SCHOOL PERFORMANCE FACT SHEET CET Center: … · SCHOOL PERFORMANCE FACT SHEET CET Center: ... This...
153
SCHOOL PERFORMANCE FACT SHEET CET Center: COACHELLA Student Name: _____________________________________________________________ SID No. _______________________ BPPE Fact Sheet for School Name CENTER FOR EMPLOYMENT TRAINING Disclose by date: September 1, 2013 Street address 49-111 HIGHWAY 111 SUITE 5 City, State Zip Code COACHELLA, CA 92236 Phone number (760) 398-8889 Fax Phone (760) 398-9711 Website WWW.CETWEB.ORG PROGRAM TITLE – PROGRAM LENGTH Course Name Clock Hours Published Charges BUSINESS OFFICE TECHNOLOGY 900 $9307.00 COMPLETION RATES Calendar Year Number of Students Who Began Program (1) Students Available for Graduation (2) Graduates (3) Completion Rate (4) 2011 42 41 12 29.27% 2012 25 25 6 24.00% STUDENTS COMPLETING AFTER PUBLISHED PROGRAM LENGTH--150% COMPLETION RATES Calendar Year Number of Students Who Began Program (1) Students Available for Graduation (2) 150% Graduates (5) 150% Completion Rate (6) 2011 42 41 15 36.59% 2012 25 25 14 56.00% (1) “Number of Students Who Began Program” means the number of students who began the program who are scheduled to complete the program within the reporting calendar year. (2) “Students Available for Graduation” means the number of students who began program minus the number of students unavailable for graduation, which means those students who have died, been incarcerated, or called to active military duty. (3) “Graduates” means the number of students who completed the program within 100% of the published program length. (4) “Completion Rate” means the number of graduates divided by the number of Students Available for Graduation. (5) “150% Graduates” means the number of students who completed the program within 101-150% of the published program length. (6) “150% Completion Rate” means the number of students who completed the program in the reported calendar year within 101- 150% of the published program length divided by the number of Students Available for Graduation in the published program length period. Initials: _______ Date:_______ I have read and understand the above completion rates.
Transcript of SCHOOL PERFORMANCE FACT SHEET CET Center: … · SCHOOL PERFORMANCE FACT SHEET CET Center: ... This...

SCHOOL PERFORMANCE FACT SHEET CET Center: COACHELLA
Student Name: _____________________________________________________________ SID No. _______________________
BPPE Fact Sheet for School Name CENTER FOR EMPLOYMENT TRAINING
Disclose by date: September 1, 2013 Street address 49-111 HIGHWAY 111 SUITE 5 City, State Zip Code COACHELLA, CA 92236
Phone number (760) 398-8889 Fax Phone (760) 398-9711
Website WWW.CETWEB.ORG
PROGRAM TITLE – PROGRAM LENGTH
Course Name Clock Hours Published Charges BUSINESS OFFICE TECHNOLOGY 900 $9307.00
COMPLETION RATES
Calendar Year
Number of Students Who Began Program (1)
Students Available for Graduation (2)
Graduates (3) Completion Rate (4)
2011 42 41 12 29.27% 2012 25 25 6 24.00%
STUDENTS COMPLETING AFTER PUBLISHED PROGRAM LENGTH--150% COMPLETION RATES
Calendar Year
Number of Students Who Began Program (1)
Students Available for Graduation (2)
150% Graduates (5)
150% Completion Rate (6)
2011 42 41 15 36.59% 2012 25 25 14 56.00%
(1) “Number of Students Who Began Program” means the number of students who began the program who are scheduled to complete the program within the reporting calendar year.
(2) “Students Available for Graduation” means the number of students who began program minus the number of students unavailable for graduation, which means those students who have died, been incarcerated, or called to active military duty.
(3) “Graduates” means the number of students who completed the program within 100% of the published program length.
(4) “Completion Rate” means the number of graduates divided by the number of Students Available for Graduation.
(5) “150% Graduates” means the number of students who completed the program within 101-150% of the published program length.
(6) “150% Completion Rate” means the number of students who completed the program in the reported calendar year within 101-150% of the published program length divided by the number of Students Available for Graduation in the published program length period.
Initials: _______ Date:_______ I have read and understand the above completion rates.

SCHOOL PERFORMANCE FACT SHEET (continued) page 2
PLACEMENT RATES
Calendar Year
Number of Students Who Began Program (1)
Number of Graduates (2)
Graduates Available for Employment(3)
Graduates Employed in the Field (4)
Placement Rate % Employedin the Field (5)
Graduates Employed in the Field an Average of less than 32 Hours per Week
Graduates Employed in the Field at least 32 Hours per Week
2011 42 12 12 6 50.00% 6 0 2012 25 6 6 3 50.00% 2 1
(1) “Number of Students Who Began Program” means the number of students who began the program who are scheduled to complete the program within the reporting calendar year.
(2) “Number of Graduates” means the number of students who have completed the program within 100% of the published program length.
(3) “Graduates Available for Employment” means the number of graduates minus the number of graduates unavailable for employment. Graduates unavailable for employment' means graduates who, after graduation, die, become incarcerated, are called to active military duty, are international students that leave the United States or do not have a visa allowing employment in the United States, or are continuing their education in an accredited or bureau-approved postsecondary institution.
(4) “Graduates Employed in the Field” means a single position for which the institution represents, the program prepare graduates, within six months after the student completes the applicable educational program. For occupations requiring passage of a licensing exam prior to employment, institutions may count the graduate if employment begins “in a single position, for which the institution represents, its program prepares its graduates within six months of the announcement of the first licensure exam results.”
(5) “Placement Rate” is calculated by dividing the number of graduates gainfully employed in the field by the number of graduates available for employment.
Initials: _________ Date: ________ I have read and understand the above placement rates.
EXAMINATION PASSAGE RATES
Calendar Year
Number of Students Taking the Exam (1)
Number Who Passed First Exam Taken (2)
Number Who Failed First Exam Taken
Passage Rate (3)
2011 N/A N/A N/A N/A % 2012 N/A N/A N/A N/A %
(1) “Number of Students Taking Exam” means the number of students who completed the program within 150% of the published program length and who took the exam in the reported calendar year for the first time.
(2) “Number Who Passed First Exam Taken” means the number of students who took and passed the licensing exam in the reported calendar year on the first attempt.
(3) “Passage Rate” is calculated by dividing the number of graduates who pass the exam the first time that they take it by the number of graduates who took the licensing exam for the first time after completion of the program.
Initials:________ Date:______ I have read and understand the above license examination rates.

___________________________ __________________________
___________________________ _________________
SCHOOL PERFORMANCE FACT SHEET (continued) page 3
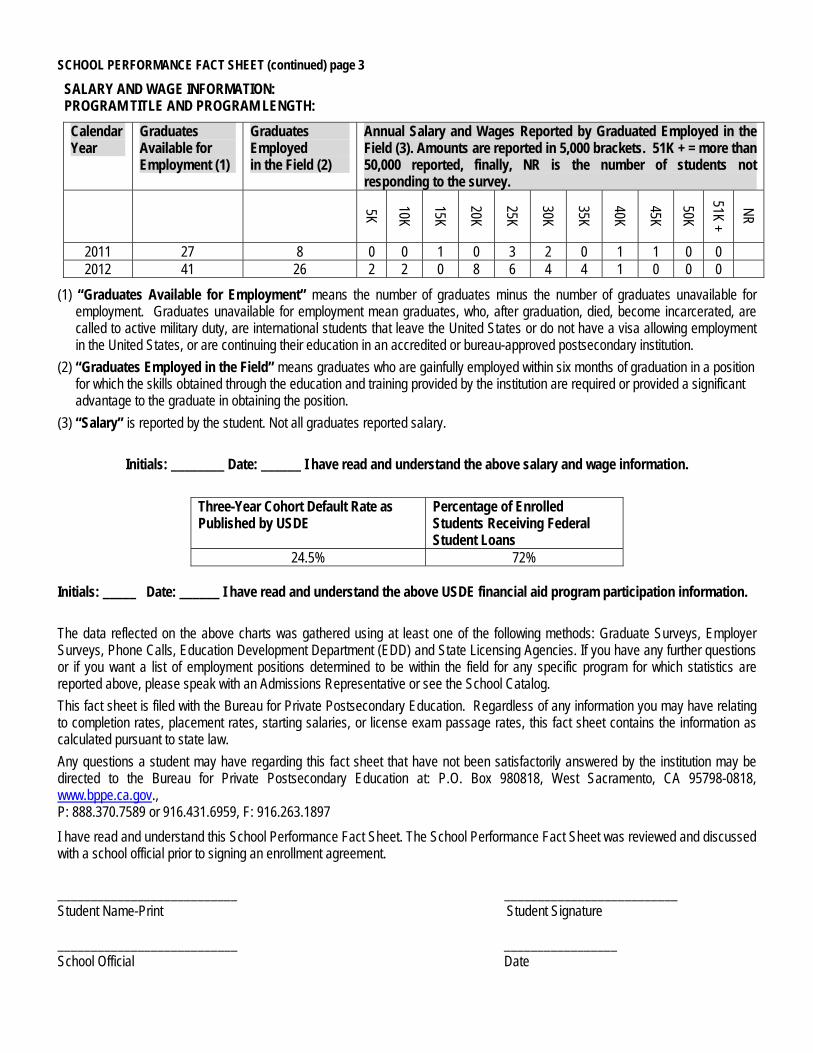
SALARY AND WAGE INFORMATION: PROGRAM TITLE AND PROGRAM LENGTH:
Calendar Year
Graduates Available for Employment (1)
Graduates Employedin the Field (2)
Annual Salary and Wages Reported by Graduated Employed in the Field (3). Amounts are reported in 5,000 brackets. 51K + = more than 50,000 reported, finally, NR is the number of students not responding to the survey.
5K
10K
15K
20K
25K
30K
35K
40K
45K
50K
51K +
NR
2011 12 6 0 2 4 0 0 0 0 0 0 0 0 2012 6 3 0 0 2 1 0 0 0 0 0 0 0
(1) “Graduates Available for Employment” means the number of graduates minus the number of graduates unavailable for employment. Graduates unavailable for employment mean graduates, who, after graduation, died, become incarcerated, are called to active military duty, are international students that leave the United States or do not have a visa allowing employment in the United States, or are continuing their education in an accredited or bureau-approved postsecondary institution.
(2) “Graduates Employed in the Field” means graduates who are gainfully employed within six months of graduation in a position for which the skills obtained through the education and training provided by the institution are required or provided a significant advantage to the graduate in obtaining the position.
(3) “Salary” is reported by the student. Not all graduates reported salary.
Initials: ________ Date: ______ I have read and understand the above salary and wage information.
Three-Year Cohort Default Rate as Published by USDE
Percentage of EnrolledStudents Receiving FederalStudent Loans
24.5% 72%
Initials: _____ Date: ______ I have read and understand the above USDE financial aid program participation information.
The data reflected on the above charts was gathered using at least one of the following methods: Graduate Surveys, Employer Surveys, Phone Calls, Education Development Department (EDD) and State Licensing Agencies. If you have any further questions or if you want a list of employment positions determined to be within the field for any specific program for which statistics are reported above, please speak with an Admissions Representative or see the School Catalog.
This fact sheet is filed with the Bureau for Private Postsecondary Education. Regardless of any information you may have relating to completion rates, placement rates, starting salaries, or license exam passage rates, this fact sheet contains the information as calculated pursuant to state law.
Any questions a student may have regarding this fact sheet that have not been satisfactorily answered by the institution may be directed to the Bureau for Private Postsecondary Education at: P.O. Box 980818, West Sacramento, CA 95798-0818, www.bppe.ca.gov., P: 888.370.7589 or 916.431.6959, F: 916.263.1897
I have read and understand this School Performance Fact Sheet. The School Performance Fact Sheet was reviewed and discussed with a school official prior to signing an enrollment agreement.
Student Name-Print Student Signature
School Official Date

SCHOOL PERFORMANCE FACT SHEET CET Center: COACHELLA
Student Name: _____________________________________________________________ SID No. _______________________
BPPE Fact Sheet for School Name CENTER FOR EMPLOYMENT TRAINING
Disclose by date: September 1, 2013 Street address 49-111 HIGHWAY 111 SUITE 5 City, State Zip Code COACHELLA, CA 92236
Phone number (760) 398-8889 Fax Phone (760) 398-9711
Website WWW.CETWEB.ORG
PROGRAM TITLE – PROGRAM LENGTH
Course Name Clock Hours Published Charges GREEN BUILDING CONSTRUCTION SKILLS 900 $9307.00
COMPLETION RATES
Calendar Year
Number of Students Who Began Program (1)
Students Available for Graduation (2)
Graduates (3) Completion Rate (4)
2011 44 44 23 52.27% 2012 23 23 13 56.52%
STUDENTS COMPLETING AFTER PUBLISHED PROGRAM LENGTH--150% COMPLETION RATES
Calendar Year
Number of Students Who Began Program (1)
Students Available for Graduation (2)
150% Graduates (5)
150% Completion Rate (6)
2011 44 44 16 36.36% 2012 23 23 8 34.78%
(1) “Number of Students Who Began Program” means the number of students who began the program who are scheduled to complete the program within the reporting calendar year.
(2) “Students Available for Graduation” means the number of students who began program minus the number of students unavailable for graduation, which means those students who have died, been incarcerated, or called to active military duty.
(3) “Graduates” means the number of students who completed the program within 100% of the published program length.
(4) “Completion Rate” means the number of graduates divided by the number of Students Available for Graduation.
(5) “150% Graduates” means the number of students who completed the program within 101-150% of the published program length.
(6) “150% Completion Rate” means the number of students who completed the program in the reported calendar year within 101-150% of the published program length divided by the number of Students Available for Graduation in the published program length period.
Initials: _______ Date:_______ I have read and understand the above completion rates.

SCHOOL PERFORMANCE FACT SHEET (continued) page 2
PLACEMENT RATES
Calendar Year
Number of Students Who Began Program (1)
Number of Graduates (2)
Graduates Available for Employment(3)
Graduates Employed in the Field (4)
Placement Rate % Employedin the Field (5)
Graduates Employed in the Field an Average of less than 32 Hours per Week
Graduates Employed in the Field at least 32 Hours per Week
2011 44 23 23 14 60.87% 4 10 2012 23 13 13 4 30.77% 2 2
(1) “Number of Students Who Began Program” means the number of students who began the program who are scheduled to complete the program within the reporting calendar year.
(2) “Number of Graduates” means the number of students who have completed the program within 100% of the published program length.
(3) “Graduates Available for Employment” means the number of graduates minus the number of graduates unavailable for employment. Graduates unavailable for employment' means graduates who, after graduation, die, become incarcerated, are called to active military duty, are international students that leave the United States or do not have a visa allowing employment in the United States, or are continuing their education in an accredited or bureau-approved postsecondary institution.
(4) “Graduates Employed in the Field” means a single position for which the institution represents, the program prepare graduates, within six months after the student completes the applicable educational program. For occupations requiring passage of a licensing exam prior to employment, institutions may count the graduate if employment begins “in a single position, for which the institution represents, its program prepares its graduates within six months of the announcement of the first licensure exam results.”
(5) “Placement Rate” is calculated by dividing the number of graduates gainfully employed in the field by the number of graduates available for employment.
Initials: _________ Date: ________ I have read and understand the above placement rates.
EXAMINATION PASSAGE RATES
Calendar Year
Number of Students Taking the Exam (1)
Number Who Passed First Exam Taken (2)
Number Who Failed First Exam Taken
Passage Rate (3)
2011 N/A N/A N/A N/A % 2012 N/A N/A N/A N/A %
(1) “Number of Students Taking Exam” means the number of students who completed the program within 150% of the published program length and who took the exam in the reported calendar year for the first time.
(2) “Number Who Passed First Exam Taken” means the number of students who took and passed the licensing exam in the reported calendar year on the first attempt.
(3) “Passage Rate” is calculated by dividing the number of graduates who pass the exam the first time that they take it by the number of graduates who took the licensing exam for the first time after completion of the program.
Initials:________ Date:______ I have read and understand the above license examination rates.

___________________________ __________________________
___________________________ _________________
SCHOOL PERFORMANCE FACT SHEET (continued) page 3
SALARY AND WAGE INFORMATION: PROGRAM TITLE AND PROGRAM LENGTH:
Calendar Year
Graduates Available for Employment (1)
Graduates Employedin the Field (2)
Annual Salary and Wages Reported by Graduated Employed in the Field (3). Amounts are reported in 5,000 brackets. 51K + = more than 50,000 reported, finally, NR is the number of students not responding to the survey.
5K
10K
15K
20K
25K
30K
35K
40K
45K
50K
51K +
NR
2011 23 14 0 0 4 3 3 3 1 0 0 0 0 2012 13 4 0 1 1 0 1 0 0 0 0 0 0
(1) “Graduates Available for Employment” means the number of graduates minus the number of graduates unavailable for employment. Graduates unavailable for employment mean graduates, who, after graduation, died, become incarcerated, are called to active military duty, are international students that leave the United States or do not have a visa allowing employment in the United States, or are continuing their education in an accredited or bureau-approved postsecondary institution.
(2) “Graduates Employed in the Field” means graduates who are gainfully employed within six months of graduation in a position for which the skills obtained through the education and training provided by the institution are required or provided a significant advantage to the graduate in obtaining the position.
(3) “Salary” is reported by the student. Not all graduates reported salary.
Initials: ________ Date: ______ I have read and understand the above salary and wage information.
Three-Year Cohort Default Rate as Published by USDE
Percentage of EnrolledStudents Receiving FederalStudent Loans
24.5% 72%
Initials: _____ Date: ______ I have read and understand the above USDE financial aid program participation information.
The data reflected on the above charts was gathered using at least one of the following methods: Graduate Surveys, Employer Surveys, Phone Calls, Education Development Department (EDD) and State Licensing Agencies. If you have any further questions or if you want a list of employment positions determined to be within the field for any specific program for which statistics are reported above, please speak with an Admissions Representative or see the School Catalog.
This fact sheet is filed with the Bureau for Private Postsecondary Education. Regardless of any information you may have relating to completion rates, placement rates, starting salaries, or license exam passage rates, this fact sheet contains the information as calculated pursuant to state law.
Any questions a student may have regarding this fact sheet that have not been satisfactorily answered by the institution may be directed to the Bureau for Private Postsecondary Education at: P.O. Box 980818, West Sacramento, CA 95798-0818, www.bppe.ca.gov., P: 888.370.7589 or 916.431.6959, F: 916.263.1897
I have read and understand this School Performance Fact Sheet. The School Performance Fact Sheet was reviewed and discussed with a school official prior to signing an enrollment agreement.
Student Name-Print Student Signature
School Official Date

SCHOOL PERFORMANCE FACT SHEET CET Center: COACHELLA
Student Name: _____________________________________________________________ SID No. _______________________
BPPE Fact Sheet for School Name CENTER FOR EMPLOYMENT TRAINING
Disclose by date: September 1, 2013 Street address 49-111 HIGHWAY 111 SUITE 5 City, State Zip Code COACHELLA, CA 92236
Phone number (760) 398-8889 Fax Phone (760) 398-9711
Website WWW.CETWEB.ORG
PROGRAM TITLE – PROGRAM LENGTH
Course Name Clock Hours Published Charges HVAC TECHNICIAN and GREEN TECHNOLOGY 810 $8684.00
COMPLETION RATES
Calendar Year
Number of Students Who Began Program (1)
Students Available for Graduation (2)
Graduates (3) Completion Rate (4)
2011 42 42 33 78.57% 2012 48 48 31 64.58%
STUDENTS COMPLETING AFTER PUBLISHED PROGRAM LENGTH--150% COMPLETION RATES
Calendar Year
Number of Students Who Began Program (1)
Students Available for Graduation (2)
150% Graduates (5)
150% Completion Rate (6)
2011 42 42 4 9.52% 2012 48 48 14 29.17%
(1) “Number of Students Who Began Program” means the number of students who began the program who are scheduled to complete the program within the reporting calendar year.
(2) “Students Available for Graduation” means the number of students who began program minus the number of students unavailable for graduation, which means those students who have died, been incarcerated, or called to active military duty.
(3) “Graduates” means the number of students who completed the program within 100% of the published program length.
(4) “Completion Rate” means the number of graduates divided by the number of Students Available for Graduation.
(5) “150% Graduates” means the number of students who completed the program within 101-150% of the published program length.
(6) “150% Completion Rate” means the number of students who completed the program in the reported calendar year within 101-150% of the published program length divided by the number of Students Available for Graduation in the published program length period.
Initials: _______ Date:_______ I have read and understand the above completion rates.

SCHOOL PERFORMANCE FACT SHEET (continued) page 2
PLACEMENT RATES
Calendar Year
Number of Students Who Began Program (1)
Number of Graduates (2)
Graduates Available for Employment(3)
Graduates Employed in the Field (4)
Placement Rate % Employedin the Field (5)
Graduates Employed in the Field an Average of less than 32 Hours per Week
Graduates Employed in the Field at least 32 Hours per Week
2011 42 33 33 21 63.64% 3 18 2012 48 31 31 10 32.26% 1 9
(1) “Number of Students Who Began Program” means the number of students who began the program who are scheduled to complete the program within the reporting calendar year.
(2) “Number of Graduates” means the number of students who have completed the program within 100% of the published program length.
(3) “Graduates Available for Employment” means the number of graduates minus the number of graduates unavailable for employment. Graduates unavailable for employment' means graduates who, after graduation, die, become incarcerated, are called to active military duty, are international students that leave the United States or do not have a visa allowing employment in the United States, or are continuing their education in an accredited or bureau-approved postsecondary institution.
(4) “Graduates Employed in the Field” means a single position for which the institution represents, the program prepare graduates, within six months after the student completes the applicable educational program. For occupations requiring passage of a licensing exam prior to employment, institutions may count the graduate if employment begins “in a single position, for which the institution represents, its program prepares its graduates within six months of the announcement of the first licensure exam results.”
(5) “Placement Rate” is calculated by dividing the number of graduates gainfully employed in the field by the number of graduates available for employment.
Initials: _________ Date: ________ I have read and understand the above placement rates.
EXAMINATION PASSAGE RATES
Calendar Year
Number of Students Taking the Exam (1)
Number Who Passed First Exam Taken (2)
Number Who Failed First Exam Taken
Passage Rate (3)
2011 N/A N/A N/A N/A % 2012 N/A N/A N/A N/A %
(1) “Number of Students Taking Exam” means the number of students who completed the program within 150% of the published program length and who took the exam in the reported calendar year for the first time.
(2) “Number Who Passed First Exam Taken” means the number of students who took and passed the licensing exam in the reported calendar year on the first attempt.
(3) “Passage Rate” is calculated by dividing the number of graduates who pass the exam the first time that they take it by the number of graduates who took the licensing exam for the first time after completion of the program.
Initials:________ Date:______ I have read and understand the above license examination rates.

___________________________ __________________________
___________________________ _________________
SCHOOL PERFORMANCE FACT SHEET (continued) page 3
SALARY AND WAGE INFORMATION: PROGRAM TITLE AND PROGRAM LENGTH:
Calendar Year
Graduates Available for Employment (1)
Graduates Employedin the Field (2)
Annual Salary and Wages Reported by Graduated Employed in the Field (3). Amounts are reported in 5,000 brackets. 51K + = more than 50,000 reported, finally, NR is the number of students not responding to the survey.
5K
10K
15K
20K
25K
30K
35K
40K
45K
50K
51K +
NR
2011 33 21 0 0 1 3 8 3 4 2 0 0 0 2012 31 10 0 0 2 1 3 0 0 1 0 0 0
(1) “Graduates Available for Employment” means the number of graduates minus the number of graduates unavailable for employment. Graduates unavailable for employment mean graduates, who, after graduation, died, become incarcerated, are called to active military duty, are international students that leave the United States or do not have a visa allowing employment in the United States, or are continuing their education in an accredited or bureau-approved postsecondary institution.
(2) “Graduates Employed in the Field” means graduates who are gainfully employed within six months of graduation in a position for which the skills obtained through the education and training provided by the institution are required or provided a significant advantage to the graduate in obtaining the position.
(3) “Salary” is reported by the student. Not all graduates reported salary.
Initials: ________ Date: ______ I have read and understand the above salary and wage information.
Three-Year Cohort Default Rate as Published by USDE
Percentage of EnrolledStudents Receiving FederalStudent Loans
24.5% 72%
Initials: _____ Date: ______ I have read and understand the above USDE financial aid program participation information.
The data reflected on the above charts was gathered using at least one of the following methods: Graduate Surveys, Employer Surveys, Phone Calls, Education Development Department (EDD) and State Licensing Agencies. If you have any further questions or if you want a list of employment positions determined to be within the field for any specific program for which statistics are reported above, please speak with an Admissions Representative or see the School Catalog.
This fact sheet is filed with the Bureau for Private Postsecondary Education. Regardless of any information you may have relating to completion rates, placement rates, starting salaries, or license exam passage rates, this fact sheet contains the information as calculated pursuant to state law.
Any questions a student may have regarding this fact sheet that have not been satisfactorily answered by the institution may be directed to the Bureau for Private Postsecondary Education at: P.O. Box 980818, West Sacramento, CA 95798-0818, www.bppe.ca.gov., P: 888.370.7589 or 916.431.6959, F: 916.263.1897
I have read and understand this School Performance Fact Sheet. The School Performance Fact Sheet was reviewed and discussed with a school official prior to signing an enrollment agreement.
Student Name-Print Student Signature
School Official Date

SCHOOL PERFORMANCE FACT SHEET CET Center: EL CENTRO
Student Name: _____________________________________________________________ SID No. _______________________
BPPE Fact Sheet for School Name CENTER FOR EMPLOYMENT TRAINING
Disclose by date: September 1, 2013 Street address 294 SOUTH 3RD STREET City, State Zip Code EL CENTRO, CA 92243
Phone number (760) 337-6565 Fax Phone (760) 353-5589
Website WWW.CETWEB.ORG
PROGRAM TITLE – PROGRAM LENGTH
Course Name Clock Hours Published Charges ACCOUNTING CLERK 900 $9307.00
COMPLETION RATES
Calendar Year
Number of Students Who Began Program (1)
Students Available for Graduation (2)
Graduates (3) Completion Rate (4)
2011 53 53 17 32.08% 2012 49 49 18 36.73%
STUDENTS COMPLETING AFTER PUBLISHED PROGRAM LENGTH--150% COMPLETION RATES
Calendar Year
Number of Students Who Began Program (1)
Students Available for Graduation (2)
150% Graduates (5)
150% Completion Rate (6)
2011 53 53 32 60.38% 2012 49 49 19 38.78%
(1) “Number of Students Who Began Program” means the number of students who began the program who are scheduled to complete the program within the reporting calendar year.
(2) “Students Available for Graduation” means the number of students who began program minus the number of students unavailable for graduation, which means those students who have died, been incarcerated, or called to active military duty.
(3) “Graduates” means the number of students who completed the program within 100% of the published program length.
(4) “Completion Rate” means the number of graduates divided by the number of Students Available for Graduation.
(5) “150% Graduates” means the number of students who completed the program within 101-150% of the published program length.
(6) “150% Completion Rate” means the number of students who completed the program in the reported calendar year within 101-150% of the published program length divided by the number of Students Available for Graduation in the published program length period.
Initials: _______ Date:_______ I have read and understand the above completion rates.

SCHOOL PERFORMANCE FACT SHEET (continued) page 2
PLACEMENT RATES
Calendar Year
Number of Students Who Began Program (1)
Number of Graduates (2)
Graduates Available for Employment(3)
Graduates Employed in the Field (4)
Placement Rate % Employedin the Field (5)
Graduates Employed in the Field an Average of less than 32 Hours per Week
Graduates Employed in the Field at least 32 Hours per Week
2011 53 17 17 8 47.06% 1 7 2012 49 18 18 5 31.25% 3 2
(1) “Number of Students Who Began Program” means the number of students who began the program who are scheduled to complete the program within the reporting calendar year.
(2) “Number of Graduates” means the number of students who have completed the program within 100% of the published program length.
(3) “Graduates Available for Employment” means the number of graduates minus the number of graduates unavailable for employment. Graduates unavailable for employment' means graduates who, after graduation, die, become incarcerated, are called to active military duty, are international students that leave the United States or do not have a visa allowing employment in the United States, or are continuing their education in an accredited or bureau-approved postsecondary institution.
(4) “Graduates Employed in the Field” means a single position for which the institution represents, the program prepare graduates, within six months after the student completes the applicable educational program. For occupations requiring passage of a licensing exam prior to employment, institutions may count the graduate if employment begins “in a single position, for which the institution represents, its program prepares its graduates within six months of the announcement of the first licensure exam results.”
(5) “Placement Rate” is calculated by dividing the number of graduates gainfully employed in the field by the number of graduates available for employment.
Initials: _________ Date: ________ I have read and understand the above placement rates.
EXAMINATION PASSAGE RATES
Calendar Year
Number of Students Taking the Exam (1)
Number Who Passed First Exam Taken (2)
Number Who Failed First Exam Taken
Passage Rate (3)
2011 N/A N/A N/A N/A % 2012 N/A N/A N/A N/A %
(1) “Number of Students Taking Exam” means the number of students who completed the program within 150% of the published program length and who took the exam in the reported calendar year for the first time.
(2) “Number Who Passed First Exam Taken” means the number of students who took and passed the licensing exam in the reported calendar year on the first attempt.
(3) “Passage Rate” is calculated by dividing the number of graduates who pass the exam the first time that they take it by the number of graduates who took the licensing exam for the first time after completion of the program.
Initials:________ Date:______ I have read and understand the above license examination rates.

___________________________ __________________________
___________________________ _________________
SCHOOL PERFORMANCE FACT SHEET (continued) page 3
SALARY AND WAGE INFORMATION: PROGRAM TITLE AND PROGRAM LENGTH:
Calendar Year
Graduates Available for Employment (1)
Graduates Employedin the Field (2)
Annual Salary and Wages Reported by Graduated Employed in the Field (3). Amounts are reported in 5,000 brackets. 51K + = more than 50,000 reported, finally, NR is the number of students not responding to the survey.
5K
10K
15K
20K
25K
30K
35K
40K
45K
50K
51K +
NR
2011 17 8 0 0 2 3 2 0 1 0 0 0 0 2012 18 5 0 1 2 2 0 0 0 0 0 0 0
(1) “Graduates Available for Employment” means the number of graduates minus the number of graduates unavailable for employment. Graduates unavailable for employment mean graduates, who, after graduation, died, become incarcerated, are called to active military duty, are international students that leave the United States or do not have a visa allowing employment in the United States, or are continuing their education in an accredited or bureau-approved postsecondary institution.
(2) “Graduates Employed in the Field” means graduates who are gainfully employed within six months of graduation in a position for which the skills obtained through the education and training provided by the institution are required or provided a significant advantage to the graduate in obtaining the position.
(3) “Salary” is reported by the student. Not all graduates reported salary.
Initials: ________ Date: ______ I have read and understand the above salary and wage information.
Three-Year Cohort Default Rate as Published by USDE
Percentage of EnrolledStudents Receiving FederalStudent Loans
24.5% 72%
Initials: _____ Date: ______ I have read and understand the above USDE financial aid program participation information.
The data reflected on the above charts was gathered using at least one of the following methods: Graduate Surveys, Employer Surveys, Phone Calls, Education Development Department (EDD) and State Licensing Agencies. If you have any further questions or if you want a list of employment positions determined to be within the field for any specific program for which statistics are reported above, please speak with an Admissions Representative or see the School Catalog.
This fact sheet is filed with the Bureau for Private Postsecondary Education. Regardless of any information you may have relating to completion rates, placement rates, starting salaries, or license exam passage rates, this fact sheet contains the information as calculated pursuant to state law.
Any questions a student may have regarding this fact sheet that have not been satisfactorily answered by the institution may be directed to the Bureau for Private Postsecondary Education at: P.O. Box 980818, West Sacramento, CA 95798-0818, www.bppe.ca.gov., P: 888.370.7589 or 916.431.6959, F: 916.263.1897
I have read and understand this School Performance Fact Sheet. The School Performance Fact Sheet was reviewed and discussed with a school official prior to signing an enrollment agreement.
Student Name-Print Student Signature
School Official Date

SCHOOL PERFORMANCE FACT SHEET CET Center: EL CENTRO
Student Name: _____________________________________________________________ SID No. _______________________
BPPE Fact Sheet for School Name CENTER FOR EMPLOYMENT TRAINING
Disclose by date: September 1, 2013 Street address 294 SOUTH 3RD STREET City, State Zip Code EL CENTRO, CA 92243
Phone number (760) 337-6565 Fax Phone (760) 353-5589
Website WWW.CETWEB.ORG
PROGRAM TITLE – PROGRAM LENGTH
Course Name Clock Hours Published Charges GREEN BUILDING CONSTRUCTION SKILLS 900 $9307.00
COMPLETION RATES
Calendar Year
Number of Students Who Began Program (1)
Students Available for Graduation (2)
Graduates (3) Completion Rate (4)
2011 63 63 27 42.86% 2012 62 62 41 66.13%
STUDENTS COMPLETING AFTER PUBLISHED PROGRAM LENGTH--150% COMPLETION RATES
Calendar Year
Number of Students Who Began Program (1)
Students Available for Graduation (2)
150% Graduates (5)
150% Completion Rate (6)
2011 63 63 29 46.03% 2012 62 62 8 12.90%
(1) “Number of Students Who Began Program” means the number of students who began the program who are scheduled to complete the program within the reporting calendar year.
(2) “Students Available for Graduation” means the number of students who began program minus the number of students unavailable for graduation, which means those students who have died, been incarcerated, or called to active military duty.
(3) “Graduates” means the number of students who completed the program within 100% of the published program length.
(4) “Completion Rate” means the number of graduates divided by the number of Students Available for Graduation.
(5) “150% Graduates” means the number of students who completed the program within 101-150% of the published program length.
(6) “150% Completion Rate” means the number of students who completed the program in the reported calendar year within 101-150% of the published program length divided by the number of Students Available for Graduation in the published program length period.
Initials: _______ Date:_______ I have read and understand the above completion rates.

SCHOOL PERFORMANCE FACT SHEET (continued) page 2
PLACEMENT RATES
Calendar Year
Number of Students Who Began Program (1)
Number of Graduates (2)
Graduates Available for Employment(3)
Graduates Employed in the Field (4)
Placement Rate % Employedin the Field (5)
Graduates Employed in the Field an Average of less than 32 Hours per Week
Graduates Employed in the Field at least 32 Hours per Week
2011 63 27 27 8 29.63% 1 7 2012 62 41 41 26 65.00% 5 21
(1) “Number of Students Who Began Program” means the number of students who began the program who are scheduled to complete the program within the reporting calendar year.
(2) “Number of Graduates” means the number of students who have completed the program within 100% of the published program length.
(3) “Graduates Available for Employment” means the number of graduates minus the number of graduates unavailable for employment. Graduates unavailable for employment' means graduates who, after graduation, die, become incarcerated, are called to active military duty, are international students that leave the United States or do not have a visa allowing employment in the United States, or are continuing their education in an accredited or bureau-approved postsecondary institution.
(4) “Graduates Employed in the Field” means a single position for which the institution represents, the program prepare graduates, within six months after the student completes the applicable educational program. For occupations requiring passage of a licensing exam prior to employment, institutions may count the graduate if employment begins “in a single position, for which the institution represents, its program prepares its graduates within six months of the announcement of the first licensure exam results.”
(5) “Placement Rate” is calculated by dividing the number of graduates gainfully employed in the field by the number of graduates available for employment.
Initials: _________ Date: ________ I have read and understand the above placement rates.
EXAMINATION PASSAGE RATES
Calendar Year
Number of Students Taking the Exam (1)
Number Who Passed First Exam Taken (2)
Number Who Failed First Exam Taken
Passage Rate (3)
2011 N/A N/A N/A N/A % 2012 N/A N/A N/A N/A %
(1) “Number of Students Taking Exam” means the number of students who completed the program within 150% of the published program length and who took the exam in the reported calendar year for the first time.
(2) “Number Who Passed First Exam Taken” means the number of students who took and passed the licensing exam in the reported calendar year on the first attempt.
(3) “Passage Rate” is calculated by dividing the number of graduates who pass the exam the first time that they take it by the number of graduates who took the licensing exam for the first time after completion of the program.
Initials:________ Date:______ I have read and understand the above license examination rates.
___________________________ __________________________
___________________________ _________________
SCHOOL PERFORMANCE FACT SHEET (continued) page 3
SALARY AND WAGE INFORMATION: PROGRAM TITLE AND PROGRAM LENGTH:
Calendar Year
Graduates Available for Employment (1)
Graduates Employedin the Field (2)
Annual Salary and Wages Reported by Graduated Employed in the Field (3). Amounts are reported in 5,000 brackets. 51K + = more than 50,000 reported, finally, NR is the number of students not responding to the survey.
5K
10K
15K
20K
25K
30K
35K
40K
45K
50K
51K +
NR
2011 27 8 0 0 1 0 3 2 0 1 1 0 0 2012 41 26 2 2 0 8 6 4 4 1 0 0 0
(1) “Graduates Available for Employment” means the number of graduates minus the number of graduates unavailable for employment. Graduates unavailable for employment mean graduates, who, after graduation, died, become incarcerated, are called to active military duty, are international students that leave the United States or do not have a visa allowing employment in the United States, or are continuing their education in an accredited or bureau-approved postsecondary institution.
(2) “Graduates Employed in the Field” means graduates who are gainfully employed within six months of graduation in a position for which the skills obtained through the education and training provided by the institution are required or provided a significant advantage to the graduate in obtaining the position.
(3) “Salary” is reported by the student. Not all graduates reported salary.
Initials: ________ Date: ______ I have read and understand the above salary and wage information.
Three-Year Cohort Default Rate as Published by USDE
Percentage of EnrolledStudents Receiving FederalStudent Loans
24.5% 72%
Initials: _____ Date: ______ I have read and understand the above USDE financial aid program participation information.
The data reflected on the above charts was gathered using at least one of the following methods: Graduate Surveys, Employer Surveys, Phone Calls, Education Development Department (EDD) and State Licensing Agencies. If you have any further questions or if you want a list of employment positions determined to be within the field for any specific program for which statistics are reported above, please speak with an Admissions Representative or see the School Catalog.
This fact sheet is filed with the Bureau for Private Postsecondary Education. Regardless of any information you may have relating to completion rates, placement rates, starting salaries, or license exam passage rates, this fact sheet contains the information as calculated pursuant to state law.
Any questions a student may have regarding this fact sheet that have not been satisfactorily answered by the institution may be directed to the Bureau for Private Postsecondary Education at: P.O. Box 980818, West Sacramento, CA 95798-0818, www.bppe.ca.gov., P: 888.370.7589 or 916.431.6959, F: 916.263.1897
I have read and understand this School Performance Fact Sheet. The School Performance Fact Sheet was reviewed and discussed with a school official prior to signing an enrollment agreement.
Student Name-Print Student Signature
School Official Date

SCHOOL PERFORMANCE FACT SHEET CET Center: EL CENTRO
Student Name: _____________________________________________________________ SID No. _______________________
BPPE Fact Sheet for School Name CENTER FOR EMPLOYMENT TRAINING
Disclose by date: September 1, 2013 Street address 294 SOUTH 3RD STREET City, State Zip Code EL CENTRO, CA 92243
Phone number (760) 337-6565 Fax Phone (760) 353-5589
Website WWW.CETWEB.ORG
PROGRAM TITLE – PROGRAM LENGTH
Course Name Clock Hours Published Charges RETAIL SPECIALIST 630 $7437.00
COMPLETION RATES
Calendar Year
Number of Students Who Began Program (1)
Students Available for Graduation (2)
Graduates (3) Completion Rate (4)
2011 72 71 69 97.18% 2012 87 87 82 94.25%
STUDENTS COMPLETING AFTER PUBLISHED PROGRAM LENGTH--150% COMPLETION RATES
Calendar Year
Number of Students Who Began Program (1)
Students Available for Graduation (2)
150% Graduates (5)
150% Completion Rate (6)
2011 72 71 0 0.00% 2012 87 87 0 0.00%
(1) “Number of Students Who Began Program” means the number of students who began the program who are scheduled to complete the program within the reporting calendar year.
(2) “Students Available for Graduation” means the number of students who began program minus the number of students unavailable for graduation, which means those students who have died, been incarcerated, or called to active military duty.
(3) “Graduates” means the number of students who completed the program within 100% of the published program length.
(4) “Completion Rate” means the number of graduates divided by the number of Students Available for Graduation.
(5) “150% Graduates” means the number of students who completed the program within 101-150% of the published program length.
(6) “150% Completion Rate” means the number of students who completed the program in the reported calendar year within 101-150% of the published program length divided by the number of Students Available for Graduation in the published program length period.
Initials: _______ Date:_______ I have read and understand the above completion rates.

SCHOOL PERFORMANCE FACT SHEET (continued) page 2
PLACEMENT RATES
Calendar Year
Number of Students Who Began Program (1)
Number of Graduates (2)
Graduates Available for Employment(3)
Graduates Employed in the Field (4)
Placement Rate % Employedin the Field (5)
Graduates Employed in the Field an Average of less than 32 Hours per Week
Graduates Employed in the Field at least 32 Hours per Week
2011 72 69 69 39 56.52% 29 10 2012 87 82 82 64 78.05% 41 23
(1) “Number of Students Who Began Program” means the number of students who began the program who are scheduled to complete the program within the reporting calendar year.
(2) “Number of Graduates” means the number of students who have completed the program within 100% of the published program length.
(3) “Graduates Available for Employment” means the number of graduates minus the number of graduates unavailable for employment. Graduates unavailable for employment' means graduates who, after graduation, die, become incarcerated, are called to active military duty, are international students that leave the United States or do not have a visa allowing employment in the United States, or are continuing their education in an accredited or bureau-approved postsecondary institution.
(4) “Graduates Employed in the Field” means a single position for which the institution represents, the program prepare graduates, within six months after the student completes the applicable educational program. For occupations requiring passage of a licensing exam prior to employment, institutions may count the graduate if employment begins “in a single position, for which the institution represents, its program prepares its graduates within six months of the announcement of the first licensure exam results.”
(5) “Placement Rate” is calculated by dividing the number of graduates gainfully employed in the field by the number of graduates available for employment.
Initials: _________ Date: ________ I have read and understand the above placement rates.
EXAMINATION PASSAGE RATES
Calendar Year
Number of Students Taking the Exam (1)
Number Who Passed First Exam Taken (2)
Number Who Failed First Exam Taken
Passage Rate (3)
2011 N/A N/A N/A N/A % 2012 N/A N/A N/A N/A %
(1) “Number of Students Taking Exam” means the number of students who completed the program within 150% of the published program length and who took the exam in the reported calendar year for the first time.
(2) “Number Who Passed First Exam Taken” means the number of students who took and passed the licensing exam in the reported calendar year on the first attempt.
(3) “Passage Rate” is calculated by dividing the number of graduates who pass the exam the first time that they take it by the number of graduates who took the licensing exam for the first time after completion of the program.
Initials:________ Date:______ I have read and understand the above license examination rates.

___________________________ __________________________
___________________________ _________________
SCHOOL PERFORMANCE FACT SHEET (continued) page 3
SALARY AND WAGE INFORMATION: PROGRAM TITLE AND PROGRAM LENGTH:
Calendar Year
Graduates Available for Employment (1)
Graduates Employedin the Field (2)
Annual Salary and Wages Reported by Graduated Employed in the Field (3). Amounts are reported in 5,000 brackets. 51K + = more than 50,000 reported, finally, NR is the number of students not responding to the survey.
5K
10K
15K
20K
25K
30K
35K
40K
45K
50K
51K +
NR
2011 69 39 6 5 22 6 0 0 0 0 0 0 0 2012 82 64 0 19 22 20 3 0 0 0 0 0 0
(1) “Graduates Available for Employment” means the number of graduates minus the number of graduates unavailable for employment. Graduates unavailable for employment mean graduates, who, after graduation, died, become incarcerated, are called to active military duty, are international students that leave the United States or do not have a visa allowing employment in the United States, or are continuing their education in an accredited or bureau-approved postsecondary institution.
(2) “Graduates Employed in the Field” means graduates who are gainfully employed within six months of graduation in a position for which the skills obtained through the education and training provided by the institution are required or provided a significant advantage to the graduate in obtaining the position.
(3) “Salary” is reported by the student. Not all graduates reported salary.
Initials: ________ Date: ______ I have read and understand the above salary and wage information.
Three-Year Cohort Default Rate as Published by USDE
Percentage of EnrolledStudents Receiving FederalStudent Loans
24.5% 72%
Initials: _____ Date: ______ I have read and understand the above USDE financial aid program participation information.
The data reflected on the above charts was gathered using at least one of the following methods: Graduate Surveys, Employer Surveys, Phone Calls, Education Development Department (EDD) and State Licensing Agencies. If you have any further questions or if you want a list of employment positions determined to be within the field for any specific program for which statistics are reported above, please speak with an Admissions Representative or see the School Catalog.
This fact sheet is filed with the Bureau for Private Postsecondary Education. Regardless of any information you may have relating to completion rates, placement rates, starting salaries, or license exam passage rates, this fact sheet contains the information as calculated pursuant to state law.
Any questions a student may have regarding this fact sheet that have not been satisfactorily answered by the institution may be directed to the Bureau for Private Postsecondary Education at: P.O. Box 980818, West Sacramento, CA 95798-0818, www.bppe.ca.gov., P: 888.370.7589 or 916.431.6959, F: 916.263.1897
I have read and understand this School Performance Fact Sheet. The School Performance Fact Sheet was reviewed and discussed with a school official prior to signing an enrollment agreement.
Student Name-Print Student Signature
School Official Date

SCHOOL PERFORMANCE FACT SHEET CET Center: EL CENTRO
Student Name: _____________________________________________________________ SID No. _______________________
BPPE Fact Sheet for School Name CENTER FOR EMPLOYMENT TRAINING
Disclose by date: September 1, 2013 Street address 294 SOUTH 3RD STREET City, State Zip Code EL CENTRO, CA 92243
Phone number (760) 337-6565 Fax Phone (760) 353-5589
Website WWW.CETWEB.ORG
PROGRAM TITLE – PROGRAM LENGTH
Course Name Clock Hours Published Charges TRUCK DRIVER 630 $8779.00
COMPLETION RATES
Calendar Year
Number of Students Who Began Program (1)
Students Available for Graduation (2)
Graduates (3) Completion Rate (4)
2011 43 43 21 48.84% 2012 36 36 14 38.89%
STUDENTS COMPLETING AFTER PUBLISHED PROGRAM LENGTH--150% COMPLETION RATES
Calendar Year
Number of Students Who Began Program (1)
Students Available for Graduation (2)
150% Graduates (5)
150% Completion Rate (6)
2011 43 43 19 44.19% 2012 36 36 21 58.33%
(1) “Number of Students Who Began Program” means the number of students who began the program who are scheduled to complete the program within the reporting calendar year.
(2) “Students Available for Graduation” means the number of students who began program minus the number of students unavailable for graduation, which means those students who have died, been incarcerated, or called to active military duty.
(3) “Graduates” means the number of students who completed the program within 100% of the published program length.
(4) “Completion Rate” means the number of graduates divided by the number of Students Available for Graduation.
(5) “150% Graduates” means the number of students who completed the program within 101-150% of the published program length.
(6) “150% Completion Rate” means the number of students who completed the program in the reported calendar year within 101-150% of the published program length divided by the number of Students Available for Graduation in the published program length period.
Initials: _______ Date:_______ I have read and understand the above completion rates.

SCHOOL PERFORMANCE FACT SHEET (continued) page 2
PLACEMENT RATES
Calendar Year
Number of Students Who Began Program (1)
Number of Graduates (2)
Graduates Available for Employment(3)
Graduates Employed in the Field (4)
Placement Rate % Employedin the Field (5)
Graduates Employed in the Field an Average of less than 32 Hours per Week
Graduates Employed in the Field at least 32 Hours per Week
2011 43 21 21 14 66.67% 2 12 2012 36 14 14 12 92.31% 3 9
(1) “Number of Students Who Began Program” means the number of students who began the program who are scheduled to complete the program within the reporting calendar year.
(2) “Number of Graduates” means the number of students who have completed the program within 100% of the published program length.
(3) “Graduates Available for Employment” means the number of graduates minus the number of graduates unavailable for employment. Graduates unavailable for employment' means graduates who, after graduation, die, become incarcerated, are called to active military duty, are international students that leave the United States or do not have a visa allowing employment in the United States, or are continuing their education in an accredited or bureau-approved postsecondary institution.
(4) “Graduates Employed in the Field” means a single position for which the institution represents, the program prepare graduates, within six months after the student completes the applicable educational program. For occupations requiring passage of a licensing exam prior to employment, institutions may count the graduate if employment begins “in a single position, for which the institution represents, its program prepares its graduates within six months of the announcement of the first licensure exam results.”
(5) “Placement Rate” is calculated by dividing the number of graduates gainfully employed in the field by the number of graduates available for employment.
Initials: _________ Date: ________ I have read and understand the above placement rates.
EXAMINATION PASSAGE RATES
Calendar Year
Number of Students Taking the Exam (1)
Number Who Passed First Exam Taken (2)
Number Who Failed First Exam Taken
Passage Rate (3)
2011 N/A N/A N/A N/A % 2012 N/A N/A N/A N/A %
(1) “Number of Students Taking Exam” means the number of students who completed the program within 150% of the published program length and who took the exam in the reported calendar year for the first time.
(2) “Number Who Passed First Exam Taken” means the number of students who took and passed the licensing exam in the reported calendar year on the first attempt.
(3) “Passage Rate” is calculated by dividing the number of graduates who pass the exam the first time that they take it by the number of graduates who took the licensing exam for the first time after completion of the program.
Initials:________ Date:______ I have read and understand the above license examination rates.

___________________________ __________________________
___________________________ _________________
SCHOOL PERFORMANCE FACT SHEET (continued) page 3
SALARY AND WAGE INFORMATION: PROGRAM TITLE AND PROGRAM LENGTH:
Calendar Year
Graduates Available for Employment (1)
Graduates Employedin the Field (2)
Annual Salary and Wages Reported by Graduated Employed in the Field (3). Amounts are reported in 5,000 brackets. 51K + = more than 50,000 reported, finally, NR is the number of students not responding to the survey.
5K
10K
15K
20K
25K
30K
35K
40K
45K
50K
51K +
NR
2011 21 14 0 1 1 5 2 1 3 1 0 0 0 2012 14 12 0 1 2 4 0 1 1 0 1 0 2
(1) “Graduates Available for Employment” means the number of graduates minus the number of graduates unavailable for employment. Graduates unavailable for employment mean graduates, who, after graduation, died, become incarcerated, are called to active military duty, are international students that leave the United States or do not have a visa allowing employment in the United States, or are continuing their education in an accredited or bureau-approved postsecondary institution.
(2) “Graduates Employed in the Field” means graduates who are gainfully employed within six months of graduation in a position for which the skills obtained through the education and training provided by the institution are required or provided a significant advantage to the graduate in obtaining the position.
(3) “Salary” is reported by the student. Not all graduates reported salary.
Initials: ________ Date: ______ I have read and understand the above salary and wage information.
Three-Year Cohort Default Rate as Published by USDE
Percentage of EnrolledStudents Receiving FederalStudent Loans
24.5% 72%
Initials: _____ Date: ______ I have read and understand the above USDE financial aid program participation information.
The data reflected on the above charts was gathered using at least one of the following methods: Graduate Surveys, Employer Surveys, Phone Calls, Education Development Department (EDD) and State Licensing Agencies. If you have any further questions or if you want a list of employment positions determined to be within the field for any specific program for which statistics are reported above, please speak with an Admissions Representative or see the School Catalog.
This fact sheet is filed with the Bureau for Private Postsecondary Education. Regardless of any information you may have relating to completion rates, placement rates, starting salaries, or license exam passage rates, this fact sheet contains the information as calculated pursuant to state law.
Any questions a student may have regarding this fact sheet that have not been satisfactorily answered by the institution may be directed to the Bureau for Private Postsecondary Education at: P.O. Box 980818, West Sacramento, CA 95798-0818, www.bppe.ca.gov., P: 888.370.7589 or 916.431.6959, F: 916.263.1897
I have read and understand this School Performance Fact Sheet. The School Performance Fact Sheet was reviewed and discussed with a school official prior to signing an enrollment agreement.
Student Name-Print Student Signature
School Official Date

SCHOOL PERFORMANCE FACT SHEET CET Center: EL CENTRO
Student Name: _____________________________________________________________ SID No. _______________________
BPPE Fact Sheet for School Name CENTER FOR EMPLOYMENT TRAINING
Disclose by date: September 1, 2013 Street address 294 SOUTH 3RD STREET City, State Zip Code EL CENTRO, CA 92243
Phone number (760) 337-6565 Fax Phone (760) 353-5589
Website WWW.CETWEB.ORG
PROGRAM TITLE – PROGRAM LENGTH
Course Name Clock Hours Published Charges WELDING FABRICATION 900 $9307.00
COMPLETION RATES
Calendar Year
Number of Students Who Began Program (1)
Students Available for Graduation (2)
Graduates (3) Completion Rate (4)
2011 89 88 76 86.36% 2012 61 61 58 95.08%
STUDENTS COMPLETING AFTER PUBLISHED PROGRAM LENGTH--150% COMPLETION RATES
Calendar Year
Number of Students Who Began Program (1)
Students Available for Graduation (2)
150% Graduates (5)
150% Completion Rate (6)
2011 89 88 0 0.00% 2012 61 61 0 0.00%
(1) “Number of Students Who Began Program” means the number of students who began the program who are scheduled to complete the program within the reporting calendar year.
(2) “Students Available for Graduation” means the number of students who began program minus the number of students unavailable for graduation, which means those students who have died, been incarcerated, or called to active military duty.
(3) “Graduates” means the number of students who completed the program within 100% of the published program length.
(4) “Completion Rate” means the number of graduates divided by the number of Students Available for Graduation.
(5) “150% Graduates” means the number of students who completed the program within 101-150% of the published program length.
(6) “150% Completion Rate” means the number of students who completed the program in the reported calendar year within 101-150% of the published program length divided by the number of Students Available for Graduation in the published program length period.
Initials: _______ Date:_______ I have read and understand the above completion rates.

SCHOOL PERFORMANCE FACT SHEET (continued) page 2
PLACEMENT RATES
Calendar Year
Number of Students Who Began Program (1)
Number of Graduates (2)
Graduates Available for Employment(3)
Graduates Employed in the Field (4)
Placement Rate % Employedin the Field (5)
Graduates Employed in the Field an Average of less than 32 Hours per Week
Graduates Employed in the Field at least 32 Hours per Week
2011 89 76 76 27 35.53% 5 22 2012 61 58 58 21 36.21% 0 21
(1) “Number of Students Who Began Program” means the number of students who began the program who are scheduled to complete the program within the reporting calendar year.
(2) “Number of Graduates” means the number of students who have completed the program within 100% of the published program length.
(3) “Graduates Available for Employment” means the number of graduates minus the number of graduates unavailable for employment. Graduates unavailable for employment' means graduates who, after graduation, die, become incarcerated, are called to active military duty, are international students that leave the United States or do not have a visa allowing employment in the United States, or are continuing their education in an accredited or bureau-approved postsecondary institution.
(4) “Graduates Employed in the Field” means a single position for which the institution represents, the program prepare graduates, within six months after the student completes the applicable educational program. For occupations requiring passage of a licensing exam prior to employment, institutions may count the graduate if employment begins “in a single position, for which the institution represents, its program prepares its graduates within six months of the announcement of the first licensure exam results.”
(5) “Placement Rate” is calculated by dividing the number of graduates gainfully employed in the field by the number of graduates available for employment.
Initials: _________ Date: ________ I have read and understand the above placement rates.
EXAMINATION PASSAGE RATES
Calendar Year
Number of Students Taking the Exam (1)
Number Who Passed First Exam Taken (2)
Number Who Failed First Exam Taken
Passage Rate (3)
2011 N/A N/A N/A N/A % 2012 N/A N/A N/A N/A %
(1) “Number of Students Taking Exam” means the number of students who completed the program within 150% of the published program length and who took the exam in the reported calendar year for the first time.
(2) “Number Who Passed First Exam Taken” means the number of students who took and passed the licensing exam in the reported calendar year on the first attempt.
(3) “Passage Rate” is calculated by dividing the number of graduates who pass the exam the first time that they take it by the number of graduates who took the licensing exam for the first time after completion of the program.
Initials:________ Date:______ I have read and understand the above license examination rates.

___________________________ __________________________
___________________________ _________________
SCHOOL PERFORMANCE FACT SHEET (continued) page 3
SALARY AND WAGE INFORMATION: PROGRAM TITLE AND PROGRAM LENGTH:
Calendar Year
Graduates Available for Employment (1)
Graduates Employedin the Field (2)
Annual Salary and Wages Reported by Graduated Employed in the Field (3). Amounts are reported in 5,000 brackets. 51K + = more than 50,000 reported, finally, NR is the number of students not responding to the survey.
5K
10K
15K
20K
25K
30K
35K
40K
45K
50K
51K +
NR
2011 76 27 0 1 4 3 10 5 1 3 0 0 0 2012 58 21 0 0 0 7 8 0 0 0 0 5 0
(1) “Graduates Available for Employment” means the number of graduates minus the number of graduates unavailable for employment. Graduates unavailable for employment mean graduates, who, after graduation, died, become incarcerated, are called to active military duty, are international students that leave the United States or do not have a visa allowing employment in the United States, or are continuing their education in an accredited or bureau-approved postsecondary institution.
(2) “Graduates Employed in the Field” means graduates who are gainfully employed within six months of graduation in a position for which the skills obtained through the education and training provided by the institution are required or provided a significant advantage to the graduate in obtaining the position.
(3) “Salary” is reported by the student. Not all graduates reported salary.
Initials: ________ Date: ______ I have read and understand the above salary and wage information.
Three-Year Cohort Default Rate as Published by USDE
Percentage of EnrolledStudents Receiving FederalStudent Loans
24.5% 72%
Initials: _____ Date: ______ I have read and understand the above USDE financial aid program participation information.
The data reflected on the above charts was gathered using at least one of the following methods: Graduate Surveys, Employer Surveys, Phone Calls, Education Development Department (EDD) and State Licensing Agencies. If you have any further questions or if you want a list of employment positions determined to be within the field for any specific program for which statistics are reported above, please speak with an Admissions Representative or see the School Catalog.
This fact sheet is filed with the Bureau for Private Postsecondary Education. Regardless of any information you may have relating to completion rates, placement rates, starting salaries, or license exam passage rates, this fact sheet contains the information as calculated pursuant to state law.
Any questions a student may have regarding this fact sheet that have not been satisfactorily answered by the institution may be directed to the Bureau for Private Postsecondary Education at: P.O. Box 980818, West Sacramento, CA 95798-0818, www.bppe.ca.gov., P: 888.370.7589 or 916.431.6959, F: 916.263.1897
I have read and understand this School Performance Fact Sheet. The School Performance Fact Sheet was reviewed and discussed with a school official prior to signing an enrollment agreement.
Student Name-Print Student Signature
School Official Date

SCHOOL PERFORMANCE FACT SHEET CET Center: TEMECULA/FALLBROOK
Student Name: _____________________________________________________________ SID No. _______________________
BPPE Fact Sheet for School Name CENTER FOR EMPLOYMENT TRAINING
Disclose by date: September 1, 2013 Street address 27941 JEFFERSON SUITE "A" City, State Zip Code TEMECULA, CA 92590
Phone number (951) 699-8180 Fax Phone (951) 699-3851
Website WWW.CETWEB.ORG
PROGRAM TITLE – PROGRAM LENGTH
Course Name Clock Hours Published Charges SHIPPING & RECEIVING WAREHOUSE OPERATIONS 720 $8060.00
COMPLETION RATES
Calendar Year
Number of Students Who Began Program (1)
Students Available for Graduation (2)
Graduates (3) Completion Rate (4)
2011 47 47 5 10.64% 2012 42 41 16 39.02%
STUDENTS COMPLETING AFTER PUBLISHED PROGRAM LENGTH--150% COMPLETION RATES
Calendar Year
Number of Students Who Began Program (1)
Students Available for Graduation (2)
150% Graduates (5)
150% Completion Rate (6)
2011 47 47 41 87.23% 2012 42 41 18 43.90%
(1) “Number of Students Who Began Program” means the number of students who began the program who are scheduled to complete the program within the reporting calendar year.
(2) “Students Available for Graduation” means the number of students who began program minus the number of students unavailable for graduation, which means those students who have died, been incarcerated, or called to active military duty.
(3) “Graduates” means the number of students who completed the program within 100% of the published program length.
(4) “Completion Rate” means the number of graduates divided by the number of Students Available for Graduation.
(5) “150% Graduates” means the number of students who completed the program within 101-150% of the published program length.
(6) “150% Completion Rate” means the number of students who completed the program in the reported calendar year within 101-150% of the published program length divided by the number of Students Available for Graduation in the published program length period.
Initials: _______ Date:_______ I have read and understand the above completion rates.

SCHOOL PERFORMANCE FACT SHEET (continued) page 2
PLACEMENT RATES
Calendar Year
Number of Students Who Began Program (1)
Number of Graduates (2)
Graduates Available for Employment(3)
Graduates Employed in the Field (4)
Placement Rate % Employedin the Field (5)
Graduates Employed in the Field an Average of less than 32 Hours per Week
Graduates Employed in the Field at least 32 Hours per Week
2011 47 5 5 3 60.00% 0 3 2012 42 16 16 14 87.50% 7 7
(1) “Number of Students Who Began Program” means the number of students who began the program who are scheduled to complete the program within the reporting calendar year.
(2) “Number of Graduates” means the number of students who have completed the program within 100% of the published program length.
(3) “Graduates Available for Employment” means the number of graduates minus the number of graduates unavailable for employment. Graduates unavailable for employment' means graduates who, after graduation, die, become incarcerated, are called to active military duty, are international students that leave the United States or do not have a visa allowing employment in the United States, or are continuing their education in an accredited or bureau-approved postsecondary institution.
(4) “Graduates Employed in the Field” means a single position for which the institution represents, the program prepare graduates, within six months after the student completes the applicable educational program. For occupations requiring passage of a licensing exam prior to employment, institutions may count the graduate if employment begins “in a single position, for which the institution represents, its program prepares its graduates within six months of the announcement of the first licensure exam results.”
(5) “Placement Rate” is calculated by dividing the number of graduates gainfully employed in the field by the number of graduates available for employment.
Initials: _________ Date: ________ I have read and understand the above placement rates.
EXAMINATION PASSAGE RATES
Calendar Year
Number of Students Taking the Exam (1)
Number Who Passed First Exam Taken (2)
Number Who Failed First Exam Taken
Passage Rate (3)
2011 N/A N/A N/A N/A % 2012 N/A N/A N/A N/A %
(1) “Number of Students Taking Exam” means the number of students who completed the program within 150% of the published program length and who took the exam in the reported calendar year for the first time.
(2) “Number Who Passed First Exam Taken” means the number of students who took and passed the licensing exam in the reported calendar year on the first attempt.
(3) “Passage Rate” is calculated by dividing the number of graduates who pass the exam the first time that they take it by the number of graduates who took the licensing exam for the first time after completion of the program.
Initials:________ Date:______ I have read and understand the above license examination rates.

___________________________ __________________________
___________________________ _________________
SCHOOL PERFORMANCE FACT SHEET (continued) page 3
SALARY AND WAGE INFORMATION: PROGRAM TITLE AND PROGRAM LENGTH:
Calendar Year
Graduates Available for Employment (1)
Graduates Employedin the Field (2)
Annual Salary and Wages Reported by Graduated Employed in the Field (3). Amounts are reported in 5,000 brackets. 51K + = more than 50,000 reported, finally, NR is the number of students not responding to the survey.
5K
10K
15K
20K
25K
30K
35K
40K
45K
50K
51K +
NR
2011 5 3 0 0 1 1 1 0 0 0 0 0 0 2012 16 14 0 5 1 6 1 1 1 0 0 0 0
(1) “Graduates Available for Employment” means the number of graduates minus the number of graduates unavailable for employment. Graduates unavailable for employment mean graduates, who, after graduation, died, become incarcerated, are called to active military duty, are international students that leave the United States or do not have a visa allowing employment in the United States, or are continuing their education in an accredited or bureau-approved postsecondary institution.
(2) “Graduates Employed in the Field” means graduates who are gainfully employed within six months of graduation in a position for which the skills obtained through the education and training provided by the institution are required or provided a significant advantage to the graduate in obtaining the position.
(3) “Salary” is reported by the student. Not all graduates reported salary.
Initials: ________ Date: ______ I have read and understand the above salary and wage information.
Three-Year Cohort Default Rate as Published by USDE
Percentage of EnrolledStudents Receiving FederalStudent Loans
24.5% 72%
Initials: _____ Date: ______ I have read and understand the above USDE financial aid program participation information.
The data reflected on the above charts was gathered using at least one of the following methods: Graduate Surveys, Employer Surveys, Phone Calls, Education Development Department (EDD) and State Licensing Agencies. If you have any further questions or if you want a list of employment positions determined to be within the field for any specific program for which statistics are reported above, please speak with an Admissions Representative or see the School Catalog.
This fact sheet is filed with the Bureau for Private Postsecondary Education. Regardless of any information you may have relating to completion rates, placement rates, starting salaries, or license exam passage rates, this fact sheet contains the information as calculated pursuant to state law.
Any questions a student may have regarding this fact sheet that have not been satisfactorily answered by the institution may be directed to the Bureau for Private Postsecondary Education at: P.O. Box 980818, West Sacramento, CA 95798-0818, www.bppe.ca.gov., P: 888.370.7589 or 916.431.6959, F: 916.263.1897
I have read and understand this School Performance Fact Sheet. The School Performance Fact Sheet was reviewed and discussed with a school official prior to signing an enrollment agreement.
Student Name-Print Student Signature
School Official Date

SCHOOL PERFORMANCE FACT SHEET CET Center: GILROY
Student Name: _____________________________________________________________ SID No. _______________________
BPPE Fact Sheet for School Name CENTER FOR EMPLOYMENT TRAINING
Disclose by date: September 1, 2013 Street address 7800 ARROYO CIRCLE City, State Zip Code GILROY, CA 95020
Phone number (408) 842-6484 Fax Phone (408) 8427158
Website WWW.CETWEB.ORG
PROGRAM TITLE – PROGRAM LENGTH
Course Name Clock Hours Published Charges GREEN BUILDING CONSTRUCTION SKILLS 900 $9307.00
COMPLETION RATES
Calendar Year
Number of Students Who Began Program (1)
Students Available for Graduation (2)
Graduates (3) Completion Rate (4)
2011 79 77 26 33.77% 2012 41 41 7 17.07%
STUDENTS COMPLETING AFTER PUBLISHED PROGRAM LENGTH--150% COMPLETION RATES
Calendar Year
Number of Students Who Began Program (1)
Students Available for Graduation (2)
150% Graduates (5)
150% Completion Rate (6)
2011 79 77 42 54.55% 2012 41 41 27 65.85%
(1) “Number of Students Who Began Program” means the number of students who began the program who are scheduled to complete the program within the reporting calendar year.
(2) “Students Available for Graduation” means the number of students who began program minus the number of students unavailable for graduation, which means those students who have died, been incarcerated, or called to active military duty.
(3) “Graduates” means the number of students who completed the program within 100% of the published program length.
(4) “Completion Rate” means the number of graduates divided by the number of Students Available for Graduation.
(5) “150% Graduates” means the number of students who completed the program within 101-150% of the published program length.
(6) “150% Completion Rate” means the number of students who completed the program in the reported calendar year within 101-150% of the published program length divided by the number of Students Available for Graduation in the published program length period.
Initials: _______ Date:_______ I have read and understand the above completion rates.

SCHOOL PERFORMANCE FACT SHEET (continued) page 2
PLACEMENT RATES
Calendar Year
Number of Students Who Began Program (1)
Number of Graduates (2)
Graduates Available for Employment(3)
Graduates Employed in the Field (4)
Placement Rate % Employedin the Field (5)
Graduates Employed in the Field an Average of less than 32 Hours per Week
Graduates Employed in the Field at least 32 Hours per Week
2011 79 26 26 20 76.92% 0 20 2012 41 7 7 2 28.57% 0 2
(1) “Number of Students Who Began Program” means the number of students who began the program who are scheduled to complete the program within the reporting calendar year.
(2) “Number of Graduates” means the number of students who have completed the program within 100% of the published program length.
(3) “Graduates Available for Employment” means the number of graduates minus the number of graduates unavailable for employment. Graduates unavailable for employment' means graduates who, after graduation, die, become incarcerated, are called to active military duty, are international students that leave the United States or do not have a visa allowing employment in the United States, or are continuing their education in an accredited or bureau-approved postsecondary institution.
(4) “Graduates Employed in the Field” means a single position for which the institution represents, the program prepare graduates, within six months after the student completes the applicable educational program. For occupations requiring passage of a licensing exam prior to employment, institutions may count the graduate if employment begins “in a single position, for which the institution represents, its program prepares its graduates within six months of the announcement of the first licensure exam results.”
(5) “Placement Rate” is calculated by dividing the number of graduates gainfully employed in the field by the number of graduates available for employment.
Initials: _________ Date: ________ I have read and understand the above placement rates.
EXAMINATION PASSAGE RATES
Calendar Year
Number of Students Taking the Exam (1)
Number Who Passed First Exam Taken (2)
Number Who Failed First Exam Taken
Passage Rate (3)
2011 N/A N/A N/A N/A % 2012 N/A N/A N/A N/A %
(1) “Number of Students Taking Exam” means the number of students who completed the program within 150% of the published program length and who took the exam in the reported calendar year for the first time.
(2) “Number Who Passed First Exam Taken” means the number of students who took and passed the licensing exam in the reported calendar year on the first attempt.
(3) “Passage Rate” is calculated by dividing the number of graduates who pass the exam the first time that they take it by the number of graduates who took the licensing exam for the first time after completion of the program.
Initials:________ Date:______ I have read and understand the above license examination rates.

___________________________ __________________________
___________________________ _________________
SCHOOL PERFORMANCE FACT SHEET (continued) page 3
SALARY AND WAGE INFORMATION: PROGRAM TITLE AND PROGRAM LENGTH:
Calendar Year
Graduates Available for Employment (1)
Graduates Employedin the Field (2)
Annual Salary and Wages Reported by Graduated Employed in the Field (3). Amounts are reported in 5,000 brackets. 51K + = more than 50,000 reported, finally, NR is the number of students not responding to the survey.
5K
10K
15K
20K
25K
30K
35K
40K
45K
50K
51K +
NR
2011 26 20 0 0 0 7 3 6 4 0 0 0 0 2012 7 2 0 0 0 0 0 2 2 0 0 0 0
(1) “Graduates Available for Employment” means the number of graduates minus the number of graduates unavailable for employment. Graduates unavailable for employment mean graduates, who, after graduation, died, become incarcerated, are called to active military duty, are international students that leave the United States or do not have a visa allowing employment in the United States, or are continuing their education in an accredited or bureau-approved postsecondary institution.
(2) “Graduates Employed in the Field” means graduates who are gainfully employed within six months of graduation in a position for which the skills obtained through the education and training provided by the institution are required or provided a significant advantage to the graduate in obtaining the position.
(3) “Salary” is reported by the student. Not all graduates reported salary.
Initials: ________ Date: ______ I have read and understand the above salary and wage information.
Three-Year Cohort Default Rate as Published by USDE
Percentage of EnrolledStudents Receiving FederalStudent Loans
24.5% 72%
Initials: _____ Date: ______ I have read and understand the above USDE financial aid program participation information.
The data reflected on the above charts was gathered using at least one of the following methods: Graduate Surveys, Employer Surveys, Phone Calls, Education Development Department (EDD) and State Licensing Agencies. If you have any further questions or if you want a list of employment positions determined to be within the field for any specific program for which statistics are reported above, please speak with an Admissions Representative or see the School Catalog.
This fact sheet is filed with the Bureau for Private Postsecondary Education. Regardless of any information you may have relating to completion rates, placement rates, starting salaries, or license exam passage rates, this fact sheet contains the information as calculated pursuant to state law.
Any questions a student may have regarding this fact sheet that have not been satisfactorily answered by the institution may be directed to the Bureau for Private Postsecondary Education at: P.O. Box 980818, West Sacramento, CA 95798-0818, www.bppe.ca.gov., P: 888.370.7589 or 916.431.6959, F: 916.263.1897
I have read and understand this School Performance Fact Sheet. The School Performance Fact Sheet was reviewed and discussed with a school official prior to signing an enrollment agreement.
Student Name-Print Student Signature
School Official Date

SCHOOL PERFORMANCE FACT SHEET CET Center: GILROY
Student Name: _____________________________________________________________ SID No. _______________________
BPPE Fact Sheet for School Name CENTER FOR EMPLOYMENT TRAINING
Disclose by date: September 1, 2013 Street address 7800 ARROYO CIRCLE City, State Zip Code GILROY, CA 95020
Phone number (408) 842-6484 Fax Phone (408) 8427158
Website WWW.CETWEB.ORG
PROGRAM TITLE – PROGRAM LENGTH
Course Name Clock Hours Published Charges MEDICAL ADMINISTRATIVE ASSISTANT 720 $8060.00
COMPLETION RATES
Calendar Year
Number of Students Who Began Program (1)
Students Available for Graduation (2)
Graduates (3) Completion Rate (4)
2011 62 62 7 11.29% 2012 63 63 11 17.46%
STUDENTS COMPLETING AFTER PUBLISHED PROGRAM LENGTH--150% COMPLETION RATES
Calendar Year
Number of Students Who Began Program (1)
Students Available for Graduation (2)
150% Graduates (5)
150% Completion Rate (6)
2011 62 62 45 72.58% 2012 63 63 39 61.90%
(1) “Number of Students Who Began Program” means the number of students who began the program who are scheduled to complete the program within the reporting calendar year.
(2) “Students Available for Graduation” means the number of students who began program minus the number of students unavailable for graduation, which means those students who have died, been incarcerated, or called to active military duty.
(3) “Graduates” means the number of students who completed the program within 100% of the published program length.
(4) “Completion Rate” means the number of graduates divided by the number of Students Available for Graduation.
(5) “150% Graduates” means the number of students who completed the program within 101-150% of the published program length.
(6) “150% Completion Rate” means the number of students who completed the program in the reported calendar year within 101-150% of the published program length divided by the number of Students Available for Graduation in the published program length period.
Initials: _______ Date:_______ I have read and understand the above completion rates.

SCHOOL PERFORMANCE FACT SHEET (continued) page 2
PLACEMENT RATES
Calendar Year
Number of Students Who Began Program (1)
Number of Graduates (2)
Graduates Available for Employment(3)
Graduates Employed in the Field (4)
Placement Rate % Employedin the Field (5)
Graduates Employed in the Field an Average of less than 32 Hours per Week
Graduates Employed in the Field at least 32 Hours per Week
2011 62 7 7 6 85.71% 1 5 2012 63 11 11 5 45.45% 0 5
(1) “Number of Students Who Began Program” means the number of students who began the program who are scheduled to complete the program within the reporting calendar year.
(2) “Number of Graduates” means the number of students who have completed the program within 100% of the published program length.
(3) “Graduates Available for Employment” means the number of graduates minus the number of graduates unavailable for employment. Graduates unavailable for employment' means graduates who, after graduation, die, become incarcerated, are called to active military duty, are international students that leave the United States or do not have a visa allowing employment in the United States, or are continuing their education in an accredited or bureau-approved postsecondary institution.
(4) “Graduates Employed in the Field” means a single position for which the institution represents, the program prepare graduates, within six months after the student completes the applicable educational program. For occupations requiring passage of a licensing exam prior to employment, institutions may count the graduate if employment begins “in a single position, for which the institution represents, its program prepares its graduates within six months of the announcement of the first licensure exam results.”
(5) “Placement Rate” is calculated by dividing the number of graduates gainfully employed in the field by the number of graduates available for employment.
Initials: _________ Date: ________ I have read and understand the above placement rates.
EXAMINATION PASSAGE RATES
Calendar Year
Number of Students Taking the Exam (1)
Number Who Passed First Exam Taken (2)
Number Who Failed First Exam Taken
Passage Rate (3)
2011 N/A N/A N/A N/A % 2012 N/A N/A N/A N/A %
(1) “Number of Students Taking Exam” means the number of students who completed the program within 150% of the published program length and who took the exam in the reported calendar year for the first time.
(2) “Number Who Passed First Exam Taken” means the number of students who took and passed the licensing exam in the reported calendar year on the first attempt.
(3) “Passage Rate” is calculated by dividing the number of graduates who pass the exam the first time that they take it by the number of graduates who took the licensing exam for the first time after completion of the program.
Initials:________ Date:______ I have read and understand the above license examination rates.

___________________________ __________________________
___________________________ _________________
SCHOOL PERFORMANCE FACT SHEET (continued) page 3
SALARY AND WAGE INFORMATION: PROGRAM TITLE AND PROGRAM LENGTH:
Calendar Year
Graduates Available for Employment (1)
Graduates Employedin the Field (2)
Annual Salary and Wages Reported by Graduated Employed in the Field (3). Amounts are reported in 5,000 brackets. 51K + = more than 50,000 reported, finally, NR is the number of students not responding to the survey.
5K
10K
15K
20K
25K
30K
35K
40K
45K
50K
51K +
NR
2011 7 6 0 0 1 1 4 0 0 0 0 0 0 2012 11 5 0 0 0 1 2 0 0 1 0 0 0
(1) “Graduates Available for Employment” means the number of graduates minus the number of graduates unavailable for employment. Graduates unavailable for employment mean graduates, who, after graduation, died, become incarcerated, are called to active military duty, are international students that leave the United States or do not have a visa allowing employment in the United States, or are continuing their education in an accredited or bureau-approved postsecondary institution.
(2) “Graduates Employed in the Field” means graduates who are gainfully employed within six months of graduation in a position for which the skills obtained through the education and training provided by the institution are required or provided a significant advantage to the graduate in obtaining the position.
(3) “Salary” is reported by the student. Not all graduates reported salary.
Initials: ________ Date: ______ I have read and understand the above salary and wage information.
Three-Year Cohort Default Rate as Published by USDE
Percentage of EnrolledStudents Receiving FederalStudent Loans
24.5% 72%
Initials: _____ Date: ______ I have read and understand the above USDE financial aid program participation information.
The data reflected on the above charts was gathered using at least one of the following methods: Graduate Surveys, Employer Surveys, Phone Calls, Education Development Department (EDD) and State Licensing Agencies. If you have any further questions or if you want a list of employment positions determined to be within the field for any specific program for which statistics are reported above, please speak with an Admissions Representative or see the School Catalog.
This fact sheet is filed with the Bureau for Private Postsecondary Education. Regardless of any information you may have relating to completion rates, placement rates, starting salaries, or license exam passage rates, this fact sheet contains the information as calculated pursuant to state law.
Any questions a student may have regarding this fact sheet that have not been satisfactorily answered by the institution may be directed to the Bureau for Private Postsecondary Education at: P.O. Box 980818, West Sacramento, CA 95798-0818, www.bppe.ca.gov., P: 888.370.7589 or 916.431.6959, F: 916.263.1897
I have read and understand this School Performance Fact Sheet. The School Performance Fact Sheet was reviewed and discussed with a school official prior to signing an enrollment agreement.
Student Name-Print Student Signature
School Official Date

SCHOOL PERFORMANCE FACT SHEET CET Center: GILROY
Student Name: _____________________________________________________________ SID No. _______________________
BPPE Fact Sheet for School Name CENTER FOR EMPLOYMENT TRAINING
Disclose by date: September 1, 2013 Street address 7800 ARROYO CIRCLE City, State Zip Code GILROY, CA 95020
Phone number (408) 842-6484 Fax Phone (408) 8427158
Website WWW.CETWEB.ORG
PROGRAM TITLE – PROGRAM LENGTH
Course Name Clock Hours Published Charges TRUCK DRIVER 630 $8779.00
COMPLETION RATES
Calendar Year
Number of Students Who Began Program (1)
Students Available for Graduation (2)
Graduates (3) Completion Rate (4)
2011 83 83 13 15.66% 2012 78 78 31 39.74%
STUDENTS COMPLETING AFTER PUBLISHED PROGRAM LENGTH--150% COMPLETION RATES
Calendar Year
Number of Students Who Began Program (1)
Students Available for Graduation (2)
150% Graduates (5)
150% Completion Rate (6)
2011 83 83 61 73.49% 2012 78 78 38 48.72%
(1) “Number of Students Who Began Program” means the number of students who began the program who are scheduled to complete the program within the reporting calendar year.
(2) “Students Available for Graduation” means the number of students who began program minus the number of students unavailable for graduation, which means those students who have died, been incarcerated, or called to active military duty.
(3) “Graduates” means the number of students who completed the program within 100% of the published program length.
(4) “Completion Rate” means the number of graduates divided by the number of Students Available for Graduation.
(5) “150% Graduates” means the number of students who completed the program within 101-150% of the published program length.
(6) “150% Completion Rate” means the number of students who completed the program in the reported calendar year within 101-150% of the published program length divided by the number of Students Available for Graduation in the published program length period.
Initials: _______ Date:_______ I have read and understand the above completion rates.

SCHOOL PERFORMANCE FACT SHEET (continued) page 2
PLACEMENT RATES
Calendar Year
Number of Students Who Began Program (1)
Number of Graduates (2)
Graduates Available for Employment(3)
Graduates Employed in the Field (4)
Placement Rate % Employedin the Field (5)
Graduates Employed in the Field an Average of less than 32 Hours per Week
Graduates Employed in the Field at least 32 Hours per Week
2011 83 13 13 12 92.31% 0 12 2012 78 31 31 27 87.10% 0 27
(1) “Number of Students Who Began Program” means the number of students who began the program who are scheduled to complete the program within the reporting calendar year.
(2) “Number of Graduates” means the number of students who have completed the program within 100% of the published program length.
(3) “Graduates Available for Employment” means the number of graduates minus the number of graduates unavailable for employment. Graduates unavailable for employment' means graduates who, after graduation, die, become incarcerated, are called to active military duty, are international students that leave the United States or do not have a visa allowing employment in the United States, or are continuing their education in an accredited or bureau-approved postsecondary institution.
(4) “Graduates Employed in the Field” means a single position for which the institution represents, the program prepare graduates, within six months after the student completes the applicable educational program. For occupations requiring passage of a licensing exam prior to employment, institutions may count the graduate if employment begins “in a single position, for which the institution represents, its program prepares its graduates within six months of the announcement of the first licensure exam results.”
(5) “Placement Rate” is calculated by dividing the number of graduates gainfully employed in the field by the number of graduates available for employment.
Initials: _________ Date: ________ I have read and understand the above placement rates.
EXAMINATION PASSAGE RATES
Calendar Year
Number of Students Taking the Exam (1)
Number Who Passed First Exam Taken (2)
Number Who Failed First Exam Taken
Passage Rate (3)
2011 N/A N/A N/A N/A % 2012 N/A N/A N/A N/A %
(1) “Number of Students Taking Exam” means the number of students who completed the program within 150% of the published program length and who took the exam in the reported calendar year for the first time.
(2) “Number Who Passed First Exam Taken” means the number of students who took and passed the licensing exam in the reported calendar year on the first attempt.
(3) “Passage Rate” is calculated by dividing the number of graduates who pass the exam the first time that they take it by the number of graduates who took the licensing exam for the first time after completion of the program.
Initials:________ Date:______ I have read and understand the above license examination rates.

___________________________ __________________________
___________________________ _________________
SCHOOL PERFORMANCE FACT SHEET (continued) page 3
SALARY AND WAGE INFORMATION: PROGRAM TITLE AND PROGRAM LENGTH:
Calendar Year
Graduates Available for Employment (1)
Graduates Employedin the Field (2)
Annual Salary and Wages Reported by Graduated Employed in the Field (3). Amounts are reported in 5,000 brackets. 51K + = more than 50,000 reported, finally, NR is the number of students not responding to the survey.
5K
10K
15K
20K
25K
30K
35K
40K
45K
50K
51K +
NR
2011 13 12 0 0 0 0 3 2 1 2 4 0 0 2012 31 27 0 0 0 1 6 6 6 1 1 0 4
(1) “Graduates Available for Employment” means the number of graduates minus the number of graduates unavailable for employment. Graduates unavailable for employment mean graduates, who, after graduation, died, become incarcerated, are called to active military duty, are international students that leave the United States or do not have a visa allowing employment in the United States, or are continuing their education in an accredited or bureau-approved postsecondary institution.
(2) “Graduates Employed in the Field” means graduates who are gainfully employed within six months of graduation in a position for which the skills obtained through the education and training provided by the institution are required or provided a significant advantage to the graduate in obtaining the position.
(3) “Salary” is reported by the student. Not all graduates reported salary.
Initials: ________ Date: ______ I have read and understand the above salary and wage information.
Three-Year Cohort Default Rate as Published by USDE
Percentage of EnrolledStudents Receiving FederalStudent Loans
24.5% 72%
Initials: _____ Date: ______ I have read and understand the above USDE financial aid program participation information.
The data reflected on the above charts was gathered using at least one of the following methods: Graduate Surveys, Employer Surveys, Phone Calls, Education Development Department (EDD) and State Licensing Agencies. If you have any further questions or if you want a list of employment positions determined to be within the field for any specific program for which statistics are reported above, please speak with an Admissions Representative or see the School Catalog.
This fact sheet is filed with the Bureau for Private Postsecondary Education. Regardless of any information you may have relating to completion rates, placement rates, starting salaries, or license exam passage rates, this fact sheet contains the information as calculated pursuant to state law.
Any questions a student may have regarding this fact sheet that have not been satisfactorily answered by the institution may be directed to the Bureau for Private Postsecondary Education at: P.O. Box 980818, West Sacramento, CA 95798-0818, www.bppe.ca.gov., P: 888.370.7589 or 916.431.6959, F: 916.263.1897
I have read and understand this School Performance Fact Sheet. The School Performance Fact Sheet was reviewed and discussed with a school official prior to signing an enrollment agreement.
Student Name-Print Student Signature
School Official Date

SCHOOL PERFORMANCE FACT SHEET CET Center: OXNARD
Student Name: _____________________________________________________________ SID No. _______________________
BPPE Fact Sheet for School Name CENTER FOR EMPLOYMENT TRAINING
Disclose by date: September 1, 2013 Street address 761 SOUTH "C" STREET City, State Zip Code OXNARD, CA 93030
Phone number (805) 487-9821 Fax Phone (805) 487-7775
Website WWW.CETWEB.ORG
PROGRAM TITLE – PROGRAM LENGTH
Course Name Clock Hours Published Charges GREEN BUILDING CONSTRUCTION SKILLS 900 $9307.00
COMPLETION RATES
Calendar Year
Number of Students Who Began Program (1)
Students Available for Graduation (2)
Graduates (3) Completion Rate (4)
2011 21 20 4 20.00% 2012 10 10 0 0.00%
STUDENTS COMPLETING AFTER PUBLISHED PROGRAM LENGTH--150% COMPLETION RATES
Calendar Year
Number of Students Who Began Program (1)
Students Available for Graduation (2)
150% Graduates (5)
150% Completion Rate (6)
2011 21 20 12 60.00% 2012 10 10 8 80.00%
(1) “Number of Students Who Began Program” means the number of students who began the program who are scheduled to complete the program within the reporting calendar year.
(2) “Students Available for Graduation” means the number of students who began program minus the number of students unavailable for graduation, which means those students who have died, been incarcerated, or called to active military duty.
(3) “Graduates” means the number of students who completed the program within 100% of the published program length.
(4) “Completion Rate” means the number of graduates divided by the number of Students Available for Graduation.
(5) “150% Graduates” means the number of students who completed the program within 101-150% of the published program length.
(6) “150% Completion Rate” means the number of students who completed the program in the reported calendar year within 101-150% of the published program length divided by the number of Students Available for Graduation in the published program length period.
Initials: _______ Date:_______ I have read and understand the above completion rates.

SCHOOL PERFORMANCE FACT SHEET (continued) page 2
PLACEMENT RATES
Calendar Year
Number of Students Who Began Program (1)
Number of Graduates (2)
Graduates Available for Employment(3)
Graduates Employed in the Field (4)
Placement Rate % Employedin the Field (5)
Graduates Employed in the Field an Average of less than 32 Hours per Week
Graduates Employed in the Field at least 32 Hours per Week
2011 21 4 4 4 100.00% 0 4 2012 10 0 0 0 0.00% 0 0
(1) “Number of Students Who Began Program” means the number of students who began the program who are scheduled to complete the program within the reporting calendar year.
(2) “Number of Graduates” means the number of students who have completed the program within 100% of the published program length.
(3) “Graduates Available for Employment” means the number of graduates minus the number of graduates unavailable for employment. Graduates unavailable for employment' means graduates who, after graduation, die, become incarcerated, are called to active military duty, are international students that leave the United States or do not have a visa allowing employment in the United States, or are continuing their education in an accredited or bureau-approved postsecondary institution.
(4) “Graduates Employed in the Field” means a single position for which the institution represents, the program prepare graduates, within six months after the student completes the applicable educational program. For occupations requiring passage of a licensing exam prior to employment, institutions may count the graduate if employment begins “in a single position, for which the institution represents, its program prepares its graduates within six months of the announcement of the first licensure exam results.”
(5) “Placement Rate” is calculated by dividing the number of graduates gainfully employed in the field by the number of graduates available for employment.
Initials: _________ Date: ________ I have read and understand the above placement rates.
EXAMINATION PASSAGE RATES
Calendar Year
Number of Students Taking the Exam (1)
Number Who Passed First Exam Taken (2)
Number Who Failed First Exam Taken
Passage Rate (3)
2011 N/A N/A N/A N/A % 2012 N/A N/A N/A N/A %
(1) “Number of Students Taking Exam” means the number of students who completed the program within 150% of the published program length and who took the exam in the reported calendar year for the first time.
(2) “Number Who Passed First Exam Taken” means the number of students who took and passed the licensing exam in the reported calendar year on the first attempt.
(3) “Passage Rate” is calculated by dividing the number of graduates who pass the exam the first time that they take it by the number of graduates who took the licensing exam for the first time after completion of the program.
Initials:________ Date:______ I have read and understand the above license examination rates.

___________________________ __________________________
___________________________ _________________
SCHOOL PERFORMANCE FACT SHEET (continued) page 3
SALARY AND WAGE INFORMATION: PROGRAM TITLE AND PROGRAM LENGTH:
Calendar Year
Graduates Available for Employment (1)
Graduates Employedin the Field (2)
Annual Salary and Wages Reported by Graduated Employed in the Field (3). Amounts are reported in 5,000 brackets. 51K + = more than 50,000 reported, finally, NR is the number of students not responding to the survey.
5K
10K
15K
20K
25K
30K
35K
40K
45K
50K
51K +
NR
2011 4 4 0 0 0 0 3 0 1 0 0 0 0 2012 0 0 0 0 0 0 0 0 0 0 0 0 0
(1) “Graduates Available for Employment” means the number of graduates minus the number of graduates unavailable for employment. Graduates unavailable for employment mean graduates, who, after graduation, died, become incarcerated, are called to active military duty, are international students that leave the United States or do not have a visa allowing employment in the United States, or are continuing their education in an accredited or bureau-approved postsecondary institution.
(2) “Graduates Employed in the Field” means graduates who are gainfully employed within six months of graduation in a position for which the skills obtained through the education and training provided by the institution are required or provided a significant advantage to the graduate in obtaining the position.
(3) “Salary” is reported by the student. Not all graduates reported salary.
Initials: ________ Date: ______ I have read and understand the above salary and wage information.
Three-Year Cohort Default Rate as Published by USDE
Percentage of EnrolledStudents Receiving FederalStudent Loans
24.5% 72%
Initials: _____ Date: ______ I have read and understand the above USDE financial aid program participation information.
The data reflected on the above charts was gathered using at least one of the following methods: Graduate Surveys, Employer Surveys, Phone Calls, Education Development Department (EDD) and State Licensing Agencies. If you have any further questions or if you want a list of employment positions determined to be within the field for any specific program for which statistics are reported above, please speak with an Admissions Representative or see the School Catalog.
This fact sheet is filed with the Bureau for Private Postsecondary Education. Regardless of any information you may have relating to completion rates, placement rates, starting salaries, or license exam passage rates, this fact sheet contains the information as calculated pursuant to state law.
Any questions a student may have regarding this fact sheet that have not been satisfactorily answered by the institution may be directed to the Bureau for Private Postsecondary Education at: P.O. Box 980818, West Sacramento, CA 95798-0818, www.bppe.ca.gov., P: 888.370.7589 or 916.431.6959, F: 916.263.1897
I have read and understand this School Performance Fact Sheet. The School Performance Fact Sheet was reviewed and discussed with a school official prior to signing an enrollment agreement.
Student Name-Print Student Signature
School Official Date

SCHOOL PERFORMANCE FACT SHEET CET Center: OXNARD
Student Name: _____________________________________________________________ SID No. _______________________
BPPE Fact Sheet for School Name CENTER FOR EMPLOYMENT TRAINING
Disclose by date: September 1, 2013 Street address 761 SOUTH "C" STREET City, State Zip Code OXNARD, CA 93030
Phone number (805) 487-9821 Fax Phone (805) 487-7775
Website WWW.CETWEB.ORG
PROGRAM TITLE – PROGRAM LENGTH
Course Name Clock Hours Published Charges MEDICAL ASSISTANT 900 $9307.00
COMPLETION RATES
Calendar Year
Number of Students Who Began Program (1)
Students Available for Graduation (2)
Graduates (3) Completion Rate (4)
2011 70 69 5 7.25% 2012 26 26 2 7.69%
STUDENTS COMPLETING AFTER PUBLISHED PROGRAM LENGTH--150% COMPLETION RATES
Calendar Year
Number of Students Who Began Program (1)
Students Available for Graduation (2)
150% Graduates (5)
150% Completion Rate (6)
2011 70 69 52 75.36% 2012 26 26 16 61.54%
(1) “Number of Students Who Began Program” means the number of students who began the program who are scheduled to complete the program within the reporting calendar year.
(2) “Students Available for Graduation” means the number of students who began program minus the number of students unavailable for graduation, which means those students who have died, been incarcerated, or called to active military duty.
(3) “Graduates” means the number of students who completed the program within 100% of the published program length.
(4) “Completion Rate” means the number of graduates divided by the number of Students Available for Graduation.
(5) “150% Graduates” means the number of students who completed the program within 101-150% of the published program length.
(6) “150% Completion Rate” means the number of students who completed the program in the reported calendar year within 101-150% of the published program length divided by the number of Students Available for Graduation in the published program length period.
Initials: _______ Date:_______ I have read and understand the above completion rates.

SCHOOL PERFORMANCE FACT SHEET (continued) page 2
PLACEMENT RATES
Calendar Year
Number of Students Who Began Program (1)
Number of Graduates (2)
Graduates Available for Employment(3)
Graduates Employed in the Field (4)
Placement Rate % Employedin the Field (5)
Graduates Employed in the Field an Average of less than 32 Hours per Week
Graduates Employed in the Field at least 32 Hours per Week
2011 70 5 5 3 60.00% 1 2 2012 26 2 2 2 100.00% 1 1
(1) “Number of Students Who Began Program” means the number of students who began the program who are scheduled to complete the program within the reporting calendar year.
(2) “Number of Graduates” means the number of students who have completed the program within 100% of the published program length.
(3) “Graduates Available for Employment” means the number of graduates minus the number of graduates unavailable for employment. Graduates unavailable for employment' means graduates who, after graduation, die, become incarcerated, are called to active military duty, are international students that leave the United States or do not have a visa allowing employment in the United States, or are continuing their education in an accredited or bureau-approved postsecondary institution.
(4) “Graduates Employed in the Field” means a single position for which the institution represents, the program prepare graduates, within six months after the student completes the applicable educational program. For occupations requiring passage of a licensing exam prior to employment, institutions may count the graduate if employment begins “in a single position, for which the institution represents, its program prepares its graduates within six months of the announcement of the first licensure exam results.”
(5) “Placement Rate” is calculated by dividing the number of graduates gainfully employed in the field by the number of graduates available for employment.
Initials: _________ Date: ________ I have read and understand the above placement rates.
EXAMINATION PASSAGE RATES
Calendar Year
Number of Students Taking the Exam (1)
Number Who Passed First Exam Taken (2)
Number Who Failed First Exam Taken
Passage Rate (3)
2011 N/A N/A N/A N/A % 2012 N/A N/A N/A N/A %
(1) “Number of Students Taking Exam” means the number of students who completed the program within 150% of the published program length and who took the exam in the reported calendar year for the first time.
(2) “Number Who Passed First Exam Taken” means the number of students who took and passed the licensing exam in the reported calendar year on the first attempt.
(3) “Passage Rate” is calculated by dividing the number of graduates who pass the exam the first time that they take it by the number of graduates who took the licensing exam for the first time after completion of the program.
Initials:________ Date:______ I have read and understand the above license examination rates.

___________________________ __________________________
___________________________ _________________
SCHOOL PERFORMANCE FACT SHEET (continued) page 3
SALARY AND WAGE INFORMATION: PROGRAM TITLE AND PROGRAM LENGTH:
Calendar Year
Graduates Available for Employment (1)
Graduates Employedin the Field (2)
Annual Salary and Wages Reported by Graduated Employed in the Field (3). Amounts are reported in 5,000 brackets. 51K + = more than 50,000 reported, finally, NR is the number of students not responding to the survey.
5K
10K
15K
20K
25K
30K
35K
40K
45K
50K
51K +
NR
2011 5 3 0 0 1 0 1 1 0 0 0 0 0 2012 2 2 0 1 0 0 0 0 0 0 0 0 0
(1) “Graduates Available for Employment” means the number of graduates minus the number of graduates unavailable for employment. Graduates unavailable for employment mean graduates, who, after graduation, died, become incarcerated, are called to active military duty, are international students that leave the United States or do not have a visa allowing employment in the United States, or are continuing their education in an accredited or bureau-approved postsecondary institution.
(2) “Graduates Employed in the Field” means graduates who are gainfully employed within six months of graduation in a position for which the skills obtained through the education and training provided by the institution are required or provided a significant advantage to the graduate in obtaining the position.
(3) “Salary” is reported by the student. Not all graduates reported salary.
Initials: ________ Date: ______ I have read and understand the above salary and wage information.
Three-Year Cohort Default Rate as Published by USDE
Percentage of EnrolledStudents Receiving FederalStudent Loans
24.5% 72%
Initials: _____ Date: ______ I have read and understand the above USDE financial aid program participation information.
The data reflected on the above charts was gathered using at least one of the following methods: Graduate Surveys, Employer Surveys, Phone Calls, Education Development Department (EDD) and State Licensing Agencies. If you have any further questions or if you want a list of employment positions determined to be within the field for any specific program for which statistics are reported above, please speak with an Admissions Representative or see the School Catalog.
This fact sheet is filed with the Bureau for Private Postsecondary Education. Regardless of any information you may have relating to completion rates, placement rates, starting salaries, or license exam passage rates, this fact sheet contains the information as calculated pursuant to state law.
Any questions a student may have regarding this fact sheet that have not been satisfactorily answered by the institution may be directed to the Bureau for Private Postsecondary Education at: P.O. Box 980818, West Sacramento, CA 95798-0818, www.bppe.ca.gov., P: 888.370.7589 or 916.431.6959, F: 916.263.1897
I have read and understand this School Performance Fact Sheet. The School Performance Fact Sheet was reviewed and discussed with a school official prior to signing an enrollment agreement.
Student Name-Print Student Signature
School Official Date

SCHOOL PERFORMANCE FACT SHEET CET Center: OXNARD
Student Name: _____________________________________________________________ SID No. _______________________
BPPE Fact Sheet for School Name CENTER FOR EMPLOYMENT TRAINING
Disclose by date: September 1, 2013 Street address 761 SOUTH "C" STREET City, State Zip Code OXNARD, CA 93030
Phone number (805) 487-9821 Fax Phone (805) 487-7775
Website WWW.CETWEB.ORG
PROGRAM TITLE – PROGRAM LENGTH
Course Name Clock Hours Published Charges MACHANIST TECHNOLOGY/CNC 900 $9307.00
COMPLETION RATES
Calendar Year
Number of Students Who Began Program (1)
Students Available for Graduation (2)
Graduates (3) Completion Rate (4)
2011 48 48 21 43.75% 2012 44 44 16 36.36%
STUDENTS COMPLETING AFTER PUBLISHED PROGRAM LENGTH--150% COMPLETION RATES
Calendar Year
Number of Students Who Began Program (1)
Students Available for Graduation (2)
150% Graduates (5)
150% Completion Rate (6)
2011 48 48 16 33.33% 2012 44 44 21 47.73%
(1) “Number of Students Who Began Program” means the number of students who began the program who are scheduled to complete the program within the reporting calendar year.
(2) “Students Available for Graduation” means the number of students who began program minus the number of students unavailable for graduation, which means those students who have died, been incarcerated, or called to active military duty.
(3) “Graduates” means the number of students who completed the program within 100% of the published program length.
(4) “Completion Rate” means the number of graduates divided by the number of Students Available for Graduation.
(5) “150% Graduates” means the number of students who completed the program within 101-150% of the published program length.
(6) “150% Completion Rate” means the number of students who completed the program in the reported calendar year within 101-150% of the published program length divided by the number of Students Available for Graduation in the published program length period.
Initials: _______ Date:_______ I have read and understand the above completion rates.

SCHOOL PERFORMANCE FACT SHEET (continued) page 2
PLACEMENT RATES
Calendar Year
Number of Students Who Began Program (1)
Number of Graduates (2)
Graduates Available for Employment(3)
Graduates Employed in the Field (4)
Placement Rate % Employedin the Field (5)
Graduates Employed in the Field an Average of less than 32 Hours per Week
Graduates Employed in the Field at least 32 Hours per Week
2011 48 21 21 16 100.00% 16 2012 44 16 16 16 100.00% 1 15
(1) “Number of Students Who Began Program” means the number of students who began the program who are scheduled to complete the program within the reporting calendar year.
(2) “Number of Graduates” means the number of students who have completed the program within 100% of the published program length.
(3) “Graduates Available for Employment” means the number of graduates minus the number of graduates unavailable for employment. Graduates unavailable for employment' means graduates who, after graduation, die, become incarcerated, are called to active military duty, are international students that leave the United States or do not have a visa allowing employment in the United States, or are continuing their education in an accredited or bureau-approved postsecondary institution.
(4) “Graduates Employed in the Field” means a single position for which the institution represents, the program prepare graduates, within six months after the student completes the applicable educational program. For occupations requiring passage of a licensing exam prior to employment, institutions may count the graduate if employment begins “in a single position, for which the institution represents, its program prepares its graduates within six months of the announcement of the first licensure exam results.”
(5) “Placement Rate” is calculated by dividing the number of graduates gainfully employed in the field by the number of graduates available for employment.
Initials: _________ Date: ________ I have read and understand the above placement rates.
EXAMINATION PASSAGE RATES
Calendar Year
Number of Students Taking the Exam (1)
Number Who Passed First Exam Taken (2)
Number Who Failed First Exam Taken
Passage Rate (3)
2011 N/A N/A N/A N/A % 2012 N/A N/A N/A N/A %
(1) “Number of Students Taking Exam” means the number of students who completed the program within 150% of the published program length and who took the exam in the reported calendar year for the first time.
(2) “Number Who Passed First Exam Taken” means the number of students who took and passed the licensing exam in the reported calendar year on the first attempt.
(3) “Passage Rate” is calculated by dividing the number of graduates who pass the exam the first time that they take it by the number of graduates who took the licensing exam for the first time after completion of the program.
Initials:________ Date:______ I have read and understand the above license examination rates.

___________________________ __________________________
___________________________ _________________
SCHOOL PERFORMANCE FACT SHEET (continued) page 3
SALARY AND WAGE INFORMATION: PROGRAM TITLE AND PROGRAM LENGTH:
Calendar Year
Graduates Available for Employment (1)
Graduates Employedin the Field (2)
Annual Salary and Wages Reported by Graduated Employed in the Field (3). Amounts are reported in 5,000 brackets. 51K + = more than 50,000 reported, finally, NR is the number of students not responding to the survey.
5K
10K
15K
20K
25K
30K
35K
40K
45K
50K
51K +
NR
2011 21 16 0 0 1 1 4 7 3 0 0 0 0 2012 16 16 0 0 1 0 7 1 1 1 0 0 0
(1) “Graduates Available for Employment” means the number of graduates minus the number of graduates unavailable for employment. Graduates unavailable for employment mean graduates, who, after graduation, died, become incarcerated, are called to active military duty, are international students that leave the United States or do not have a visa allowing employment in the United States, or are continuing their education in an accredited or bureau-approved postsecondary institution.
(2) “Graduates Employed in the Field” means graduates who are gainfully employed within six months of graduation in a position for which the skills obtained through the education and training provided by the institution are required or provided a significant advantage to the graduate in obtaining the position.
(3) “Salary” is reported by the student. Not all graduates reported salary.
Initials: ________ Date: ______ I have read and understand the above salary and wage information.
Three-Year Cohort Default Rate as Published by USDE
Percentage of EnrolledStudents Receiving FederalStudent Loans
24.5% 72%
Initials: _____ Date: ______ I have read and understand the above USDE financial aid program participation information.
The data reflected on the above charts was gathered using at least one of the following methods: Graduate Surveys, Employer Surveys, Phone Calls, Education Development Department (EDD) and State Licensing Agencies. If you have any further questions or if you want a list of employment positions determined to be within the field for any specific program for which statistics are reported above, please speak with an Admissions Representative or see the School Catalog.
This fact sheet is filed with the Bureau for Private Postsecondary Education. Regardless of any information you may have relating to completion rates, placement rates, starting salaries, or license exam passage rates, this fact sheet contains the information as calculated pursuant to state law.
Any questions a student may have regarding this fact sheet that have not been satisfactorily answered by the institution may be directed to the Bureau for Private Postsecondary Education at: P.O. Box 980818, West Sacramento, CA 95798-0818, www.bppe.ca.gov., P: 888.370.7589 or 916.431.6959, F: 916.263.1897
I have read and understand this School Performance Fact Sheet. The School Performance Fact Sheet was reviewed and discussed with a school official prior to signing an enrollment agreement.
Student Name-Print Student Signature
School Official Date

SCHOOL PERFORMANCE FACT SHEET CET Center: OXNARD
Student Name: _____________________________________________________________ SID No. _______________________
BPPE Fact Sheet for School Name CENTER FOR EMPLOYMENT TRAINING
Disclose by date: September 1, 2013 Street address 761 SOUTH "C" STREET City, State Zip Code OXNARD, CA 93030
Phone number (805) 487-9821 Fax Phone (805) 487-7775
Website WWW.CETWEB.ORG
PROGRAM TITLE – PROGRAM LENGTH
Course Name Clock Hours Published Charges TRUCK DRIVER 630 $8779.00
COMPLETION RATES
Calendar Year
Number of Students Who Began Program (1)
Students Available for Graduation (2)
Graduates (3) Completion Rate (4)
2011 25 25 10 40.00% 2012 19 19 6 31.58%
STUDENTS COMPLETING AFTER PUBLISHED PROGRAM LENGTH--150% COMPLETION RATES
Calendar Year
Number of Students Who Began Program (1)
Students Available for Graduation (2)
150% Graduates (5)
150% Completion Rate (6)
2011 25 25 8 32.00% 2012 19 19 8 42.11%
(1) “Number of Students Who Began Program” means the number of students who began the program who are scheduled to complete the program within the reporting calendar year.
(2) “Students Available for Graduation” means the number of students who began program minus the number of students unavailable for graduation, which means those students who have died, been incarcerated, or called to active military duty.
(3) “Graduates” means the number of students who completed the program within 100% of the published program length.
(4) “Completion Rate” means the number of graduates divided by the number of Students Available for Graduation.
(5) “150% Graduates” means the number of students who completed the program within 101-150% of the published program length.
(6) “150% Completion Rate” means the number of students who completed the program in the reported calendar year within 101-150% of the published program length divided by the number of Students Available for Graduation in the published program length period.
Initials: _______ Date:_______ I have read and understand the above completion rates.

SCHOOL PERFORMANCE FACT SHEET (continued) page 2
PLACEMENT RATES
Calendar Year
Number of Students Who Began Program (1)
Number of Graduates (2)
Graduates Available for Employment(3)
Graduates Employed in the Field (4)
Placement Rate % Employedin the Field (5)
Graduates Employed in the Field an Average of less than 32 Hours per Week
Graduates Employed in the Field at least 32 Hours per Week
2011 25 10 10 8 80.00% 0 8 2012 19 6 6 5 83.33% 0 5
(1) “Number of Students Who Began Program” means the number of students who began the program who are scheduled to complete the program within the reporting calendar year.
(2) “Number of Graduates” means the number of students who have completed the program within 100% of the published program length.
(3) “Graduates Available for Employment” means the number of graduates minus the number of graduates unavailable for employment. Graduates unavailable for employment' means graduates who, after graduation, die, become incarcerated, are called to active military duty, are international students that leave the United States or do not have a visa allowing employment in the United States, or are continuing their education in an accredited or bureau-approved postsecondary institution.
(4) “Graduates Employed in the Field” means a single position for which the institution represents, the program prepare graduates, within six months after the student completes the applicable educational program. For occupations requiring passage of a licensing exam prior to employment, institutions may count the graduate if employment begins “in a single position, for which the institution represents, its program prepares its graduates within six months of the announcement of the first licensure exam results.”
(5) “Placement Rate” is calculated by dividing the number of graduates gainfully employed in the field by the number of graduates available for employment.
Initials: _________ Date: ________ I have read and understand the above placement rates.
EXAMINATION PASSAGE RATES
Calendar Year
Number of Students Taking the Exam (1)
Number Who Passed First Exam Taken (2)
Number Who Failed First Exam Taken
Passage Rate (3)
2011 N/A N/A N/A N/A % 2012 N/A N/A N/A N/A %
(1) “Number of Students Taking Exam” means the number of students who completed the program within 150% of the published program length and who took the exam in the reported calendar year for the first time.
(2) “Number Who Passed First Exam Taken” means the number of students who took and passed the licensing exam in the reported calendar year on the first attempt.
(3) “Passage Rate” is calculated by dividing the number of graduates who pass the exam the first time that they take it by the number of graduates who took the licensing exam for the first time after completion of the program.
Initials:________ Date:______ I have read and understand the above license examination rates.

___________________________ __________________________
___________________________ _________________
SCHOOL PERFORMANCE FACT SHEET (continued) page 3
SALARY AND WAGE INFORMATION: PROGRAM TITLE AND PROGRAM LENGTH:
Calendar Year
Graduates Available for Employment (1)
Graduates Employedin the Field (2)
Annual Salary and Wages Reported by Graduated Employed in the Field (3). Amounts are reported in 5,000 brackets. 51K + = more than 50,000 reported, finally, NR is the number of students not responding to the survey.
5K
10K
15K
20K
25K
30K
35K
40K
45K
50K
51K +
NR
2011 10 8 0 0 0 2 1 3 2 0 0 0 0 2012 6 5 0 0 0 1 0 1 1 0 0 0 1
(1) “Graduates Available for Employment” means the number of graduates minus the number of graduates unavailable for employment. Graduates unavailable for employment mean graduates, who, after graduation, died, become incarcerated, are called to active military duty, are international students that leave the United States or do not have a visa allowing employment in the United States, or are continuing their education in an accredited or bureau-approved postsecondary institution.
(2) “Graduates Employed in the Field” means graduates who are gainfully employed within six months of graduation in a position for which the skills obtained through the education and training provided by the institution are required or provided a significant advantage to the graduate in obtaining the position.
(3) “Salary” is reported by the student. Not all graduates reported salary.
Initials: ________ Date: ______ I have read and understand the above salary and wage information.
Three-Year Cohort Default Rate as Published by USDE
Percentage of EnrolledStudents Receiving FederalStudent Loans
24.5% 72%
Initials: _____ Date: ______ I have read and understand the above USDE financial aid program participation information.
The data reflected on the above charts was gathered using at least one of the following methods: Graduate Surveys, Employer Surveys, Phone Calls, Education Development Department (EDD) and State Licensing Agencies. If you have any further questions or if you want a list of employment positions determined to be within the field for any specific program for which statistics are reported above, please speak with an Admissions Representative or see the School Catalog.
This fact sheet is filed with the Bureau for Private Postsecondary Education. Regardless of any information you may have relating to completion rates, placement rates, starting salaries, or license exam passage rates, this fact sheet contains the information as calculated pursuant to state law.
Any questions a student may have regarding this fact sheet that have not been satisfactorily answered by the institution may be directed to the Bureau for Private Postsecondary Education at: P.O. Box 980818, West Sacramento, CA 95798-0818, www.bppe.ca.gov., P: 888.370.7589 or 916.431.6959, F: 916.263.1897
I have read and understand this School Performance Fact Sheet. The School Performance Fact Sheet was reviewed and discussed with a school official prior to signing an enrollment agreement.
Student Name-Print Student Signature
School Official Date
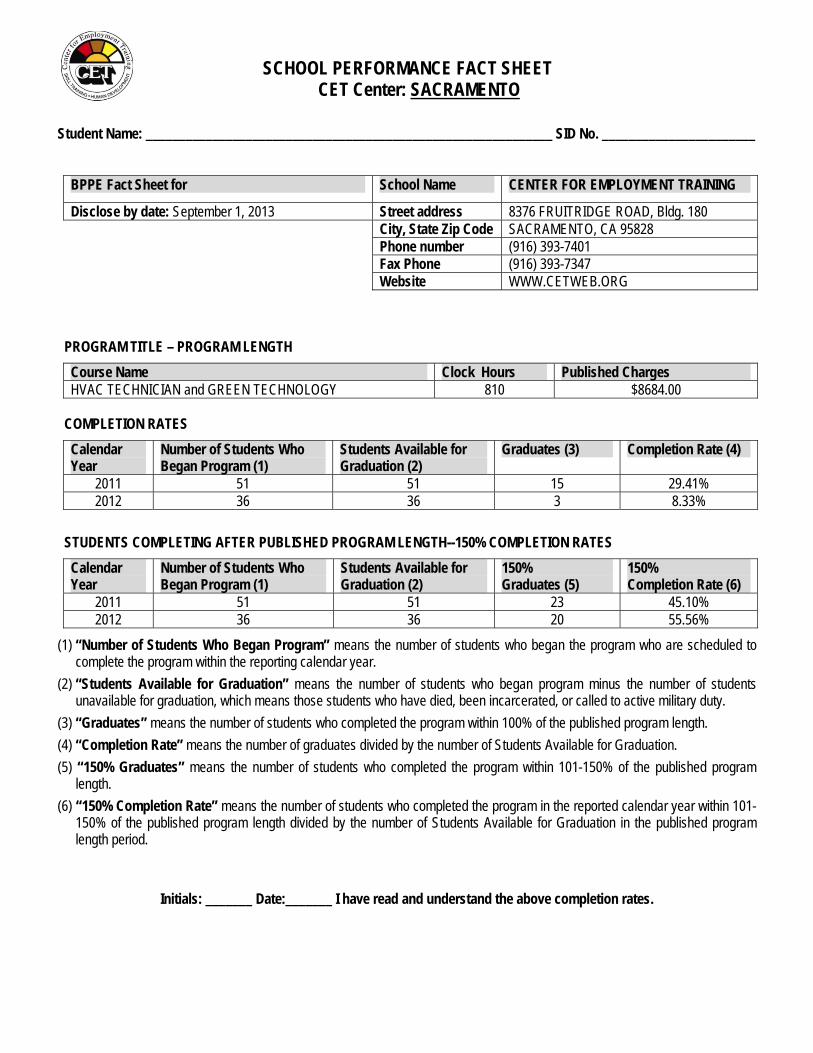
SCHOOL PERFORMANCE FACT SHEET CET Center: SACRAMENTO
Student Name: _____________________________________________________________ SID No. _______________________
BPPE Fact Sheet for School Name CENTER FOR EMPLOYMENT TRAINING
Disclose by date: September 1, 2013 Street address 8376 FRUITRIDGE ROAD, Bldg. 180 City, State Zip Code SACRAMENTO, CA 95828
Phone number (916) 393-7401 Fax Phone (916) 393-7347
Website WWW.CETWEB.ORG
PROGRAM TITLE – PROGRAM LENGTH
Course Name Clock Hours Published Charges HVAC TECHNICIAN and GREEN TECHNOLOGY 810 $8684.00
COMPLETION RATES
Calendar Year
Number of Students Who Began Program (1)
Students Available for Graduation (2)
Graduates (3) Completion Rate (4)
2011 51 51 15 29.41% 2012 36 36 3 8.33%
STUDENTS COMPLETING AFTER PUBLISHED PROGRAM LENGTH--150% COMPLETION RATES
Calendar Year
Number of Students Who Began Program (1)
Students Available for Graduation (2)
150% Graduates (5)
150% Completion Rate (6)
2011 51 51 23 45.10% 2012 36 36 20 55.56%
(1) “Number of Students Who Began Program” means the number of students who began the program who are scheduled to complete the program within the reporting calendar year.
(2) “Students Available for Graduation” means the number of students who began program minus the number of students unavailable for graduation, which means those students who have died, been incarcerated, or called to active military duty.
(3) “Graduates” means the number of students who completed the program within 100% of the published program length.
(4) “Completion Rate” means the number of graduates divided by the number of Students Available for Graduation.
(5) “150% Graduates” means the number of students who completed the program within 101-150% of the published program length.
(6) “150% Completion Rate” means the number of students who completed the program in the reported calendar year within 101-150% of the published program length divided by the number of Students Available for Graduation in the published program length period.
Initials: _______ Date:_______ I have read and understand the above completion rates.

SCHOOL PERFORMANCE FACT SHEET (continued) page 2
PLACEMENT RATES
Calendar Year
Number of Students Who Began Program (1)
Number of Graduates (2)
Graduates Available for Employment(3)
Graduates Employed in the Field (4)
Placement Rate % Employedin the Field (5)
Graduates Employed in the Field an Average of less than 32 Hours per Week
Graduates Employed in the Field at least 32 Hours per Week
2011 51 15 15 3 20.00% 1 2 2012 36 3 3 1 33.33% 1 0
(1) “Number of Students Who Began Program” means the number of students who began the program who are scheduled to complete the program within the reporting calendar year.
(2) “Number of Graduates” means the number of students who have completed the program within 100% of the published program length.
(3) “Graduates Available for Employment” means the number of graduates minus the number of graduates unavailable for employment. Graduates unavailable for employment' means graduates who, after graduation, die, become incarcerated, are called to active military duty, are international students that leave the United States or do not have a visa allowing employment in the United States, or are continuing their education in an accredited or bureau-approved postsecondary institution.
(4) “Graduates Employed in the Field” means a single position for which the institution represents, the program prepare graduates, within six months after the student completes the applicable educational program. For occupations requiring passage of a licensing exam prior to employment, institutions may count the graduate if employment begins “in a single position, for which the institution represents, its program prepares its graduates within six months of the announcement of the first licensure exam results.”
(5) “Placement Rate” is calculated by dividing the number of graduates gainfully employed in the field by the number of graduates available for employment.
Initials: _________ Date: ________ I have read and understand the above placement rates.
EXAMINATION PASSAGE RATES
Calendar Year
Number of Students Taking the Exam (1)
Number Who Passed First Exam Taken (2)
Number Who Failed First Exam Taken
Passage Rate (3)
2011 N/A N/A N/A N/A % 2012 N/A N/A N/A N/A %
(1) “Number of Students Taking Exam” means the number of students who completed the program within 150% of the published program length and who took the exam in the reported calendar year for the first time.
(2) “Number Who Passed First Exam Taken” means the number of students who took and passed the licensing exam in the reported calendar year on the first attempt.
(3) “Passage Rate” is calculated by dividing the number of graduates who pass the exam the first time that they take it by the number of graduates who took the licensing exam for the first time after completion of the program.
Initials:________ Date:______ I have read and understand the above license examination rates.

___________________________ __________________________
___________________________ _________________
SCHOOL PERFORMANCE FACT SHEET (continued) page 3
SALARY AND WAGE INFORMATION: PROGRAM TITLE AND PROGRAM LENGTH:
Calendar Year
Graduates Available for Employment (1)
Graduates Employedin the Field (2)
Annual Salary and Wages Reported by Graduated Employed in the Field (3). Amounts are reported in 5,000 brackets. 51K + = more than 50,000 reported, finally, NR is the number of students not responding to the survey.
5K
10K
15K
20K
25K
30K
35K
40K
45K
50K
51K +
NR
2011 15 3 0 0 0 1 0 0 0 1 1 0 0 2012 3 1 0 0 0 1 0 0 0 0 0 0 0
(1) “Graduates Available for Employment” means the number of graduates minus the number of graduates unavailable for employment. Graduates unavailable for employment mean graduates, who, after graduation, died, become incarcerated, are called to active military duty, are international students that leave the United States or do not have a visa allowing employment in the United States, or are continuing their education in an accredited or bureau-approved postsecondary institution.
(2) “Graduates Employed in the Field” means graduates who are gainfully employed within six months of graduation in a position for which the skills obtained through the education and training provided by the institution are required or provided a significant advantage to the graduate in obtaining the position.
(3) “Salary” is reported by the student. Not all graduates reported salary.
Initials: ________ Date: ______ I have read and understand the above salary and wage information.
Three-Year Cohort Default Rate as Published by USDE
Percentage of EnrolledStudents Receiving FederalStudent Loans
24.5% 72%
Initials: _____ Date: ______ I have read and understand the above USDE financial aid program participation information.
The data reflected on the above charts was gathered using at least one of the following methods: Graduate Surveys, Employer Surveys, Phone Calls, Education Development Department (EDD) and State Licensing Agencies. If you have any further questions or if you want a list of employment positions determined to be within the field for any specific program for which statistics are reported above, please speak with an Admissions Representative or see the School Catalog.
This fact sheet is filed with the Bureau for Private Postsecondary Education. Regardless of any information you may have relating to completion rates, placement rates, starting salaries, or license exam passage rates, this fact sheet contains the information as calculated pursuant to state law.
Any questions a student may have regarding this fact sheet that have not been satisfactorily answered by the institution may be directed to the Bureau for Private Postsecondary Education at: P.O. Box 980818, West Sacramento, CA 95798-0818, www.bppe.ca.gov., P: 888.370.7589 or 916.431.6959, F: 916.263.1897
I have read and understand this School Performance Fact Sheet. The School Performance Fact Sheet was reviewed and discussed with a school official prior to signing an enrollment agreement.
Student Name-Print Student Signature
School Official Date

SCHOOL PERFORMANCE FACT SHEET CET Center: SACRAMENTO
Student Name: _____________________________________________________________ SID No. _______________________
BPPE Fact Sheet for School Name CENTER FOR EMPLOYMENT TRAINING
Disclose by date: September 1, 2013 Street address 8376 FRUITRIDGE ROAD, Bldg. 180 City, State Zip Code SACRAMENTO, CA 95828
Phone number (916) 393-7401 Fax Phone (916) 393-7347
Website WWW.CETWEB.ORG
PROGRAM TITLE – PROGRAM LENGTH
Course Name Clock Hours Published Charges MEDICAL ASSISTANT 900 $9307.00
COMPLETION RATES
Calendar Year
Number of Students Who Began Program (1)
Students Available for Graduation (2)
Graduates (3) Completion Rate (4)
2011 71 71 8 11.27% 2012 39 39 20 51.28%
STUDENTS COMPLETING AFTER PUBLISHED PROGRAM LENGTH--150% COMPLETION RATES
Calendar Year
Number of Students Who Began Program (1)
Students Available for Graduation (2)
150% Graduates (5)
150% Completion Rate (6)
2011 71 71 39 54.93% 2012 39 39 10 25.64%
(1) “Number of Students Who Began Program” means the number of students who began the program who are scheduled to complete the program within the reporting calendar year.
(2) “Students Available for Graduation” means the number of students who began program minus the number of students unavailable for graduation, which means those students who have died, been incarcerated, or called to active military duty.
(3) “Graduates” means the number of students who completed the program within 100% of the published program length.
(4) “Completion Rate” means the number of graduates divided by the number of Students Available for Graduation.
(5) “150% Graduates” means the number of students who completed the program within 101-150% of the published program length.
(6) “150% Completion Rate” means the number of students who completed the program in the reported calendar year within 101-150% of the published program length divided by the number of Students Available for Graduation in the published program length period.
Initials: _______ Date:_______ I have read and understand the above completion rates.

SCHOOL PERFORMANCE FACT SHEET (continued) page 2
PLACEMENT RATES
Calendar Year
Number of Students Who Began Program (1)
Number of Graduates (2)
Graduates Available for Employment(3)
Graduates Employed in the Field (4)
Placement Rate % Employedin the Field (5)
Graduates Employed in the Field an Average of less than 32 Hours per Week
Graduates Employed in the Field at least 32 Hours per Week
2011 71 8 8 3 37.50% 0 3 2012 39 20 20 6 31.58% 1 5
(1) “Number of Students Who Began Program” means the number of students who began the program who are scheduled to complete the program within the reporting calendar year.
(2) “Number of Graduates” means the number of students who have completed the program within 100% of the published program length.
(3) “Graduates Available for Employment” means the number of graduates minus the number of graduates unavailable for employment. Graduates unavailable for employment' means graduates who, after graduation, die, become incarcerated, are called to active military duty, are international students that leave the United States or do not have a visa allowing employment in the United States, or are continuing their education in an accredited or bureau-approved postsecondary institution.
(4) “Graduates Employed in the Field” means a single position for which the institution represents, the program prepare graduates, within six months after the student completes the applicable educational program. For occupations requiring passage of a licensing exam prior to employment, institutions may count the graduate if employment begins “in a single position, for which the institution represents, its program prepares its graduates within six months of the announcement of the first licensure exam results.”
(5) “Placement Rate” is calculated by dividing the number of graduates gainfully employed in the field by the number of graduates available for employment.
Initials: _________ Date: ________ I have read and understand the above placement rates.
EXAMINATION PASSAGE RATES
Calendar Year
Number of Students Taking the Exam (1)
Number Who Passed First Exam Taken (2)
Number Who Failed First Exam Taken
Passage Rate (3)
2011 N/A N/A N/A N/A % 2012 N/A N/A N/A N/A %
(1) “Number of Students Taking Exam” means the number of students who completed the program within 150% of the published program length and who took the exam in the reported calendar year for the first time.
(2) “Number Who Passed First Exam Taken” means the number of students who took and passed the licensing exam in the reported calendar year on the first attempt.
(3) “Passage Rate” is calculated by dividing the number of graduates who pass the exam the first time that they take it by the number of graduates who took the licensing exam for the first time after completion of the program.
Initials:________ Date:______ I have read and understand the above license examination rates.

___________________________ __________________________
___________________________ _________________
SCHOOL PERFORMANCE FACT SHEET (continued) page 3
SALARY AND WAGE INFORMATION: PROGRAM TITLE AND PROGRAM LENGTH:
Calendar Year
Graduates Available for Employment (1)
Graduates Employedin the Field (2)
Annual Salary and Wages Reported by Graduated Employed in the Field (3). Amounts are reported in 5,000 brackets. 51K + = more than 50,000 reported, finally, NR is the number of students not responding to the survey.
5K
10K
15K
20K
25K
30K
35K
40K
45K
50K
51K +
NR
2011 8 3 0 0 1 0 2 0 0 0 0 0 0 2012 20 6 0 0 2 1 3 0 0 0 0 0 0
(1) “Graduates Available for Employment” means the number of graduates minus the number of graduates unavailable for employment. Graduates unavailable for employment mean graduates, who, after graduation, died, become incarcerated, are called to active military duty, are international students that leave the United States or do not have a visa allowing employment in the United States, or are continuing their education in an accredited or bureau-approved postsecondary institution.
(2) “Graduates Employed in the Field” means graduates who are gainfully employed within six months of graduation in a position for which the skills obtained through the education and training provided by the institution are required or provided a significant advantage to the graduate in obtaining the position.
(3) “Salary” is reported by the student. Not all graduates reported salary.
Initials: ________ Date: ______ I have read and understand the above salary and wage information.
Three-Year Cohort Default Rate as Published by USDE
Percentage of EnrolledStudents Receiving FederalStudent Loans
24.5% 72%
Initials: _____ Date: ______ I have read and understand the above USDE financial aid program participation information.
The data reflected on the above charts was gathered using at least one of the following methods: Graduate Surveys, Employer Surveys, Phone Calls, Education Development Department (EDD) and State Licensing Agencies. If you have any further questions or if you want a list of employment positions determined to be within the field for any specific program for which statistics are reported above, please speak with an Admissions Representative or see the School Catalog.
This fact sheet is filed with the Bureau for Private Postsecondary Education. Regardless of any information you may have relating to completion rates, placement rates, starting salaries, or license exam passage rates, this fact sheet contains the information as calculated pursuant to state law.
Any questions a student may have regarding this fact sheet that have not been satisfactorily answered by the institution may be directed to the Bureau for Private Postsecondary Education at: P.O. Box 980818, West Sacramento, CA 95798-0818, www.bppe.ca.gov., P: 888.370.7589 or 916.431.6959, F: 916.263.1897
I have read and understand this School Performance Fact Sheet. The School Performance Fact Sheet was reviewed and discussed with a school official prior to signing an enrollment agreement.
Student Name-Print Student Signature
School Official Date

SCHOOL PERFORMANCE FACT SHEET CET Center: SACRAMENTO
Student Name: _____________________________________________________________ SID No. _______________________
BPPE Fact Sheet for School Name CENTER FOR EMPLOYMENT TRAINING
Disclose by date: September 1, 2013 Street address 8376 FRUITRIDGE ROAD, Bldg. 180 City, State Zip Code SACRAMENTO, CA 95828
Phone number (916) 393-7401 Fax Phone (916) 393-7347
Website WWW.CETWEB.ORG
PROGRAM TITLE – PROGRAM LENGTH
Course Name Clock Hours Published Charges MEDICAL ADMINISTRATIVE ASSISTANT 720 $8060.00
COMPLETION RATES
Calendar Year
Number of Students Who Began Program (1)
Students Available for Graduation (2)
Graduates (3) Completion Rate (4)
2011 56 56 6 10.71% 2012 39 39 17 43.59%
STUDENTS COMPLETING AFTER PUBLISHED PROGRAM LENGTH--150% COMPLETION RATES
Calendar Year
Number of Students Who Began Program (1)
Students Available for Graduation (2)
150% Graduates (5)
150% Completion Rate (6)
2011 56 56 34 60.71% 2012 39 39 13 33.33%
(1) “Number of Students Who Began Program” means the number of students who began the program who are scheduled to complete the program within the reporting calendar year.
(2) “Students Available for Graduation” means the number of students who began program minus the number of students unavailable for graduation, which means those students who have died, been incarcerated, or called to active military duty.
(3) “Graduates” means the number of students who completed the program within 100% of the published program length.
(4) “Completion Rate” means the number of graduates divided by the number of Students Available for Graduation.
(5) “150% Graduates” means the number of students who completed the program within 101-150% of the published program length.
(6) “150% Completion Rate” means the number of students who completed the program in the reported calendar year within 101-150% of the published program length divided by the number of Students Available for Graduation in the published program length period.
Initials: _______ Date:_______ I have read and understand the above completion rates.

SCHOOL PERFORMANCE FACT SHEET (continued) page 2
PLACEMENT RATES
Calendar Year
Number of Students Who Began Program (1)
Number of Graduates (2)
Graduates Available for Employment(3)
Graduates Employed in the Field (4)
Placement Rate % Employedin the Field (5)
Graduates Employed in the Field an Average of less than 32 Hours per Week
Graduates Employed in the Field at least 32 Hours per Week
2011 56 6 6 0 0.00% 0 0 2012 39 17 17 9 52.94% 4 5
(1) “Number of Students Who Began Program” means the number of students who began the program who are scheduled to complete the program within the reporting calendar year.
(2) “Number of Graduates” means the number of students who have completed the program within 100% of the published program length.
(3) “Graduates Available for Employment” means the number of graduates minus the number of graduates unavailable for employment. Graduates unavailable for employment' means graduates who, after graduation, die, become incarcerated, are called to active military duty, are international students that leave the United States or do not have a visa allowing employment in the United States, or are continuing their education in an accredited or bureau-approved postsecondary institution.
(4) “Graduates Employed in the Field” means a single position for which the institution represents, the program prepare graduates, within six months after the student completes the applicable educational program. For occupations requiring passage of a licensing exam prior to employment, institutions may count the graduate if employment begins “in a single position, for which the institution represents, its program prepares its graduates within six months of the announcement of the first licensure exam results.”
(5) “Placement Rate” is calculated by dividing the number of graduates gainfully employed in the field by the number of graduates available for employment.
Initials: _________ Date: ________ I have read and understand the above placement rates.
EXAMINATION PASSAGE RATES
Calendar Year
Number of Students Taking the Exam (1)
Number Who Passed First Exam Taken (2)
Number Who Failed First Exam Taken
Passage Rate (3)
2011 N/A N/A N/A N/A % 2012 N/A N/A N/A N/A %
(1) “Number of Students Taking Exam” means the number of students who completed the program within 150% of the published program length and who took the exam in the reported calendar year for the first time.
(2) “Number Who Passed First Exam Taken” means the number of students who took and passed the licensing exam in the reported calendar year on the first attempt.
(3) “Passage Rate” is calculated by dividing the number of graduates who pass the exam the first time that they take it by the number of graduates who took the licensing exam for the first time after completion of the program.
Initials:________ Date:______ I have read and understand the above license examination rates.

___________________________ __________________________
___________________________ _________________
SCHOOL PERFORMANCE FACT SHEET (continued) page 3
SALARY AND WAGE INFORMATION: PROGRAM TITLE AND PROGRAM LENGTH:
Calendar Year
Graduates Available for Employment (1)
Graduates Employedin the Field (2)
Annual Salary and Wages Reported by Graduated Employed in the Field (3). Amounts are reported in 5,000 brackets. 51K + = more than 50,000 reported, finally, NR is the number of students not responding to the survey.
5K
10K
15K
20K
25K
30K
35K
40K
45K
50K
51K +
NR
2011 6 0 0 0 0 0 0 0 0 0 0 0 0 2012 17 9 0 1 0 4 3 0 0 0 1 0 0
(1) “Graduates Available for Employment” means the number of graduates minus the number of graduates unavailable for employment. Graduates unavailable for employment mean graduates, who, after graduation, died, become incarcerated, are called to active military duty, are international students that leave the United States or do not have a visa allowing employment in the United States, or are continuing their education in an accredited or bureau-approved postsecondary institution.
(2) “Graduates Employed in the Field” means graduates who are gainfully employed within six months of graduation in a position for which the skills obtained through the education and training provided by the institution are required or provided a significant advantage to the graduate in obtaining the position.
(3) “Salary” is reported by the student. Not all graduates reported salary.
Initials: ________ Date: ______ I have read and understand the above salary and wage information.
Three-Year Cohort Default Rate as Published by USDE
Percentage of EnrolledStudents Receiving FederalStudent Loans
24.5% 72%
Initials: _____ Date: ______ I have read and understand the above USDE financial aid program participation information.
The data reflected on the above charts was gathered using at least one of the following methods: Graduate Surveys, Employer Surveys, Phone Calls, Education Development Department (EDD) and State Licensing Agencies. If you have any further questions or if you want a list of employment positions determined to be within the field for any specific program for which statistics are reported above, please speak with an Admissions Representative or see the School Catalog.
This fact sheet is filed with the Bureau for Private Postsecondary Education. Regardless of any information you may have relating to completion rates, placement rates, starting salaries, or license exam passage rates, this fact sheet contains the information as calculated pursuant to state law.
Any questions a student may have regarding this fact sheet that have not been satisfactorily answered by the institution may be directed to the Bureau for Private Postsecondary Education at: P.O. Box 980818, West Sacramento, CA 95798-0818, www.bppe.ca.gov., P: 888.370.7589 or 916.431.6959, F: 916.263.1897
I have read and understand this School Performance Fact Sheet. The School Performance Fact Sheet was reviewed and discussed with a school official prior to signing an enrollment agreement.
Student Name-Print Student Signature
School Official Date

SCHOOL PERFORMANCE FACT SHEET CET Center: SALINAS
Student Name: _____________________________________________________________ SID No. _______________________
BPPE Fact Sheet for School Name CENTER FOR EMPLOYMENT TRAINING
Disclose by date: September 1, 2013 Street address 421 MONTEREY STREET City, State Zip Code SALINAS, CA 93901
Phone number (831) 424-0665 Fax Phone (831) 424-4743
Website WWW.CETWEB.ORG
PROGRAM TITLE – PROGRAM LENGTH
Course Name Clock Hours Published Charges BUSINESS OFFICE TECHNOLOGY 900 $9307.00
COMPLETION RATES
Calendar Year
Number of Students Who Began Program (1)
Students Available for Graduation (2)
Graduates (3) Completion Rate (4)
2011 66 65 19 29.23% 2012 80 80 48 60.00%
STUDENTS COMPLETING AFTER PUBLISHED PROGRAM LENGTH--150% COMPLETION RATES
Calendar Year
Number of Students Who Began Program (1)
Students Available for Graduation (2)
150% Graduates (5)
150% Completion Rate (6)
2011 66 65 33 50.77% 2012 80 80 25 31.25%
(1) “Number of Students Who Began Program” means the number of students who began the program who are scheduled to complete the program within the reporting calendar year.
(2) “Students Available for Graduation” means the number of students who began program minus the number of students unavailable for graduation, which means those students who have died, been incarcerated, or called to active military duty.
(3) “Graduates” means the number of students who completed the program within 100% of the published program length.
(4) “Completion Rate” means the number of graduates divided by the number of Students Available for Graduation.
(5) “150% Graduates” means the number of students who completed the program within 101-150% of the published program length.
(6) “150% Completion Rate” means the number of students who completed the program in the reported calendar year within 101-150% of the published program length divided by the number of Students Available for Graduation in the published program length period.
Initials: _______ Date:_______ I have read and understand the above completion rates.
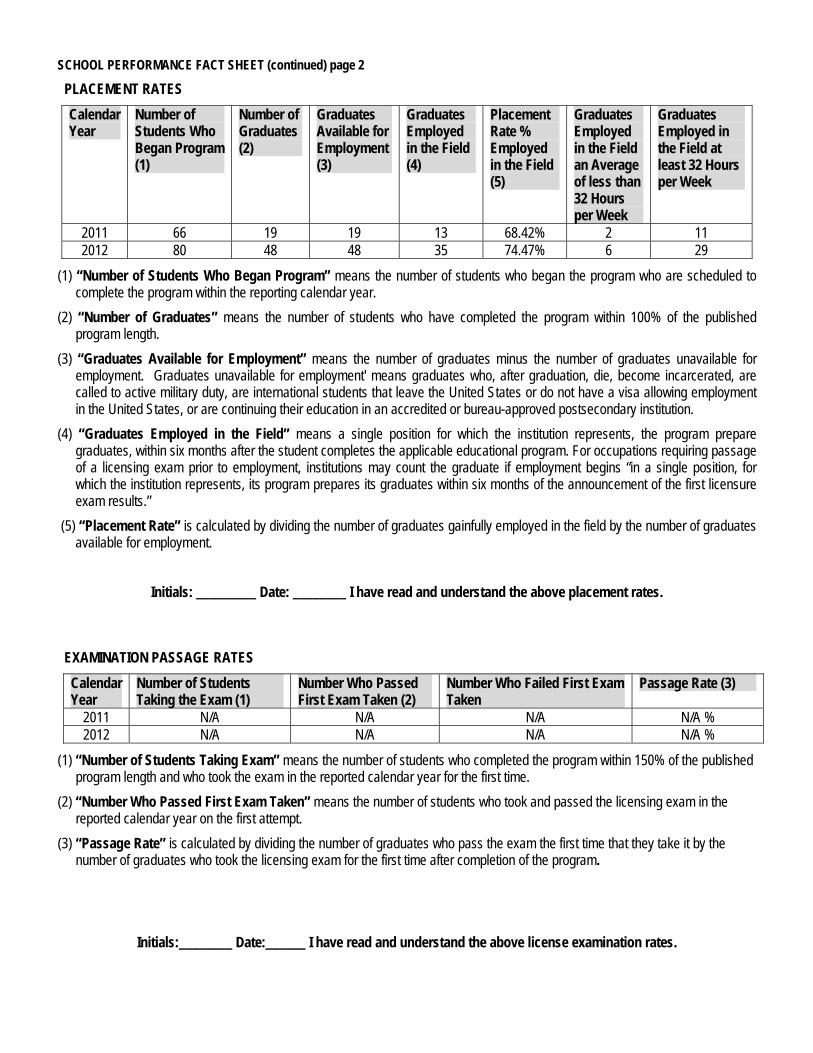
SCHOOL PERFORMANCE FACT SHEET (continued) page 2
PLACEMENT RATES
Calendar Year
Number of Students Who Began Program (1)
Number of Graduates (2)
Graduates Available for Employment(3)
Graduates Employed in the Field (4)
Placement Rate % Employedin the Field (5)
Graduates Employed in the Field an Average of less than 32 Hours per Week
Graduates Employed in the Field at least 32 Hours per Week
2011 66 19 19 13 68.42% 2 11 2012 80 48 48 35 74.47% 6 29
(1) “Number of Students Who Began Program” means the number of students who began the program who are scheduled to complete the program within the reporting calendar year.
(2) “Number of Graduates” means the number of students who have completed the program within 100% of the published program length.
(3) “Graduates Available for Employment” means the number of graduates minus the number of graduates unavailable for employment. Graduates unavailable for employment' means graduates who, after graduation, die, become incarcerated, are called to active military duty, are international students that leave the United States or do not have a visa allowing employment in the United States, or are continuing their education in an accredited or bureau-approved postsecondary institution.
(4) “Graduates Employed in the Field” means a single position for which the institution represents, the program prepare graduates, within six months after the student completes the applicable educational program. For occupations requiring passage of a licensing exam prior to employment, institutions may count the graduate if employment begins “in a single position, for which the institution represents, its program prepares its graduates within six months of the announcement of the first licensure exam results.”
(5) “Placement Rate” is calculated by dividing the number of graduates gainfully employed in the field by the number of graduates available for employment.
Initials: _________ Date: ________ I have read and understand the above placement rates.
EXAMINATION PASSAGE RATES
Calendar Year
Number of Students Taking the Exam (1)
Number Who Passed First Exam Taken (2)
Number Who Failed First Exam Taken
Passage Rate (3)
2011 N/A N/A N/A N/A % 2012 N/A N/A N/A N/A %
(1) “Number of Students Taking Exam” means the number of students who completed the program within 150% of the published program length and who took the exam in the reported calendar year for the first time.
(2) “Number Who Passed First Exam Taken” means the number of students who took and passed the licensing exam in the reported calendar year on the first attempt.
(3) “Passage Rate” is calculated by dividing the number of graduates who pass the exam the first time that they take it by the number of graduates who took the licensing exam for the first time after completion of the program.
Initials:________ Date:______ I have read and understand the above license examination rates.

___________________________ __________________________
___________________________ _________________
SCHOOL PERFORMANCE FACT SHEET (continued) page 3
SALARY AND WAGE INFORMATION: PROGRAM TITLE AND PROGRAM LENGTH:
Calendar Year
Graduates Available for Employment (1)
Graduates Employedin the Field (2)
Annual Salary and Wages Reported by Graduated Employed in the Field (3). Amounts are reported in 5,000 brackets. 51K + = more than 50,000 reported, finally, NR is the number of students not responding to the survey.
5K
10K
15K
20K
25K
30K
35K
40K
45K
50K
51K +
NR
2011 19 13 0 0 2 5 4 1 0 0 1 0 0 2012 48 35 0 4 6 14 7 2 2 0 0 0 0
(1) “Graduates Available for Employment” means the number of graduates minus the number of graduates unavailable for employment. Graduates unavailable for employment mean graduates, who, after graduation, died, become incarcerated, are called to active military duty, are international students that leave the United States or do not have a visa allowing employment in the United States, or are continuing their education in an accredited or bureau-approved postsecondary institution.
(2) “Graduates Employed in the Field” means graduates who are gainfully employed within six months of graduation in a position for which the skills obtained through the education and training provided by the institution are required or provided a significant advantage to the graduate in obtaining the position.
(3) “Salary” is reported by the student. Not all graduates reported salary.
Initials: ________ Date: ______ I have read and understand the above salary and wage information.
Three-Year Cohort Default Rate as Published by USDE
Percentage of EnrolledStudents Receiving FederalStudent Loans
24.5% 72%
Initials: _____ Date: ______ I have read and understand the above USDE financial aid program participation information.
The data reflected on the above charts was gathered using at least one of the following methods: Graduate Surveys, Employer Surveys, Phone Calls, Education Development Department (EDD) and State Licensing Agencies. If you have any further questions or if you want a list of employment positions determined to be within the field for any specific program for which statistics are reported above, please speak with an Admissions Representative or see the School Catalog.
This fact sheet is filed with the Bureau for Private Postsecondary Education. Regardless of any information you may have relating to completion rates, placement rates, starting salaries, or license exam passage rates, this fact sheet contains the information as calculated pursuant to state law.
Any questions a student may have regarding this fact sheet that have not been satisfactorily answered by the institution may be directed to the Bureau for Private Postsecondary Education at: P.O. Box 980818, West Sacramento, CA 95798-0818, www.bppe.ca.gov., P: 888.370.7589 or 916.431.6959, F: 916.263.1897
I have read and understand this School Performance Fact Sheet. The School Performance Fact Sheet was reviewed and discussed with a school official prior to signing an enrollment agreement.
Student Name-Print Student Signature
School Official Date

SCHOOL PERFORMANCE FACT SHEET CET Center: SALINAS
Student Name: _____________________________________________________________ SID No. _______________________
BPPE Fact Sheet for School Name CENTER FOR EMPLOYMENT TRAINING
Disclose by date: September 1, 2013 Street address 421 MONTEREY STREET City, State Zip Code SALINAS, CA 93901
Phone number (831) 424-0665 Fax Phone (831) 424-4743
Website WWW.CETWEB.ORG
PROGRAM TITLE – PROGRAM LENGTH
Course Name Clock Hours Published Charges CUSTODIAL SERVICES 720 $8060.00
COMPLETION RATES
Calendar Year
Number of Students Who Began Program (1)
Students Available for Graduation (2)
Graduates (3) Completion Rate (4)
2011 44 44 4 9.09% 2012 23 23 0 0.00%
STUDENTS COMPLETING AFTER PUBLISHED PROGRAM LENGTH--150% COMPLETION RATES
Calendar Year
Number of Students Who Began Program (1)
Students Available for Graduation (2)
150% Graduates (5)
150% Completion Rate (6)
2011 44 44 30 68.18% 2012 23 23 17 73.91%
(1) “Number of Students Who Began Program” means the number of students who began the program who are scheduled to complete the program within the reporting calendar year.
(2) “Students Available for Graduation” means the number of students who began program minus the number of students unavailable for graduation, which means those students who have died, been incarcerated, or called to active military duty.
(3) “Graduates” means the number of students who completed the program within 100% of the published program length.
(4) “Completion Rate” means the number of graduates divided by the number of Students Available for Graduation.
(5) “150% Graduates” means the number of students who completed the program within 101-150% of the published program length.
(6) “150% Completion Rate” means the number of students who completed the program in the reported calendar year within 101-150% of the published program length divided by the number of Students Available for Graduation in the published program length period.
Initials: _______ Date:_______ I have read and understand the above completion rates.

SCHOOL PERFORMANCE FACT SHEET (continued) page 2
PLACEMENT RATES
Calendar Year
Number of Students Who Began Program (1)
Number of Graduates (2)
Graduates Available for Employment(3)
Graduates Employed in the Field (4)
Placement Rate % Employedin the Field (5)
Graduates Employed in the Field an Average of less than 32 Hours per Week
Graduates Employed in the Field at least 32 Hours per Week
2011 44 4 4 1 25.00% 0 1 2012 23 0 0 0 0.00% 0 0
(1) “Number of Students Who Began Program” means the number of students who began the program who are scheduled to complete the program within the reporting calendar year.
(2) “Number of Graduates” means the number of students who have completed the program within 100% of the published program length.
(3) “Graduates Available for Employment” means the number of graduates minus the number of graduates unavailable for employment. Graduates unavailable for employment' means graduates who, after graduation, die, become incarcerated, are called to active military duty, are international students that leave the United States or do not have a visa allowing employment in the United States, or are continuing their education in an accredited or bureau-approved postsecondary institution.
(4) “Graduates Employed in the Field” means a single position for which the institution represents, the program prepare graduates, within six months after the student completes the applicable educational program. For occupations requiring passage of a licensing exam prior to employment, institutions may count the graduate if employment begins “in a single position, for which the institution represents, its program prepares its graduates within six months of the announcement of the first licensure exam results.”
(5) “Placement Rate” is calculated by dividing the number of graduates gainfully employed in the field by the number of graduates available for employment.
Initials: _________ Date: ________ I have read and understand the above placement rates.
EXAMINATION PASSAGE RATES
Calendar Year
Number of Students Taking the Exam (1)
Number Who Passed First Exam Taken (2)
Number Who Failed First Exam Taken
Passage Rate (3)
2011 N/A N/A N/A N/A % 2012 N/A N/A N/A N/A %
(1) “Number of Students Taking Exam” means the number of students who completed the program within 150% of the published program length and who took the exam in the reported calendar year for the first time.
(2) “Number Who Passed First Exam Taken” means the number of students who took and passed the licensing exam in the reported calendar year on the first attempt.
(3) “Passage Rate” is calculated by dividing the number of graduates who pass the exam the first time that they take it by the number of graduates who took the licensing exam for the first time after completion of the program.
Initials:________ Date:______ I have read and understand the above license examination rates.

___________________________ __________________________
___________________________ _________________
SCHOOL PERFORMANCE FACT SHEET (continued) page 3
SALARY AND WAGE INFORMATION: PROGRAM TITLE AND PROGRAM LENGTH:
Calendar Year
Graduates Available for Employment (1)
Graduates Employedin the Field (2)
Annual Salary and Wages Reported by Graduated Employed in the Field (3). Amounts are reported in 5,000 brackets. 51K + = more than 50,000 reported, finally, NR is the number of students not responding to the survey.
5K
10K
15K
20K
25K
30K
35K
40K
45K
50K
51K +
NR
2011 4 1 0 0 0 0 1 0 0 0 0 0 0 2012 0 0 0 0 0 0 0 0 0 0 0 0 0
(1) “Graduates Available for Employment” means the number of graduates minus the number of graduates unavailable for employment. Graduates unavailable for employment mean graduates, who, after graduation, died, become incarcerated, are called to active military duty, are international students that leave the United States or do not have a visa allowing employment in the United States, or are continuing their education in an accredited or bureau-approved postsecondary institution.
(2) “Graduates Employed in the Field” means graduates who are gainfully employed within six months of graduation in a position for which the skills obtained through the education and training provided by the institution are required or provided a significant advantage to the graduate in obtaining the position.
(3) “Salary” is reported by the student. Not all graduates reported salary.
Initials: ________ Date: ______ I have read and understand the above salary and wage information.
Three-Year Cohort Default Rate as Published by USDE
Percentage of EnrolledStudents Receiving FederalStudent Loans
24.5% 72%
Initials: _____ Date: ______ I have read and understand the above USDE financial aid program participation information.
The data reflected on the above charts was gathered using at least one of the following methods: Graduate Surveys, Employer Surveys, Phone Calls, Education Development Department (EDD) and State Licensing Agencies. If you have any further questions or if you want a list of employment positions determined to be within the field for any specific program for which statistics are reported above, please speak with an Admissions Representative or see the School Catalog.
This fact sheet is filed with the Bureau for Private Postsecondary Education. Regardless of any information you may have relating to completion rates, placement rates, starting salaries, or license exam passage rates, this fact sheet contains the information as calculated pursuant to state law.
Any questions a student may have regarding this fact sheet that have not been satisfactorily answered by the institution may be directed to the Bureau for Private Postsecondary Education at: P.O. Box 980818, West Sacramento, CA 95798-0818, www.bppe.ca.gov., P: 888.370.7589 or 916.431.6959, F: 916.263.1897
I have read and understand this School Performance Fact Sheet. The School Performance Fact Sheet was reviewed and discussed with a school official prior to signing an enrollment agreement.
Student Name-Print Student Signature
School Official Date

SCHOOL PERFORMANCE FACT SHEET CET Center: SAN BERNARDINO
Student Name: _____________________________________________________________ SID No. _______________________
BPPE Fact Sheet for School Name CENTER FOR EMPLOYMENT TRAINING
Disclose by date: September 1, 2013 Street address 1430 COOLEY CT City, State Zip Code SAN BERNARDINO, CA 92408
Phone number (909) 478-3818 Fax Phone (909) 478-9506
Website WWW.CETWEB.ORG
PROGRAM TITLE – PROGRAM LENGTH
Course Name Clock Hours Published Charges HVAC TECHNICIAN and GREEN TECHNOLOGY 810 $8684.00
COMPLETION RATES
Calendar Year
Number of Students Who Began Program (1)
Students Available for Graduation (2)
Graduates (3) Completion Rate (4)
2011 49 49 17 34.69% 2012 64 64 9 14.06%
STUDENTS COMPLETING AFTER PUBLISHED PROGRAM LENGTH--150% COMPLETION RATES
Calendar Year
Number of Students Who Began Program (1)
Students Available for Graduation (2)
150% Graduates (5)
150% Completion Rate (6)
2011 49 49 26 53.06% 2012 64 64 42 65.63%
(1) “Number of Students Who Began Program” means the number of students who began the program who are scheduled to complete the program within the reporting calendar year.
(2) “Students Available for Graduation” means the number of students who began program minus the number of students unavailable for graduation, which means those students who have died, been incarcerated, or called to active military duty.
(3) “Graduates” means the number of students who completed the program within 100% of the published program length.
(4) “Completion Rate” means the number of graduates divided by the number of Students Available for Graduation.
(5) “150% Graduates” means the number of students who completed the program within 101-150% of the published program length.
(6) “150% Completion Rate” means the number of students who completed the program in the reported calendar year within 101-150% of the published program length divided by the number of Students Available for Graduation in the published program length period.
Initials: _______ Date:_______ I have read and understand the above completion rates.

SCHOOL PERFORMANCE FACT SHEET (continued) page 2
PLACEMENT RATES
Calendar Year
Number of Students Who Began Program (1)
Number of Graduates (2)
Graduates Available for Employment(3)
Graduates Employed in the Field (4)
Placement Rate % Employedin the Field (5)
Graduates Employed in the Field an Average of less than 32 Hours per Week
Graduates Employed in the Field at least 32 Hours per Week
2011 49 17 17 5 29.41% 0 5 2012 64 9 9 5 55.56% 1 4
(1) “Number of Students Who Began Program” means the number of students who began the program who are scheduled to complete the program within the reporting calendar year.
(2) “Number of Graduates” means the number of students who have completed the program within 100% of the published program length.
(3) “Graduates Available for Employment” means the number of graduates minus the number of graduates unavailable for employment. Graduates unavailable for employment' means graduates who, after graduation, die, become incarcerated, are called to active military duty, are international students that leave the United States or do not have a visa allowing employment in the United States, or are continuing their education in an accredited or bureau-approved postsecondary institution.
(4) “Graduates Employed in the Field” means a single position for which the institution represents, the program prepare graduates, within six months after the student completes the applicable educational program. For occupations requiring passage of a licensing exam prior to employment, institutions may count the graduate if employment begins “in a single position, for which the institution represents, its program prepares its graduates within six months of the announcement of the first licensure exam results.”
(5) “Placement Rate” is calculated by dividing the number of graduates gainfully employed in the field by the number of graduates available for employment.
Initials: _________ Date: ________ I have read and understand the above placement rates.
EXAMINATION PASSAGE RATES
Calendar Year
Number of Students Taking the Exam (1)
Number Who Passed First Exam Taken (2)
Number Who Failed First Exam Taken
Passage Rate (3)
2011 N/A N/A N/A N/A % 2012 N/A N/A N/A N/A %
(1) “Number of Students Taking Exam” means the number of students who completed the program within 150% of the published program length and who took the exam in the reported calendar year for the first time.
(2) “Number Who Passed First Exam Taken” means the number of students who took and passed the licensing exam in the reported calendar year on the first attempt.
(3) “Passage Rate” is calculated by dividing the number of graduates who pass the exam the first time that they take it by the number of graduates who took the licensing exam for the first time after completion of the program.
Initials:________ Date:______ I have read and understand the above license examination rates.

___________________________ __________________________
___________________________ _________________
SCHOOL PERFORMANCE FACT SHEET (continued) page 3
SALARY AND WAGE INFORMATION: PROGRAM TITLE AND PROGRAM LENGTH:
Calendar Year
Graduates Available for Employment (1)
Graduates Employedin the Field (2)
Annual Salary and Wages Reported by Graduated Employed in the Field (3). Amounts are reported in 5,000 brackets. 51K + = more than 50,000 reported, finally, NR is the number of students not responding to the survey.
5K
10K
15K
20K
25K
30K
35K
40K
45K
50K
51K +
NR
2011 17 5 0 0 1 2 0 0 1 0 0 1 0 2012 9 5 1 0 0 1 0 1 1 0 1 0 0
(1) “Graduates Available for Employment” means the number of graduates minus the number of graduates unavailable for employment. Graduates unavailable for employment mean graduates, who, after graduation, died, become incarcerated, are called to active military duty, are international students that leave the United States or do not have a visa allowing employment in the United States, or are continuing their education in an accredited or bureau-approved postsecondary institution.
(2) “Graduates Employed in the Field” means graduates who are gainfully employed within six months of graduation in a position for which the skills obtained through the education and training provided by the institution are required or provided a significant advantage to the graduate in obtaining the position.
(3) “Salary” is reported by the student. Not all graduates reported salary.
Initials: ________ Date: ______ I have read and understand the above salary and wage information.
Three-Year Cohort Default Rate as Published by USDE
Percentage of EnrolledStudents Receiving FederalStudent Loans
24.5% 72%
Initials: _____ Date: ______ I have read and understand the above USDE financial aid program participation information.
The data reflected on the above charts was gathered using at least one of the following methods: Graduate Surveys, Employer Surveys, Phone Calls, Education Development Department (EDD) and State Licensing Agencies. If you have any further questions or if you want a list of employment positions determined to be within the field for any specific program for which statistics are reported above, please speak with an Admissions Representative or see the School Catalog.
This fact sheet is filed with the Bureau for Private Postsecondary Education. Regardless of any information you may have relating to completion rates, placement rates, starting salaries, or license exam passage rates, this fact sheet contains the information as calculated pursuant to state law.
Any questions a student may have regarding this fact sheet that have not been satisfactorily answered by the institution may be directed to the Bureau for Private Postsecondary Education at: P.O. Box 980818, West Sacramento, CA 95798-0818, www.bppe.ca.gov., P: 888.370.7589 or 916.431.6959, F: 916.263.1897
I have read and understand this School Performance Fact Sheet. The School Performance Fact Sheet was reviewed and discussed with a school official prior to signing an enrollment agreement.
Student Name-Print Student Signature
School Official Date

SCHOOL PERFORMANCE FACT SHEET CET Center: SAN BERNARDINO
Student Name: _____________________________________________________________ SID No. _______________________
BPPE Fact Sheet for School Name CENTER FOR EMPLOYMENT TRAINING
Disclose by date: September 1, 2013 Street address 1430 COOLEY CT City, State Zip Code SAN BERNARDINO, CA 92408
Phone number (909) 478-3818 Fax Phone (909) 478-9506
Website WWW.CETWEB.ORG
PROGRAM TITLE – PROGRAM LENGTH
Course Name Clock Hours Published Charges MACHANIST TECHNOLOGY/CNC 900 $9307.00
COMPLETION RATES
Calendar Year
Number of Students Who Began Program (1)
Students Available for Graduation (2)
Graduates (3) Completion Rate (4)
2011 13 13 3 23.08% 2012 16 16 3 18.75%
STUDENTS COMPLETING AFTER PUBLISHED PROGRAM LENGTH--150% COMPLETION RATES
Calendar Year
Number of Students Who Began Program (1)
Students Available for Graduation (2)
150% Graduates (5)
150% Completion Rate (6)
2011 13 13 8 61.54% 2012 16 16 10 62.50%
(1) “Number of Students Who Began Program” means the number of students who began the program who are scheduled to complete the program within the reporting calendar year.
(2) “Students Available for Graduation” means the number of students who began program minus the number of students unavailable for graduation, which means those students who have died, been incarcerated, or called to active military duty.
(3) “Graduates” means the number of students who completed the program within 100% of the published program length.
(4) “Completion Rate” means the number of graduates divided by the number of Students Available for Graduation.
(5) “150% Graduates” means the number of students who completed the program within 101-150% of the published program length.
(6) “150% Completion Rate” means the number of students who completed the program in the reported calendar year within 101-150% of the published program length divided by the number of Students Available for Graduation in the published program length period.
Initials: _______ Date:_______ I have read and understand the above completion rates.

SCHOOL PERFORMANCE FACT SHEET (continued) page 2
PLACEMENT RATES
Calendar Year
Number of Students Who Began Program (1)
Number of Graduates (2)
Graduates Available for Employment(3)
Graduates Employed in the Field (4)
Placement Rate % Employedin the Field (5)
Graduates Employed in the Field an Average of less than 32 Hours per Week
Graduates Employed in the Field at least 32 Hours per Week
2011 13 3 3 0 0.00% 0 0 2012 16 3 3 3 100.00% 0 3
(1) “Number of Students Who Began Program” means the number of students who began the program who are scheduled to complete the program within the reporting calendar year.
(2) “Number of Graduates” means the number of students who have completed the program within 100% of the published program length.
(3) “Graduates Available for Employment” means the number of graduates minus the number of graduates unavailable for employment. Graduates unavailable for employment' means graduates who, after graduation, die, become incarcerated, are called to active military duty, are international students that leave the United States or do not have a visa allowing employment in the United States, or are continuing their education in an accredited or bureau-approved postsecondary institution.
(4) “Graduates Employed in the Field” means a single position for which the institution represents, the program prepare graduates, within six months after the student completes the applicable educational program. For occupations requiring passage of a licensing exam prior to employment, institutions may count the graduate if employment begins “in a single position, for which the institution represents, its program prepares its graduates within six months of the announcement of the first licensure exam results.”
(5) “Placement Rate” is calculated by dividing the number of graduates gainfully employed in the field by the number of graduates available for employment.
Initials: _________ Date: ________ I have read and understand the above placement rates.
EXAMINATION PASSAGE RATES
Calendar Year
Number of Students Taking the Exam (1)
Number Who Passed First Exam Taken (2)
Number Who Failed First Exam Taken
Passage Rate (3)
2011 N/A N/A N/A N/A % 2012 N/A N/A N/A N/A %
(1) “Number of Students Taking Exam” means the number of students who completed the program within 150% of the published program length and who took the exam in the reported calendar year for the first time.
(2) “Number Who Passed First Exam Taken” means the number of students who took and passed the licensing exam in the reported calendar year on the first attempt.
(3) “Passage Rate” is calculated by dividing the number of graduates who pass the exam the first time that they take it by the number of graduates who took the licensing exam for the first time after completion of the program.
Initials:________ Date:______ I have read and understand the above license examination rates.

___________________________ __________________________
___________________________ _________________
SCHOOL PERFORMANCE FACT SHEET (continued) page 3
SALARY AND WAGE INFORMATION: PROGRAM TITLE AND PROGRAM LENGTH:
Calendar Year
Graduates Available for Employment (1)
Graduates Employedin the Field (2)
Annual Salary and Wages Reported by Graduated Employed in the Field (3). Amounts are reported in 5,000 brackets. 51K + = more than 50,000 reported, finally, NR is the number of students not responding to the survey.
5K
10K
15K
20K
25K
30K
35K
40K
45K
50K
51K +
NR
2011 3 0 0 0 0 0 0 0 0 0 0 0 0 2012 3 3 0 0 0 0 2 0 0 0 0 0 0
(1) “Graduates Available for Employment” means the number of graduates minus the number of graduates unavailable for employment. Graduates unavailable for employment mean graduates, who, after graduation, died, become incarcerated, are called to active military duty, are international students that leave the United States or do not have a visa allowing employment in the United States, or are continuing their education in an accredited or bureau-approved postsecondary institution.
(2) “Graduates Employed in the Field” means graduates who are gainfully employed within six months of graduation in a position for which the skills obtained through the education and training provided by the institution are required or provided a significant advantage to the graduate in obtaining the position.
(3) “Salary” is reported by the student. Not all graduates reported salary.
Initials: ________ Date: ______ I have read and understand the above salary and wage information.
Three-Year Cohort Default Rate as Published by USDE
Percentage of EnrolledStudents Receiving FederalStudent Loans
24.5% 72%
Initials: _____ Date: ______ I have read and understand the above USDE financial aid program participation information.
The data reflected on the above charts was gathered using at least one of the following methods: Graduate Surveys, Employer Surveys, Phone Calls, Education Development Department (EDD) and State Licensing Agencies. If you have any further questions or if you want a list of employment positions determined to be within the field for any specific program for which statistics are reported above, please speak with an Admissions Representative or see the School Catalog.
This fact sheet is filed with the Bureau for Private Postsecondary Education. Regardless of any information you may have relating to completion rates, placement rates, starting salaries, or license exam passage rates, this fact sheet contains the information as calculated pursuant to state law.
Any questions a student may have regarding this fact sheet that have not been satisfactorily answered by the institution may be directed to the Bureau for Private Postsecondary Education at: P.O. Box 980818, West Sacramento, CA 95798-0818, www.bppe.ca.gov., P: 888.370.7589 or 916.431.6959, F: 916.263.1897
I have read and understand this School Performance Fact Sheet. The School Performance Fact Sheet was reviewed and discussed with a school official prior to signing an enrollment agreement.
Student Name-Print Student Signature
School Official Date

SCHOOL PERFORMANCE FACT SHEET CET Center: SAN BERNARDINO
Student Name: _____________________________________________________________ SID No. _______________________
BPPE Fact Sheet for School Name CENTER FOR EMPLOYMENT TRAINING
Disclose by date: September 1, 2013 Street address 1430 COOLEY CT City, State Zip Code SAN BERNARDINO, CA 92408
Phone number (909) 478-3818 Fax Phone (909) 478-9506
Website WWW.CETWEB.ORG
PROGRAM TITLE – PROGRAM LENGTH
Course Name Clock Hours Published Charges WELDING FABRICATION 900 $9307.00
COMPLETION RATES
Calendar Year
Number of Students Who Began Program (1)
Students Available for Graduation (2)
Graduates (3) Completion Rate (4)
2011 94 92 37 40.22% 2012 79 79 42 53.16%
STUDENTS COMPLETING AFTER PUBLISHED PROGRAM LENGTH--150% COMPLETION RATES
Calendar Year
Number of Students Who Began Program (1)
Students Available for Graduation (2)
150% Graduates (5)
150% Completion Rate (6)
2011 94 92 38 41.30% 2012 79 79 28 35.44%
(1) “Number of Students Who Began Program” means the number of students who began the program who are scheduled to complete the program within the reporting calendar year.
(2) “Students Available for Graduation” means the number of students who began program minus the number of students unavailable for graduation, which means those students who have died, been incarcerated, or called to active military duty.
(3) “Graduates” means the number of students who completed the program within 100% of the published program length.
(4) “Completion Rate” means the number of graduates divided by the number of Students Available for Graduation.
(5) “150% Graduates” means the number of students who completed the program within 101-150% of the published program length.
(6) “150% Completion Rate” means the number of students who completed the program in the reported calendar year within 101-150% of the published program length divided by the number of Students Available for Graduation in the published program length period.
Initials: _______ Date:_______ I have read and understand the above completion rates.

SCHOOL PERFORMANCE FACT SHEET (continued) page 2
PLACEMENT RATES
Calendar Year
Number of Students Who Began Program (1)
Number of Graduates (2)
Graduates Available for Employment(3)
Graduates Employed in the Field (4)
Placement Rate % Employedin the Field (5)
Graduates Employed in the Field an Average of less than 32 Hours per Week
Graduates Employed in the Field at least 32 Hours per Week
2011 94 37 37 29 78.38% 0 29 2012 79 42 42 30 71.43% 0 30
(1) “Number of Students Who Began Program” means the number of students who began the program who are scheduled to complete the program within the reporting calendar year.
(2) “Number of Graduates” means the number of students who have completed the program within 100% of the published program length.
(3) “Graduates Available for Employment” means the number of graduates minus the number of graduates unavailable for employment. Graduates unavailable for employment' means graduates who, after graduation, die, become incarcerated, are called to active military duty, are international students that leave the United States or do not have a visa allowing employment in the United States, or are continuing their education in an accredited or bureau-approved postsecondary institution.
(4) “Graduates Employed in the Field” means a single position for which the institution represents, the program prepare graduates, within six months after the student completes the applicable educational program. For occupations requiring passage of a licensing exam prior to employment, institutions may count the graduate if employment begins “in a single position, for which the institution represents, its program prepares its graduates within six months of the announcement of the first licensure exam results.”
(5) “Placement Rate” is calculated by dividing the number of graduates gainfully employed in the field by the number of graduates available for employment.
Initials: _________ Date: ________ I have read and understand the above placement rates.
EXAMINATION PASSAGE RATES
Calendar Year
Number of Students Taking the Exam (1)
Number Who Passed First Exam Taken (2)
Number Who Failed First Exam Taken
Passage Rate (3)
2011 N/A N/A N/A N/A % 2012 N/A N/A N/A N/A %
(1) “Number of Students Taking Exam” means the number of students who completed the program within 150% of the published program length and who took the exam in the reported calendar year for the first time.
(2) “Number Who Passed First Exam Taken” means the number of students who took and passed the licensing exam in the reported calendar year on the first attempt.
(3) “Passage Rate” is calculated by dividing the number of graduates who pass the exam the first time that they take it by the number of graduates who took the licensing exam for the first time after completion of the program.
Initials:________ Date:______ I have read and understand the above license examination rates.

___________________________ __________________________
___________________________ _________________
SCHOOL PERFORMANCE FACT SHEET (continued) page 3
SALARY AND WAGE INFORMATION: PROGRAM TITLE AND PROGRAM LENGTH:
Calendar Year
Graduates Available for Employment (1)
Graduates Employedin the Field (2)
Annual Salary and Wages Reported by Graduated Employed in the Field (3). Amounts are reported in 5,000 brackets. 51K + = more than 50,000 reported, finally, NR is the number of students not responding to the survey.
5K
10K
15K
20K
25K
30K
35K
40K
45K
50K
51K +
NR
2011 37 29 0 0 0 3 22 1 1 2 0 0 0 2012 42 30 0 0 0 2 13 3 3 1 1 2 2
(1) “Graduates Available for Employment” means the number of graduates minus the number of graduates unavailable for employment. Graduates unavailable for employment mean graduates, who, after graduation, died, become incarcerated, are called to active military duty, are international students that leave the United States or do not have a visa allowing employment in the United States, or are continuing their education in an accredited or bureau-approved postsecondary institution.
(2) “Graduates Employed in the Field” means graduates who are gainfully employed within six months of graduation in a position for which the skills obtained through the education and training provided by the institution are required or provided a significant advantage to the graduate in obtaining the position.
(3) “Salary” is reported by the student. Not all graduates reported salary.
Initials: ________ Date: ______ I have read and understand the above salary and wage information.
Three-Year Cohort Default Rate as Published by USDE
Percentage of EnrolledStudents Receiving FederalStudent Loans
24.5% 72%
Initials: _____ Date: ______ I have read and understand the above USDE financial aid program participation information.
The data reflected on the above charts was gathered using at least one of the following methods: Graduate Surveys, Employer Surveys, Phone Calls, Education Development Department (EDD) and State Licensing Agencies. If you have any further questions or if you want a list of employment positions determined to be within the field for any specific program for which statistics are reported above, please speak with an Admissions Representative or see the School Catalog.
This fact sheet is filed with the Bureau for Private Postsecondary Education. Regardless of any information you may have relating to completion rates, placement rates, starting salaries, or license exam passage rates, this fact sheet contains the information as calculated pursuant to state law.
Any questions a student may have regarding this fact sheet that have not been satisfactorily answered by the institution may be directed to the Bureau for Private Postsecondary Education at: P.O. Box 980818, West Sacramento, CA 95798-0818, www.bppe.ca.gov., P: 888.370.7589 or 916.431.6959, F: 916.263.1897
I have read and understand this School Performance Fact Sheet. The School Performance Fact Sheet was reviewed and discussed with a school official prior to signing an enrollment agreement.
Student Name-Print Student Signature
School Official Date

SCHOOL PERFORMANCE FACT SHEET CET Center: SAN DIEGO
Student Name: _____________________________________________________________ SID No. _______________________
BPPE Fact Sheet for School Name CENTER FOR EMPLOYMENT TRAINING
Disclose by date: September 1, 2013 Street address 4153 MARKET STREET City, State Zip Code SAN DIEGO, CA 92102
Phone number (619) 233-6829 Fax Phone (619) 233-6350
Website WWW.CETWEB.ORG
PROGRAM TITLE – PROGRAM LENGTH
Course Name Clock Hours Published Charges GREEN BUILDING CONSTRUCTION SKILLS 900 $9307.00
COMPLETION RATES
Calendar Year
Number of Students Who Began Program (1)
Students Available for Graduation (2)
Graduates (3) Completion Rate (4)
2011 65 61 9 14.75% 2012 63 63 15 23.81%
STUDENTS COMPLETING AFTER PUBLISHED PROGRAM LENGTH--150% COMPLETION RATES
Calendar Year
Number of Students Who Began Program (1)
Students Available for Graduation (2)
150% Graduates (5)
150% Completion Rate (6)
2011 65 61 38 62.30% 2012 63 63 37 58.73%
(1) “Number of Students Who Began Program” means the number of students who began the program who are scheduled to complete the program within the reporting calendar year.
(2) “Students Available for Graduation” means the number of students who began program minus the number of students unavailable for graduation, which means those students who have died, been incarcerated, or called to active military duty.
(3) “Graduates” means the number of students who completed the program within 100% of the published program length.
(4) “Completion Rate” means the number of graduates divided by the number of Students Available for Graduation.
(5) “150% Graduates” means the number of students who completed the program within 101-150% of the published program length.
(6) “150% Completion Rate” means the number of students who completed the program in the reported calendar year within 101-150% of the published program length divided by the number of Students Available for Graduation in the published program length period.
Initials: _______ Date:_______ I have read and understand the above completion rates.

SCHOOL PERFORMANCE FACT SHEET (continued) page 2
PLACEMENT RATES
Calendar Year
Number of Students Who Began Program (1)
Number of Graduates (2)
Graduates Available for Employment(3)
Graduates Employed in the Field (4)
Placement Rate % Employedin the Field (5)
Graduates Employed in the Field an Average of less than 32 Hours per Week
Graduates Employed in the Field at least 32 Hours per Week
2011 65 9 9 7 77.78% 0 7 2012 63 15 15 13 86.67% 3 10
(1) “Number of Students Who Began Program” means the number of students who began the program who are scheduled to complete the program within the reporting calendar year.
(2) “Number of Graduates” means the number of students who have completed the program within 100% of the published program length.
(3) “Graduates Available for Employment” means the number of graduates minus the number of graduates unavailable for employment. Graduates unavailable for employment' means graduates who, after graduation, die, become incarcerated, are called to active military duty, are international students that leave the United States or do not have a visa allowing employment in the United States, or are continuing their education in an accredited or bureau-approved postsecondary institution.
(4) “Graduates Employed in the Field” means a single position for which the institution represents, the program prepare graduates, within six months after the student completes the applicable educational program. For occupations requiring passage of a licensing exam prior to employment, institutions may count the graduate if employment begins “in a single position, for which the institution represents, its program prepares its graduates within six months of the announcement of the first licensure exam results.”
(5) “Placement Rate” is calculated by dividing the number of graduates gainfully employed in the field by the number of graduates available for employment.
Initials: _________ Date: ________ I have read and understand the above placement rates.
EXAMINATION PASSAGE RATES
Calendar Year
Number of Students Taking the Exam (1)
Number Who Passed First Exam Taken (2)
Number Who Failed First Exam Taken
Passage Rate (3)
2011 N/A N/A N/A N/A % 2012 N/A N/A N/A N/A %
(1) “Number of Students Taking Exam” means the number of students who completed the program within 150% of the published program length and who took the exam in the reported calendar year for the first time.
(2) “Number Who Passed First Exam Taken” means the number of students who took and passed the licensing exam in the reported calendar year on the first attempt.
(3) “Passage Rate” is calculated by dividing the number of graduates who pass the exam the first time that they take it by the number of graduates who took the licensing exam for the first time after completion of the program.
Initials:________ Date:______ I have read and understand the above license examination rates.

___________________________ __________________________
___________________________ _________________
SCHOOL PERFORMANCE FACT SHEET (continued) page 3
SALARY AND WAGE INFORMATION: PROGRAM TITLE AND PROGRAM LENGTH:
Calendar Year
Graduates Available for Employment (1)
Graduates Employedin the Field (2)
Annual Salary and Wages Reported by Graduated Employed in the Field (3). Amounts are reported in 5,000 brackets. 51K + = more than 50,000 reported, finally, NR is the number of students not responding to the survey.
5K
10K
15K
20K
25K
30K
35K
40K
45K
50K
51K +
NR
2011 9 7 0 0 0 1 1 0 2 3 0 0 0 2012 15 13 0 0 1 3 5 2 2 0 0 0 0
(1) “Graduates Available for Employment” means the number of graduates minus the number of graduates unavailable for employment. Graduates unavailable for employment mean graduates, who, after graduation, died, become incarcerated, are called to active military duty, are international students that leave the United States or do not have a visa allowing employment in the United States, or are continuing their education in an accredited or bureau-approved postsecondary institution.
(2) “Graduates Employed in the Field” means graduates who are gainfully employed within six months of graduation in a position for which the skills obtained through the education and training provided by the institution are required or provided a significant advantage to the graduate in obtaining the position.
(3) “Salary” is reported by the student. Not all graduates reported salary.
Initials: ________ Date: ______ I have read and understand the above salary and wage information.
Three-Year Cohort Default Rate as Published by USDE
Percentage of EnrolledStudents Receiving FederalStudent Loans
24.5% 72%
Initials: _____ Date: ______ I have read and understand the above USDE financial aid program participation information.
The data reflected on the above charts was gathered using at least one of the following methods: Graduate Surveys, Employer Surveys, Phone Calls, Education Development Department (EDD) and State Licensing Agencies. If you have any further questions or if you want a list of employment positions determined to be within the field for any specific program for which statistics are reported above, please speak with an Admissions Representative or see the School Catalog.
This fact sheet is filed with the Bureau for Private Postsecondary Education. Regardless of any information you may have relating to completion rates, placement rates, starting salaries, or license exam passage rates, this fact sheet contains the information as calculated pursuant to state law.
Any questions a student may have regarding this fact sheet that have not been satisfactorily answered by the institution may be directed to the Bureau for Private Postsecondary Education at: P.O. Box 980818, West Sacramento, CA 95798-0818, www.bppe.ca.gov., P: 888.370.7589 or 916.431.6959, F: 916.263.1897
I have read and understand this School Performance Fact Sheet. The School Performance Fact Sheet was reviewed and discussed with a school official prior to signing an enrollment agreement.
Student Name-Print Student Signature
School Official Date

SCHOOL PERFORMANCE FACT SHEET CET Center: SAN DIEGO
Student Name: _____________________________________________________________ SID No. _______________________
BPPE Fact Sheet for School Name CENTER FOR EMPLOYMENT TRAINING
Disclose by date: September 1, 2013 Street address 4153 MARKET STREET City, State Zip Code SAN DIEGO, CA 92102
Phone number (619) 233-6829 Fax Phone (619) 233-6350
Website WWW.CETWEB.ORG
PROGRAM TITLE – PROGRAM LENGTH
Course Name Clock Hours Published Charges MEDICAL ASSISTANT 900 $9307.00
COMPLETION RATES
Calendar Year
Number of Students Who Began Program (1)
Students Available for Graduation (2)
Graduates (3) Completion Rate (4)
2011 30 30 5 16.67% 2012 23 23 2 8.70%
STUDENTS COMPLETING AFTER PUBLISHED PROGRAM LENGTH--150% COMPLETION RATES
Calendar Year
Number of Students Who Began Program (1)
Students Available for Graduation (2)
150% Graduates (5)
150% Completion Rate (6)
2011 30 30 19 63.33% 2012 23 23 16 69.57%
(1) “Number of Students Who Began Program” means the number of students who began the program who are scheduled to complete the program within the reporting calendar year.
(2) “Students Available for Graduation” means the number of students who began program minus the number of students unavailable for graduation, which means those students who have died, been incarcerated, or called to active military duty.
(3) “Graduates” means the number of students who completed the program within 100% of the published program length.
(4) “Completion Rate” means the number of graduates divided by the number of Students Available for Graduation.
(5) “150% Graduates” means the number of students who completed the program within 101-150% of the published program length.
(6) “150% Completion Rate” means the number of students who completed the program in the reported calendar year within 101-150% of the published program length divided by the number of Students Available for Graduation in the published program length period.
Initials: _______ Date:_______ I have read and understand the above completion rates.

SCHOOL PERFORMANCE FACT SHEET (continued) page 2
PLACEMENT RATES
Calendar Year
Number of Students Who Began Program (1)
Number of Graduates (2)
Graduates Available for Employment(3)
Graduates Employed in the Field (4)
Placement Rate % Employedin the Field (5)
Graduates Employed in the Field an Average of less than 32 Hours per Week
Graduates Employed in the Field at least 32 Hours per Week
2011 30 5 5 1 20.00% 0 1 2012 23 2 2 0 0.00% 0 0
(1) “Number of Students Who Began Program” means the number of students who began the program who are scheduled to complete the program within the reporting calendar year.
(2) “Number of Graduates” means the number of students who have completed the program within 100% of the published program length.
(3) “Graduates Available for Employment” means the number of graduates minus the number of graduates unavailable for employment. Graduates unavailable for employment' means graduates who, after graduation, die, become incarcerated, are called to active military duty, are international students that leave the United States or do not have a visa allowing employment in the United States, or are continuing their education in an accredited or bureau-approved postsecondary institution.
(4) “Graduates Employed in the Field” means a single position for which the institution represents, the program prepare graduates, within six months after the student completes the applicable educational program. For occupations requiring passage of a licensing exam prior to employment, institutions may count the graduate if employment begins “in a single position, for which the institution represents, its program prepares its graduates within six months of the announcement of the first licensure exam results.”
(5) “Placement Rate” is calculated by dividing the number of graduates gainfully employed in the field by the number of graduates available for employment.
Initials: _________ Date: ________ I have read and understand the above placement rates.
EXAMINATION PASSAGE RATES
Calendar Year
Number of Students Taking the Exam (1)
Number Who Passed First Exam Taken (2)
Number Who Failed First Exam Taken
Passage Rate (3)
2011 N/A N/A N/A N/A % 2012 N/A N/A N/A N/A %
(1) “Number of Students Taking Exam” means the number of students who completed the program within 150% of the published program length and who took the exam in the reported calendar year for the first time.
(2) “Number Who Passed First Exam Taken” means the number of students who took and passed the licensing exam in the reported calendar year on the first attempt.
(3) “Passage Rate” is calculated by dividing the number of graduates who pass the exam the first time that they take it by the number of graduates who took the licensing exam for the first time after completion of the program.
Initials:________ Date:______ I have read and understand the above license examination rates.

___________________________ __________________________
___________________________ _________________
SCHOOL PERFORMANCE FACT SHEET (continued) page 3
SALARY AND WAGE INFORMATION: PROGRAM TITLE AND PROGRAM LENGTH:
Calendar Year
Graduates Available for Employment (1)
Graduates Employedin the Field (2)
Annual Salary and Wages Reported by Graduated Employed in the Field (3). Amounts are reported in 5,000 brackets. 51K + = more than 50,000 reported, finally, NR is the number of students not responding to the survey.
5K
10K
15K
20K
25K
30K
35K
40K
45K
50K
51K +
NR
2011 5 1 0 0 0 0 1 0 0 0 0 0 0 2012 2 0 0 0 0 0 0 0 0 0 0 0 0
(1) “Graduates Available for Employment” means the number of graduates minus the number of graduates unavailable for employment. Graduates unavailable for employment mean graduates, who, after graduation, died, become incarcerated, are called to active military duty, are international students that leave the United States or do not have a visa allowing employment in the United States, or are continuing their education in an accredited or bureau-approved postsecondary institution.
(2) “Graduates Employed in the Field” means graduates who are gainfully employed within six months of graduation in a position for which the skills obtained through the education and training provided by the institution are required or provided a significant advantage to the graduate in obtaining the position.
(3) “Salary” is reported by the student. Not all graduates reported salary.
Initials: ________ Date: ______ I have read and understand the above salary and wage information.
Three-Year Cohort Default Rate as Published by USDE
Percentage of EnrolledStudents Receiving FederalStudent Loans
24.5% 72%
Initials: _____ Date: ______ I have read and understand the above USDE financial aid program participation information.
The data reflected on the above charts was gathered using at least one of the following methods: Graduate Surveys, Employer Surveys, Phone Calls, Education Development Department (EDD) and State Licensing Agencies. If you have any further questions or if you want a list of employment positions determined to be within the field for any specific program for which statistics are reported above, please speak with an Admissions Representative or see the School Catalog.
This fact sheet is filed with the Bureau for Private Postsecondary Education. Regardless of any information you may have relating to completion rates, placement rates, starting salaries, or license exam passage rates, this fact sheet contains the information as calculated pursuant to state law.
Any questions a student may have regarding this fact sheet that have not been satisfactorily answered by the institution may be directed to the Bureau for Private Postsecondary Education at: P.O. Box 980818, West Sacramento, CA 95798-0818, www.bppe.ca.gov., P: 888.370.7589 or 916.431.6959, F: 916.263.1897
I have read and understand this School Performance Fact Sheet. The School Performance Fact Sheet was reviewed and discussed with a school official prior to signing an enrollment agreement.
Student Name-Print Student Signature
School Official Date

SCHOOL PERFORMANCE FACT SHEET CET Center: SAN DIEGO
Student Name: _____________________________________________________________ SID No. _______________________
BPPE Fact Sheet for School Name CENTER FOR EMPLOYMENT TRAINING
Disclose by date: September 1, 2013 Street address 4153 MARKET STREET City, State Zip Code SAN DIEGO, CA 92102
Phone number (619) 233-6829 Fax Phone (619) 233-6350
Website WWW.CETWEB.ORG
PROGRAM TITLE – PROGRAM LENGTH
Course Name Clock Hours Published Charges MEDICAL ADMINISTRATIVE ASSISTANT 720 $8060.00
COMPLETION RATES
Calendar Year
Number of Students Who Began Program (1)
Students Available for Graduation (2)
Graduates (3) Completion Rate (4)
2011 18 17 3 17.65% 2012 9 8 4 50.00%
STUDENTS COMPLETING AFTER PUBLISHED PROGRAM LENGTH--150% COMPLETION RATES
Calendar Year
Number of Students Who Began Program (1)
Students Available for Graduation (2)
150% Graduates (5)
150% Completion Rate (6)
2011 18 17 11 64.71% 2012 9 8 3 37.50%
(1) “Number of Students Who Began Program” means the number of students who began the program who are scheduled to complete the program within the reporting calendar year.
(2) “Students Available for Graduation” means the number of students who began program minus the number of students unavailable for graduation, which means those students who have died, been incarcerated, or called to active military duty.
(3) “Graduates” means the number of students who completed the program within 100% of the published program length.
(4) “Completion Rate” means the number of graduates divided by the number of Students Available for Graduation.
(5) “150% Graduates” means the number of students who completed the program within 101-150% of the published program length.
(6) “150% Completion Rate” means the number of students who completed the program in the reported calendar year within 101-150% of the published program length divided by the number of Students Available for Graduation in the published program length period.
Initials: _______ Date:_______ I have read and understand the above completion rates.

SCHOOL PERFORMANCE FACT SHEET (continued) page 2
PLACEMENT RATES
Calendar Year
Number of Students Who Began Program (1)
Number of Graduates (2)
Graduates Available for Employment(3)
Graduates Employed in the Field (4)
Placement Rate % Employedin the Field (5)
Graduates Employed in the Field an Average of less than 32 Hours per Week
Graduates Employed in the Field at least 32 Hours per Week
2011 18 3 3 1 33.33% 0 1 2012 9 4 4 3 100.00% 2 1
(1) “Number of Students Who Began Program” means the number of students who began the program who are scheduled to complete the program within the reporting calendar year.
(2) “Number of Graduates” means the number of students who have completed the program within 100% of the published program length.
(3) “Graduates Available for Employment” means the number of graduates minus the number of graduates unavailable for employment. Graduates unavailable for employment' means graduates who, after graduation, die, become incarcerated, are called to active military duty, are international students that leave the United States or do not have a visa allowing employment in the United States, or are continuing their education in an accredited or bureau-approved postsecondary institution.
(4) “Graduates Employed in the Field” means a single position for which the institution represents, the program prepare graduates, within six months after the student completes the applicable educational program. For occupations requiring passage of a licensing exam prior to employment, institutions may count the graduate if employment begins “in a single position, for which the institution represents, its program prepares its graduates within six months of the announcement of the first licensure exam results.”
(5) “Placement Rate” is calculated by dividing the number of graduates gainfully employed in the field by the number of graduates available for employment.
Initials: _________ Date: ________ I have read and understand the above placement rates.
EXAMINATION PASSAGE RATES
Calendar Year
Number of Students Taking the Exam (1)
Number Who Passed First Exam Taken (2)
Number Who Failed First Exam Taken
Passage Rate (3)
2011 N/A N/A N/A N/A % 2012 N/A N/A N/A N/A %
(1) “Number of Students Taking Exam” means the number of students who completed the program within 150% of the published program length and who took the exam in the reported calendar year for the first time.
(2) “Number Who Passed First Exam Taken” means the number of students who took and passed the licensing exam in the reported calendar year on the first attempt.
(3) “Passage Rate” is calculated by dividing the number of graduates who pass the exam the first time that they take it by the number of graduates who took the licensing exam for the first time after completion of the program.
Initials:________ Date:______ I have read and understand the above license examination rates.

___________________________ __________________________
___________________________ _________________
SCHOOL PERFORMANCE FACT SHEET (continued) page 3
SALARY AND WAGE INFORMATION: PROGRAM TITLE AND PROGRAM LENGTH:
Calendar Year
Graduates Available for Employment (1)
Graduates Employedin the Field (2)
Annual Salary and Wages Reported by Graduated Employed in the Field (3). Amounts are reported in 5,000 brackets. 51K + = more than 50,000 reported, finally, NR is the number of students not responding to the survey.
5K
10K
15K
20K
25K
30K
35K
40K
45K
50K
51K +
NR
2011 3 1 0 0 0 0 1 0 0 0 0 0 0 2012 4 3 0 1 0 2 0 0 0 0 0 0 0
(1) “Graduates Available for Employment” means the number of graduates minus the number of graduates unavailable for employment. Graduates unavailable for employment mean graduates, who, after graduation, died, become incarcerated, are called to active military duty, are international students that leave the United States or do not have a visa allowing employment in the United States, or are continuing their education in an accredited or bureau-approved postsecondary institution.
(2) “Graduates Employed in the Field” means graduates who are gainfully employed within six months of graduation in a position for which the skills obtained through the education and training provided by the institution are required or provided a significant advantage to the graduate in obtaining the position.
(3) “Salary” is reported by the student. Not all graduates reported salary.
Initials: ________ Date: ______ I have read and understand the above salary and wage information.
Three-Year Cohort Default Rate as Published by USDE
Percentage of EnrolledStudents Receiving FederalStudent Loans
24.5% 72%
Initials: _____ Date: ______ I have read and understand the above USDE financial aid program participation information.
The data reflected on the above charts was gathered using at least one of the following methods: Graduate Surveys, Employer Surveys, Phone Calls, Education Development Department (EDD) and State Licensing Agencies. If you have any further questions or if you want a list of employment positions determined to be within the field for any specific program for which statistics are reported above, please speak with an Admissions Representative or see the School Catalog.
This fact sheet is filed with the Bureau for Private Postsecondary Education. Regardless of any information you may have relating to completion rates, placement rates, starting salaries, or license exam passage rates, this fact sheet contains the information as calculated pursuant to state law.
Any questions a student may have regarding this fact sheet that have not been satisfactorily answered by the institution may be directed to the Bureau for Private Postsecondary Education at: P.O. Box 980818, West Sacramento, CA 95798-0818, www.bppe.ca.gov., P: 888.370.7589 or 916.431.6959, F: 916.263.1897
I have read and understand this School Performance Fact Sheet. The School Performance Fact Sheet was reviewed and discussed with a school official prior to signing an enrollment agreement.
Student Name-Print Student Signature
School Official Date

SCHOOL PERFORMANCE FACT SHEET CET Center: SAN DIEGO
Student Name: _____________________________________________________________ SID No. _______________________
BPPE Fact Sheet for School Name CENTER FOR EMPLOYMENT TRAINING
Disclose by date: September 1, 2013 Street address 4153 MARKET STREET City, State Zip Code SAN DIEGO, CA 92102
Phone number (619) 233-6829 Fax Phone (619) 233-6350
Website WWW.CETWEB.ORG
PROGRAM TITLE – PROGRAM LENGTH
Course Name Clock Hours Published Charges WELDING FABRICATION 900 $9307.00
COMPLETION RATES
Calendar Year
Number of Students Who Began Program (1)
Students Available for Graduation (2)
Graduates (3) Completion Rate (4)
2011 119 115 44 38.26% 2012 74 74 29 39.19%
STUDENTS COMPLETING AFTER PUBLISHED PROGRAM LENGTH--150% COMPLETION RATES
Calendar Year
Number of Students Who Began Program (1)
Students Available for Graduation (2)
150% Graduates (5)
150% Completion Rate (6)
2011 119 115 37 32.17% 2012 74 74 38 51.35%
(1) “Number of Students Who Began Program” means the number of students who began the program who are scheduled to complete the program within the reporting calendar year.
(2) “Students Available for Graduation” means the number of students who began program minus the number of students unavailable for graduation, which means those students who have died, been incarcerated, or called to active military duty.
(3) “Graduates” means the number of students who completed the program within 100% of the published program length.
(4) “Completion Rate” means the number of graduates divided by the number of Students Available for Graduation.
(5) “150% Graduates” means the number of students who completed the program within 101-150% of the published program length.
(6) “150% Completion Rate” means the number of students who completed the program in the reported calendar year within 101-150% of the published program length divided by the number of Students Available for Graduation in the published program length period.
Initials: _______ Date:_______ I have read and understand the above completion rates.

SCHOOL PERFORMANCE FACT SHEET (continued) page 2
PLACEMENT RATES
Calendar Year
Number of Students Who Began Program (1)
Number of Graduates (2)
Graduates Available for Employment(3)
Graduates Employed in the Field (4)
Placement Rate % Employedin the Field (5)
Graduates Employed in the Field an Average of less than 32 Hours per Week
Graduates Employed in the Field at least 32 Hours per Week
2011 119 44 44 31 70.45% 1 30 2012 74 29 29 19 65.52% 0 19
(1) “Number of Students Who Began Program” means the number of students who began the program who are scheduled to complete the program within the reporting calendar year.
(2) “Number of Graduates” means the number of students who have completed the program within 100% of the published program length.
(3) “Graduates Available for Employment” means the number of graduates minus the number of graduates unavailable for employment. Graduates unavailable for employment' means graduates who, after graduation, die, become incarcerated, are called to active military duty, are international students that leave the United States or do not have a visa allowing employment in the United States, or are continuing their education in an accredited or bureau-approved postsecondary institution.
(4) “Graduates Employed in the Field” means a single position for which the institution represents, the program prepare graduates, within six months after the student completes the applicable educational program. For occupations requiring passage of a licensing exam prior to employment, institutions may count the graduate if employment begins “in a single position, for which the institution represents, its program prepares its graduates within six months of the announcement of the first licensure exam results.”
(5) “Placement Rate” is calculated by dividing the number of graduates gainfully employed in the field by the number of graduates available for employment.
Initials: _________ Date: ________ I have read and understand the above placement rates.
EXAMINATION PASSAGE RATES
Calendar Year
Number of Students Taking the Exam (1)
Number Who Passed First Exam Taken (2)
Number Who Failed First Exam Taken
Passage Rate (3)
2011 N/A N/A N/A N/A % 2012 N/A N/A N/A N/A %
(1) “Number of Students Taking Exam” means the number of students who completed the program within 150% of the published program length and who took the exam in the reported calendar year for the first time.
(2) “Number Who Passed First Exam Taken” means the number of students who took and passed the licensing exam in the reported calendar year on the first attempt.
(3) “Passage Rate” is calculated by dividing the number of graduates who pass the exam the first time that they take it by the number of graduates who took the licensing exam for the first time after completion of the program.
Initials:________ Date:______ I have read and understand the above license examination rates.

___________________________ __________________________
___________________________ _________________
SCHOOL PERFORMANCE FACT SHEET (continued) page 3
SALARY AND WAGE INFORMATION: PROGRAM TITLE AND PROGRAM LENGTH:
Calendar Year
Graduates Available for Employment (1)
Graduates Employedin the Field (2)
Annual Salary and Wages Reported by Graduated Employed in the Field (3). Amounts are reported in 5,000 brackets. 51K + = more than 50,000 reported, finally, NR is the number of students not responding to the survey.
5K
10K
15K
20K
25K
30K
35K
40K
45K
50K
51K +
NR
2011 44 31 0 0 0 5 8 0 13 4 0 0 1 2012 29 19 0 0 0 3 1 6 6 1 0 1 1
(1) “Graduates Available for Employment” means the number of graduates minus the number of graduates unavailable for employment. Graduates unavailable for employment mean graduates, who, after graduation, died, become incarcerated, are called to active military duty, are international students that leave the United States or do not have a visa allowing employment in the United States, or are continuing their education in an accredited or bureau-approved postsecondary institution.
(2) “Graduates Employed in the Field” means graduates who are gainfully employed within six months of graduation in a position for which the skills obtained through the education and training provided by the institution are required or provided a significant advantage to the graduate in obtaining the position.
(3) “Salary” is reported by the student. Not all graduates reported salary.
Initials: ________ Date: ______ I have read and understand the above salary and wage information.
Three-Year Cohort Default Rate as Published by USDE
Percentage of EnrolledStudents Receiving FederalStudent Loans
24.5% 72%
Initials: _____ Date: ______ I have read and understand the above USDE financial aid program participation information.
The data reflected on the above charts was gathered using at least one of the following methods: Graduate Surveys, Employer Surveys, Phone Calls, Education Development Department (EDD) and State Licensing Agencies. If you have any further questions or if you want a list of employment positions determined to be within the field for any specific program for which statistics are reported above, please speak with an Admissions Representative or see the School Catalog.
This fact sheet is filed with the Bureau for Private Postsecondary Education. Regardless of any information you may have relating to completion rates, placement rates, starting salaries, or license exam passage rates, this fact sheet contains the information as calculated pursuant to state law.
Any questions a student may have regarding this fact sheet that have not been satisfactorily answered by the institution may be directed to the Bureau for Private Postsecondary Education at: P.O. Box 980818, West Sacramento, CA 95798-0818, www.bppe.ca.gov., P: 888.370.7589 or 916.431.6959, F: 916.263.1897
I have read and understand this School Performance Fact Sheet. The School Performance Fact Sheet was reviewed and discussed with a school official prior to signing an enrollment agreement.
Student Name-Print Student Signature
School Official Date

SCHOOL PERFORMANCE FACT SHEET CET Center: SAN JOSE
Student Name: _____________________________________________________________ SID No. _______________________
BPPE Fact Sheet for School Name CENTER FOR EMPLOYMENT TRAINING
Disclose by date: September 1, 2013 Street address 701 VINE STREET City, State Zip Code SAN JOSE, CA 95110
Phone number (408) 534-5456 Fax Phone (408) 294-7849
Website WWW.CETWEB.ORG
PROGRAM TITLE – PROGRAM LENGTH
Course Name Clock Hours Published Charges AUTOMOTIVE SPECIALIST 810 $8684.00
COMPLETION RATES
Calendar Year
Number of Students Who Began Program (1)
Students Available for Graduation (2)
Graduates (3) Completion Rate (4)
2011 74 73 21 28.77% 2012 32 30 6 20.00%
STUDENTS COMPLETING AFTER PUBLISHED PROGRAM LENGTH--150% COMPLETION RATES
Calendar Year
Number of Students Who Began Program (1)
Students Available for Graduation (2)
150% Graduates (5)
150% Completion Rate (6)
2011 74 73 40 54.79% 2012 32 30 20 66.67%
(1) “Number of Students Who Began Program” means the number of students who began the program who are scheduled to complete the program within the reporting calendar year.
(2) “Students Available for Graduation” means the number of students who began program minus the number of students unavailable for graduation, which means those students who have died, been incarcerated, or called to active military duty.
(3) “Graduates” means the number of students who completed the program within 100% of the published program length.
(4) “Completion Rate” means the number of graduates divided by the number of Students Available for Graduation.
(5) “150% Graduates” means the number of students who completed the program within 101-150% of the published program length.
(6) “150% Completion Rate” means the number of students who completed the program in the reported calendar year within 101-150% of the published program length divided by the number of Students Available for Graduation in the published program length period.
Initials: _______ Date:_______ I have read and understand the above completion rates.

SCHOOL PERFORMANCE FACT SHEET (continued) page 2
PLACEMENT RATES
Calendar Year
Number of Students Who Began Program (1)
Number of Graduates (2)
Graduates Available for Employment(3)
Graduates Employed in the Field (4)
Placement Rate % Employedin the Field (5)
Graduates Employed in the Field an Average of less than 32 Hours per Week
Graduates Employed in the Field at least 32 Hours per Week
2011 74 21 21 7 33.33% 2 5 2012 32 6 6 1 20.00% 1 0
(1) “Number of Students Who Began Program” means the number of students who began the program who are scheduled to complete the program within the reporting calendar year.
(2) “Number of Graduates” means the number of students who have completed the program within 100% of the published program length.
(3) “Graduates Available for Employment” means the number of graduates minus the number of graduates unavailable for employment. Graduates unavailable for employment' means graduates who, after graduation, die, become incarcerated, are called to active military duty, are international students that leave the United States or do not have a visa allowing employment in the United States, or are continuing their education in an accredited or bureau-approved postsecondary institution.
(4) “Graduates Employed in the Field” means a single position for which the institution represents, the program prepare graduates, within six months after the student completes the applicable educational program. For occupations requiring passage of a licensing exam prior to employment, institutions may count the graduate if employment begins “in a single position, for which the institution represents, its program prepares its graduates within six months of the announcement of the first licensure exam results.”
(5) “Placement Rate” is calculated by dividing the number of graduates gainfully employed in the field by the number of graduates available for employment.
Initials: _________ Date: ________ I have read and understand the above placement rates.
EXAMINATION PASSAGE RATES
Calendar Year
Number of Students Taking the Exam (1)
Number Who Passed First Exam Taken (2)
Number Who Failed First Exam Taken
Passage Rate (3)
2011 N/A N/A N/A N/A % 2012 N/A N/A N/A N/A %
(1) “Number of Students Taking Exam” means the number of students who completed the program within 150% of the published program length and who took the exam in the reported calendar year for the first time.
(2) “Number Who Passed First Exam Taken” means the number of students who took and passed the licensing exam in the reported calendar year on the first attempt.
(3) “Passage Rate” is calculated by dividing the number of graduates who pass the exam the first time that they take it by the number of graduates who took the licensing exam for the first time after completion of the program.
Initials:________ Date:______ I have read and understand the above license examination rates.

___________________________ __________________________
___________________________ _________________
SCHOOL PERFORMANCE FACT SHEET (continued) page 3
SALARY AND WAGE INFORMATION: PROGRAM TITLE AND PROGRAM LENGTH:
Calendar Year
Graduates Available for Employment (1)
Graduates Employedin the Field (2)
Annual Salary and Wages Reported by Graduated Employed in the Field (3). Amounts are reported in 5,000 brackets. 51K + = more than 50,000 reported, finally, NR is the number of students not responding to the survey.
5K
10K
15K
20K
25K
30K
35K
40K
45K
50K
51K +
NR
2011 21 7 0 0 1 1 3 1 0 0 1 0 0 2012 6 1 0 0 1 0 0 0 0 0 0 0 0
(1) “Graduates Available for Employment” means the number of graduates minus the number of graduates unavailable for employment. Graduates unavailable for employment mean graduates, who, after graduation, died, become incarcerated, are called to active military duty, are international students that leave the United States or do not have a visa allowing employment in the United States, or are continuing their education in an accredited or bureau-approved postsecondary institution.
(2) “Graduates Employed in the Field” means graduates who are gainfully employed within six months of graduation in a position for which the skills obtained through the education and training provided by the institution are required or provided a significant advantage to the graduate in obtaining the position.
(3) “Salary” is reported by the student. Not all graduates reported salary.
Initials: ________ Date: ______ I have read and understand the above salary and wage information.
Three-Year Cohort Default Rate as Published by USDE
Percentage of EnrolledStudents Receiving FederalStudent Loans
24.5% 72%
Initials: _____ Date: ______ I have read and understand the above USDE financial aid program participation information.
The data reflected on the above charts was gathered using at least one of the following methods: Graduate Surveys, Employer Surveys, Phone Calls, Education Development Department (EDD) and State Licensing Agencies. If you have any further questions or if you want a list of employment positions determined to be within the field for any specific program for which statistics are reported above, please speak with an Admissions Representative or see the School Catalog.
This fact sheet is filed with the Bureau for Private Postsecondary Education. Regardless of any information you may have relating to completion rates, placement rates, starting salaries, or license exam passage rates, this fact sheet contains the information as calculated pursuant to state law.
Any questions a student may have regarding this fact sheet that have not been satisfactorily answered by the institution may be directed to the Bureau for Private Postsecondary Education at: P.O. Box 980818, West Sacramento, CA 95798-0818, www.bppe.ca.gov., P: 888.370.7589 or 916.431.6959, F: 916.263.1897
I have read and understand this School Performance Fact Sheet. The School Performance Fact Sheet was reviewed and discussed with a school official prior to signing an enrollment agreement.
Student Name-Print Student Signature
School Official Date

SCHOOL PERFORMANCE FACT SHEET CET Center: SAN JOSE
Student Name: _____________________________________________________________ SID No. _______________________
BPPE Fact Sheet for School Name CENTER FOR EMPLOYMENT TRAINING
Disclose by date: September 1, 2013 Street address 701 VINE STREET City, State Zip Code SAN JOSE, CA 95110
Phone number (408) 534-5456 Fax Phone (408) 294-7849
Website WWW.CETWEB.ORG
PROGRAM TITLE – PROGRAM LENGTH
Course Name Clock Hours Published Charges BUSINESS OFFICE TECHNOLOGY 900 $9307.00
COMPLETION RATES
Calendar Year
Number of Students Who Began Program (1)
Students Available for Graduation (2)
Graduates (3) Completion Rate (4)
2011 22 22 0 0.00% 2012 15 15 1 6.67%
STUDENTS COMPLETING AFTER PUBLISHED PROGRAM LENGTH--150% COMPLETION RATES
Calendar Year
Number of Students Who Began Program (1)
Students Available for Graduation (2)
150% Graduates (5)
150% Completion Rate (6)
2011 22 22 17 77.27% 2012 15 15 13 86.67%
(1) “Number of Students Who Began Program” means the number of students who began the program who are scheduled to complete the program within the reporting calendar year.
(2) “Students Available for Graduation” means the number of students who began program minus the number of students unavailable for graduation, which means those students who have died, been incarcerated, or called to active military duty.
(3) “Graduates” means the number of students who completed the program within 100% of the published program length.
(4) “Completion Rate” means the number of graduates divided by the number of Students Available for Graduation.
(5) “150% Graduates” means the number of students who completed the program within 101-150% of the published program length.
(6) “150% Completion Rate” means the number of students who completed the program in the reported calendar year within 101-150% of the published program length divided by the number of Students Available for Graduation in the published program length period.
Initials: _______ Date:_______ I have read and understand the above completion rates.

SCHOOL PERFORMANCE FACT SHEET (continued) page 2
PLACEMENT RATES
Calendar Year
Number of Students Who Began Program (1)
Number of Graduates (2)
Graduates Available for Employment(3)
Graduates Employed in the Field (4)
Placement Rate % Employedin the Field (5)
Graduates Employed in the Field an Average of less than 32 Hours per Week
Graduates Employed in the Field at least 32 Hours per Week
2011 22 0 0 0 0.00% 0 0 2012 15 1 1 1 100.00% 0 1
(1) “Number of Students Who Began Program” means the number of students who began the program who are scheduled to complete the program within the reporting calendar year.
(2) “Number of Graduates” means the number of students who have completed the program within 100% of the published program length.
(3) “Graduates Available for Employment” means the number of graduates minus the number of graduates unavailable for employment. Graduates unavailable for employment' means graduates who, after graduation, die, become incarcerated, are called to active military duty, are international students that leave the United States or do not have a visa allowing employment in the United States, or are continuing their education in an accredited or bureau-approved postsecondary institution.
(4) “Graduates Employed in the Field” means a single position for which the institution represents, the program prepare graduates, within six months after the student completes the applicable educational program. For occupations requiring passage of a licensing exam prior to employment, institutions may count the graduate if employment begins “in a single position, for which the institution represents, its program prepares its graduates within six months of the announcement of the first licensure exam results.”
(5) “Placement Rate” is calculated by dividing the number of graduates gainfully employed in the field by the number of graduates available for employment.
Initials: _________ Date: ________ I have read and understand the above placement rates.
EXAMINATION PASSAGE RATES
Calendar Year
Number of Students Taking the Exam (1)
Number Who Passed First Exam Taken (2)
Number Who Failed First Exam Taken
Passage Rate (3)
2011 N/A N/A N/A N/A % 2012 N/A N/A N/A N/A %
(1) “Number of Students Taking Exam” means the number of students who completed the program within 150% of the published program length and who took the exam in the reported calendar year for the first time.
(2) “Number Who Passed First Exam Taken” means the number of students who took and passed the licensing exam in the reported calendar year on the first attempt.
(3) “Passage Rate” is calculated by dividing the number of graduates who pass the exam the first time that they take it by the number of graduates who took the licensing exam for the first time after completion of the program.
Initials:________ Date:______ I have read and understand the above license examination rates.

___________________________ __________________________
___________________________ _________________
SCHOOL PERFORMANCE FACT SHEET (continued) page 3
SALARY AND WAGE INFORMATION: PROGRAM TITLE AND PROGRAM LENGTH:
Calendar Year
Graduates Available for Employment (1)
Graduates Employedin the Field (2)
Annual Salary and Wages Reported by Graduated Employed in the Field (3). Amounts are reported in 5,000 brackets. 51K + = more than 50,000 reported, finally, NR is the number of students not responding to the survey.
5K
10K
15K
20K
25K
30K
35K
40K
45K
50K
51K +
NR
2011 0 0 0 0 0 0 0 0 0 0 0 0 0 2012 1 1 0 0 0 0 1 0 0 0 0 0 0
(1) “Graduates Available for Employment” means the number of graduates minus the number of graduates unavailable for employment. Graduates unavailable for employment mean graduates, who, after graduation, died, become incarcerated, are called to active military duty, are international students that leave the United States or do not have a visa allowing employment in the United States, or are continuing their education in an accredited or bureau-approved postsecondary institution.
(2) “Graduates Employed in the Field” means graduates who are gainfully employed within six months of graduation in a position for which the skills obtained through the education and training provided by the institution are required or provided a significant advantage to the graduate in obtaining the position.
(3) “Salary” is reported by the student. Not all graduates reported salary.
Initials: ________ Date: ______ I have read and understand the above salary and wage information.
Three-Year Cohort Default Rate as Published by USDE
Percentage of EnrolledStudents Receiving FederalStudent Loans
24.5% 72%
Initials: _____ Date: ______ I have read and understand the above USDE financial aid program participation information.
The data reflected on the above charts was gathered using at least one of the following methods: Graduate Surveys, Employer Surveys, Phone Calls, Education Development Department (EDD) and State Licensing Agencies. If you have any further questions or if you want a list of employment positions determined to be within the field for any specific program for which statistics are reported above, please speak with an Admissions Representative or see the School Catalog.
This fact sheet is filed with the Bureau for Private Postsecondary Education. Regardless of any information you may have relating to completion rates, placement rates, starting salaries, or license exam passage rates, this fact sheet contains the information as calculated pursuant to state law.
Any questions a student may have regarding this fact sheet that have not been satisfactorily answered by the institution may be directed to the Bureau for Private Postsecondary Education at: P.O. Box 980818, West Sacramento, CA 95798-0818, www.bppe.ca.gov., P: 888.370.7589 or 916.431.6959, F: 916.263.1897
I have read and understand this School Performance Fact Sheet. The School Performance Fact Sheet was reviewed and discussed with a school official prior to signing an enrollment agreement.
Student Name-Print Student Signature
School Official Date

SCHOOL PERFORMANCE FACT SHEET CET Center: SAN JOSE
Student Name: _____________________________________________________________ SID No. _______________________
BPPE Fact Sheet for School Name CENTER FOR EMPLOYMENT TRAINING
Disclose by date: September 1, 2013 Street address 701 VINE STREET City, State Zip Code SAN JOSE, CA 95110
Phone number (408) 534-5456 Fax Phone (408) 294-7849
Website WWW.CETWEB.ORG
PROGRAM TITLE – PROGRAM LENGTH
Course Name Clock Hours Published Charges CULINARY ARTS 810 $10301.00
COMPLETION RATES
Calendar Year
Number of Students Who Began Program (1)
Students Available for Graduation (2)
Graduates (3) Completion Rate (4)
2011 89 89 21 23.60% 2012 58 58 18 31.03%
STUDENTS COMPLETING AFTER PUBLISHED PROGRAM LENGTH--150% COMPLETION RATES
Calendar Year
Number of Students Who Began Program (1)
Students Available for Graduation (2)
150% Graduates (5)
150% Completion Rate (6)
2011 89 89 55 61.80% 2012 58 58 28 48.28%
(1) “Number of Students Who Began Program” means the number of students who began the program who are scheduled to complete the program within the reporting calendar year.
(2) “Students Available for Graduation” means the number of students who began program minus the number of students unavailable for graduation, which means those students who have died, been incarcerated, or called to active military duty.
(3) “Graduates” means the number of students who completed the program within 100% of the published program length.
(4) “Completion Rate” means the number of graduates divided by the number of Students Available for Graduation.
(5) “150% Graduates” means the number of students who completed the program within 101-150% of the published program length.
(6) “150% Completion Rate” means the number of students who completed the program in the reported calendar year within 101-150% of the published program length divided by the number of Students Available for Graduation in the published program length period.
Initials: _______ Date:_______ I have read and understand the above completion rates.

SCHOOL PERFORMANCE FACT SHEET (continued) page 2
PLACEMENT RATES
Calendar Year
Number of Students Who Began Program (1)
Number of Graduates (2)
Graduates Available for Employment(3)
Graduates Employed in the Field (4)
Placement Rate % Employedin the Field (5)
Graduates Employed in the Field an Average of less than 32 Hours per Week
Graduates Employed in the Field at least 32 Hours per Week
2011 89 21 21 12 57.14% 5 7 2012 58 18 18 16 88.89% 4 12
(1) “Number of Students Who Began Program” means the number of students who began the program who are scheduled to complete the program within the reporting calendar year.
(2) “Number of Graduates” means the number of students who have completed the program within 100% of the published program length.
(3) “Graduates Available for Employment” means the number of graduates minus the number of graduates unavailable for employment. Graduates unavailable for employment' means graduates who, after graduation, die, become incarcerated, are called to active military duty, are international students that leave the United States or do not have a visa allowing employment in the United States, or are continuing their education in an accredited or bureau-approved postsecondary institution.
(4) “Graduates Employed in the Field” means a single position for which the institution represents, the program prepare graduates, within six months after the student completes the applicable educational program. For occupations requiring passage of a licensing exam prior to employment, institutions may count the graduate if employment begins “in a single position, for which the institution represents, its program prepares its graduates within six months of the announcement of the first licensure exam results.”
(5) “Placement Rate” is calculated by dividing the number of graduates gainfully employed in the field by the number of graduates available for employment.
Initials: _________ Date: ________ I have read and understand the above placement rates.
EXAMINATION PASSAGE RATES
Calendar Year
Number of Students Taking the Exam (1)
Number Who Passed First Exam Taken (2)
Number Who Failed First Exam Taken
Passage Rate (3)
2011 N/A N/A N/A N/A % 2012 N/A N/A N/A N/A %
(1) “Number of Students Taking Exam” means the number of students who completed the program within 150% of the published program length and who took the exam in the reported calendar year for the first time.
(2) “Number Who Passed First Exam Taken” means the number of students who took and passed the licensing exam in the reported calendar year on the first attempt.
(3) “Passage Rate” is calculated by dividing the number of graduates who pass the exam the first time that they take it by the number of graduates who took the licensing exam for the first time after completion of the program.
Initials:________ Date:______ I have read and understand the above license examination rates.

___________________________ __________________________
___________________________ _________________
SCHOOL PERFORMANCE FACT SHEET (continued) page 3
SALARY AND WAGE INFORMATION: PROGRAM TITLE AND PROGRAM LENGTH:
Calendar Year
Graduates Available for Employment (1)
Graduates Employedin the Field (2)
Annual Salary and Wages Reported by Graduated Employed in the Field (3). Amounts are reported in 5,000 brackets. 51K + = more than 50,000 reported, finally, NR is the number of students not responding to the survey.
5K
10K
15K
20K
25K
30K
35K
40K
45K
50K
51K +
NR
2011 21 12 0 1 4 0 5 0 1 1 0 0 0 2012 18 16 0 0 4 4 7 0 0 0 0 0 0
(1) “Graduates Available for Employment” means the number of graduates minus the number of graduates unavailable for employment. Graduates unavailable for employment mean graduates, who, after graduation, died, become incarcerated, are called to active military duty, are international students that leave the United States or do not have a visa allowing employment in the United States, or are continuing their education in an accredited or bureau-approved postsecondary institution.
(2) “Graduates Employed in the Field” means graduates who are gainfully employed within six months of graduation in a position for which the skills obtained through the education and training provided by the institution are required or provided a significant advantage to the graduate in obtaining the position.
(3) “Salary” is reported by the student. Not all graduates reported salary.
Initials: ________ Date: ______ I have read and understand the above salary and wage information.
Three-Year Cohort Default Rate as Published by USDE
Percentage of EnrolledStudents Receiving FederalStudent Loans
24.5% 72%
Initials: _____ Date: ______ I have read and understand the above USDE financial aid program participation information.
The data reflected on the above charts was gathered using at least one of the following methods: Graduate Surveys, Employer Surveys, Phone Calls, Education Development Department (EDD) and State Licensing Agencies. If you have any further questions or if you want a list of employment positions determined to be within the field for any specific program for which statistics are reported above, please speak with an Admissions Representative or see the School Catalog.
This fact sheet is filed with the Bureau for Private Postsecondary Education. Regardless of any information you may have relating to completion rates, placement rates, starting salaries, or license exam passage rates, this fact sheet contains the information as calculated pursuant to state law.
Any questions a student may have regarding this fact sheet that have not been satisfactorily answered by the institution may be directed to the Bureau for Private Postsecondary Education at: P.O. Box 980818, West Sacramento, CA 95798-0818, www.bppe.ca.gov., P: 888.370.7589 or 916.431.6959, F: 916.263.1897
I have read and understand this School Performance Fact Sheet. The School Performance Fact Sheet was reviewed and discussed with a school official prior to signing an enrollment agreement.
Student Name-Print Student Signature
School Official Date

SCHOOL PERFORMANCE FACT SHEET CET Center: SAN JOSE
Student Name: _____________________________________________________________ SID No. _______________________
BPPE Fact Sheet for School Name CENTER FOR EMPLOYMENT TRAINING
Disclose by date: September 1, 2013 Street address 701 VINE STREET City, State Zip Code SAN JOSE, CA 95110
Phone number (408) 534-5456 Fax Phone (408) 294-7849
Website WWW.CETWEB.ORG
PROGRAM TITLE – PROGRAM LENGTH
Course Name Clock Hours Published Charges EARLY CHILDHOOD TEACHERS ASSISTANT 900 $9307.00
COMPLETION RATES
Calendar Year
Number of Students Who Began Program (1)
Students Available for Graduation (2)
Graduates (3) Completion Rate (4)
2011 30 30 11 36.67% 2012 22 22 3 13.64%
STUDENTS COMPLETING AFTER PUBLISHED PROGRAM LENGTH--150% COMPLETION RATES
Calendar Year
Number of Students Who Began Program (1)
Students Available for Graduation (2)
150% Graduates (5)
150% Completion Rate (6)
2011 30 30 18 60.00% 2012 22 22 12 54.55%
(1) “Number of Students Who Began Program” means the number of students who began the program who are scheduled to complete the program within the reporting calendar year.
(2) “Students Available for Graduation” means the number of students who began program minus the number of students unavailable for graduation, which means those students who have died, been incarcerated, or called to active military duty.
(3) “Graduates” means the number of students who completed the program within 100% of the published program length.
(4) “Completion Rate” means the number of graduates divided by the number of Students Available for Graduation.
(5) “150% Graduates” means the number of students who completed the program within 101-150% of the published program length.
(6) “150% Completion Rate” means the number of students who completed the program in the reported calendar year within 101-150% of the published program length divided by the number of Students Available for Graduation in the published program length period.
Initials: _______ Date:_______ I have read and understand the above completion rates.

SCHOOL PERFORMANCE FACT SHEET (continued) page 2
PLACEMENT RATES
Calendar Year
Number of Students Who Began Program (1)
Number of Graduates (2)
Graduates Available for Employment(3)
Graduates Employed in the Field (4)
Placement Rate % Employedin the Field (5)
Graduates Employed in the Field an Average of less than 32 Hours per Week
Graduates Employed in the Field at least 32 Hours per Week
2011 30 11 11 2 18.18% 1 1 2012 22 3 3 2 66.67% 1 1
(1) “Number of Students Who Began Program” means the number of students who began the program who are scheduled to complete the program within the reporting calendar year.
(2) “Number of Graduates” means the number of students who have completed the program within 100% of the published program length.
(3) “Graduates Available for Employment” means the number of graduates minus the number of graduates unavailable for employment. Graduates unavailable for employment' means graduates who, after graduation, die, become incarcerated, are called to active military duty, are international students that leave the United States or do not have a visa allowing employment in the United States, or are continuing their education in an accredited or bureau-approved postsecondary institution.
(4) “Graduates Employed in the Field” means a single position for which the institution represents, the program prepare graduates, within six months after the student completes the applicable educational program. For occupations requiring passage of a licensing exam prior to employment, institutions may count the graduate if employment begins “in a single position, for which the institution represents, its program prepares its graduates within six months of the announcement of the first licensure exam results.”
(5) “Placement Rate” is calculated by dividing the number of graduates gainfully employed in the field by the number of graduates available for employment.
Initials: _________ Date: ________ I have read and understand the above placement rates.
EXAMINATION PASSAGE RATES
Calendar Year
Number of Students Taking the Exam (1)
Number Who Passed First Exam Taken (2)
Number Who Failed First Exam Taken
Passage Rate (3)
2011 N/A N/A N/A N/A % 2012 N/A N/A N/A N/A %
(1) “Number of Students Taking Exam” means the number of students who completed the program within 150% of the published program length and who took the exam in the reported calendar year for the first time.
(2) “Number Who Passed First Exam Taken” means the number of students who took and passed the licensing exam in the reported calendar year on the first attempt.
(3) “Passage Rate” is calculated by dividing the number of graduates who pass the exam the first time that they take it by the number of graduates who took the licensing exam for the first time after completion of the program.
Initials:________ Date:______ I have read and understand the above license examination rates.

___________________________ __________________________
___________________________ _________________
SCHOOL PERFORMANCE FACT SHEET (continued) page 3
SALARY AND WAGE INFORMATION: PROGRAM TITLE AND PROGRAM LENGTH:
Calendar Year
Graduates Available for Employment (1)
Graduates Employedin the Field (2)
Annual Salary and Wages Reported by Graduated Employed in the Field (3). Amounts are reported in 5,000 brackets. 51K + = more than 50,000 reported, finally, NR is the number of students not responding to the survey.
5K
10K
15K
20K
25K
30K
35K
40K
45K
50K
51K +
NR
2011 11 2 0 0 1 0 1 0 0 0 0 0 0 2012 3 2 0 0 1 0 1 0 0 0 0 0 0
(1) “Graduates Available for Employment” means the number of graduates minus the number of graduates unavailable for employment. Graduates unavailable for employment mean graduates, who, after graduation, died, become incarcerated, are called to active military duty, are international students that leave the United States or do not have a visa allowing employment in the United States, or are continuing their education in an accredited or bureau-approved postsecondary institution.
(2) “Graduates Employed in the Field” means graduates who are gainfully employed within six months of graduation in a position for which the skills obtained through the education and training provided by the institution are required or provided a significant advantage to the graduate in obtaining the position.
(3) “Salary” is reported by the student. Not all graduates reported salary.
Initials: ________ Date: ______ I have read and understand the above salary and wage information.
Three-Year Cohort Default Rate as Published by USDE
Percentage of EnrolledStudents Receiving FederalStudent Loans
24.5% 72%
Initials: _____ Date: ______ I have read and understand the above USDE financial aid program participation information.
The data reflected on the above charts was gathered using at least one of the following methods: Graduate Surveys, Employer Surveys, Phone Calls, Education Development Department (EDD) and State Licensing Agencies. If you have any further questions or if you want a list of employment positions determined to be within the field for any specific program for which statistics are reported above, please speak with an Admissions Representative or see the School Catalog.
This fact sheet is filed with the Bureau for Private Postsecondary Education. Regardless of any information you may have relating to completion rates, placement rates, starting salaries, or license exam passage rates, this fact sheet contains the information as calculated pursuant to state law.
Any questions a student may have regarding this fact sheet that have not been satisfactorily answered by the institution may be directed to the Bureau for Private Postsecondary Education at: P.O. Box 980818, West Sacramento, CA 95798-0818, www.bppe.ca.gov., P: 888.370.7589 or 916.431.6959, F: 916.263.1897
I have read and understand this School Performance Fact Sheet. The School Performance Fact Sheet was reviewed and discussed with a school official prior to signing an enrollment agreement.
Student Name-Print Student Signature
School Official Date

SCHOOL PERFORMANCE FACT SHEET CET Center: SAN JOSE
Student Name: _____________________________________________________________ SID No. _______________________
BPPE Fact Sheet for School Name CENTER FOR EMPLOYMENT TRAINING
Disclose by date: September 1, 2013 Street address 701 VINE STREET City, State Zip Code SAN JOSE, CA 95110
Phone number (408) 534-5456 Fax Phone (408) 294-7849
Website WWW.CETWEB.ORG
PROGRAM TITLE – PROGRAM LENGTH
Course Name Clock Hours Published Charges ELECTRICIAN (RESIDENTIAL & GENERAL) 720 $12500.00
COMPLETION RATES
Calendar Year
Number of Students Who Began Program (1)
Students Available for Graduation (2)
Graduates (3) Completion Rate (4)
2011 88 87 12 13.79% 2012 61 61 18 29.51%
STUDENTS COMPLETING AFTER PUBLISHED PROGRAM LENGTH--150% COMPLETION RATES
Calendar Year
Number of Students Who Began Program (1)
Students Available for Graduation (2)
150% Graduates (5)
150% Completion Rate (6)
2011 88 87 65 74.71% 2012 61 61 28 45.90%
(1) “Number of Students Who Began Program” means the number of students who began the program who are scheduled to complete the program within the reporting calendar year.
(2) “Students Available for Graduation” means the number of students who began program minus the number of students unavailable for graduation, which means those students who have died, been incarcerated, or called to active military duty.
(3) “Graduates” means the number of students who completed the program within 100% of the published program length.
(4) “Completion Rate” means the number of graduates divided by the number of Students Available for Graduation.
(5) “150% Graduates” means the number of students who completed the program within 101-150% of the published program length.
(6) “150% Completion Rate” means the number of students who completed the program in the reported calendar year within 101-150% of the published program length divided by the number of Students Available for Graduation in the published program length period.
Initials: _______ Date:_______ I have read and understand the above completion rates.

SCHOOL PERFORMANCE FACT SHEET (continued) page 2
PLACEMENT RATES
Calendar Year
Number of Students Who Began Program (1)
Number of Graduates (2)
Graduates Available for Employment(3)
Graduates Employed in the Field (4)
Placement Rate % Employedin the Field (5)
Graduates Employed in the Field an Average of less than 32 Hours per Week
Graduates Employed in the Field at least 32 Hours per Week
2011 88 12 12 4 33.33% 0 4 2012 61 18 18 11 61.11% 3 8
(1) “Number of Students Who Began Program” means the number of students who began the program who are scheduled to complete the program within the reporting calendar year.
(2) “Number of Graduates” means the number of students who have completed the program within 100% of the published program length.
(3) “Graduates Available for Employment” means the number of graduates minus the number of graduates unavailable for employment. Graduates unavailable for employment' means graduates who, after graduation, die, become incarcerated, are called to active military duty, are international students that leave the United States or do not have a visa allowing employment in the United States, or are continuing their education in an accredited or bureau-approved postsecondary institution.
(4) “Graduates Employed in the Field” means a single position for which the institution represents, the program prepare graduates, within six months after the student completes the applicable educational program. For occupations requiring passage of a licensing exam prior to employment, institutions may count the graduate if employment begins “in a single position, for which the institution represents, its program prepares its graduates within six months of the announcement of the first licensure exam results.”
(5) “Placement Rate” is calculated by dividing the number of graduates gainfully employed in the field by the number of graduates available for employment.
Initials: _________ Date: ________ I have read and understand the above placement rates.
EXAMINATION PASSAGE RATES
Calendar Year
Number of Students Taking the Exam (1)
Number Who Passed First Exam Taken (2)
Number Who Failed First Exam Taken
Passage Rate (3)
2011 N/A N/A N/A N/A % 2012 N/A N/A N/A N/A %
(1) “Number of Students Taking Exam” means the number of students who completed the program within 150% of the published program length and who took the exam in the reported calendar year for the first time.
(2) “Number Who Passed First Exam Taken” means the number of students who took and passed the licensing exam in the reported calendar year on the first attempt.
(3) “Passage Rate” is calculated by dividing the number of graduates who pass the exam the first time that they take it by the number of graduates who took the licensing exam for the first time after completion of the program.
Initials:________ Date:______ I have read and understand the above license examination rates.

___________________________ __________________________
___________________________ _________________
SCHOOL PERFORMANCE FACT SHEET (continued) page 3
SALARY AND WAGE INFORMATION: PROGRAM TITLE AND PROGRAM LENGTH:
Calendar Year
Graduates Available for Employment (1)
Graduates Employedin the Field (2)
Annual Salary and Wages Reported by Graduated Employed in the Field (3). Amounts are reported in 5,000 brackets. 51K + = more than 50,000 reported, finally, NR is the number of students not responding to the survey.
5K
10K
15K
20K
25K
30K
35K
40K
45K
50K
51K +
NR
2011 12 4 0 0 0 0 0 0 2 2 0 0 0 2012 18 11 0 0 0 1 4 3 3 0 1 0 0
(1) “Graduates Available for Employment” means the number of graduates minus the number of graduates unavailable for employment. Graduates unavailable for employment mean graduates, who, after graduation, died, become incarcerated, are called to active military duty, are international students that leave the United States or do not have a visa allowing employment in the United States, or are continuing their education in an accredited or bureau-approved postsecondary institution.
(2) “Graduates Employed in the Field” means graduates who are gainfully employed within six months of graduation in a position for which the skills obtained through the education and training provided by the institution are required or provided a significant advantage to the graduate in obtaining the position.
(3) “Salary” is reported by the student. Not all graduates reported salary.
Initials: ________ Date: ______ I have read and understand the above salary and wage information.
Three-Year Cohort Default Rate as Published by USDE
Percentage of EnrolledStudents Receiving FederalStudent Loans
24.5% 72%
Initials: _____ Date: ______ I have read and understand the above USDE financial aid program participation information.
The data reflected on the above charts was gathered using at least one of the following methods: Graduate Surveys, Employer Surveys, Phone Calls, Education Development Department (EDD) and State Licensing Agencies. If you have any further questions or if you want a list of employment positions determined to be within the field for any specific program for which statistics are reported above, please speak with an Admissions Representative or see the School Catalog.
This fact sheet is filed with the Bureau for Private Postsecondary Education. Regardless of any information you may have relating to completion rates, placement rates, starting salaries, or license exam passage rates, this fact sheet contains the information as calculated pursuant to state law.
Any questions a student may have regarding this fact sheet that have not been satisfactorily answered by the institution may be directed to the Bureau for Private Postsecondary Education at: P.O. Box 980818, West Sacramento, CA 95798-0818, www.bppe.ca.gov., P: 888.370.7589 or 916.431.6959, F: 916.263.1897
I have read and understand this School Performance Fact Sheet. The School Performance Fact Sheet was reviewed and discussed with a school official prior to signing an enrollment agreement.
Student Name-Print Student Signature
School Official Date

SCHOOL PERFORMANCE FACT SHEET CET Center: SAN JOSE
Student Name: _____________________________________________________________ SID No. _______________________
BPPE Fact Sheet for School Name CENTER FOR EMPLOYMENT TRAINING
Disclose by date: September 1, 2013 Street address 701 VINE STREET City, State Zip Code SAN JOSE, CA 95110
Phone number (408) 534-5456 Fax Phone (408) 294-7849
Website WWW.CETWEB.ORG
PROGRAM TITLE – PROGRAM LENGTH
Course Name Clock Hours Published Charges GREEN BUILDING CONSTRUCTION SKILLS 900 $9307.00
COMPLETION RATES
Calendar Year
Number of Students Who Began Program (1)
Students Available for Graduation (2)
Graduates (3) Completion Rate (4)
2011 93 93 15 16.13% 2012 59 59 19 32.20%
STUDENTS COMPLETING AFTER PUBLISHED PROGRAM LENGTH--150% COMPLETION RATES
Calendar Year
Number of Students Who Began Program (1)
Students Available for Graduation (2)
150% Graduates (5)
150% Completion Rate (6)
2011 93 93 63 67.74% 2012 59 59 26 44.07%
(1) “Number of Students Who Began Program” means the number of students who began the program who are scheduled to complete the program within the reporting calendar year.
(2) “Students Available for Graduation” means the number of students who began program minus the number of students unavailable for graduation, which means those students who have died, been incarcerated, or called to active military duty.
(3) “Graduates” means the number of students who completed the program within 100% of the published program length.
(4) “Completion Rate” means the number of graduates divided by the number of Students Available for Graduation.
(5) “150% Graduates” means the number of students who completed the program within 101-150% of the published program length.
(6) “150% Completion Rate” means the number of students who completed the program in the reported calendar year within 101-150% of the published program length divided by the number of Students Available for Graduation in the published program length period.
Initials: _______ Date:_______ I have read and understand the above completion rates.

SCHOOL PERFORMANCE FACT SHEET (continued) page 2
PLACEMENT RATES
Calendar Year
Number of Students Who Began Program (1)
Number of Graduates (2)
Graduates Available for Employment(3)
Graduates Employed in the Field (4)
Placement Rate % Employedin the Field (5)
Graduates Employed in the Field an Average of less than 32 Hours per Week
Graduates Employed in the Field at least 32 Hours per Week
2011 93 15 15 11 73.33% 3 8 2012 59 19 19 12 63.16% 6 6
(1) “Number of Students Who Began Program” means the number of students who began the program who are scheduled to complete the program within the reporting calendar year.
(2) “Number of Graduates” means the number of students who have completed the program within 100% of the published program length.
(3) “Graduates Available for Employment” means the number of graduates minus the number of graduates unavailable for employment. Graduates unavailable for employment' means graduates who, after graduation, die, become incarcerated, are called to active military duty, are international students that leave the United States or do not have a visa allowing employment in the United States, or are continuing their education in an accredited or bureau-approved postsecondary institution.
(4) “Graduates Employed in the Field” means a single position for which the institution represents, the program prepare graduates, within six months after the student completes the applicable educational program. For occupations requiring passage of a licensing exam prior to employment, institutions may count the graduate if employment begins “in a single position, for which the institution represents, its program prepares its graduates within six months of the announcement of the first licensure exam results.”
(5) “Placement Rate” is calculated by dividing the number of graduates gainfully employed in the field by the number of graduates available for employment.
Initials: _________ Date: ________ I have read and understand the above placement rates.
EXAMINATION PASSAGE RATES
Calendar Year
Number of Students Taking the Exam (1)
Number Who Passed First Exam Taken (2)
Number Who Failed First Exam Taken
Passage Rate (3)
2011 N/A N/A N/A N/A % 2012 N/A N/A N/A N/A %
(1) “Number of Students Taking Exam” means the number of students who completed the program within 150% of the published program length and who took the exam in the reported calendar year for the first time.
(2) “Number Who Passed First Exam Taken” means the number of students who took and passed the licensing exam in the reported calendar year on the first attempt.
(3) “Passage Rate” is calculated by dividing the number of graduates who pass the exam the first time that they take it by the number of graduates who took the licensing exam for the first time after completion of the program.
Initials:________ Date:______ I have read and understand the above license examination rates.

___________________________ __________________________
___________________________ _________________
SCHOOL PERFORMANCE FACT SHEET (continued) page 3
SALARY AND WAGE INFORMATION: PROGRAM TITLE AND PROGRAM LENGTH:
Calendar Year
Graduates Available for Employment (1)
Graduates Employedin the Field (2)
Annual Salary and Wages Reported by Graduated Employed in the Field (3). Amounts are reported in 5,000 brackets. 51K + = more than 50,000 reported, finally, NR is the number of students not responding to the survey.
5K
10K
15K
20K
25K
30K
35K
40K
45K
50K
51K +
NR
2011 15 11 0 1 1 1 1 3 2 1 0 0 1 2012 19 12 0 1 2 3 3 1 1 1 0 0 0
(1) “Graduates Available for Employment” means the number of graduates minus the number of graduates unavailable for employment. Graduates unavailable for employment mean graduates, who, after graduation, died, become incarcerated, are called to active military duty, are international students that leave the United States or do not have a visa allowing employment in the United States, or are continuing their education in an accredited or bureau-approved postsecondary institution.
(2) “Graduates Employed in the Field” means graduates who are gainfully employed within six months of graduation in a position for which the skills obtained through the education and training provided by the institution are required or provided a significant advantage to the graduate in obtaining the position.
(3) “Salary” is reported by the student. Not all graduates reported salary.
Initials: ________ Date: ______ I have read and understand the above salary and wage information.
Three-Year Cohort Default Rate as Published by USDE
Percentage of EnrolledStudents Receiving FederalStudent Loans
24.5% 72%
Initials: _____ Date: ______ I have read and understand the above USDE financial aid program participation information.
The data reflected on the above charts was gathered using at least one of the following methods: Graduate Surveys, Employer Surveys, Phone Calls, Education Development Department (EDD) and State Licensing Agencies. If you have any further questions or if you want a list of employment positions determined to be within the field for any specific program for which statistics are reported above, please speak with an Admissions Representative or see the School Catalog.
This fact sheet is filed with the Bureau for Private Postsecondary Education. Regardless of any information you may have relating to completion rates, placement rates, starting salaries, or license exam passage rates, this fact sheet contains the information as calculated pursuant to state law.
Any questions a student may have regarding this fact sheet that have not been satisfactorily answered by the institution may be directed to the Bureau for Private Postsecondary Education at: P.O. Box 980818, West Sacramento, CA 95798-0818, www.bppe.ca.gov., P: 888.370.7589 or 916.431.6959, F: 916.263.1897
I have read and understand this School Performance Fact Sheet. The School Performance Fact Sheet was reviewed and discussed with a school official prior to signing an enrollment agreement.
Student Name-Print Student Signature
School Official Date

SCHOOL PERFORMANCE FACT SHEET CET Center: SAN JOSE
Student Name: _____________________________________________________________ SID No. _______________________
BPPE Fact Sheet for School Name CENTER FOR EMPLOYMENT TRAINING
Disclose by date: September 1, 2013 Street address 701 VINE STREET City, State Zip Code SAN JOSE, CA 95110
Phone number (408) 534-5456 Fax Phone (408) 294-7849
Website WWW.CETWEB.ORG
PROGRAM TITLE – PROGRAM LENGTH
Course Name Clock Hours Published Charges HVAC TECHNICIAN and GREEN TECHNOLOGY 810 $8684.00
COMPLETION RATES
Calendar Year
Number of Students Who Began Program (1)
Students Available for Graduation (2)
Graduates (3) Completion Rate (4)
2011 24 24 15 62.50% 2012 46 46 10 21.74%
STUDENTS COMPLETING AFTER PUBLISHED PROGRAM LENGTH--150% COMPLETION RATES
Calendar Year
Number of Students Who Began Program (1)
Students Available for Graduation (2)
150% Graduates (5)
150% Completion Rate (6)
2011 24 24 6 25.00% 2012 46 46 29 63.04%
(1) “Number of Students Who Began Program” means the number of students who began the program who are scheduled to complete the program within the reporting calendar year.
(2) “Students Available for Graduation” means the number of students who began program minus the number of students unavailable for graduation, which means those students who have died, been incarcerated, or called to active military duty.
(3) “Graduates” means the number of students who completed the program within 100% of the published program length.
(4) “Completion Rate” means the number of graduates divided by the number of Students Available for Graduation.
(5) “150% Graduates” means the number of students who completed the program within 101-150% of the published program length.
(6) “150% Completion Rate” means the number of students who completed the program in the reported calendar year within 101-150% of the published program length divided by the number of Students Available for Graduation in the published program length period.
Initials: _______ Date:_______ I have read and understand the above completion rates.

SCHOOL PERFORMANCE FACT SHEET (continued) page 2
PLACEMENT RATES
Calendar Year
Number of Students Who Began Program (1)
Number of Graduates (2)
Graduates Available for Employment(3)
Graduates Employed in the Field (4)
Placement Rate % Employedin the Field (5)
Graduates Employed in the Field an Average of less than 32 Hours per Week
Graduates Employed in the Field at least 32 Hours per Week
2011 24 15 15 7 46.67% 1 6 2012 46 10 10 4 40.00% 0 4
(1) “Number of Students Who Began Program” means the number of students who began the program who are scheduled to complete the program within the reporting calendar year.
(2) “Number of Graduates” means the number of students who have completed the program within 100% of the published program length.
(3) “Graduates Available for Employment” means the number of graduates minus the number of graduates unavailable for employment. Graduates unavailable for employment' means graduates who, after graduation, die, become incarcerated, are called to active military duty, are international students that leave the United States or do not have a visa allowing employment in the United States, or are continuing their education in an accredited or bureau-approved postsecondary institution.
(4) “Graduates Employed in the Field” means a single position for which the institution represents, the program prepare graduates, within six months after the student completes the applicable educational program. For occupations requiring passage of a licensing exam prior to employment, institutions may count the graduate if employment begins “in a single position, for which the institution represents, its program prepares its graduates within six months of the announcement of the first licensure exam results.”
(5) “Placement Rate” is calculated by dividing the number of graduates gainfully employed in the field by the number of graduates available for employment.
Initials: _________ Date: ________ I have read and understand the above placement rates.
EXAMINATION PASSAGE RATES
Calendar Year
Number of Students Taking the Exam (1)
Number Who Passed First Exam Taken (2)
Number Who Failed First Exam Taken
Passage Rate (3)
2011 N/A N/A N/A N/A % 2012 N/A N/A N/A N/A %
(1) “Number of Students Taking Exam” means the number of students who completed the program within 150% of the published program length and who took the exam in the reported calendar year for the first time.
(2) “Number Who Passed First Exam Taken” means the number of students who took and passed the licensing exam in the reported calendar year on the first attempt.
(3) “Passage Rate” is calculated by dividing the number of graduates who pass the exam the first time that they take it by the number of graduates who took the licensing exam for the first time after completion of the program.
Initials:________ Date:______ I have read and understand the above license examination rates.

___________________________ __________________________
___________________________ _________________
SCHOOL PERFORMANCE FACT SHEET (continued) page 3
SALARY AND WAGE INFORMATION: PROGRAM TITLE AND PROGRAM LENGTH:
Calendar Year
Graduates Available for Employment (1)
Graduates Employedin the Field (2)
Annual Salary and Wages Reported by Graduated Employed in the Field (3). Amounts are reported in 5,000 brackets. 51K + = more than 50,000 reported, finally, NR is the number of students not responding to the survey.
5K
10K
15K
20K
25K
30K
35K
40K
45K
50K
51K +
NR
2011 15 7 0 1 0 0 2 2 1 0 0 0 1 2012 10 4 0 0 0 0 0 2 2 0 0 0 0
(1) “Graduates Available for Employment” means the number of graduates minus the number of graduates unavailable for employment. Graduates unavailable for employment mean graduates, who, after graduation, died, become incarcerated, are called to active military duty, are international students that leave the United States or do not have a visa allowing employment in the United States, or are continuing their education in an accredited or bureau-approved postsecondary institution.
(2) “Graduates Employed in the Field” means graduates who are gainfully employed within six months of graduation in a position for which the skills obtained through the education and training provided by the institution are required or provided a significant advantage to the graduate in obtaining the position.
(3) “Salary” is reported by the student. Not all graduates reported salary.
Initials: ________ Date: ______ I have read and understand the above salary and wage information.
Three-Year Cohort Default Rate as Published by USDE
Percentage of EnrolledStudents Receiving FederalStudent Loans
24.5% 72%
Initials: _____ Date: ______ I have read and understand the above USDE financial aid program participation information.
The data reflected on the above charts was gathered using at least one of the following methods: Graduate Surveys, Employer Surveys, Phone Calls, Education Development Department (EDD) and State Licensing Agencies. If you have any further questions or if you want a list of employment positions determined to be within the field for any specific program for which statistics are reported above, please speak with an Admissions Representative or see the School Catalog.
This fact sheet is filed with the Bureau for Private Postsecondary Education. Regardless of any information you may have relating to completion rates, placement rates, starting salaries, or license exam passage rates, this fact sheet contains the information as calculated pursuant to state law.
Any questions a student may have regarding this fact sheet that have not been satisfactorily answered by the institution may be directed to the Bureau for Private Postsecondary Education at: P.O. Box 980818, West Sacramento, CA 95798-0818, www.bppe.ca.gov., P: 888.370.7589 or 916.431.6959, F: 916.263.1897
I have read and understand this School Performance Fact Sheet. The School Performance Fact Sheet was reviewed and discussed with a school official prior to signing an enrollment agreement.
Student Name-Print Student Signature
School Official Date

SCHOOL PERFORMANCE FACT SHEET CET Center: SAN JOSE
Student Name: _____________________________________________________________ SID No. _______________________
BPPE Fact Sheet for School Name CENTER FOR EMPLOYMENT TRAINING
Disclose by date: September 1, 2013 Street address 701 VINE STREET City, State Zip Code SAN JOSE, CA 95110
Phone number (408) 534-5456 Fax Phone (408) 294-7849
Website WWW.CETWEB.ORG
PROGRAM TITLE – PROGRAM LENGTH
Course Name Clock Hours Published Charges MEDICAL ASSISTANT 900 $9307.00
COMPLETION RATES
Calendar Year
Number of Students Who Began Program (1)
Students Available for Graduation (2)
Graduates (3) Completion Rate (4)
2011 123 123 13 10.57% 2012 71 70 2 2.86%
STUDENTS COMPLETING AFTER PUBLISHED PROGRAM LENGTH--150% COMPLETION RATES
Calendar Year
Number of Students Who Began Program (1)
Students Available for Graduation (2)
150% Graduates (5)
150% Completion Rate (6)
2011 123 123 85 69.11% 2012 71 70 51 72.86%
(1) “Number of Students Who Began Program” means the number of students who began the program who are scheduled to complete the program within the reporting calendar year.
(2) “Students Available for Graduation” means the number of students who began program minus the number of students unavailable for graduation, which means those students who have died, been incarcerated, or called to active military duty.
(3) “Graduates” means the number of students who completed the program within 100% of the published program length.
(4) “Completion Rate” means the number of graduates divided by the number of Students Available for Graduation.
(5) “150% Graduates” means the number of students who completed the program within 101-150% of the published program length.
(6) “150% Completion Rate” means the number of students who completed the program in the reported calendar year within 101-150% of the published program length divided by the number of Students Available for Graduation in the published program length period.
Initials: _______ Date:_______ I have read and understand the above completion rates.

SCHOOL PERFORMANCE FACT SHEET (continued) page 2
PLACEMENT RATES
Calendar Year
Number of Students Who Began Program (1)
Number of Graduates (2)
Graduates Available for Employment(3)
Graduates Employed in the Field (4)
Placement Rate % Employedin the Field (5)
Graduates Employed in the Field an Average of less than 32 Hours per Week
Graduates Employed in the Field at least 32 Hours per Week
2011 123 13 13 4 30.77% 3 1 2012 71 2 2 1 50.00% 1 0
(1) “Number of Students Who Began Program” means the number of students who began the program who are scheduled to complete the program within the reporting calendar year.
(2) “Number of Graduates” means the number of students who have completed the program within 100% of the published program length.
(3) “Graduates Available for Employment” means the number of graduates minus the number of graduates unavailable for employment. Graduates unavailable for employment' means graduates who, after graduation, die, become incarcerated, are called to active military duty, are international students that leave the United States or do not have a visa allowing employment in the United States, or are continuing their education in an accredited or bureau-approved postsecondary institution.
(4) “Graduates Employed in the Field” means a single position for which the institution represents, the program prepare graduates, within six months after the student completes the applicable educational program. For occupations requiring passage of a licensing exam prior to employment, institutions may count the graduate if employment begins “in a single position, for which the institution represents, its program prepares its graduates within six months of the announcement of the first licensure exam results.”
(5) “Placement Rate” is calculated by dividing the number of graduates gainfully employed in the field by the number of graduates available for employment.
Initials: _________ Date: ________ I have read and understand the above placement rates.
EXAMINATION PASSAGE RATES
Calendar Year
Number of Students Taking the Exam (1)
Number Who Passed First Exam Taken (2)
Number Who Failed First Exam Taken
Passage Rate (3)
2011 N/A N/A N/A N/A % 2012 N/A N/A N/A N/A %
(1) “Number of Students Taking Exam” means the number of students who completed the program within 150% of the published program length and who took the exam in the reported calendar year for the first time.
(2) “Number Who Passed First Exam Taken” means the number of students who took and passed the licensing exam in the reported calendar year on the first attempt.
(3) “Passage Rate” is calculated by dividing the number of graduates who pass the exam the first time that they take it by the number of graduates who took the licensing exam for the first time after completion of the program.
Initials:________ Date:______ I have read and understand the above license examination rates.

___________________________ __________________________
___________________________ _________________
SCHOOL PERFORMANCE FACT SHEET (continued) page 3
SALARY AND WAGE INFORMATION: PROGRAM TITLE AND PROGRAM LENGTH:
Calendar Year
Graduates Available for Employment (1)
Graduates Employedin the Field (2)
Annual Salary and Wages Reported by Graduated Employed in the Field (3). Amounts are reported in 5,000 brackets. 51K + = more than 50,000 reported, finally, NR is the number of students not responding to the survey.
5K
10K
15K
20K
25K
30K
35K
40K
45K
50K
51K +
NR
2011 13 4 0 0 1 1 2 0 0 0 0 0 0 2012 2 1 0 0 0 0 1 0 0 0 0 0 0
(1) “Graduates Available for Employment” means the number of graduates minus the number of graduates unavailable for employment. Graduates unavailable for employment mean graduates, who, after graduation, died, become incarcerated, are called to active military duty, are international students that leave the United States or do not have a visa allowing employment in the United States, or are continuing their education in an accredited or bureau-approved postsecondary institution.
(2) “Graduates Employed in the Field” means graduates who are gainfully employed within six months of graduation in a position for which the skills obtained through the education and training provided by the institution are required or provided a significant advantage to the graduate in obtaining the position.
(3) “Salary” is reported by the student. Not all graduates reported salary.
Initials: ________ Date: ______ I have read and understand the above salary and wage information.
Three-Year Cohort Default Rate as Published by USDE
Percentage of EnrolledStudents Receiving FederalStudent Loans
24.5% 72%
Initials: _____ Date: ______ I have read and understand the above USDE financial aid program participation information.
The data reflected on the above charts was gathered using at least one of the following methods: Graduate Surveys, Employer Surveys, Phone Calls, Education Development Department (EDD) and State Licensing Agencies. If you have any further questions or if you want a list of employment positions determined to be within the field for any specific program for which statistics are reported above, please speak with an Admissions Representative or see the School Catalog.
This fact sheet is filed with the Bureau for Private Postsecondary Education. Regardless of any information you may have relating to completion rates, placement rates, starting salaries, or license exam passage rates, this fact sheet contains the information as calculated pursuant to state law.
Any questions a student may have regarding this fact sheet that have not been satisfactorily answered by the institution may be directed to the Bureau for Private Postsecondary Education at: P.O. Box 980818, West Sacramento, CA 95798-0818, www.bppe.ca.gov., P: 888.370.7589 or 916.431.6959, F: 916.263.1897
I have read and understand this School Performance Fact Sheet. The School Performance Fact Sheet was reviewed and discussed with a school official prior to signing an enrollment agreement.
Student Name-Print Student Signature
School Official Date

SCHOOL PERFORMANCE FACT SHEET CET Center: SAN JOSE
Student Name: _____________________________________________________________ SID No. _______________________
BPPE Fact Sheet for School Name CENTER FOR EMPLOYMENT TRAINING
Disclose by date: September 1, 2013 Street address 701 VINE STREET City, State Zip Code SAN JOSE, CA 95110
Phone number (408) 534-5456 Fax Phone (408) 294-7849
Website WWW.CETWEB.ORG
PROGRAM TITLE – PROGRAM LENGTH
Course Name Clock Hours Published Charges MEDICAL ADMINISTRATIVE ASSISTANT 720 $8060.00
COMPLETION RATES
Calendar Year
Number of Students Who Began Program (1)
Students Available for Graduation (2)
Graduates (3) Completion Rate (4)
2011 33 33 11 33.33% 2012 34 34 18 52.94%
STUDENTS COMPLETING AFTER PUBLISHED PROGRAM LENGTH--150% COMPLETION RATES
Calendar Year
Number of Students Who Began Program (1)
Students Available for Graduation (2)
150% Graduates (5)
150% Completion Rate (6)
2011 33 33 18 54.55% 2012 34 34 8 23.53%
(1) “Number of Students Who Began Program” means the number of students who began the program who are scheduled to complete the program within the reporting calendar year.
(2) “Students Available for Graduation” means the number of students who began program minus the number of students unavailable for graduation, which means those students who have died, been incarcerated, or called to active military duty.
(3) “Graduates” means the number of students who completed the program within 100% of the published program length.
(4) “Completion Rate” means the number of graduates divided by the number of Students Available for Graduation.
(5) “150% Graduates” means the number of students who completed the program within 101-150% of the published program length.
(6) “150% Completion Rate” means the number of students who completed the program in the reported calendar year within 101-150% of the published program length divided by the number of Students Available for Graduation in the published program length period.
Initials: _______ Date:_______ I have read and understand the above completion rates.

SCHOOL PERFORMANCE FACT SHEET (continued) page 2
PLACEMENT RATES
Calendar Year
Number of Students Who Began Program (1)
Number of Graduates (2)
Graduates Available for Employment(3)
Graduates Employed in the Field (4)
Placement Rate % Employedin the Field (5)
Graduates Employed in the Field an Average of less than 32 Hours per Week
Graduates Employed in the Field at least 32 Hours per Week
2011 33 11 11 2 18.18% 1 1 2012 34 18 18 4 25.00% 2 2
(1) “Number of Students Who Began Program” means the number of students who began the program who are scheduled to complete the program within the reporting calendar year.
(2) “Number of Graduates” means the number of students who have completed the program within 100% of the published program length.
(3) “Graduates Available for Employment” means the number of graduates minus the number of graduates unavailable for employment. Graduates unavailable for employment' means graduates who, after graduation, die, become incarcerated, are called to active military duty, are international students that leave the United States or do not have a visa allowing employment in the United States, or are continuing their education in an accredited or bureau-approved postsecondary institution.
(4) “Graduates Employed in the Field” means a single position for which the institution represents, the program prepare graduates, within six months after the student completes the applicable educational program. For occupations requiring passage of a licensing exam prior to employment, institutions may count the graduate if employment begins “in a single position, for which the institution represents, its program prepares its graduates within six months of the announcement of the first licensure exam results.”
(5) “Placement Rate” is calculated by dividing the number of graduates gainfully employed in the field by the number of graduates available for employment.
Initials: _________ Date: ________ I have read and understand the above placement rates.
EXAMINATION PASSAGE RATES
Calendar Year
Number of Students Taking the Exam (1)
Number Who Passed First Exam Taken (2)
Number Who Failed First Exam Taken
Passage Rate (3)
2011 N/A N/A N/A N/A % 2012 N/A N/A N/A N/A %
(1) “Number of Students Taking Exam” means the number of students who completed the program within 150% of the published program length and who took the exam in the reported calendar year for the first time.
(2) “Number Who Passed First Exam Taken” means the number of students who took and passed the licensing exam in the reported calendar year on the first attempt.
(3) “Passage Rate” is calculated by dividing the number of graduates who pass the exam the first time that they take it by the number of graduates who took the licensing exam for the first time after completion of the program.
Initials:________ Date:______ I have read and understand the above license examination rates.

___________________________ __________________________
___________________________ _________________
SCHOOL PERFORMANCE FACT SHEET (continued) page 3
SALARY AND WAGE INFORMATION: PROGRAM TITLE AND PROGRAM LENGTH:
Calendar Year
Graduates Available for Employment (1)
Graduates Employedin the Field (2)
Annual Salary and Wages Reported by Graduated Employed in the Field (3). Amounts are reported in 5,000 brackets. 51K + = more than 50,000 reported, finally, NR is the number of students not responding to the survey.
5K
10K
15K
20K
25K
30K
35K
40K
45K
50K
51K +
NR
2011 11 2 0 0 0 1 0 1 0 0 0 0 0 2012 18 4 0 0 2 2 0 0 0 0 0 0 0
(1) “Graduates Available for Employment” means the number of graduates minus the number of graduates unavailable for employment. Graduates unavailable for employment mean graduates, who, after graduation, died, become incarcerated, are called to active military duty, are international students that leave the United States or do not have a visa allowing employment in the United States, or are continuing their education in an accredited or bureau-approved postsecondary institution.
(2) “Graduates Employed in the Field” means graduates who are gainfully employed within six months of graduation in a position for which the skills obtained through the education and training provided by the institution are required or provided a significant advantage to the graduate in obtaining the position.
(3) “Salary” is reported by the student. Not all graduates reported salary.
Initials: ________ Date: ______ I have read and understand the above salary and wage information.
Three-Year Cohort Default Rate as Published by USDE
Percentage of EnrolledStudents Receiving FederalStudent Loans
24.5% 72%
Initials: _____ Date: ______ I have read and understand the above USDE financial aid program participation information.
The data reflected on the above charts was gathered using at least one of the following methods: Graduate Surveys, Employer Surveys, Phone Calls, Education Development Department (EDD) and State Licensing Agencies. If you have any further questions or if you want a list of employment positions determined to be within the field for any specific program for which statistics are reported above, please speak with an Admissions Representative or see the School Catalog.
This fact sheet is filed with the Bureau for Private Postsecondary Education. Regardless of any information you may have relating to completion rates, placement rates, starting salaries, or license exam passage rates, this fact sheet contains the information as calculated pursuant to state law.
Any questions a student may have regarding this fact sheet that have not been satisfactorily answered by the institution may be directed to the Bureau for Private Postsecondary Education at: P.O. Box 980818, West Sacramento, CA 95798-0818, www.bppe.ca.gov., P: 888.370.7589 or 916.431.6959, F: 916.263.1897
I have read and understand this School Performance Fact Sheet. The School Performance Fact Sheet was reviewed and discussed with a school official prior to signing an enrollment agreement.
Student Name-Print Student Signature
School Official Date
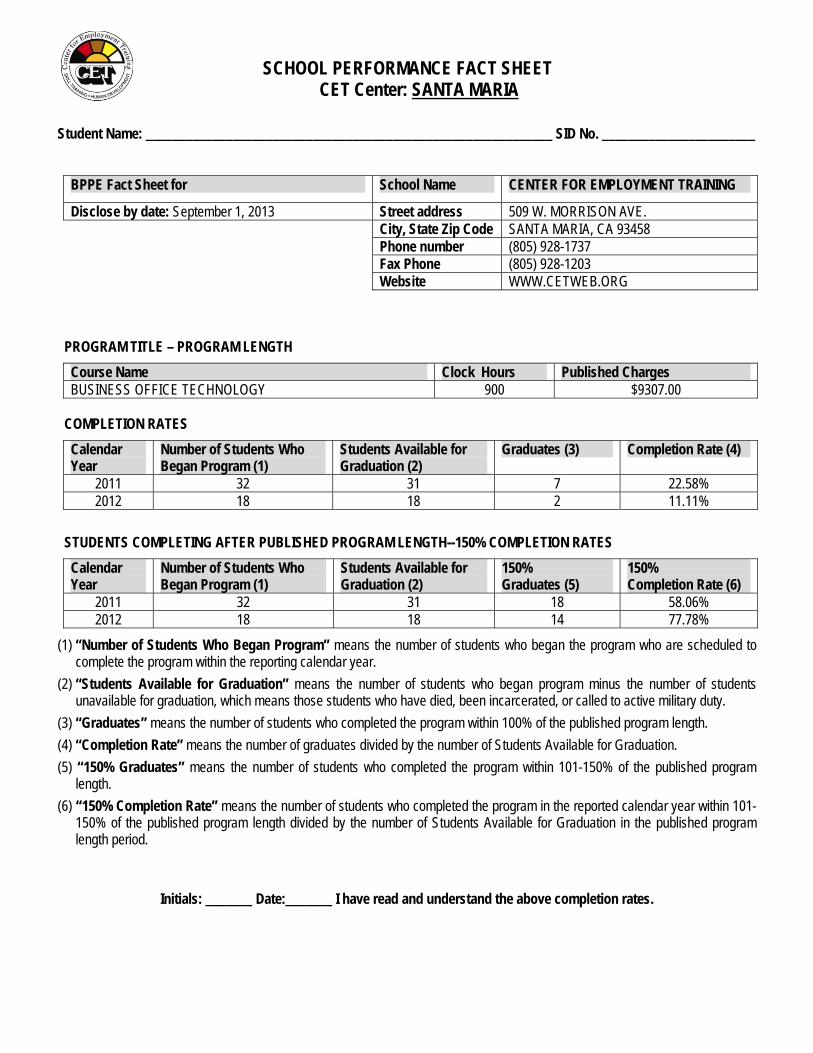
SCHOOL PERFORMANCE FACT SHEET CET Center: SANTA MARIA
Student Name: _____________________________________________________________ SID No. _______________________
BPPE Fact Sheet for School Name CENTER FOR EMPLOYMENT TRAINING
Disclose by date: September 1, 2013 Street address 509 W. MORRISON AVE. City, State Zip Code SANTA MARIA, CA 93458
Phone number (805) 928-1737 Fax Phone (805) 928-1203
Website WWW.CETWEB.ORG
PROGRAM TITLE – PROGRAM LENGTH
Course Name Clock Hours Published Charges BUSINESS OFFICE TECHNOLOGY 900 $9307.00
COMPLETION RATES
Calendar Year
Number of Students Who Began Program (1)
Students Available for Graduation (2)
Graduates (3) Completion Rate (4)
2011 32 31 7 22.58% 2012 18 18 2 11.11%
STUDENTS COMPLETING AFTER PUBLISHED PROGRAM LENGTH--150% COMPLETION RATES
Calendar Year
Number of Students Who Began Program (1)
Students Available for Graduation (2)
150% Graduates (5)
150% Completion Rate (6)
2011 32 31 18 58.06% 2012 18 18 14 77.78%
(1) “Number of Students Who Began Program” means the number of students who began the program who are scheduled to complete the program within the reporting calendar year.
(2) “Students Available for Graduation” means the number of students who began program minus the number of students unavailable for graduation, which means those students who have died, been incarcerated, or called to active military duty.
(3) “Graduates” means the number of students who completed the program within 100% of the published program length.
(4) “Completion Rate” means the number of graduates divided by the number of Students Available for Graduation.
(5) “150% Graduates” means the number of students who completed the program within 101-150% of the published program length.
(6) “150% Completion Rate” means the number of students who completed the program in the reported calendar year within 101-150% of the published program length divided by the number of Students Available for Graduation in the published program length period.
Initials: _______ Date:_______ I have read and understand the above completion rates.

SCHOOL PERFORMANCE FACT SHEET (continued) page 2
PLACEMENT RATES
Calendar Year
Number of Students Who Began Program (1)
Number of Graduates (2)
Graduates Available for Employment(3)
Graduates Employed in the Field (4)
Placement Rate % Employedin the Field (5)
Graduates Employed in the Field an Average of less than 32 Hours per Week
Graduates Employed in the Field at least 32 Hours per Week
2011 32 7 7 2 28.57% 1 1 2012 18 2 2 1 50.00% 1 0
(1) “Number of Students Who Began Program” means the number of students who began the program who are scheduled to complete the program within the reporting calendar year.
(2) “Number of Graduates” means the number of students who have completed the program within 100% of the published program length.
(3) “Graduates Available for Employment” means the number of graduates minus the number of graduates unavailable for employment. Graduates unavailable for employment' means graduates who, after graduation, die, become incarcerated, are called to active military duty, are international students that leave the United States or do not have a visa allowing employment in the United States, or are continuing their education in an accredited or bureau-approved postsecondary institution.
(4) “Graduates Employed in the Field” means a single position for which the institution represents, the program prepare graduates, within six months after the student completes the applicable educational program. For occupations requiring passage of a licensing exam prior to employment, institutions may count the graduate if employment begins “in a single position, for which the institution represents, its program prepares its graduates within six months of the announcement of the first licensure exam results.”
(5) “Placement Rate” is calculated by dividing the number of graduates gainfully employed in the field by the number of graduates available for employment.
Initials: _________ Date: ________ I have read and understand the above placement rates.
EXAMINATION PASSAGE RATES
Calendar Year
Number of Students Taking the Exam (1)
Number Who Passed First Exam Taken (2)
Number Who Failed First Exam Taken
Passage Rate (3)
2011 N/A N/A N/A N/A % 2012 N/A N/A N/A N/A %
(1) “Number of Students Taking Exam” means the number of students who completed the program within 150% of the published program length and who took the exam in the reported calendar year for the first time.
(2) “Number Who Passed First Exam Taken” means the number of students who took and passed the licensing exam in the reported calendar year on the first attempt.
(3) “Passage Rate” is calculated by dividing the number of graduates who pass the exam the first time that they take it by the number of graduates who took the licensing exam for the first time after completion of the program.
Initials:________ Date:______ I have read and understand the above license examination rates.

___________________________ __________________________
___________________________ _________________
SCHOOL PERFORMANCE FACT SHEET (continued) page 3
SALARY AND WAGE INFORMATION: PROGRAM TITLE AND PROGRAM LENGTH:
Calendar Year
Graduates Available for Employment (1)
Graduates Employedin the Field (2)
Annual Salary and Wages Reported by Graduated Employed in the Field (3). Amounts are reported in 5,000 brackets. 51K + = more than 50,000 reported, finally, NR is the number of students not responding to the survey.
5K
10K
15K
20K
25K
30K
35K
40K
45K
50K
51K +
NR
2011 7 2 0 1 0 0 1 0 0 0 0 0 0 2012 2 1 0 0 0 1 0 0 0 0 0 0 0
(1) “Graduates Available for Employment” means the number of graduates minus the number of graduates unavailable for employment. Graduates unavailable for employment mean graduates, who, after graduation, died, become incarcerated, are called to active military duty, are international students that leave the United States or do not have a visa allowing employment in the United States, or are continuing their education in an accredited or bureau-approved postsecondary institution.
(2) “Graduates Employed in the Field” means graduates who are gainfully employed within six months of graduation in a position for which the skills obtained through the education and training provided by the institution are required or provided a significant advantage to the graduate in obtaining the position.
(3) “Salary” is reported by the student. Not all graduates reported salary.
Initials: ________ Date: ______ I have read and understand the above salary and wage information.
Three-Year Cohort Default Rate as Published by USDE
Percentage of EnrolledStudents Receiving FederalStudent Loans
24.5% 72%
Initials: _____ Date: ______ I have read and understand the above USDE financial aid program participation information.
The data reflected on the above charts was gathered using at least one of the following methods: Graduate Surveys, Employer Surveys, Phone Calls, Education Development Department (EDD) and State Licensing Agencies. If you have any further questions or if you want a list of employment positions determined to be within the field for any specific program for which statistics are reported above, please speak with an Admissions Representative or see the School Catalog.
This fact sheet is filed with the Bureau for Private Postsecondary Education. Regardless of any information you may have relating to completion rates, placement rates, starting salaries, or license exam passage rates, this fact sheet contains the information as calculated pursuant to state law.
Any questions a student may have regarding this fact sheet that have not been satisfactorily answered by the institution may be directed to the Bureau for Private Postsecondary Education at: P.O. Box 980818, West Sacramento, CA 95798-0818, www.bppe.ca.gov., P: 888.370.7589 or 916.431.6959, F: 916.263.1897
I have read and understand this School Performance Fact Sheet. The School Performance Fact Sheet was reviewed and discussed with a school official prior to signing an enrollment agreement.
Student Name-Print Student Signature
School Official Date

SCHOOL PERFORMANCE FACT SHEET CET Center: SANTA MARIA
Student Name: _____________________________________________________________ SID No. _______________________
BPPE Fact Sheet for School Name CENTER FOR EMPLOYMENT TRAINING
Disclose by date: September 1, 2013 Street address 509 W. MORRISON AVE. City, State Zip Code SANTA MARIA, CA 93458
Phone number (805) 928-1737 Fax Phone (805) 928-1203
Website WWW.CETWEB.ORG
PROGRAM TITLE – PROGRAM LENGTH
Course Name Clock Hours Published Charges GREEN BUILDING CONSTRUCTION SKILLS 900 $9307.00
COMPLETION RATES
Calendar Year
Number of Students Who Began Program (1)
Students Available for Graduation (2)
Graduates (3) Completion Rate (4)
2011 46 43 4 9.30% 2012 23 23 2 8.70%
STUDENTS COMPLETING AFTER PUBLISHED PROGRAM LENGTH--150% COMPLETION RATES
Calendar Year
Number of Students Who Began Program (1)
Students Available for Graduation (2)
150% Graduates (5)
150% Completion Rate (6)
2011 46 43 27 62.79% 2012 23 23 18 78.26%
(1) “Number of Students Who Began Program” means the number of students who began the program who are scheduled to complete the program within the reporting calendar year.
(2) “Students Available for Graduation” means the number of students who began program minus the number of students unavailable for graduation, which means those students who have died, been incarcerated, or called to active military duty.
(3) “Graduates” means the number of students who completed the program within 100% of the published program length.
(4) “Completion Rate” means the number of graduates divided by the number of Students Available for Graduation.
(5) “150% Graduates” means the number of students who completed the program within 101-150% of the published program length.
(6) “150% Completion Rate” means the number of students who completed the program in the reported calendar year within 101-150% of the published program length divided by the number of Students Available for Graduation in the published program length period.
Initials: _______ Date:_______ I have read and understand the above completion rates.

SCHOOL PERFORMANCE FACT SHEET (continued) page 2
PLACEMENT RATES
Calendar Year
Number of Students Who Began Program (1)
Number of Graduates (2)
Graduates Available for Employment(3)
Graduates Employed in the Field (4)
Placement Rate % Employedin the Field (5)
Graduates Employed in the Field an Average of less than 32 Hours per Week
Graduates Employed in the Field at least 32 Hours per Week
2011 46 4 4 2 50.00% 0 2 2012 23 2 2 2 100.00% 1 1
(1) “Number of Students Who Began Program” means the number of students who began the program who are scheduled to complete the program within the reporting calendar year.
(2) “Number of Graduates” means the number of students who have completed the program within 100% of the published program length.
(3) “Graduates Available for Employment” means the number of graduates minus the number of graduates unavailable for employment. Graduates unavailable for employment' means graduates who, after graduation, die, become incarcerated, are called to active military duty, are international students that leave the United States or do not have a visa allowing employment in the United States, or are continuing their education in an accredited or bureau-approved postsecondary institution.
(4) “Graduates Employed in the Field” means a single position for which the institution represents, the program prepare graduates, within six months after the student completes the applicable educational program. For occupations requiring passage of a licensing exam prior to employment, institutions may count the graduate if employment begins “in a single position, for which the institution represents, its program prepares its graduates within six months of the announcement of the first licensure exam results.”
(5) “Placement Rate” is calculated by dividing the number of graduates gainfully employed in the field by the number of graduates available for employment.
Initials: _________ Date: ________ I have read and understand the above placement rates.
EXAMINATION PASSAGE RATES
Calendar Year
Number of Students Taking the Exam (1)
Number Who Passed First Exam Taken (2)
Number Who Failed First Exam Taken
Passage Rate (3)
2011 N/A N/A N/A N/A % 2012 N/A N/A N/A N/A %
(1) “Number of Students Taking Exam” means the number of students who completed the program within 150% of the published program length and who took the exam in the reported calendar year for the first time.
(2) “Number Who Passed First Exam Taken” means the number of students who took and passed the licensing exam in the reported calendar year on the first attempt.
(3) “Passage Rate” is calculated by dividing the number of graduates who pass the exam the first time that they take it by the number of graduates who took the licensing exam for the first time after completion of the program.
Initials:________ Date:______ I have read and understand the above license examination rates.

___________________________ __________________________
___________________________ _________________
SCHOOL PERFORMANCE FACT SHEET (continued) page 3
SALARY AND WAGE INFORMATION: PROGRAM TITLE AND PROGRAM LENGTH:
Calendar Year
Graduates Available for Employment (1)
Graduates Employedin the Field (2)
Annual Salary and Wages Reported by Graduated Employed in the Field (3). Amounts are reported in 5,000 brackets. 51K + = more than 50,000 reported, finally, NR is the number of students not responding to the survey.
5K
10K
15K
20K
25K
30K
35K
40K
45K
50K
51K +
NR
2011 4 2 0 0 0 1 0 0 0 1 0 0 0 2012 2 2 0 0 0 1 0 0 0 0 0 0 1
(1) “Graduates Available for Employment” means the number of graduates minus the number of graduates unavailable for employment. Graduates unavailable for employment mean graduates, who, after graduation, died, become incarcerated, are called to active military duty, are international students that leave the United States or do not have a visa allowing employment in the United States, or are continuing their education in an accredited or bureau-approved postsecondary institution.
(2) “Graduates Employed in the Field” means graduates who are gainfully employed within six months of graduation in a position for which the skills obtained through the education and training provided by the institution are required or provided a significant advantage to the graduate in obtaining the position.
(3) “Salary” is reported by the student. Not all graduates reported salary.
Initials: ________ Date: ______ I have read and understand the above salary and wage information.
Three-Year Cohort Default Rate as Published by USDE
Percentage of EnrolledStudents Receiving FederalStudent Loans
24.5% 72%
Initials: _____ Date: ______ I have read and understand the above USDE financial aid program participation information.
The data reflected on the above charts was gathered using at least one of the following methods: Graduate Surveys, Employer Surveys, Phone Calls, Education Development Department (EDD) and State Licensing Agencies. If you have any further questions or if you want a list of employment positions determined to be within the field for any specific program for which statistics are reported above, please speak with an Admissions Representative or see the School Catalog.
This fact sheet is filed with the Bureau for Private Postsecondary Education. Regardless of any information you may have relating to completion rates, placement rates, starting salaries, or license exam passage rates, this fact sheet contains the information as calculated pursuant to state law.
Any questions a student may have regarding this fact sheet that have not been satisfactorily answered by the institution may be directed to the Bureau for Private Postsecondary Education at: P.O. Box 980818, West Sacramento, CA 95798-0818, www.bppe.ca.gov., P: 888.370.7589 or 916.431.6959, F: 916.263.1897
I have read and understand this School Performance Fact Sheet. The School Performance Fact Sheet was reviewed and discussed with a school official prior to signing an enrollment agreement.
Student Name-Print Student Signature
School Official Date

SCHOOL PERFORMANCE FACT SHEET CET Center: SANTA MARIA
Student Name: _____________________________________________________________ SID No. _______________________
BPPE Fact Sheet for School Name CENTER FOR EMPLOYMENT TRAINING
Disclose by date: September 1, 2013 Street address 509 W. MORRISON AVE. City, State Zip Code SANTA MARIA, CA 93458
Phone number (805) 928-1737 Fax Phone (805) 928-1203
Website WWW.CETWEB.ORG
PROGRAM TITLE – PROGRAM LENGTH
Course Name Clock Hours Published Charges MEDICAL ASSISTANT 900 $9307.00
COMPLETION RATES
Calendar Year
Number of Students Who Began Program (1)
Students Available for Graduation (2)
Graduates (3) Completion Rate (4)
2011 86 85 10 11.76% 2012 54 54 4 7.41%
STUDENTS COMPLETING AFTER PUBLISHED PROGRAM LENGTH--150% COMPLETION RATES
Calendar Year
Number of Students Who Began Program (1)
Students Available for Graduation (2)
150% Graduates (5)
150% Completion Rate (6)
2011 86 85 51 60.00% 2012 54 54 34 62.96%
(1) “Number of Students Who Began Program” means the number of students who began the program who are scheduled to complete the program within the reporting calendar year.
(2) “Students Available for Graduation” means the number of students who began program minus the number of students unavailable for graduation, which means those students who have died, been incarcerated, or called to active military duty.
(3) “Graduates” means the number of students who completed the program within 100% of the published program length.
(4) “Completion Rate” means the number of graduates divided by the number of Students Available for Graduation.
(5) “150% Graduates” means the number of students who completed the program within 101-150% of the published program length.
(6) “150% Completion Rate” means the number of students who completed the program in the reported calendar year within 101-150% of the published program length divided by the number of Students Available for Graduation in the published program length period.
Initials: _______ Date:_______ I have read and understand the above completion rates.

SCHOOL PERFORMANCE FACT SHEET (continued) page 2
PLACEMENT RATES
Calendar Year
Number of Students Who Began Program (1)
Number of Graduates (2)
Graduates Available for Employment(3)
Graduates Employed in the Field (4)
Placement Rate % Employedin the Field (5)
Graduates Employed in the Field an Average of less than 32 Hours per Week
Graduates Employed in the Field at least 32 Hours per Week
2011 86 10 10 7 70.00% 3 4 2012 54 4 4 3 75.00% 0 3
(1) “Number of Students Who Began Program” means the number of students who began the program who are scheduled to complete the program within the reporting calendar year.
(2) “Number of Graduates” means the number of students who have completed the program within 100% of the published program length.
(3) “Graduates Available for Employment” means the number of graduates minus the number of graduates unavailable for employment. Graduates unavailable for employment' means graduates who, after graduation, die, become incarcerated, are called to active military duty, are international students that leave the United States or do not have a visa allowing employment in the United States, or are continuing their education in an accredited or bureau-approved postsecondary institution.
(4) “Graduates Employed in the Field” means a single position for which the institution represents, the program prepare graduates, within six months after the student completes the applicable educational program. For occupations requiring passage of a licensing exam prior to employment, institutions may count the graduate if employment begins “in a single position, for which the institution represents, its program prepares its graduates within six months of the announcement of the first licensure exam results.”
(5) “Placement Rate” is calculated by dividing the number of graduates gainfully employed in the field by the number of graduates available for employment.
Initials: _________ Date: ________ I have read and understand the above placement rates.
EXAMINATION PASSAGE RATES
Calendar Year
Number of Students Taking the Exam (1)
Number Who Passed First Exam Taken (2)
Number Who Failed First Exam Taken
Passage Rate (3)
2011 N/A N/A N/A N/A % 2012 N/A N/A N/A N/A %
(1) “Number of Students Taking Exam” means the number of students who completed the program within 150% of the published program length and who took the exam in the reported calendar year for the first time.
(2) “Number Who Passed First Exam Taken” means the number of students who took and passed the licensing exam in the reported calendar year on the first attempt.
(3) “Passage Rate” is calculated by dividing the number of graduates who pass the exam the first time that they take it by the number of graduates who took the licensing exam for the first time after completion of the program.
Initials:________ Date:______ I have read and understand the above license examination rates.
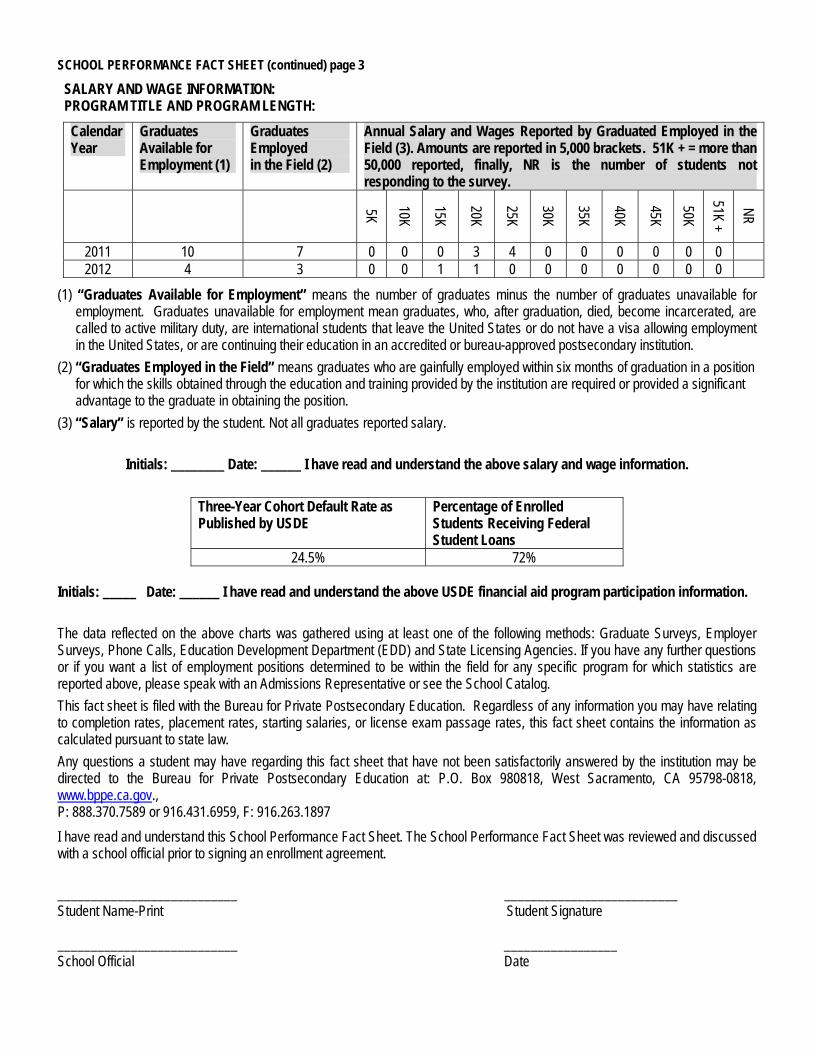
___________________________ __________________________
___________________________ _________________
SCHOOL PERFORMANCE FACT SHEET (continued) page 3
SALARY AND WAGE INFORMATION: PROGRAM TITLE AND PROGRAM LENGTH:
Calendar Year
Graduates Available for Employment (1)
Graduates Employedin the Field (2)
Annual Salary and Wages Reported by Graduated Employed in the Field (3). Amounts are reported in 5,000 brackets. 51K + = more than 50,000 reported, finally, NR is the number of students not responding to the survey.
5K
10K
15K
20K
25K
30K
35K
40K
45K
50K
51K +
NR
2011 10 7 0 0 0 3 4 0 0 0 0 0 0 2012 4 3 0 0 1 1 0 0 0 0 0 0 0
(1) “Graduates Available for Employment” means the number of graduates minus the number of graduates unavailable for employment. Graduates unavailable for employment mean graduates, who, after graduation, died, become incarcerated, are called to active military duty, are international students that leave the United States or do not have a visa allowing employment in the United States, or are continuing their education in an accredited or bureau-approved postsecondary institution.
(2) “Graduates Employed in the Field” means graduates who are gainfully employed within six months of graduation in a position for which the skills obtained through the education and training provided by the institution are required or provided a significant advantage to the graduate in obtaining the position.
(3) “Salary” is reported by the student. Not all graduates reported salary.
Initials: ________ Date: ______ I have read and understand the above salary and wage information.
Three-Year Cohort Default Rate as Published by USDE
Percentage of EnrolledStudents Receiving FederalStudent Loans
24.5% 72%
Initials: _____ Date: ______ I have read and understand the above USDE financial aid program participation information.
The data reflected on the above charts was gathered using at least one of the following methods: Graduate Surveys, Employer Surveys, Phone Calls, Education Development Department (EDD) and State Licensing Agencies. If you have any further questions or if you want a list of employment positions determined to be within the field for any specific program for which statistics are reported above, please speak with an Admissions Representative or see the School Catalog.
This fact sheet is filed with the Bureau for Private Postsecondary Education. Regardless of any information you may have relating to completion rates, placement rates, starting salaries, or license exam passage rates, this fact sheet contains the information as calculated pursuant to state law.
Any questions a student may have regarding this fact sheet that have not been satisfactorily answered by the institution may be directed to the Bureau for Private Postsecondary Education at: P.O. Box 980818, West Sacramento, CA 95798-0818, www.bppe.ca.gov., P: 888.370.7589 or 916.431.6959, F: 916.263.1897
I have read and understand this School Performance Fact Sheet. The School Performance Fact Sheet was reviewed and discussed with a school official prior to signing an enrollment agreement.
Student Name-Print Student Signature
School Official Date

SCHOOL PERFORMANCE FACT SHEET CET Center: SANTA MARIA
Student Name: _____________________________________________________________ SID No. _______________________
BPPE Fact Sheet for School Name CENTER FOR EMPLOYMENT TRAINING
Disclose by date: September 1, 2013 Street address 509 W. MORRISON AVE. City, State Zip Code SANTA MARIA, CA 93458
Phone number (805) 928-1737 Fax Phone (805) 928-1203
Website WWW.CETWEB.ORG
PROGRAM TITLE – PROGRAM LENGTH
Course Name Clock Hours Published Charges TRUCK DRIVER 630 $8779.00
COMPLETION RATES
Calendar Year
Number of Students Who Began Program (1)
Students Available for Graduation (2)
Graduates (3) Completion Rate (4)
2011 14 14 9 64.29% 2012 22 22 15 68.18%
STUDENTS COMPLETING AFTER PUBLISHED PROGRAM LENGTH--150% COMPLETION RATES
Calendar Year
Number of Students Who Began Program (1)
Students Available for Graduation (2)
150% Graduates (5)
150% Completion Rate (6)
2011 14 14 5 35.71% 2012 22 22 7 31.82%
(1) “Number of Students Who Began Program” means the number of students who began the program who are scheduled to complete the program within the reporting calendar year.
(2) “Students Available for Graduation” means the number of students who began program minus the number of students unavailable for graduation, which means those students who have died, been incarcerated, or called to active military duty.
(3) “Graduates” means the number of students who completed the program within 100% of the published program length.
(4) “Completion Rate” means the number of graduates divided by the number of Students Available for Graduation.
(5) “150% Graduates” means the number of students who completed the program within 101-150% of the published program length.
(6) “150% Completion Rate” means the number of students who completed the program in the reported calendar year within 101-150% of the published program length divided by the number of Students Available for Graduation in the published program length period.
Initials: _______ Date:_______ I have read and understand the above completion rates.

SCHOOL PERFORMANCE FACT SHEET (continued) page 2
PLACEMENT RATES
Calendar Year
Number of Students Who Began Program (1)
Number of Graduates (2)
Graduates Available for Employment(3)
Graduates Employed in the Field (4)
Placement Rate % Employedin the Field (5)
Graduates Employed in the Field an Average of less than 32 Hours per Week
Graduates Employed in the Field at least 32 Hours per Week
2011 14 9 9 6 66.67% 1 5 2012 22 15 15 12 80.00% 1 11
(1) “Number of Students Who Began Program” means the number of students who began the program who are scheduled to complete the program within the reporting calendar year.
(2) “Number of Graduates” means the number of students who have completed the program within 100% of the published program length.
(3) “Graduates Available for Employment” means the number of graduates minus the number of graduates unavailable for employment. Graduates unavailable for employment' means graduates who, after graduation, die, become incarcerated, are called to active military duty, are international students that leave the United States or do not have a visa allowing employment in the United States, or are continuing their education in an accredited or bureau-approved postsecondary institution.
(4) “Graduates Employed in the Field” means a single position for which the institution represents, the program prepare graduates, within six months after the student completes the applicable educational program. For occupations requiring passage of a licensing exam prior to employment, institutions may count the graduate if employment begins “in a single position, for which the institution represents, its program prepares its graduates within six months of the announcement of the first licensure exam results.”
(5) “Placement Rate” is calculated by dividing the number of graduates gainfully employed in the field by the number of graduates available for employment.
Initials: _________ Date: ________ I have read and understand the above placement rates.
EXAMINATION PASSAGE RATES
Calendar Year
Number of Students Taking the Exam (1)
Number Who Passed First Exam Taken (2)
Number Who Failed First Exam Taken
Passage Rate (3)
2011 N/A N/A N/A N/A % 2012 N/A N/A N/A N/A %
(1) “Number of Students Taking Exam” means the number of students who completed the program within 150% of the published program length and who took the exam in the reported calendar year for the first time.
(2) “Number Who Passed First Exam Taken” means the number of students who took and passed the licensing exam in the reported calendar year on the first attempt.
(3) “Passage Rate” is calculated by dividing the number of graduates who pass the exam the first time that they take it by the number of graduates who took the licensing exam for the first time after completion of the program.
Initials:________ Date:______ I have read and understand the above license examination rates.

___________________________ __________________________
___________________________ _________________
SCHOOL PERFORMANCE FACT SHEET (continued) page 3
SALARY AND WAGE INFORMATION: PROGRAM TITLE AND PROGRAM LENGTH:
Calendar Year
Graduates Available for Employment (1)
Graduates Employedin the Field (2)
Annual Salary and Wages Reported by Graduated Employed in the Field (3). Amounts are reported in 5,000 brackets. 51K + = more than 50,000 reported, finally, NR is the number of students not responding to the survey.
5K
10K
15K
20K
25K
30K
35K
40K
45K
50K
51K +
NR
2011 9 6 0 0 0 2 2 1 0 1 0 0 0 2012 15 12 0 0 0 1 6 3 3 0 1 0 0
(1) “Graduates Available for Employment” means the number of graduates minus the number of graduates unavailable for employment. Graduates unavailable for employment mean graduates, who, after graduation, died, become incarcerated, are called to active military duty, are international students that leave the United States or do not have a visa allowing employment in the United States, or are continuing their education in an accredited or bureau-approved postsecondary institution.
(2) “Graduates Employed in the Field” means graduates who are gainfully employed within six months of graduation in a position for which the skills obtained through the education and training provided by the institution are required or provided a significant advantage to the graduate in obtaining the position.
(3) “Salary” is reported by the student. Not all graduates reported salary.
Initials: ________ Date: ______ I have read and understand the above salary and wage information.
Three-Year Cohort Default Rate as Published by USDE
Percentage of EnrolledStudents Receiving FederalStudent Loans
24.5% 72%
Initials: _____ Date: ______ I have read and understand the above USDE financial aid program participation information.
The data reflected on the above charts was gathered using at least one of the following methods: Graduate Surveys, Employer Surveys, Phone Calls, Education Development Department (EDD) and State Licensing Agencies. If you have any further questions or if you want a list of employment positions determined to be within the field for any specific program for which statistics are reported above, please speak with an Admissions Representative or see the School Catalog.
This fact sheet is filed with the Bureau for Private Postsecondary Education. Regardless of any information you may have relating to completion rates, placement rates, starting salaries, or license exam passage rates, this fact sheet contains the information as calculated pursuant to state law.
Any questions a student may have regarding this fact sheet that have not been satisfactorily answered by the institution may be directed to the Bureau for Private Postsecondary Education at: P.O. Box 980818, West Sacramento, CA 95798-0818, www.bppe.ca.gov., P: 888.370.7589 or 916.431.6959, F: 916.263.1897
I have read and understand this School Performance Fact Sheet. The School Performance Fact Sheet was reviewed and discussed with a school official prior to signing an enrollment agreement.
Student Name-Print Student Signature
School Official Date

SCHOOL PERFORMANCE FACT SHEET CET Center: SOLEDAD
Student Name: _____________________________________________________________ SID No. _______________________
BPPE Fact Sheet for School Name CENTER FOR EMPLOYMENT TRAINING
Disclose by date: September 1, 2013 Street address 930 LOS COCHES DR. City, State Zip Code SOLEDAD, CA 93960
Phone number (831) 678-0448 Fax Phone (831) 678-0592
Website WWW.CETWEB.ORG
PROGRAM TITLE – PROGRAM LENGTH
Course Name Clock Hours Published Charges GREEN BUILDING CONSTRUCTION SKILLS 900 $9307.00
COMPLETION RATES
Calendar Year
Number of Students Who Began Program (1)
Students Available for Graduation (2)
Graduates (3) Completion Rate (4)
2011 20 20 7 35.00% 2012 16 16 8 50.00%
STUDENTS COMPLETING AFTER PUBLISHED PROGRAM LENGTH--150% COMPLETION RATES
Calendar Year
Number of Students Who Began Program (1)
Students Available for Graduation (2)
150% Graduates (5)
150% Completion Rate (6)
2011 20 20 11 55.00% 2012 16 16 6 37.50%
(1) “Number of Students Who Began Program” means the number of students who began the program who are scheduled to complete the program within the reporting calendar year.
(2) “Students Available for Graduation” means the number of students who began program minus the number of students unavailable for graduation, which means those students who have died, been incarcerated, or called to active military duty.
(3) “Graduates” means the number of students who completed the program within 100% of the published program length.
(4) “Completion Rate” means the number of graduates divided by the number of Students Available for Graduation.
(5) “150% Graduates” means the number of students who completed the program within 101-150% of the published program length.
(6) “150% Completion Rate” means the number of students who completed the program in the reported calendar year within 101-150% of the published program length divided by the number of Students Available for Graduation in the published program length period.
Initials: _______ Date:_______ I have read and understand the above completion rates.

SCHOOL PERFORMANCE FACT SHEET (continued) page 2
PLACEMENT RATES
Calendar Year
Number of Students Who Began Program (1)
Number of Graduates (2)
Graduates Available for Employment(3)
Graduates Employed in the Field (4)
Placement Rate % Employedin the Field (5)
Graduates Employed in the Field an Average of less than 32 Hours per Week
Graduates Employed in the Field at least 32 Hours per Week
2011 20 7 7 1 14.29% 0 1 2012 16 8 8 3 37.50% 0 3
(1) “Number of Students Who Began Program” means the number of students who began the program who are scheduled to complete the program within the reporting calendar year.
(2) “Number of Graduates” means the number of students who have completed the program within 100% of the published program length.
(3) “Graduates Available for Employment” means the number of graduates minus the number of graduates unavailable for employment. Graduates unavailable for employment' means graduates who, after graduation, die, become incarcerated, are called to active military duty, are international students that leave the United States or do not have a visa allowing employment in the United States, or are continuing their education in an accredited or bureau-approved postsecondary institution.
(4) “Graduates Employed in the Field” means a single position for which the institution represents, the program prepare graduates, within six months after the student completes the applicable educational program. For occupations requiring passage of a licensing exam prior to employment, institutions may count the graduate if employment begins “in a single position, for which the institution represents, its program prepares its graduates within six months of the announcement of the first licensure exam results.”
(5) “Placement Rate” is calculated by dividing the number of graduates gainfully employed in the field by the number of graduates available for employment.
Initials: _________ Date: ________ I have read and understand the above placement rates.
EXAMINATION PASSAGE RATES
Calendar Year
Number of Students Taking the Exam (1)
Number Who Passed First Exam Taken (2)
Number Who Failed First Exam Taken
Passage Rate (3)
2011 N/A N/A N/A N/A % 2012 N/A N/A N/A N/A %
(1) “Number of Students Taking Exam” means the number of students who completed the program within 150% of the published program length and who took the exam in the reported calendar year for the first time.
(2) “Number Who Passed First Exam Taken” means the number of students who took and passed the licensing exam in the reported calendar year on the first attempt.
(3) “Passage Rate” is calculated by dividing the number of graduates who pass the exam the first time that they take it by the number of graduates who took the licensing exam for the first time after completion of the program.
Initials:________ Date:______ I have read and understand the above license examination rates.

___________________________ __________________________
___________________________ _________________
SCHOOL PERFORMANCE FACT SHEET (continued) page 3
SALARY AND WAGE INFORMATION: PROGRAM TITLE AND PROGRAM LENGTH:
Calendar Year
Graduates Available for Employment (1)
Graduates Employedin the Field (2)
Annual Salary and Wages Reported by Graduated Employed in the Field (3). Amounts are reported in 5,000 brackets. 51K + = more than 50,000 reported, finally, NR is the number of students not responding to the survey.
5K
10K
15K
20K
25K
30K
35K
40K
45K
50K
51K +
NR
2011 7 1 0 0 0 1 0 0 0 0 0 0 0 2012 8 3 0 0 0 0 0 2 2 0 0 0 0
(1) “Graduates Available for Employment” means the number of graduates minus the number of graduates unavailable for employment. Graduates unavailable for employment mean graduates, who, after graduation, died, become incarcerated, are called to active military duty, are international students that leave the United States or do not have a visa allowing employment in the United States, or are continuing their education in an accredited or bureau-approved postsecondary institution.
(2) “Graduates Employed in the Field” means graduates who are gainfully employed within six months of graduation in a position for which the skills obtained through the education and training provided by the institution are required or provided a significant advantage to the graduate in obtaining the position.
(3) “Salary” is reported by the student. Not all graduates reported salary.
Initials: ________ Date: ______ I have read and understand the above salary and wage information.
Three-Year Cohort Default Rate as Published by USDE
Percentage of EnrolledStudents Receiving FederalStudent Loans
24.5% 72%
Initials: _____ Date: ______ I have read and understand the above USDE financial aid program participation information.
The data reflected on the above charts was gathered using at least one of the following methods: Graduate Surveys, Employer Surveys, Phone Calls, Education Development Department (EDD) and State Licensing Agencies. If you have any further questions or if you want a list of employment positions determined to be within the field for any specific program for which statistics are reported above, please speak with an Admissions Representative or see the School Catalog.
This fact sheet is filed with the Bureau for Private Postsecondary Education. Regardless of any information you may have relating to completion rates, placement rates, starting salaries, or license exam passage rates, this fact sheet contains the information as calculated pursuant to state law.
Any questions a student may have regarding this fact sheet that have not been satisfactorily answered by the institution may be directed to the Bureau for Private Postsecondary Education at: P.O. Box 980818, West Sacramento, CA 95798-0818, www.bppe.ca.gov., P: 888.370.7589 or 916.431.6959, F: 916.263.1897
I have read and understand this School Performance Fact Sheet. The School Performance Fact Sheet was reviewed and discussed with a school official prior to signing an enrollment agreement.
Student Name-Print Student Signature
School Official Date

SCHOOL PERFORMANCE FACT SHEET CET Center: SOLEDAD
Student Name: _____________________________________________________________ SID No. _______________________
BPPE Fact Sheet for School Name CENTER FOR EMPLOYMENT TRAINING
Disclose by date: September 1, 2013 Street address 930 LOS COCHES DR. City, State Zip Code SOLEDAD, CA 93960
Phone number (831) 678-0448 Fax Phone (831) 678-0592
Website WWW.CETWEB.ORG
PROGRAM TITLE – PROGRAM LENGTH
Course Name Clock Hours Published Charges MEDICAL ASSISTANT 900 $9307.00
COMPLETION RATES
Calendar Year
Number of Students Who Began Program (1)
Students Available for Graduation (2)
Graduates (3) Completion Rate (4)
2011 76 76 26 34.21% 2012 55 55 26 47.27%
STUDENTS COMPLETING AFTER PUBLISHED PROGRAM LENGTH--150% COMPLETION RATES
Calendar Year
Number of Students Who Began Program (1)
Students Available for Graduation (2)
150% Graduates (5)
150% Completion Rate (6)
2011 76 76 40 52.63% 2012 55 55 24 43.64%
(1) “Number of Students Who Began Program” means the number of students who began the program who are scheduled to complete the program within the reporting calendar year.
(2) “Students Available for Graduation” means the number of students who began program minus the number of students unavailable for graduation, which means those students who have died, been incarcerated, or called to active military duty.
(3) “Graduates” means the number of students who completed the program within 100% of the published program length.
(4) “Completion Rate” means the number of graduates divided by the number of Students Available for Graduation.
(5) “150% Graduates” means the number of students who completed the program within 101-150% of the published program length.
(6) “150% Completion Rate” means the number of students who completed the program in the reported calendar year within 101-150% of the published program length divided by the number of Students Available for Graduation in the published program length period.
Initials: _______ Date:_______ I have read and understand the above completion rates.

SCHOOL PERFORMANCE FACT SHEET (continued) page 2
PLACEMENT RATES
Calendar Year
Number of Students Who Began Program (1)
Number of Graduates (2)
Graduates Available for Employment(3)
Graduates Employed in the Field (4)
Placement Rate % Employedin the Field (5)
Graduates Employed in the Field an Average of less than 32 Hours per Week
Graduates Employed in the Field at least 32 Hours per Week
2011 76 26 26 12 46.15% 5 7 2012 55 26 26 10 38.46% 4 6
(1) “Number of Students Who Began Program” means the number of students who began the program who are scheduled to complete the program within the reporting calendar year.
(2) “Number of Graduates” means the number of students who have completed the program within 100% of the published program length.
(3) “Graduates Available for Employment” means the number of graduates minus the number of graduates unavailable for employment. Graduates unavailable for employment' means graduates who, after graduation, die, become incarcerated, are called to active military duty, are international students that leave the United States or do not have a visa allowing employment in the United States, or are continuing their education in an accredited or bureau-approved postsecondary institution.
(4) “Graduates Employed in the Field” means a single position for which the institution represents, the program prepare graduates, within six months after the student completes the applicable educational program. For occupations requiring passage of a licensing exam prior to employment, institutions may count the graduate if employment begins “in a single position, for which the institution represents, its program prepares its graduates within six months of the announcement of the first licensure exam results.”
(5) “Placement Rate” is calculated by dividing the number of graduates gainfully employed in the field by the number of graduates available for employment.
Initials: _________ Date: ________ I have read and understand the above placement rates.
EXAMINATION PASSAGE RATES
Calendar Year
Number of Students Taking the Exam (1)
Number Who Passed First Exam Taken (2)
Number Who Failed First Exam Taken
Passage Rate (3)
2011 N/A N/A N/A N/A % 2012 N/A N/A N/A N/A %
(1) “Number of Students Taking Exam” means the number of students who completed the program within 150% of the published program length and who took the exam in the reported calendar year for the first time.
(2) “Number Who Passed First Exam Taken” means the number of students who took and passed the licensing exam in the reported calendar year on the first attempt.
(3) “Passage Rate” is calculated by dividing the number of graduates who pass the exam the first time that they take it by the number of graduates who took the licensing exam for the first time after completion of the program.
Initials:________ Date:______ I have read and understand the above license examination rates.

___________________________ __________________________
___________________________ _________________
SCHOOL PERFORMANCE FACT SHEET (continued) page 3
SALARY AND WAGE INFORMATION: PROGRAM TITLE AND PROGRAM LENGTH:
Calendar Year
Graduates Available for Employment (1)
Graduates Employedin the Field (2)
Annual Salary and Wages Reported by Graduated Employed in the Field (3). Amounts are reported in 5,000 brackets. 51K + = more than 50,000 reported, finally, NR is the number of students not responding to the survey.
5K
10K
15K
20K
25K
30K
35K
40K
45K
50K
51K +
NR
2011 26 12 0 1 2 2 6 1 0 0 0 0 0 2012 26 10 0 0 2 3 2 1 1 0 1 0 0
(1) “Graduates Available for Employment” means the number of graduates minus the number of graduates unavailable for employment. Graduates unavailable for employment mean graduates, who, after graduation, died, become incarcerated, are called to active military duty, are international students that leave the United States or do not have a visa allowing employment in the United States, or are continuing their education in an accredited or bureau-approved postsecondary institution.
(2) “Graduates Employed in the Field” means graduates who are gainfully employed within six months of graduation in a position for which the skills obtained through the education and training provided by the institution are required or provided a significant advantage to the graduate in obtaining the position.
(3) “Salary” is reported by the student. Not all graduates reported salary.
Initials: ________ Date: ______ I have read and understand the above salary and wage information.
Three-Year Cohort Default Rate as Published by USDE
Percentage of EnrolledStudents Receiving FederalStudent Loans
24.5% 72%
Initials: _____ Date: ______ I have read and understand the above USDE financial aid program participation information.
The data reflected on the above charts was gathered using at least one of the following methods: Graduate Surveys, Employer Surveys, Phone Calls, Education Development Department (EDD) and State Licensing Agencies. If you have any further questions or if you want a list of employment positions determined to be within the field for any specific program for which statistics are reported above, please speak with an Admissions Representative or see the School Catalog.
This fact sheet is filed with the Bureau for Private Postsecondary Education. Regardless of any information you may have relating to completion rates, placement rates, starting salaries, or license exam passage rates, this fact sheet contains the information as calculated pursuant to state law.
Any questions a student may have regarding this fact sheet that have not been satisfactorily answered by the institution may be directed to the Bureau for Private Postsecondary Education at: P.O. Box 980818, West Sacramento, CA 95798-0818, www.bppe.ca.gov., P: 888.370.7589 or 916.431.6959, F: 916.263.1897
I have read and understand this School Performance Fact Sheet. The School Performance Fact Sheet was reviewed and discussed with a school official prior to signing an enrollment agreement.
Student Name-Print Student Signature
School Official Date
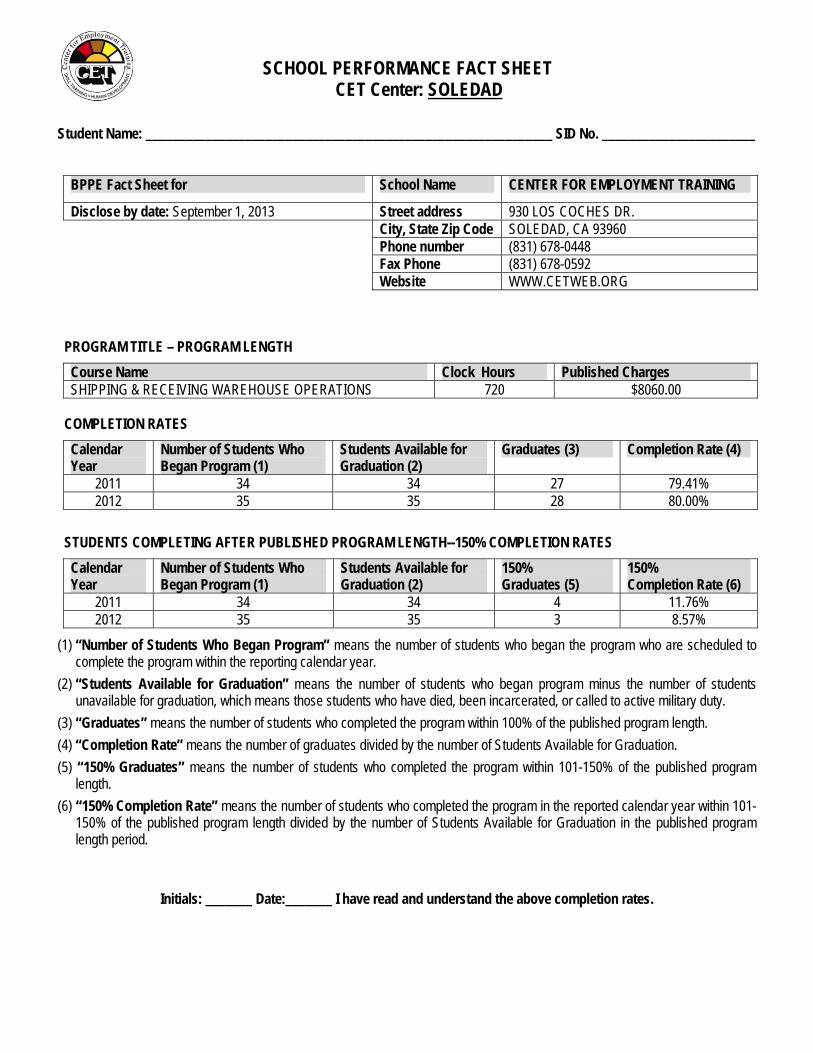
SCHOOL PERFORMANCE FACT SHEET CET Center: SOLEDAD
Student Name: _____________________________________________________________ SID No. _______________________
BPPE Fact Sheet for School Name CENTER FOR EMPLOYMENT TRAINING
Disclose by date: September 1, 2013 Street address 930 LOS COCHES DR. City, State Zip Code SOLEDAD, CA 93960
Phone number (831) 678-0448 Fax Phone (831) 678-0592
Website WWW.CETWEB.ORG
PROGRAM TITLE – PROGRAM LENGTH
Course Name Clock Hours Published Charges SHIPPING & RECEIVING WAREHOUSE OPERATIONS 720 $8060.00
COMPLETION RATES
Calendar Year
Number of Students Who Began Program (1)
Students Available for Graduation (2)
Graduates (3) Completion Rate (4)
2011 34 34 27 79.41% 2012 35 35 28 80.00%
STUDENTS COMPLETING AFTER PUBLISHED PROGRAM LENGTH--150% COMPLETION RATES
Calendar Year
Number of Students Who Began Program (1)
Students Available for Graduation (2)
150% Graduates (5)
150% Completion Rate (6)
2011 34 34 4 11.76% 2012 35 35 3 8.57%
(1) “Number of Students Who Began Program” means the number of students who began the program who are scheduled to complete the program within the reporting calendar year.
(2) “Students Available for Graduation” means the number of students who began program minus the number of students unavailable for graduation, which means those students who have died, been incarcerated, or called to active military duty.
(3) “Graduates” means the number of students who completed the program within 100% of the published program length.
(4) “Completion Rate” means the number of graduates divided by the number of Students Available for Graduation.
(5) “150% Graduates” means the number of students who completed the program within 101-150% of the published program length.
(6) “150% Completion Rate” means the number of students who completed the program in the reported calendar year within 101-150% of the published program length divided by the number of Students Available for Graduation in the published program length period.
Initials: _______ Date:_______ I have read and understand the above completion rates.

SCHOOL PERFORMANCE FACT SHEET (continued) page 2
PLACEMENT RATES
Calendar Year
Number of Students Who Began Program (1)
Number of Graduates (2)
Graduates Available for Employment(3)
Graduates Employed in the Field (4)
Placement Rate % Employedin the Field (5)
Graduates Employed in the Field an Average of less than 32 Hours per Week
Graduates Employed in the Field at least 32 Hours per Week
2011 34 27 27 21 77.78% 1 20 2012 35 28 28 25 89.29% 7 18
(1) “Number of Students Who Began Program” means the number of students who began the program who are scheduled to complete the program within the reporting calendar year.
(2) “Number of Graduates” means the number of students who have completed the program within 100% of the published program length.
(3) “Graduates Available for Employment” means the number of graduates minus the number of graduates unavailable for employment. Graduates unavailable for employment' means graduates who, after graduation, die, become incarcerated, are called to active military duty, are international students that leave the United States or do not have a visa allowing employment in the United States, or are continuing their education in an accredited or bureau-approved postsecondary institution.
(4) “Graduates Employed in the Field” means a single position for which the institution represents, the program prepare graduates, within six months after the student completes the applicable educational program. For occupations requiring passage of a licensing exam prior to employment, institutions may count the graduate if employment begins “in a single position, for which the institution represents, its program prepares its graduates within six months of the announcement of the first licensure exam results.”
(5) “Placement Rate” is calculated by dividing the number of graduates gainfully employed in the field by the number of graduates available for employment.
Initials: _________ Date: ________ I have read and understand the above placement rates.
EXAMINATION PASSAGE RATES
Calendar Year
Number of Students Taking the Exam (1)
Number Who Passed First Exam Taken (2)
Number Who Failed First Exam Taken
Passage Rate (3)
2011 N/A N/A N/A N/A % 2012 N/A N/A N/A N/A %
(1) “Number of Students Taking Exam” means the number of students who completed the program within 150% of the published program length and who took the exam in the reported calendar year for the first time.
(2) “Number Who Passed First Exam Taken” means the number of students who took and passed the licensing exam in the reported calendar year on the first attempt.
(3) “Passage Rate” is calculated by dividing the number of graduates who pass the exam the first time that they take it by the number of graduates who took the licensing exam for the first time after completion of the program.
Initials:________ Date:______ I have read and understand the above license examination rates.

___________________________ __________________________
___________________________ _________________
SCHOOL PERFORMANCE FACT SHEET (continued) page 3
SALARY AND WAGE INFORMATION: PROGRAM TITLE AND PROGRAM LENGTH:
Calendar Year
Graduates Available for Employment (1)
Graduates Employedin the Field (2)
Annual Salary and Wages Reported by Graduated Employed in the Field (3). Amounts are reported in 5,000 brackets. 51K + = more than 50,000 reported, finally, NR is the number of students not responding to the survey.
5K
10K
15K
20K
25K
30K
35K
40K
45K
50K
51K +
NR
2011 27 21 0 0 1 15 4 1 0 0 0 0 0 2012 28 25 0 1 4 12 7 0 0 0 0 0 0
(1) “Graduates Available for Employment” means the number of graduates minus the number of graduates unavailable for employment. Graduates unavailable for employment mean graduates, who, after graduation, died, become incarcerated, are called to active military duty, are international students that leave the United States or do not have a visa allowing employment in the United States, or are continuing their education in an accredited or bureau-approved postsecondary institution.
(2) “Graduates Employed in the Field” means graduates who are gainfully employed within six months of graduation in a position for which the skills obtained through the education and training provided by the institution are required or provided a significant advantage to the graduate in obtaining the position.
(3) “Salary” is reported by the student. Not all graduates reported salary.
Initials: ________ Date: ______ I have read and understand the above salary and wage information.
Three-Year Cohort Default Rate as Published by USDE
Percentage of EnrolledStudents Receiving FederalStudent Loans
24.5% 72%
Initials: _____ Date: ______ I have read and understand the above USDE financial aid program participation information.
The data reflected on the above charts was gathered using at least one of the following methods: Graduate Surveys, Employer Surveys, Phone Calls, Education Development Department (EDD) and State Licensing Agencies. If you have any further questions or if you want a list of employment positions determined to be within the field for any specific program for which statistics are reported above, please speak with an Admissions Representative or see the School Catalog.
This fact sheet is filed with the Bureau for Private Postsecondary Education. Regardless of any information you may have relating to completion rates, placement rates, starting salaries, or license exam passage rates, this fact sheet contains the information as calculated pursuant to state law.
Any questions a student may have regarding this fact sheet that have not been satisfactorily answered by the institution may be directed to the Bureau for Private Postsecondary Education at: P.O. Box 980818, West Sacramento, CA 95798-0818, www.bppe.ca.gov., P: 888.370.7589 or 916.431.6959, F: 916.263.1897
I have read and understand this School Performance Fact Sheet. The School Performance Fact Sheet was reviewed and discussed with a school official prior to signing an enrollment agreement.
Student Name-Print Student Signature
School Official Date

SCHOOL PERFORMANCE FACT SHEET CET Center: TEMECULA
Student Name: _____________________________________________________________ SID No. _______________________
BPPE Fact Sheet for School Name CENTER FOR EMPLOYMENT TRAINING
Disclose by date: September 1, 2013 Street address 27941 JEFFERSON SUITE "A" City, State Zip Code TEMECULA, CA 92590
Phone number (951) 699-8180 Fax Phone (951) 699-3851
Website WWW.CETWEB.ORG
PROGRAM TITLE – PROGRAM LENGTH
Course Name Clock Hours Published Charges ACCOUNTING CLERK 900 $9307.00
COMPLETION RATES
Calendar Year
Number of Students Who Began Program (1)
Students Available for Graduation (2)
Graduates (3) Completion Rate (4)
2011 14 14 9 64.29% 2012 1 1 1 100.00%
STUDENTS COMPLETING AFTER PUBLISHED PROGRAM LENGTH--150% COMPLETION RATES
Calendar Year
Number of Students Who Began Program (1)
Students Available for Graduation (2)
150% Graduates (5)
150% Completion Rate (6)
2011 14 14 5 35.71% 2012 1 1 0 0.00%
(1) “Number of Students Who Began Program” means the number of students who began the program who are scheduled to complete the program within the reporting calendar year.
(2) “Students Available for Graduation” means the number of students who began program minus the number of students unavailable for graduation, which means those students who have died, been incarcerated, or called to active military duty.
(3) “Graduates” means the number of students who completed the program within 100% of the published program length.
(4) “Completion Rate” means the number of graduates divided by the number of Students Available for Graduation.
(5) “150% Graduates” means the number of students who completed the program within 101-150% of the published program length.
(6) “150% Completion Rate” means the number of students who completed the program in the reported calendar year within 101-150% of the published program length divided by the number of Students Available for Graduation in the published program length period.
Initials: _______ Date:_______ I have read and understand the above completion rates.

SCHOOL PERFORMANCE FACT SHEET (continued) page 2
PLACEMENT RATES
Calendar Year
Number of Students Who Began Program (1)
Number of Graduates (2)
Graduates Available for Employment(3)
Graduates Employed in the Field (4)
Placement Rate % Employedin the Field (5)
Graduates Employed in the Field an Average of less than 32 Hours per Week
Graduates Employed in the Field at least 32 Hours per Week
2011 14 9 9 5 55.56% 1 4 2012 1 1 1 1 100.00% 0 1
(1) “Number of Students Who Began Program” means the number of students who began the program who are scheduled to complete the program within the reporting calendar year.
(2) “Number of Graduates” means the number of students who have completed the program within 100% of the published program length.
(3) “Graduates Available for Employment” means the number of graduates minus the number of graduates unavailable for employment. Graduates unavailable for employment' means graduates who, after graduation, die, become incarcerated, are called to active military duty, are international students that leave the United States or do not have a visa allowing employment in the United States, or are continuing their education in an accredited or bureau-approved postsecondary institution.
(4) “Graduates Employed in the Field” means a single position for which the institution represents, the program prepare graduates, within six months after the student completes the applicable educational program. For occupations requiring passage of a licensing exam prior to employment, institutions may count the graduate if employment begins “in a single position, for which the institution represents, its program prepares its graduates within six months of the announcement of the first licensure exam results.”
(5) “Placement Rate” is calculated by dividing the number of graduates gainfully employed in the field by the number of graduates available for employment.
Initials: _________ Date: ________ I have read and understand the above placement rates.
EXAMINATION PASSAGE RATES
Calendar Year
Number of Students Taking the Exam (1)
Number Who Passed First Exam Taken (2)
Number Who Failed First Exam Taken
Passage Rate (3)
2011 N/A N/A N/A N/A % 2012 N/A N/A N/A N/A %
(1) “Number of Students Taking Exam” means the number of students who completed the program within 150% of the published program length and who took the exam in the reported calendar year for the first time.
(2) “Number Who Passed First Exam Taken” means the number of students who took and passed the licensing exam in the reported calendar year on the first attempt.
(3) “Passage Rate” is calculated by dividing the number of graduates who pass the exam the first time that they take it by the number of graduates who took the licensing exam for the first time after completion of the program.
Initials:________ Date:______ I have read and understand the above license examination rates.

___________________________ __________________________
___________________________ _________________
SCHOOL PERFORMANCE FACT SHEET (continued) page 3
SALARY AND WAGE INFORMATION: PROGRAM TITLE AND PROGRAM LENGTH:
Calendar Year
Graduates Available for Employment (1)
Graduates Employedin the Field (2)
Annual Salary and Wages Reported by Graduated Employed in the Field (3). Amounts are reported in 5,000 brackets. 51K + = more than 50,000 reported, finally, NR is the number of students not responding to the survey.
5K
10K
15K
20K
25K
30K
35K
40K
45K
50K
51K +
NR
2011 9 5 0 0 1 3 0 1 0 0 0 0 0 2012 1 1 0 0 0 0 1 0 0 0 0 0 0
(1) “Graduates Available for Employment” means the number of graduates minus the number of graduates unavailable for employment. Graduates unavailable for employment mean graduates, who, after graduation, died, become incarcerated, are called to active military duty, are international students that leave the United States or do not have a visa allowing employment in the United States, or are continuing their education in an accredited or bureau-approved postsecondary institution.
(2) “Graduates Employed in the Field” means graduates who are gainfully employed within six months of graduation in a position for which the skills obtained through the education and training provided by the institution are required or provided a significant advantage to the graduate in obtaining the position.
(3) “Salary” is reported by the student. Not all graduates reported salary.
Initials: ________ Date: ______ I have read and understand the above salary and wage information.
Three-Year Cohort Default Rate as Published by USDE
Percentage of EnrolledStudents Receiving FederalStudent Loans
24.5% 72%
Initials: _____ Date: ______ I have read and understand the above USDE financial aid program participation information.
The data reflected on the above charts was gathered using at least one of the following methods: Graduate Surveys, Employer Surveys, Phone Calls, Education Development Department (EDD) and State Licensing Agencies. If you have any further questions or if you want a list of employment positions determined to be within the field for any specific program for which statistics are reported above, please speak with an Admissions Representative or see the School Catalog.
This fact sheet is filed with the Bureau for Private Postsecondary Education. Regardless of any information you may have relating to completion rates, placement rates, starting salaries, or license exam passage rates, this fact sheet contains the information as calculated pursuant to state law.
Any questions a student may have regarding this fact sheet that have not been satisfactorily answered by the institution may be directed to the Bureau for Private Postsecondary Education at: P.O. Box 980818, West Sacramento, CA 95798-0818, www.bppe.ca.gov., P: 888.370.7589 or 916.431.6959, F: 916.263.1897
I have read and understand this School Performance Fact Sheet. The School Performance Fact Sheet was reviewed and discussed with a school official prior to signing an enrollment agreement.
Student Name-Print Student Signature
School Official Date

SCHOOL PERFORMANCE FACT SHEET CET Center: TEMECULA
Student Name: _____________________________________________________________ SID No. _______________________
BPPE Fact Sheet for School Name CENTER FOR EMPLOYMENT TRAINING
Disclose by date: September 1, 2013 Street address 27941 JEFFERSON SUITE "A" City, State Zip Code TEMECULA, CA 92590
Phone number (951) 699-8180 Fax Phone (951) 699-3851
Website WWW.CETWEB.ORG
PROGRAM TITLE – PROGRAM LENGTH
Course Name Clock Hours Published Charges BUSINESS OFFICE TECHNOLOGY 900 $9307.00
COMPLETION RATES
Calendar Year
Number of Students Who Began Program (1)
Students Available for Graduation (2)
Graduates (3) Completion Rate (4)
2011 18 18 7 38.89% 2012 15 15 4 26.67%
STUDENTS COMPLETING AFTER PUBLISHED PROGRAM LENGTH--150% COMPLETION RATES
Calendar Year
Number of Students Who Began Program (1)
Students Available for Graduation (2)
150% Graduates (5)
150% Completion Rate (6)
2011 18 18 11 61.11% 2012 15 15 3 20.00%
(1) “Number of Students Who Began Program” means the number of students who began the program who are scheduled to complete the program within the reporting calendar year.
(2) “Students Available for Graduation” means the number of students who began program minus the number of students unavailable for graduation, which means those students who have died, been incarcerated, or called to active military duty.
(3) “Graduates” means the number of students who completed the program within 100% of the published program length.
(4) “Completion Rate” means the number of graduates divided by the number of Students Available for Graduation.
(5) “150% Graduates” means the number of students who completed the program within 101-150% of the published program length.
(6) “150% Completion Rate” means the number of students who completed the program in the reported calendar year within 101-150% of the published program length divided by the number of Students Available for Graduation in the published program length period.
Initials: _______ Date:_______ I have read and understand the above completion rates.

SCHOOL PERFORMANCE FACT SHEET (continued) page 2
PLACEMENT RATES
Calendar Year
Number of Students Who Began Program (1)
Number of Graduates (2)
Graduates Available for Employment(3)
Graduates Employed in the Field (4)
Placement Rate % Employedin the Field (5)
Graduates Employed in the Field an Average of less than 32 Hours per Week
Graduates Employed in the Field at least 32 Hours per Week
2011 18 7 7 7 100.00% 4 3 2012 15 4 4 4 100.00% 2 2
(1) “Number of Students Who Began Program” means the number of students who began the program who are scheduled to complete the program within the reporting calendar year.
(2) “Number of Graduates” means the number of students who have completed the program within 100% of the published program length.
(3) “Graduates Available for Employment” means the number of graduates minus the number of graduates unavailable for employment. Graduates unavailable for employment' means graduates who, after graduation, die, become incarcerated, are called to active military duty, are international students that leave the United States or do not have a visa allowing employment in the United States, or are continuing their education in an accredited or bureau-approved postsecondary institution.
(4) “Graduates Employed in the Field” means a single position for which the institution represents, the program prepare graduates, within six months after the student completes the applicable educational program. For occupations requiring passage of a licensing exam prior to employment, institutions may count the graduate if employment begins “in a single position, for which the institution represents, its program prepares its graduates within six months of the announcement of the first licensure exam results.”
(5) “Placement Rate” is calculated by dividing the number of graduates gainfully employed in the field by the number of graduates available for employment.
Initials: _________ Date: ________ I have read and understand the above placement rates.
EXAMINATION PASSAGE RATES
Calendar Year
Number of Students Taking the Exam (1)
Number Who Passed First Exam Taken (2)
Number Who Failed First Exam Taken
Passage Rate (3)
2011 N/A N/A N/A N/A % 2012 N/A N/A N/A N/A %
(1) “Number of Students Taking Exam” means the number of students who completed the program within 150% of the published program length and who took the exam in the reported calendar year for the first time.
(2) “Number Who Passed First Exam Taken” means the number of students who took and passed the licensing exam in the reported calendar year on the first attempt.
(3) “Passage Rate” is calculated by dividing the number of graduates who pass the exam the first time that they take it by the number of graduates who took the licensing exam for the first time after completion of the program.
Initials:________ Date:______ I have read and understand the above license examination rates.
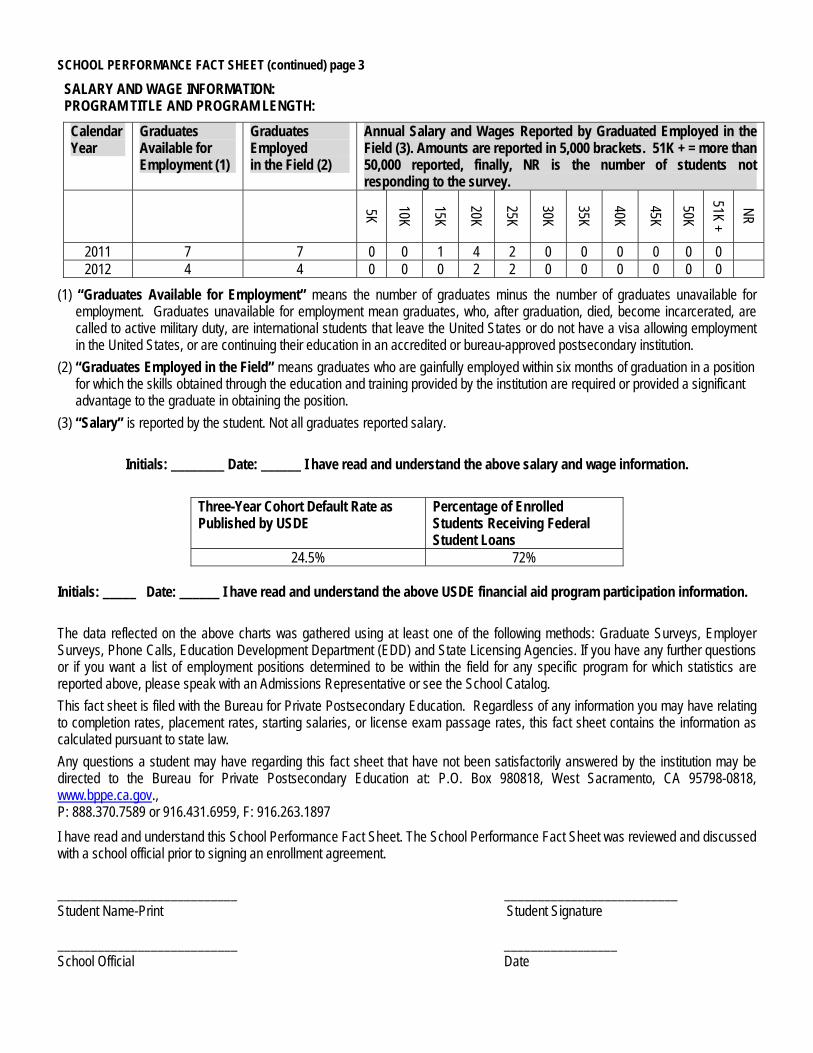
___________________________ __________________________
___________________________ _________________
SCHOOL PERFORMANCE FACT SHEET (continued) page 3
SALARY AND WAGE INFORMATION: PROGRAM TITLE AND PROGRAM LENGTH:
Calendar Year
Graduates Available for Employment (1)
Graduates Employedin the Field (2)
Annual Salary and Wages Reported by Graduated Employed in the Field (3). Amounts are reported in 5,000 brackets. 51K + = more than 50,000 reported, finally, NR is the number of students not responding to the survey.
5K
10K
15K
20K
25K
30K
35K
40K
45K
50K
51K +
NR
2011 7 7 0 0 1 4 2 0 0 0 0 0 0 2012 4 4 0 0 0 2 2 0 0 0 0 0 0
(1) “Graduates Available for Employment” means the number of graduates minus the number of graduates unavailable for employment. Graduates unavailable for employment mean graduates, who, after graduation, died, become incarcerated, are called to active military duty, are international students that leave the United States or do not have a visa allowing employment in the United States, or are continuing their education in an accredited or bureau-approved postsecondary institution.
(2) “Graduates Employed in the Field” means graduates who are gainfully employed within six months of graduation in a position for which the skills obtained through the education and training provided by the institution are required or provided a significant advantage to the graduate in obtaining the position.
(3) “Salary” is reported by the student. Not all graduates reported salary.
Initials: ________ Date: ______ I have read and understand the above salary and wage information.
Three-Year Cohort Default Rate as Published by USDE
Percentage of EnrolledStudents Receiving FederalStudent Loans
24.5% 72%
Initials: _____ Date: ______ I have read and understand the above USDE financial aid program participation information.
The data reflected on the above charts was gathered using at least one of the following methods: Graduate Surveys, Employer Surveys, Phone Calls, Education Development Department (EDD) and State Licensing Agencies. If you have any further questions or if you want a list of employment positions determined to be within the field for any specific program for which statistics are reported above, please speak with an Admissions Representative or see the School Catalog.
This fact sheet is filed with the Bureau for Private Postsecondary Education. Regardless of any information you may have relating to completion rates, placement rates, starting salaries, or license exam passage rates, this fact sheet contains the information as calculated pursuant to state law.
Any questions a student may have regarding this fact sheet that have not been satisfactorily answered by the institution may be directed to the Bureau for Private Postsecondary Education at: P.O. Box 980818, West Sacramento, CA 95798-0818, www.bppe.ca.gov., P: 888.370.7589 or 916.431.6959, F: 916.263.1897
I have read and understand this School Performance Fact Sheet. The School Performance Fact Sheet was reviewed and discussed with a school official prior to signing an enrollment agreement.
Student Name-Print Student Signature
School Official Date

SCHOOL PERFORMANCE FACT SHEET CET Center: TEMECULA
Student Name: _____________________________________________________________ SID No. _______________________
BPPE Fact Sheet for School Name CENTER FOR EMPLOYMENT TRAINING
Disclose by date: September 1, 2013 Street address 27941 JEFFERSON SUITE "A" City, State Zip Code TEMECULA, CA 92590
Phone number (951) 699-8180 Fax Phone (951) 699-3851
Website WWW.CETWEB.ORG
PROGRAM TITLE – PROGRAM LENGTH
Course Name Clock Hours Published Charges MEDICAL ADMINISTRATIVE ASSISTANT 720 $8060.00
COMPLETION RATES
Calendar Year
Number of Students Who Began Program (1)
Students Available for Graduation (2)
Graduates (3) Completion Rate (4)
2011 20 20 10 50.00% 2012 29 29 3 10.34%
STUDENTS COMPLETING AFTER PUBLISHED PROGRAM LENGTH--150% COMPLETION RATES
Calendar Year
Number of Students Who Began Program (1)
Students Available for Graduation (2)
150% Graduates (5)
150% Completion Rate (6)
2011 20 20 8 40.00% 2012 29 29 20 68.97%
(1) “Number of Students Who Began Program” means the number of students who began the program who are scheduled to complete the program within the reporting calendar year.
(2) “Students Available for Graduation” means the number of students who began program minus the number of students unavailable for graduation, which means those students who have died, been incarcerated, or called to active military duty.
(3) “Graduates” means the number of students who completed the program within 100% of the published program length.
(4) “Completion Rate” means the number of graduates divided by the number of Students Available for Graduation.
(5) “150% Graduates” means the number of students who completed the program within 101-150% of the published program length.
(6) “150% Completion Rate” means the number of students who completed the program in the reported calendar year within 101-150% of the published program length divided by the number of Students Available for Graduation in the published program length period.
Initials: _______ Date:_______ I have read and understand the above completion rates.

SCHOOL PERFORMANCE FACT SHEET (continued) page 2
PLACEMENT RATES
Calendar Year
Number of Students Who Began Program (1)
Number of Graduates (2)
Graduates Available for Employment(3)
Graduates Employed in the Field (4)
Placement Rate % Employedin the Field (5)
Graduates Employed in the Field an Average of less than 32 Hours per Week
Graduates Employed in the Field at least 32 Hours per Week
2011 20 10 10 7 70.00% 3 4 2012 29 3 3 1 33.33% 1 0
(1) “Number of Students Who Began Program” means the number of students who began the program who are scheduled to complete the program within the reporting calendar year.
(2) “Number of Graduates” means the number of students who have completed the program within 100% of the published program length.
(3) “Graduates Available for Employment” means the number of graduates minus the number of graduates unavailable for employment. Graduates unavailable for employment' means graduates who, after graduation, die, become incarcerated, are called to active military duty, are international students that leave the United States or do not have a visa allowing employment in the United States, or are continuing their education in an accredited or bureau-approved postsecondary institution.
(4) “Graduates Employed in the Field” means a single position for which the institution represents, the program prepare graduates, within six months after the student completes the applicable educational program. For occupations requiring passage of a licensing exam prior to employment, institutions may count the graduate if employment begins “in a single position, for which the institution represents, its program prepares its graduates within six months of the announcement of the first licensure exam results.”
(5) “Placement Rate” is calculated by dividing the number of graduates gainfully employed in the field by the number of graduates available for employment.
Initials: _________ Date: ________ I have read and understand the above placement rates.
EXAMINATION PASSAGE RATES
Calendar Year
Number of Students Taking the Exam (1)
Number Who Passed First Exam Taken (2)
Number Who Failed First Exam Taken
Passage Rate (3)
2011 N/A N/A N/A N/A % 2012 N/A N/A N/A N/A %
(1) “Number of Students Taking Exam” means the number of students who completed the program within 150% of the published program length and who took the exam in the reported calendar year for the first time.
(2) “Number Who Passed First Exam Taken” means the number of students who took and passed the licensing exam in the reported calendar year on the first attempt.
(3) “Passage Rate” is calculated by dividing the number of graduates who pass the exam the first time that they take it by the number of graduates who took the licensing exam for the first time after completion of the program.
Initials:________ Date:______ I have read and understand the above license examination rates.

___________________________ __________________________
___________________________ _________________
SCHOOL PERFORMANCE FACT SHEET (continued) page 3
SALARY AND WAGE INFORMATION: PROGRAM TITLE AND PROGRAM LENGTH:
Calendar Year
Graduates Available for Employment (1)
Graduates Employedin the Field (2)
Annual Salary and Wages Reported by Graduated Employed in the Field (3). Amounts are reported in 5,000 brackets. 51K + = more than 50,000 reported, finally, NR is the number of students not responding to the survey.
5K
10K
15K
20K
25K
30K
35K
40K
45K
50K
51K +
NR
2011 10 7 0 0 2 2 2 1 0 0 0 0 0 2012 3 1 0 0 0 0 1 0 0 0 0 0 0
(1) “Graduates Available for Employment” means the number of graduates minus the number of graduates unavailable for employment. Graduates unavailable for employment mean graduates, who, after graduation, died, become incarcerated, are called to active military duty, are international students that leave the United States or do not have a visa allowing employment in the United States, or are continuing their education in an accredited or bureau-approved postsecondary institution.
(2) “Graduates Employed in the Field” means graduates who are gainfully employed within six months of graduation in a position for which the skills obtained through the education and training provided by the institution are required or provided a significant advantage to the graduate in obtaining the position.
(3) “Salary” is reported by the student. Not all graduates reported salary.
Initials: ________ Date: ______ I have read and understand the above salary and wage information.
Three-Year Cohort Default Rate as Published by USDE
Percentage of EnrolledStudents Receiving FederalStudent Loans
24.5% 72%
Initials: _____ Date: ______ I have read and understand the above USDE financial aid program participation information.
The data reflected on the above charts was gathered using at least one of the following methods: Graduate Surveys, Employer Surveys, Phone Calls, Education Development Department (EDD) and State Licensing Agencies. If you have any further questions or if you want a list of employment positions determined to be within the field for any specific program for which statistics are reported above, please speak with an Admissions Representative or see the School Catalog.
This fact sheet is filed with the Bureau for Private Postsecondary Education. Regardless of any information you may have relating to completion rates, placement rates, starting salaries, or license exam passage rates, this fact sheet contains the information as calculated pursuant to state law.
Any questions a student may have regarding this fact sheet that have not been satisfactorily answered by the institution may be directed to the Bureau for Private Postsecondary Education at: P.O. Box 980818, West Sacramento, CA 95798-0818, www.bppe.ca.gov., P: 888.370.7589 or 916.431.6959, F: 916.263.1897
I have read and understand this School Performance Fact Sheet. The School Performance Fact Sheet was reviewed and discussed with a school official prior to signing an enrollment agreement.
Student Name-Print Student Signature
School Official Date

SCHOOL PERFORMANCE FACT SHEET CET Center: WATSONVILLE
Student Name: _____________________________________________________________ SID No. _______________________
BPPE Fact Sheet for School Name CENTER FOR EMPLOYMENT TRAINING
Disclose by date: September 1, 2013 Street address 10 BLANCA LANE City, State Zip Code WATSONVILLE, CA 95076
Phone number (831) 728-4551 Fax Phone (831) 728-1659
Website WWW.CETWEB.ORG
PROGRAM TITLE – PROGRAM LENGTH
Course Name Clock Hours Published Charges CUSTODIAL SERVICES 720 $8060.00
COMPLETION RATES
Calendar Year
Number of Students Who Began Program (1)
Students Available for Graduation (2)
Graduates (3) Completion Rate (4)
2011 20 20 7 35.00% 2012 13 13 4 30.77%
STUDENTS COMPLETING AFTER PUBLISHED PROGRAM LENGTH--150% COMPLETION RATES
Calendar Year
Number of Students Who Began Program (1)
Students Available for Graduation (2)
150% Graduates (5)
150% Completion Rate (6)
2011 20 20 10 50.00% 2012 13 13 9 69.23%
(1) “Number of Students Who Began Program” means the number of students who began the program who are scheduled to complete the program within the reporting calendar year.
(2) “Students Available for Graduation” means the number of students who began program minus the number of students unavailable for graduation, which means those students who have died, been incarcerated, or called to active military duty.
(3) “Graduates” means the number of students who completed the program within 100% of the published program length.
(4) “Completion Rate” means the number of graduates divided by the number of Students Available for Graduation.
(5) “150% Graduates” means the number of students who completed the program within 101-150% of the published program length.
(6) “150% Completion Rate” means the number of students who completed the program in the reported calendar year within 101-150% of the published program length divided by the number of Students Available for Graduation in the published program length period.
Initials: _______ Date:_______ I have read and understand the above completion rates.

SCHOOL PERFORMANCE FACT SHEET (continued) page 2
PLACEMENT RATES
Calendar Year
Number of Students Who Began Program (1)
Number of Graduates (2)
Graduates Available for Employment(3)
Graduates Employed in the Field (4)
Placement Rate % Employedin the Field (5)
Graduates Employed in the Field an Average of less than 32 Hours per Week
Graduates Employed in the Field at least 32 Hours per Week
2011 20 7 7 7 100.00% 1 6 2012 13 4 4 3 75.00% 1 2
(1) “Number of Students Who Began Program” means the number of students who began the program who are scheduled to complete the program within the reporting calendar year.
(2) “Number of Graduates” means the number of students who have completed the program within 100% of the published program length.
(3) “Graduates Available for Employment” means the number of graduates minus the number of graduates unavailable for employment. Graduates unavailable for employment' means graduates who, after graduation, die, become incarcerated, are called to active military duty, are international students that leave the United States or do not have a visa allowing employment in the United States, or are continuing their education in an accredited or bureau-approved postsecondary institution.
(4) “Graduates Employed in the Field” means a single position for which the institution represents, the program prepare graduates, within six months after the student completes the applicable educational program. For occupations requiring passage of a licensing exam prior to employment, institutions may count the graduate if employment begins “in a single position, for which the institution represents, its program prepares its graduates within six months of the announcement of the first licensure exam results.”
(5) “Placement Rate” is calculated by dividing the number of graduates gainfully employed in the field by the number of graduates available for employment.
Initials: _________ Date: ________ I have read and understand the above placement rates.
EXAMINATION PASSAGE RATES
Calendar Year
Number of Students Taking the Exam (1)
Number Who Passed First Exam Taken (2)
Number Who Failed First Exam Taken
Passage Rate (3)
2011 N/A N/A N/A N/A % 2012 N/A N/A N/A N/A %
(1) “Number of Students Taking Exam” means the number of students who completed the program within 150% of the published program length and who took the exam in the reported calendar year for the first time.
(2) “Number Who Passed First Exam Taken” means the number of students who took and passed the licensing exam in the reported calendar year on the first attempt.
(3) “Passage Rate” is calculated by dividing the number of graduates who pass the exam the first time that they take it by the number of graduates who took the licensing exam for the first time after completion of the program.
Initials:________ Date:______ I have read and understand the above license examination rates.

___________________________ __________________________
___________________________ _________________
SCHOOL PERFORMANCE FACT SHEET (continued) page 3
SALARY AND WAGE INFORMATION: PROGRAM TITLE AND PROGRAM LENGTH:
Calendar Year
Graduates Available for Employment (1)
Graduates Employedin the Field (2)
Annual Salary and Wages Reported by Graduated Employed in the Field (3). Amounts are reported in 5,000 brackets. 51K + = more than 50,000 reported, finally, NR is the number of students not responding to the survey.
5K
10K
15K
20K
25K
30K
35K
40K
45K
50K
51K +
NR
2011 7 7 0 0 0 6 0 1 0 0 0 0 0 2012 4 3 0 0 1 1 0 0 0 0 0 0 0
(1) “Graduates Available for Employment” means the number of graduates minus the number of graduates unavailable for employment. Graduates unavailable for employment mean graduates, who, after graduation, died, become incarcerated, are called to active military duty, are international students that leave the United States or do not have a visa allowing employment in the United States, or are continuing their education in an accredited or bureau-approved postsecondary institution.
(2) “Graduates Employed in the Field” means graduates who are gainfully employed within six months of graduation in a position for which the skills obtained through the education and training provided by the institution are required or provided a significant advantage to the graduate in obtaining the position.
(3) “Salary” is reported by the student. Not all graduates reported salary.
Initials: ________ Date: ______ I have read and understand the above salary and wage information.
Three-Year Cohort Default Rate as Published by USDE
Percentage of EnrolledStudents Receiving FederalStudent Loans
24.5% 72%
Initials: _____ Date: ______ I have read and understand the above USDE financial aid program participation information.
The data reflected on the above charts was gathered using at least one of the following methods: Graduate Surveys, Employer Surveys, Phone Calls, Education Development Department (EDD) and State Licensing Agencies. If you have any further questions or if you want a list of employment positions determined to be within the field for any specific program for which statistics are reported above, please speak with an Admissions Representative or see the School Catalog.
This fact sheet is filed with the Bureau for Private Postsecondary Education. Regardless of any information you may have relating to completion rates, placement rates, starting salaries, or license exam passage rates, this fact sheet contains the information as calculated pursuant to state law.
Any questions a student may have regarding this fact sheet that have not been satisfactorily answered by the institution may be directed to the Bureau for Private Postsecondary Education at: P.O. Box 980818, West Sacramento, CA 95798-0818, www.bppe.ca.gov., P: 888.370.7589 or 916.431.6959, F: 916.263.1897
I have read and understand this School Performance Fact Sheet. The School Performance Fact Sheet was reviewed and discussed with a school official prior to signing an enrollment agreement.
Student Name-Print Student Signature
School Official Date

SCHOOL PERFORMANCE FACT SHEET CET Center: WATSONVILLE
Student Name: _____________________________________________________________ SID No. _______________________
BPPE Fact Sheet for School Name CENTER FOR EMPLOYMENT TRAINING
Disclose by date: September 1, 2013 Street address 10 BLANCA LANE City, State Zip Code WATSONVILLE, CA 95076
Phone number (831) 728-4551 Fax Phone (831) 728-1659
Website WWW.CETWEB.ORG
PROGRAM TITLE – PROGRAM LENGTH
Course Name Clock Hours Published Charges GREEN BUILDING CONSTRUCTION SKILLS 900 $9307.00
COMPLETION RATES
Calendar Year
Number of Students Who Began Program (1)
Students Available for Graduation (2)
Graduates (3) Completion Rate (4)
2011 65 65 33 50.77% 2012 43 43 24 55.81%
STUDENTS COMPLETING AFTER PUBLISHED PROGRAM LENGTH--150% COMPLETION RATES
Calendar Year
Number of Students Who Began Program (1)
Students Available for Graduation (2)
150% Graduates (5)
150% Completion Rate (6)
2011 65 65 26 40.00% 2012 43 43 12 27.91%
(1) “Number of Students Who Began Program” means the number of students who began the program who are scheduled to complete the program within the reporting calendar year.
(2) “Students Available for Graduation” means the number of students who began program minus the number of students unavailable for graduation, which means those students who have died, been incarcerated, or called to active military duty.
(3) “Graduates” means the number of students who completed the program within 100% of the published program length.
(4) “Completion Rate” means the number of graduates divided by the number of Students Available for Graduation.
(5) “150% Graduates” means the number of students who completed the program within 101-150% of the published program length.
(6) “150% Completion Rate” means the number of students who completed the program in the reported calendar year within 101-150% of the published program length divided by the number of Students Available for Graduation in the published program length period.
Initials: _______ Date:_______ I have read and understand the above completion rates.

SCHOOL PERFORMANCE FACT SHEET (continued) page 2
PLACEMENT RATES
Calendar Year
Number of Students Who Began Program (1)
Number of Graduates (2)
Graduates Available for Employment(3)
Graduates Employed in the Field (4)
Placement Rate % Employedin the Field (5)
Graduates Employed in the Field an Average of less than 32 Hours per Week
Graduates Employed in the Field at least 32 Hours per Week
2011 65 33 33 16 48.48% 0 16 2012 43 24 24 19 79.17% 4 15
(1) “Number of Students Who Began Program” means the number of students who began the program who are scheduled to complete the program within the reporting calendar year.
(2) “Number of Graduates” means the number of students who have completed the program within 100% of the published program length.
(3) “Graduates Available for Employment” means the number of graduates minus the number of graduates unavailable for employment. Graduates unavailable for employment' means graduates who, after graduation, die, become incarcerated, are called to active military duty, are international students that leave the United States or do not have a visa allowing employment in the United States, or are continuing their education in an accredited or bureau-approved postsecondary institution.
(4) “Graduates Employed in the Field” means a single position for which the institution represents, the program prepare graduates, within six months after the student completes the applicable educational program. For occupations requiring passage of a licensing exam prior to employment, institutions may count the graduate if employment begins “in a single position, for which the institution represents, its program prepares its graduates within six months of the announcement of the first licensure exam results.”
(5) “Placement Rate” is calculated by dividing the number of graduates gainfully employed in the field by the number of graduates available for employment.
Initials: _________ Date: ________ I have read and understand the above placement rates.
EXAMINATION PASSAGE RATES
Calendar Year
Number of Students Taking the Exam (1)
Number Who Passed First Exam Taken (2)
Number Who Failed First Exam Taken
Passage Rate (3)
2011 N/A N/A N/A N/A % 2012 N/A N/A N/A N/A %
(1) “Number of Students Taking Exam” means the number of students who completed the program within 150% of the published program length and who took the exam in the reported calendar year for the first time.
(2) “Number Who Passed First Exam Taken” means the number of students who took and passed the licensing exam in the reported calendar year on the first attempt.
(3) “Passage Rate” is calculated by dividing the number of graduates who pass the exam the first time that they take it by the number of graduates who took the licensing exam for the first time after completion of the program.
Initials:________ Date:______ I have read and understand the above license examination rates.

___________________________ __________________________
___________________________ _________________
SCHOOL PERFORMANCE FACT SHEET (continued) page 3
SALARY AND WAGE INFORMATION: PROGRAM TITLE AND PROGRAM LENGTH:
Calendar Year
Graduates Available for Employment (1)
Graduates Employedin the Field (2)
Annual Salary and Wages Reported by Graduated Employed in the Field (3). Amounts are reported in 5,000 brackets. 51K + = more than 50,000 reported, finally, NR is the number of students not responding to the survey.
5K
10K
15K
20K
25K
30K
35K
40K
45K
50K
51K +
NR
2011 33 16 0 0 0 4 9 2 0 0 0 1 0 2012 24 19 0 1 1 6 7 1 1 0 1 0 0
(1) “Graduates Available for Employment” means the number of graduates minus the number of graduates unavailable for employment. Graduates unavailable for employment mean graduates, who, after graduation, died, become incarcerated, are called to active military duty, are international students that leave the United States or do not have a visa allowing employment in the United States, or are continuing their education in an accredited or bureau-approved postsecondary institution.
(2) “Graduates Employed in the Field” means graduates who are gainfully employed within six months of graduation in a position for which the skills obtained through the education and training provided by the institution are required or provided a significant advantage to the graduate in obtaining the position.
(3) “Salary” is reported by the student. Not all graduates reported salary.
Initials: ________ Date: ______ I have read and understand the above salary and wage information.
Three-Year Cohort Default Rate as Published by USDE
Percentage of EnrolledStudents Receiving FederalStudent Loans
24.5% 72%
Initials: _____ Date: ______ I have read and understand the above USDE financial aid program participation information.
The data reflected on the above charts was gathered using at least one of the following methods: Graduate Surveys, Employer Surveys, Phone Calls, Education Development Department (EDD) and State Licensing Agencies. If you have any further questions or if you want a list of employment positions determined to be within the field for any specific program for which statistics are reported above, please speak with an Admissions Representative or see the School Catalog.
This fact sheet is filed with the Bureau for Private Postsecondary Education. Regardless of any information you may have relating to completion rates, placement rates, starting salaries, or license exam passage rates, this fact sheet contains the information as calculated pursuant to state law.
Any questions a student may have regarding this fact sheet that have not been satisfactorily answered by the institution may be directed to the Bureau for Private Postsecondary Education at: P.O. Box 980818, West Sacramento, CA 95798-0818, www.bppe.ca.gov., P: 888.370.7589 or 916.431.6959, F: 916.263.1897
I have read and understand this School Performance Fact Sheet. The School Performance Fact Sheet was reviewed and discussed with a school official prior to signing an enrollment agreement.
Student Name-Print Student Signature
School Official Date

SCHOOL PERFORMANCE FACT SHEET CET Center: WATSONVILLE
Student Name: _____________________________________________________________ SID No. _______________________
BPPE Fact Sheet for School Name CENTER FOR EMPLOYMENT TRAINING
Disclose by date: September 1, 2013 Street address 10 BLANCA LANE City, State Zip Code WATSONVILLE, CA 95076
Phone number (831) 728-4551 Fax Phone (831) 728-1659
Website WWW.CETWEB.ORG
PROGRAM TITLE – PROGRAM LENGTH
Course Name Clock Hours Published Charges MEDICAL CLERK 720 $8060.00
COMPLETION RATES
Calendar Year
Number of Students Who Began Program (1)
Students Available for Graduation (2)
Graduates (3) Completion Rate (4)
2011 57 57 12 21.05% 2012 41 41 8 19.51%
STUDENTS COMPLETING AFTER PUBLISHED PROGRAM LENGTH--150% COMPLETION RATES
Calendar Year
Number of Students Who Began Program (1)
Students Available for Graduation (2)
150% Graduates (5)
150% Completion Rate (6)
2011 57 57 36 63.16% 2012 41 41 25 60.98%
(1) “Number of Students Who Began Program” means the number of students who began the program who are scheduled to complete the program within the reporting calendar year.
(2) “Students Available for Graduation” means the number of students who began program minus the number of students unavailable for graduation, which means those students who have died, been incarcerated, or called to active military duty.
(3) “Graduates” means the number of students who completed the program within 100% of the published program length.
(4) “Completion Rate” means the number of graduates divided by the number of Students Available for Graduation.
(5) “150% Graduates” means the number of students who completed the program within 101-150% of the published program length.
(6) “150% Completion Rate” means the number of students who completed the program in the reported calendar year within 101-150% of the published program length divided by the number of Students Available for Graduation in the published program length period.
Initials: _______ Date:_______ I have read and understand the above completion rates.

SCHOOL PERFORMANCE FACT SHEET (continued) page 2
PLACEMENT RATES
Calendar Year
Number of Students Who Began Program (1)
Number of Graduates (2)
Graduates Available for Employment(3)
Graduates Employed in the Field (4)
Placement Rate % Employedin the Field (5)
Graduates Employed in the Field an Average of less than 32 Hours per Week
Graduates Employed in the Field at least 32 Hours per Week
2011 57 12 12 7 58.33% 4 3 2012 41 8 8 3 37.50% 1 2
(1) “Number of Students Who Began Program” means the number of students who began the program who are scheduled to complete the program within the reporting calendar year.
(2) “Number of Graduates” means the number of students who have completed the program within 100% of the published program length.
(3) “Graduates Available for Employment” means the number of graduates minus the number of graduates unavailable for employment. Graduates unavailable for employment' means graduates who, after graduation, die, become incarcerated, are called to active military duty, are international students that leave the United States or do not have a visa allowing employment in the United States, or are continuing their education in an accredited or bureau-approved postsecondary institution.
(4) “Graduates Employed in the Field” means a single position for which the institution represents, the program prepare graduates, within six months after the student completes the applicable educational program. For occupations requiring passage of a licensing exam prior to employment, institutions may count the graduate if employment begins “in a single position, for which the institution represents, its program prepares its graduates within six months of the announcement of the first licensure exam results.”
(5) “Placement Rate” is calculated by dividing the number of graduates gainfully employed in the field by the number of graduates available for employment.
Initials: _________ Date: ________ I have read and understand the above placement rates.
EXAMINATION PASSAGE RATES
Calendar Year
Number of Students Taking the Exam (1)
Number Who Passed First Exam Taken (2)
Number Who Failed First Exam Taken
Passage Rate (3)
2011 N/A N/A N/A N/A % 2012 N/A N/A N/A N/A %
(1) “Number of Students Taking Exam” means the number of students who completed the program within 150% of the published program length and who took the exam in the reported calendar year for the first time.
(2) “Number Who Passed First Exam Taken” means the number of students who took and passed the licensing exam in the reported calendar year on the first attempt.
(3) “Passage Rate” is calculated by dividing the number of graduates who pass the exam the first time that they take it by the number of graduates who took the licensing exam for the first time after completion of the program.
Initials:________ Date:______ I have read and understand the above license examination rates.

___________________________ __________________________
___________________________ _________________
SCHOOL PERFORMANCE FACT SHEET (continued) page 3
SALARY AND WAGE INFORMATION: PROGRAM TITLE AND PROGRAM LENGTH:
Calendar Year
Graduates Available for Employment (1)
Graduates Employedin the Field (2)
Annual Salary and Wages Reported by Graduated Employed in the Field (3). Amounts are reported in 5,000 brackets. 51K + = more than 50,000 reported, finally, NR is the number of students not responding to the survey.
5K
10K
15K
20K
25K
30K
35K
40K
45K
50K
51K +
NR
2011 12 7 0 0 2 1 3 1 0 0 0 0 2012 8 3 0 0 1 1 1 0 0 0 0 0 0
(1) “Graduates Available for Employment” means the number of graduates minus the number of graduates unavailable for employment. Graduates unavailable for employment mean graduates, who, after graduation, died, become incarcerated, are called to active military duty, are international students that leave the United States or do not have a visa allowing employment in the United States, or are continuing their education in an accredited or bureau-approved postsecondary institution.
(2) “Graduates Employed in the Field” means graduates who are gainfully employed within six months of graduation in a position for which the skills obtained through the education and training provided by the institution are required or provided a significant advantage to the graduate in obtaining the position.
(3) “Salary” is reported by the student. Not all graduates reported salary.
Initials: ________ Date: ______ I have read and understand the above salary and wage information.
Three-Year Cohort Default Rate as Published by USDE
Percentage of EnrolledStudents Receiving FederalStudent Loans
24.5% 72%
Initials: _____ Date: ______ I have read and understand the above USDE financial aid program participation information.
The data reflected on the above charts was gathered using at least one of the following methods: Graduate Surveys, Employer Surveys, Phone Calls, Education Development Department (EDD) and State Licensing Agencies. If you have any further questions or if you want a list of employment positions determined to be within the field for any specific program for which statistics are reported above, please speak with an Admissions Representative or see the School Catalog.
This fact sheet is filed with the Bureau for Private Postsecondary Education. Regardless of any information you may have relating to completion rates, placement rates, starting salaries, or license exam passage rates, this fact sheet contains the information as calculated pursuant to state law.
Any questions a student may have regarding this fact sheet that have not been satisfactorily answered by the institution may be directed to the Bureau for Private Postsecondary Education at: P.O. Box 980818, West Sacramento, CA 95798-0818, www.bppe.ca.gov., P: 888.370.7589 or 916.431.6959, F: 916.263.1897
I have read and understand this School Performance Fact Sheet. The School Performance Fact Sheet was reviewed and discussed with a school official prior to signing an enrollment agreement.
Student Name-Print Student Signature
School Official Date

SCHOOL PERFORMANCE FACT SHEET CET Center: WATSONVILLE
Student Name: _____________________________________________________________ SID No. _______________________
BPPE Fact Sheet for School Name CENTER FOR EMPLOYMENT TRAINING
Disclose by date: September 1, 2013 Street address 10 BLANCA LANE City, State Zip Code WATSONVILLE, CA 95076
Phone number (831) 728-4551 Fax Phone (831) 728-1659
Website WWW.CETWEB.ORG
PROGRAM TITLE – PROGRAM LENGTH
Course Name Clock Hours Published Charges WELDING FABRICATION 900 $9307.00
COMPLETION RATES
Calendar Year
Number of Students Who Began Program (1)
Students Available for Graduation (2)
Graduates (3) Completion Rate (4)
2011 22 22 5 22.73% 2012 14 14 7 50.00%
STUDENTS COMPLETING AFTER PUBLISHED PROGRAM LENGTH--150% COMPLETION RATES
Calendar Year
Number of Students Who Began Program (1)
Students Available for Graduation (2)
150% Graduates (5)
150% Completion Rate (6)
2011 22 22 12 54.55% 2012 14 14 7 50.00%
(1) “Number of Students Who Began Program” means the number of students who began the program who are scheduled to complete the program within the reporting calendar year.
(2) “Students Available for Graduation” means the number of students who began program minus the number of students unavailable for graduation, which means those students who have died, been incarcerated, or called to active military duty.
(3) “Graduates” means the number of students who completed the program within 100% of the published program length.
(4) “Completion Rate” means the number of graduates divided by the number of Students Available for Graduation.
(5) “150% Graduates” means the number of students who completed the program within 101-150% of the published program length.
(6) “150% Completion Rate” means the number of students who completed the program in the reported calendar year within 101-150% of the published program length divided by the number of Students Available for Graduation in the published program length period.
Initials: _______ Date:_______ I have read and understand the above completion rates.

SCHOOL PERFORMANCE FACT SHEET (continued) page 2
PLACEMENT RATES
Calendar Year
Number of Students Who Began Program (1)
Number of Graduates (2)
Graduates Available for Employment(3)
Graduates Employed in the Field (4)
Placement Rate % Employedin the Field (5)
Graduates Employed in the Field an Average of less than 32 Hours per Week
Graduates Employed in the Field at least 32 Hours per Week
2011 22 5 5 4 80.00% 1 3 2012 14 7 7 7 100.00% 1 6
(1) “Number of Students Who Began Program” means the number of students who began the program who are scheduled to complete the program within the reporting calendar year.
(2) “Number of Graduates” means the number of students who have completed the program within 100% of the published program length.
(3) “Graduates Available for Employment” means the number of graduates minus the number of graduates unavailable for employment. Graduates unavailable for employment' means graduates who, after graduation, die, become incarcerated, are called to active military duty, are international students that leave the United States or do not have a visa allowing employment in the United States, or are continuing their education in an accredited or bureau-approved postsecondary institution.
(4) “Graduates Employed in the Field” means a single position for which the institution represents, the program prepare graduates, within six months after the student completes the applicable educational program. For occupations requiring passage of a licensing exam prior to employment, institutions may count the graduate if employment begins “in a single position, for which the institution represents, its program prepares its graduates within six months of the announcement of the first licensure exam results.”
(5) “Placement Rate” is calculated by dividing the number of graduates gainfully employed in the field by the number of graduates available for employment.
Initials: _________ Date: ________ I have read and understand the above placement rates.
EXAMINATION PASSAGE RATES
Calendar Year
Number of Students Taking the Exam (1)
Number Who Passed First Exam Taken (2)
Number Who Failed First Exam Taken
Passage Rate (3)
2011 N/A N/A N/A N/A % 2012 N/A N/A N/A N/A %
(1) “Number of Students Taking Exam” means the number of students who completed the program within 150% of the published program length and who took the exam in the reported calendar year for the first time.
(2) “Number Who Passed First Exam Taken” means the number of students who took and passed the licensing exam in the reported calendar year on the first attempt.
(3) “Passage Rate” is calculated by dividing the number of graduates who pass the exam the first time that they take it by the number of graduates who took the licensing exam for the first time after completion of the program.
Initials:________ Date:______ I have read and understand the above license examination rates.

___________________________ __________________________
___________________________ _________________
SCHOOL PERFORMANCE FACT SHEET (continued) page 3
SALARY AND WAGE INFORMATION: PROGRAM TITLE AND PROGRAM LENGTH:
Calendar Year
Graduates Available for Employment (1)
Graduates Employedin the Field (2)
Annual Salary and Wages Reported by Graduated Employed in the Field (3). Amounts are reported in 5,000 brackets. 51K + = more than 50,000 reported, finally, NR is the number of students not responding to the survey.
5K
10K
15K
20K
25K
30K
35K
40K
45K
50K
51K +
NR
2011 5 4 0 0 0 4 0 0 0 0 0 0 0 2012 7 7 0 0 0 3 4 0 0 0 0 0 0
(1) “Graduates Available for Employment” means the number of graduates minus the number of graduates unavailable for employment. Graduates unavailable for employment mean graduates, who, after graduation, died, become incarcerated, are called to active military duty, are international students that leave the United States or do not have a visa allowing employment in the United States, or are continuing their education in an accredited or bureau-approved postsecondary institution.
(2) “Graduates Employed in the Field” means graduates who are gainfully employed within six months of graduation in a position for which the skills obtained through the education and training provided by the institution are required or provided a significant advantage to the graduate in obtaining the position.
(3) “Salary” is reported by the student. Not all graduates reported salary.
Initials: ________ Date: ______ I have read and understand the above salary and wage information.
Three-Year Cohort Default Rate as Published by USDE
Percentage of EnrolledStudents Receiving FederalStudent Loans
24.5% 72%
Initials: _____ Date: ______ I have read and understand the above USDE financial aid program participation information.
The data reflected on the above charts was gathered using at least one of the following methods: Graduate Surveys, Employer Surveys, Phone Calls, Education Development Department (EDD) and State Licensing Agencies. If you have any further questions or if you want a list of employment positions determined to be within the field for any specific program for which statistics are reported above, please speak with an Admissions Representative or see the School Catalog.
This fact sheet is filed with the Bureau for Private Postsecondary Education. Regardless of any information you may have relating to completion rates, placement rates, starting salaries, or license exam passage rates, this fact sheet contains the information as calculated pursuant to state law.
Any questions a student may have regarding this fact sheet that have not been satisfactorily answered by the institution may be directed to the Bureau for Private Postsecondary Education at: P.O. Box 980818, West Sacramento, CA 95798-0818, www.bppe.ca.gov., P: 888.370.7589 or 916.431.6959, F: 916.263.1897
I have read and understand this School Performance Fact Sheet. The School Performance Fact Sheet was reviewed and discussed with a school official prior to signing an enrollment agreement.
Student Name-Print Student Signature
School Official Date