School of Chemistry Faculty of Science and Agriculture ...
205
School of Chemistry Faculty of Science and Agriculture University of KwaZulu-Natal Durban OZONE INITIATED OXIDATION OF ORGANIC POLLUTANTS, M-XYLENE AND 2-CHLOROETHANOL by ASOGAN NOKAN GOUNDEN
Transcript of School of Chemistry Faculty of Science and Agriculture ...

School of Chemistry Faculty of Science and Agriculture
University of KwaZulu-Natal Durban
OZONE INITIATED OXIDATION OF
ORGANIC POLLUTANTS M-XYLENE AND 2-CHLOROETHANOL
by
ASOGAN NOKAN GOUNDEN
OZONE INITIATED OXIDATION OF ORGANIC POLLUTANTS M-XYLENE AND 2-CHLOROETHANOL
by
ASOGAN NOKAN GOUNDEN
Submitted in fulfilment of the academic requirements for the degree of
MASTER IN SCIENCE
in the School of Chemistry
Faculty of Science and Agriculture
University of KwaZulu-Natal
Durban
Supervisor Professor S B Jonnalagadda
2010
ABSTRACT
A variety of hazardous organic compounds are present in leachate from landfill sites that
accept medical and industrial chemical waste Most of these compounds find their way
into nearby streams rivers and dams posing a threat to the ecosystem In the present
work two hazardous organic compounds namely m-xylene and 2-chloroethanol were
chosen to react with ozone gas at different experimental conditions
The ozone initiated oxidation of m-xylene and 2-chloroethanol in solvent free conditions
were investigated as a function of time Gas chromatographic analysis of ozonated
m-xylene showed an increase in the conversion of substrate from about 1 after 3 hours
to about 14 after 24 hours Some of the ozonation products identified were formic acid
acetic acid 3-methylbenzylalcohol 3-methylbenzaldehyde and 3-methylbenzoic acid
The presence of acetic acid ethyl acetate or acetone during ozonation significantly
improved the percent conversion of m-xylene relative to similar products obtained under
solvent free conditions The presence of activated charcoal during ozonation of m-xylene
showed marginal improvement in percent conversion compared to solvent free ozonation
The oxidation of 2-chloroethanol was followed by monitoring the consumption of the
halogenated organic substrate which showed an increase in conversion from about 2
after 3 hours to about 46 after 12 hours Ozonated products contained a mixture of
acetaldehyde and acetic acid It was also found that the ozonation of 2-chloroethanol
yielded quantitative amounts of chloride ions The percent conversion of 2-chloroethanol
in the presence of acetic acid and ethyl acetate were higher than those under solvent free
conditions The use of activated charcoal during ozonolysis of 2-chloroethanol showed a
significant increase in percent conversion of the substrate Since 2-chloroethanol has a
higher solubility in water than m-xylene the effects of solution pH activated charcoal and
hydrogen peroxide on ozone initiated reactions were studied Solutions of
2-chloroethanol maintained at pH level 4 and 7 showed marginal changes in percent
conversion compared to ozonation alone however percent conversion improved
significantly when the pH of the solution was increased to 10 The ozonation of
2-chloroethanol in the presence of 5 hydrogen peroxide in water at pH levels 4 and 7
showed marginal changes in percent conversion compared to ozonation alone however
percent conversion and product yields improved significantly when the pH of the
solution was increased to 10 Increasing the strength of the hydrogen peroxide in the
reaction mixture from 5 to 10 had very little effect in the percent conversion of
2-chloroethanol and product formation
Based on the experimental findings the overall reaction mechanism for the reaction of
both m-xylene and 2-chloroethanol with ozone is described
DECLARATION
I Asogan Nokan Gounden declare that
1 The research reported in this thesis except where otherwise indicated is my
original research
2 The thesis has not been submitted for any degree or examination at any other
university
3 This thesis does not contain other personsrsquo data pictures graphs or other
information unless specifically acknowledged as being sourced from other
personsrsquo
4 This thesis does not contain other personsrsquo writing unless specifically
acknowledged as being sourced from other researchers Where other written
sources have been quoted then
a Their words have been re-written but the general information attributed to them
has been referenced
b Where their exact words have been used then their writing has been placed in
italics and inside quotation marks and referenced
5 The thesis does not contain text graphics or tables copied and pasted from the
internet unless specifically acknowledged and the source being detailed in the
thesis and in the References sections
PREFACE
The experimental work described in this thesis was carried out in the Department of
Analytical Chemistry Faculty of Natural Science Mangosuthu University of
Technology Umlazi and at the School of Chemistry University of KwaZulu-Natal
Westville Campus from June 2006 to December 2009 under the supervision of Professor
SB Jonnalagadda
These studies represent original work by the author and have not otherwise been
submitted in any form for any degree or diploma to any tertiary institution Where use has
been made of the work of others it is duly acknowledged in the text
_______________________ _________________
Asogan Nokan Gounden Date
ACKNOWLEDGEMENTS
I express my sincere thanks and appreciation to the following people
Professor SB J onnalagadda fo r his expert guidance and inspi ration dur ing thi s
study I have been fortunate to be blessed with a mentor of his caliber
Dr MM Shapi for his support e ncouragement and c onstructive su ggestions
during the difficult times
The inst rument laboratory staff of th e S chool of C hemistry (UKZN-Westville
Campus) especially Ani ta Naidoo and staf f for the use of the GC-MS LC-MS
and FTIR instruments
The labor atory staff o f Mang osuthu University of Te chnology Chemistry
Department for their support and assistance
Mr Dilip fr om the NMR unit (U KZN ndash Westville C ampus) for the use a nd
assistance with NMR spectra studies
The University of KwaZulu-Natal and Mangosuthu University of Technology for
financial assistance
My wife Saraspathy daughter Jayandree and son Kaylin for their encouragement
and patience during my years of study
PRESENTATION AT CONFERENCES
1 Poster presentation entitled ldquoOzone Initiated Oxidation of m-Xylenerdquo at the 40th
National Convention of the South African Chemical Institute Cape Town South
Africa December 2008
CONTENTS
Page Number
LIST OF FIGURES i
LIST OF TABLES ix
LIST OF SCHEMES xiii
ABBREVIATIONS xiv
CHAPTER 1
INTRODUCTION AND LITERATURE SURVEY
10 Introduction 1
11 Occurrence and uses of xylene 2
12 Properties of xylene 3
13 Xylene in the environment 4
14 Transformation of xylene 6
141 Biodegradation of xylenes 6
1411 Aerobic biodegradation 6
1412 Anaerobic biodegradation 8
142 Abiotic Degradation 11
4121 Photolysis 11
4122 Atmospheric Oxidation 11
143 Biofiltration 11
15 Occurrence of halogenated organic compounds 13
16 Properties of 2-chloroethanol 14
17 Transformation of 2-chloroethanol 15
18 Oxidation of organic compounds 17
19 Properties of ozone 23
110 History of ozone-organic chemistry 25
111 Types of ozone attack 29
112 Aqueous ozonation chemistry 32
113 Motivation for the study 36
114 Hypothesis 36
115 Objectives of the study 37
CHAPTER 2
EXPERIMENTAL METHODS
20 Introduction 38
21 Ozonation experiments 39
22 Ozonation of m-xylene and 2-chloroethanol 41
23 Ozonation of m-xylene and 2-CE in the presence of organic solvents 41
231 Ozonation of m-xylene and 2-CE in acetic acid and ethyl acetate 42
2311 Ozonation of m-xylene and 2-CE in the presence of 5 acetic acid 42
2312 Ozonation of m-xylene and 2-CE in the presence of 20 acetic acid 43
24 Ozonation of m-xylene in the presence of AA in an aqueous medium 43
241 Ozonation of 1 m-xylene in the presence of AA and acetone 44
242 Ozonation of 1 m-xylene in AA and acetone in the presence of water 44
25 Ozonation of m-xylene in the presence of activated carbon 45
26 GC-MS analysis 45
27 Gas chromatography analysis 46
28 Extraction of carboxylic acids from product mixture 46
29 FTIR analysis 47
210 Calculation of conversion of substrate molecule after ozonation 48
211 Calculation of selectivity and yield of products after ozonation 49
CHAPTER 3
OZONE INITIATED OXIDATION OF M-XYLENE
30 Introduction 51
31 Calibration of ozone generator 51
32 Oxidation of m-xylene under solvent free conditions 52
33 Product characterization for ozonation of pure m-xylene 53
331 GC-MS analysis of m-xylene and product mixture 53
332 FTIR analysis of product mixture 55
333 Analysis of isolated products by 1H NMR 55
34 Ozonation of m-xylene in the presence of organic solvents 59
341 Effect of acetic acid on ozonation of m-xylene 60
342 Comparison of data for ozone initiated oxidation of m-xylene in AA 64
343 Effect of ethyl acetate on ozonation of m-xylene 68
344 Comparison of data for ozone initiated oxidation of m-xylene in EA 73
345 Ozonation of 1 m-xylene in EA 76
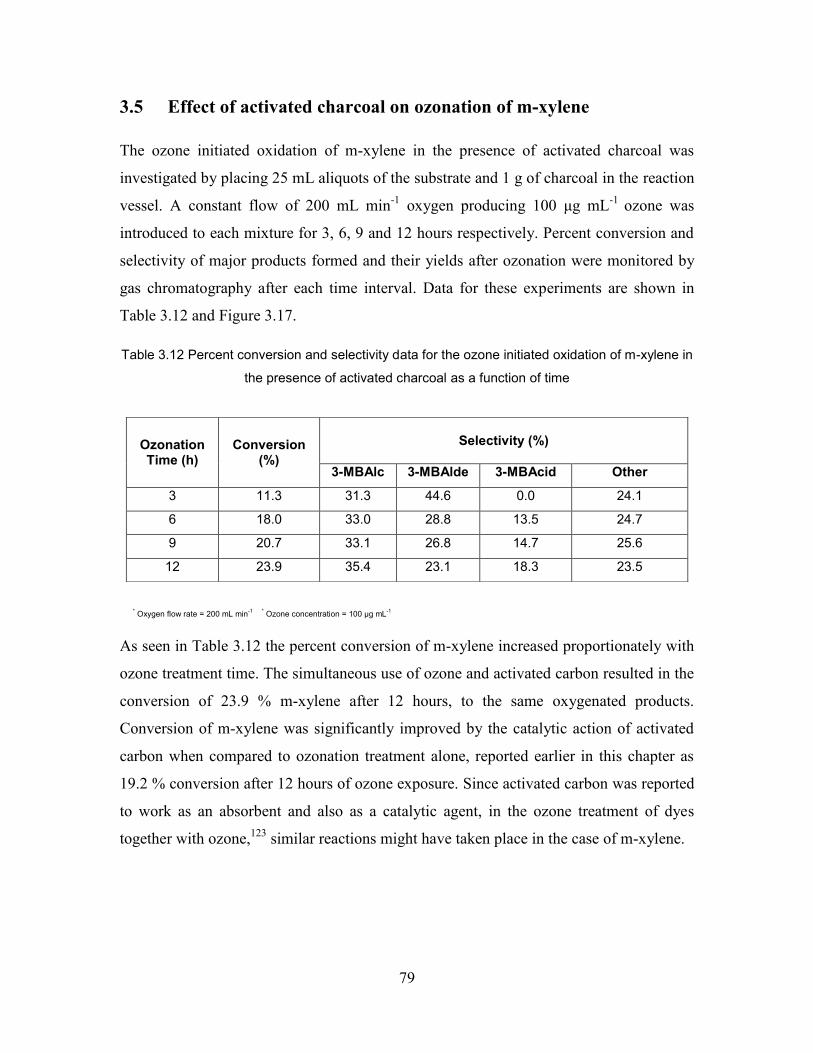
35 Effect of activated charcoal on ozonation of m-xylene 79
351 Comparison of data for ozone initiated oxidation of m-xylene in
the presence of activated charcoal 82
36 Ozonation of 1 m-xylene in the presence of water 85
37 Reaction sequence for m-xylene ozonation 88
CHAPTER 4
OZONE INITIATED OXIDATION OF 2-CHLOROETHANOL
40 Introduction 91
41 Product identification for ozonation of 2-chloroethanol 91
411 Chloride and Conductivity analysis of product mixture 92
412 Analysis of the product mixture by 1H NMR 92
413 Analysis of the product mixture by GC-MS 92
414 Analysis of the product mixture by FTIR 93
42 Oxidation of 2-chloroethanol under solvent free conditions 93
43 Ozone initiated oxidation of 2-CE in the presence of organic solvents 97
431 Effect of acetic acid on ozonation of 2-chloroethanol 97
432 Comparison of data for ozonation of 2-CE in the presence of AA 103
433 Effect of ethyl acetate on ozonation of 2-chloroethanol 106
434 Comparison of data for ozonation of 2-CE in the presence of EA 111
44 Effect of activated charcoal on ozonation of 2-chloroethanol 114
441 Comparison of data for ozonation of 2-CE in the presence of
activated charcoal 117
45 Ozone initiated oxidation of 2-chloroethanol in aqueous medium 121
451 Effect pH on the ozonation of 2-chloroethanol 122
452 Comparison of data for ozone initiated oxidation of 2-CE at different
pH levels 126
46 Effect of activated charcoal on the ozonation of 2-CE in water 130
461 Comparison of data for ozone initiated oxidation of an aqueous solution
of 2-CE in the presence of activated charcoal 134
47 Effect of hydrogen peroxide on ozonation of 2-CE in water 138
471 Comparison of data for ozone initiated oxidation of an aqueous solution
of 2-CE in the presence of hydrogen peroxide 146
48 Reaction pathway for ozonation of 2-chloroethanol 151
CHAPTER 5
CONCLUSIONS
50 Conclusions 153
51 Ozonation of m-xylene 153
52 Ozonation of 2-chloroethanol 154
53 Future work 155
REFERENCES 157
APPENDIX 166
i
LIST OF FIGURES
Page Number
Figure 11 Isomers of xylene 4
Figure 12 Canonical forms of the ozone molecule 24
Figure 13 List of functional groups that can be readily attacked by ozone 31
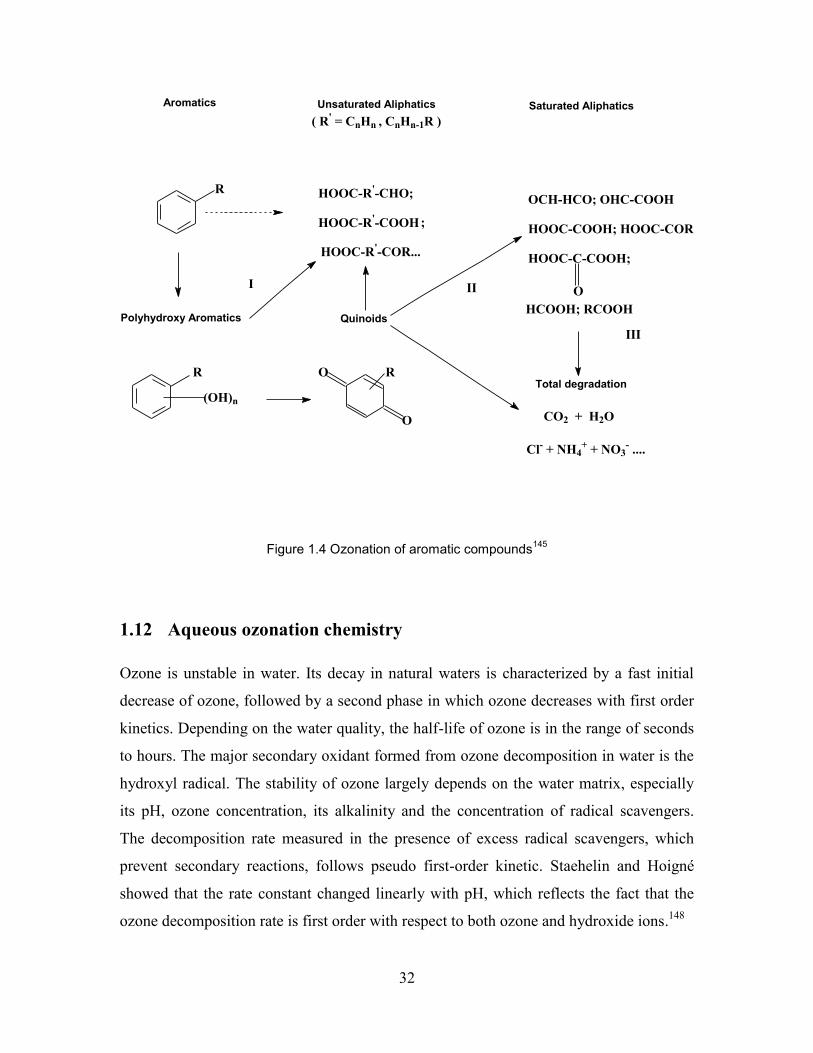
Figure 14 Ozonation of aromatic compounds 32
Figure 20 Schematic of a corona discharge unit showing how ozone is generated 39
Figure 21 Schematic of experimental apparatus for ozonation reactions 40
Figure 30 Percent conversion of m-xylene and product selectivity versus
ozonation time 57
Figure 31 Percent yield of products versus ozone treatment time 58
Figure 32 Percent conversion of m-xylene and selectivity profiles of product
formation versus ozonation time (m-xylene with 5 acetic acid) 61
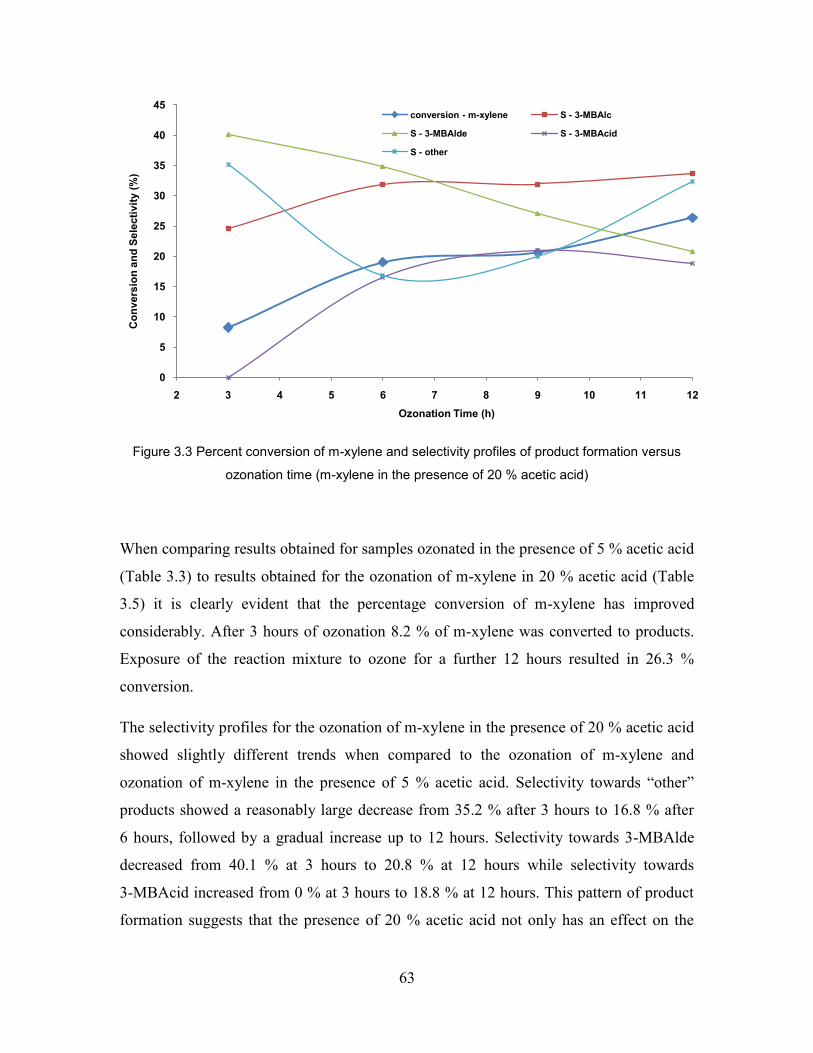
Figure 33 Percent conversion of m-xylene and selectivity profiles of product
formation versus ozonation time (m-xylene with 20 acetic acid) 63
Figure 34 Comparison of percent conversion of m-xylene and m-xylene in
acetic acid versus ozonation time 65
Figure 35 Comparison of percent yield of 3-MBAlc formed during ozonation
of m-xylene and m-xylene in acetic acid versus time 66
Figure 36 Comparison of percent yield of 3-MBAlde formed during ozonation
of m-xylene and m-xylene in acetic acid versus time 66
Figure 37 Comparison of percent yield of 3-MBAcid formed during ozonation
of m-xylene and m-xylene in acetic acid versus time 67
ii
Figure 38 Comparison of percent yield of ldquootherrdquo products formed during
ozonation of m-xylene and m-xylene in acetic acid versus time 67
Figure 39 Percent conversion of m-xylene and selectivity profiles of product
formation versus ozonation time (m-xylene with 5 ethyl acetate) 69
Figure 310 Percent conversion of m-xylene and selectivity profiles of product
formation versus ozonation time (m-xylene with 20 ethyl acetate) 71
Figure 311 Comparison of percent conversion of m-xylene and m-xylene in ethyl
acetate versus ozonation time 73
Figure 312 Comparison of percent yield of 3-MBAlc formed during ozonation of
m-xylene and m-xylene in ethyl acetate versus time 74
Figure 313 Comparison of percent yield of 3-MBAlde formed during ozonation of
m-xylene and m-xylene in ethyl acetate versus time 74
Figure 314 Comparison of percent yield of 3-MBAcid formed during ozonation of
m-xylene and m-xylene in ethyl acetate versus time 75
Figure 315 Comparison of percent yield of ldquootherrdquo products formed during
ozonation of m-xylene and m-xylene in ethyl acetate versus time 75
Figure 316 Percent conversion of m-xylene and selectivity profiles of product
formation for ozonation of 1 m-xylene in ethyl acetate versus time 77
Figure 317 Percent conversion of m-xylene and selectivity profiles of product
formation versus ozonation time (m-xylene with 1 g activated charcoal) 80
Figure 318 Comparison of percent conversion of m-xylene and m-xylene with
activated charcoal versus ozonation time 82
Figure 319 Comparison of percent yield of 3-MBAlc formed during ozonation of
m-xylene and m-xylene in the presence of activated charcoal 83
iii
Figure 320 Comparison of percent yield of 3-MBAlde formed during ozonation of
m-xylene and m-xylene in the presence of activated charcoal 83
Figure 321 Comparison of percent yield of 3-MBAcid formed during ozonation of
m-xylene and m-xylene in the presence of activated charcoal 84
Figure 322 Comparison of percent yield of ldquootherrdquo products formed during
ozonation of m-xylene and m-xylene with activated charcoal 84
Figure 323 Comparison of percent conversion of m-xylene in 100 acetic acid
and 70 30 ratio acetic acid water versus ozonation time 86
Figure 324 Comparison of percent conversion of m-xylene in 100 and
70 30 ratio acetone water versus ozonation time 88
Figure 40 Percent conversion of 2-CE and product selectivity versus ozonation
time 94
Figure 41 Chloride ion content and solution conductivity of ozonated 2-CE
versus time 95
Figure 42 Percentage yield of AcAlde AA and unknown product versus
ozonation time 96
Figure 43 Percent conversion of 2-chloroethanol in the presence of 5 acetic
acid and selectivity profile of products versus ozonation time 98
Figure 44 Percent conversion of 2-chloroethanol in the presence of 20 acetic
acid and selectivity profile of products versus ozonation time 101
Figure 45 Comparison of 2-chloroethanol conversion with and without the
presence of acetic acid versus ozonation time 103
Figure 46 Comparison of selectivity for AcAlde and AA formed during the
ozonation of 2-chloroethanol with and without the presence of acetic
acid versus time 104
iv
Figure 47 Comparison of yield of AcAlde and AA formed during the ozonation
of 2-chloroethanol with and without the presence of acetic acid
versus time 105
Figure 48 Comparison of chloride ion formed during the ozonation of 2-CE
with and without the presence of acetic acid versus time 106
Figure 49 Percent conversion of 2-CE in the presence of 5 ethyl acetate
and selectivity profile for products as a function of ozonation time 107
Figure 410 Percent conversion of 2-CE in the presence of 20 ethyl acetate
and selectivity profile of products as a function of ozonation time 109
Figure 411 Comparison of 2-chloroethanol conversion with and without the
presence ethyl acetate versus ozonation time 111
Figure 412 Comparison of selectivity for AcAlde and AA formed during the
ozonation of 2-CE with and without the presence of ethyl acetate
versus time 112
Figure 413 Comparison of yield of AcAlde and AA formed during the ozonation
of 2-CE with and without the presence of ethyl acetate versus time 113
Figure 414 Comparison of chloride ion formed during the ozonation of 2-CE
with and without the presence of ethyl acetate versus time 114
Figure 415 Percent conversion of 2-chloroethanol in the presence of activated
charcoal and selectivity profile for products as a function of
ozonation time 116
Figure 416 Comparison of percent conversion of 2-chloroethanol with and
without the presence of activated charcoal versus ozonation time 118
Figure 417 Comparison of selectivity for AcAlde and AA formed during the
ozonation of 2-CE with and without the presence of activated
charcoal versus time 119
v
Figure 418 Comparison of yield of AcAlde and AA formed during the ozonation
of 2-CE with and without the presence of activated charcoal 119
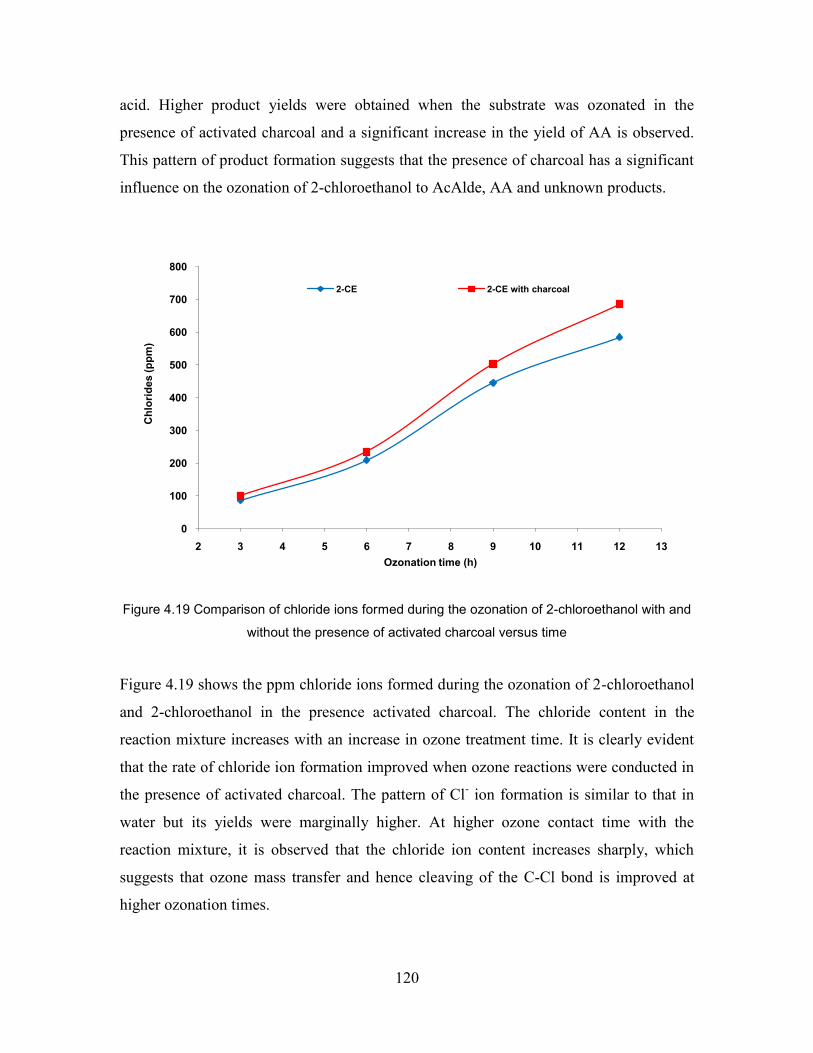
Figure 419 Comparison of chloride ions formed during the ozonation of 2-CE
with and without the presence of activated charcoal versus time 120
Figure 420 Percent conversion of 10 2-CE in water at pH 4 and selectivity
profiles of AcAlde AA and unknown versus ozonation time 123
Figure 421 Percent conversion of 10 2-CE in water at pH 7 and selectivity
profiles of AcAlde AA and unknown versus ozonation time 124
Figure 422 Percent conversion of 10 2-CE in water at pH 10 and selectivity
profiles of AcAlde AA and unknown versus ozonation time 126
Figure 423 Comparison of percent conversion of 10 2-CE in water at pH 4 7
and 10 versus ozonation time 127
Figure 424 Comparison of selectivity for AcAlde and AA formed during the
ozonation of 10 2-CE in water at pH 4 7 and 10 versus time 128
Figure 425 Comparison of yield of AcAlde and AA formed during the ozonation
of 10 2-CE in water at pH 4 7 and 10 versus time 128
Figure 426 Comparison of chloride ions formed during the ozonation of 10
2-CE in water at pH 4 7 and 10 versus time 129
Figure 427 Percent conversion of 10 2-CE in the presence of activated charcoal
in water at pH 4 and selectivity profile of products versus time 131
Figure 428 Percent conversion of 10 2-CE in the presence of activated charcoal
in water at pH 7 and selectivity profile of products versus time 132
Figure 429 Percent conversion of 10 2-CE in the presence of activated charcoal
in water at pH 10 and selectivity profile of products versus time 133
vi
Figure 430 Comparison of percent conversion of 2-CE versus ozonation time
(10 2-CE + 1 g activated charcoal in water at pH 4 7 and 10) 134
Figure 431 Comparison of yield of AcAlde and AA formed during the ozonation
of 1 g charcoal and 10 2-CE in water at pH 4 versus time 135
Figure 432 Comparison of yield of AcAlde and AA formed during the ozonation
of 1 g charcoal and 10 2-CE in water at pH 7 versus time 136
Figure 433 Comparison of yield of AcAlde and AA formed during the ozonation
of 1 g activated charcoal and 10 2-CE in water at pH 10 versus time 136
Figure 434 Comparison of chloride ions formed during the ozonation of 1 g
charcoal and 10 2-CE in water at pH 4 7 and 10 versus time 137
Figure 435 Percent conversion of 10 2-CE in the presence of 5 H2O2 in water
at pH 4 and selectivity profile of products versus ozonation time 139
Figure 436 Percent conversion of 10 2-CE in the presence of 5 H2O2 in water
at pH 7 and selectivity profile of products versus ozonation time 140
Figure 437 Percent conversion of 10 2-CE in the presence of 5 H2O2 in water
at pH 10 and selectivity profile of products versus ozonation time 141
Figure 438 Percent conversion of 10 2-CE in the presence of 10 H2O2 in water
at pH 4 and selectivity profile of products versus ozonation time 143
Figure 439 Percent conversion of 10 2-CE in the presence of 10 H2O2 in water
at pH 7 and selectivity profile of products versus ozonation time 144
Figure 440 Percent conversion of 10 2-CE in the presence of 10 H2O2 in water
at pH 10 and selectivity profile of products versus ozonation time 145
Figure 441 Comparison of percent conversion of 2-CE with and without the
presence of H2O2 (10 2-CE + 5 H2O2 in water at pH 4) 146
vii
Figure 442 Comparison of percent conversion of 2-CE with and without the
presence of H2O2 (10 2-CE + 5 H2O2 in water at pH 7) 146
Figure 443 Comparison of percent conversion of 2-CE with and without the
presence of H2O2 (10 2-CE + 5 H2O2 in water at pH 10) 147
Figure 444 Comparison of percent yield of AcAlde and AA formed with and
without the presence of H2O2 (10 2-CE + H2O2 in water at pH 4) 148
Figure 445 Comparison of percent yield of AcAlde and AA formed with and
without the presence of H2O2 (10 2-CE + H2O2 in water at pH 7) 148
Figure 446 Comparison of percent yield of AcAlde and AA formed with and
without the presence of H2O2 (10 2-CE + H2O2 in water at pH 10) 149
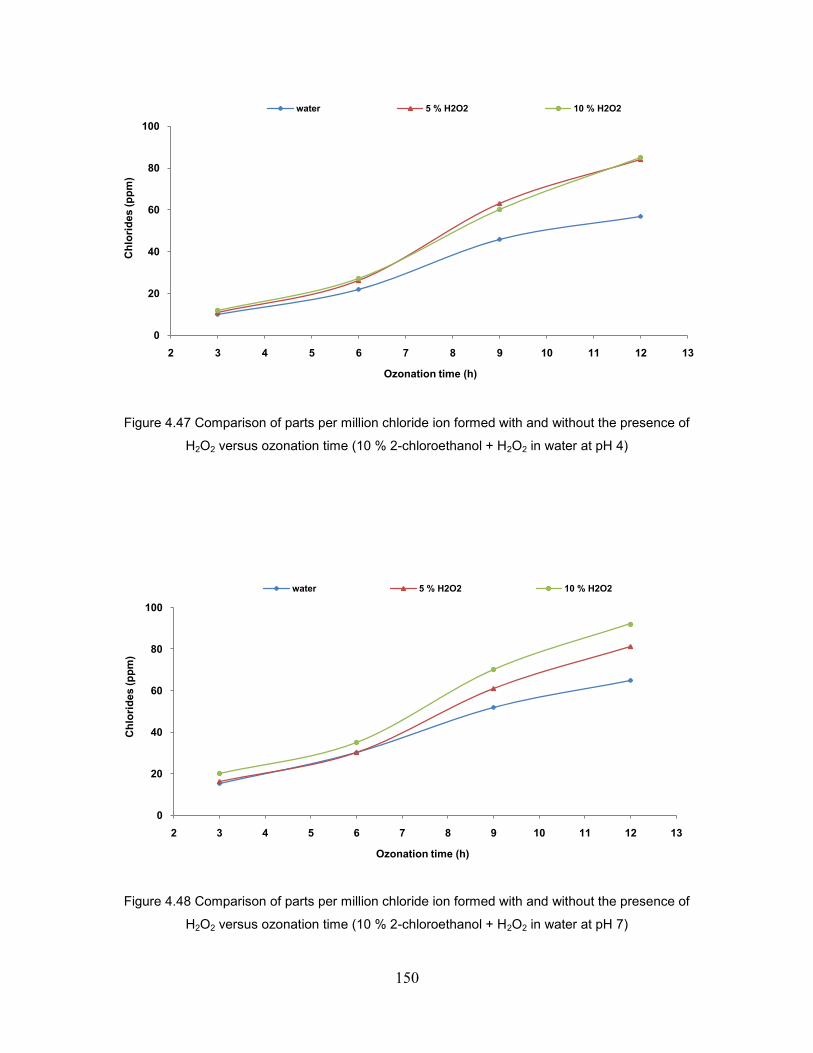
Figure 447 Comparison of parts per million chloride ion formed with and without
the presence of H2O2 (10 2-CE + H2O2 in water at pH 4) 150
Figure 448 Comparison of parts per million chloride ion formed with and without
the presence of H2O2 (10 2-CE + H2O2 in water at pH 7) 150
Figure 449 Comparison of parts per million chloride ion formed with and without
the presence of H2O2 (10 2-CE + H2O2 in water at pH 10) 151
Figure A30 Chromatogram of pure m-xylene before ozonation 166
Figure A31 Chromatogram of pure m-xylene after 12 h ozonation 166
Figure A32 Mass spectrum of m-xylene 165
Figure A33 Mass Spectrum of 3-methylbenzaldehyde 167
Figure A34 Mass spectrum of 3-methylbenzoic acid 168
Figure A35 Mass spectrum formic acid 168
Figure A36 FTIR spectrum of pure m-xylene before ozonation 169
Figure A37 FTIR spectrum of m-xylene after 12 hours ozonation 170
viii
Figure A38 1H NMR spectrum of 3-methylbenzyl alcohol 171
Figure A39 1H NMR spectrum of 3-methylbenzoic acid 172
Figure A40 Chromatogram of 2-chloroethanol before ozonation 173
Figure A41 Chromatogram of 2-chloroethanol after 18 hours ozonation 173
Figure A42 1H NMR spectrum of acetaldehyde 174
Figure A43 Mass spectrum of acetic acid 175
Figure A44 FTIR spectrum of 2-chloroethanol before ozonation 176
Figure A45 FTIR spectrum of 2-chloroethanol after 18 hours ozonation 177
ix
LIST OF TABLES
Page Number
Table 11 Physical and Chemical Properties of Xylenes 3
Table 12 Physical and Chemical Properties of 2-Chloroethanol 15
Table 13 Comparative reduction potentials measured at 25 oC 16
Table 14 Some organic compounds that can be oxidized by bullOH radicals 18
Table 15 Important physical constants of ozone 24
Table 20 GC-MS method and instrument parameters 46
Table 21 GC method and instruments parameters 46
Table 30 Ozone concentration data obtained at different oxygen flow rates and
currents measured at 25 oC 52
Table 31 Percent conversion of m-xylene and selectivity data for the ozone
initiated oxidation of m-xylene as a function of time 56
Table 32 Percent yield of identified products for the ozone initiated oxidation
of m-xylene as a function of time 58
Table 33 Percent conversion and selectivity data for the ozone initiated oxidation
of m-xylene in the presence of 5 acetic acid as a function of time 60
Table 34 Percent yield of identified products for the ozone initiated oxidation
of m-xylene in the presence of 5 acetic acid as a function of time 62
Table 35 Percent conversion and selectivity data for the ozone initiated oxidation
of m-xylene in the presence of 20 acetic acid as a function of time 62
Table 36 Percent yield of identified products for the ozone initiated oxidation
of m-xylene in the presence of 20 acetic acid as a function of time 63
x
Table 37 Percent conversion and selectivity data for the ozone initiated oxidation
of m-xylene in the presence of 5 ethyl acetate as a function of time 69
Table 38 Percent yield of identified products for the ozone initiated oxidation
of m-xylene in the presence of 5 ethyl acetate as a function of time 70
Table 39 Percent conversion and selectivity data for the ozone initiated
oxidation of m-xylene with 20 ethyl acetate as a function of time 71
Table 310 Percent yield of identified products for the ozone initiated oxidation
of m-xylene with 20 ethyl acetate as a function of time 72
Table 311 Percent conversion and selectivity data for the ozone initiated oxidation
of 1 m-xylene in the presence of ethyl acetate as a function of time 77
Table 312 Percent conversion and selectivity data for the ozone initiated oxidation
of m-xylene in the presence of activated charcoal as a function of time 79
Table 313 Percent yield of identified products for the ozone initiated oxidation
of m-xylene in the presence of activated charcoal as a function of time 81
Table 314 Percent conversion of m-xylene in 100 and 70 acetic acid as a
function of ozone treatment time 86
Table 315 Percent conversion of m-xylene in 100 and 70 acetone as a
function of ozone treatment time 87
Table 40 Percent conversion of 2-CE and product selectivity data for the ozone
initiated oxidation of 20 mL 2-CE as a function of time 94
Table 41 Solution conductivity chloride ion content and product yields for the
ozonation of 2-CE as a function of time 95
Table 42 Percent conversion and product selectivity data for the ozone initiated
oxidation of 2-CE in 5 acetic acid as a function of time 97
xi
Table 43 Solution conductivity chloride ion content and product yields for the
ozonation of 2-CE in 5 acetic acid as a function of time 99
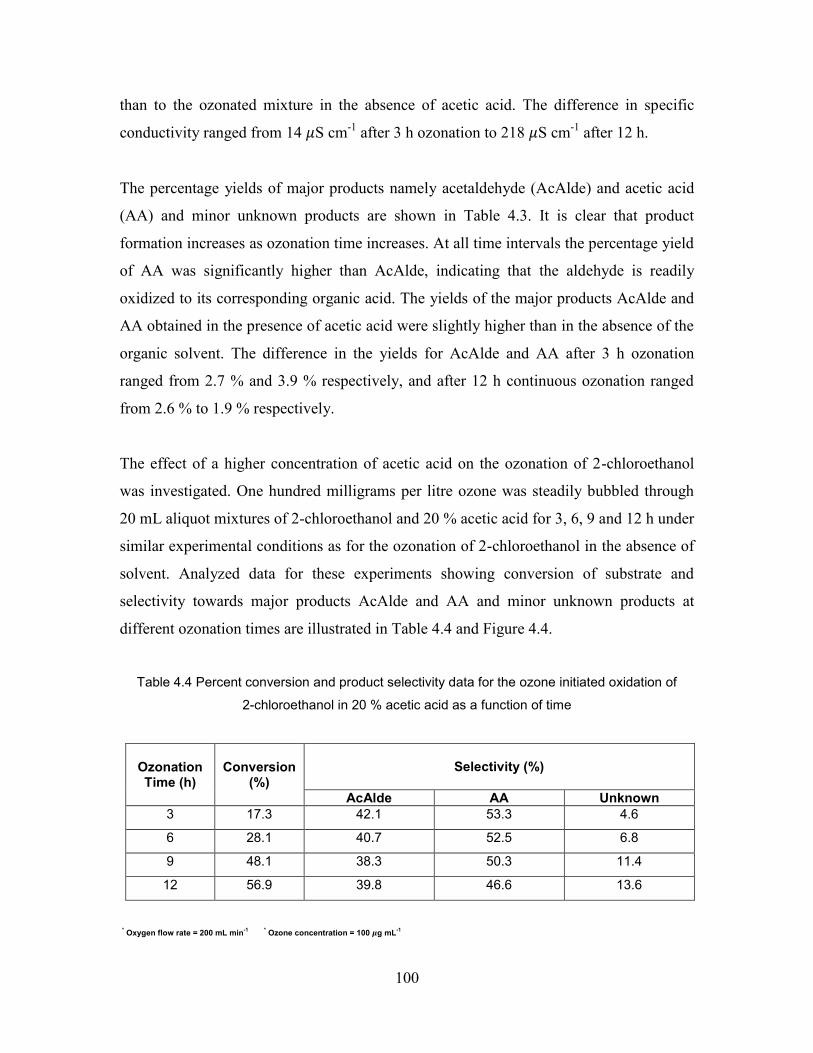
Table 44 Percent conversion and product selectivity data for the ozone initiated
oxidation of 2-CE in 20 acetic acid as a function of time 100
Table 45 Solution conductivity chloride ion content and product yields for the
ozonation of 2-CE in 20 acetic acid as a function of time 102
Table 46 Percent conversion and product selectivity data for the ozone initiated
oxidation of 2-CE in 5 ethyl acetate as a function of time 107
Table 47 Solution conductivity chloride ion content and product yields for the
ozonation of 2-CE in 5 ethyl acetate as a function of time 108
Table 48 Percent conversion and selectivity data for the ozone initiated oxidation
of 2-CE in 20 ethyl acetate as a function of time 109
Table 49 Solution conductivity chloride ion content and product yields for the
ozonation of 2-CE in 20 ethyl acetate as a function of time 110
Table 410 Percent conversion and product selectivity for the ozonation of 2-CE
in the presence of charcoal as a function of time 115
Table 411 Solution conductivity chloride ion content and product yields for
ozonation of 2-CE in the presence of charcoal as a function of time 117
Table 412 Conversion and selectivity data for ozonation of 10 2-CE in water
at pH 4 as a function of time 122
Table 413 Conversion and selectivity data for ozonation of 10 2-CE in water
at pH 7 as a function of time 124
Table 414 Conversion and selectivity data for ozonation of 10 2-CE in water
at pH 10 as a function of time 125
xii
Table 415 Conversion and selectivity data for ozonation of 10 2-CE and
charcoal in water at pH 4 as a function of time 130
Table 416 Conversion and selectivity data for ozonation of 10 2-CE and
charcoal in water at pH 7 as a function of time 131
Table 417 Conversion and selectivity data for ozonation of 10 2-CE and
charcoal in water at pH 10 as a function of time 133
Table 418 Conversion and selectivity data for ozonation of 10 2-CE and
5 H2O2 in water at pH 4 as a function of time 139
Table 419 Conversion and selectivity data for ozonation of 10 2-CE and
5 H2O2 in water at pH 7 as a function of time 140
Table 420 Conversion and selectivity data for ozonation of 10 2-CE and
5 H2O2 in water at pH 10 as a function of time 141
Table 421 Conversion and selectivity data for ozonation of 10 2-CE and
10 H2O2 in water at pH 4 as a function of time 142
Table 422 Conversion and selectivity data for ozonation of 10 2-CE and
10 H2O2 in water at pH 7 as a function of time 143
Table 423 Conversion and selectivity data for ozonation of 10 2-CE and
10 H2O2 in water at pH 10 as a function of time 145
xiii
LIST OF SCHEMES
Page Number
Scheme 10 Initiation of a chain oxidation of an organic compound with the
hydroxyl radical 17
Scheme 11 The Harries mechanism 26
Scheme 12 The Staudinger mechanism 27
Scheme 13 The Criegee mechanism 28
Scheme 14 13-dipolar cycloaddition of ozone to a double bond 29
Scheme 15 Electrophilic reaction of ozone with aromatic compounds 30
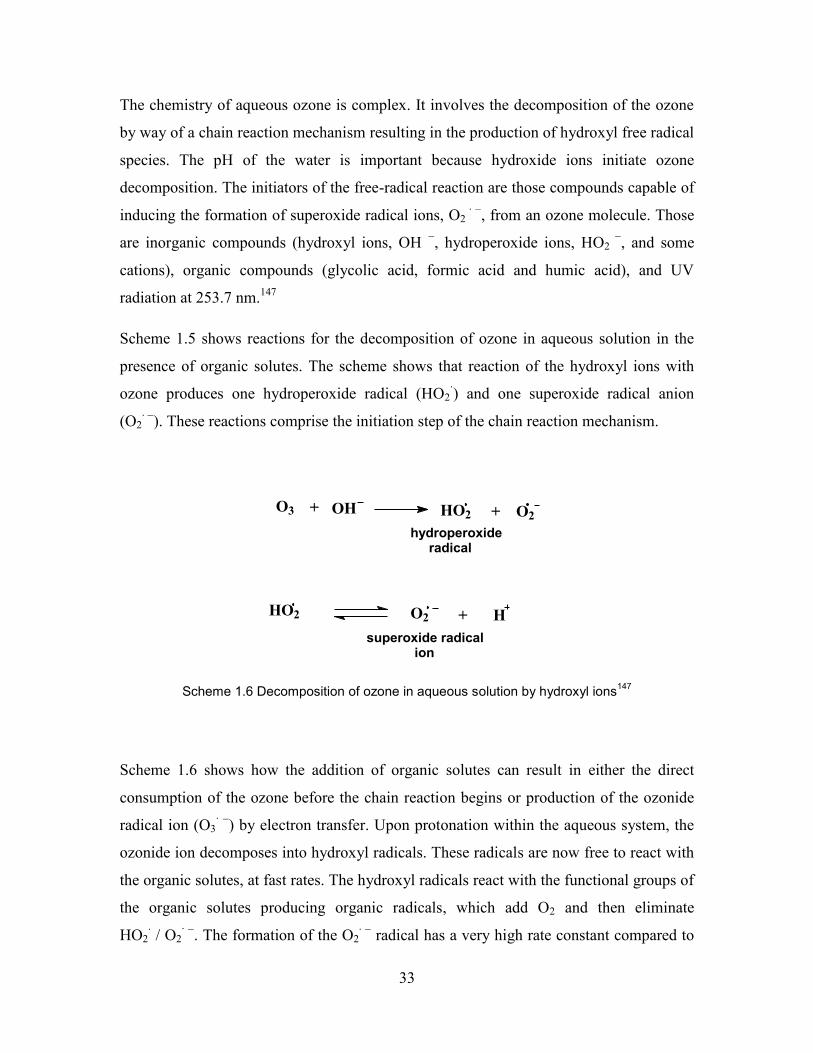
Scheme 16 Decomposition of ozone in aqueous solution by hydroxyl ions 33
Scheme 17 Decomposition of ozone in aqueous solution by hydroxyl radicals 34
Scheme 18 Effect of scavengers on the decomposition of ozone in water 35
Scheme 20 Generation of ozone by corona discharge 38
Scheme 21 Mechanism showing the extraction of 3-methylbenzoic acid from the
12 hour ozonated reaction mixture 47
Scheme 30 General pathway for the reaction of m-xylene with ozone 88
Scheme 31 Proposed mechanism for 3-methylbenzaldehyde ozonation 89
Scheme 32 13 Dipolar cycloaddition of m-xylene 90
Scheme 40 Proposed radical type reaction pathway for the ozonation of 2-CE in
H2O or H2O H2O2 system 152
xiv
ABBREVIATIONS
AA Acetic Acid
AcAlde Acetaldehyde
3-MBAlc 3-Methylbenzyl Alcohol
3-MBAlde 3-Methylbenzaldehyde
3-MBAcid 3-Methylbenzoic Acid
2-CE 2-Chloroethanol
H2O2 Hydrogen Peroxide
FTIR Fourier Transform Infrared
GC Gas Chromatography
GC-MS Gas Chromatography - Mass Spectroscopy
LC-MS Liquid Chromatography - Mass Spectroscopy
1H-NMR Proton Nuclear Magnetic Resonance
PAH Polyaromatic Hydrocarbon
1
10 Introduction
Economic considerations continue to maintain landfills as the most attractive option for
domestic and industrial waste disposal1 Alternative methods to landfilling such as
incineration and composting produce ash and slag fractions which ultimately need to be
landfilled23 Despite the evolution of landfill technology from open uncontrolled dumps
to highly engineered facilities designed to eliminate or minimize the potential adverse
impact on the waste on our environment the generation of toxic contaminated leachate
remains an inevitable consequence of the practice of waste disposal in landfills Leachate
is formed when the refuse moisture content exceeds its field capacity which is defined as
the maximum moisture that can be retained in a porous medium without downward
percolation4 There are many factors such as seasonal weather variations landfilling
techniques phase sequencing piling and compaction methods etc that relate to the
quality and quantity of the leachate formed at landfills5 Organic and inorganic
contaminants of landfill leachates are released from waste due to successive biological
chemical and physical processes67 Also refuse type and composition pretreatment
biological stage age and structure of the landfill has an influence to the amount and
composition of leachates at a landfill site8
Industrial landfill leachate is heavily contaminated with volatile and non-volatile organic
compounds and characterized by the presence of substantial quantities of difficult-to-treat
and ldquohardrdquo COD (the chemical oxygen demand) compounds Some of these are miscible
while a few pollutants are immiscible9 Studies from developed countries have confirmed
the presence of hazardous organic contaminants such as phthalate compounds phenolics
pesticides volatile compounds such as benzene toluene ethylene and xylene (BTEX)
polyaromatic hydrocarbons (PAHrsquos) and polychlorinated biphenyls (PCBrsquos) in
municipal landfill leachate101112 These hazardous organic compounds are primarily
leached out from the waste material disposed into the dumpsite They might also be the
by-products and end-products of various biochemical processes occurring naturally
within the dump or the result of open burning activity in the dumping grounds8
2
Most of these compounds find their way into nearby streams rivers and dams posing a
threat to aquatic and human life In this research m-xylene and 2-chloroethanol were
chosen as the model PAH and organochlorine compounds respectively
11 Occurrence and uses of xylene
Xylene is among the 30 most abundantly produced chemical in the United States The
estimated world production in 1984 was 154 million tones It occurs mainly in petroleum
products coal tar paints and varnishes is a known toxic substance Commercial grade
xylene contains a mixture of all three isomers with meta-xylene predominating usually
60 ndash 70 The technical product ldquomixed xylenesrdquo contains approximately 40 meta-
xylene and 20 each of ethylbenzene ortho-xylene and para-xylene Small quantities of
toluene and C9 aromatic fractions may also be present Before 1940 virtually all of the
aromatic solvents including xylene were produced from coal Thereafter production of
xylene from petroleum started Most mixed xylene is currently produced by catalytic
reforming of petroleum It is also obtained from pyrolysis gasoline as a by-product of
olefin manufacture during the cracking of hydrocarbons Small amounts of mixed xylenes
are also obtained from coal-derived coke-oven light oil and from disproportionation of
toluene13
Approximately 92 of the mixed xylenes produced are blended into gasoline The
remainder is used in a variety of solvent applications as well as to produce its individual
isomers It is also used in the paint and printing ink industries The single largest end-use
of mixed xylenes is in the production of the p-xylene isomer The major derivatives
produced from p-xylene are dimethylterephthalate and terephthalic acid used for the
production of polyester fiber film and fabricated items The o-xylene is almost
exclusively used to produce phthalic anhydride for phthalate plasticizers and m-xylene is
use for the production of isophthalic acid an intermediate in the manufacture of polyester
resins1372 Mixed xylenes are also used in the manufacture of perfumes pesticide
formulations pharmaceuticals and adhesives and in the painting printing rubber
plastics and leather industries75
3
12 Properties of xylene
Table 11 Physical and chemical properties of xylenes70 71 72
Property o-xylene m-xylene p-xylene
Physical State (20 oC 1013 kPa) liquid liquid liquid
Colour colourless colourless colourless
Boiling Point (oC 1013 kPa) 1444 1391 1383
Melting Point (oC 1013 kPa) -252 -479 133
Relative density (25 oC 4 oC) 0876 0860 0857
Vapour Pressure (kPa 20 oC) 066 079 086
Flash Point (oC) (Closed Cup) 30 35 25
Saturation in Air (1013 kPa) 103 (32 oC) 103 (28 oC) 103 (28 oC)
Explosion limits (Vol in Air) 1 - 6 1 - 7 1 - 9
Autoignition temp (oC) 465 525 525
Solubility in Water (mg L-1) 142 146 185
Xylene is a clear colorless liquid at room temperature with a sweet aromatic odor74
Xylene in air can be smelled at 008 to 37 parts of xylene per million parts of air (ppm)
and can begin to be tasted in water at 053 to 18 ppm Xylene is an aromatic hydrocarbon
which exists in three isomeric forms ortho meta and para The three isomers are shown
in Figure 11 Xylene is flammable at room temperature therefore it constitutes a fire
hazard It reacts with strong oxidizers and strong acids The vapor pressure lies between
066 and 086 kPa for the three isomers13
4
CH3
CH3
CH3 CH3
CH3
CH3
12-dimethylbenzene(ortho-xylene)
13-dimethylbenzene(meta-xylene)
14-dimethylbenzene(para-xylene)
Figure 11 Isomers of xylene
All three isomers of xylene are soluble in organic solvents such as ethanol diethyl ether
acetone and benzene74 The odor threshold for mixed xylene in air is approximately
435 mg m-3 (1 ppm)73
13 Xylene in the environment
The majority of xylene released into the environment enters the atmosphere directly This
results mainly from its use as a solvent and its release in motor vehicle exhausts A small
proportion is also likely to enter water and soil due to oilpetrol spillages etc Jori et al76
did calculations based on the Mackay fugacity model that more than 99 of the xylene
released ultimately partitions to the atmosphere
Kawata and Fujieda78 monitored xylene concentrations in the air of Niigata Japan in
1991 and 1992 At an urban location mean m-xylene and p-xylene concentrations were
48 and 20 g m-3 respectively The m-xylene and p-xylene concentrations at a rural
location were 18 and 07 g m-3 respectively Young and Parker77 measured high levels
of total xylene in air samples from within landfill sites in the United Kingdom Levels of
between 36 and 77 mg m-3 were reported in domestic landfills with higher levels being
found in some industrial waste landfills They found mean background levels of all three
xylene isomers in ambient air to be around 1 g m-3 but in suburban areas they were
found to be 3 g m-3 suggesting that vehicle emissions are a significant source of
5
xylenes Higher levels have been measured in urban and industrialized areas mean
concentrations ranging up to 500 g m-3 However concentrations are generally below
100 g m-3 Estimated daily exposure of the general population through inhalation is
70 g in rural areas and less than 2000 g in urban areas76
The concentration of xylene in drinking water ranges from not detectable to
12 g L-1 Mean background concentrations of xylenes in surface water are generally
below 01 g L-1 However much higher values have been measured in industrial areas
and areas associated with the oil industry (up to 30 g L-1 in polluted waters and up to
2000 g L-1 near discharge pipes) Wiesenburg et al78 measured xylenes in brine from an
oil production platform in the Gulf of Mexico Two samples taken from an underwater
vent plume contained 480 and 1800 g L-1of mp-xylene and 500 and 1900 g L-1 of
o-xylene Xylene concentrations in the surface water were 0270 g L-1 for mp-xylene
and 006 g L-1 for o-xylene Water from the discharge pipe contained 2060 g L-1 of
mp-xylene and 1510 g L-1 of o-xylene Barker et al79 measured o- and p-xylene in the
leachate from a landfill in Hamilton Ontario Canada Xylene concentrations ranged
from 308 to 123 g L-1 for the ortho isomer and from 125 to 191 g L-1 for the para
isomer Sabel and Clark80 showed that Leachate from a landfill in Minnesota USA
contained m-xylene concentrations ranging from 21 to 150 g L-1 and op-xylene
concentrations ranging from 12 to 170 g L-1 Since xylenes are only slightly soluble in
water only a very small proportion of xylene in the atmosphere is likely to be removed
by precipitation This is supported by the fact that xylenes have been detected in
rainwater samples at very low levels (2 ng m-xylene L-1 and 9 ng p-xylene L-1)82
Levels of 015 g kg-1 o-xylene and 04 g kg-1 mp-xylene have been measured at a depth
of 70 - 250 cm in soil from a gasoline station The soil was thought to be contaminated as
a result of leakage from an underground storage tank81 Volatilization rate of xylenes near
the surface of soils is expected to be a rapid process owing to the reasonably high
volatility of xylenes It is also possible that a small amount of xylene in soil may leach
out into the aquatic system
6
15 Transformation of xylene
In the atmosphere the xylene isomers are readily degraded primarily by photo-oxidation
In soil and water the meta and para isomers are readily biodegraded under a wide range
of aerobic and anaerobic conditions but the ortho isomer is more persistent
141 Biodegradation of xylenes
In soil and water o- and p-xylene are readily biodegraded under a wide range of aerobic
and anaerobic conditions but o-xylene is much more persistent under similar conditions
1411 Aerobic biodegradation
Bacteria of the genus Pseudomonas have been shown to be capable of growing using
either m-xylene or p-xylene as the sole carbon source The main initial metabolites
appear to be m-toluic acid from m-xylene and p-toluic acid from p-xylene Similarly
cultures of three strains of Nocardia have been shown to metabolize p-xylene to p-toluic
acid and 23-hydroxy-p-toluic acid84 Many of the bacteria do not appear to be capable of
growing on o-xylene as sole carbon source83 However o-xylene has been shown to
undergo biodegradation in the presence of other carbon sources Using hexadecane as
growth substrate o-xylene was co-oxidized to o-toluic acid by Nocardia A similar
oxidation was observed with Pseudomonas using hexane as the growth substrate85
The biodegradation of xylenes by the autochthonous microflora in groundwater in the
presence of the water soluble fraction of gas oil has been demonstrated by Kappeler and
Wuhrmann8687 After a lag period of 3 to 4 days individual hydrocarbon concentrations
were found to decrease at a measurable rate The removal of m-xylene and p-xylene was
complete after 7 days O-xylene was shown to degrade at a significantly slower rate than
the meta- and para- isomer removal being complete after 11-12 days In the first case the
first step in the degradation appears to be oxidation to the corresponding methylbenzyl
alcohol
7
Both m-xylene and p-xylene have been shown to be readily degraded within 13 days
using a microbial inoculum from an activated sludge wastewater treatment plant The
initial concentration of xylene was 100 mg L-1 and 30 mg L-1 of sludge biomass was
used Degradation of xylene was monitored by comparing the oxygen uptake of the
system with that of controls88 The degradation of mixtures of benzene toluene and
p-xylene has been studied using pure cultures of either Pseudomonas sp strain CFS-215
or Arthrobacter sp strain HCB or a mixed culture indigenous to a shallow sandy aquifer
In the mixed culture the presence of p-xylene was found to increase the lag period before
the degradation of benzene and toluene commenced and also appeared to decrease the
rate of toluene degradation compared to the rate obtained without added p-xylene
Degradation of p-xylene occurred in the mixed culture although a long lag period was
observed before degradation commenced When toluene was also present in the culture
the lag period for the degradation of p-xylene was reduced and the degradation rate was
increased but all the toluene had been degraded the p-xylene degradation rate again
slowed In the experiments with Pseudomonas sp the degradation of p-xylene was slow
no degradation was observed in the first three weeks when p-xylene alone was present
Again the degradation rate of p-xylene was found to increase when toluene was also
being degraded Also the presence of p-xylene again increased the lag period for benzene
and toluene degradation In the experiments with Arthrobacter sp degradation of
p-xylene was found to occur only in the presence of benzene and at a slow rate89
The biodegradation of o-xylene and m-xylene has been studied in three core samples of
subsurface soil uncontaminated soil soil that had previously been contaminated with
unleaded gasoline and soil from an area that had previously undergone biostimulation
using H2O2 M-xylene was rapidly degraded in all three core types although the rate was
faster in the previously biostimulated soil due to a higher bacterial cell count (m-xylene
disappeared to below the analytical detection limit within three weeks in the previously
biostimulated soil whereas some remained after 3 weeks in the previously contaminated
samples O-xylene was found to be recalcitrant in all of the samples90 P-xylene and
o-xylene were shown to be degraded in aquifer material collected from the contaminant
plume after a large gasoline spill The degradation occurred fastest in material from the
aerobic degrading zone of the plume but also occurred rapidly in uncontaminated soil91
8
In a study using laboratory aquifer columns which simulated saturated-flow conditions
typical of a rivergroundwater infiltration system all three xylene isomers were shown to
undergo degradation under aerobic conditions Both m-xylene and p-xylene were
degraded to concentrations below the analytical limit of detection within 17 days The
rate of transformation was significantly lower for o-xylene but degradation occurred
readily92
The rate of biodegradation of benzene toluene and xylene (BTX) in groundwater soil
slurries has been shown to be highly dependent on the dissolved oxygen concentration93
At dissolved oxygen concentration of between 2 and 8 mg L-1 BTX (initial
concentrations between 120 and 16000 g L-1) was 80 ndash 100 degraded in 30 ndash 40 days
with a half-life of 5 ndash 20 days When the dissolved oxygen concentration was 1 or
2 mg L-1 the BTX was incompletely degraded (20 ndash 60 ) in 30 ndash 40 days Little or no
degradation was observed at dissolved oxygen concentrations of 001 and 05 mg L-1
The xylenes have been shown to be 100 degraded after 192 hours incubation at 13 oC
with natural flora in groundwater in the presence of other components of high-octane
gasoline85
1412 Anaerobic biodegradation
O-xylene along with other alkylbenzene compounds has been shown to undergo
degradation under anaerobic methanogenic conditions No significant degradation of
o-xylene occurred over the first 20 weeks but after 40 weeks the concentration was
reduced to 22 of the original Less than 1 remained after 120 weeks94
In anoxic suspensions of Pseudomonas sp strain T cells grown anaerobically with
toluene m-xylene and p-xylene were partially oxidized to 3- and 4-methylbenzoate
respectively O-xylene was not oxidized to 2-methylbenzoate as predicted Suspensions
of strain T cells grown anaerobically with m-xylene and incubated with m-xylene at
5 oC accumulated 3-methylbenzaldehyde (35 microM after 20 min) and 3-methylbenzoate
(5 microM after 20 min) After further incubation at room temperature the three aromatic
compounds were completely oxidized within 3 h95
9
Experiments have been carried out using aquifer material from a site containing areas that
were either contaminated or uncontaminated with JP-4 jet fuel Both mixed xylene and
the individual isomers were incubated with the aquifer material at 12 oC in a nitrogen
atmosphere Both o-xylene and m-xylene were slowly degraded in the uncontaminated
aquifer material when added individually although m-xylene (at 16 mg L-1) also
appeared to inhibit the basal rate of denitrification Using mixed xylenes a lag period of
30 days was required before biodegradation commenced in the uncontaminated material
M-xylene and p-xylene were degraded to below the analytical limit of detection within
the next 26 days but the degradation of o-xylene was found to be much slower In the
contaminated aquifer material much longer lag periods and decreased rates of
biodegradation were observed o-xylene not being significantly degraded over a 6 month
period96
In further laboratory experiments using a mixture of benzene and alkylbenzenes both
o-xylene and m-xylene were found to be degraded under nitrate-reducing and nitrous
oxide-reducing conditions but degradation of o-xylene was found to cease once the other
alkylbenzenes had been degraded97 In field experiments using the same aquifer
m-xylene and p-xylene were shown to be degraded under denitrifying conditions when
nitrate was injected into the aquifer but no evidence of biodegradation of o-xylene was
found98
The three xylene isomers have been shown to be completely mineralized by aquifer-
derived microorganisms under sulphate-reducing conditions The source of the inoculum
was gasoline-contaminated sediment All microcosms were initially fed a mixture of
benzene toluene ethylbenzene o-xylene and p-xylene (5 mg L-1 of each component)
P-xylene was found to be greater than 80 degraded within 72 days and o-xylene was
more than 80 degraded within 104 days After this initial adaptation period o-xylene
m-xylene and p-xylene were rapidly degraded by the system without any lag period
M-xylene co-elutes with p-xylene and therefore m-xylene was not added initially99
Edwards and Grbic-Galic100 reported that o-xylene is completely mineralized by aquifer-
derived microorganisms under anaerobic conditions However an adaptation period of
200 to 255 days was required before the onset of degradation Anaerobic degradation was
10
found to be inhibited by the presence of some natural organic substrates and
co-contaminants P-xylene and o-xylene have been shown to be degraded in anaerobic
aquifer material collected from the contaminant plume after a large gasoline spill91
All three xylene isomers have been shown to undergo degradation under anaerobic
denitrifying conditions The rate was much lower for o-xylene than for the other isomers
Long lag periods were observed in all cases before degradation commenced92
Degradation of o-xylene under anaerobic conditions has been hypothesized to explain to
explain the distribution of o-xylene in a landfill leachate plume101 M-xylene has been
shown to be rapidly mineralized to carbon dioxide in laboratory aquifer columns operated
under continuous conditions with nitrite as an electron acceptor The degradation occurs
simultaneously with the reduction of nitrite In contrast to this the concentrations of o-
xylene and p-xylene were only slightly reduced in the experiment The author102 noted
however that the experiments were carried out over a 6 day period after the addition of
the new substrate and therefore may not have allowed a build-up of other microorganisms
capable of degrading these substrates
The biodegradation of BTX has been shown to occur under anaerobic denitrifying
conditions using shallow aquifer material that had previously been exposed to BTX
O-xylene and m-xylene were found to be degraded to 15 and 12 respectively of the
initial concentration (3 mg L-1) after 62 days with added nitrate103 Much less degradation
occurred under anaerobic conditions in the absence of added nitrate (73 o-xylene
remained after 62 days and 59 m-xylene remained after 62 days) These losses were
not considered to be significant when compared with sterile controls
Up to 04 mM (425 mg L-1) m-xylene was found to be rapidly mineralized in a
laboratory aquifer column operated in the absence of molecular oxygen with nitrate as an
electron acceptor Quantitative oxidation of m-xylene (80 ) to carbon dioxide occurred
with concomitant reduction of nitrate The column was inoculated with denitrifying river
sediment that had been continuously fed with m-xylene for several months104
11
142 Abiotic Degradation
The xylene isomers are readily degraded in the atmosphere photo-oxidation being the
most important degradation process
4121 Photolysis
Xylenes do not absorb UV-visible radiation appreciably at wavelengths longer than
290 nm This means that they are unlikely to be directly photolysed in the troposphere or
in solution as the ozone layer absorbs wavelengths shorter than 290 nm Experiments
using xylenes adsorbed on silica gel have shown that the photomineralization rates for all
three isomers are low when radiation of wavelength longer than 290 nm is used105
4122 Atmospheric Oxidation
Atmospheric oxidation of xylene isomers is rapid and proceeds via free-radical chain
processes The most important oxidant is the hydroxyl radical but xylenes will also react
with other species found in the atmosphere such as alkoxy radicals peroxy radicals
ozone and nitrogen oxides The most likely reaction pathways occurring in the
atmosphere are hydroxyl radical addition to the aromatic ring and hydrogen abstraction
from the alkyl groups by hydroxyl radicals106 although reactions with nitrate radicals
may become important at night107
143 Biofiltration
Many studies8-13 on removal of xylene and other volatile organic carbon compounds by
microorganisms and biofiltration have been reported
Abumaizar et al17 reported biofiltration of benzene toluene ethylbenzene and xylene
(BTEX) contaminated air streams using compost-activated carbon filter media with inlet
concentrations of more than 200 ppm and a gas load rate of 176 m3 m-2 h-1 with
achievement of 90 removal efficiencies17 Among the BTEX compounds xylene is
the most difficult to biodegrade under mesophilic and thermophilic conditions in the
toluene acclimatized biofilter18
12
A few studies16-19 focusing on the performance of biofiltration in the removal of xylene as
the sole pollutant in the air stream was reported
Jorio et al16 studied the biofiltration of xylene vapors on a laboratory scale biofilters
packed with a filter material consisting of small balls composed of peat moss (70
ww) mixed with two structuring and conditioning agents (30 ww) Vapors having
xylene gas inlet concentrations ranging from 02 to 40 g m-3 were tested using gas flow
rates of 04 07 and 10 m3 h-1 The biofiltration proved to be highly efficient in the
removal of xylene at a gas flow rate of 04 m3 h-1corresponding to a gas residence time of
157 s Saravanan and Rajamohan19 investigated the biofiltration of xylene vapors on a
laboratory scale biofilter packed with press mud as filter material inoculated with
activated sludge from the pharmaceutical industry In their study the biofiltration column
was fed with a stream of contaminated air of flow rates 003 006 009 and 012 m3 h-1
having xylene vapor concentrations ranging from 02 to 12 g m-3 It was reported that for
all the tested gas flow rates a decrease in the removal efficiency was noticed for high
xylene inlet concentration and for all the tested inlet concentrations the removal
efficiency decreased for high gas flow rates
Chen et al20 reported on the simple and effective synthesis of methoxy-dimethylbenzene
at room temperature and atmospheric pressure from electrochemical oxidation of p-
xylene in methanol and catalyzed by solid superacids SO42- ZrO2 ndash MxOy (M = Ti Ni
Si) They found that all catalysts used showed good catalytic activity in the
electrochemical reaction of p-xylene with methanol assisted with a pair of porous
graphite plane electrodes and the selectivity of main products higher than 90 were
observed
13
15 Occurrence of halogenated organic compounds Of all the synthetic chemicals currently in use in the industrial and agricultural sector
halogenated organic compounds have most certainly received the widest scientific
attention Used as herbicides pesticides refrigerants fire retardants solvents degreasers
and as various intermediates in organic synthesis these compounds are often of
environmental importance due to their toxicity and often limited biodegradability Most
halogenated organic compounds are extremely stable The carbon ndash chlorine bond is very
strong and resists being broken down by physical processes Furthermore when
organochlorines do breakdown they usually produce other organochlorines were the
carbon ndash chlorine bond remaining intact as part of another compound which is
sometimes more toxic and far more hazardous than the original substance When
organochlorines enter the aquatic system their behavior depends very much upon their
physical and chemical properties Solvents such as chloroform and carbon tetrachloride
are generally volatile and tend to evaporate from water into the atmosphere Less volatile
compounds such as chloroethane chlorobenzene chlorophenols and polychlorinated
biphenyls tend to bind with sediments and enter the food chain15
Of the numerous halogenated organics the degradation of which has been studied
interest has been largely focused on chlorinated aromatics while the short chain aliphatic
compounds have been relatively neglected In the chemical industry large amounts of
short-chain chlorinated aliphatic organics are produced These chemicals are used as
organic solvents degreasing agents pesticides and intermediates for the synthesis of
various other organic compounds14 Hazardous municipal and medical waste destined for
incinerators is predominantly organic chemical waste with the organically bound chlorine
content much higher The generation of dioxins which are highly toxic occurs during
combustion when both organic matter and an available source of chlorinated compounds
are present155 Therefore reduction of waste through incineration is undesirable since their
reactions lead to more toxic compounds The most commonly reported chlorinated
organic compound in the environment originating from landfill leachate is chloroethane
Since this compound has a low solubility in water its analogous alcohol 2-chloroethanol
which has a greater solubility and lower volatility was used in this study
14
16 Properties of 2-chloroethanol
2-chloroethanol a widely used chemical is a colorless liquid similar to glycerine with a
faint sweet pleasant ether-like odor It is also known as 2-chloro-1-ethanol
2-monochloroethanol 2-hydroxyethyl chloride β-chloroethanol β-hydroxyethyl
chloride chloroethanol ethylchlorohydrin ethylene chlorohydrin glycol chlorohydrin
and glycol monochlorohydrin 2-chloroethanol is synthesized from ethylene and
hypochlorous acid
CH2 CH2 + HOCl HOCH2CH2Cl
This substrate can be used as a model for future studies of simplified reaction
mechanisms since it has a simple structure and it is highly soluble in water It is widely
used in the pharmaceutical industry as an alkylation agent in the manufacture of
medicinal drugs It is also used as a solvent to determine the water content of a wide
range of products It is harmful to aquatic organisms Disposal of the waste solvent
containing 2-chloroethanol is difficult and expensive The primary use of 2-chloroethanol
has been as a precursor for ethylene oxide which is a widely used organic chemical It is
also used in a number of synthetic reactions including the manufacture of certain dyes
pharmaceuticals crop protection chemicals and plasticizers 2-chloroethanol is very toxic
and may be fatal by inhalation swallowing or absorbed through the skin It can be
irritating to the eyes skin and lungs but irritation is weak and is not strong enough to
warn of a potentially fatal exposure Exposure can cause damage to the central nervous
system cardiovascular system kidneys and liver It decomposes in fires to yield
hydrogen chloride and phosgene which are also irritating and toxic It reacts violently
with oxidants and is a fire and explosion hazard with water or steam to produce toxic and
corrosive fumes and with strong bases to produce ethylene oxide which is toxic and a
fire hazard It is for these reasons that efficient and effective methods need to be found to
remove it from the water system140
15
Table 12 Physical and chemical properties of 2-chloroethanol140
17 Transformation of 2-chloroethanol
Limited studies on the degradation of 2-chloroethaol was conducted McCann et al21
metabolized it with mammalian alcohol dehydrogenase to 2-chloroacetaldehye which is
considered to be a mutagen The degradation of 2-chloroethanol by bacteria also proceeds
through the potentially toxic intermediates 2-chloroacetaldehyde and chloroacetic acid to
glycolate2223 In Xanthobacter autotrophicus GJ10 the oxidation of 2-chloroethanol to 2-
chloroacetaldehyde is catalyzed by a quinoprotein alcohol dehydrogenase and the
subsequent conversion of 2-chloroacetaldehyde to chloroacetic acid by a NAD-dependent
aldehyde dehydrogenase A dehydrogenase is involved in dehalogenation of chloroacetic
acid to gylcolate24 Strotmann et al25 described the isolation of a strain of Pseudomonas
pudita US2 that is able to use 2-chloroethanol as growth substrate The degradation of 2-
chloroethanol was found to proceed via 2-chloroacetaldehyde to chloroacetic acid which
is hydrolytically dehalogenated to gylcolate25
Property Value
Molecular Mass (g mol-1) 805
Physical State (20 oC 1013 kPa) Liquid with Characteristic Odour
Colour Colourless
Boiling Point (oC 1013 kPa) 128 ndash 130
Melting Point (oC 1013 kPa) - 67
Relative density (25 oC 4 oC) 12
Vapour Pressure (kPa 20 oC) 065
Flash Point (oC) (Closed Cup) 60
Explosion limits (Vol in Air) 49 ndash 159
Autoignition temp (oC) 425
Solubility in Water (mg L-1) Miscible
16
Table 13 Comparative reduction potentials measured at 25 oC141
Pace et al125 conducted studies on the degradation of 2-chloroethanol by hydrogen
peroxide under ultraviolet radiation They found the hydroxyl radical (bull OH) to be a
powerful non-selective chemical oxidant which reacts very rapidly with organic
compounds
Table 14 lists the standard redox potentials of some oxidants Hydrogen peroxide in
dilute aqueous solution is known to produce bullOH radicals by photolysis under UV
irradiation (λ lsaquo 370 nm)
H2O2 (aq) hv 2 bullOH (aq)
Once generated the hydroxyl radicals aggressively attack virtually all organic
compounds Depending upon the nature of the organic species two types of initial attack
are possible
Oxidizing Agents Eo (Volts)
Fluorine (F2) 303
Hydroxyl Radical ( OH ) 280
Ozone (O3) 207
Hydrogen Peroxide (H2O2) 178
Potassium Permanganate (KMnO4) 170
Hyprobromous Acid (HOBr) 159
Hydrochlorous Acid (HOCl) 149
Chlorine (Cl2) 136
Chlorine Dioxide (ClO2) 127
Oxygen (O2) 123
Chromic Acid (H2CrO4) 121
Bromine (Br2) 109
Nitric Acid (HNO3) 094
Iodine (I2) 054
17
(1) The hydroxyl radical can add itself to the contaminant as in the case of olefins or
aromatic compounds A common reaction is the abstraction of hydrogen atom to initiate a
radical chain oxidation shown in Scheme 10
RH + OH H2O + R2 OH H2O2
R + H2O2 ROH + OH
R + O2 ROO
ROO + RH ROOH + R
Scheme 10 Initiation of a chain oxidation of an organic compound with the hydroxyl radical26
(2) The attack by hydroxyl radical in the presence of oxygen initiates a complex
cascade oxidative reactions leading to mineralization of the organic compound
18 Oxidation of organic compounds
A large number of toxic organic compounds found in water are difficult to oxidize by
conventional chemical and biological treatment In this case water treatment processes at
ambient temperature and pressure involving the formation of highly reactive bullOH
radicals are used to improve the oxidation process and shorten the reaction time This
type of oxidation is generally referred to as an advanced oxidation process (AOP)60 61 In
drinking water treatment they are applied to oxidation of ozone resistant compounds such
as pesticides6263 aromatic compounds64 and chlorinated compounds such as tri- and
tetrachloroethene65 The ozonation of dissolved organic matter in water can be regarded
as an AOP since bullOH radicals are generated from the decomposition of ozone catalyzed
by the hydroxyl ion or initiated by the presence of trace transition metal cations66
18
Table 14 Some organic compounds that can be oxidized by bullOH radicals67
Organic Compounds
Acids Formic gluconic lactic propanoic tartaric
Alcohols Benzyl tert-butyl ethanol ethylene glycol glycerol iso-propanol methanol
propandiol
Aldehydes Acetaldehyde benzaldehyde formaldehyde glyoxal iso-butyraldehyde
trichloroacetaldehyde
Aromatics Benzene chlorobenzene chlorophenols creosote dichlorophenol
hydroquinone phenol p-nitrophenol toluene trichlorophenol xylene
trinitrotoluene
Amines Aniline cyclic amines diethylamine dimethylformamide EDTA
propanediamine n-propylamine
Ethers Tetrahydrofuran
Ketones Dihydroxyacetone methyl ethyl ketone
Dyes Anthrquinone diazo monoazo
An attractive feature of the bullOH radical is that it is resistant to attack thus making it a
good oxidant for wastewater treatment Table 14 shows several organic compounds that
can be oxidized by bullOH radicals however some of the commonly found organic
compounds such as acetic maleic and oxalic acids acetone and simple chloride
derivatives (chloroform and carbon tetrachloride) is resistant to attack by bullOH radicals67
The radical mechanism predominates in less reactive compound such as aliphatic
hydrocarbons carboxylic acids benzenes and chlorobenzenes68 Under acidic conditions
the direct pathway dominates and above pH 10 it changes to the radical mechanism69 A
conventional ozone process can be converted to an AOP by increasing reaction time after
ozone addition increasing the pH of the reaction mixture or by adding another strong
oxidizing agent like hydrogen peroxide Since the first two possibilities can be costly the
addition of hydrogen peroxide is a cheap and most effective method used for water
purification In this process the ozone transformation is accelerated by the presence of
hydrogen peroxide
Chemical oxidation of NOM in water is generally used when biological processes have
little efficiency Chemical oxidation has proven to be an effective process for the removal
19
of trace levels of organic pollutants present in water The principle aim of chemical
oxidation is to transform the contaminants to harmless or value-added products
Conventional purification processes consists of addition of an oxidizing agent to the
water containing the organic contaminant The most widely used oxidants for water
treatment are chlorine potassium permanganate and oxygen51 Despite their advantages
these oxidants have a number of limitations such as low selectivity generation of toxic
products discoloration costly installation of chemical plants and poor stability Chemical
oxidation by ozone has recently become a widely used method to disinfect drinking water
and wastewater Pilot studies have shown that ozone is a quicker and more efficient
disinfectant than chlorine and that when properly used it can reduce suspended solids
(SS) biochemical oxygen demand (BOD) chemical oxygen demand (COD) and other
pollutants found in water As a disinfectant one of ozonersquos attributes is its ability to
achieve significant bacterial reductions with contact times much shorter than those used
in chlorination Petrasek of the Dallas Water Reclamation Centre reported that in studies
using filtered effluent from an activated sludge plant a 5 mg L-1 dose of ozone applied
for less than 2 minutes yielded a significant reduction in total plate count and fecal
coliform levels When the effluent from an advanced wastewater treatment process was
used the results were even more impressive A 25 mg L-1 concentration applied for the
same contact time reduced bacteria levels by over 1000 times
Other researchers27 have found similar results Dr Carl Nebel Welsbach Corp reported
that ozone disinfects about 3000 times faster than chlorine He cited experiments in
which a chlorine dose of 01 mg L-1 required 250 minutes to reduce the total plate count
of a sample by 999 while the same concentration of ozone needed only 08 minutes to
achieve the same reduction An added benefit from using ozone for wastewater
disinfection is that it leaves behind a residual of dissolved oxygen unlike chlorine which
leaves behind free chlorine and chlorinated compounds like trihalomethanes and
chloramines These chlorinated compounds can be toxic to aquatic life and in some
locations is believed to be the major cause of effluent toxicity Ozone has greater
disinfection effectiveness against bacteria and viruses compared to chlorination In
addition the oxidizing properties can also reduce the concentration of iron manganese
sulphur Ozone facilitates the oxidation of iron manganese and sulphur in water to form
20
insoluble metal oxides and elemental sulphur These insoluble particles are then removed
by post-filtration Ozone is unstable and it will degrade over a time frame ranging from a
few seconds to 30 minutes Ozone is effective over a much wider pH and temperature
range than chlorine making it more versatile Ozone can also reduce the concentration of
suspended solids In pilot studies carried out in conjunction with disinfection
experiments ozone generated froth was able to reduce suspended solids to less than 2
mgL-1 The ozone bubbles generated in the contact chamber trapped and reacted with the
solids floating them to the surface where the froth was removed Tertiary treatment
plants have also used ozone to reduce BOD COD cyanides and phenols In reactor tests
the effluent from a secondary treatment plant was treated with ozone and ferrous salts
The combination of ozone oxidation and froth flotation achieved BOD and COD
reductions of 95 and 58 percent respectively
Cyanide and cyanide complexes can also be destroyed by ozone treatment In tests
performed by the US Air Force industrial wastes containing up to 10 000 mg L-1 of
cyanide were treated with ozone and ultraviolet light The treatment reduced to cyanide
concentration to below detectable levels Ozone is effective on phenol wastes as well In
this case it requires about 2 parts of ozone to destroy 1 part of phenol Treatment of
water containing phenols with ozone rather than chlorine also eliminates odors and
improves taste While ozone can made to treat pulp bleaching plant wastewaters it has a
much more productive use in replacing chlorine as a bleaching agent In this way not only
OZONE REMOVES
Iron Bacteria and Viruses
Hydrogen
Sulphide
Manganese
21
is formation of chlorinated organic substances eliminated but significant portions of the
water used can be re-used in the process28 The majority of problematic substances in
industrial wastewaters and landfill leachate are organic compounds These waters are
often a complex mixture comprising of many individual substances ranging in
concentration from mg L-1 to g L-1 has to be reduced or removed The predominant tasks
associated with ozone treatment of wastewaters are
the conversion of toxic compounds to non-toxic and if possible to value added
products
the partial oxidation of the biologically refractory part of the dissolved organic
carbon for the purpose of improving subsequent biodegradation and
the removal of color and odor
Ozone may react with water impurities by means of direct or indirect reactions Reactions
between a substrate and ozone molecule is referred to as a direction reaction while the
indirect reactions is referred to as those reactions which involve a substrate and radicals
derived from decomposition of ozone The ozone molecule is highly selective to species
it will react with and when a reaction does take place it is relatively slow when compared
to radical reactions On the contrary radicals are highly reactive which makes the
reaction period shorter29 Organic compounds such as formic acids humic acids
glyoxylic acids primary alcohols and benzene have been found to initiate and promote
ozone decomposition while acetone and aliphatic alcohols stop the decomposition
chain2930 During ozonation dissolved organic compounds (DOC) in water are only
partially oxidized Higher molecular weight organic compounds are transformed into
lower molecular weight compounds leaving DOC concentrations to a large extent
unaffected3132 The reaction of ozone with natural organic matter (NOM) may result in
the formation of numerous by-products Among these by-products epoxides organic
peroxides and aldehydes are of particular concern in drinking water The formation of
aldehydes33 34 and carboxylic acids upon ozonation of NOM is widely published35 The
literature provides several studies of aldehyde formation (formaldehyde acetaldehyde
22
and glyoxal) as a function of ozone dose aldehyde formation as a function of pH and
aldehyde formation as a function of hydrogen peroxide concentration3637
Kusakabe et al38 have showed that almost all organic matter can be oxidized by ozone to
carboxylic acids Formic acid acetic acid and particularly oxalic acid were the most
significant The formation of benzoic acid by the oxidation of toluene in the presence of
supercritical CO2 and ionic liquids as solvents was also reported3940 The liquid phase
oxidation of toluene with homogeneous metal salt catalysts was industrially realized in
the Rhodia Dow and Snia-Viscosa processes using oxygen or peroxides as
oxidants41-43 The Snia-Viscosa process operates at 165 oC and under 10 atm of air in the
presence of a homogeneous cobalt catalyst in acetic acid At optimal conditions benzoic
acid as the target product is produced at 90 selectivity and benzaldehyde as a minor
by-product is obtained with 3 selectivity at 15 conversion of toluene In these
processes however halogen ions and acidic solvents are indispensable and they easily
cause corrosion of the reaction vessel
Aldehydes are usually observed at the levels of 10 mg L-1 after ozonation while
carboxylic acids are usually present at concentrations of hundreds of micrograms per
liter 3444 A short contact time is sufficient for the reaction of ozone with organic matter
Carboxylic acids are formed at much higher quantities than aldehydes during ozonation
of NOM45
The reaction products of the oxidation of aromatic compounds with ozone are not well
covered in literature The reactivity of benzene toluene ethylbenzene and xylene
(BTEX) with ozone increases with the degree of substituted methyl groups
While benzene is relatively unreactive xylenes have a higher reactivity depending on the
position of the substitution46 Literature reviews46-47 show that the reaction of ozone with
the aromatic ring system is highly electrophilic and also highly selective Electron donor
groups on the aromatic ring lead to an enhanced rate whereas electron-withdrawing
groups cause a slower rate Increasing the number of aromatic rings (benzene rarr
naphthalene rarr phenanthrene) also leads to an enhanced reactivity Naphthalene reacts
1500 and phenanthrene reacts 10 000 times faster than benzene respectively4648 Fuel
additives such as methyl-tertbutylether (MBTE) tertiary butanol (t-BuOH) and ethanol
23
have a low reactivity with ozone49 This is typical for saturated hydrocarbons and in
particular ethers and tert-butyl groups46 The reactivity of saturated compounds
containing aldehyde alcohol ketone and carboxylic acid functional groups with ozone is
typically very low4650 Many of these compounds are formed as oxidation products from
the reaction of ozone with NOM
Activated carbon is reported to accelerate ozone decomposition resulting in the formation
of hydroxyl radicals52-54 It was reported5556 that incorporated metal center electrons of
the graphenic layers and the basic surface groups of the activated carbon are considered
as the main factors responsible for the decomposition of ozone at the activated carbon
surface The presence of activated carbon during the ozonation of organic pollutants leads
to a reduction in the concentration of DOC thereby increasing the applicability of this
treatment system57 Ozonation in the presence of activated carbon can lead to oxidation of
micro-pollutants either by a direct reaction of the compounds with ozone or by hydroxyl
radicals that are produced in the interaction of ozone with the surface of activated
carbon58 Sanchez-Polo et al compared the efficiency of treating water from Lake Zurich
with O3 and O3 activated carbon The results showed that O3 activated carbon process
lead to an increased transformation rate of ozone and a significant reduction of the
concentration of DOC Furthermore it was observed that the adsorption of low
concentrations of DOC on the carbon surface does not change its initiatingpromoting
activity for ozone transformation59
19 Properties of ozone
Ozone is a highly reactive allotrope of atmospheric oxygen in which the molecule is
composed of three atoms of oxygen It is generated photochemically in the stratosphere
and is believed to protect life on earth from overexposure to ultraviolet and other high
energy radiation Ozone has proved to be a highly useful and powerful oxidizing agent in
the chemical industry the cost of generating it being the only limitation for it to be used
more widely
24
More important however is the growing use of ozone in water and wastewater
purification In treating portable water wastewater and landfill leachate ozone has the
proven ability to convert bio-refractory organic material
Table 15 Important physical constants of ozone142
Combining ozone oxidation with biological water treatment methods can produce water
or wastewater with lower concentrations of problematic organic compounds more cost-
effectively than either process used individually Ozone has been used in this way in
Europe for many years after which the United States began to realize the potential of
ozone in disinfection in sewage and waste treatment and in odor color and taste control
Studies conducted by Hughes Gordy143 and co-workers during the period 1952 ndash 1956
with the microwave spectrum of ozone showed that the ozone molecule in the ground
state has an obtuse angle of 116o 45prime and an oxygen ndash oxygen bond length of 1278 Aring
The molecule has no appreciable para-magnetism and its dipole moment is low On the
basis of the abovementioned properties the structure of the ozone molecule can be
described as a resonance hybrid of the four canonical forms as illustrated in Figure 12
O
O O
+
_
O
O O
+
_
O
O O+ _
O
O O+_
Figure 12 Canonical forms of the ozone molecule143
Molecular Weight (g mol-1) 48
Boiling Point (oC) -1119
Melting Point (oC) -193
Gas Density 0 oC (g L-1) 2144
Critical Temperature (oC) -121
Critical Pressure (oC) 546
Critical Volume (oC) 1471
25
Ozone is a blue colored gas At atmospheric pressure ozone can partially dissolve in
water but at standard temperature and pressure the solubility of ozone is thirteen times
that of oxygen Although ozone is only partially soluble in water it is sufficiently soluble
and stable such that its oxidation and disinfectant properties can be fully utilized The
oxidation potential of 207 V proves that ozone is a strong oxidizer which can react with
a large variety of organic compounds resulting in the formation of oxygen containing
products Concentrated mixtures of ozone and oxygen that contain more than 20 ozone
can become explosive in both fluids and gases
110 History of ozone-organic chemistry
The history of ozone-organic chemistry divides itself into three periods each of which is
dominated by the genius of a particular researcher
Schőnbein in 1840 is generally credited with being the discoverer of ozone as a
chemical substance He gave it the name ldquoozonerdquo derived from the Greek word ozein
meaning ldquoto smellrdquo Schőnbein was the first to study the reactions of ozone with organic
and inorganic substances but in most cases there were no conclusive identification of
products
A very important period in the history of ozone chemistry began with the first paper of
Harries in 1903 He established ozonolysis as one of the classical reactions of organic
chemistry and also pioneered most of the known reactions of ozone with organic
compounds and gave us our first insight into how these reactions occur In his research
Harries observed that certain olefinic compounds reacted with ozone in the absence of
ionic solvents to give peroxidic oils which he later called ozonides and to which he
assigned structure 2 Later he changed the structure to 3 which he described as a highly
unstable initial ozone-olefin adduct called a ldquoprimary ozoniderdquo
26
C C
O O
O
2
C C
O O
O
3
Harries proposed that the primary ozonide decomposes in two ways one to give
aldehydes andor ketones and hydrogen peroxide (reaction 1) and the other to give an
aldehyde or ketone and a ldquoperoxiderdquo 4 (reaction 2) Harries suggested that the ldquoperoxiderdquo
could rearrange to a carboxylic acid if a hydrogen atom is attached to the carbon atom of
the peroxy group (reaction 3) or in some cases dimerize
C C
O O
O
3
C C
O O
O
3
C O + H2O2 + O C
C
O
O
+ O C
C
H O
O
C O H
O
H2Oreaction 1
reaction 2
reaction 3
4
Scheme 11 The Harries mechanism143
27
In 1925 Staudinger suggested a more detailed mechanism of ozonolysis than that of
Harries The useful parts are outlined below
R2C CR2 O3 R2C
O O O
CR2 O O
R2CO
R2C CR2
O O
O
R2C O + R2C O O
O O
R2C CR2
O O
C
O
OHR
if one R is hydrogen
CR2
5 6
7
8
9
Scheme 12 The Staudinger mechanism143
Staudingerrsquos proposal was that ozone reacts with olefins to form an unstable initial
adduct with a four-membered ring structure 5 which he called a ldquomol-ozoniderdquo He
suggested several transformations for the mol-ozonide the most important of which was
re-structuring to a true ozonide 6 which he called an ldquoisozoniderdquo In support of structure
6 he pointed out that reduction of ozonides gave aldehydes and ketones rather than
glycols which would be expected from Harriesrsquo ozonide structure 4 In addition
Staudinger suggested that the mol-ozonide could polymerize (5 rarr 7) and decompose to
an aldehyde or ketone and structure 8 If one R in structure 8 is hydrogen it could
rearrange to a carboxylic acid or dimerize to structure 9 a similar proposal by Harries
28
A detailed study of the active oxygen-containing products of a wide variety of
unsaturated substances in different types of solvents resulted in the development of the
Criegee mechanism of ozonolysis during the period 1949 ndash 1957 The mechanism is
outlined below
R2C CR2 R2C
O3
CR2 R2C CR2
OO O+
11
R2C+
O Opolymeric ozonides +
O O
R2C CR2O
12
R2CG
O O H
14
O O
R2C CR2
O9
+polymeric peroxides
rearrangement products
G = OH OR O C
O
R etc
O3
+ R2C O
HG
O
10
613
Scheme 13 The Criegee mechanism143
The first intermediate 10 an ozone-olefin adduct is assumed to be very unstable and
through 11 cleaved to a zwitterion 12 and an aldehyde or a ketone 13 Zwitterion 12
the key intermediate in the Criegee mechanism is a modernization of minor
intermediates predicted earlier by Harries and Staudinger The breakdown of 12
according to the Criegee mechanism depends partly on its source and partly on its
environment He suggested four different ways by which it can stabilize itself
(a) Reaction with an aldehyde or ketone (13) usually an aldehyde to give an ozonide
(6) or polymeric ozonides (aprotic solvents)
29
(b) Dimerization and polymerization to give 9 and polymeric peroxides
(favoured by aprotic solvents and by 13 being a ketone)
(c) Reaction with a protic nucleophilic solvent molecule to give 14 or
(d) Rearrangement to give ldquoabnormalrdquo ozonolysis products
111 Types of ozone attack
On the basis of the resonance description of the ozone molecule one could predict that
ozone should be able to function as a 13-dipole an electrophile or a nucleophile
1111 13-Dipolar cycloaddition
During the 1960s Huisgenrsquos classified ozone as a typical 13-dipole and the addition of
ozone to a multiple bond as a 13-dipolar cycloaddition The 13-dipolar cycloaddition of
ozone to an olefinic double bond is illustrated in Scheme 13
O
O O
C C
O
O
O
C C
OO
CC
O
O
O
C C
Scheme 14 13-dipolar cycloaddition of ozone to a double bond143
1112 Electrophilic nature of ozone reactions
The e lectrophilic reaction is restricted to molecular sit ed with strong electronic density
and certain aromatic compounds Aromatics substituted with electron donor groups such
30
as hydroxyl and amine show high e lectronic densities on carbons located in the ortho-
and para- positions are very reactive with ozone at these positions Aromatics substituted
with electron withdrawing groups such as carboxylate and nitrite groups react to a lesser
extent with oz one I n thi s case the initial a ttack b y th e oz one mol ecule takes place
mainly on the least deactivated meta-position The result of thi s reactivity is that the
aromatic c ompounds be aring the electron donor g roups D such as phenol and a niline
react quickly with ozone This reaction is schematically shown in Scheme 14
O
O
O+
D
OOO
Hand
D
O O
O
O2
D
OH
and
D
OH
Scheme 15 Electrophilic reaction of ozone with aromatic compounds144
The initial attack by the ozone molecule leads first to the formation of ortho- and para-
hydroxylated by-products These compounds are highly susceptible to further ozonation
leading to the formation of quinoid and due to the opening of the aromatic ring to the
formation of aliphatic products with carbonyl and carboxyl functional groups
1113 Nucleophilic nature of ozone reactions
The nucleophilic reaction is found locally on molecular sites which are electron deficient
and more fr equently o n carbons carrying electron withdrawing g roups In g eneral
molecular oz one r eactions are e xtremely selective a nd li mited to unsaturated aromatic
and aliphatic compounds as well as to specific functional groups Figure 13 lists some of
the organic functional groups that can be readily attacked by ozone
31
C C ( aliphatic and aromatic ) C C
C N N RSH RSSR
R S R
O
R3P (RO)3P R3As R2Se
C H
R
R
R
RCH2OR R C R
O
R2CHNH2
RCH2OH R2CHNR2 SiH Si C
Si Si C Mg C Hg
Figure 13 List of functional groups that can be readily attacked by ozone28
32
Aromatics Unsaturated Aliphatics Saturated Aliphatics( R = CnHn CnHn-1R )
R HOOC-R-CHO
HOOC-R-COOH
HOOC-R-COR
Polyhydroxy Aromatics Quinoids
R
(OH)n
O
O R
OCH-HCO OHC-COOH
HOOC-COOH HOOC-COR
HOOC-C-COOH
OHCOOH RCOOH
Total degradation
CO2 + H2O
Cl- + NH4+ + NO3
-
I II
III
Figure 14 Ozonation of aromatic compounds145
112 Aqueous ozonation chemistry
Ozone is unstable in water Its decay in natural waters is characterized by a fast initial
decrease of ozone followed by a second phase in which ozone decreases with first order
kinetics Depending on the water quality the half-life of ozone is in the range of seconds
to hours The major secondary oxidant formed from ozone decomposition in water is the
hydroxyl radical The stability of ozone largely depends on the water matrix especially
its pH ozone concentration its alkalinity and the concentration of radical scavengers
The decomposition rate measured in the presence of excess radical scavengers which
prevent secondary reactions follows pseudo first-order kinetic Staehelin and Hoigneacute
showed that the rate constant changed linearly with pH which reflects the fact that the
ozone decomposition rate is first order with respect to both ozone and hydroxide ions148
33
The chemistry of aqueous ozone is complex It involves the decomposition of the ozone
by way of a chain reaction mechanism resulting in the production of hydroxyl free radical
species The pH of the water is important because hydroxide ions initiate ozone
decomposition The initiators of the free-radical reaction are those compounds capable of
inducing the formation of superoxide radical ions O2 ∙ minus from an ozone molecule Those
are inorganic compounds (hydroxyl ions OH minus hydroperoxide ions HO2 minus and some
cations) organic compounds (glycolic acid formic acid and humic acid) and UV
radiation at 2537 nm147
Scheme 15 shows reactions for the decomposition of ozone in aqueous solution in the
presence of organic solutes The scheme shows that reaction of the hydroxyl ions with
ozone produces one hydroperoxide radical (HO2) and one superoxide radical anion
(O2∙ minus) These reactions comprise the initiation step of the chain reaction mechanism
O3 OH HO2+ + O2hydroperoxide radical
HO2 O2 + Hsuperoxide radical ion
Scheme 16 Decomposition of ozone in aqueous solution by hydroxyl ions147
Scheme 16 shows how the addition of organic solutes can result in either the direct
consumption of the ozone before the chain reaction begins or production of the ozonide
radical ion (O3 minus) by electron transfer Upon protonation within the aqueous system the
ozonide ion decomposes into hydroxyl radicals These radicals are now free to react with
the organic solutes at fast rates The hydroxyl radicals react with the functional groups of
the organic solutes producing organic radicals which add O2 and then eliminate
HO2∙ O2
minus The formation of the O2∙ minus radical has a very high rate constant compared to
34
the reactions with other solutes present in ozonated waters It is thought by Staechlin and
Hoigne147 that the production of the highly ozone selective O2 minus ion promotes the chain
reaction to produce hydroxyl free radicals OH Promoters of the free radical reaction are
organic and inorganic molecules capable of regenerating the superoxide radical anion
from the hydroxyl radical Common organic promoters include aryl groups formic acid
glycolic acid primary alcohols and humic acids Among the inorganic compounds
phosphate species is commonly used
O3 + O2 O3 + O2ozonide radical ion
O3 H++ HO3
HO3 OH + O2
O3 + OH HO4
HO4 HO2 + O2
Scheme 17 Decomposition of ozone in aqueous solution by hydroxyl radicals147
The production of ozone selective radicals is beneficial for the destruction of organic
solutes by radical reactions but other organic and inorganic substrates can also react with
the hydroxyl radicals produced Scheme 17 shows the reaction mechanism for the
decomposition of ozone in aqueous solution in the presence of a scavenger These
reactions form secondary radicals which do not predominantly produce the HO2∙ and O2
minus
radicals Species such as OOCH2COO∙ and CO32minus ldquoscavengerrdquo the hydroxyl radicals
produced preventing interaction between the OH radical and ozone leading to
35
termination of the chain reaction Some of the more common inhibitors include
bicarbonate ions alkyl groups tertiary alcohols and humic substances
HO4 HO4 H2O2+ 2O3+
HO4 + HO3 H2O2 + O3 + O2
OH + CO32- OH
+ CO3
carbonate radical ion
CO3 + O3 products( CO2 + O2 + O2 )
OH + HCO3 OH + HCO3
Scheme 18 Effect of scavengers on the decomposition of ozone in aqueous solution146
The overall pattern of the ozone decomposition mechanism (Scheme 15 rarr 17) shows
that the free radical initiating step constitutes the rate determining step in the reaction
The regeneration of the superoxide radical ion O2∙ minus or its protonic form HO2∙ from the
hydroxyl radical OH ∙ implies that 1 mol of ozone is consumed As a result of this all
the species capable of consuming hydroxyl radicals without regenerating the superoxide
radical ion will produce a stabilizing effect on the ozone molecule in water146
36
113 Motivation for the study
Shongweni landfill dump situated in Kwazulu ndash Natal is a site that accepts medical and
industrial chemical waste Aqueous leachate from the site is collected in two dams
situated below the site During the rainy season overflow from these dams enter nearby
streams and rivers Tests conducted on the leachate showed a significant increase in
levels of xylene a carcinogenic substance during certain months
Ozone gas was chosen for the oxidation process because it is a strong oxidizing agent and
environment friendly and can be particularly effective for purification of aqueous waste
streams with organic pollutants It is sometimes used as a pre-treatment method or to
disinfect wastewater after biological treatment It is faster acting than alkaline
chlorination and unlike chlorine ozone does not generate toxic ions during the oxidation
process
The toxic nature of many organic compounds has been extensively reported Efficient
methods of removing these compounds from the environment and changing them into
less toxic and value adding substances is constantly researched The work undertaken
here involves a study of the ozone initiated oxidation of toxic organic compounds found
mainly in landfill leachate Two model compounds commonly found in the landfill
leachate were chosen for this investigation namely m-xylene and 2-chloroethanol
114 Hypothesis
Ozone is an effective oxidant to convert m-xylene and 2-chloroethanol into non-
toxic or less toxic products
The presence of substances like acetic acid ethyl acetate and acetone enhance the
solubility of ozone and activated charcoal and hydrogen peroxide facilitate the
oxidation process
The pH of the aqueous media affects the ozonation process and facilitates the
substrate oxidation
37
115 Objectives of the study
The focus of the study is to investigate the impact of ozonation on the oxidation of
m-xylene formation of products as a function of ozonation time and ozonation reactions
in the presence of organic solvents
In the case of water soluble 2-chloroethanol the objective is to investigate its oxidation in
aqueous medium and influence of pH presence of hydrogen peroxide andor activated
charcoal on the reaction This would be achieved by characterization of products and
selectivity
Ozonation reactions of m-xylene and 2-chloroethanol were conducted separately as a
function of ozonation time Since many toxic organic compounds are partially soluble or
insoluble in water and landfill leachates also contain many other organics studies were
conducted to investigate the effect of ozonation in the presence of an added solvent such
as acetic acid ethyl acetate or acetone The focus here would be to identify and quantify
conversion of the substrate molecule as a function of ozone treatment time and monitor
the selectivity and yields of products formed
38
20 Introduction
The smell of oz one in the a ir during a thunde r and li ghtning storm has been obse rved
from the ti me e arth was first able to support life Man has since copied na ture and
currently us es electric discharge as his pr incipal method of generating oz one The fir st
ozonator based on corona discha rges was manufactured b y von S iemens in 1857 Two
concentrical glass tubes were used the outer tube was covered externally by a thin layer
of ti n a nd th e inner tub e wa s c overed int ernally b y a l ayer of ti n Air was circulated
through the annular sp ace This technology was later improved b y t he a ddition of
circulating c ooling fluid s along the discharge a ir or ox ygen gap re sulting in lower
generation tempe ratures and less ther mal de struction of the ozone B ecause of it s
relatively short ha lf-life ozone is always generated on-site b y an ozone generator The
two main pr inciples of oz one g eneration a re UV-light a nd corona-discharge Oz one
generation by corona-discharge is most common nowadays and has most advantages such
as greater sustainability of the unit higher ozone production and higher cost affectivity
An electric discharge ( a spark ndash also referred to a s corona discha rge) splits an oxygen
molecule into two o xygen radicals These unstable oxygen radicals combine with other
oxygen molecules to form ozone The formation of ozone is shown in Scheme 20142143
Scheme 20 Generation of ozone by corona discharge150
39
21 Ozonation experiments
In this study ozone was produced from medical grade oxygen passed through the Ozonox
LAB 7000 ndash 240 V Corona Discharge Generator An outline of the discharge unit is
shown in Figure 20 The corona discharge element (the dielectric) is a class 6 ceramic
utilizing micro-gap technology which provides the capacitive load Its function is to
control and maintain the electrical discharge
Figure 20 Schematic of a corona discharge unit showing how ozone is generated142
The generation of ozone is accompanied by heat formation This makes it important to
cool the generator An ozone reaction is reversible and this increases when temperatures
rise As a result more oxygen molecules are formed To limit the decomposition of ozone
the temperature in the discharge gap should not be higher than 25 oC The excessive heat
produced by the electrodes of the Ozonox LAB 7000 is cooled by air The generation of
ozone is very energy ndash intensive with some 90 of the power supplied to the generator
being utilized to produce light sound and primary heat Important factors that influence
ozone generation are oxygen concentration inlet gas humidity and purity of inlet gas and
electrical parameters The presence of moisture and organic impurities in the oxygen feed
40
gas must be avoided Moisture reacts with ozone which leads to a reduction of ozone
yield per kWh An additional problem of high humidity is that undesired reactions occur
in the corona unit When increased amounts of water vapour are present larger quantities
of nitrogen oxides are formed when spark discharge occurs Nitrogen oxide can form
nitric acid which can lead to corrosion of the instrument components Furthermore
highly reactive hydroxyl radicals are formed that combine with oxygen radicals and with
ozone All these factors reduce the capacity of the ozone generator The presence of about
1 hydrocarbon impurities can reduce the ozone generation nearly to zero The ozone
concentration an ozone generator delivers is also dependant on the oxygen concentration
Ozone production is increased by a factor of 17 to 25 when pure oxygen is used at
constant electric power To ensure a high yield of ozone gas production medical grade
oxygen (999 purity) was used in all experiments The concentration of ozone was
controlled by changing the current of the generator and the flow rate of the oxygen feed
gas A schematic diagram of the apparatus used for the experimental work is shown in
Figure 21
Figure 21 Schematic of experimental apparatus for ozonation reactions149
41
Ozone gas was bubbled into 25 mL of the substrate solution through a sintered porous
gas diffuser with a porosity of 2 The flow of ozone into the reactor was regulated at
200 mL min-1 using a 1000 cc flowmeter The tubing connectors and valves were
constructed of PTFE and stainless steel Prior to commencing ozonation of each
substrate ozone was allowed to flow into the system but by-passed the reactor and
flowed into a trap containing 2 WV KI in water When the influent ozone reached
steady state it was then directed into the reactor to commence the reaction The
concentrations of ozone in the influent and effluent gas streams were measured by the
iodometric method154
22 Ozonation of m-xylene and 2-chloroethanol
In order to study the ozone initiated oxidation of hazardous organic compounds 25 mL
of each solvent (m-xylene and 2-chloroethanol) was pipetted into a reaction vessel and a
constant flow of 100 g mL-1 ozone was bubbled into each solvent for 3 6 9 12 16 and
24 hours respectively at a reaction temperature of 25 oC After each time interval
observations were made on the appearance of the substrate present in the reactor A
05 L aliquot of the substrate was injected into a gas chromatograph to monitor the
percentage conversion of substrate and products formed as a function of time Product
characterization and identification were conducted by GC-MS FT-IR and NMR
spectroscopy
23 Ozonation of m-xylene and 2-chloroethanol in the presence of
organic solvents
Many studies on ozonation have been carried out in water to remove toxic organic
substances However concentrations of most target organics in water are very low and
co-exist with ozone scavengers like CO2 The ozonation in water therefore is not
necessarily the most efficient process Most organic chemicals in water such as
pesticides polycyclic aromatic hydrocarbons and chlorinated compounds are
42
hydrophobic substances108 It is easy therefore to separate these substances by extraction
using organic solvents (which do not react with ozone) directly from water or from
activated carbon after adsorption from water The separated chemical concentrated in the
organic solvent may be decomposed more effectively than when in water or when in the
pure form To test the efficiency of the ozone initiated oxidation of organic compounds in
the presence of solvents acetic acid ethyl acetate and acetone were used These solvents
are known not to react with ozone Aqueous solutions containing acetic acid and acetone
were also studied
231 Ozonation of m-xylene and 2-chloroethanol in the presence of
acetic acid and ethyl acetate
The suitability of acetic acid and ethyl acetate as solvents for the ozonolysis of m-xylene
and 2-chloroethanol was therefore investigated by placing 2520 mL of each analytical
grade reagent into separate reaction vessels A constant flow of 100 g mL-1 ozone was
continuously bubbled into each solvent for 3 6 9 and 12 hours respectively at 25 oC The
appearance of the substrate was checked for any noticeable change during and after each
time interval and the change in the concentration of the substrate as a function of time
was monitored using a gas chromatograph fitted with a flame ionization detector
2311 Ozonation of m-xylene and 2-chloroethanol in the presence of
5 acetic acid
A 250 mL mixture of acetic acid in m-xylene and 2-chloroethanol was prepared by
mixing 125 mL acetic acid in 2375 mL of m-xylene and 2-chloroethanol respectively
(5 VV) Four 20 mL aliquots of each solvent mixture were placed in the reactor and a
continuous flow of 100 g mL-1 ozone was bubbled for 3 6 9 and 12 hours respectively
The appearance of the reaction mixture and the change in concentration of the substrate
as a function of time was monitored using a GC instrument The results obtained for these
43
experiments were compared to results from the ozonolysis of m-xylene and
2-chloroethanol under solvent free conditions Characterization of products was
performed by GC-MS
2312 Ozonation of m-xylene and 2-chloroethanol in the presence of
20 acetic acid
The effect of increased moles of acetic acid in the presence of m-xylene and
2-chloroethanol was investigated by preparing a mixture of 50 mL acetic acid in 200 mL
of m-xylene and 2-chloroethanol respectively (20 VV) Four 25 mL aliquots of each
mixture were placed in the reactor and a continuous flow of 100 g mL-1 ozone was
bubbled for 3 6 9 and 12 hours respectively
The appearance of the reaction mixture and the change in concentration of m-xylene as a
function of time was monitored by gas chromatography The results obtained for these
experiments were compared to results from the ozonolysis of m-xylene in the presence of
5 VV acetic acid and m-xylene under solvent free conditions Results of
characterization and identification of product obtained by GC-MS is presented and
discussed in chapter 3
24 Ozonation of m-xylene in the presence of acetic acid in an aqueous
medium
The work published by Y Nakano et al119120 on the ozonation of water soluble organic
substances in acetic acid solution showed that decomposition was possible not only in
water but also in organic solvents in the presence of water Their studies showed that the
rates of organic substance degradation both in 70 and 100 acetic acid solutions were
higher than in distilled water The decomposition rate of orange ІІ in distilled water was
27 mg L-1 min-1 whereas those in 70 and 100 acetic acid were more than
10 mg L-1 min-1 and were more than three times that in distilled water The pH of distilled
44
water was 69 It was different from that of 70 acetic acid solution which was 17
They suggested that the difference in pH might be responsible for the difference in the
decomposition rates Since m-xylene has a very low aqueous solubility and its presence
in natural waters is minimal mixtures containing 1 m-xylene in various solvents were
used for this study
241 Ozonation of 1 m-xylene in the presence of acetic acid and
acetone
Two stock solutions containing 25 mL m-xylene in 2475 mL 100 acetic acid and
25 mL m-xylene in 2475 mL 100 acetone were prepared (1 VV m-xylene) Seven
25 mL aliquots from each stock was introduced into separate reaction vessels and a
constant flow of 100 g mL-1 ozone was continuously bubbled for 10 20 30 40 50 60
and 90 minutes into each mixture During and after the ozonation observations were
made on the appearance of the substrate present in the reactor A 05 L aliquot of the
substrate was then injected into a gas chromatograph to monitor the conversion of
m-xylene as a function of time and yield of major products formed during ozonation
Product characterization and identification were determined by GC-MS and FTIR
242 Ozonation of 1 m-xylene in acetic acid and acetone in the
presence of water
Two stock solutions containing 25 mL m-xylene in 2475 mL 70 acetic acid and
25 mL m-xylene in 2475 mL acetone were prepared (1 VV m-xylene) Seven aliquots
of 20 mL each was introduced into the reaction vessel and a constant flow of 100 g mL-1
ozone was continuously fed for 10 20 30 40 50 60 and 90 minutes into each mixture
Percent conversion of m-xylene as a function of time was monitored for this
investigation
45
25 Ozonation of m-xylene in the presence of activated carbon
Several researchers123124 found that the catalytic ozonation process using activated
carbon requires little amount of ozone and its presence accelerates the ozone
decomposition reactions A study was therefore conducted to investigate the oxidation of
m-xylene present in heterogeneous systems
A fixed mass (1 g) of activated charcoal was added to each reaction flask containing
25 mL of m-xylene A constant flow of 100 g mL-1 ozone gas was continuously bubbled
for 3 6 9 and 12 hour into the mixture respectively Percent conversion of m-xylene and
yield of products formed as a function of time was monitored for this investigation
26 GC-MS analysis
Products formed during ozonolysis of m-xylene respectively was identified using a
ThermoFinnigan Trace Gas Chromatograph fitted with AS 3000 autosampler and coupled
to a ThermoFinnigan Polaris Q Electron Impact Mass Spectrometer The instrument
parameters and developed method was used for the GC-MS analysis is shown in Table
20
Table 20 GC-MS method and instrument parameters
Column Type AlltechEC5 [955poly(dimethylsiloxane)poly(diphenylsiloxane)]
30 m X 023 mm ID 1 microm film thickness
Sample Size 1 L
Injector Temp Prog 200 oC
Oven Temp 40 oC for 1 min increase 10 oC min to 300 oC hold for 5 min
Carrier Gas Helium at 1 mL min-1
Ion Source Temp 200 oC
Scan Range 40 - 500
Solvent Delay Time 4 minutes
MS Transfer Line Temp 270 oC
46
27 Gas chromatography analysis
Determination of the concentration of reaction products for the ozonation of m-xylene
and 2-chloroethanol was performed on a Shimadzu Gas Chromatograph fitted with a
flame ionization detector A GC method which gave good separation of products was
developed for the study The method and GC instrument settings are shown in Table 21
Table 21 GC method and instruments parameters
Column Type Elite 5 MS
30 m X 025 mm ID 025 microm film thickness
Sample Size 1 L
Injector Temp 260 oC
Split Ratio 600
Oven Temp Prog 45 oC for 5 min increase 20 oC min to 250 oC hold for 2 min
Carrier Gas Helium at 30 mL min-1
Detector Gas Hydrogen at 40 mL min-1 Air at 400 mL min-1
28 Extraction of carboxylic acids from product mixture
The ozonated samples were analyzed for the presence of water insoluble carboxylic
acids Sufficient quantity of substrate that was ozonated for more than 12 hours was
dissolved in dichloromethane (CH2Cl2) in a separating funnel A 5 aqueous solution of
sodium hydrogen carbonate (NaHCO3) was added to this mixture The contents of the
funnel were thoroughly shaken and then allowed to stand until two distinct layers were
observed
47
C
O
OH + NaHCO3
water insoluble
5
H2OCO
O
+ H2CO3Na
water soluble
solution
CH3 CH3
3-methylbenzoic acid 3-methylbenzoate)( )(
ion
Scheme 21 Mechanism showing the extraction of 3-methylbenzoic acid from the 12 hour ozonated reaction mixture
The water layer was then separated from the organic layer and acidified to pH 3 using
5 HCl The acidified mixture was finally extracted with CH2Cl2 and a drop spotted on
a TLC plate using 1 part ethyl acetate and 4 parts hexane as the mobile phase Both layers
showed good separation of products To confirm the presence of carboxylic acid FTIR
scans were performed on both the layers The GCMS results showed the presence of
three carboxylic acids namely acetic acid formic acid and 3-methylbenzoic acid The
reaction showing the extraction of 3-methylbenzoic acid is illustrated in Scheme 21
29 FTIR analysis
FTIR studies were performed in the transmittance mode in ambient air using a Perkin-
Elmer FTIR 2000 spectrometer equipped with an ATR crystal Spectra of the reaction
mixture were recorded before and after 12 h ozonation with a resolution of 4 cm-1 and
averaging of 128 scans The spectrums shown in Figures A36 A37 A44 and A45 were
compared An observation of the sample scans before and after ozonation showed a
definite change in the composition of the substrate molecule The interpretation of these
spectra is discussed in the chapters to follow
48
210 Calculation of conversion of substrate molecule after ozonation
The results of the GC analysis of the reaction mixture before and after ozonation were
used to calculate the amount of substrate converted at the end of each time interval
Calculation of m-xylene conversion ( conversion) was based on the peak areas obtained
from the chromatograms The following calculation model was used to calculate the
percentage of m-xylene converted in the reaction mixture after each time interval
CH3
CH3
Molecular Mass = 106 g mol-1
Density = 087 g mL-1
Sample Volume = 25 mL
Injection Volume = 1 x 10⁻³ mL
Peak Area (reference) = 777034714 units2
Peak Area (after 3 h ozonation) = 742762795 units2
Mass of m-xylene in 25 mL aliquot sample = 25 mL x 087 g mL-1
= 2175 g
Moles of m-xylene in 25 mL aliquot sample =
= 02052 mol
1 x 10⁻³ mL injection gave a peak area of 77034714 units2
Therefore 25 mL will give a peak area of 194 x 1013 units2
49
For a Sample after 3 h Ozonation
1 x 10⁻³ mL injection gave a peak area of 742762795 units2
Therefore 25 mL will give a peak area of 185 x 1013 units2
Therefore volume of m-xylene left in the reaction vessel after 3 h ozonation = 2384 mL
Mass of m-xylene left = 2384 mL x 087 g mL-1
= 2074 g
Moles of m-xylene left =
= 01957 mol
m-xylene converted =
= 463
Similar calculations were performed for percent conversion of m-xylene in the reaction
mixture after 6 9 and 12 h respectively For 2-chloroethanol ozonation a 20 ml sample
volume was used with the same calculations followed
211 Calculation of selectivity and yield of products after ozonation
The results of the GC analysis of the reaction mixture before and after ozonation were
used to calculate the percentage selectivity and yields of products at the end of each time
interval Calculation of selectivity for a specific product and its yield ( selectivity and
yield) are based on the peak area of the product obtained from the chromatogram The
following derived formulas were used in the calculation
50
The same formulas were used to calculate the selectivity and yield of products formed
during the ozonation of 2-chloroethanol at different time intervals
51
30 Introduction
In this chapter the results for the oxidation of m-xylene at various experimental
conditions are presented and discussed Ozone exhibits variations in its reactivity with
different classes of compounds when reactions take place in non-aqueous solvents under
severe reaction conditions of high temperature high pressure and high concentrations of
ozone and the organic compound The alkanes for example are relatively unreactive
towards ozone because they are saturated compounds On the other hand unsaturated
compounds such as the alkenes and some aromatic compounds that have available
electrons above and below the plane of the aromatic ring react reasonably fast with
ozone The presence of conjugated double bonds imparts color to most compounds in
water Colour will disappear rapidly when ozone is bubbled through the water because
ozone cleaves many of these carbon-carbon double bonds109 The reaction of ozone with
the aromatic ring system is highly electrophilic in nature and also highly selective
Electron donor groups attached to the aromatic ring lead to an enhanced rate whereas
electron-withdrawing groups cause a slower rate69
31 Calibration of ozone generator
Ozone output is a function of oxygen flow rate and ammeter readings The LAB 7000
was calibrated by varying oxygen flow rate and current at a constant temperature of 25 oC
to achieve ozone concentrations of 10 20 30 40 50 100 g mL-1 respectively The
determination of ozone concentration was determined by iodometric method involving
titration with a standard solution of sodium thiosulphate154 The results of the calibration
are shown in Table 30
52
Table 30 Ozone concentration data obtained at different oxygen flow rates and currents
measured at 25 oC
O2 Flow
rate
mL min-1
Ammeter Readings
(Amperes)
[O3 ]
10 g mL-1
[O3 ]
20 g mL-1
[O3 ]
30 g mL-1
[O3 ]
40 g mL-1
[O3 ]
50 g mL-1
[O3 ]
100 g mL-1
50 0204 0123 0236 0245 0267 0320
100 0235 0260 0267 0280 0297 0390
200 0270 0279 0310 0325 0345 0420
300 0323 0310 0367 0390 0405 0470
500 0360 0367 0398 0405 0450 ---
1000 0400 0398 0436 0457 --- ---
The amount of ozone generated was varied between 10 g mL-1 to100 g mL-1 Results
from the calibration data show that for a fixed oxygen gas flow rate the concentration of
ozone produced increases with increasing current However the instrument manufacturer
recommends that we operate the instrument at current settings not greater than 05 A for
more than a one minute as this will lead to dielectric overheating and reduction in ozone
output At higher oxygen gas flow rate one would expect a decrease in the residence time
of oxygen molecules in the vicinity of the dielectric hence a reduction in ozone output
This is evident from the calibration results that for a constant current the concentration of
ozone generated is less (10 g mL-1) at the highest oxygen flow rate (1000 mL min-1) and
more (100 g mL-1) at the lowest oxygen flow rate (50 mL min-1) All experiments were
therefore conducted with an oxygen gas flow rate of 200 mL min-1 and ammeter reading
ranging from 027 to 042 A
32 Oxidation of m-xylene under solvent free conditions
The ozone initiated oxidation of m-xylene was investigated for 3 6 9 12 16 and 24
hours respectively Twenty five milliliters of m-xylene was pipetted into the reaction
53
vessel and a constant flow of 200 mL min-1 oxygen producing 100 microg mL-1 ozone was
bubbled into each vessel for 3 6 9 12 16 and 24 hours respectively at a reaction
temperature of 25 oC Data for these experiments showing percent conversion of substrate
and percent selectivity towards identified products at various time intervals are shown in
Table 31
33 Product characterization for ozonation of pure m-xylene
The isolated products formed during the ozonation of m-xylene were characterized using
GC-MS FT-IR and 1H NMR techniques The interpretation of chromatograms and
spectra obtained during the study are discussed below
331 GC-MS analysis of m-xylene and product mixture
Chromatograms of pure m-xylene before ozonation shown in Figure A30 and pure
m-xylene after 12 hours of ozonation shown in Figure A31 provides sufficient evidence
that the substrate was oxidized to a mixture of major and minor products The peak
around 10 minutes refers to the elution of unreacted m-xylene and peaks at 1495 1574
1747 1931 and 2642 minutes refer to the elution of the positively identified products
acetic acid formic acid 3-methylbenzaldehyde 3-methylbenzyl alcohol and 3-
methylbenzoic acid respectively
The interpretation of electron impact mass spectra obtained for m-xylene ozonolysis
reactions is based on comparison of mass spectra of standard compounds These
compounds provided information on characteristic fragmentation pathways and expected
ion fragments The mass spectrum of m-xylene (MW=106) presented in Figure A32
show a medium peak at mz = 105 which is due to the loss of a hydrogen atom and the
formation of a methyltropylium ion More importantly xylene loses one methyl group to
form the tropylium ion (mz = 91) The formation of a substituted tropylium ion is typical
for alkyl-substituted benzenes The tropylium ion has characteristic fragmentations of its
54
own The tropylium ion can fragment to form the aromatic cyclopentadienyl cation
(mz = 65) plus ethyne (acetylene) The cyclopentadienyl cation in turn can fragment to
form another equivalent of ethyne and the aromatic cyclopropenyl cation (mz = 39)
Scheme 30 illustrates the formation and fragmentation of the tropylium ion
HH
R H +
H
H
R
R
H R
R
+
RH
H
+
R
mz = 91 (R=H)
mz = 105 (R=CH3)
mz = 91 (R=H)mz = 105 (R=CH3)
mz = 91 (R=H)mz = 105 (R=CH3)
mz = 65 (R=H)mz = 79 (R=CH3)
mz = 39 (R=H)mz = 53 (R=CH3)
Scheme 30 Formation and fragmentation of the tropylium ion137
The mass spectrum obtained for 3-methylbenzaldehyde is shown in Figure A33 A very
weak molecular ion peak characteristic of an aromatic aldehyde appears at mz = 120
The loss of one hydrogen atom via α-cleavage occurs to give the M ndash 1 peak at mz =
119 This peak is found to be more intense than the molecular peak a typical of an
aromatic aldehyde Further fragmentation leads to the loss of the formyl radical and
formation of the tropylium ion (mz = 91) The tropylium ion which has its own
characteristic fragmentation pattern is illustrated in Scheme 30
The mass spectrum obtained for 3-methylbenzoic acid is shown in Figure A34 A fairly
intense molecular ion peak of the aromatic acid appears at mz = 136 The loss of the bullOH
55
forms the CH3C6H5CequivO+ ion appearing at mz = 119 Further loss of CO from this ion
gives rise to a strong peak at mz = 91 characteristic of the tropylium ion The
fragmentation pattern of this ion is shown in Scheme 30137
332 FTIR analysis of product mixture
Infra-red spectra obtained for pure m-xylene and ozonated m-xylene mixture were also
compared The spectrum of pure m-xylene (Figure A37) showed strong C ndash H stretching
peaks near 3030 cm-1 characteristic of the benzene derivative The four bands in the
1450 ndash 1600 cm-1 region with two peaks near 1500 and 1600 cm-1 appearing moderately
stronger is characteristic of the stretching motions of the benzene ring The meta-
disubstituted benzene compound show two peaks one strong peak between 680 and 725
cm-1 and one very strong peak between 750 and 810 cm-1
The IR spectrum of ozonated m-xylene (Figure A37) showed the peaks and bands at
their usual positions for pure m-xylene but a prominent strong absorption peak is
observed between 1630 and 1780 cm-1 which is characteristic of the carbonyl functional
group This stretching indicates the presence of aldehydes andor carboxylic acid
compounds
333 Analysis of isolated products by 1H NMR
The 1H NMR spectrum of isolated product 3-methylbenzyl alcohol is presented in Figure
A39 The signal between 65 ndash 70 ppm is characteristic of aromatic ring hydrogens
(benzene ring hydrogens) and the signal between 20 ndash 25 ppm is characteristic of
benzylic hydrogens (those attached to an adjacent carbon atom)137 The chemical shift of
the ndashOH hydrogen appears as a broad peak around 20 ppm The position of this peak and
its broadening effect may be dependent on concentration solvent temperature and
presence of water or of acidic or basic impurities The hydrogens on the adjacent carbons
(-CH2 ndash OH) appears in the range 45 ndash 50 ppm is deshielded by the attached oxygen
56
The 1H NMR spectrum of isolated product 3-methylbenzoic acid is presented in Figure
A310 The hydrogens attached to the aromatic ring are easily identified The hydrogens
on an aromatic ring are more highly deshielded than those attached to double bonds due
to the large anisotropic field that is generated by the circulation of the electrons in the
ring (ring current)137 They are found in the region between 70 ndash 85 ppm The chemical
shift of the methyl protons appearing between 20 ndash 30 ppm shows a smaller deshielding
effect The chemical shift of the ndashOH hydrogen produces a peak near 105 ppm
In Table 31 the effect of ozone treatment time over conversion of m-xylene and
selectivity for products 3-MBAlc 3-MBAlde 3-MBAcid and smaller oxygenated
products referred to as ldquootherrdquo are shown An observation of the data shows that percent
conversion of m-xylene increases as a function of ozonation time Percentage conversion
of the substrate increased from 44 for 3 hours ozonation to 376 for 24 h ozonation
The conversion of m-xylene increased steadily from 3 h to 6 h with a low conversion in
the first 9 h and thereafter a fairly rapid increase up to 24 h This pattern of m-xylene
conversion indicates that the reaction is mass transfer controlled as reported by
Bollyky112 who showed that for fast ozone reactions the rate of mass transfer of ozone
increases thereby improving substrate destruction
Table 31 Percent conversion of m-xylene and selectivity data for the ozone initiated oxidation of
25 mL m-xylene as a function of time
Oxygen flow rate = 200 mL min-1 Ozone concentration = 100 μg mL-1
3-MBAlc = 3-methylbenzylalcohol 3-MBAlde = 3-methylbenzaldehyde 3-MBAcid = 3-methylbenzoic acid Other = acetic acid formic acid and carbon oxides
Ozonation Time (h)
Conversion ()
Selectivity ()
3-MBAlc 3-MBAlde 3-MBAcid Other
3 44 243 451 00 306
6 92 310 336 118 232
9 107 301 330 114 252
12 192 349 237 163 252
16 234 348 225 180 251
24 376 357 166 220 254
57
In Figure 30 m-xylene conversion and the selectivityrsquos for the formation of 3-MBAlc
3-MBAlde 3-MBAcid and other small oxygenated products measured at a constant
ozone dose of 100 μg mL-1 are plotted as a function of ozonation time The results show a
steady decrease in selectivity towards 3-MBAlde from 451 after 3 h ozonation to 166
after 24 h ozonation and an increase in selectivity towards 3-MBAcid from 0 after 3
h ozonation to 220 after 24 h
Figure 30 Percent conversion of m-xylene and product selectivity versus ozonation time
This pattern of product formation is due to the oxidation of 3-MBAlde to 3-MBAcid
implying the existence of consecutive reactions for these products at longer ozonation
times A similar behavior was found by Van der Weile and Van den Berg118 in the
oxidation of toluene over bismuth molybdate catalysts Selectivity towards 3-MBAlc
increased gradually from 243 to 349 during the first 12 hours of ozonation and
thereafter remained constant up to 24 h ozonation The smaller oxygenated products such
as formic acetic and carbon oxides showed a decrease in selectivity for the first 6 h and
thereafter remained constant up to 24 h ozonation
0
5
10
15
20
25
30
35
40
45
50
2 4 6 8 10 12 14 16 18 20 22 24
Con
vers
ion
and
Sele
ctiv
ity (
)
Ozonation Time (h)
conversion - m-xylene S - 3-MBAlc
S - 3-MBAlde S - 3-MBAcid
S - other
58
The percentage yields of major products namely 3-MBAlc 3-MBAlde 3-MBAcid and
ldquootherrdquo products formed during the ozone initiated oxidation of m-xylene are presented in
Table 32 and Figure 31 It is evident that yield for all products increase as ozonation time
increases
Table 32 Percent yield of identified products for ozonation of m-xylene as a function of time
Ozonation Time (h)
Yield ()
3-MBAlc 3-MBAlde 3-MBAcid Other
3 11 20 00 13
6 29 31 11 21
9 32 35 12 27
12 67 46 31 48
16 81 53 42 58
24 134 63 83 96
Oxygen flow rate = 200 mL min-1 Ozone concentration = 100 μg mL-1
Figure 31 Percent yield of products versus ozone treatment time
In the first 3 h of ozonation the data obtained suggests that ozone was ineffective to
oxidize the aromatic aldehyde 3-MBAlde to its corresponding acid 3-MBAcid This
0
2
4
6
8
10
12
14
3 6 9 12 16 24
Yiel
d (
)
Ozonation Time (h)
3-MBAlc 3-MBAlde 3-MBAcid other
59
slow oxidation process indicates low ozone solubility in the substrate During the first 9 h
of ozone treatment it is observed that the yield of 3-MBAlde is marginally higher than the
yield of 3-MBAlc indicating that the aromatic alcohol once formed is rapidly oxidized
to its corresponding acid After 9 h the yield of 3-MBAlc increases significantly in
comparison to the other products formed This pattern of product formation suggests that
ozone is extremely effective in converting m-xylene to its primary product 3-MBAlc
however further oxidation of this product is slow The presence of organic solvents
during the ozonation of m-xylene is therefore going to be explored
34 Ozonation of m-xylene in the presence of organic solvents
Literature review showed that the ozonation of alkanes was studied in the presence of
several chlorinated solvents acetone tetrahydrofuran benzene etc Solvents were used
mainly to improve the solubility of ozone and to provide suitable reaction conditions
White and Bailey reported that the adsorption of ozone in acetic acid reaction mixtures
were about 80 to 90 throughout the reaction115
Acetic acid and ethyl acetate are frequently used as solvents in ozonation and are quite
resistant to ozone destruction111 However it has been reported by Paillard and Briner113
that on prolonged treatment with ozone traces of peracetic acid are produced Taube114
has claimed that under the influence of UV light this product becomes significant
Attempts also have been made to destroy acetic and oxalic acids in wastewater using
ozone Acetic acid destruction was unsuccessful except in the presence of UV light or
alkali solution Ozone plus UV light converted acetic acid to oxalic acid Oxalic acid
destruction was slow under basic conditions but conversion to CO2 occurred under acidic
conditions and influence of UV light116117 Attempts were made by Galutkina et al117 to
destroy acetone present in wastewaters They were unsuccessful however ozonation in
the presence of acetic acid converted it to acetic and oxalic acids Since acetic acid and
ethyl acetate are quite resistant to ozone attack and has found to improve the ozonation
process as reported by many researchers experiments were conducted to study the
influence of these solvents on the ozone initiated oxidation of m-xylene
60
341 Effect of acetic acid on ozonation of m-xylene
The presence of acetic acid in the ozonation of m-xylene was investigated One hundred
milligrams per litre ozone was first bubbled through pure acetic acid for 3 6 9 and 12
hours under similar experimental conditions as for the ozonation of m-xylene The
results showed no significant oxidation of the substrate molecule
A mixture containing m-xylene in 5 acetic acid was then ozonated for 3 6 9 and 12
hours using similar experimental conditions for ozonation of m-xylene Data for these
experiments showing conversion of substrate and selectivity towards identified products
at various ozonation times are illustrated in Table 33 and Figure 32
Table 33 Percent conversion and selectivity data for the ozone initiated oxidation of m-xylene in
the presence of 5 acetic acid as a function of time
Oxygen flow rate = 200 mL min-1 Ozone concentration = 100 μg mL-1
From the results shown in Table 33 it is evident that the percentage conversion of
m-xylene is marginally higher when ozonated in the presence of 5 acetic acid The
conversion of m-xylene increased from 54 after 3 h to 211 after 12 h of ozone
treatment This behavior is in accordance with former studies conducted by Nakano et
al119120 who showed that when acetic acid was used as a flushing solvent the rate of
trichloroethylene removal in the flushing process with ozone was 25 times higher
Ozonation Time (h)
Conversion ()
Selectivity ()
3-MBAlc 3-MBAlde 3-MBAcid Other
3 54 287 443 00 270
6 110 299 366 127 207
9 127 327 263 176 233
12 211 363 250 206 181
61
Acetic acid was chosen for two reasons a high capacity for ozone dissolution
(225 mg L-1 in 99 acetic acid whereas 95 mg L-1 in water at 20 oC) and a higher
trichloroethylene oxidation rate compared to that in distilled water even at the same
ozone concentration Product formation for the ozonation of m-xylene in the presence of
5 acetic acid was the same as for the oxidation of m-xylene in the absence of the acid
Figure 32 Percent conversion of m-xylene and selectivity profiles of product formation versus
ozonation time (m-xylene in the presence of 5 acetic acid)
The selectivity profiles for the ozonation of m-xylene in the presence of 5 acetic acid
showed similar trends when compared to the ozonation of m-xylene in the absence of
acid Selectivity for 3-MBAlc gradually increased from 287 after 3 h ozonation to
363 after 12 h Selectivity towards 3-MBAlde sharply decreased from 443 after 3 h
ozonation to 263 after 9 h thereafter remaining constant for the next 3 h while
selectivity towards 3-MBAcid increased from 0 after 3 to 206 at 12 h Selectivity
towards formic acetic and carbon oxides decreased from 270 after 3 h to 181 after
12 h of ozone treatment The percentage yields of major products namely 3-MBAlc 3-
MBAlde 3-MBAcid and ldquootherrdquo products formed during the ozone initiated oxidation of
m-xylene are presented in Table 34 While the data shows that yield for all products
0
5
10
15
20
25
30
35
40
45
50
2 3 4 5 6 7 8 9 10 11 12
Con
vers
ion
and
Sele
ctiv
ity (
)
Ozonation Time (h)
conversion - m-xylene S - 3-MBAlc S - 3-MBAlde
S - 3-MBAcid S - other
62
increase as ozonation time increases it is evident that the presence of 5 acetic acid has
marginally improved the yield of all products
Table 34 Percent yield of identified products for the ozone initiated oxidation of m-xylene in the
presence of 5 acetic acid as a function of time
Further experiments were conducted to study the effect of increasing the moles of acetic
acid on the ozonation of m-xylene This was achieved by ozonating a mixture containing
m-xylene in 20 acetic acid for 3 6 9 and 12 hours respectively using similar
experimental conditions for ozonation of m-xylene in the absence of acid Data for these
experiments showing percentage conversion of substrate and percentage selectivity
towards major products at various ozonation times are shown in Table 35 and Figure 33
Table 35 Percent conversion and selectivity data for the ozone initiated oxidation of m-xylene in
the presence of 20 acetic acid as a function of time
Oxygen flow rate = 200 mL min-1 Ozone concentration = 100 μg mL-1
Ozonation Time (h)
Yield ()
3-MBAlc 3-MBAlde 3-MBAcid Other
3 16 24 00 07
6 33 41 13 15
9 41 34 21 24
12 77 55 41 32
Ozonation Time (h)
Conversion ()
Selectivity ()
3-MBAlc 3-MBAlde 3-MBAcid Other
3 82 247 401 00 352
6 190 319 348 165 168
9 206 319 271 210 200
12 263 337 208 188 323
63
Figure 33 Percent conversion of m-xylene and selectivity profiles of product formation versus
ozonation time (m-xylene in the presence of 20 acetic acid)
When comparing results obtained for samples ozonated in the presence of 5 acetic acid
(Table 33) to results obtained for the ozonation of m-xylene in 20 acetic acid (Table
35) it is clearly evident that the percentage conversion of m-xylene has improved
considerably After 3 hours of ozonation 82 of m-xylene was converted to products
Exposure of the reaction mixture to ozone for a further 12 hours resulted in 263
conversion
The selectivity profiles for the ozonation of m-xylene in the presence of 20 acetic acid
showed slightly different trends when compared to the ozonation of m-xylene and
ozonation of m-xylene in the presence of 5 acetic acid Selectivity towards ldquootherrdquo
products showed a reasonably large decrease from 352 after 3 hours to 168 after
6 hours followed by a gradual increase up to 12 hours Selectivity towards 3-MBAlde
decreased from 401 at 3 hours to 208 at 12 hours while selectivity towards
3-MBAcid increased from 0 at 3 hours to 188 at 12 hours This pattern of product
formation suggests that the presence of 20 acetic acid not only has an effect on the
0
5
10
15
20
25
30
35
40
45
2 3 4 5 6 7 8 9 10 11 12
Con
vers
ion
and
Sele
ctiv
ity (
)
Ozonation Time (h)
conversion - m-xylene S - 3-MBAlc
S - 3-MBAlde S - 3-MBAcid
S - other
64
oxidation of m-xylene but also is effective in converting primary products into secondary
products which was not achieved when m-xylene was ozonated alone
Table 36 Percent yield of identified products for the ozone initiated oxidation of m-xylene in the
presence of 20 acetic acid as a function of time
Ozonation Time (h)
Yield ()
3-MBAlc 3-MBAlde 3-MBAcid Other
3 20 33 00 29
6 61 66 31 32
9 66 56 43 41
12 89 55 50 85
The percentage yields of major products namely 3-MBAlc 3-MBAlde 3-MBAcid and
ldquootherrdquo products formed during the ozone initiated oxidation of m-xylene are presented in
Table 36 While the data shows that yield for all products increase as ozonation time
increases it is evident that the presence of 20 acetic acid has marginally improved the
yield of all products formed
342 Comparison of data for ozone initiated oxidation of m-xylene in
acetic acid
A comparison of the percentage conversion of m-xylene in solvent free conditions
m-xylene in the presence of 5 acetic acid and m-xylene in the presence of 20 acetic
acid is illustrated in Figure 34 In comparing the conversion profiles at different reaction
conditions it is clearly evident that m-xylene in the presence of 20 acetic acid gave the
highest percentage conversion of substrate The presence of acetic acid resulted both in
an increase in ozone dissolution and the initiation of the ozone decomposition reaction
This behavior is in agreement with previous studies conducted which showed that the
increase in acetic acid concentration modified the chemical properties of humic acid
producing both soluble and solid fractions during the ozonation of trichloroethylene121
65
The distribution of soluble and solid humic acid fractions affected the chemical reactions
between humic acid and ozone resulting in a higher trichloroethylene decomposition
rate122
Figure 34 Comparison of percent conversion of m-xylene and m-xylene in acetic acid versus
ozonation time
Figures 35 ndash 38 illustrates percentage yields for 3-MBAlc 3-MBAlde 3-MBAcid and
smaller oxygenated products referred to as ldquoothersrdquo formed during the ozonation of
m-xylene in solvent free conditions and m-xylene in the presence of 5 and 20 acetic
acid as a function of time
A study of the product yields shows that the percentage yield of all identified products
were the highest when m-xylene was treated with ozone in the presence of 20 acetic
acid The pattern of 3-MBAlc formation during the ozonation of m-xylene was similar to
the ozonation of m-xylene in the presence of 5 acetic acid however a marginal
increase in yield at all time intervals is observed
0
5
10
15
20
25
30
2 4 6 8 10 12
Con
vers
ion
()
Ozonation Time (h)
m-xylene
m-xylene in 5 AA
m-xylene in 20 AA
66
Figure 35 Comparison of percent yield of 3-MBAlc formed during ozonation of m-xylene and
m-xylene in acetic acid versus time
Figure 36 Comparison of percent yield of 3-MBAlde formed during ozonation of m-xylene and
m-xylene in acetic acid versus time
0
1
2
3
4
5
6
7
8
9
10
2 3 4 5 6 7 8 9 10 11 12 13
Ye
ild (
)
Ozonation Time (h)
3-MBAlc (m-xylene)
3-MBAlc (m-xylene + 5 AA)
3-MBAlc (m-xylene + 20 AA)
1
2
3
4
5
6
7
2 3 4 5 6 7 8 9 10 11 12 13
Ye
ild (
)
Ozonation Time (h)
3-MBAlde (m-xylene)
3-MBAlde (m-xylene + 5 AA)
3-MBAlde (m-xylene + 20 AA)
67
Figure 37 Comparison of percent yield of 3-MBAcid formed during ozonation of m-xylene and
m-xylene in acetic acid versus time
Figure 38 Comparison of percent yield of ldquootherrdquo products formed during ozonation of m-xylene
and m-xylene in acetic acid versus time
0
1
2
3
4
5
6
2 3 4 5 6 7 8 9 10 11 12 13
Ye
ild (
)
Ozonation Time (h)
3-MBAcid (m-xylene)
3-MBAcid (m-xylene + 5 AA)
3-MBAcid (m-xylene + 20 AA)
1
2
3
4
5
6
7
8
9
2 3 4 5 6 7 8 9 10 11 12 13
Ye
ild (
)
Ozonation Time (h)
other (m-xylene)
other (m-xylene + 5 AA)
other (m-xylene + 20 AA)
68
In all cases the percent yield of 3-MBAlc increased sharply between 3 to 6 h of
ozonation thereafter remaining constant for the next 3 h and finally increasing fairly
rapidly from 9 to 12 h of ozone treatment In the presence of 20 acetic acid the yield
of 3-MBAlc increased sharply after 3 h from 2 to 61 after 6 h ozonation A steady
formation is observed for the next 3 h and thereafter a rapid increase to 89 after 12 h
ozone treatment Figure 36 show that the yield of 3-MBAlde increasing for the first 6 h
of ozonation with the highest yield recorded when m-xylene was ozonated in the
presence of 20 acetic acid It is further observed that for 5 and 20 acetic acid
mixtures the yield of 3-MBAlde decreased sharply during the 6 h to 9 h time interval
while the yield of 3-MBAcid increases sharply This trend indicates that the presence of
acetic acid during ozonation not only gives higher conversion rates of m-xylene but also
has the ability to rapidly convert the aromatic aldehydes to aromatic carboxylic acids
The yield of the smaller oxygenated products such as formic acid acetic acid and carbon
oxides also shows a rapid increase from 9 h to 12 h of ozone treatment in acidic medium
343 Effect of ethyl acetate on ozonation of m-xylene
The presence of ethyl acetate in the ozonation of m-xylene was investigated One
hundred milligrams per litre ozone was first bubbled through pure ethyl acetate for 3 6 9
and 12 h under similar experimental conditions as for the ozonation of m-xylene The
results showed no significant oxidation of the substrate molecule confirming that ethyl
acetate is resistant to ozone attack at room temperature and atmospheric pressure
A 25 mL mixture containing m-xylene in 5 ethyl acetate was then ozonated for 3 6 9
and 12 h using identical experimental conditions for ozonation of m-xylene in the
absence of solvent Data for these experiments showing percent conversion of substrate
and percent selectivity towards major products at various ozonation times are illustrated
in Table 37 and Figure 39
69
Table 37 Percent conversion and selectivity data for the ozone initiated oxidation of m-xylene in
the presence of 5 ethyl acetate as a function of time
Ozonation Time (h)
Conversion ()
Selectivity ()
3-MBAlc 3-MBAlde 3-MBAcid Other
3 89 192 405 00 403
6 196 341 242 178 239
9 299 370 186 210 233
12 375 355 157 221 266
Oxygen flow rate = 200 mL min-1 Ozone concentration = 100 μg mL-1
Figure 39 Percent conversion of m-xylene and selectivity profiles of product formation versus
ozonation time (m-xylene in the presence of 5 ethyl acetate)
0
5
10
15
20
25
30
35
40
45
2 3 4 5 6 7 8 9 10 11 12
Con
vers
ion
and
Sele
ctiv
ity (
)
Ozonation Time (h)
conversion - m-xylene S - 3-MBAlcS - 3-MBAlde S - 3-MBAcidS - other
70
It is clearly evident from the data presented in Table 37 that the presence of 5 ethyl
acetate has improved the conversion of m-xylene to the same oxygenated products
formed during ozonation without solvent Conversion of substrate increased from 89
after 3 h of ozonation to 375 after 12 h of continuous ozone treatment The selectivity
towards the aromatic alcohol 3-MBAlc increased from 192 after 3 h to 355 after
12 h ozonation Selectivity for the aromatic aldehyde showed a steady decrease of 405
after 3 h ozonation to 157 after 12 h ozonation The aromatic acid 3-MBAcid
appeared to be non-selective after 3 h of ozone treatment increasing steadily to 178
after 6 h and remaining constant for the next 6 h of ozonation This pattern of selectivity
indicates the presence of consecutive reactions between the products formed Table 38
lists the calculated data for the product yields The yield of all major products increase as
ozone treatment time is increased
Table 38 Percent yield of identified products for the ozone initiated oxidation of m-xylene in the
presence of 5 ethyl acetate as a function of time
Further experiments were conducted to study the effect of increasing the moles of ethyl
acetate on the ozonation of m-xylene This was conducted by ozonating a 25 mL mixture
containing m-xylene in 20 ethyl acetate for 3 6 9 and 12 hours respectively using
similar experimental conditions for ozonation of pure m-xylene Data for these
experiments showing percent conversion of substrate and percent selectivity towards
major products at various ozonation times are shown in Table 39 and Figure 310
Ozonation Time (h)
Yield ()
3-MBAlc 3-MBAlde 3-MBAcid Other
3 17 36 00 36
6 67 47 35 47
9 111 56 63 70
12 133 59 83 99
71
Table 39 Percent conversion and selectivity data for the ozone initiated oxidation of m-xylene in
the presence of 20 ethyl acetate as a function of time
Ozonation Time (h)
Conversion ()
Selectivity ()
3-MBAlc 3-MBAlde 3-MBAcid Other
3 125 322 276 147 256
6 248 407 174 214 205
9 305 381 165 238 216
12 425 296 133 228 343
Oxygen flow rate = 200 mL min-1 Ozone concentration = 100 μg mL-1
Figure 310 Percent conversion of m-xylene and selectivity profiles of product formation versus
ozonation time (m-xylene in the presence of 20 ethyl acetate)
10
15
20
25
30
35
40
45
2 3 4 5 6 7 8 9 10 11 12
Con
vers
ion
and
Sele
ctiv
ity (
)
Ozonation Time (h)
conversion - m-xylene S - 3-MBAlc
S - 3-MBAlde S - 3-MBAcid
S - other
72
A study of the data in Table 39 shows that m-xylene in the presence of 20 ethyl
acetate has been successfully oxidized to products and percentage conversion of the
substrate increases with an increase in ozone treatment time The products formed were
the same oxygenated products formed during ozonation without solvent Conversion of
substrate increased from 125 after 3 h of ozonation to 425 after 12 h of continuous
ozone treatment The selectivity for the aromatic alcohol increased from 322 after 3 h
to 407 after 6 h ozonation and thereafter decreased gradually to 296 Selectivity
for the aromatic aldehyde showed a steady decrease of 276 after 3 h ozonation to 133
after 12 h ozonation The aromatic acid 3-MBAcid showed good selectivity achieving
a value of 147 after 3 h of ozone treatment and thereafter increasing steadily to 214
after 6 h and finally remaining constant for the next 6 h of ozonation This pattern of
selectivity indicates the presence of consecutive reactions between the products formed
The aromatic alcohol is converted to its corresponding alcohol and thereafter to its
corresponding aromatic acid Table 310 lists the calculated data for the product yields for
the ozonation of m-xylene in the presence of 20 ethyl acetate The yield of major
products is shown to increase with an increase in ozonation time a pattern similar to
experiments conducted with 5 ethyl acetate
Table 310 Percent yield of identified products for the ozone initiated oxidation of m-xylene in the
presence of 20 ethyl acetate as a function of time
Ozonation Time (h)
Yield ()
3-MBAlc 3-MBAlde 3-MBAcid Other
3 40 34 18 32
6 101 43 53 51
9 116 50 72 66
12 126 56 97 146
73
344 Comparison of data for ozone initiated oxidation of m-xylene in
ethyl acetate
Figure 311 Comparison of percent conversion of m-xylene and m-xylene in ethyl acetate versus
ozonation time
Figure 311 compares data for the ozone initiated conversion of m-xylene in the absence
of solvent and m-xylene in the presence of 5 and 20 ethyl acetate solutions
respectively
An observation of the data reveals that the conversion of m-xylene is significantly
improved when ozonation is performed in the presence of ethyl acetate In comparing the
conversion profiles at different reaction conditions it is clearly evident that m-xylene in
the presence of 20 ethyl acetate gave the highest percentage conversion of substrate
The presence of ethyl acetate due to its nature resulted both in an increase in ozone
dissolution and the initiation of the ozone decomposition reaction
Figures 312 ndash 315 illustrates percentage yields for 3-MBAlc 3-MBAlde 3-MBAcid and
smaller oxygenated products referred to as ldquoothersrdquo formed during the ozonation of
m-xylene in solvent free conditions and m-xylene in the presence of 5 and 20 ethyl
acetate as a function of time
0
10
20
30
40
50
2 4 6 8 10 12
Con
vers
ion
()
Ozonation Time (h)
m-xylene
m-xylene in 5 EA
m-xylene in 20 EA
74
Figure 312 Comparison of percent yield of 3-MBAlc formed during ozonation of m-xylene and
m-xylene in ethyl acetate versus time
Figure 313 Comparison of percent yield of 3-MBAlde formed during ozonation of m-xylene and
m-xylene in ethyl acetate versus time
0
2
4
6
8
10
12
14
16
2 3 4 5 6 7 8 9 10 11 12 13
Yeild
()
Ozonation Time (h)
3-MBAlc (m-xylene)
3-MBAlc (m-xylene + 5 EA)
3-MBAlc (m-xylene + 20 EA)
1
2
3
4
5
6
7
2 3 4 5 6 7 8 9 10 11 12 13
Yeild
()
Ozonation Time (h)
3-MBAlde (m-xylene)
3-MBAlde (m-xylene + 5 EA)
3-MBAlde (m-xylene + 20 EA)
75
Figure 314 Comparison of percent yield of 3-MBAcid formed during ozonation of m-xylene and
m-xylene in ethyl acetate versus time
Figure 315 Comparison of percent yield of ldquootherrdquo products formed during ozonation of m-
xylene and m-xylene in ethyl acetate versus time
0
2
4
6
8
10
12
2 3 4 5 6 7 8 9 10 11 12 13
Yeild
()
Ozonation Time (h)
3-MBAcid (m-xylene)
3-MBAcid (m-xylene + 5 EA)
3-MBAcid (m-xylene + 20 EA)
1
3
5
7
9
11
13
15
17
2 3 4 5 6 7 8 9 10 11 12 13
Yeild
()
Ozonation Time (h)
other (m-xylene)
other (m-xylene + 5 EA)
other (m-xylene + 20 EA)
76
A study of the product yields shows that the percentage yield of all identified products
were the highest when m-xylene was treated with ozone in the presence of ethyl acetate
The pattern of 3-MBAlc formation during the ozonation of m-xylene was similar to the
ozonation of m-xylene in the presence of ethyl acetate however a significant increase in
yield at all time intervals is observed The percent yield of 3-MBAlc increased sharply
between 3 to 12 h when ozonation was carried out in ethyl acetate In the presence of
20 ethyl acetate the yield of 3-MBAlc increased sharply after 3 h from 4 to 101
after 6 h ozonation A steady formation is observed for the next 6 h from 116 to
126 Figure 313 show that the yield of 3-MBAlde increases gradually from 3 h to 6 h
of ozonation with the higher yields recorded when m-xylene was ozonated in the
presence of 20 ethyl acetate This trend indicates that the presence of ethyl acetate
during ozonation not only gives higher conversion rates of m-xylene but also has the
ability to rapidly convert the aromatic aldehydes to aromatic carboxylic acids The yield
of the smaller oxygenated products such as formic acid acetic acid and carbon oxides
also shows a rapid increase from 9 h to 12 h of ozone treatment
345 Ozonation of 1 m-xylene in ethyl acetate
A further study was conducted to establish the sequence of the product formation by
ozonating a 1 solution of m-xylene in ethyl acetate using shorter ozonation times but
similar experimental conditions as for pure m-xylene Results for this experiment
showing percent conversion of substrate and percent selectivity towards the major
identified products at various time intervals are summarized in Table 311 Interesting
observations were made from the analysis of the data obtained for the ozonation of a
mixture of 1 m-xylene in ethyl acetate at time intervals ranging from 10 minutes to 90
minutes (Figure 316) The selectivity towards 3-methylbenzyl alcohol was 0 from
start to end of reaction that is no formation of this product was observed during the
duration of the experiment The IR spectrum of a 12 hour ozonated sample of m-xylene
in Figure A37 shows no strong broad band in the 3200 ndash 3600 cm-1 region due to O ndashH
stretching furthermore the absence of another characteristic broad band at about 1230
cm-1 due to C ndash O stretching commonly found in Ar ndash OH functional groups is additional
77
evidence that 3-methylbenzyl alcohol is not formed as an intermediate product during the
ozonation of m-xylene
Table 311 Percent conversion and selectivity data for the ozone initiated oxidation of 1
m-xylene in the presence of ethyl acetate as a function of time
Oxygen flow rate = 200 mL min-1 Ozone concentration = 100 μg mL-1
Figure 316 Percent conversion of m-xylene and selectivity profiles of product formation for
ozonation of 1 m-xylene in ethyl acetate versus time
0
10
20
30
40
50
60
70
80
90
100
0 10 20 30 40 50 60 70 80 90 100
Con
vers
ion
and
Sele
ctiv
ity (
)
Ozonation Time (h)
conversion S - 3-MBAlde S - 3-MBAcid other
Ozonation Time (min)
Conversion ()
Selectivity ()
3-MBAlc 3-MBAlde 3-MBAcid Other
10 85 00 1000 00 00
20 204 00 901 22 78
30 220 00 166 76 758
40 326 00 120 89 790
50 485 00 89 101 810
60 764 00 62 112 826
90 833 00 55 123 822
78
The first 10 minutes of ozonation of the mixture resulted in the formation of only one
product namely 3-methylbenzaldehyde having a selectivity of 100 Its high selectivity
sharply decreased between 10 and 30 minutes to 166 and thereafter it further
decreased gradually to 55 after 90 minutes The selectivity towards 3-methylbenzoic
acid was 0 for the first 10 minutes of the reaction thereafter steadily increasing from
22 to 123 during the remainder of the reaction
The selectivity for the ldquootherrdquo products was 0 during the first 10 minutes of the
reaction and from then on increased sharply from 78 to 822 after 90 minutes This
pattern of product formation is in contrast to studies recently conducted by Guo et al110
who reported the oxidation of toluene catalyzed by cobalt tetraphenylporphyrin to benzyl
alcohol benzaldehyde and benzoic acid (Their mechanism is illustrated in Scheme 30)
the pattern of product formation for the ozonation of m-xylene indicates a stepwise
reaction with first a rapid formation of an aldehyde followed by further oxidation to a
carboxylic acid
CH3
oxide catalystO2 in autoclave
CHO
+
CH2OH
+
COOH
Scheme 30 Liquid phase oxidation of toluene with molecular oxygen over Cu-based
heterogeneous catalyst110
Hoigne and Bader69 also found that the reactivity of benzene toluene ethylbenzene and
xylene with ozone increases with the number of substituted methyl groups While
benzene was moderately reactive xylenes had a higher reactivity depending on the
position of the methyl group
79
35 Effect of activated charcoal on ozonation of m-xylene
The ozone initiated oxidation of m-xylene in the presence of activated charcoal was
investigated by placing 25 mL aliquots of the substrate and 1 g of charcoal in the reaction
vessel A constant flow of 200 mL min-1 oxygen producing 100 μg mL-1 ozone was
introduced to each mixture for 3 6 9 and 12 hours respectively Percent conversion and
selectivity of major products formed and their yields after ozonation were monitored by
gas chromatography after each time interval Data for these experiments are shown in
Table 312 and Figure 317
Table 312 Percent conversion and selectivity data for the ozone initiated oxidation of m-xylene in
the presence of activated charcoal as a function of time
Oxygen flow rate = 200 mL min-1 Ozone concentration = 100 μg mL-1
As seen in Table 312 the percent conversion of m-xylene increased proportionately with
ozone treatment time The simultaneous use of ozone and activated carbon resulted in the
conversion of 239 m-xylene after 12 hours to the same oxygenated products
Conversion of m-xylene was significantly improved by the catalytic action of activated
carbon when compared to ozonation treatment alone reported earlier in this chapter as
192 conversion after 12 hours of ozone exposure Since activated carbon was reported
to work as an absorbent and also as a catalytic agent in the ozone treatment of dyes
together with ozone123 similar reactions might have taken place in the case of m-xylene
Ozonation Time (h)
Conversion ()
Selectivity ()
3-MBAlc 3-MBAlde 3-MBAcid Other
3 113 313 446 00 241
6 180 330 288 135 247
9 207 331 268 147 256
12 239 354 231 183 235
80
Figure 317 Percent conversion of m-xylene and selectivity profiles of product formation versus
ozonation time (m-xylene in 1 g activated charcoal)
In Figure 317 m-xylene conversion and the selectivityrsquos for the formation of 3-MBAlc
3-MBAlde 3-MBAcid and the ldquootherrdquo products are plotted as a function of ozonation
time at a constant ozone dose of 100 μg mL-1 The results show a steady decrease in
selectivity towards 3-MBAlde and an increase in selectivity towards 3-MBAcid as
ozonation time increases This is due to the oxidation of 3-MBAlde to 3-MBAcid Ozone
treatment combined with activated carbon converted m-xylene more rapidly than that
with ozone alone The conversion of m-xylene as well as some of the oxidation by-
products through ozonation in the presence of activated carbon is a result of a complex
combination of homogeneous and heterogeneous reactions Both direct and indirect
ozone reactions occur in the liquid phase Additionally reactions between adsorbed
species and oxygen radicals formed on the surface of the activated carbon are thought to
occur Several authors have reported that activated carbon accelerates the decomposition
of ozone124 They concluded that both textural and surface chemical properties influence
the decomposition According to the literature two possible pathways can explain the
decomposition of ozone in the presence of activated charcoal The first pathway
0
5
10
15
20
25
30
35
40
45
50
2 3 4 5 6 7 8 9 10 11 12
Con
vers
ion
and
Sele
ctiv
ity (
)
Ozonation Time (h)
conversion - m-xylene S - 3-MBAlc
S - 3-MBAlde S - 3-MBAcid
S - other
81
suggested that activated carbon acts as an initiator of the decomposition of ozone
eventually through the formation of H2O2 yielding free radical species such as bullOH in
solution A second possibility is the adsorption and reaction of ozone molecules on the
surface of the activated carbon yielding surface free radicals
AC + O3 rarr ACminusO
Where ACminusO represents an oxygen-containing active species on the surface of the
activated carbon which can react with the adsorbed organic species151
Table 313 Percent yield of identified products for the ozone initiated oxidation of m-xylene in the
presence of activated charcoal as a function of time
Table 313 presents data for the percentage yield of products formed during ozonation of
m-xylene in the presence of activated charcoal It is clearly evident that the yield of
identified products 3-MBAlc 3-MBAlde 3-MBAcid and small oxygenated compounds
referred to as ldquootherrdquo increases with an increase in ozone treatment time Yield of
3-MBAc increased gradually from 35 after 3 h ozonation to 85 h after 12 h of ozone
treatment The yield of 3-MBAlde remained almost constant with 50 recorded after
3 h to 55 after 12 h of ozone treatment The formation of 3-MBAcid only occurred
after 3 h of ozonation with 24 being formed after 6 h increasing to 44 after 12 h
of ozonation
Ozonation Time (h)
Yield ()
3-MBAlc 3-MBAlde 3-MBAcid Other
3 35 50 00 27
6 59 52 24 45
9 68 55 30 53
12 85 55 44 55
82
351 Comparison of data for ozone initiated oxidation of m-xylene in
the presence of activated charcoal
Figure 318 gives an illustration of the ozone initiated conversion of m-xylene and
m-xylene in the presence of activated charcoal It is evident that ozone oxidation of the
substrate molecule combined with activated charcoal is more effective compared to
ozonation alone
Figure 318 Comparison of percent conversion of m-xylene and m-xylene in activated charcoal
versus ozonation time
Conversion of m-xylene to oxygenated products when ozonation is carried out in the
presence of activated charcoal is significantly higher at all time intervals This can
probably be due to catalytic effects provided by the carbon surface Higher rates of
reactivity are achieved since the carbon surface has orientated the m-xylene molecules to
allow the active radicals to successfully oxidize them There is also a higher probability
of collisions between m-xylene molecules as they are now present at few angstrom layers
on the carbon surface resulting in higher concentrations instead of being diluted in a
much larger volume
0
5
10
15
20
25
30
2 4 6 8 10 12
Con
vers
ion
()
Ozonation Time (h)
m-xylene
m-xylene in charcoal
83
Figure 319 Comparison of percent yield of 3-MBAlc formed during ozonation of m-xylene and
m-xylene in the presence of activated charcoal
Figure 320 Comparison of percent yield of 3-MBAlde formed during ozonation of m-xylene and
m-xylene in the presence of activated charcoal
0
1
2
3
4
5
6
7
8
9
2 3 4 5 6 7 8 9 10 11 12 13
Ye
ild (
)
Ozonation Time (h)
3-MBAlc (m-xylene)
3-MBAlc (m-xylene + charcoal)
1
2
3
4
5
6
2 3 4 5 6 7 8 9 10 11 12 13
Ye
ild (
)
Ozonation Time (h)
3-MBAlde (m-xylene)
3-MBAlde (m-xylene + charcoal)
84
Figure 321 Comparison of percent yield of 3-MBAcid formed during ozonation of m-xylene and
m-xylene in the presence of activated charcoal
Figure 322 Comparison of percent yield of ldquootherrdquo products formed during ozonation of m-xylene
and m-xylene in the presence of activated charcoal
0
1
2
3
4
5
2 3 4 5 6 7 8 9 10 11 12 13
Ye
ild (
)
Ozonation Time (h)
3-MBAcid (m-xylene)
3-MBAcid (m-xylene + charcoal)
1
2
3
4
5
6
2 3 4 5 6 7 8 9 10 11 12 13
Ye
ild (
)
Ozonation Time (h)
other (m-xylene)
other (m-xylene + charcoal)
85
A comparison of the yield of products formed illustrated in Figures 319 ndash 322 reveals
that the yield of all identified products is higher when ozonation is carried out in the
presence of activated charcoal An observation of Figure 320 shows that the formation of
3-MBAlde remains constant during the 12 h of ozonation It is also evident from Figure
321 that the formation of 3-MBAcid increases sharply during the same period of
ozonation This pattern of product formation suggests that ozonation in the presence of
activated charcoal not only improves the conversion rate of m-xylene but also enhances
the oxidation of the aromatic aldehyde to its corresponding acid
36 Ozonation of 1 m-xylene in the presence of water
In order to study the oxidation of m-xylene in water acetic acid and acetone was used as
a third medium to obtain a miscible reaction mixture Mixtures containing 1 m-xylene
in 100 solvent and 70 30 ratio (solvent water) were ozonated for 10 20 30 40 50
60 and 90 minutes respectively Table 314 and Figure 323 present reaction data for the
conversion of 1 m-xylene in 70 30 ratio (acetic acid water) and 100 acetic acid as
a function of ozone treatment time An observation of the data in Table 314 and Figure
323 shows that percent conversion of m-xylene increases in both cases with ozone
treatment time however it is evident that conversion of the target compound is
significantly higher when ozonation is carried out in the presence of water In the first 30
minutes 963 of m-xylene in water is converted compared to 613 conversion in the
absence of water Ozone in aqueous solution is thought to generate hydroxyl radicals138
which together with the natural oxidizing ability of ozone leads to an improvement of the
conversion rate of m-xylene
86
Table 314 Percent conversion of 1 m-xylene in 100 acetic acid and 70 30 ratio
(acetic acid water) as a function of ozone treatment time
Ozonation time (min)
Conversion
1 m-xylene in 100 acetic acid
1 m-xylene in 70 30 ratio
(acetic acid water)
10 406 476
20 498 755
30 613 963
40 661 974
50 690 998
60 903 1000
90 975 1000
Oxygen flow rate = 200 mL min-1 Ozone concentration = 100 μg mL-1
Figure 323 Comparison of percent conversion of m-xylene in 100 acetic acid and 70 30 ratio
(acetic acid water) versus ozonation time
0
20
40
60
80
100
120
0 20 40 60 80 100
Con
vers
ion
()
Ozonation time (min)
1 m-xylene in 70 30 (acetic acid water) 1 m-xylene in 100 acetic acid
87
When acetone was used as a solvent a similar pattern of m-xylene conversion was
observed Table 315 and Figure 324 presents reaction data for the conversion of 1
m-xylene in 70 30 ratio (acetone water) and 100 acetone and 1 m-xylene in
70 30 ratio (acetone water) and 100 acetone in the presence of activated charcoal as
a function of ozone treatment time
Table 315 Percent conversion of m-xylene in 100 and 70 30 ratio (acetone water) as a function of ozone treatment time
Ozonation time (min)
Conversion
m-xylene in 100 acetone
m-xylene in 70 30 acetone water
m-xylene in 100 acetone + charcoal
m-xylene in 70 30 acetone water +
charcoal 10 312 419 345 494
20 396 611 433 710
30 603 846 623 920
40 752 953 811 1000
50 805 1000 834 1000
60 854 1000 879 1000
90 988 1000 1000 1000
Oxygen flow rate = 200 mL min-1 Ozone concentration = 100 μg mL-1
It is evident from Figure 324 that the presence of water significantly improves the
conversion of m-xylene Furthermore when ozonation is conducted in the presence of
activated charcoal a further improvement in conversion rate is noted Activated carbon in
aqueous solution is able to convert ozone to hydroxyl radicals138 It is therefore suggested
that added activated charcoal increases the amount of hydroxyl radical needed for
m-xylene oxidation resulting in enhancement of conversion rate
88
Figure 324 Comparison of percent conversion of m-xylene in 100 and 70 30 ratio
(acetone water) versus ozonation time
37 Reaction sequence for m-xylene ozonation
A general pathway for the oxidation of m-xylene by ozone is proposed in Scheme 30
This reaction sequence involves all intermediates detected leading to 3-methylbenzoic
acid formic and acetic acids as ultimate generated carboxylic acids The main oxidizing
agents are O3 for ozonation alone and O3organic solvent O3hydroxyl radical and
O3activated carbon for catalyzed ozonations
CH3
CH3
O3
CH3
CH2 OH
O3
CH3
CH
O
O3
CH3
C
O
OH
m-xylene 3-methylbenzyl alcohol 3-methylbenzaldehyde 3-methylbenzoic acid
+ other
Scheme 30 General pathway for the reaction of m-xylene with ozone
0
20
40
60
80
100
120
5 15 25 35 45 55 65 75 85 95
Con
vers
ion
()
Ozonation time (min)
m-xylene in 100 acetone m-xylene in 70 30 acetone water
m-xylene in 100 acetone + charcoal m-xylene in 70 30 acetone water + charcoal
89
The pr ocess is initiated b y th e dire ct attack of the methyl group b y O3 giving
3-methylbenzyl alcohol as a pr imary ox idation product This reaction is faster in the
O3solvent and O3activated carbon system where more amount of ozone can react with
the initial reactant
Stary et al139 studied the reactions of ozone with organic substrates as possible sources of
singlet ox ygen In a nu mber of c ases they provided evidence that sin glet ox ygen is
produced in the ozonation reaction which was found to be a good source for chemical
oxidation reactions The ozonation of 3-methylbenzaldehyde is thought to proceed in this
way b y fir st forming th e 3 -methylbenzaldehyde hydrotrioxide mol ecule a nd thereafter
producing 3 -methylbenzoic acid and sing let ox ygen Th e pr oposed mechanism for thi s
reaction is shown in Scheme 31
CH3
C
O
O
O
O
H
CH3
C
O
O
O
O
H
CH3
C
O
O
H
+ O2
3-methylbenzaldehyde 3-methylbenzoic acid
H
O
1
singlet oxygen
Scheme 31 Proposed mechanism for 3-methylbenzaldehyde ozonation
The pr ocess is initiated by th e dire ct attack of the methyl group b y O3 giving
3-methylbenzyl alcohol as a pr imary ox idation product This reaction is faster in the
O3solvent and O3activated carbon system where more amount of ozone can react with
the initial reactant
Bailey et al143 proposed that aromatic compounds can react with ozone via three distinct
mechanisms (i) 13 -dipolar cycloaddition or o zonolysis a t the bond or bonds with
greatest double bond character (ii) electrophilic attack on the most polar bonds or atoms
with the lowest localization energy and (iii) thr ough a conjugated addition when there
90
is a highly reactive diene They studied the oxidation of aromatic compounds and
concluded that when the stoichiometry is one the main mechanism is 13-dipolar
cycloaddition at the double bond o highest electron density Beltraacuten et al152 corroborated
these results after analyzing the ozonation of polycyclic aromatic hydrocarbons They
found that the oxidation of phenanthrene which only occurred by 13-dipolar
cycloaddition had a stoichiometric factor of one mole ozone consumed per one mole
hydrocarbon consumed Pryor et al153 observed that the ozonation of alkenes with
electron- withdrawing substituentrsquos takes place mainly via 13-dipolar cycloaddition
Moreover olefins in which the double bond is connected to electron-donating groups
react many times faster than those in which it is connected to electron-withdrawing
groups
CH3
CH3
O3
CH3
CH3
O
OO
OO
CH3
CH3
O O
O
CH3
CH3
H2O+ + other products
Scheme 32 13 Dipolar cycloaddition of m-xylene
In the light of the above observations and the experimental results obtained it can be
proposed that the ozone attack on the aromatic ring of m-xylene proceeds mostly by
13-dipolar cycloaddition to the carbon ndash carbon double bond of the highest electron
density According to Criegee111 and Bailey143 the first step is a 13-dipolar addition of
ozone to the substrate to give the ldquoinitialrdquo or ldquoprimaryrdquo ozonide This ozonide may then
undergo various reactions to give the corresponding carbonyl products which could then
be degraded by further oxidation
91
40 Introduction The efficiency of ozone initiated oxidation of 2-chloroethanol was investigated at various
experimental conditions as a function of time Ozonation experiments were conducted
under solvent free conditions in the presence of solvents acetic acid and ethyl acetate
and in the presence of charcoal Since 2-chloroethanol is highly soluble in water
experiments were also conducted to study its conversion and product formation in the
presence of water at different pH values and in the presence of hydrogen peroxide
The kinetics of the reaction of organic compounds with ozone has been measured for
several hundred compounds The second order rate constant for the reaction of olefins
with ozone (ethane k = 18 x 105 M-1s-1) decreases by a factor of ge 10 for each additional
chlorine substituent Chloroethene reacts very quickly with ozone with a half-life of 25 s
for an ozone concentration of 1 mg L-1 Dichloroethenes still have a relatively high
reactivity with ozone The reactivity of tri- and tetrachloroethene with ozone is
substantially lower and especially in the case of tetrachloroethene the oxidation is
governed by OH∙ radicals147 Limited data is available for the oxidation of
2-chloroethanol Most studies involved the use of biodegrading agents21 and
photochemical methods125
41 Product identification for ozonation of 2-chloroethanol Chromatograms of 2-chloroethanol before ozonation shown in Figure A40 and
2-chloroethanol after 12 hours of ozonation shown in Figure A41 provides sufficient
evidence that the substrate was oxidized to a mixture of major and minor products The
isolated products formed during the ozonation were characterized and quantified by GC
analysis The peak at 857 minutes refer to the elution of unreacted 2-chloroethanol
Peaks at 7776 and 11272 minutes refer to the elution of the positively identified
products acetaldehyde (AcAlde) and acetic acid (AA) respectively
92
411 Chloride and Conductivity analysis of product mixture Analysis of the ozonated solutions for ldquofreerdquo chloride ions released by the oxidation of
2-chloroethanol was performed by ion chromatography and an ion analyzer fitted with a
chloride ion selective electrode In all cases the parts per million of chloride ions were
found to increase with an increase in ozone treatment time The chloride ions formed
during the ozonation process at different conditions showed no evidence of further
oxidation to chlorine gas Direct conductivity measurements made to the ozonated
samples showed that solution conductivity increased with increase in chloride ion
concentration This therefore suggests that the ldquofreerdquo chloride ions are the only
contributing factor for the increase in solution conductivity The trends in ppm chloride
ions and solution conductivity during ozonation are discussed later in this chapter
412 Analysis of the product mixture by 1H NMR The 1H NMR spectrum of acetaldehyde is presented in Figure A42 Two types of
hydrogens are found in aldehydes the aldehyde hydrogen and the α-hydrogens (those
hydrogens attached to the same carbon as the aldehyde group) The chemical shift of the
proton in the aldehyde group (-CHO) is found in the range 9 ndash 10 ppm Protons appearing
in this region are very indicative of an aldehyde group since no other protons appear in
this region The CH3 group adjacent to the carbonyl group appears in the range of
45 ndash 50 ppm which is typical of protons on the α-carbon
413 Analysis of the product mixture by GC-MS The mass spectrum obtained for the isolated carboxylic acid (acetic acid) is shown in
Figure A43 A very weak molecular ion peak characteristic of a short-chain acid
appears at mz = 60 The loss of OH and COOH through α-cleavage occurs on either side
of the C=O Loss of OH gives rise to a strong peak at mz = 43 Loss of COOH gives rise
to weak peak at mz = 15
93
414 Analysis of the product mixture by FTIR Infra-red spectra obtained for 2-chloroethanol before ozonation and 2-chloroethanol after
ozonation were also compared The spectrum of 2-chloroethanol (Figure A44) shows a
strong broad band due to O ndash H stretching at 3333 cm-1 characteristic of the hydrogen-
bonded alcohol Another strong broad band due to C ndash O stretching appears around the
1050 cm-1 region characteristic of a primary alcohol Two strong bands in the 800 ndash
600 cm-1 region arise from the stretching vibration of the C ndash Cl bond in 2-chloroethanol
The IR spectrum of ozonated 2-chloroethanol (Figure A45) showed the peaks and bands
at their usual positions for 2-chloroethanol but a prominent strong absorption peak is
observed at 1723 cm-1 which is characteristic of the carbonyl functional group This
stretching indicates the presence of aldehydes andor carboxylic acid compounds
42 Oxidation of 2-chloroethanol under solvent free conditions The ozone initiated oxidation of 2-chloroethanol was investigated for 3 6 9 12 18 and
24 h respectively Twenty milliliters of 2-chloroethanol was pipetted into the reaction
vessel and a constant flow of 200 mL min-1 oxygen producing 100 g mL-1 ozone was
bubbled into each vessel for 3 6 9 12 18 and 24 h respectively at a reaction
temperature of 25 oC Results for these experiments showing percent conversion of
substrate and percent selectivity towards products at various time intervals are listed in
Table 40 An observation of the data shows that percent conversion of 2-chloroethanol
increases as a function of ozonation time Percentage conversion of the substrate
increases from 10 for 3 hours ozonation to 520 for 24 h ozonation The conversion
of 2-chloroethanol increased steadily from 3 h to 6 h with low conversion in the first
9 h and thereafter a fairly rapid increase in conversion up to 24 h This pattern of
2-chloroethanol conversion is similar to the conversion of m-xylene ozonation which was
discussed extensively in chapter 3 suggesting that the reaction between 2-chloroethanol
and ozone is mass transfer controlled as reported by Bollyky112
94
In Figure 40 2-chloroethanol conversion and the selectivity data for the formation of
AcAlde and AA and the unknown products are plotted as a function of ozonation time at
a constant ozone dose of 100 g mL-1
Table 40 Percent conversion of 2-chloroethanol and product selectivity data for the ozone
initiated oxidation of 20 mL 2-chloroethanol as a function of time
Oxygen flow rate = 200 mL min-1 Ozone concentration = 100 μg mL-1 AcAlde = acetaldehyde AA = acetic acid
Figure 40 Percent conversion of 2-chloroethanol and product selectivity versus ozonation time
The results show a steady decrease in selectivity towards both AcAlde and AA and an
increase in selectivity towards the unknown products during the 3 h to 6 h time interval
0
10
20
30
40
50
60
70
0 3 6 9 12 15 18 21 24
Con
vers
ion
and
Sel
ectiv
ity (
)
Ozonation time (h)
conversion - 2-CE S - AcAlde S - AA S - unknown
Ozonation Time (h)
Conversion ()
Selectivity ()
AcAlde AA Unknown
3 10 402 598 00
6 25 352 488 160
9 99 375 484 141
12 219 372 489 139
18 413 391 485 124
24 520 384 500 116
95
thereafter remaining constant up to 24 h of ozonation This is due to the oxidation of
AcAlde to AA implying the existence of successive reactions for these products at longer
ozonation times G Pace et al125 studied the oxidation of acetaldehyde in the presence of
H2O2 using UV irradiation They found that 50 of the acetaldehyde was easily oxidized
to acetic acid in 60 minutes Since ozone is a strong oxidizing agent a similar process
may have occurred here
Table 41 Solution conductivity chloride ion content and product yields for the ozonation of
2-chloroethanol as a function of time
Oxygen flow rate = 200 mL min-1 Ozone concentration = 100 g mL-1
Figure 41 Chloride ion content and solution conductivity of ozonated 2-chloroethanol versus time
0
2000
4000
6000
8000
10000
0
200
400
600
800
1000
1200
2 4 6 8 10 12 14 16 18 20 22 24
Con
duct
ivity
(μS
cm
-1)
Chl
orid
es (p
pm)
Ozonation time (h)
Chlorides Conductivity
Ozonation Time (h)
Conductivity
( S cm-1)
Chlorides
(ppm)
Yield ()
AcAlde AA Unknown
3 318 86 04 06 00
6 2030 209 09 12 04
9 3930 445 37 48 14
12 5061 585 81 107 31
18 7017 806 161 200 52
24 8938 1014 200 260 60
96
Figure 41 and Table 41 shows the relationship between chloride ion content and
conductivity of the reaction mixture after 3 6 9 12 18 and 24 h respectively It can be
seen that the ozonation of 2-chloroethanol yield quantitative amounts of chloride ion as
one of the major products and there is a steady increase of Cl- with an increase in
ozonation time This pattern of chloride formation indicates that dechlorination is a major
reaction mechanism occurring during ozonation of 2-chloroethanol The concentration of
chloride ions released during the reaction of 2-chloroethanol with ozone was found to
range from 86 ppm after 3 h to 1014 ppm after 24 h This behavior is consistent with
studies conducted by other researchers N Graham et al126 showed that the degradation of
246-trichlorophenol with ozone resulted in the release of large amounts of chloride ions
and the number of chloride ions increased with the extent of 246-trichlorophenol
degraded G Pace et al125 reported on the oxidation of 2-chloroethanol by H2O2 under
UV irradiation Their results showed that the oxidation of 2-chloroethanol generated
significant amounts of Cl- ions and their yields increased as a function of substrate
degradation It is also evident from the results of the conductivity measurements that
there is a steady increase in conductivity of the reaction solution as the ozonation time is
increased This is most likely due to the presence of the chloride ion formed during the
ozonation process since it is the only conducting species that can contribute significantly
to the specific conductivity of the reaction mixture We would expect the conductivity of
the partially dissociated weak organic acids to be negligible
Figure 42 Percentage yield of AcAlde AA and unknown product versus ozonation time
0
5
10
15
20
25
30
3 6 9 12 18 24
Yeild
()
Ozonation time (h)
AcAlde AA unknown
97
The percentage yield of major products namely acetaldehyde (AcAlde) and acetic acid
(AA) and minor unknown products formed during the ozone initiated oxidation of
2-chloroethanol are presented in Figure 42 It is clear that yields for all products
increase as ozonation time increase At all time intervals the percentage yield of AA was
significantly higher than AcAlde suggesting that ozone has readily oxidized the
acetaldehyde to its corresponding organic acid
43 Ozone initiated oxidation of 2-chloroethanol in the presence of
organic solvents The effects of chemical characteristics of organic solvents such as acetic acid and ethyl
acetate on the decomposition of m-xylene by ozonation were extensively studied in
chapter 3 The results showed that the presence of organic solvents that do not react with
ozone like acetic acid or ethyl acetate significantly improved the rate of conversion of
m-xylene to value added products during ozonation This is consistent with many
researchers who reported that the presence of organic solvents like acetic acid ethyl
acetate and many others considerably improves the solubility of ozone in the reaction
mixture thereby increasing mass transfer effects and influencing the extent of organic
substrate conversion Since there has been no reported study on the ozonation of
2-chloroethanol in the presence of acetic acid or ethyl acetate it is not known whether or
not it will have any influence on the ozonation process Therefore a study has been
conducted to ascertain the reaction characteristics of the ozone initiated oxidation of
2-chloroethanol in the presence of acetic acid or ethyl acetate
431 Effect of acetic acid on ozonation of 2-chloroethanol The influence of acetic acid on the ozonation of 2-chloroethanol was investigated One
hundred milligrams per litre ozone was steadily bubbled through a 20 mL mixture of
2-chloroethanol and 5 acetic acid for 3 6 9 and 12 h under similar experimental
conditions as for the ozonation of 2-chloroethanol in the absence of solvent
98
Chromatographic analysis of the product mixture showed the same pattern of product
formation as for the oxidation of pure 2-chloroethanol with AcAlde and AA being the
major product No new products peaks were observed during the ozonation of
2-chloroethanol in the presence of 5 acetic acid
Data for these experiments showing conversion of substrate and selectivity for major
products AcAlde and AA and minor unknown products at different ozonation times are
illustrated in Table 42 and Figure 43
Table 42 Percent conversion and product selectivity data for the ozone initiated oxidation of
2-chloroethanol in 5 acetic acid as a function of time
Oxygen flow rate = 200 mL min-1 Ozone concentration = 100 g mL-1
Figure 43 Percent conversion of 2-chloroethanol in the presence of 5 acetic acid and selectivity
profile of products versus ozonation time
0
10
20
30
40
50
60
70
2 3 4 5 6 7 8 9 10 11 12 13
Con
vers
ion
and
Sel
ectiv
ity (
)
Ozonation time (h)
conversion - 2-CE S - AcAlde S - AA S - unknown
Ozonation Time (h)
Conversion ()
Selectivity ()
AcAlde AA Unknown
3 78 404 574 22
6 106 392 506 103
9 134 404 474 122
12 262 409 483 108
99
Results presented in Table 42 show that the percent conversion of 2-chloroethanol
increases gradually from 78 after 3 h ozonation to 134 after 9 h ozonation and
thereafter increasing rapidly to 262 after 12 h ozonation This pattern of substrate
conversion suggests that oxidation rates increase significantly when substrate molecules
are exposed to ozone gas for longer periods The selectivity profiles for the ozonation of 2-chloroethanol in the presence of 5 acetic
acid showed similar trends when compared to the ozonation of 2-chloroethanol in the
absence of solvent Selectivity towards AcAlde did not change significantly from 404
after 3 h ozonation to 409 after 12 h while selectivity towards AA decreased
gradually from 574 after 3 h to 483 after 12 h ozonation
Table 43 Solution conductivity chloride content and product yields for the ozonation of
2-chloroethanol in 5 acetic acid as a function of time
Ozonation Time (h)
Conductivity
( S cm-1)
Chlorides
(ppm)
Yield ()
AcAlde AA Unknown
3 332 92 31 45 02
6 2194 226 41 53 11
9 4068 461 54 63 17
12 5279 610 107 126 28
Table 43 shows the relationship between increasing chloride ion content and increasing
conductivity of the reaction mixture after 3 6 9 and 12 h respectively It is evident that
the ozonation of 2-chloroethanol in the presence of 5 acetic acid yields quantitative
amounts of chloride ion as one of the major products and there is a steady increase of Cl-
with an increase in ozonation time The ppm chlorides obtained in the presence of acetic
acid were slightly higher than in the absence of acetic acid The difference in the chloride
concentration ranged from 6 ppm after 3 h ozonation to 25 ppm after 12 h It is also
evident from the results of the conductivity measurements that there is a steady increase
in conductivity of the reaction solution as the ozonation time is increased The specific
conductivity of the ozonated mixture in the presence of acetic acid was slightly higher
100
than to the ozonated mixture in the absence of acetic acid The difference in specific
conductivity ranged from 14 S cm-1 after 3 h ozonation to 218 S cm-1 after 12 h
The percentage yields of major products namely acetaldehyde (AcAlde) and acetic acid
(AA) and minor unknown products are shown in Table 43 It is clear that product
formation increases as ozonation time increases At all time intervals the percentage yield
of AA was significantly higher than AcAlde indicating that the aldehyde is readily
oxidized to its corresponding organic acid The yields of the major products AcAlde and
AA obtained in the presence of acetic acid were slightly higher than in the absence of the
organic solvent The difference in the yields for AcAlde and AA after 3 h ozonation
ranged from 27 and 39 respectively and after 12 h continuous ozonation ranged
from 26 to 19 respectively
The effect of a higher concentration of acetic acid on the ozonation of 2-chloroethanol
was investigated One hundred milligrams per litre ozone was steadily bubbled through
20 mL aliquot mixtures of 2-chloroethanol and 20 acetic acid for 3 6 9 and 12 h under
similar experimental conditions as for the ozonation of 2-chloroethanol in the absence of
solvent Analyzed data for these experiments showing conversion of substrate and
selectivity towards major products AcAlde and AA and minor unknown products at
different ozonation times are illustrated in Table 44 and Figure 44
Table 44 Percent conversion and product selectivity data for the ozone initiated oxidation of
2-chloroethanol in 20 acetic acid as a function of time
Ozonation Time (h)
Conversion ()
Selectivity ()
AcAlde AA Unknown
3 173 421 533 46
6 281 407 525 68
9 481 383 503 114
12 569 398 466 136
Oxygen flow rate = 200 mL min-1 Ozone concentration = 100 g mL-1
101
Figure 44 Percent conversion of 2-chloroethanol in the presence of 20 acetic acid and
selectivity profile of products versus ozonation time
Results in Table 44 and Figure 44 show that the percent conversion of 2-chloroethanol
increases from 173 after 3 h ozonation to 569 after 12 h ozonation Most evident is
that the percentage of conversion of 2-chloroethanol improved significantly when
ozonation is carried out in the presence of 20 acetic acid The selectivity profiles for
the ozonation of 2-chloroethanol in the presence of 20 acetic acid showed similar
trends when compared to the ozonation of 2-chloroethanol in 5 acetic acid Selectivity
towards AcAlde did not change significantly from 421 after 3 h ozonation to 398
after 12 h while selectivity towards AA decreased gradually from 533 after 3 h to
466 after 12 h ozonation
Table 45 shows the relationship between increasing chloride ion content and increasing
conductivity of the reaction mixture after 3 6 9 and 12 h respectively It is evident that
the ozonation of 2-chloroethanol in the presence of 20 acetic acid yields quantitative
amounts of chloride ion as one of the major products and there is a steady increase of Cl-
ions with an increase in ozonation time The ppm chlorides obtained in the presence of
acetic acid were slightly higher than in the presence of 5 acetic acid The difference in
the chloride concentration ranged from 8 ppm after 3 h ozonation to 180 ppm after 12 h
0
10
20
30
40
50
60
2 3 4 5 6 7 8 9 10 11 12 13
Con
vers
ion
and
Sel
ectiv
ity (
)
Ozonation time (h)
conversion - 2-CE S - AcAlde S - AA S - unknown
102
Table 45 Solution conductivity chloride ion content and product yields for the ozonation of
2-chloroethanol in 20 acetic acid as a function of time
Ozonation Time (h)
Conductivity
( S cm-1)
Chlorides
(ppm)
Yield ()
AcAlde AA Unknown
3 370 100 73 92 08
6 2550 262 114 148 18
9 5431 615 184 242 55
12 6832 790 227 265 77
Oxygen flow rate = 200 mL min-1 Ozone concentration = 100 g mL-1
It is also evident from the results of the conductivity measurements that there is a steady
increase in conductivity of the reaction solution as the ozonation time is increased The
specific conductivity of the ozonated mixture in the presence of 20 acetic acid was
slightly higher when compared to the ozonated mixture in 5 acetic acid
The percentage yields of major products namely acetaldehyde (AcAlde) and acetic acid
(AA) and minor unknown products are shown in Table 45 It is clear that product
formation increases as ozonation time increases At all time intervals the percentage yield
of AA was significantly higher than AcAlde indicating that the aldehyde is readily
oxidized to its corresponding organic acid The yields of the major products AcAlde and
AA obtained in the presence of 20 acetic acid were slightly higher than that obtained in
5 acetic acid suggesting that a higher concentration of solvent favors the ozone
initiated oxidation of 2-chloroethanol
103
432 Comparison of data for ozonation of 2-chloroethanol in the
presence of acetic acid The data obtained for the ozonation of 2-chloroethanol at different reaction conditions
were consolidated and compared Results for the conversion of 2-chloroethanol with and
without the presence of 5 and 20 acetic acid mixtures are presented in Figure 45
Figure 45 Comparison of 2-chloroethanol conversion with and without the presence of acetic
acid versus ozonation time
It is evident from the conversion profiles that the percentage conversion of
2-chloroethanol is improved when ozone reactions are carried out in the presence of
acetic acid Furthermore it is observed that an increase in the concentration of the added
solvent significantly increases the conversion rate of the substrate molecule In previous
studies various organic compounds were decomposed by ozonation in several organic
solvents showed similar behavior Shigimitu133 found that certain organic solvents have a
higher capacity of ozone solubilization than water Nakano et al120 showed that the
solubility of ozone in pure acetic acid to be 87 times higher than in distilled water Henry
et al135 reported that the ozonation rate for trans-stilbene increased with the increase in
solvent polarity whereas Gomes et al134 found that the reaction rates of stilbene with
allyl chloride were independent of the solvent polarity
0
10
20
30
40
50
60
2 3 4 5 6 7 8 9 10 11 12 13
Con
vers
ion
()
Ozonation time (h)
2-CE
2-CE in 5 AA
2-CE in 20 AA
104
Selectivity Profiles of major products AcAlde and AA illustrated in Figure 46 shows that
selectivity for AA is the highest in reactions with and without the presence of acetic acid
while AcAlde shows the lowest selectivity This pattern of product formation indicates
that the AcAlde formed is rapidly oxidized to its corresponding acid AA Furthermore it
is observed that the oxidation of products increase with an increase in solvent
concentration suggesting a fast reaction in the presence of acetic acid Selectivity towards
AcAlde from 6 h to 9 h ozonation of 2-chloroethanol in 20 acetic acid showed a rapid
decrease indicating improved conversion of AcAlde to AA It can therefore be suggested
that the presence of 20 acetic acid has the greatest influence on the ozonation process
Figure 46 Comparison of selectivity for AcAlde and AA formed during the ozonation of
2-chloroethanol with and without the presence of acetic acid versus time
A comparison of the percentage yields of major products namely acetaldehyde (AcAlde)
and acetic acid (AA) formed during the ozone initiated oxidation of 2-choroethanol and
2-chloroethanol in the presence of 5 and 20 acetic acid as a function of ozonation
time is shown in Figure 47
35
40
45
50
55
60
2 3 4 5 6 7 8 9 10 11 12 13
Sele
ctiv
ity (
)
Ozonation Time (h)
AcAlde (2-CE) AcAlde (2-CE in 5 AA) AcAlde (2-CE in 20 AA)AA (2-CE) AA (2-CE in 5 AA) AA (2-CE in 20 AA)
105
Figure 47 Comparison of yield of AcAlde and AA formed during the ozonation of 2-chloroethanol
with and without the presence of acetic acid versus time
An observation of the profile shows an increase in product yield as ozonation time
increases The yield of AA was significantly higher than the yield of AcAlde implying
that the aldehyde is readily oxidized to its corresponding organic acid Higher product
yields were obtained when the substrate was ozonated in the presence of 20 acetic acid
and a significant increase in the yield of both AcAlde and AA is observed This pattern of
product formation suggests that the presence of the added solvent acetic acid has a
significant influence on the ozonation process and increasing the solvent strength further
enhances the oxidation process
The chloride ion formation during the ozonation of 2-chloroethanol with and without the
presence of acetic acid is shown in Figure 48 The pattern of chloride formation in
acetic acid is similar to that in water but the ppm Cl- in the presence of acetic acid was
higher than that in water increasing significantly in the presence of 20 acetic acid As
expected the presence of 20 solvent significantly improved the ozonation process
resulting in an increase in the C-Cl bond cleavage to thus give the highest concentration
of chloride ions in the reaction mixture
0
5
10
15
20
25
30
2 3 4 5 6 7 8 9 10 11 12 13
Yiel
d (
)
Ozonation Time (h)
AcAlde (2-CE) AcAlde (2-CE in 5 AA) AcAlde (2-CE in 20 AA)
AA (2-CE) AA (2-CE in 5 AA) AA (2-CE in 20 AA)
106
Figure 48 Comparison of chloride ion formed during the ozonation of 2-chloroethanol with and
without the presence of acetic acid versus time
433 Effect of ethyl acetate on ozonation of 2-chloroethanol The influence of ethyl acetate on the ozonation of 2-chloroethanol was investigated Four
20 ml aliquots of 5 ethyl acetate in 2-chloroethanol was ozonated for 3 6 9 and 12 h
respectively using the same experimental conditions for ozonation described in chapter 2
Gas chromatographic analysis of the product mixture was performed after each time
interval Peaks for AcAlde and AA appeared at their respective retention times and
besides an additional peak for ethyl acetate no other new product peak was observed
The interpreted results for these experiments showing percent conversion of substrate and
percent selectivity towards major products after 3 6 9 and 12 h of ozonation are
illustrated in Table 46 and Figure 49
It is evident from that the percentage conversion of 2-chloroethanol in the presence of
5 ethyl acetate increases as the ozonation time increases The results show that the
percent conversion of 2-chloroethanol increases from 73 after 3 h ozonation to 441
0
100
200
300
400
500
600
700
800
900
1000
2 3 4 5 6 7 8 9 10 11 12 13
Chl
orid
es (p
pm)
Ozonation time (h)
2-CE
2-CE in 5 AA
2-CE in 20 AA
107
after 12 h ozonation As reported previously the oxidation characteristics of ozone
increase with an increase in ozone contact time with the substrate molecule
Table 46 Percent conversion and product selectivity data for the ozone initiated oxidation of
2-chloroethanol in 5 ethyl acetate as a function of time
Ozonation Time (h)
Conversion ()
Selectivity ()
AcAlde AA Unknown
3 73 421 517 62
6 188 405 498 97
9 273 393 474 133
12 441 389 471 140
Oxygen flow rate = 200 mL min-1 Ozone concentration = 100 g mL-1
Figure 49 Percent conversion of 2-chloroethanol in the presence of 5 ethyl acetate and
selectivity profile for products as a function of ozonation time
The selectivity profiles for the ozonation of 2-chloroethanol in the presence of 5 ethyl
acetate showed similar trends when compared to the ozonation of 2-chloroethanol in the
absence of solvent AA showed the highest selectivity again indicating that AcAlde is
0
10
20
30
40
50
60
2 3 4 5 6 7 8 9 10 11 12 13
Con
vers
ion
and
Sele
ctiv
ity (
)
Ozonation time (h)
conversion - 2-CE S - AcAlde S - AA S - unknown
108
easily oxidized to its corresponding acid Selectivity towards both AcAlde and AA
decreased gradually while selectivity towards the unknown products increased slowly
with an increase in ozonation time This could probably be due to partial mineralization
of products and formation of carbon oxides
Table 47 Solution conductivity chloride ion content and product yields for the ozonation of
2-chloroethanol in 5 ethyl acetate as a function of time
Ozonation Time (h)
Conductivity
( S cm-1)
Chlorides
(ppm)
Yield ()
AcAlde AA Unknown
3 340 93 31 38 04
6 2361 243 76 94 18
9 4614 522 107 130 36
12 6184 715 172 208 62
The percentage yields of major products namely acetaldehyde (AcAlde) and acetic acid
(AA) and minor unknown compounds as a function of ozonation time are shown in Table
47 It is clear that product formation increases as ozonation time increases At all time
intervals the percentage yield of AA was significantly higher than AcAlde indicating that
the aldehyde is readily oxidized to its corresponding organic acid The yields of the major
products AcAlde and AA obtained in the presence of ethyl acetate were slightly higher
when compared to its yields in the absence of the organic solvent indicating that the
presence of the 5 dipolar aprotic solvent ethyl acetate in the reaction mixture definitely
influences the ozonation process
The effect of a higher concentration of ethyl acetate on the ozonation of 2-chloroethanol
was investigated One hundred milligrams per litre ozone was steadily bubbled through
20 mL aliquot mixtures of 20 ethyl acetate in 2-chloroethanol for 3 6 9 and 12 h
respectively under similar experimental conditions as for the ozonation of
pure 2-chloroethanol Chromatographic analysis of the product mixtures showed no new
product peaks Analyzed results from the chromatograms are illustrated in Table 48 and
Figure 410
109
Table 48 Percent conversion and selectivity data for the ozone initiated oxidation of
2-chloroethanol in 20 ethyl acetate as a function of time
Ozonation Time (h)
Conversion ()
Selectivity ()
AcAlde AA Unknown
3 129 316 649 35
6 254 344 604 52
9 341 346 587 67
12 473 353 574 73
Oxygen flow rate = 200 mL min-1 Ozone concentration = 100 g mL-1
It is evident from Table 48 that the percentage conversion of 2-chloroethanol in the
presence of 20 ethyl acetate increases as the ozonation time increases The conversion
after 3 h ozonation was 129 increasing sharply to 473 after 12 h of ozonation again
suggesting an increase in conversion rate with increase ozone gas contact time with the
substrate molecule
Figure 410 Percent conversion of 2-chloroethanol in the presence of 20 ethyl acetate and
selectivity profile of products as a function of ozonation time
0
10
20
30
40
50
60
70
2 3 4 5 6 7 8 9 10 11 12 13
Con
vers
ion
and
Sele
ctiv
ity (
)
Ozonation time (h)
conversion - 2-CE S - AcAlde S - AA S - unknown
110
The selectivity profiles illustrated in Figure 410 for the ozonation of 2-chloroethanol in
the presence of 20 ethyl acetate showed similar trends when compared to the ozonation
of 2-chloroethanol in the absence of solvent and in 5 solvent Selectivity for AA as
expected remained high Selectivity for both AcAlde and AA decreased gradually while
selectivity towards the unknown products increased slightly with an increase in ozonation
time This may have been due to partial mineralization of products and formation of
carbon oxides
Table 49 Solution conductivity chloride ion content and product yields for the ozonation of
2-chloroethanol 20 ethyl acetate as a function of time
Ozonation Time (h)
Conductivity
( S cm-1)
Chlorides
(ppm)
Yield ()
AcAlde AA Unknown
3 356 96 41 84 05
6 2495 257 87 153 13
9 4881 553 118 200 23
12 6346 734 167 272 34
Oxygen flow rate = 200 mL min-1 Ozone concentration = 100 g mL-1
The percentage yields of major products namely acetaldehyde (AcAlde) and acetic acid
(AA) and minor unknown compounds as a function of ozonation time are illustrated in
Table 49 It is clear that product yield increases as ozonation time increases At all time
intervals the percentage yield of AA was significantly higher than AcAlde indicating that
the aldehyde is readily oxidized to its corresponding organic acid The yields of the major
products AcAlde and AA obtained in the presence of 20 ethyl acetate were higher
when compared to its yields obtained in the presence of 5 ethyl acetate indicating that
the presence of the participating solvent with a higher strength has a significant influence
on the ozonation process
111
434 Comparison of data for ozonation of 2-chloroethanol in the
presence of ethyl acetate
Figure 411 Comparison of 2-chloroethanol conversion with and without the presence ethyl
acetate versus ozonation time
Figure 411 compares conversion data of 2-chloroethanol in the presence of 5 and
20 ethyl acetate respectively Most evident is that the percent conversion of
2-chloroethanol is marginally higher when ozonation is carried out in the presence of 5
ethyl acetate It is clearly evident that 2-chloroethanol in the presence of 20 ethyl
acetate gave the highest percentage conversion of substrate It is further observed that for
the first 3 h of ozone treatment the substrate molecule in the presence of solvent shows a
sharp increase in conversion rate whereas in the absence of solvent the conversion rate is
much slower This trend suggests that the presence of ethyl acetate has a significant
influence on the ozonation of 2-chloroethanol to oxygenated products Selectivity profiles
of major products AcAlde and AA are illustrated in Figure 412 The selectivity for AA is
the highest in reactions carried out with and without the presence of acetic acid while
AcAlde shows the lowest selectivity This pattern of product formation indicates that the
AcAlde formed is rapidly oxidized to its corresponding acid AA
0
10
20
30
40
50
2 3 4 5 6 7 8 9 10 11 12 13
Con
vers
ion
()
Ozonation time (h)
2-CE
2-CE in 5 EA
2-CE in 20 EA
112
Figure 412 Comparison of selectivity for AcAlde and AA formed during the ozonation of
2-chloroethanol with and without the presence of ethyl acetate versus time
An interesting observation is that the selectivity for AcAlde in reaction mixtures
containing 20 ethyl acetate showed the lowest result indicating that the conversion of
AcAlde to AA is faster in the presence of 20 ethyl acetate Furthermore it is observed
that the oxidation of products increase with an increase in solvent concentration
suggesting a fast reaction in the presence of increased solvent strength Selectivity for
AcAlde from 6 h to 9 h ozonation of 2-chloroethanol in 5 ethyl acetate showed a rapid
decrease indicating improved conversion of AcAlde to AA In view of these trends it can
therefore be suggested that the presence of 20 acetic acid has the most influence on the
ozonation process
A profile of the percentage yield of major products namely acetaldehyde (AcAlde) and
acetic acid (AA) formed during the ozone initiated oxidation of 2-choroethanol and
2-chloroethanol in the presence of 5 and 20 ethyl acetate as a function of ozone
treatment time is shown in Figure 413
30
35
40
45
50
55
60
65
2 3 4 5 6 7 8 9 10 11 12 13
Sele
ctiv
ity (
)
Ozonation Time (h)
AcAlde (2-CE) AcAlde (2-CE in 5 EA) AcAlde (2-CE in 20 EA)
AA (2-CE) AA (2-CE in 5 EA) AA (2-CE in 20 EA)
113
Figure 413 Comparison of yield of AcAlde and AA formed during the ozonation of
2-chloroethanol with and without the presence of ethyl acetate versus time
It is clear that product yield increase as ozonation time increases In all cases the
percentage yield of AA was found to be significantly higher than the yield of AcAlde
indicating that the aldehyde is readily oxidized to its corresponding organic acid Higher
product yields were obtained when the substrate was ozonated in the presence of 20
ethyl acetate and a significant increase in the yield of AA is observed This pattern of
product formation suggests that the presence of ethyl acetate has a significant influence
on the ozonation process and increasing the solvent strength further enhances the
oxidation process
The ppm chloride ions formed during the ozonation of 2-chloroethanol and
2-chloroethanol in the presence of 5 and 20 ethyl acetate is shown in Figure 414
The chloride content in the reaction mixture increases with an increase in ozone treatment
time The rate of chloride ion formation improved when ozone reactions were conducted
in the presence of ethyl acetate The pattern of Cl- ion formation is similar to that in water
but its concentrations were marginally higher than that in water Increasing the strength
of the solvent from 5 to 20 resulted in a slight improvement in C-Cl bond cleavage
0
5
10
15
20
25
30
2 3 4 5 6 7 8 9 10 11 12 13
Yiel
d (
)
Ozonation Time (h)
AcAlde (2-CE) AcAlde (2-CE in 5 EA) AcAlde (2-CE in 20 EA)
AA (2-CE) AA (2-CE in 5 EA) AA (2-CE in 20 EA)
114
Figure 414 Comparison of chloride ion formed during the ozonation of 2-chloroethanol with and
without the presence of ethyl acetate versus time
44 Effect of activated charcoal on ozonation of 2-chloroethanol The use of activated charcoal adsorption and ozonation has been identified as a suitable
treatment of many contaminants by several researchers These reports imply that the
decomposition of ozone is initiated by the adsorption on the surface of the activated
carbon and the surface characteristics of carbon significantly influence the
decomposition of ozone Activated charcoal presents a large surface area where ozone
and the contaminant could adsorb and react McKay et al156 Kainulainen et al157
Cannon et al158 Croll159 found ozone to readily destroy adsorbed aromatic molecules
which assisted in the regeneration of the activated carbon surface resulting in improved
adsorption capacity Zaror46 also reported that the activated surface groups may be
responsible for catalytic effects found in ozonation in presence of activated charcoal
In the present study the ozone initiated oxidation of 2-chloroethanol in the presence of
activated charcoal was investigated The aim is to analyze the influence of activated
charcoal on 2-chloroethanol conversion and product characterization and yields Four
20 mL aliquots of 2-chloroethanol and 1 g of activated charcoal were placed in the
reaction vessel A constant flow of 200 mL min-1 medical grade oxygen producing
0
100
200
300
400
500
600
700
800
900
2 3 4 5 6 7 8 9 10 11 12 13
Chl
orid
es (p
pm)
Ozonation time (h)
2-CE
2-CE in 5 EA
2-CE in 20 EA
115
100 g mL-1 ozone was introduced to each mixture for 3 6 9 and 12 hours respectively
Percent conversion of substrate selectivity and yields of major products formed during
the ozone reaction were monitored by gas chromatography after each time interval Data
for these experiments are shown in Table 410 and Figure 415
Table 410 Percent conversion and product selectivity for the ozone initiated oxidation of
2-chloroethanol in the presence of 1 g activated charcoal as a function of time
Ozonation Time (h)
Conversion ()
Selectivity ()
AcAlde AA Unknown
3 71 400 600 00
6 101 363 600 38
9 178 347 590 63
12 325 381 465 154
Oxygen flow rate = 200 mL min-1 Ozone concentration = 100 g mL-1
As observed in Table 410 the percent conversion increased in proportion to ozone
treatment time The simultaneous use of ozone and activated carbon resulted in the
conversion of 325 2-chloroethanol after 12 hours to the same oxygenated products
when 2-chloroethanol was ozonated alone Conversion of 2-chloroethanol was
significantly improved by the catalytic action of activated carbon when compared to
ozone treatment alone reported earlier in this chapter as 219 conversion after 12 hours
of ozone exposure Previous reports showed ozone to work as an absorbent and also as a
catalytic agent in the treatment of dyes together with activated carbon123 It is therefore
suggested that similar reactions might have taken place in the case of 2-chloroethanol
In Figure 415 2-chloroethanol conversion and the selectivityrsquos for the formation of
AcAlde AA and the unknown products are plotted as a function of ozonation time using
a constant ozone dose of 100 g mL-1
116
Figure 415 Percent conversion of 2-chloroethanol in the presence of activated charcoal and
selectivity profile for products as a function of ozonation time
The results show a steady decrease in selectivity towards AcAlde from 3 h to 9 h and
thereafter a slight increase up to 12 h The selectivity towards AA remained constant for
the first 9 hours and thereafter decreased gradually as ozonation time increases This is
due to the oxidation of AcAlde to AA and unknown products The ozone treatment
combined with activated carbon converted 2-chloroethanol more rapidly than that with
ozone alone
The percentage yield of products chloride ion content and solution conductivity as a
function of ozonation time are presented in Table 411 It is clear that the rate at which
products are formed increases as ozonation time increases It is also evident that the
conductivity of the reaction mixture increases proportionately with the amount of
chloride ions formed as a function of time This behavior suggests that the Cl- ions
formed is the only species that contributes to an increase in solution conductivity and the
breaking of the C-Cl bond in 2-chloroethanol is enhanced in the presence of activated
charcoal At all time intervals the percentage yield of AA was significantly higher than
AcAlde indicating that the aldehyde is readily oxidized to its corresponding organic acid
The yields of the major products AcAlde and AA obtained in the presence of activated
0
10
20
30
40
50
60
70
2 3 4 5 6 7 8 9 10 11 12 13
Con
vers
ion
and
Sele
ctiv
ity (
)
Ozonation time (h)
conversion - 2-CE S - AcAlde S - AA S - unknown
117
charcoal were slightly higher when compared to its yields in the absence of the charcoal
indicating that the presence of activated charcoal in the reaction mixture definitely
influences the ozonation process
Table 411 Solution conductivity chloride ion content and product yields for ozonation of
2-chloroethanol in the presence of 1g activated charcoal as a function of time
Ozonation Time (h)
Conductivity
( S cm-1)
Chlorides
(ppm)
Yield ()
AcAlde AA Unknown
3 337 91 28 43 00
6 2184 225 37 60 04
9 4240 480 62 105 11
12 5597 647 124 151 50
Oxygen flow rate = 200 mL min-1 Ozone concentration = 100 g mL-1
441 Comparison of data for ozonation of 2-chloroethanol in the
presence of activated charcoal Figure 416 compares the conversion of 2-chloroethanol with and without the presence of
activated charcoal as a function of ozone treatment time It is evident that the conversion
rate of 2-chloroethanol is significantly higher when ozonation is carried out in the
presence of activated charcoal This behavior of substrate conversion is sufficient
evidence to support other researchers that the presence of activated charcoal in reactions
of organic compounds with ozone markedly improves the oxidation process The action
of activated carbon may be two-fold Firstly the surface characteristics of carbon may
assist in the decomposition of ozone and secondly reactions between the ozonide ions and
the substrate molecules may have occurred on the surface of carbon The result of this is
an increased conversion rate of the 2-chloroethanol molecule to AcAlde AA and
unknown products
118
Figure 416 Comparison of percent conversion of 2-chloroethanol with and without the presence
of activated charcoal versus ozonation time
Figure 417 Comparison of selectivity for AcAlde and AA formed during the ozonation of
2-chloroethanol with and without the presence of activated charcoal versus time
0
5
10
15
20
25
30
35
2 3 4 5 6 7 8 9 10 11 12 13
Con
vers
ion
(
)
Ozonation time (h)
2-CE 2-CE with charcoal
30
35
40
45
50
55
60
65
2 3 4 5 6 7 8 9 10 11 12 13
Sele
ctiv
ity (
)
Ozonation Time (h)
AcAlde (2-CE) AcAlde (2-CE with charcoal)AA (2-CE) AA (2-CE with charcoal)
119
Selectivity profiles of major products AcAlde and AA are illustrated in Figure 417 The
selectivity for both AcAlde and AA is high in reactions carried out in the presence of
activated charcoal Selectivity for AcAlde from 3 h to 6 h ozonation of 2-chloroethanol in
the presence of charcoal showed a gradual decrease indicating improved conversion of
AcAlde to AA This pattern of product formation suggests that the AcAlde formed is
rapidly oxidized to its corresponding acid AA In view of these trends in selectivity it
can therefore be suggested that the presence of activated charcoal has a significant
influence on the conversion of the substrate molecule and on the products formed
Figure 418 Comparison of yield of AcAlde and AA formed during the ozonation of
2-chloroethanol with and without the presence of activated charcoal versus time
A profile of the percentage yield of major products namely acetaldehyde (AcAlde) and
acetic acid (AA) formed during the ozone initiated oxidation of 2-choroethanol and
2-chloroethanol in the presence of charcoal as a function of ozone treatment time is
shown in Figure 418 It is clear that product yield increase as ozonation time increases
In all cases the percentage yield of AA was found to be significantly higher than the yield
of AcAlde indicating that the aldehyde is readily oxidized to its corresponding organic
0
2
4
6
8
10
12
14
16
2 3 4 5 6 7 8 9 10 11 12 13
Yiel
d (
)
Ozonation Time (h)
AcAlde (2-CE) AcAlde (2-CE with charcoal)
AA (2-CE) AA (2-CE with charcoal)
120
acid Higher product yields were obtained when the substrate was ozonated in the
presence of activated charcoal and a significant increase in the yield of AA is observed
This pattern of product formation suggests that the presence of charcoal has a significant
influence on the ozonation of 2-chloroethanol to AcAlde AA and unknown products
Figure 419 Comparison of chloride ions formed during the ozonation of 2-chloroethanol with and
without the presence of activated charcoal versus time
Figure 419 shows the ppm chloride ions formed during the ozonation of 2-chloroethanol
and 2-chloroethanol in the presence activated charcoal The chloride content in the
reaction mixture increases with an increase in ozone treatment time It is clearly evident
that the rate of chloride ion formation improved when ozone reactions were conducted in
the presence of activated charcoal The pattern of Cl- ion formation is similar to that in
water but its yields were marginally higher At higher ozone contact time with the
reaction mixture it is observed that the chloride ion content increases sharply which
suggests that ozone mass transfer and hence cleaving of the C-Cl bond is improved at
higher ozonation times
0
100
200
300
400
500
600
700
800
2 3 4 5 6 7 8 9 10 11 12 13
Chl
orid
es (p
pm)
Ozonation time (h)
2-CE 2-CE with charcoal
121
45 Ozone initiated oxidation of 2-chloroethanol in aqueous medium Ozone has been successfully applied to oxidize various organic compounds in water
Ozonation can remove easily and nearly completely persistent organic substances dyes
and malodorous substances which used to be imperfectly disposed by chlorination
Hyunook et al128 studied the oxidation of nonylphenol and nonylphenol ethoxylates in
water using O3 In water ozone is always produced diluted in either oxygen or air and it
is not feasible to produce 100 of the gas In addition since ozone is sparingly soluble
in water lower mass transfer and reaction rates are expected to result in certain cases of
conventional ozone processes In order to improve the performance of ozonation ozone-
based advanced oxidation processes involving homogeneous or heterogeneous catalytic
ozonation have been studied by several workers The aim of such processes is to increase
the production of hydroxyl radicals which are highly reactive species and thought to
enhance the decomposition of ozone in water These species may also result from
photocatalytic processes which are also classified as advanced oxidation process and
have also been applied for the degradation of many organic compounds in water
Although hydroxyl radicals are highly reactive species they are unselective and thereby
may react with non-target compounds leading to undesirable oxidation by-products In
addition AOPrsquos are considered to be expensive which is a limiting factor for their
industrial application In an attempt to solve some of these problems studies were
conducted to find the most effective condition for ozonation of organic substrates 2-
chloroethanol was chosen as the target compound since it is highly soluble in water at
different conditions Ozonation studies were conducted to evaluate its conversion and
product formation in aqueous media The effect of varying pH catalytic activity of
charcoal and influence of hydrogen peroxide during the ozonation process were
investigated to find the optimal condition for a complete and fast oxidation of
2-chloroethanol
122
451 Effect of pH on the ozonation of 2-chloroethanol It is widely known that pH plays a major role in the decomposition of ozone in solution
Kurniawan et al136 reported that in alkaline conditions (pH gt8) once the reaction of free
radical was initiated by ozone a series of oxidative degradation reactions that completely
oxidized the recalcitrant organic material into CO2 and H2O occurred in the solution
Therefore the effects of pH on the treatment performance of ozonation were studied by
varying the solution pH from 4 to 10 while keeping ozone dose concentration and
temperature of the reaction mixture constant
To evaluate the effect of solution pH on the conversion of 2-chloroethanol 100 μg mL-1
of ozone gas was constantly bubbled through 20 mL aliquots of 10 2-chloroethanol in
water at pH 4 7 and 10 respectively Gas chromatographic analysis of the product
mixture was performed after each time interval Peaks for AcAlde and AA eluted at their
respective retention times with no other new product peak appearing Table 412 and
Figure 420 summarize the reaction data for the conversion of 10 2-chloroethanol in
water at pH 4 and selectivity profiles of AcAlde AA and the unknown products
Table 412 Conversion and selectivity data for ozonation of 10 2-chloroethanol in water at pH 4
as a function of time
Ozonation Time (h)
Conversion ()
Selectivity ()
AcAlde AA Unknown
3 109 637 311 52
6 204 620 301 80
9 251 573 288 139
12 293 556 272 172
Oxygen flow rate = 200 mL min-1 Ozone concentration = 100 g mL-1
An observation of the data in Table 412 and Figure 420 shows that percent conversion
of 2-chloroethanol increases with ozonation time Percentage conversion of the substrate
increases from 109 after 3 h ozonation to 293 after 24 h ozonation It is evident
123
that the conversion rate of 2-chloroethanol increases sharply from 3 h to 6 h and
thereafter increases gradually up to 12 h
Figure 420 Percent conversion of 10 2-chloroethanol in water at pH 4 and selectivity profiles of
AcAlde AA and unknown versus ozonation time
This pattern of m-xylene conversion indicates that ozone dissolution increases with
increasing contact time with the substrate solution This is in agreement with Ozomax Ltd
who reported that the maximum number of moles of O3 transferred to the solution may be
calculated from
Mozone = NA x S x t
Where Mozone = number of moles O3 transferred
NA = Avogadrorsquos number
S = total bubble surface area and
t = contact time
This equation reveals that ozone dissolution in the substrate solution increases with
increasing contact time The results show that the selectivityrsquos towards AcAlde and AA is
high after 3h ozonation and steadily decreases with an increase in ozonation time
This is due to the oxidation of AcAlde to AA implying the existence of consecutive
reactions for these products at longer ozonation times
0
10
20
30
40
50
60
70
2 3 4 5 6 7 8 9 10 11 12
Con
vers
ion
and
Sel
ectiv
ity (
)
Ozonation time (h)
conversion - 2-CE S - AcAlde S - AA S - unknown
124
The effect of increasing the pH of the substrate solution to neutral (pH = 7) shows a
marginal increase in conversion of 2-chloroethanol as ozonation time is increased
Table 413 and Figure 421 summarize the reaction data for the conversion of 10
2-chloroethanol in water at pH 7 and selectivity profiles of AcAlde AA and unknown
products
Table 413 Conversion and selectivity data for ozonation of 10 2-chloroethanol in water at pH 7
as a function of time
Ozonation Time (h)
Conversion ()
Selectivity ()
AcAlde AA Unknown
3 145 617 325 59
6 227 575 341 84
9 308 547 335 117
12 328 527 414 59
Oxygen flow rate = 200 mL min-1 Ozone concentration = 100 g mL-1
Figure 421 Percent conversion of 10 2-chloroethanol in water at pH 7 and selectivity profiles of
AcAlde AA and unknown versus ozonation time
0
10
20
30
40
50
60
70
2 3 4 5 6 7 8 9 10 11 12 13
Con
vers
ion
and
Sel
ectiv
ity (
)
Ozonation time (h)
conversion - 2-CE S - AcAlde S - AA S - unknown
125
An observation of the data in Table 413 and Figure 421 shows that percent conversion
of 2-chloroethanol increases with ozonation time Percentage conversion of the substrate
increases from 145 after 3 h to 328 after 12 h when treated with 100 g mL-1
ozone It is evident that the conversion rate of 2-chloroethanol increases sharply during
the first 9 h of ozonation and thereafter increases gradually up to 12 h The oxygenated
product AcAlde showed the highest selectivity starting at 617 after 3 h ozonation and
thereafter decreasing to 527 after 12 h ozonation This pattern of product formation
indicates that AcAlde is readily oxidized to its corresponding carboxylic acid in aqueous
medium at neutral pH
Table 414 and Figure 422 summarize the reaction data for the conversion of 10
2-chloroethanol in water at pH 10 and selectivity profiles of AcAlde AA and unknown
products The effect of increasing the pH of the substrate solution to alkaline shows a
rapid increase in conversion of 2-chloroethanol as ozonation time is increased
Table 414 Conversion and selectivity data for ozonation of 10 2-chloroethanol in water at
pH 10 as a function of time
Ozonation Time (h)
Conversion
()
Selectivity ()
AcAlde AA Unknown
3 206 660 321 19
6 261 548 415 37
9 335 507 441 52
12 399 438 539 23
Oxygen flow rate = 200 mL min-1 Ozone concentration = 100 μg mL-1
An observation of the data in Table 414 and Figure 422 shows that percent conversion
of 2-chloroethanol increases with ozonation time Percentage conversion of the substrate
increases from 206 after 3 h of ozone treatment to 399 after 12 h of ozone
treatment It is evident that the conversion rate of 2-chloroethanol increases steadily
during the 12 h of ozonation
126
Figure 422 Percent conversion of 10 2-chloroethanol in water at pH 10 and selectivity profiles
of AcAlde AA and unknown versus ozonation time
The oxygenated product AcAlde showed the highest selectivity starting at 660 after 3
h ozonation and thereafter decreasing to 438 after 12 h ozonation Selectivity towards
AA increased steadily from 321 after 3 h to 539 after 12 h This pattern of product
formation indicates that AcAlde is readily oxidized to its corresponding carboxylic acid
AA in aqueous medium at pH 10
452 Comparison of data for ozonation of 2-chloroethanol at different
pH levels A comparison of the data was studied to ascertain the most efficient pH level for the
ozonation of 2-chloroethanol in water Data plotted in Figure 423 shows the percent
conversion of 2-chloroethanol in water at pH 4 7 and 10 respectively as a function of
ozone treatment time It is clear from the data that 2-chloroethanol can be easily oxidized
in acidic neutral and alkaline conditions by molecular ozone however more interesting
is that the conversion of 2-chloroethanol increases with ozonation time as the pH of the
solution increases
0
10
20
30
40
50
60
70
2 3 4 5 6 7 8 9 10 11 12 13
Con
vers
ion
and
Sele
ctiv
ity (
)
Ozonation time (h)
conversion - 2-CE S - AcAlde S - AA S - unknown
127
Figure 423 Comparison of percent conversion of 10 2-chloroethanol in water at pH 4 7 and 10
versus ozonation time
When comparing the three different conditions it is evident that the conversion of
2-chloroethanol at pH 4 was the lowest at all time intervals and marginally higher in
neutral water The conversion of 2-chloroethanol in water at pH 10 showed the best
results It can be suggested from the results obtained that the pH of the solution has a
significant influence on the conversion of 2-chloroethanol with conversion being
optimum in a more alkaline medium than in an acidic medium This is in good agreement
with Staehelin and Hoigneacute66 who reported that in pure water decomposition of ozone is
accelerated by increasing the pH Ozone at pH levels lt 7 reacts primarily as the O3
molecule by selective and sometimes relatively slow reactions Ozone at pH levels gt 8
rapidly decomposes into hydroxyl free radicals as described in chapter one which react
very fast Many organic compounds that are slow to oxidize in acidic or neutral water
will oxidize rapidly at high pH levels It was found that solution pH from 8 to 10 gave
the best results for oxidation of organic molecules in water The initial step of the
decomposition of ozone is the reaction between ozone and the hydroxide ion to form
ozone ion and hydroxyl radical The hydroxyl radical being highly reactive then reacts
further with ozone This process would then explain the increased solubility of ozone
with increasing alkalinity Glaze129 concluded that the hydroxyl radical may be the most
active species in the ozonation process
0
5
10
15
20
25
30
35
40
45
2 3 4 5 6 7 8 9 10 11 12 13
Con
vers
ion
()
Ozonation time (h)
pH 4 pH 7 pH 10
128
Figure 424 Comparison of selectivity for AcAlde and AA formed during the ozonation of 10
2-chloroethanol in water at pH 4 7 and 10 versus time
Figure 425 Comparison of yield of AcAlde and AA formed during the ozonation of 10
2-chloroethanol in water at pH 4 7 and 10 versus time
25
30
35
40
45
50
55
60
65
70
2 3 4 5 6 7 8 9 10 11 12 13
Sele
ctiv
ity (
)
Ozonation Time (h)
AcAlde (pH 4) AcAlde (pH 7) AcAlde (pH 10)AA (pH 4) AA (pH 7) AA (pH 10)
0
5
10
15
20
25
2 3 4 5 6 7 8 9 10 11 12 13
Yiel
d (
)
Ozonation time (h)
AcAlde (pH 4) AcAlde (pH 7) AcAlde (pH 10)
AA (pH 4) AA (pH 7) AA (pH 10)
129
Figures 424 and 425 shows the selectivity profiles and percentage yields of the major
products AcAlde and AA respectively It is evident that the selectivity for AcAlde at pH
4 and 7 decreases gradually with ozonation time whereas at pH 10 it decreases sharply It
is further observed that the selectivity for AA increases sharply as a function of ozonation
time at pH 10 This behavior of oxidation is further evidence that the presence of
hydroxyl ions improves the ozonation process of 2-chloroethanol an assumption that is
in good agreement with other researchers66129 A profile of the percentage yield of
AcAlde and AA also shows high results at pH 10 indicating that the reactivity at high pH
is fast Studies on trichlorophenol ozonation conducted by Chu and Wong132 also
confirmed that a linear increase in pseudo-first order reaction rates is obtained with pH in
the range greater than 7 and less than 11
Figure 426 Comparison of chloride ions formed during the ozonation of 10 2-chloroethanol in
water at pH 4 7 and 10 versus time
A comparison of the chloride ion content of the reaction mixture after 3 6 9 and 12 h at
pH 4 7 and 10 levels measured using a chloride ion selective electrode is shown in
Figure 426 It is evident that the pattern of chloride ion formation is the same at all pH
levels showing an increase in concentration from 3 h to 12 h of ozone treatment time
Ozonation of the reaction mixture maintained at pH 10 produces the highest amount of
chloride ions suggesting that the presence of a high concentration of hydroxide ions
readily causes the decomposition of ozone to ozone ions and hydroxyl radicals which
leads to a higher conversion rate of 2-chloroethanol thereby favouring a high
concentration of chloride ions
0
20
40
60
80
2 3 4 5 6 7 8 9 10 11 12 13
Chl
orid
es (p
pm)
Ozonation Time (h)
pH = 4 pH = 7 pH = 10
130
46 Effect of activated charcoal on the ozonation of 2-chloroethanol in
water Activated charcoal has been widely used as a powerful adsorbent in wastewater and gas
treatment The chemical reactivity of the activated carbon surface has shown in many
studies to catalyze oxidation reduction halogenations dehydrogenation polymerization
and nucleophilic reactions among others Combined ozone-activated charcoal treatment
processes have been shown to modify the chemical composition of the activated carbon
surface groups130
To investigate the influence of activated charcoal on the conversion of 2-chloroethanol
100 g mL-1 of ozone gas was bubbled through a mixture containing 20 mL aliquots of
10 2-chloroethanol in water at pH 4 7 and 10 in the presence of 1 g activated charcoal
for 3 6 9 and 12 h respectively Gas chromatographic analysis of the product mixture
after each time interval showed major peaks for AcAlde and AA eluting at their usual
retention times with no new product peak observed Table 415 and Figure 427
summarizes the reaction data for the conversion of 2-chloroethanol in water at different
pH levels and the selectivity profiles of major and unknown products
Table 415 Conversion and selectivity data for ozonation of 10 2-chloroethanol and 1 g
activated charcoal in water at pH 4 as a function of time
Ozonation Time (h)
Conversion ()
Selectivity ()
AcAlde AA Unknown
3 115 672 320 08
6 242 628 348 24
9 291 600 365 35
12 315 576 409 15
Oxygen flow rate = 200 mL min-1 Ozone concentration = 100 g mL-1
131
Figure 427 Percent conversion of 2-chloroethanol and selectivity profile of products versus time
(reaction mixture = 10 2-chloroethanol + 1 g activated charcoal in water at pH 4)
The data confirms that ozone initiated oxidation of 2-chloroethanol in the presence of
activated charcoal slightly improves the oxidation process and thereby increasing the
conversion of 2-chloroethanol as the ozone contact time increases The conversion of
2-chloroethanol was 115 after 3 h ozonation increasing steadily to 315 after 12 h
ozonation The selectivityrsquos towards AcAlde is 672 after 3h ozonation and steadily
decreases to 576 with an increase in ozonation time The results imply that AcAlde is
the first oxygenated product to be formed which is then rapidly further oxidized to its
corresponding carboxylic acid AA
Table 416 Conversion and selectivity data for ozonation of 10 2-chloroethanol and 1 g
activated charcoal in water at pH 7 as a function of time
Ozonation Time (h)
Conversion ()
Selectivity ()
AcAlde AA Unknown
3 133 629 336 35
6 253 584 353 64
9 336 570 351 79
12 389 537 425 38
Oxygen flow rate = 200 mL min-1 Ozone concentration = 100 g mL-1
0
10
20
30
40
50
60
70
80
2 3 4 5 6 7 8 9 10 11 12 13
Con
vers
ion
and
Sel
ectiv
ity (
)
Ozonation time (h)
conversion - 2-CE S - AcAlde S - AA S - unknown
132
Table 416 and Figure 428 summarizes the reaction data for the conversion of 10
2-chloroethanol in water at pH 7 in the presence of 1 g activated charcoal and the
selectivity profiles of AcAlde AA and unknown products
Figure 428 Percent conversion of 2-chloroethanol and selectivity profile of products versus time
(reaction mixture = 10 2-chloroethanol + 1 g activated charcoal in water at pH 7)
The effect of increasing the pH level of the substrate solution to neutral shows a rapid
increase in conversion of 2-chloroethanol as ozonation time is increased After 3 h of
ozone treatment 133 of 2-chloroethanol is converted to products rapidly increasing to
389 after 12 h ozonation Selectivity towards AcAlde has decreased from 629 after
3 h to 537 after 12 h Selectivity towards AA increased from 336 after 3 h
ozonation to 425 after 12 h of ozonation It is clear that the increase in pH level has
marginally influenced the oxidation process of both substrate conversion and product
formation This behavior is in agreement with previous studies131 which reported that the
ozone decomposition process showed very strong pH dependence At pH gt 4 the reaction
with hydroxide ions dominates the reaction process while it is probable that a no-radical
process which can also be described as a surface effect dominates at low pH level (~2)
0
10
20
30
40
50
60
70
2 3 4 5 6 7 8 9 10 11 12 13
Con
vers
ion
and
Sel
ectiv
ity (
)
Ozonation time (h)
conversion - 2-CE S - AcAlde S - AA S - unknown
133
Table 417 and Figure 429 summarizes the analyzed data for the conversion of 10
2-chloroethanol in water at pH 10 in the presence of 1 g activated charcoal and the
selectivity profiles of AcAlde AA and unknown products
Table 417 Conversion and selectivity data for ozonation of 10 2-chloroethanol and 1 g
activated charcoal in water at pH 10 as a function of time
Ozonation Time (h)
Conversion ()
Selectivity
AcAlde AA Unknown
3 236 694 284 21
6 367 604 389 07
9 417 442 474 84
12 477 389 564 47
Oxygen flow rate = 200 mL min-1 Ozone concentration = 100 g mL-1
Figure 429 Percent conversion of 2-chloroethanol and selectivity profile of products versus time
(reaction mixture = 10 2-chloroethanol + 1 g activated charcoal in water at pH 10)
The effect of increasing the pH level of the substrate solution to alkaline shows a rapid
increase in conversion of 2-chloroethanol as ozonation time is increased After 3 h of
ozone treatment 236 of 2-chloroethanol is converted to products rapidly increasing to
0
10
20
30
40
50
60
70
80
2 3 4 5 6 7 8 9 10 11 12 13
Con
vers
ion
and
Sel
ectiv
ity (
)
Ozonation time (h)
conversion - 2-CE S - AcAlde S - AA S - unknown
134
477 after 12 h ozonation Selectivity towards AcAlde has decreased from 694 after
3 h to 389 after 12 h Selectivity towards AA increased from 284 after 3 h
ozonation to 564 after 12 h of ozonation It is clear that the increase in pH level to a
great extent influences the oxidation process of both substrate conversion and product
formation corresponding favorably to studies conducted by other researchers on the
effects of activated carbon and pH levels on the ozonation process129 131
461 Comparison of data for ozone initiated oxidation of an aqueous
solution of 2-chloroethanol in the presence of activated charcoal The data presented in Figure 430 shows a comparison of percentage conversion of the
ozone initiated oxidation of a mixture of 10 2-chloroethanol with and without 1 g
activated charcoal in water at pH 4 7 and 10 respectively as a function of ozone
treatment time
Figure 430 Comparison of percent conversion of 2-chloroethanol versus ozonation time
(10 2-chloroethanol + 1 g activated charcoal in water at pH 4 7 and 10 respectively)
10
15
20
25
30
35
40
45
50
2 3 4 5 6 7 8 9 10 11 12 13
Con
vers
ion
()
Ozonation time (h)
water (pH 4) water + charcoal (pH 4) water (pH 7)water + charcoal (pH 7) water (pH 10) water + charcoal (pH 10)
135
It is evident from the plots that the presence of 1 g activated charcoal has a significant
influence on the ozone process at all pH levels studied The conversion rates increased in
proportion to treatment time Ozone treatment combined with activated carbon converted
2-chloroethanol more rapidly than that with ozone alone Furthermore the conversion
rates were the highest in the activated carbon-ozone treatment at pH 10 Activated carbon
is believed to promote the decomposition of aqueous ozone leading to the formation of
oxygen active species both in the liquid phase and on the carbon surface that are
responsible for enhancing the conversion of 2-chloroethanol to smaller oxygenated
products Upon contact of the ozone gas with the activated carbon in water higher ozone
concentrations in the aqueous phase is achieved which can enable faster oxidation rates
Better and effective ozone utilization can also be expected Tizaoui C et al reported that
ozone can be adsorbed at high concentrations from an oxygen or air stream on to a silica-
based adsorbent (eg silica gel adsorbs 710 gm3 O3 at 20oC and 50 gm3 NTP gasndash
ozone) Thus if activated charcoal is in contact with water aqueous ozone may reach
higher concentrations than those obtainable with ozonewater systems leading to
enhanced bulk reaction rates Furthermore if 2-chlorothanol molecules are adsorbed on
the absorbent they will be exposed to high ozone concentrations the reactions taking
place on the surface of the solid material will result in potential benefits such as selective
oxidation and kinetic enhancement
Figure 431 Comparison of percentage yield of AcAlde and AA formed during the ozonation of
1 g activated charcoal and 10 2-chloroethanol in water at pH 4 versus ozonation time
0
2
4
6
8
10
12
14
16
18
20
2 3 4 5 6 7 8 9 10 11 12 13
Yiel
d (
)
Ozonation time (h)
AcAlde (water) Acalde (charcoal) AA (water) AA (charcoal)
136
Figure 432 Comparison of percentage yield of AcAlde and AA formed during the ozonation of
1 g activated charcoal and 10 2-chloroethanol in water at pH 7 versus ozonation time
Figure 433 Comparison of percentage yield of AcAlde and AA formed during the ozonation of
1 g activated charcoal and 10 2-chloroethanol in water at pH 10 versus ozonation time
0
5
10
15
20
25
2 3 4 5 6 7 8 9 10 11 12 13
Yiel
d (
)
Ozonation time (h)
AcAlde (water) AcAlde (charcoal) AA (water) AA (charcoal)
0
5
10
15
20
25
30
2 3 4 5 6 7 8 9 10 11 12 13
Yiel
d (
)
Ozonation time (h)
AcAlde (water) AcAlde (charcoal) AA (water) AA (charcoal)
137
Figures 431 ndash 433 compares the percentage yields of the major products AcAlde and
AA formation during the ozonation of 10 2-chloroethanol with and without activated
charcoal in water at pH 4 7 and 10 respectively as a function of ozone treatment time
The product yields obtained for ozonation of 2-chloroethanol under acidic conditions
(pH 4) shows the final oxidation products AcAlde and AA to be highly refractory to
ozonation and thus found to persist in solution Both products displayed good selectivity
in the presence of activated charcoal with AcAlde showing the highest selectivity and
yield The profile of product yields obtained at pH 7 was similar to product yields
obtained at pH 4 A significant change in the product yield pattern was observed when
ozonation was carried out under basic conditions The yield of AcAlde increased sharply
for the first three hours of ozone treatment and thereafter decreased sharply during the
next three hours It then remained steady up to 12 h During the same time period a
gradual increase in AA yield was noticed This pattern of product formation and
destruction can only be explained as consecutive reactions taking place The ozonation of
2-chloroethanol in the presence of activated charcoal in a highly basic reaction mixture
not only enhances the conversion of substrate but further assists in the oxidation of
primary products into secondary products
Figure 434 Comparison of chloride ion formation during the ozonation of 1 g activated charcoal
and 10 2-chloroethanol in water at pH 4 7 and 10 respectively versus time
10
20
30
40
50
60
70
80
2 3 4 5 6 7 8 9 10 11 12 13
Chl
orid
es (p
pm)
Ozonation Time (h)
water (pH 4) water + charcoal (pH 4) water (pH 7)water + charcoal (pH 7) water (pH 10) water + charcoal (pH 10)
138
A comparison of the chloride ion content of the reaction mixture containing activated
charcoal after 3 6 9 and 12 h at pH 4 7 and 10 levels measured using a chloride ion
selective electrode is shown in Figure 434 It is evident that the pattern of chloride ion
formation is the same at all pH levels showing an increase in concentration from 3 h to
12 h of ozone treatment time Ozonation of the reaction mixture containing activated
charcoal at pH 10 produces the highest amount of chloride ions suggesting that the
presence of a high concentration of hydroxide ions in activated charcoal readily causes
the decomposition of ozone to ozone ions and hydroxyl radicals leading to a higher
conversion rate of 2-chloroethanol
47 Effect of hydrogen peroxide on ozonation of 2-chloroethanol in
water Since hydrogen peroxide reacts well with ozone to produce highly reactive OH- and O2
-
species127 a study was conducted to investigate the influence of hydrogen peroxide on
the ozone initiated oxidation of 2-chloroethanol Experiments were conducted by
introducing 100 μg mL-1 of ozone gas through 20 mL mixtures of 10 2-chloroethanol
and hydrogen peroxide at pH 4 7 and 10 for 3 6 9 and 12 h respectively Gas
chromatographic analysis of the product mixture after each time interval showed major
peaks for AcAlde and AA eluting at their usual retention times with no additional product
peaks emerging
Tables 418 and Figure 435 gives the reaction data for the conversion of a mixture of
10 2-chloroethanol and 5 hydrogen peroxide at pH 4 7 and 10 respectively and the
selectivity profiles of AcAlde AA and the unknown products as a function of ozone
treatment time An observation of the data shows that percent conversion of
2-chloroethanol increases with ozonation time Percentage conversion of the substrate
increases from 113 after 3 h ozonation to 322 after 24 h ozonation It is evident
that the conversion rate of 2-chloroethanol increases sharply from 3 h to 9 h and
thereafter increases gradually up to 12 h This pattern of 2-chloroethanol conversion
indicates that ozone dissolution increases with increasing contact time with the substrate
139
solution Selectivity towards AcAlde was high starting from 659 after 3 h ozonation
and gradually decreasing to 574 after 12 h ozonation Selectivity towards AA
increased slightly from 331 after 3 h to 372 after 12 h
Table 418 Conversion and selectivity data for ozonation of 10 2-chloroethanol and 5 H2O2
in water at pH 4 as a function of time
Ozonation Time (h)
Conversion
()
Selectivity ()
AcAlde AA Unknown
3 113 659 331 11
6 238 647 335 18
9 307 600 359 41
12 322 574 372 54
Oxygen flow rate = 200 mL min-1 Ozone concentration = 100 g mL-1
Figure 435 Percent conversion of 2-chloroethanol and selectivity profile of products versus
ozonation time (reaction mixture = 10 2-chloroethanol + 5 H2O2 in water at pH 4)
0
10
20
30
40
50
60
70
2 3 4 5 6 7 8 9 10 11 12
Con
vers
ion
and
Sel
ectiv
ity (
)
Ozonation time (h)
conversion - 2CE S - AcAlde S - AA S - unknown
140
Table 419 and Figure 436 summarizes the reaction data for the conversion of 10
2-chloroethanol in the presence of 5 hydrogen peroxide in water at pH 7 and
selectivity profiles of AcAlde AA and unknown products
Table 419 Conversion and selectivity data for ozonation of 10 2-chloroethanol and 5 H2O2
in water at pH 7 as a function of time
Ozonation Time (h)
Conversion ()
Selectivity ()
AcAlde AA Unknown
3 154 648 344 08
6 273 596 340 64
9 349 557 376 67
12 392 549 385 66
Oxygen flow rate = 200 mL min-1 Ozone concentration = 100 g mL-1
Figure 436 Percent conversion of 2-chloroethanol and selectivity profile of products versus
ozonation time (reaction mixture = 10 2-chloroethanol + 5 H2O2 in water at pH 7)
0
10
20
30
40
50
60
70
2 3 4 5 6 7 8 9 10 11 12
Con
vers
ion
and
Sel
ectiv
ity (
)
Ozonation time (h)
conversion - 2-CE S - AcAlde S - AA S - unknown
141
After 3 h of ozone treatment 154 of 2-chloroethanol was completely oxidized to
AcAlde AA and a small quantity of unknown products Further ozonation up to 12 h
resulted in the conversion of 2-chloroethanol increasing rapidly to 392 AcAlde
showed the highest selectivity decreasing slightly from 648 after 3 h of ozone
treatment to 549 after 12 h This pattern of substrate conversion and selectivity
profiles of products were very similar to the ozonation reactions conducted at pH 4
Table 420 Conversion and selectivity data for ozonation of 10 2-chloroethanol and 5 H2O2
in water at pH 10 as a function of time
Ozonation Time (h)
Conversion ()
Selectivity ()
AcAlde AA Unknown
3 271 629 344 27
6 382 541 433 26
9 455 477 494 30
12 516 369 598 33
Oxygen flow rate = 200 mL min-1 Ozone concentration = 100 g mL-1
Figure 437 Percent conversion of 2-chloroethanol and selectivity profile of products versus
ozonation time (reaction mixture = 10 2-chloroethanol + 5 H2O2 in water at pH 10)
0
10
20
30
40
50
60
70
2 3 4 5 6 7 8 9 10 11 12
Con
vers
ion
and
Sel
ectiv
ity (
)
Ozonation time (h)
conversion - 2-CE S - AcAlde S - AA S - unknown
142
Table 420 and Figure 437 summarize the reaction data for the conversion of 10
2-chloroethanol in the presence of 5 hydrogen peroxide in water at pH 10 and
selectivity profiles of AcAlde AA and unknown products
Increasing the pH level of the substrate solution to alkaline shows a rapid increase in
conversion of 2-chloroethanol as ozonation time is increased After 3 h of ozone
treatment 271 of 2-chloroethanol is converted to products rapidly increasing to
516 after 12 h ozonation Selectivity towards AcAlde has decreased from 629 after
3 h to 369 after 12 h Selectivity towards AA increased from 344 after 3 h
ozonation to 598 after 12 h of ozonation
The effect of increasing the strength of the hydrogen peroxide from 5 to 10 was
investigated Experiments were conducted by bubbling 100 g mL-1 of ozone gas with
20 mL mixtures of 10 2-chloroethanol in the presence of 10 hydrogen peroxide at
pH 4 7 and 10 for 3 6 9 and 12 h respectively
Table 421 and Figure 438 summarizes the reaction data for the conversion of 10
2-chloroethanol and 10 hydrogen peroxide in water at pH 4 and the selectivity profiles
of AcAlde AA and unknown products as a function of ozone treatment time
Table 421 Conversion and selectivity data for ozonation of 10 2-chloroethanol and 10 H2O2
in water at pH 4 as a function of time
Ozonation Time (h)
Conversion ()
Selectivity ()
AcAlde AA Unknown
3 164 647 344 09
6 252 568 348 83
9 347 524 409 67
12 353 512 430 57
Oxygen flow rate = 200 mL min-1 Ozone concentration = 100 g mL-1
143
The results presented in Table 421 show that the percentage conversion of
2-chloroethanol increases from 164 after 3 h of ozonation to 353 after 12 h
Selectivity towards AcAlde decreased from 647 to 512 as ozone treatment time
was increased Selectivity towards AA increased from 344 after 3 h of ozonation to
43 after 12 h This pattern of product formation indicates that consecutive reactions
between the two products have occurred
Figure 438 Percent conversion of 2-chloroethanol and selectivity profile of products versus
ozonation time (reaction mixture = 10 2-chloroethanol + 10 H2O2 in water at pH 4)
Table 422 Conversion and selectivity data for ozonation of 10 2-chloroethanol and 10 H2O2
in water at pH 7 as a function of time
Ozonation Time (h)
Conversion ()
Selectivity ()
AcAlde AA Unknown
3 169 778 148 74
6 292 715 199 86
9 369 667 297 36
12 412 664 316 20
Oxygen flow rate = 200 mL min-1 Ozone concentration = 100 g mL-1
0
10
20
30
40
50
60
70
2 3 4 5 6 7 8 9 10 11 12
Con
vers
ion
and
Sele
ctiv
ity (
)
Ozonation time (h)
conversion - 2-CE S - AcAlde S - AA S - unknown
144
Table 422 and Figure 439 summarize the reaction data for the conversion of 10
2-chloroethanol in the presence of 10 hydrogen peroxide in water at pH 7 and
selectivity profiles of AcAlde AA and unknown products
Figure 439 Percent conversion of 2-chloroethanol and selectivity profile of products versus
ozonation time (reaction mixture = 10 2-chloroethanol + 10 H2O2 in water at pH 7)
The results show a steady decrease in selectivity towards AcAlde and an increase in
selectivity towards AA as ozonation time increases This is due to the oxidation of
AcAlde to its corresponding acid AA implying the existence of consecutive reactions for
these products at longer ozonation times Percent conversion of 2-chloroethanol increased
from 169 to 412 after 12 h of ozone treatment indicating that the extent of
oxidation of the substrate molecule is dependent on ozonation contact time
Table 423 and Figure 440 summarize the reaction data for the conversion of 10
2-chloroethanol in the presence of 10 hydrogen peroxide in water at pH 10 and
selectivity profiles of AcAlde AA and unknown products The results show that the
percentage conversion of 2-chloroethanol is significantly higher when ozonation is
carried out in the presence of 10 hydrogen peroxide The conversion 2-chloroethanol
increased from 363 after 3 h of ozone treatment to 555 after 12 h After 3 h of
ozonation AcAlde showed the highest selectivity of 642 thereafter decreasing to 265
0
10
20
30
40
50
60
70
80
90
2 3 4 5 6 7 8 9 10 11 12
Con
vers
ion
and
Sele
ctiv
ity (
)
Ozonation time (h)
conversion - 2-CE S - AcAlde S - AA S - unknown
145
in 12 h The selectivity of AA increased sharply from 356 after 3 h of ozonation to
632 after 12 h This pattern of product formation indicates that AcAlde in the presence
of 10 hydrogen peroxide and sufficient hydroxide ions can easily be oxidized to AA
Acetic acid on the other hand is found to be resistant to further ozone oxidation
Table 423 Conversion and selectivity data for ozonation of 10 2-chloroethanol and 10 H2O2
in water at pH 10 as a function of time
Ozonation Time (h)
Conversion ()
Selectivity ()
AcAlde AA Unknown
3 363 642 356 02
6 424 514 471 15
9 477 393 589 18
12 555 265 632 103
Oxygen flow rate = 200 mL min-1 Ozone concentration = 100 g mL-1
Figure 440 Percent conversion of 2-chloroethanol and selectivity profile of products versus
ozonation time (reaction mixture = 10 2-chloroethanol + 10 H2O2 in water at pH 10)
0
10
20
30
40
50
60
70
2 3 4 5 6 7 8 9 10 11 12
C
onve
rsio
n a
nd S
elec
tivity
()
Ozonation time (h)
conversion - 2-CE S - AcAlde S - AA S - unknown
146
471 Comparison of data for ozone initiated oxidation of an aqueous
solution of 2-chloroethanol in the presence of hydrogen peroxide
Figure 441 Comparison of percent conversion of 2-chloroethanol with and without the presence
of H2O2 versus ozonation time (10 2-chloroethanol + 5 H2O2 in water at pH 4)
Figure 442 Comparison of percent conversion of 2-chloroethanol with and without the presence
of H2O2 versus ozonation time (10 2-chloroethanol + 5 H2O2 in water at pH 7)
0
5
10
15
20
25
30
35
40
2 3 4 5 6 7 8 9 10 11 12 13
Con
vers
ion
()
Ozonation time (h)
2-CE in water 2-CE in 5 H2O2 2-CE in 10 H2O2
0
5
10
15
20
25
30
35
40
45
2 3 4 5 6 7 8 9 10 11 12 13
Con
vers
ion
()
Ozonation time (h)
2-CE in water 2-CE in 5 H2O2 2-CE in 10 H2O2
147
Figure 443 Comparison of percent conversion of 2-chloroethanol with and without the presence
of H2O2 versus ozonation time (10 2-chloroethanol + 5 H2O2 in water at pH 10)
A comparison of the data was performed to establish the most efficient condition for the
ozonation of 2-chloroethanol in the presence of 5 and 10 hydrogen peroxide in
water at pH level 4 7 and 10 Data plotted in Figures 441 ndash 443 shows the percent
conversion of 2-chloroethanol with and without hydrogen peroxide in water at pH 4 7
and 10 respectively as a function of ozone treatment time It is observed that after ozone-
hydrogen peroxide treatment the percentage of 2-chloroethanol conversion as a function
of time has significantly improved compared to ozonation alone At pH 10 the conversion
of 2-chlorethanol to products showed the most excellent result This could be attributed to
the fact that in alkaline conditions the concentration of OH- in the solution increases
thereby acting as a promoterinitiator for the decomposition of ozone into intermediate
compounds such as peroxide ions (O2-) and the HO2
bull radical In the presence of hydrogen
peroxide the hydroxyl radical is formed and acts as an initiator for the oxidation of
2-chloroethanol With the increasing OH- in the solution that initiated the intermediate
chain reactions the rate of ozone decomposition also becomes significantly faster
Figures 444 ndash 446 compares the percentage yields of the major products AcAlde and
AA formation during the ozonation of 10 2-chloroethanol with and without hydrogen
peroxide in water at pH 4 7 and 10 respectively as a function of ozone treatment time
0
10
20
30
40
50
60
2 3 4 5 6 7 8 9 10 11 12 13
Con
vers
ion
()
Ozonation time (h)
2-CE in water 2-CE in 5 H2O2 2-CE in 10 H2O2
148
Figure 444 Comparison of percent yield of AcAlde and AA formed with and without the presence
of H2O2 versus ozonation time (10 2-chloroethanol +H2O2 in water at pH 4)
Figure 445 Comparison of percent yield of AcAlde and AA formed with and without the presence
of H2O2 versus ozonation time (10 2-chloroethanol +H2O2 in water at pH 7)
3
5
7
9
11
13
15
17
19
2 3 4 5 6 7 8 9 10 11 12 13
Yiel
d (
)
Ozonation time (h)
AcAlde (water) Acalde (5 H2O2) AcAlde (10 H2O2)AA (water) AA (5 H2O2) AA (10 H2O2)
2
7
12
17
22
27
2 3 4 5 6 7 8 9 10 11 12 13
Yiel
d (
)
Ozonation time (h)
AcAlde (water) Acalde (5 H2O2) AcAlde (10 H2O2)AA (water) AA (5 H2O2) AA (10 H2O2)
149
Figure 446 Comparison of percent yield of AcAlde and AA formed with and without the presence
of H2O2 versus ozonation time (10 2-chloroethanol +H2O2 in water at pH 10)
The pattern for the formation of major products AcAlde and AA at pH 4 and pH 7 were
very similar however their percentage yields were higher in the presence of hydrogen
peroxide In all cases the yields of AcAlde and AA increased gradually with an increase
in ozone treatment time Increasing the concentration of hydrogen peroxide resulted in a
marginal increase in the yields of both AcAlde and AA Ozonation of the reaction
mixture maintained at pH level 10 showed the most promising results Product formation
is rapid with the yield of AcAlde decreasing sharply and yield of AA increasing sharply
from 3 h to 12 h ozonation This pattern of product formation indicates that ozonation of
2-chloroethanol in the presence of hydrogen peroxide in water at pH 10 occurs extremely
fast
Figures 447 ndash 449 compares the parts per million chloride ion formation during the
ozonation of 10 2-chloroethanol with and without hydrogen peroxide in water at pH 4
7 and 10 respectively as a function of ozone treatment time
6
11
16
21
26
31
36
2 3 4 5 6 7 8 9 10 11 12 13
Yiel
d (
)
Ozonation time (h)
AcAlde (water) Acalde (5 H2O2) AcAlde (10 H2O2)AA (water) AA (5 H2O2) AA (10 H2O2)
150
Figure 447 Comparison of parts per million chloride ion formed with and without the presence of
H2O2 versus ozonation time (10 2-chloroethanol + H2O2 in water at pH 4)
Figure 448 Comparison of parts per million chloride ion formed with and without the presence of
H2O2 versus ozonation time (10 2-chloroethanol + H2O2 in water at pH 7)
0
20
40
60
80
100
2 3 4 5 6 7 8 9 10 11 12 13
Chl
orid
es (p
pm)
Ozonation time (h)
water 5 H2O2 10 H2O2
0
20
40
60
80
100
2 3 4 5 6 7 8 9 10 11 12 13
Chl
orid
es (p
pm)
Ozonation time (h)
water 5 H2O2 10 H2O2
151
Figure 449 Comparison of parts per million chloride ion formed with and without the presence of
H2O2 versus ozonation time (10 2-chloroethanol + H2O2 in water at pH 10)
An observation of the data show that in all cases the concentration of chloride ion
increases with an increase in ozone treatment time Furthermore it is evident that the
presence of hydrogen peroxide has a positive effect on the ozonation process by cleaving
a higher percentage of C ndash Cl bonds in 2-chloroethanol Increasing the pH to 10 and
hydrogen concentration to 10 resulted in the formation in the highest amount of
chloride ions formed
48 Reaction pathway for ozonation of 2-chloroethanol
A general sequence for the oxidation of 2-chloroethanol by ozone is proposed in Scheme
40 This reaction sequence involves all intermediates detected leading to acetic acid as
the ultimate generated carboxylic acid The main oxidizing agents are O3 for ozonation
alone and O3 organic solvent hydrogen peroxide and activated carbon for catalytic
ozonation The process is initiated by the direct attack of either the carbon attached to the
oxygen or the carbon attached to the chlorine atom by bullOH andor O3 giving acetaldehyde
0
20
40
60
80
100
120
140
2 3 4 5 6 7 8 9 10 11 12 13
Chl
orid
es (p
pm)
Ozonation time (h)
water 5 H2O2 10 H2O2
152
as a primary oxidation product This reaction is faster in the O3solvent and O3activated
carbon system where higher amounts of ozone is able to react with the initial reactant
When ozonation of 2-chloroethanol is carried out in the presence of hydrogen peroxide
two main chemical reactions occur (i) two ozone molecules produce two hydroxyl
radicals which react with the organic compound and (ii) direct reaction of the organic
compound with ozone
Cl-CH2-CH2-OH + OH Cl-CH-CH2-OH Cl-CH2-CH-OH H2O+ +
1 2
Cl CH2 OHCH CH2 CH OH
3
+ Cl
CH2 C
O
HCH2 CH OH H
CH2 C
O
H+ Cl-CH2-CH2-OH 1 or 2 + CH3 C
H
O
(acetaldehyde)
OH CH3 C
O
HO
(acetic acid)
+ minorproducts
Scheme 40 Proposed radical type reaction pathway for the ozonation of 2-CE in H2O or H2O
H2O2 system
Reaction of bullOH with chlorinated organic compounds affords mainly hydrogen
abstraction Interaction of 2-chloroethanol with bullOH radicals are believed to yield two
main organic radicals 1 and 2 These two radicals decompose rapidly leading to the
release of Cl- ions and the formation of radical 3 Interaction of 2-CE with radical 3
produces the primary oxidation product acetaldehyde which is easily oxidized to its
corresponding carboxylic acid acetic acid
153
50 Conclusions
In the present work the ozone initiated oxidation of two selected model toxic compounds
commonly found in the environment was studied The ozonation of m-xylene and
2-chloroethanol leads to conversion of both compounds after a short reaction period and
their conversion increases as a function of ozonation time This suggests that the partial
removal of these non-biodegradable compounds from aqueous solutions can be
accomplished by ozone treatment alone The extent of conversion of 2-chloroethanol was
found to be higher than that of m-xylene under similar reaction conditions and ozone
treatment time This may be due to the difference in chemical nature and reactivity of the
two compounds
51 Ozonation of m-xylene Ozonation of m-xylene produced good yields of 3-methylbenzylalcohol
3-methylbenzaldehyde 3-methylbenzoic acid and smaller straight chain carboxylic acids
as oxidation products Their yields were found to increase as a function of ozonation
time The carboxylic acids and 3-methylbenzoic acid were found to be resistant to
further oxidation under the experimental conditions used
The presence of 5 acetic acid which is resistant to ozone attack was found to enhance
ozone solubility in the media and thus increase the rate of m-xylene conversion in
comparison to ozonation alone When the strength of the solvent was increased to 20
the conversion of m-xylene was found to increase proportionately with ozonation time
The presence of 5 and 20 ethyl acetate which also was found to be resistant to
ozone attack under the experimental conditions used showed similar trends The pattern
of product formation when ozonation was carried out in the presence of solvent was
similar in when compared to ozonation alone however it was observed that the
selectivity for 3-methylbenzaldehyde decreased while the selectivity for 3-methylbenzoic
acid increased as a function of ozone treatment time Ozone was consumed not only for
the conversion of the substrate molecule but also conversion of oxygenated intermediates
154
and final products This method of using solvents during ozone treatment can be
advantageous if the toxic compounds are insoluble in water
It is evident from the study that the use of activated charcoal-ozone combined treatment
clearly improves the conversion of m-xylene to oxygenated products Therefore
conversion of the substrate is mainly due to the catalytic activity or promoting action of
activated charcoal on the ozone decomposition and reaction of the intermediate products
52 Ozonation of 2-chloroethanol Ozonation of 2-chloroethanol was transformed to dechlorinated intermediates and
chloride ions The amount of chloride ions formed increased with an increase in ozone
treatment time Therefore it is possible to follow the conversion rate of 2-chloroethanol
by monitoring the chloride ion The electric conductivity of the reaction mixture was
found to change proportionately with the amount of chloride ions formed This simple
technique can not only be used to monitor the conversion of the halogenated organic
substrate but at the same time be used to follow the kinetics of the oxidation reaction
The ozone initiated oxidation of 2-chloroethanol produced good yields of acetaldehyde
and acetic acid as products Their yields were found to increase as a function of ozonation
time The carboxylic acids resisted ozone attack under the experimental conditions used
The presence of 5 acetic acid was found to enhance ozone decomposition and thus
increase the rate of 2-chloroethanol conversion in comparison to ozonation alone When
the strength of the solvent was increased to 20 the conversion of 2-chloroethanol was
found to increase proportionately with ozonation time The pattern of product formation
when ozonation was carried out in the presence of solvent was similar to that of
ozonation alone
The presence of 5 and 20 ethyl acetate showed similar trends however the rate of
substrate conversion and product formation showed significant improvement Ozonation
of aqueous solutions of 2-chloroethanol maintained at different pH levels produced good
yields of acetaldehyde and acetic acid as major products Conversion of substrate
155
molecule was most effective when ozonation was performed at pH 10 The increase in
hydroxide ion concentration in the reaction mixture was found to be responsible to
enhance not only the conversion rate of 2-chloroethanol but also the conversion of the
product acetaldehyde to acetic acid
The presence of activated charcoal also showed improved conversion rates of the
substrate molecule and good yields of acetaldehyde and acetic acid The activity of
charcoal seems to perform better when ozonation of the organic compound is carried out
in water The presence of charcoal in reaction mixtures maintained at pH 10 showed the
most improved conversion rates and yield of products The initiating action of activated
charcoal through surface reactions is thought to have influenced the overall ozonation
process
The ozonation of 2-chloroethanol in the presence of hydrogen peroxide in water at
different pH levels showed interesting observations Solutions of 2-chloroethanol
maintained at pH level 4 and 7 showed marginal changes in conversion rates compared to
ozonation alone however conversion rates improved significantly when the pH of the
solution was increased to 10 Increasing the strength of the hydrogen peroxide in the
reaction mixture from 5 to 10 had very little effect in the conversion rates of
2-chloroethanol and product formation
53 Future work
The work undertaken in this thesis has shown that ozone is a good oxidant to convert
m-xylene and 2-chloroethanol two toxic compounds that can persist in the environment
for long periods to less toxic compounds and in the latter case dechlorination of the
hazardous organic compound was successfully achieved The use of advance oxidation
process such as organic solvents that are resistant to ozone attack activated charcoal and
hydrogen peroxide or a combination of these processes was found to significantly
improve the ozonation process however complete mineralization of the toxic organic
compound could not be achieved using these methods alone
156
It is therefore recommended that future work be undertaken by investigating the use of
metal catalysts and other oxidation enhancers to assist in accomplishing complete
mineralization of the studied compounds and improve the economic considerations of the
ozone initiated oxidation process such as reduced ozone treatment time and lower ozone
dosage concentrations
157
REFERENCES 1 Bingen HG and Crutzen PJ J Geophys Res 1987 92 2182
2 Emberton JR and Parker A Waste Manage Res 1987 5 473
3 Nozhevnikova AN Lebedevand VS Lifshitz AB Microbiological processes
occurring in landfills Proceedings of the Symposium on Anaerobic Digestion of
Solid Waste Venice Italy 1992 303
4 Blakey NC Model Prediction of Landfill Leachate Production In Christensen
TH Cossu R and Stegmann R Editors Sanitary Landfilling Process
Technology and Environmental Impact Academic Press San Diego CA 1989
5 Amonkrane A Comel C Veron J Water Res 1997 31 (11) 2775
6 Trebouet D Schlumpt JP Jaouen P and Quemeneur F Water Res 2001 35
(12) 2935
7 Rodriguez J Castrillon L Maranon E Sastre H and Fernandez E Water Res
2004 38 3297
8 Schultz B Kjeldsen P Water Res 1986 20 (8) 965
9 Harmsen J Water Res 1983 17 (6) 699
10 Baig S Coulomb I Courant P and Liechti P Ozone Sci Eng 1999 21 (1) 1
11 Oman C Hynning P Environ Pollut 1993 80 265
12 Reinhart DR Waste Manage Res 1993 11 257
13 Fishbein L International Agency for Research on Cancer IARC Scientific
Publications No 85 1988 109
14 Strotmann UJ Pentenga M and Janssen DB Arch Microbiol 1990 154 294
15 Greenpeace Report The Effects of Organochlorines on Aquatic Ecosystems
September 1992
16 Jorio H Bibeau L Viel G and Heitz M Chem Eng J 2000 76 (3) 209
17 Abumaizar RJ Kocher W and Smith EH J Hazard Mater 1998 60 111
18 Strauss JM Riedel K J and du Plessis CA Appl Microbiol Biotech 2004
64 855
19 Saravanan V and Rajamohan N J Hazard Mater 2009 162 (2-3) 981
20 Chen F Ma H and Wang B J Hazard Mater 2009 162 (2-3) 668
158
21 McCann J Simmon V Streitwieser D and Ames BN Proc Natl Acad
Sci USA 1975 72 3190
22 Stucki G and Leisinger T FEMS Microbiol Lett 1983 16 123
23 Janssen DB Keuning S and Witholt B J Gen Microbiol 1987a 133 85
24 Janssen DB Scheper A Dijkhuizen L and Witholt B Appl Environ
Microbiol 1985 49 673
25 Strotmann UJ Pentaga M and Janssen DB Arch Microbiol 1990 154 294
26 Glaze WH Kang JW Chaplin DH Ozone Sci Eng 1987 9 335
27 Sliter JT Journal (Water Pollution Control Federation) 1974 46 (1) 4
28 Rice RG Ozone and Eng 1997 18 477
29 Staehelin J and Hoigne J Environ Sci Technol 1985 19 1206
30 Hoigne J and Bader H Wat Res 1976 10 377
31 Amy GL Sierka RA Bedessem J Price D Tan L J AWWA 1992 84 67
32 Miltner RJ Shukairy HM Summers R S J AWWA 1992 8452
33 Richardson SD ldquoDrinking water disinfection by-products in Meyers RA Ed The
encyclopedia of environmental analysis and remediationrdquo NY John Wiley and
Sons 1998 3 1398
34 Melin ES and Odegaard H Wat Res 2000 34 4464
35 Kuo ChK J Chromatography A 1998 804 265
36 Schechter DS and Singer PC Ozone Sci Eng 1995 17 53
37 Nawrocki J and Kalkowska I J Water SRT ndash Aqua 1998 47 50
38 Muumlller MB Schmitt D Frimmel F H Env Sci Technol 2000 34 4867
39 Zhu A R and Tsang SC Chem Commun 2002 2044
40 Seddon KR and Stark A Green Chem 2002 2 119
41 Ishii Y Sakagushi S Iwahama T Adv Synth Catal 2001 343 393
42 Snia-Viscosa Hydrocarbon Proc 1977 134 210
43 Garrell T Cohen S Dismukes GC J Mol Catal A 2002 187 3
44 Xie Y and Reckhow DA Ozone Sci Eng 1992 14 269
45 Nawrocki J Swietlik J Raczyk-Stanislawiak U Dabrowska A Bilzor S
Ilecki W Ozone Sci Eng 2003 25 53
46 Zaror CA J Chem Tech Biotechnol 70 21 1997
159
47 Exner O Correlation analysis of chemical data NY Plenum Press 1988
48 Trapido M Veressinina J and Munter R Ozone Sci Eng 1994 16 475
49 Acero JL Haderlein SH Schmidt T Suter MJ-F von Gunten U Environ
Sci Technol 2001 35 4252
50 Hoigne J and Bader H Wat Res 1983 17185
51 Chamarro E Marco A Prado J Esplugas S Sociedad Chilena de Quimica
1996 12 28
52 Jans U and Hoigne J Ozone Sci Eng 1998 20 67
53 Beltran FJ Rivas J Alvarez P Montero de Espinosa R Ozone Sci Eng 2002
24 22
54 Ma J Sui MH Chen ZL Wang LN Ozone Sci Eng 2004 26 3
55 Rivera-Utrilla J and Sanchez-Pollo M Appl Catal B Environ 2002 39 329
56 Rivera-Utrilla J and Sanchez-Polo M Langmuir 2004 20 9217
57 Rivera-Utrilla J and Sanchez-Polo M Mondaca MA Zaror CA J Chem
Technol Biotechnol 2002 77 883
58 Elovitz MS and von Gunten U Ozone Sci Eng 1999 21 239
59 Sanchez-Polo M von Gunten U Rivera-Utrilla J Wat Res 2005 39 3189
60 Hoigne J ldquoChemistry of aqueous ozone and transformation of pollutants by
ozonation and advanced oxidation processes In J Hubrec Editor The handbook
of environmental chemistry quality and treatment of drinking waterrdquo Berlin
Springer 1998
61 Glaze WH and Kang J Int Eng Chem Res 1989 28 1573
62 Meijers RT Oderwald-Muller EJ Nuhm P Kruithof J Ozone Sci Eng 1995
17 673
63 Beltran JB Gonzalez M AcedoB Rivaz FJ J Hazard Mater 2000 B80
189
64 Aeita EM Reagan KM Lang J S McReyonlds L Kang J Glaze WH J
AWWA 1988 80 64
160
65 Karimi AA Redman JA Glaze W H Stolarik GF J Am Water Works
Assoc 1997 89 41
66 Staehelin J and Hoigne J J Environ Sci Technol 1985 19 1206
67 Bigda RJ Chem Eng Prog 1995 91 62
68 Hoigne J and Bader H Ozone Sci and Eng 1979 1 73
69 Hoigne J and Bader H Ozone Sci and Eng 1983 17 173
70 Bell GM Sillaker RO Padgham MDJ and Standring P Xylenes London
health and safety executive Tox Rev 1992 166
71 ECETOC Joint assessment of commodity chemicals No 6 Xylenes 1986
72 Verschueren K Handbook of environmental data on organic chemicals 2nd ed
New York Van Nostrand Reinhold Co 1983 1188
73 Carpenter CP Kinkead ER Geary DL Jr Sullivan LJ and King JM
Toxicol Appl Pharmacol 1975 33 543
74 Health-based recommended occupational exposure limit for xylene The Hague
Directorate-General of Labour 1991
75 IARC Xylene In Some organic solvents resin monomers and related
compounds pigments and occupational exposures in paint manufacture and
painting 1989 47 125
76 Jori A Calamari D Di Domenico A Galli CL Galli E Marinovich M and
Silano V Ecotoxicol Environ Saf 1986 11 44
77 Young PJ and Parker A Waste Manage Res 1983 1 213
78 Wiesenburg DA Bodennec G and Brook JM Bull Environ Contam Toxicol
1981 27 167
79 Barker JF Barbash JE and Labonte M J Contam Hydrol 1988 31
80 Sabel GV and Clark TP Waste Manage Res 1984 2 119
81 Morgan P and Watkinson RJ Water Sci Technol 1990 22 63
82 Kawamura K and Kaplan IR Environ Sci Technol 1983 17 497
83 Davey JF and Gibson DT J Bacteriol 1974 119 923
84 Raymond RL Jamison VW and Hudson JO Appl Microbiol 1969 17 512
85 Jamison VW Raymond RL and Hudson JD Proceeds of the 3rd International
Biodegradation Symposium Allied Science Publishers 1976 187
161
86 Kappeler TH and Wuhrmann K Water Res 1978a 12 327
87 Kappeler TH and Wuhrmann K Water Res 1978b 12 335
88 Tabak HH Desai S and Govind R Proceedings of the 44th Industrial Waste
Conference 1989 405
89 Alvarez PJJ and Vogel TM Appl Environ Microbiol 1991 57 2981
90 Thomas JM Gordy VR Fiorenza S and Ward CH Water Sci Technol
1990 22 53
91 Wilson BH Wilson JT Kampbell DH Bledsoe BE and Armstrong JM
Geomicrobiol J 1990 8 225
92 Kuhn EP Colberg PJ Schnoor JL Wanner O Zehnder AJB and
Schwarzenbach RP Environ Sci Technol 1985 19 961
93 Chiang CY Salanito JP Chai EY Colthart JD and Klein CL Ground
Water 1989 27 823
94 Wilson BH Smith GB and Rees JF Environ Sci Technol 1986 20 997
95 Seyfried B Glod G Schocher R Tschech A and Zeyer J Appl Environ
Microbiol 1994 60(11) 4047
96 Hutchins SR Sewell GW Kovacs DA and Smith GA Environ Sci
Technol 1991a 25 68
97 Hutchins SR Downs WC Wilson JT Smith GB Kovacs DA Fine DD
Douglass RH and Hendrix DJ Ground Water 1991b 29 571
98 Hutchins SR Appl Environ Microbiol 1991 57 2403
99 Edwards EA Willis LE Reinhard M and Grbic-Galic D Appl Environ
Microbiol 1992 58 794
100 Edwards EA and Grbic-Galic D Appl Environ Microbiol 1994 60(1) 313
101 Reinhard M Goodman NL and Barker JF Environ Sci Technol 1984 18
953
102 Kuhn EP Zeyer J Eicher P and Schwarzenbach RP Appl Environ
Microbiol 1988 54 490
103 Major DW Mayfield CI and Barker JF Ground Water 1988 26 8
104 Zeyer J Kuhn EP and Schwarzenbach RP Appl Environ Microbiol 1986
52 944
162
105 Gab S Schmizer J Tham H Parlar H and Korte F Nature (Lond) 1977 270
331
106 Gery MW Fox DL Kaems RM and Stockburger L Environ Sci Technol
1987 21 339
107 Grosjean D J Air Waste Manage Assoc 1990 40 1397
108 Morioka Y J Jpn Soc Envion 1996 19 7
109 Fronk CA Ozone Sci and Eng 1987 9 265
110 Guo C-C Liu Q Wang X-T and Hu H-Y Appl Catal A 2005 282 55
111 Bailey PS ldquoOzonation in Organic Chemistryrdquo Vol 1 Academic Press New
York 1978
112 Bollyky LJ Ozone Sci and Eng 1981 3 181
113 Paillard H and Briner E Helv Chim Acta 1942 25 1528
114 Taube H Trans Faraday Soc 1957 53 656
115 White HM and Bailey PS J Org Chem 1965 3037
116 Kuo PPK Chian ESK and Chang BJ Environ Sci Technol 1977 50 2624
117 Galutkina KA Nemchenko AG and Karazeeva LN Zh Prikl
Khim(Leningrad) 1975 48 1548 J Appl ChemUSSR (Eng Transl) 1975
50 2498
118 Van der Weile K Van den Berg PJ J Catal 1975 39 437
119 Nakano Y Okawa K Nishijima W and Okada M J Jpn Soc Water Environ
2002 25 619
120 Nakano Y Okawa K Nishijima W and Okada M Water Res 2003 37 2495
121 Shishkov VF Verkhodanova NN Egorrsquokov AN Tuturina VV Solid Fuel
Chem 1984 18 31
122 Verkhodanova NN Myakina IA Egorrsquokov AN Shishkov VF
Tuturina VV Solid Fuel Chem 1981 15 48
123 Jans U Hoigne J Activated carbon and carbon black catalyzed transformation of
aqueous ozone into OH radicals Ozone Sci and Eng 1998 20 67 ndash 90
124 Alvarez PM Garcia-Araya JF Beltran FJ Giraldez I Jaramillo J Gomez-
Serrano V Carbon 2006 44 3102
163
125 Pace G Berton A Calligaro L Mantovani A and Uguagliati P J Chrom A
1995 706 350
126 Graham N Chu W and Lau C Chemosphere 2003 51 240
127 Woods RJ and Pikaev AK Applied Radiation Chemistry Radiation
Processing John Wiley and Sons Inc New York (1994)
128 Hyunook K Guisu P Myongjin Y Eunjung K Youngkook H and Colosimo
Mark F Oxidation of Nonylphenol in water using O3 Res J Chem Environ
2007 Vol 11(2) 7 ndash 12
129 Glaze 1980
130 Valdeacutes H Saacutenchez-Polo M Rivera-Utrilla J and Zaror CA Effect of Ozone
Treatment on Surface Properties of Activated Carbon Langmuir 2002 18 2111
131 Hahn J Lachmann G and Pienaar JJ Kinetics and Simulation of the
Decomposition of Ozone in Acidic Aqueous Solutions SAfr J Chem 2002
53(2) 134 ndash 137
132 Chu W and Wong CC A disappearance model for the prediction of
trichlorophenol ozonation Chemosphere 2003 51
133 Shigimitu H The foundation and Application of Ozonation Ourin Ltd Japan
Chapter 2 1995
134 Gomes M Razumovskii SD Zaikov GE Effect of Solvent Polarity on the Rate
of Ozone Reaction with Unsaturated Compounds Int J Chem Kinetics 1984
16 1-5
135 Henry H Zador M and Fliszar S A Quantitative Investigation of the Ozonolysis
Reaction XVIII A Kinetic Study of the Ozone Attack on Phenylethylenes Can
J Chem 1973 51 3398
136 Kurniawan TA Lo WH and Chan GYS Degradation of Recalcitrant
Compounds from Stabilized Landfill Leachate using a Combination of Ozone-
GAC Adsorption Treatment J Haz Materials 2006 447
137 Lampman GM Pavia DL Kriz GS and Vyvyan JR Spectroscopy
International Edition 4th edition 2010 461-483
164
138 Faria PCC Jose JM and Manuel F Mineralization of colored aqueous
solutions by ozonation in the presence of activated carbon Water Res 39 2005
1461
139 Stary FE Emge D E Murray RW J Am Chem Soc 1976 98 1880
140 httpenwikipediaorgwiki2-chloroethanol
141 httpwwwnovazonenettech_ozonehtm298
142 httpwwwlenntechcomozoneozone-propertieshtm298
143 Bailey PS ldquoOzonation in Organic Chemistryrdquo Academic Press New York Vol
2 1982
144 Langlais B Reckhow DA Brink DR Introduction In ldquoOzone in Water
Treatment Application and Engineeringrdquo Chelsea Michigan Lewis Publishers
317 1991
145 Langlais B Bellamy WD Damez F Moneiel A Rakness KL Reckhow DA
Robson CM Engineering aspects In ldquoOzone in Water Treatment Application
and Engineeringrdquo Chelsea Michigan Lewis Publishers 8 1991
146 Cooper C and Burch R An Investigation of Catalytic Ozonation for the
Oxidation of Halocarbons in Drinking Water Preparation Wat Res Vol 33 No
18 3695-3700 1999
147 von Gunten U Ozonation of drinking water Part 1 Oxidation kinetics and
product formation Wat Res Vol 37 1445 2003
148 Staehelin J and Hoigneacute J Decomposition of ozone in water rate of initiation by
hydroxide ions and hydrogen peroxide Environ Sci Technol 16 679 1982
149 Rajasekhar Pullabhotla V S R Southway C and Jonnalagadda S B Springer
Science+Business Media 2008
150 httpwwwozoneapplicationscominfoozone_corona_dischargehtm299
151 Faria PCC Oacuterfatildeo JJM and Pereira MFR Catalytic ozonation of sulfonated
aromatic compounds in the presence of activated carbon App Cat B Environ
83 150-159 2008
152 Beltraacuten F J Ovejero G Encinar J M and Rivas J Ind Eng Chem Res 34
1596 1995
153 Pryor WA Giamalva D and Church DF J Am Chem Soc 105 6858 1983
165
154 Vogal A ldquoTextbook of Quantitative Inorganic Analysisrdquo 4th Ed Longman 379
1978 Rakness K Gordon G Langlais B Masschelein W Matsumoto N
Richard Y Robson CM and Somiya I Ozone Sci Eng 8 209 1996
155 ldquoDioxin Digestrdquo ndash Volume 4 Issue 1 Jan 1999
156 McKay G and McAleavey G Chem Eng Res Des 66 532 1988
157 Kainulainen TK Tuhkanen TA Vartiainen TK and Kalliokoski Ozone Sci
Eng 17 449 1995
158 Cannon FS Dusenbury J Paulsen PD Singh J Mazyck DW and Maurer
DJ Ozone Sci Eng 18 417 1996
159 Croll BT Ozone Sci Eng 18 19 1996
160 Zaror CA J Chem Tech Biotechnol 70 21 1997
166
Figure A30 Chromatogram of pure m-xylene before ozonation
Figure A31 Chromatogram of pure m-xylene after 12 h ozonation
167
Figure A32 Mass spectrum of m-xylene
Figure A33 Mass Spectrum of 3-methylbenzaldehyde
CH3
CH3
CH3
HC
O
168
Figure A34 Mass spectrum of 3-methylbenzoic acid
Figure A35 Mass spectrum formic acid
C
CH3
OHO
C OHH
O
169
4000
036
0032
0028
0024
0020
0018
0016
0014
0012
0010
0080
060
040
00
0051015202530354045505560657075808590
973
cm-1
T
3016
10
2921
36
2863
94
2731
60
2343
00
1931
98 18
537
11773
86
1654
35
1613
50
1592
12 14
920
2
1460
2013
766
1
1170
00 10
942
8
1039
67
904
45
875
94
768
89724
87
691
08
665
55
439
96
Figu
re A
36
FTIR
spe
ctru
m o
f pur
e m
-xyl
ene
befo
re o
zona
tion
170
4000
036
0032
0028
0024
0020
0018
0016
0014
0012
0010
0080
060
040
00
00510152025303540455055606570758085
907
cm-1
T
3016
18
2922
83
2862
87
2731
85
2627
07
2556
7523
365
419
327
9 1853
17 17
734
2
1715
6516
134
2
1591
93 14
919
3
1458
6013
765
31289
68
1249
86
1214
62
1169
9610
944
2
1040
18
904
74
876
43
769
21691
47
665
14626
04
455
87
Figu
re A
37
FTIR
spe
ctru
m o
f m-x
ylen
e af
ter 1
2 ho
urs
ozon
atio
n
171
Figu
re A
38
1 H N
MR
spe
ctru
m o
f 3-m
ethy
lben
zyl a
lcoh
ol
172
Figu
re A
39
1 H N
MR
spe
ctru
m o
f 3-m
ethy
lben
zoic
aci
d
173
Figure A40 Chromatogram of 2-chloroethanol before ozonation
Figure A41 Chromatogram of 2-chloroethanol after 18 hours ozonation
174
Figu
re A
42
1 H N
MR
spe
ctru
m o
f ace
tald
ehyd
e
175
Figure A43 Mass spectrum of acetic acid
CH3 C
O
OH
176
4000
036
0032
0028
0024
0020
0018
0016
0014
0012
0010
0080
060
038
00
509556065707580859095
100
3
cm-1
T
2-ch
loro
etha
nol P
ure
3333
89
2961
38
1430
31
1298
36
1252
45 11
641
6 1071
02
1027
5293
853
848
28
747
39
658
84
472
66
Figu
re A
44
FTIR
spe
ctru
m o
f 2-c
hlor
oeth
anol
bef
ore
ozon
atio
n
177
4000
036
0032
0028
0024
0020
0018
0016
0014
0012
0010
0080
060
038
00
59062646668707274767880828486889092949698
999
cm-1
T
2-ch
loro
etha
nol 1
8hrs
3378
97
2963
06
1723
89
1431
47
1299
94
1169
76
1071
59 1026
78
937
56
848
49
747
47
660
18
473
91
Figu
re A
45
FTIR
spe
ctru
m o
f 2-c
hlor
oeth
anol
afte
r 18
hour
s
ozon
atio
n

OZONE INITIATED OXIDATION OF ORGANIC POLLUTANTS M-XYLENE AND 2-CHLOROETHANOL
by
ASOGAN NOKAN GOUNDEN
Submitted in fulfilment of the academic requirements for the degree of
MASTER IN SCIENCE
in the School of Chemistry
Faculty of Science and Agriculture
University of KwaZulu-Natal
Durban
Supervisor Professor S B Jonnalagadda
2010
ABSTRACT
A variety of hazardous organic compounds are present in leachate from landfill sites that
accept medical and industrial chemical waste Most of these compounds find their way
into nearby streams rivers and dams posing a threat to the ecosystem In the present
work two hazardous organic compounds namely m-xylene and 2-chloroethanol were
chosen to react with ozone gas at different experimental conditions
The ozone initiated oxidation of m-xylene and 2-chloroethanol in solvent free conditions
were investigated as a function of time Gas chromatographic analysis of ozonated
m-xylene showed an increase in the conversion of substrate from about 1 after 3 hours
to about 14 after 24 hours Some of the ozonation products identified were formic acid
acetic acid 3-methylbenzylalcohol 3-methylbenzaldehyde and 3-methylbenzoic acid
The presence of acetic acid ethyl acetate or acetone during ozonation significantly
improved the percent conversion of m-xylene relative to similar products obtained under
solvent free conditions The presence of activated charcoal during ozonation of m-xylene
showed marginal improvement in percent conversion compared to solvent free ozonation
The oxidation of 2-chloroethanol was followed by monitoring the consumption of the
halogenated organic substrate which showed an increase in conversion from about 2
after 3 hours to about 46 after 12 hours Ozonated products contained a mixture of
acetaldehyde and acetic acid It was also found that the ozonation of 2-chloroethanol
yielded quantitative amounts of chloride ions The percent conversion of 2-chloroethanol
in the presence of acetic acid and ethyl acetate were higher than those under solvent free
conditions The use of activated charcoal during ozonolysis of 2-chloroethanol showed a
significant increase in percent conversion of the substrate Since 2-chloroethanol has a
higher solubility in water than m-xylene the effects of solution pH activated charcoal and
hydrogen peroxide on ozone initiated reactions were studied Solutions of
2-chloroethanol maintained at pH level 4 and 7 showed marginal changes in percent
conversion compared to ozonation alone however percent conversion improved
significantly when the pH of the solution was increased to 10 The ozonation of
2-chloroethanol in the presence of 5 hydrogen peroxide in water at pH levels 4 and 7
showed marginal changes in percent conversion compared to ozonation alone however
percent conversion and product yields improved significantly when the pH of the
solution was increased to 10 Increasing the strength of the hydrogen peroxide in the
reaction mixture from 5 to 10 had very little effect in the percent conversion of
2-chloroethanol and product formation
Based on the experimental findings the overall reaction mechanism for the reaction of
both m-xylene and 2-chloroethanol with ozone is described
DECLARATION
I Asogan Nokan Gounden declare that
1 The research reported in this thesis except where otherwise indicated is my
original research
2 The thesis has not been submitted for any degree or examination at any other
university
3 This thesis does not contain other personsrsquo data pictures graphs or other
information unless specifically acknowledged as being sourced from other
personsrsquo
4 This thesis does not contain other personsrsquo writing unless specifically
acknowledged as being sourced from other researchers Where other written
sources have been quoted then
a Their words have been re-written but the general information attributed to them
has been referenced
b Where their exact words have been used then their writing has been placed in
italics and inside quotation marks and referenced
5 The thesis does not contain text graphics or tables copied and pasted from the
internet unless specifically acknowledged and the source being detailed in the
thesis and in the References sections
PREFACE
The experimental work described in this thesis was carried out in the Department of
Analytical Chemistry Faculty of Natural Science Mangosuthu University of
Technology Umlazi and at the School of Chemistry University of KwaZulu-Natal
Westville Campus from June 2006 to December 2009 under the supervision of Professor
SB Jonnalagadda
These studies represent original work by the author and have not otherwise been
submitted in any form for any degree or diploma to any tertiary institution Where use has
been made of the work of others it is duly acknowledged in the text
_______________________ _________________
Asogan Nokan Gounden Date
ACKNOWLEDGEMENTS
I express my sincere thanks and appreciation to the following people
Professor SB J onnalagadda fo r his expert guidance and inspi ration dur ing thi s
study I have been fortunate to be blessed with a mentor of his caliber
Dr MM Shapi for his support e ncouragement and c onstructive su ggestions
during the difficult times
The inst rument laboratory staff of th e S chool of C hemistry (UKZN-Westville
Campus) especially Ani ta Naidoo and staf f for the use of the GC-MS LC-MS
and FTIR instruments
The labor atory staff o f Mang osuthu University of Te chnology Chemistry
Department for their support and assistance
Mr Dilip fr om the NMR unit (U KZN ndash Westville C ampus) for the use a nd
assistance with NMR spectra studies
The University of KwaZulu-Natal and Mangosuthu University of Technology for
financial assistance
My wife Saraspathy daughter Jayandree and son Kaylin for their encouragement
and patience during my years of study
PRESENTATION AT CONFERENCES
1 Poster presentation entitled ldquoOzone Initiated Oxidation of m-Xylenerdquo at the 40th
National Convention of the South African Chemical Institute Cape Town South
Africa December 2008
CONTENTS
Page Number
LIST OF FIGURES i
LIST OF TABLES ix
LIST OF SCHEMES xiii
ABBREVIATIONS xiv
CHAPTER 1
INTRODUCTION AND LITERATURE SURVEY
10 Introduction 1
11 Occurrence and uses of xylene 2
12 Properties of xylene 3
13 Xylene in the environment 4
14 Transformation of xylene 6
141 Biodegradation of xylenes 6
1411 Aerobic biodegradation 6
1412 Anaerobic biodegradation 8
142 Abiotic Degradation 11
4121 Photolysis 11
4122 Atmospheric Oxidation 11
143 Biofiltration 11
15 Occurrence of halogenated organic compounds 13
16 Properties of 2-chloroethanol 14
17 Transformation of 2-chloroethanol 15
18 Oxidation of organic compounds 17
19 Properties of ozone 23
110 History of ozone-organic chemistry 25
111 Types of ozone attack 29
112 Aqueous ozonation chemistry 32
113 Motivation for the study 36
114 Hypothesis 36
115 Objectives of the study 37
CHAPTER 2
EXPERIMENTAL METHODS
20 Introduction 38
21 Ozonation experiments 39
22 Ozonation of m-xylene and 2-chloroethanol 41
23 Ozonation of m-xylene and 2-CE in the presence of organic solvents 41
231 Ozonation of m-xylene and 2-CE in acetic acid and ethyl acetate 42
2311 Ozonation of m-xylene and 2-CE in the presence of 5 acetic acid 42
2312 Ozonation of m-xylene and 2-CE in the presence of 20 acetic acid 43
24 Ozonation of m-xylene in the presence of AA in an aqueous medium 43
241 Ozonation of 1 m-xylene in the presence of AA and acetone 44
242 Ozonation of 1 m-xylene in AA and acetone in the presence of water 44
25 Ozonation of m-xylene in the presence of activated carbon 45
26 GC-MS analysis 45
27 Gas chromatography analysis 46
28 Extraction of carboxylic acids from product mixture 46
29 FTIR analysis 47
210 Calculation of conversion of substrate molecule after ozonation 48
211 Calculation of selectivity and yield of products after ozonation 49
CHAPTER 3
OZONE INITIATED OXIDATION OF M-XYLENE
30 Introduction 51
31 Calibration of ozone generator 51
32 Oxidation of m-xylene under solvent free conditions 52
33 Product characterization for ozonation of pure m-xylene 53
331 GC-MS analysis of m-xylene and product mixture 53
332 FTIR analysis of product mixture 55
333 Analysis of isolated products by 1H NMR 55
34 Ozonation of m-xylene in the presence of organic solvents 59
341 Effect of acetic acid on ozonation of m-xylene 60
342 Comparison of data for ozone initiated oxidation of m-xylene in AA 64
343 Effect of ethyl acetate on ozonation of m-xylene 68
344 Comparison of data for ozone initiated oxidation of m-xylene in EA 73
345 Ozonation of 1 m-xylene in EA 76
35 Effect of activated charcoal on ozonation of m-xylene 79
351 Comparison of data for ozone initiated oxidation of m-xylene in
the presence of activated charcoal 82
36 Ozonation of 1 m-xylene in the presence of water 85
37 Reaction sequence for m-xylene ozonation 88
CHAPTER 4
OZONE INITIATED OXIDATION OF 2-CHLOROETHANOL
40 Introduction 91
41 Product identification for ozonation of 2-chloroethanol 91
411 Chloride and Conductivity analysis of product mixture 92
412 Analysis of the product mixture by 1H NMR 92
413 Analysis of the product mixture by GC-MS 92
414 Analysis of the product mixture by FTIR 93
42 Oxidation of 2-chloroethanol under solvent free conditions 93
43 Ozone initiated oxidation of 2-CE in the presence of organic solvents 97
431 Effect of acetic acid on ozonation of 2-chloroethanol 97
432 Comparison of data for ozonation of 2-CE in the presence of AA 103
433 Effect of ethyl acetate on ozonation of 2-chloroethanol 106
434 Comparison of data for ozonation of 2-CE in the presence of EA 111
44 Effect of activated charcoal on ozonation of 2-chloroethanol 114
441 Comparison of data for ozonation of 2-CE in the presence of
activated charcoal 117
45 Ozone initiated oxidation of 2-chloroethanol in aqueous medium 121
451 Effect pH on the ozonation of 2-chloroethanol 122
452 Comparison of data for ozone initiated oxidation of 2-CE at different
pH levels 126
46 Effect of activated charcoal on the ozonation of 2-CE in water 130
461 Comparison of data for ozone initiated oxidation of an aqueous solution
of 2-CE in the presence of activated charcoal 134
47 Effect of hydrogen peroxide on ozonation of 2-CE in water 138
471 Comparison of data for ozone initiated oxidation of an aqueous solution
of 2-CE in the presence of hydrogen peroxide 146
48 Reaction pathway for ozonation of 2-chloroethanol 151
CHAPTER 5
CONCLUSIONS
50 Conclusions 153
51 Ozonation of m-xylene 153
52 Ozonation of 2-chloroethanol 154
53 Future work 155
REFERENCES 157
APPENDIX 166
i
LIST OF FIGURES
Page Number
Figure 11 Isomers of xylene 4
Figure 12 Canonical forms of the ozone molecule 24
Figure 13 List of functional groups that can be readily attacked by ozone 31
Figure 14 Ozonation of aromatic compounds 32
Figure 20 Schematic of a corona discharge unit showing how ozone is generated 39
Figure 21 Schematic of experimental apparatus for ozonation reactions 40
Figure 30 Percent conversion of m-xylene and product selectivity versus
ozonation time 57
Figure 31 Percent yield of products versus ozone treatment time 58
Figure 32 Percent conversion of m-xylene and selectivity profiles of product
formation versus ozonation time (m-xylene with 5 acetic acid) 61
Figure 33 Percent conversion of m-xylene and selectivity profiles of product
formation versus ozonation time (m-xylene with 20 acetic acid) 63
Figure 34 Comparison of percent conversion of m-xylene and m-xylene in
acetic acid versus ozonation time 65
Figure 35 Comparison of percent yield of 3-MBAlc formed during ozonation
of m-xylene and m-xylene in acetic acid versus time 66
Figure 36 Comparison of percent yield of 3-MBAlde formed during ozonation
of m-xylene and m-xylene in acetic acid versus time 66
Figure 37 Comparison of percent yield of 3-MBAcid formed during ozonation
of m-xylene and m-xylene in acetic acid versus time 67
ii
Figure 38 Comparison of percent yield of ldquootherrdquo products formed during
ozonation of m-xylene and m-xylene in acetic acid versus time 67
Figure 39 Percent conversion of m-xylene and selectivity profiles of product
formation versus ozonation time (m-xylene with 5 ethyl acetate) 69
Figure 310 Percent conversion of m-xylene and selectivity profiles of product
formation versus ozonation time (m-xylene with 20 ethyl acetate) 71
Figure 311 Comparison of percent conversion of m-xylene and m-xylene in ethyl
acetate versus ozonation time 73
Figure 312 Comparison of percent yield of 3-MBAlc formed during ozonation of
m-xylene and m-xylene in ethyl acetate versus time 74
Figure 313 Comparison of percent yield of 3-MBAlde formed during ozonation of
m-xylene and m-xylene in ethyl acetate versus time 74
Figure 314 Comparison of percent yield of 3-MBAcid formed during ozonation of
m-xylene and m-xylene in ethyl acetate versus time 75
Figure 315 Comparison of percent yield of ldquootherrdquo products formed during
ozonation of m-xylene and m-xylene in ethyl acetate versus time 75
Figure 316 Percent conversion of m-xylene and selectivity profiles of product
formation for ozonation of 1 m-xylene in ethyl acetate versus time 77
Figure 317 Percent conversion of m-xylene and selectivity profiles of product
formation versus ozonation time (m-xylene with 1 g activated charcoal) 80
Figure 318 Comparison of percent conversion of m-xylene and m-xylene with
activated charcoal versus ozonation time 82
Figure 319 Comparison of percent yield of 3-MBAlc formed during ozonation of
m-xylene and m-xylene in the presence of activated charcoal 83
iii
Figure 320 Comparison of percent yield of 3-MBAlde formed during ozonation of
m-xylene and m-xylene in the presence of activated charcoal 83
Figure 321 Comparison of percent yield of 3-MBAcid formed during ozonation of
m-xylene and m-xylene in the presence of activated charcoal 84
Figure 322 Comparison of percent yield of ldquootherrdquo products formed during
ozonation of m-xylene and m-xylene with activated charcoal 84
Figure 323 Comparison of percent conversion of m-xylene in 100 acetic acid
and 70 30 ratio acetic acid water versus ozonation time 86
Figure 324 Comparison of percent conversion of m-xylene in 100 and
70 30 ratio acetone water versus ozonation time 88
Figure 40 Percent conversion of 2-CE and product selectivity versus ozonation
time 94
Figure 41 Chloride ion content and solution conductivity of ozonated 2-CE
versus time 95
Figure 42 Percentage yield of AcAlde AA and unknown product versus
ozonation time 96
Figure 43 Percent conversion of 2-chloroethanol in the presence of 5 acetic
acid and selectivity profile of products versus ozonation time 98
Figure 44 Percent conversion of 2-chloroethanol in the presence of 20 acetic
acid and selectivity profile of products versus ozonation time 101
Figure 45 Comparison of 2-chloroethanol conversion with and without the
presence of acetic acid versus ozonation time 103
Figure 46 Comparison of selectivity for AcAlde and AA formed during the
ozonation of 2-chloroethanol with and without the presence of acetic
acid versus time 104
iv
Figure 47 Comparison of yield of AcAlde and AA formed during the ozonation
of 2-chloroethanol with and without the presence of acetic acid
versus time 105
Figure 48 Comparison of chloride ion formed during the ozonation of 2-CE
with and without the presence of acetic acid versus time 106
Figure 49 Percent conversion of 2-CE in the presence of 5 ethyl acetate
and selectivity profile for products as a function of ozonation time 107
Figure 410 Percent conversion of 2-CE in the presence of 20 ethyl acetate
and selectivity profile of products as a function of ozonation time 109
Figure 411 Comparison of 2-chloroethanol conversion with and without the
presence ethyl acetate versus ozonation time 111
Figure 412 Comparison of selectivity for AcAlde and AA formed during the
ozonation of 2-CE with and without the presence of ethyl acetate
versus time 112
Figure 413 Comparison of yield of AcAlde and AA formed during the ozonation
of 2-CE with and without the presence of ethyl acetate versus time 113
Figure 414 Comparison of chloride ion formed during the ozonation of 2-CE
with and without the presence of ethyl acetate versus time 114
Figure 415 Percent conversion of 2-chloroethanol in the presence of activated
charcoal and selectivity profile for products as a function of
ozonation time 116
Figure 416 Comparison of percent conversion of 2-chloroethanol with and
without the presence of activated charcoal versus ozonation time 118
Figure 417 Comparison of selectivity for AcAlde and AA formed during the
ozonation of 2-CE with and without the presence of activated
charcoal versus time 119
v
Figure 418 Comparison of yield of AcAlde and AA formed during the ozonation
of 2-CE with and without the presence of activated charcoal 119
Figure 419 Comparison of chloride ions formed during the ozonation of 2-CE
with and without the presence of activated charcoal versus time 120
Figure 420 Percent conversion of 10 2-CE in water at pH 4 and selectivity
profiles of AcAlde AA and unknown versus ozonation time 123
Figure 421 Percent conversion of 10 2-CE in water at pH 7 and selectivity
profiles of AcAlde AA and unknown versus ozonation time 124
Figure 422 Percent conversion of 10 2-CE in water at pH 10 and selectivity
profiles of AcAlde AA and unknown versus ozonation time 126
Figure 423 Comparison of percent conversion of 10 2-CE in water at pH 4 7
and 10 versus ozonation time 127
Figure 424 Comparison of selectivity for AcAlde and AA formed during the
ozonation of 10 2-CE in water at pH 4 7 and 10 versus time 128
Figure 425 Comparison of yield of AcAlde and AA formed during the ozonation
of 10 2-CE in water at pH 4 7 and 10 versus time 128
Figure 426 Comparison of chloride ions formed during the ozonation of 10
2-CE in water at pH 4 7 and 10 versus time 129
Figure 427 Percent conversion of 10 2-CE in the presence of activated charcoal
in water at pH 4 and selectivity profile of products versus time 131
Figure 428 Percent conversion of 10 2-CE in the presence of activated charcoal
in water at pH 7 and selectivity profile of products versus time 132
Figure 429 Percent conversion of 10 2-CE in the presence of activated charcoal
in water at pH 10 and selectivity profile of products versus time 133
vi
Figure 430 Comparison of percent conversion of 2-CE versus ozonation time
(10 2-CE + 1 g activated charcoal in water at pH 4 7 and 10) 134
Figure 431 Comparison of yield of AcAlde and AA formed during the ozonation
of 1 g charcoal and 10 2-CE in water at pH 4 versus time 135
Figure 432 Comparison of yield of AcAlde and AA formed during the ozonation
of 1 g charcoal and 10 2-CE in water at pH 7 versus time 136
Figure 433 Comparison of yield of AcAlde and AA formed during the ozonation
of 1 g activated charcoal and 10 2-CE in water at pH 10 versus time 136
Figure 434 Comparison of chloride ions formed during the ozonation of 1 g
charcoal and 10 2-CE in water at pH 4 7 and 10 versus time 137
Figure 435 Percent conversion of 10 2-CE in the presence of 5 H2O2 in water
at pH 4 and selectivity profile of products versus ozonation time 139
Figure 436 Percent conversion of 10 2-CE in the presence of 5 H2O2 in water
at pH 7 and selectivity profile of products versus ozonation time 140
Figure 437 Percent conversion of 10 2-CE in the presence of 5 H2O2 in water
at pH 10 and selectivity profile of products versus ozonation time 141
Figure 438 Percent conversion of 10 2-CE in the presence of 10 H2O2 in water
at pH 4 and selectivity profile of products versus ozonation time 143
Figure 439 Percent conversion of 10 2-CE in the presence of 10 H2O2 in water
at pH 7 and selectivity profile of products versus ozonation time 144
Figure 440 Percent conversion of 10 2-CE in the presence of 10 H2O2 in water
at pH 10 and selectivity profile of products versus ozonation time 145
Figure 441 Comparison of percent conversion of 2-CE with and without the
presence of H2O2 (10 2-CE + 5 H2O2 in water at pH 4) 146
vii
Figure 442 Comparison of percent conversion of 2-CE with and without the
presence of H2O2 (10 2-CE + 5 H2O2 in water at pH 7) 146
Figure 443 Comparison of percent conversion of 2-CE with and without the
presence of H2O2 (10 2-CE + 5 H2O2 in water at pH 10) 147
Figure 444 Comparison of percent yield of AcAlde and AA formed with and
without the presence of H2O2 (10 2-CE + H2O2 in water at pH 4) 148
Figure 445 Comparison of percent yield of AcAlde and AA formed with and
without the presence of H2O2 (10 2-CE + H2O2 in water at pH 7) 148
Figure 446 Comparison of percent yield of AcAlde and AA formed with and
without the presence of H2O2 (10 2-CE + H2O2 in water at pH 10) 149
Figure 447 Comparison of parts per million chloride ion formed with and without
the presence of H2O2 (10 2-CE + H2O2 in water at pH 4) 150
Figure 448 Comparison of parts per million chloride ion formed with and without
the presence of H2O2 (10 2-CE + H2O2 in water at pH 7) 150
Figure 449 Comparison of parts per million chloride ion formed with and without
the presence of H2O2 (10 2-CE + H2O2 in water at pH 10) 151
Figure A30 Chromatogram of pure m-xylene before ozonation 166
Figure A31 Chromatogram of pure m-xylene after 12 h ozonation 166
Figure A32 Mass spectrum of m-xylene 165
Figure A33 Mass Spectrum of 3-methylbenzaldehyde 167
Figure A34 Mass spectrum of 3-methylbenzoic acid 168
Figure A35 Mass spectrum formic acid 168
Figure A36 FTIR spectrum of pure m-xylene before ozonation 169
Figure A37 FTIR spectrum of m-xylene after 12 hours ozonation 170
viii
Figure A38 1H NMR spectrum of 3-methylbenzyl alcohol 171
Figure A39 1H NMR spectrum of 3-methylbenzoic acid 172
Figure A40 Chromatogram of 2-chloroethanol before ozonation 173
Figure A41 Chromatogram of 2-chloroethanol after 18 hours ozonation 173
Figure A42 1H NMR spectrum of acetaldehyde 174
Figure A43 Mass spectrum of acetic acid 175
Figure A44 FTIR spectrum of 2-chloroethanol before ozonation 176
Figure A45 FTIR spectrum of 2-chloroethanol after 18 hours ozonation 177
ix
LIST OF TABLES
Page Number
Table 11 Physical and Chemical Properties of Xylenes 3
Table 12 Physical and Chemical Properties of 2-Chloroethanol 15
Table 13 Comparative reduction potentials measured at 25 oC 16
Table 14 Some organic compounds that can be oxidized by bullOH radicals 18
Table 15 Important physical constants of ozone 24
Table 20 GC-MS method and instrument parameters 46
Table 21 GC method and instruments parameters 46
Table 30 Ozone concentration data obtained at different oxygen flow rates and
currents measured at 25 oC 52
Table 31 Percent conversion of m-xylene and selectivity data for the ozone
initiated oxidation of m-xylene as a function of time 56
Table 32 Percent yield of identified products for the ozone initiated oxidation
of m-xylene as a function of time 58
Table 33 Percent conversion and selectivity data for the ozone initiated oxidation
of m-xylene in the presence of 5 acetic acid as a function of time 60
Table 34 Percent yield of identified products for the ozone initiated oxidation
of m-xylene in the presence of 5 acetic acid as a function of time 62
Table 35 Percent conversion and selectivity data for the ozone initiated oxidation
of m-xylene in the presence of 20 acetic acid as a function of time 62
Table 36 Percent yield of identified products for the ozone initiated oxidation
of m-xylene in the presence of 20 acetic acid as a function of time 63
x
Table 37 Percent conversion and selectivity data for the ozone initiated oxidation
of m-xylene in the presence of 5 ethyl acetate as a function of time 69
Table 38 Percent yield of identified products for the ozone initiated oxidation
of m-xylene in the presence of 5 ethyl acetate as a function of time 70
Table 39 Percent conversion and selectivity data for the ozone initiated
oxidation of m-xylene with 20 ethyl acetate as a function of time 71
Table 310 Percent yield of identified products for the ozone initiated oxidation
of m-xylene with 20 ethyl acetate as a function of time 72
Table 311 Percent conversion and selectivity data for the ozone initiated oxidation
of 1 m-xylene in the presence of ethyl acetate as a function of time 77
Table 312 Percent conversion and selectivity data for the ozone initiated oxidation
of m-xylene in the presence of activated charcoal as a function of time 79
Table 313 Percent yield of identified products for the ozone initiated oxidation
of m-xylene in the presence of activated charcoal as a function of time 81
Table 314 Percent conversion of m-xylene in 100 and 70 acetic acid as a
function of ozone treatment time 86
Table 315 Percent conversion of m-xylene in 100 and 70 acetone as a
function of ozone treatment time 87
Table 40 Percent conversion of 2-CE and product selectivity data for the ozone
initiated oxidation of 20 mL 2-CE as a function of time 94
Table 41 Solution conductivity chloride ion content and product yields for the
ozonation of 2-CE as a function of time 95
Table 42 Percent conversion and product selectivity data for the ozone initiated
oxidation of 2-CE in 5 acetic acid as a function of time 97
xi
Table 43 Solution conductivity chloride ion content and product yields for the
ozonation of 2-CE in 5 acetic acid as a function of time 99
Table 44 Percent conversion and product selectivity data for the ozone initiated
oxidation of 2-CE in 20 acetic acid as a function of time 100
Table 45 Solution conductivity chloride ion content and product yields for the
ozonation of 2-CE in 20 acetic acid as a function of time 102
Table 46 Percent conversion and product selectivity data for the ozone initiated
oxidation of 2-CE in 5 ethyl acetate as a function of time 107
Table 47 Solution conductivity chloride ion content and product yields for the
ozonation of 2-CE in 5 ethyl acetate as a function of time 108
Table 48 Percent conversion and selectivity data for the ozone initiated oxidation
of 2-CE in 20 ethyl acetate as a function of time 109
Table 49 Solution conductivity chloride ion content and product yields for the
ozonation of 2-CE in 20 ethyl acetate as a function of time 110
Table 410 Percent conversion and product selectivity for the ozonation of 2-CE
in the presence of charcoal as a function of time 115
Table 411 Solution conductivity chloride ion content and product yields for
ozonation of 2-CE in the presence of charcoal as a function of time 117
Table 412 Conversion and selectivity data for ozonation of 10 2-CE in water
at pH 4 as a function of time 122
Table 413 Conversion and selectivity data for ozonation of 10 2-CE in water
at pH 7 as a function of time 124
Table 414 Conversion and selectivity data for ozonation of 10 2-CE in water
at pH 10 as a function of time 125
xii
Table 415 Conversion and selectivity data for ozonation of 10 2-CE and
charcoal in water at pH 4 as a function of time 130
Table 416 Conversion and selectivity data for ozonation of 10 2-CE and
charcoal in water at pH 7 as a function of time 131
Table 417 Conversion and selectivity data for ozonation of 10 2-CE and
charcoal in water at pH 10 as a function of time 133
Table 418 Conversion and selectivity data for ozonation of 10 2-CE and
5 H2O2 in water at pH 4 as a function of time 139
Table 419 Conversion and selectivity data for ozonation of 10 2-CE and
5 H2O2 in water at pH 7 as a function of time 140
Table 420 Conversion and selectivity data for ozonation of 10 2-CE and
5 H2O2 in water at pH 10 as a function of time 141
Table 421 Conversion and selectivity data for ozonation of 10 2-CE and
10 H2O2 in water at pH 4 as a function of time 142
Table 422 Conversion and selectivity data for ozonation of 10 2-CE and
10 H2O2 in water at pH 7 as a function of time 143
Table 423 Conversion and selectivity data for ozonation of 10 2-CE and
10 H2O2 in water at pH 10 as a function of time 145
xiii
LIST OF SCHEMES
Page Number
Scheme 10 Initiation of a chain oxidation of an organic compound with the
hydroxyl radical 17
Scheme 11 The Harries mechanism 26
Scheme 12 The Staudinger mechanism 27
Scheme 13 The Criegee mechanism 28
Scheme 14 13-dipolar cycloaddition of ozone to a double bond 29
Scheme 15 Electrophilic reaction of ozone with aromatic compounds 30
Scheme 16 Decomposition of ozone in aqueous solution by hydroxyl ions 33
Scheme 17 Decomposition of ozone in aqueous solution by hydroxyl radicals 34
Scheme 18 Effect of scavengers on the decomposition of ozone in water 35
Scheme 20 Generation of ozone by corona discharge 38
Scheme 21 Mechanism showing the extraction of 3-methylbenzoic acid from the
12 hour ozonated reaction mixture 47
Scheme 30 General pathway for the reaction of m-xylene with ozone 88
Scheme 31 Proposed mechanism for 3-methylbenzaldehyde ozonation 89
Scheme 32 13 Dipolar cycloaddition of m-xylene 90
Scheme 40 Proposed radical type reaction pathway for the ozonation of 2-CE in
H2O or H2O H2O2 system 152
xiv
ABBREVIATIONS
AA Acetic Acid
AcAlde Acetaldehyde
3-MBAlc 3-Methylbenzyl Alcohol
3-MBAlde 3-Methylbenzaldehyde
3-MBAcid 3-Methylbenzoic Acid
2-CE 2-Chloroethanol
H2O2 Hydrogen Peroxide
FTIR Fourier Transform Infrared
GC Gas Chromatography
GC-MS Gas Chromatography - Mass Spectroscopy
LC-MS Liquid Chromatography - Mass Spectroscopy
1H-NMR Proton Nuclear Magnetic Resonance
PAH Polyaromatic Hydrocarbon
1
10 Introduction
Economic considerations continue to maintain landfills as the most attractive option for
domestic and industrial waste disposal1 Alternative methods to landfilling such as
incineration and composting produce ash and slag fractions which ultimately need to be
landfilled23 Despite the evolution of landfill technology from open uncontrolled dumps
to highly engineered facilities designed to eliminate or minimize the potential adverse
impact on the waste on our environment the generation of toxic contaminated leachate
remains an inevitable consequence of the practice of waste disposal in landfills Leachate
is formed when the refuse moisture content exceeds its field capacity which is defined as
the maximum moisture that can be retained in a porous medium without downward
percolation4 There are many factors such as seasonal weather variations landfilling
techniques phase sequencing piling and compaction methods etc that relate to the
quality and quantity of the leachate formed at landfills5 Organic and inorganic
contaminants of landfill leachates are released from waste due to successive biological
chemical and physical processes67 Also refuse type and composition pretreatment
biological stage age and structure of the landfill has an influence to the amount and
composition of leachates at a landfill site8
Industrial landfill leachate is heavily contaminated with volatile and non-volatile organic
compounds and characterized by the presence of substantial quantities of difficult-to-treat
and ldquohardrdquo COD (the chemical oxygen demand) compounds Some of these are miscible
while a few pollutants are immiscible9 Studies from developed countries have confirmed
the presence of hazardous organic contaminants such as phthalate compounds phenolics
pesticides volatile compounds such as benzene toluene ethylene and xylene (BTEX)
polyaromatic hydrocarbons (PAHrsquos) and polychlorinated biphenyls (PCBrsquos) in
municipal landfill leachate101112 These hazardous organic compounds are primarily
leached out from the waste material disposed into the dumpsite They might also be the
by-products and end-products of various biochemical processes occurring naturally
within the dump or the result of open burning activity in the dumping grounds8
2
Most of these compounds find their way into nearby streams rivers and dams posing a
threat to aquatic and human life In this research m-xylene and 2-chloroethanol were
chosen as the model PAH and organochlorine compounds respectively
11 Occurrence and uses of xylene
Xylene is among the 30 most abundantly produced chemical in the United States The
estimated world production in 1984 was 154 million tones It occurs mainly in petroleum
products coal tar paints and varnishes is a known toxic substance Commercial grade
xylene contains a mixture of all three isomers with meta-xylene predominating usually
60 ndash 70 The technical product ldquomixed xylenesrdquo contains approximately 40 meta-
xylene and 20 each of ethylbenzene ortho-xylene and para-xylene Small quantities of
toluene and C9 aromatic fractions may also be present Before 1940 virtually all of the
aromatic solvents including xylene were produced from coal Thereafter production of
xylene from petroleum started Most mixed xylene is currently produced by catalytic
reforming of petroleum It is also obtained from pyrolysis gasoline as a by-product of
olefin manufacture during the cracking of hydrocarbons Small amounts of mixed xylenes
are also obtained from coal-derived coke-oven light oil and from disproportionation of
toluene13
Approximately 92 of the mixed xylenes produced are blended into gasoline The
remainder is used in a variety of solvent applications as well as to produce its individual
isomers It is also used in the paint and printing ink industries The single largest end-use
of mixed xylenes is in the production of the p-xylene isomer The major derivatives
produced from p-xylene are dimethylterephthalate and terephthalic acid used for the
production of polyester fiber film and fabricated items The o-xylene is almost
exclusively used to produce phthalic anhydride for phthalate plasticizers and m-xylene is
use for the production of isophthalic acid an intermediate in the manufacture of polyester
resins1372 Mixed xylenes are also used in the manufacture of perfumes pesticide
formulations pharmaceuticals and adhesives and in the painting printing rubber
plastics and leather industries75
3
12 Properties of xylene
Table 11 Physical and chemical properties of xylenes70 71 72
Property o-xylene m-xylene p-xylene
Physical State (20 oC 1013 kPa) liquid liquid liquid
Colour colourless colourless colourless
Boiling Point (oC 1013 kPa) 1444 1391 1383
Melting Point (oC 1013 kPa) -252 -479 133
Relative density (25 oC 4 oC) 0876 0860 0857
Vapour Pressure (kPa 20 oC) 066 079 086
Flash Point (oC) (Closed Cup) 30 35 25
Saturation in Air (1013 kPa) 103 (32 oC) 103 (28 oC) 103 (28 oC)
Explosion limits (Vol in Air) 1 - 6 1 - 7 1 - 9
Autoignition temp (oC) 465 525 525
Solubility in Water (mg L-1) 142 146 185
Xylene is a clear colorless liquid at room temperature with a sweet aromatic odor74
Xylene in air can be smelled at 008 to 37 parts of xylene per million parts of air (ppm)
and can begin to be tasted in water at 053 to 18 ppm Xylene is an aromatic hydrocarbon
which exists in three isomeric forms ortho meta and para The three isomers are shown
in Figure 11 Xylene is flammable at room temperature therefore it constitutes a fire
hazard It reacts with strong oxidizers and strong acids The vapor pressure lies between
066 and 086 kPa for the three isomers13
4
CH3
CH3
CH3 CH3
CH3
CH3
12-dimethylbenzene(ortho-xylene)
13-dimethylbenzene(meta-xylene)
14-dimethylbenzene(para-xylene)
Figure 11 Isomers of xylene
All three isomers of xylene are soluble in organic solvents such as ethanol diethyl ether
acetone and benzene74 The odor threshold for mixed xylene in air is approximately
435 mg m-3 (1 ppm)73
13 Xylene in the environment
The majority of xylene released into the environment enters the atmosphere directly This
results mainly from its use as a solvent and its release in motor vehicle exhausts A small
proportion is also likely to enter water and soil due to oilpetrol spillages etc Jori et al76
did calculations based on the Mackay fugacity model that more than 99 of the xylene
released ultimately partitions to the atmosphere
Kawata and Fujieda78 monitored xylene concentrations in the air of Niigata Japan in
1991 and 1992 At an urban location mean m-xylene and p-xylene concentrations were
48 and 20 g m-3 respectively The m-xylene and p-xylene concentrations at a rural
location were 18 and 07 g m-3 respectively Young and Parker77 measured high levels
of total xylene in air samples from within landfill sites in the United Kingdom Levels of
between 36 and 77 mg m-3 were reported in domestic landfills with higher levels being
found in some industrial waste landfills They found mean background levels of all three
xylene isomers in ambient air to be around 1 g m-3 but in suburban areas they were
found to be 3 g m-3 suggesting that vehicle emissions are a significant source of
5
xylenes Higher levels have been measured in urban and industrialized areas mean
concentrations ranging up to 500 g m-3 However concentrations are generally below
100 g m-3 Estimated daily exposure of the general population through inhalation is
70 g in rural areas and less than 2000 g in urban areas76
The concentration of xylene in drinking water ranges from not detectable to
12 g L-1 Mean background concentrations of xylenes in surface water are generally
below 01 g L-1 However much higher values have been measured in industrial areas
and areas associated with the oil industry (up to 30 g L-1 in polluted waters and up to
2000 g L-1 near discharge pipes) Wiesenburg et al78 measured xylenes in brine from an
oil production platform in the Gulf of Mexico Two samples taken from an underwater
vent plume contained 480 and 1800 g L-1of mp-xylene and 500 and 1900 g L-1 of
o-xylene Xylene concentrations in the surface water were 0270 g L-1 for mp-xylene
and 006 g L-1 for o-xylene Water from the discharge pipe contained 2060 g L-1 of
mp-xylene and 1510 g L-1 of o-xylene Barker et al79 measured o- and p-xylene in the
leachate from a landfill in Hamilton Ontario Canada Xylene concentrations ranged
from 308 to 123 g L-1 for the ortho isomer and from 125 to 191 g L-1 for the para
isomer Sabel and Clark80 showed that Leachate from a landfill in Minnesota USA
contained m-xylene concentrations ranging from 21 to 150 g L-1 and op-xylene
concentrations ranging from 12 to 170 g L-1 Since xylenes are only slightly soluble in
water only a very small proportion of xylene in the atmosphere is likely to be removed
by precipitation This is supported by the fact that xylenes have been detected in
rainwater samples at very low levels (2 ng m-xylene L-1 and 9 ng p-xylene L-1)82
Levels of 015 g kg-1 o-xylene and 04 g kg-1 mp-xylene have been measured at a depth
of 70 - 250 cm in soil from a gasoline station The soil was thought to be contaminated as
a result of leakage from an underground storage tank81 Volatilization rate of xylenes near
the surface of soils is expected to be a rapid process owing to the reasonably high
volatility of xylenes It is also possible that a small amount of xylene in soil may leach
out into the aquatic system
6
15 Transformation of xylene
In the atmosphere the xylene isomers are readily degraded primarily by photo-oxidation
In soil and water the meta and para isomers are readily biodegraded under a wide range
of aerobic and anaerobic conditions but the ortho isomer is more persistent
141 Biodegradation of xylenes
In soil and water o- and p-xylene are readily biodegraded under a wide range of aerobic
and anaerobic conditions but o-xylene is much more persistent under similar conditions
1411 Aerobic biodegradation
Bacteria of the genus Pseudomonas have been shown to be capable of growing using
either m-xylene or p-xylene as the sole carbon source The main initial metabolites
appear to be m-toluic acid from m-xylene and p-toluic acid from p-xylene Similarly
cultures of three strains of Nocardia have been shown to metabolize p-xylene to p-toluic
acid and 23-hydroxy-p-toluic acid84 Many of the bacteria do not appear to be capable of
growing on o-xylene as sole carbon source83 However o-xylene has been shown to
undergo biodegradation in the presence of other carbon sources Using hexadecane as
growth substrate o-xylene was co-oxidized to o-toluic acid by Nocardia A similar
oxidation was observed with Pseudomonas using hexane as the growth substrate85
The biodegradation of xylenes by the autochthonous microflora in groundwater in the
presence of the water soluble fraction of gas oil has been demonstrated by Kappeler and
Wuhrmann8687 After a lag period of 3 to 4 days individual hydrocarbon concentrations
were found to decrease at a measurable rate The removal of m-xylene and p-xylene was
complete after 7 days O-xylene was shown to degrade at a significantly slower rate than
the meta- and para- isomer removal being complete after 11-12 days In the first case the
first step in the degradation appears to be oxidation to the corresponding methylbenzyl
alcohol
7
Both m-xylene and p-xylene have been shown to be readily degraded within 13 days
using a microbial inoculum from an activated sludge wastewater treatment plant The
initial concentration of xylene was 100 mg L-1 and 30 mg L-1 of sludge biomass was
used Degradation of xylene was monitored by comparing the oxygen uptake of the
system with that of controls88 The degradation of mixtures of benzene toluene and
p-xylene has been studied using pure cultures of either Pseudomonas sp strain CFS-215
or Arthrobacter sp strain HCB or a mixed culture indigenous to a shallow sandy aquifer
In the mixed culture the presence of p-xylene was found to increase the lag period before
the degradation of benzene and toluene commenced and also appeared to decrease the
rate of toluene degradation compared to the rate obtained without added p-xylene
Degradation of p-xylene occurred in the mixed culture although a long lag period was
observed before degradation commenced When toluene was also present in the culture
the lag period for the degradation of p-xylene was reduced and the degradation rate was
increased but all the toluene had been degraded the p-xylene degradation rate again
slowed In the experiments with Pseudomonas sp the degradation of p-xylene was slow
no degradation was observed in the first three weeks when p-xylene alone was present
Again the degradation rate of p-xylene was found to increase when toluene was also
being degraded Also the presence of p-xylene again increased the lag period for benzene
and toluene degradation In the experiments with Arthrobacter sp degradation of
p-xylene was found to occur only in the presence of benzene and at a slow rate89
The biodegradation of o-xylene and m-xylene has been studied in three core samples of
subsurface soil uncontaminated soil soil that had previously been contaminated with
unleaded gasoline and soil from an area that had previously undergone biostimulation
using H2O2 M-xylene was rapidly degraded in all three core types although the rate was
faster in the previously biostimulated soil due to a higher bacterial cell count (m-xylene
disappeared to below the analytical detection limit within three weeks in the previously
biostimulated soil whereas some remained after 3 weeks in the previously contaminated
samples O-xylene was found to be recalcitrant in all of the samples90 P-xylene and
o-xylene were shown to be degraded in aquifer material collected from the contaminant
plume after a large gasoline spill The degradation occurred fastest in material from the
aerobic degrading zone of the plume but also occurred rapidly in uncontaminated soil91
8
In a study using laboratory aquifer columns which simulated saturated-flow conditions
typical of a rivergroundwater infiltration system all three xylene isomers were shown to
undergo degradation under aerobic conditions Both m-xylene and p-xylene were
degraded to concentrations below the analytical limit of detection within 17 days The
rate of transformation was significantly lower for o-xylene but degradation occurred
readily92
The rate of biodegradation of benzene toluene and xylene (BTX) in groundwater soil
slurries has been shown to be highly dependent on the dissolved oxygen concentration93
At dissolved oxygen concentration of between 2 and 8 mg L-1 BTX (initial
concentrations between 120 and 16000 g L-1) was 80 ndash 100 degraded in 30 ndash 40 days
with a half-life of 5 ndash 20 days When the dissolved oxygen concentration was 1 or
2 mg L-1 the BTX was incompletely degraded (20 ndash 60 ) in 30 ndash 40 days Little or no
degradation was observed at dissolved oxygen concentrations of 001 and 05 mg L-1
The xylenes have been shown to be 100 degraded after 192 hours incubation at 13 oC
with natural flora in groundwater in the presence of other components of high-octane
gasoline85
1412 Anaerobic biodegradation
O-xylene along with other alkylbenzene compounds has been shown to undergo
degradation under anaerobic methanogenic conditions No significant degradation of
o-xylene occurred over the first 20 weeks but after 40 weeks the concentration was
reduced to 22 of the original Less than 1 remained after 120 weeks94
In anoxic suspensions of Pseudomonas sp strain T cells grown anaerobically with
toluene m-xylene and p-xylene were partially oxidized to 3- and 4-methylbenzoate
respectively O-xylene was not oxidized to 2-methylbenzoate as predicted Suspensions
of strain T cells grown anaerobically with m-xylene and incubated with m-xylene at
5 oC accumulated 3-methylbenzaldehyde (35 microM after 20 min) and 3-methylbenzoate
(5 microM after 20 min) After further incubation at room temperature the three aromatic
compounds were completely oxidized within 3 h95
9
Experiments have been carried out using aquifer material from a site containing areas that
were either contaminated or uncontaminated with JP-4 jet fuel Both mixed xylene and
the individual isomers were incubated with the aquifer material at 12 oC in a nitrogen
atmosphere Both o-xylene and m-xylene were slowly degraded in the uncontaminated
aquifer material when added individually although m-xylene (at 16 mg L-1) also
appeared to inhibit the basal rate of denitrification Using mixed xylenes a lag period of
30 days was required before biodegradation commenced in the uncontaminated material
M-xylene and p-xylene were degraded to below the analytical limit of detection within
the next 26 days but the degradation of o-xylene was found to be much slower In the
contaminated aquifer material much longer lag periods and decreased rates of
biodegradation were observed o-xylene not being significantly degraded over a 6 month
period96
In further laboratory experiments using a mixture of benzene and alkylbenzenes both
o-xylene and m-xylene were found to be degraded under nitrate-reducing and nitrous
oxide-reducing conditions but degradation of o-xylene was found to cease once the other
alkylbenzenes had been degraded97 In field experiments using the same aquifer
m-xylene and p-xylene were shown to be degraded under denitrifying conditions when
nitrate was injected into the aquifer but no evidence of biodegradation of o-xylene was
found98
The three xylene isomers have been shown to be completely mineralized by aquifer-
derived microorganisms under sulphate-reducing conditions The source of the inoculum
was gasoline-contaminated sediment All microcosms were initially fed a mixture of
benzene toluene ethylbenzene o-xylene and p-xylene (5 mg L-1 of each component)
P-xylene was found to be greater than 80 degraded within 72 days and o-xylene was
more than 80 degraded within 104 days After this initial adaptation period o-xylene
m-xylene and p-xylene were rapidly degraded by the system without any lag period
M-xylene co-elutes with p-xylene and therefore m-xylene was not added initially99
Edwards and Grbic-Galic100 reported that o-xylene is completely mineralized by aquifer-
derived microorganisms under anaerobic conditions However an adaptation period of
200 to 255 days was required before the onset of degradation Anaerobic degradation was
10
found to be inhibited by the presence of some natural organic substrates and
co-contaminants P-xylene and o-xylene have been shown to be degraded in anaerobic
aquifer material collected from the contaminant plume after a large gasoline spill91
All three xylene isomers have been shown to undergo degradation under anaerobic
denitrifying conditions The rate was much lower for o-xylene than for the other isomers
Long lag periods were observed in all cases before degradation commenced92
Degradation of o-xylene under anaerobic conditions has been hypothesized to explain to
explain the distribution of o-xylene in a landfill leachate plume101 M-xylene has been
shown to be rapidly mineralized to carbon dioxide in laboratory aquifer columns operated
under continuous conditions with nitrite as an electron acceptor The degradation occurs
simultaneously with the reduction of nitrite In contrast to this the concentrations of o-
xylene and p-xylene were only slightly reduced in the experiment The author102 noted
however that the experiments were carried out over a 6 day period after the addition of
the new substrate and therefore may not have allowed a build-up of other microorganisms
capable of degrading these substrates
The biodegradation of BTX has been shown to occur under anaerobic denitrifying
conditions using shallow aquifer material that had previously been exposed to BTX
O-xylene and m-xylene were found to be degraded to 15 and 12 respectively of the
initial concentration (3 mg L-1) after 62 days with added nitrate103 Much less degradation
occurred under anaerobic conditions in the absence of added nitrate (73 o-xylene
remained after 62 days and 59 m-xylene remained after 62 days) These losses were
not considered to be significant when compared with sterile controls
Up to 04 mM (425 mg L-1) m-xylene was found to be rapidly mineralized in a
laboratory aquifer column operated in the absence of molecular oxygen with nitrate as an
electron acceptor Quantitative oxidation of m-xylene (80 ) to carbon dioxide occurred
with concomitant reduction of nitrate The column was inoculated with denitrifying river
sediment that had been continuously fed with m-xylene for several months104
11
142 Abiotic Degradation
The xylene isomers are readily degraded in the atmosphere photo-oxidation being the
most important degradation process
4121 Photolysis
Xylenes do not absorb UV-visible radiation appreciably at wavelengths longer than
290 nm This means that they are unlikely to be directly photolysed in the troposphere or
in solution as the ozone layer absorbs wavelengths shorter than 290 nm Experiments
using xylenes adsorbed on silica gel have shown that the photomineralization rates for all
three isomers are low when radiation of wavelength longer than 290 nm is used105
4122 Atmospheric Oxidation
Atmospheric oxidation of xylene isomers is rapid and proceeds via free-radical chain
processes The most important oxidant is the hydroxyl radical but xylenes will also react
with other species found in the atmosphere such as alkoxy radicals peroxy radicals
ozone and nitrogen oxides The most likely reaction pathways occurring in the
atmosphere are hydroxyl radical addition to the aromatic ring and hydrogen abstraction
from the alkyl groups by hydroxyl radicals106 although reactions with nitrate radicals
may become important at night107
143 Biofiltration
Many studies8-13 on removal of xylene and other volatile organic carbon compounds by
microorganisms and biofiltration have been reported
Abumaizar et al17 reported biofiltration of benzene toluene ethylbenzene and xylene
(BTEX) contaminated air streams using compost-activated carbon filter media with inlet
concentrations of more than 200 ppm and a gas load rate of 176 m3 m-2 h-1 with
achievement of 90 removal efficiencies17 Among the BTEX compounds xylene is
the most difficult to biodegrade under mesophilic and thermophilic conditions in the
toluene acclimatized biofilter18
12
A few studies16-19 focusing on the performance of biofiltration in the removal of xylene as
the sole pollutant in the air stream was reported
Jorio et al16 studied the biofiltration of xylene vapors on a laboratory scale biofilters
packed with a filter material consisting of small balls composed of peat moss (70
ww) mixed with two structuring and conditioning agents (30 ww) Vapors having
xylene gas inlet concentrations ranging from 02 to 40 g m-3 were tested using gas flow
rates of 04 07 and 10 m3 h-1 The biofiltration proved to be highly efficient in the
removal of xylene at a gas flow rate of 04 m3 h-1corresponding to a gas residence time of
157 s Saravanan and Rajamohan19 investigated the biofiltration of xylene vapors on a
laboratory scale biofilter packed with press mud as filter material inoculated with
activated sludge from the pharmaceutical industry In their study the biofiltration column
was fed with a stream of contaminated air of flow rates 003 006 009 and 012 m3 h-1
having xylene vapor concentrations ranging from 02 to 12 g m-3 It was reported that for
all the tested gas flow rates a decrease in the removal efficiency was noticed for high
xylene inlet concentration and for all the tested inlet concentrations the removal
efficiency decreased for high gas flow rates
Chen et al20 reported on the simple and effective synthesis of methoxy-dimethylbenzene
at room temperature and atmospheric pressure from electrochemical oxidation of p-
xylene in methanol and catalyzed by solid superacids SO42- ZrO2 ndash MxOy (M = Ti Ni
Si) They found that all catalysts used showed good catalytic activity in the
electrochemical reaction of p-xylene with methanol assisted with a pair of porous
graphite plane electrodes and the selectivity of main products higher than 90 were
observed
13
15 Occurrence of halogenated organic compounds Of all the synthetic chemicals currently in use in the industrial and agricultural sector
halogenated organic compounds have most certainly received the widest scientific
attention Used as herbicides pesticides refrigerants fire retardants solvents degreasers
and as various intermediates in organic synthesis these compounds are often of
environmental importance due to their toxicity and often limited biodegradability Most
halogenated organic compounds are extremely stable The carbon ndash chlorine bond is very
strong and resists being broken down by physical processes Furthermore when
organochlorines do breakdown they usually produce other organochlorines were the
carbon ndash chlorine bond remaining intact as part of another compound which is
sometimes more toxic and far more hazardous than the original substance When
organochlorines enter the aquatic system their behavior depends very much upon their
physical and chemical properties Solvents such as chloroform and carbon tetrachloride
are generally volatile and tend to evaporate from water into the atmosphere Less volatile
compounds such as chloroethane chlorobenzene chlorophenols and polychlorinated
biphenyls tend to bind with sediments and enter the food chain15
Of the numerous halogenated organics the degradation of which has been studied
interest has been largely focused on chlorinated aromatics while the short chain aliphatic
compounds have been relatively neglected In the chemical industry large amounts of
short-chain chlorinated aliphatic organics are produced These chemicals are used as
organic solvents degreasing agents pesticides and intermediates for the synthesis of
various other organic compounds14 Hazardous municipal and medical waste destined for
incinerators is predominantly organic chemical waste with the organically bound chlorine
content much higher The generation of dioxins which are highly toxic occurs during
combustion when both organic matter and an available source of chlorinated compounds
are present155 Therefore reduction of waste through incineration is undesirable since their
reactions lead to more toxic compounds The most commonly reported chlorinated
organic compound in the environment originating from landfill leachate is chloroethane
Since this compound has a low solubility in water its analogous alcohol 2-chloroethanol
which has a greater solubility and lower volatility was used in this study
14
16 Properties of 2-chloroethanol
2-chloroethanol a widely used chemical is a colorless liquid similar to glycerine with a
faint sweet pleasant ether-like odor It is also known as 2-chloro-1-ethanol
2-monochloroethanol 2-hydroxyethyl chloride β-chloroethanol β-hydroxyethyl
chloride chloroethanol ethylchlorohydrin ethylene chlorohydrin glycol chlorohydrin
and glycol monochlorohydrin 2-chloroethanol is synthesized from ethylene and
hypochlorous acid
CH2 CH2 + HOCl HOCH2CH2Cl
This substrate can be used as a model for future studies of simplified reaction
mechanisms since it has a simple structure and it is highly soluble in water It is widely
used in the pharmaceutical industry as an alkylation agent in the manufacture of
medicinal drugs It is also used as a solvent to determine the water content of a wide
range of products It is harmful to aquatic organisms Disposal of the waste solvent
containing 2-chloroethanol is difficult and expensive The primary use of 2-chloroethanol
has been as a precursor for ethylene oxide which is a widely used organic chemical It is
also used in a number of synthetic reactions including the manufacture of certain dyes
pharmaceuticals crop protection chemicals and plasticizers 2-chloroethanol is very toxic
and may be fatal by inhalation swallowing or absorbed through the skin It can be
irritating to the eyes skin and lungs but irritation is weak and is not strong enough to
warn of a potentially fatal exposure Exposure can cause damage to the central nervous
system cardiovascular system kidneys and liver It decomposes in fires to yield
hydrogen chloride and phosgene which are also irritating and toxic It reacts violently
with oxidants and is a fire and explosion hazard with water or steam to produce toxic and
corrosive fumes and with strong bases to produce ethylene oxide which is toxic and a
fire hazard It is for these reasons that efficient and effective methods need to be found to
remove it from the water system140
15
Table 12 Physical and chemical properties of 2-chloroethanol140
17 Transformation of 2-chloroethanol
Limited studies on the degradation of 2-chloroethaol was conducted McCann et al21
metabolized it with mammalian alcohol dehydrogenase to 2-chloroacetaldehye which is
considered to be a mutagen The degradation of 2-chloroethanol by bacteria also proceeds
through the potentially toxic intermediates 2-chloroacetaldehyde and chloroacetic acid to
glycolate2223 In Xanthobacter autotrophicus GJ10 the oxidation of 2-chloroethanol to 2-
chloroacetaldehyde is catalyzed by a quinoprotein alcohol dehydrogenase and the
subsequent conversion of 2-chloroacetaldehyde to chloroacetic acid by a NAD-dependent
aldehyde dehydrogenase A dehydrogenase is involved in dehalogenation of chloroacetic
acid to gylcolate24 Strotmann et al25 described the isolation of a strain of Pseudomonas
pudita US2 that is able to use 2-chloroethanol as growth substrate The degradation of 2-
chloroethanol was found to proceed via 2-chloroacetaldehyde to chloroacetic acid which
is hydrolytically dehalogenated to gylcolate25
Property Value
Molecular Mass (g mol-1) 805
Physical State (20 oC 1013 kPa) Liquid with Characteristic Odour
Colour Colourless
Boiling Point (oC 1013 kPa) 128 ndash 130
Melting Point (oC 1013 kPa) - 67
Relative density (25 oC 4 oC) 12
Vapour Pressure (kPa 20 oC) 065
Flash Point (oC) (Closed Cup) 60
Explosion limits (Vol in Air) 49 ndash 159
Autoignition temp (oC) 425
Solubility in Water (mg L-1) Miscible
16
Table 13 Comparative reduction potentials measured at 25 oC141
Pace et al125 conducted studies on the degradation of 2-chloroethanol by hydrogen
peroxide under ultraviolet radiation They found the hydroxyl radical (bull OH) to be a
powerful non-selective chemical oxidant which reacts very rapidly with organic
compounds
Table 14 lists the standard redox potentials of some oxidants Hydrogen peroxide in
dilute aqueous solution is known to produce bullOH radicals by photolysis under UV
irradiation (λ lsaquo 370 nm)
H2O2 (aq) hv 2 bullOH (aq)
Once generated the hydroxyl radicals aggressively attack virtually all organic
compounds Depending upon the nature of the organic species two types of initial attack
are possible
Oxidizing Agents Eo (Volts)
Fluorine (F2) 303
Hydroxyl Radical ( OH ) 280
Ozone (O3) 207
Hydrogen Peroxide (H2O2) 178
Potassium Permanganate (KMnO4) 170
Hyprobromous Acid (HOBr) 159
Hydrochlorous Acid (HOCl) 149
Chlorine (Cl2) 136
Chlorine Dioxide (ClO2) 127
Oxygen (O2) 123
Chromic Acid (H2CrO4) 121
Bromine (Br2) 109
Nitric Acid (HNO3) 094
Iodine (I2) 054
17
(1) The hydroxyl radical can add itself to the contaminant as in the case of olefins or
aromatic compounds A common reaction is the abstraction of hydrogen atom to initiate a
radical chain oxidation shown in Scheme 10
RH + OH H2O + R2 OH H2O2
R + H2O2 ROH + OH
R + O2 ROO
ROO + RH ROOH + R
Scheme 10 Initiation of a chain oxidation of an organic compound with the hydroxyl radical26
(2) The attack by hydroxyl radical in the presence of oxygen initiates a complex
cascade oxidative reactions leading to mineralization of the organic compound
18 Oxidation of organic compounds
A large number of toxic organic compounds found in water are difficult to oxidize by
conventional chemical and biological treatment In this case water treatment processes at
ambient temperature and pressure involving the formation of highly reactive bullOH
radicals are used to improve the oxidation process and shorten the reaction time This
type of oxidation is generally referred to as an advanced oxidation process (AOP)60 61 In
drinking water treatment they are applied to oxidation of ozone resistant compounds such
as pesticides6263 aromatic compounds64 and chlorinated compounds such as tri- and
tetrachloroethene65 The ozonation of dissolved organic matter in water can be regarded
as an AOP since bullOH radicals are generated from the decomposition of ozone catalyzed
by the hydroxyl ion or initiated by the presence of trace transition metal cations66
18
Table 14 Some organic compounds that can be oxidized by bullOH radicals67
Organic Compounds
Acids Formic gluconic lactic propanoic tartaric
Alcohols Benzyl tert-butyl ethanol ethylene glycol glycerol iso-propanol methanol
propandiol
Aldehydes Acetaldehyde benzaldehyde formaldehyde glyoxal iso-butyraldehyde
trichloroacetaldehyde
Aromatics Benzene chlorobenzene chlorophenols creosote dichlorophenol
hydroquinone phenol p-nitrophenol toluene trichlorophenol xylene
trinitrotoluene
Amines Aniline cyclic amines diethylamine dimethylformamide EDTA
propanediamine n-propylamine
Ethers Tetrahydrofuran
Ketones Dihydroxyacetone methyl ethyl ketone
Dyes Anthrquinone diazo monoazo
An attractive feature of the bullOH radical is that it is resistant to attack thus making it a
good oxidant for wastewater treatment Table 14 shows several organic compounds that
can be oxidized by bullOH radicals however some of the commonly found organic
compounds such as acetic maleic and oxalic acids acetone and simple chloride
derivatives (chloroform and carbon tetrachloride) is resistant to attack by bullOH radicals67
The radical mechanism predominates in less reactive compound such as aliphatic
hydrocarbons carboxylic acids benzenes and chlorobenzenes68 Under acidic conditions
the direct pathway dominates and above pH 10 it changes to the radical mechanism69 A
conventional ozone process can be converted to an AOP by increasing reaction time after
ozone addition increasing the pH of the reaction mixture or by adding another strong
oxidizing agent like hydrogen peroxide Since the first two possibilities can be costly the
addition of hydrogen peroxide is a cheap and most effective method used for water
purification In this process the ozone transformation is accelerated by the presence of
hydrogen peroxide
Chemical oxidation of NOM in water is generally used when biological processes have
little efficiency Chemical oxidation has proven to be an effective process for the removal
19
of trace levels of organic pollutants present in water The principle aim of chemical
oxidation is to transform the contaminants to harmless or value-added products
Conventional purification processes consists of addition of an oxidizing agent to the
water containing the organic contaminant The most widely used oxidants for water
treatment are chlorine potassium permanganate and oxygen51 Despite their advantages
these oxidants have a number of limitations such as low selectivity generation of toxic
products discoloration costly installation of chemical plants and poor stability Chemical
oxidation by ozone has recently become a widely used method to disinfect drinking water
and wastewater Pilot studies have shown that ozone is a quicker and more efficient
disinfectant than chlorine and that when properly used it can reduce suspended solids
(SS) biochemical oxygen demand (BOD) chemical oxygen demand (COD) and other
pollutants found in water As a disinfectant one of ozonersquos attributes is its ability to
achieve significant bacterial reductions with contact times much shorter than those used
in chlorination Petrasek of the Dallas Water Reclamation Centre reported that in studies
using filtered effluent from an activated sludge plant a 5 mg L-1 dose of ozone applied
for less than 2 minutes yielded a significant reduction in total plate count and fecal
coliform levels When the effluent from an advanced wastewater treatment process was
used the results were even more impressive A 25 mg L-1 concentration applied for the
same contact time reduced bacteria levels by over 1000 times
Other researchers27 have found similar results Dr Carl Nebel Welsbach Corp reported
that ozone disinfects about 3000 times faster than chlorine He cited experiments in
which a chlorine dose of 01 mg L-1 required 250 minutes to reduce the total plate count
of a sample by 999 while the same concentration of ozone needed only 08 minutes to
achieve the same reduction An added benefit from using ozone for wastewater
disinfection is that it leaves behind a residual of dissolved oxygen unlike chlorine which
leaves behind free chlorine and chlorinated compounds like trihalomethanes and
chloramines These chlorinated compounds can be toxic to aquatic life and in some
locations is believed to be the major cause of effluent toxicity Ozone has greater
disinfection effectiveness against bacteria and viruses compared to chlorination In
addition the oxidizing properties can also reduce the concentration of iron manganese
sulphur Ozone facilitates the oxidation of iron manganese and sulphur in water to form
20
insoluble metal oxides and elemental sulphur These insoluble particles are then removed
by post-filtration Ozone is unstable and it will degrade over a time frame ranging from a
few seconds to 30 minutes Ozone is effective over a much wider pH and temperature
range than chlorine making it more versatile Ozone can also reduce the concentration of
suspended solids In pilot studies carried out in conjunction with disinfection
experiments ozone generated froth was able to reduce suspended solids to less than 2
mgL-1 The ozone bubbles generated in the contact chamber trapped and reacted with the
solids floating them to the surface where the froth was removed Tertiary treatment
plants have also used ozone to reduce BOD COD cyanides and phenols In reactor tests
the effluent from a secondary treatment plant was treated with ozone and ferrous salts
The combination of ozone oxidation and froth flotation achieved BOD and COD
reductions of 95 and 58 percent respectively
Cyanide and cyanide complexes can also be destroyed by ozone treatment In tests
performed by the US Air Force industrial wastes containing up to 10 000 mg L-1 of
cyanide were treated with ozone and ultraviolet light The treatment reduced to cyanide
concentration to below detectable levels Ozone is effective on phenol wastes as well In
this case it requires about 2 parts of ozone to destroy 1 part of phenol Treatment of
water containing phenols with ozone rather than chlorine also eliminates odors and
improves taste While ozone can made to treat pulp bleaching plant wastewaters it has a
much more productive use in replacing chlorine as a bleaching agent In this way not only
OZONE REMOVES
Iron Bacteria and Viruses
Hydrogen
Sulphide
Manganese
21
is formation of chlorinated organic substances eliminated but significant portions of the
water used can be re-used in the process28 The majority of problematic substances in
industrial wastewaters and landfill leachate are organic compounds These waters are
often a complex mixture comprising of many individual substances ranging in
concentration from mg L-1 to g L-1 has to be reduced or removed The predominant tasks
associated with ozone treatment of wastewaters are
the conversion of toxic compounds to non-toxic and if possible to value added
products
the partial oxidation of the biologically refractory part of the dissolved organic
carbon for the purpose of improving subsequent biodegradation and
the removal of color and odor
Ozone may react with water impurities by means of direct or indirect reactions Reactions
between a substrate and ozone molecule is referred to as a direction reaction while the
indirect reactions is referred to as those reactions which involve a substrate and radicals
derived from decomposition of ozone The ozone molecule is highly selective to species
it will react with and when a reaction does take place it is relatively slow when compared
to radical reactions On the contrary radicals are highly reactive which makes the
reaction period shorter29 Organic compounds such as formic acids humic acids
glyoxylic acids primary alcohols and benzene have been found to initiate and promote
ozone decomposition while acetone and aliphatic alcohols stop the decomposition
chain2930 During ozonation dissolved organic compounds (DOC) in water are only
partially oxidized Higher molecular weight organic compounds are transformed into
lower molecular weight compounds leaving DOC concentrations to a large extent
unaffected3132 The reaction of ozone with natural organic matter (NOM) may result in
the formation of numerous by-products Among these by-products epoxides organic
peroxides and aldehydes are of particular concern in drinking water The formation of
aldehydes33 34 and carboxylic acids upon ozonation of NOM is widely published35 The
literature provides several studies of aldehyde formation (formaldehyde acetaldehyde
22
and glyoxal) as a function of ozone dose aldehyde formation as a function of pH and
aldehyde formation as a function of hydrogen peroxide concentration3637
Kusakabe et al38 have showed that almost all organic matter can be oxidized by ozone to
carboxylic acids Formic acid acetic acid and particularly oxalic acid were the most
significant The formation of benzoic acid by the oxidation of toluene in the presence of
supercritical CO2 and ionic liquids as solvents was also reported3940 The liquid phase
oxidation of toluene with homogeneous metal salt catalysts was industrially realized in
the Rhodia Dow and Snia-Viscosa processes using oxygen or peroxides as
oxidants41-43 The Snia-Viscosa process operates at 165 oC and under 10 atm of air in the
presence of a homogeneous cobalt catalyst in acetic acid At optimal conditions benzoic
acid as the target product is produced at 90 selectivity and benzaldehyde as a minor
by-product is obtained with 3 selectivity at 15 conversion of toluene In these
processes however halogen ions and acidic solvents are indispensable and they easily
cause corrosion of the reaction vessel
Aldehydes are usually observed at the levels of 10 mg L-1 after ozonation while
carboxylic acids are usually present at concentrations of hundreds of micrograms per
liter 3444 A short contact time is sufficient for the reaction of ozone with organic matter
Carboxylic acids are formed at much higher quantities than aldehydes during ozonation
of NOM45
The reaction products of the oxidation of aromatic compounds with ozone are not well
covered in literature The reactivity of benzene toluene ethylbenzene and xylene
(BTEX) with ozone increases with the degree of substituted methyl groups
While benzene is relatively unreactive xylenes have a higher reactivity depending on the
position of the substitution46 Literature reviews46-47 show that the reaction of ozone with
the aromatic ring system is highly electrophilic and also highly selective Electron donor
groups on the aromatic ring lead to an enhanced rate whereas electron-withdrawing
groups cause a slower rate Increasing the number of aromatic rings (benzene rarr
naphthalene rarr phenanthrene) also leads to an enhanced reactivity Naphthalene reacts
1500 and phenanthrene reacts 10 000 times faster than benzene respectively4648 Fuel
additives such as methyl-tertbutylether (MBTE) tertiary butanol (t-BuOH) and ethanol
23
have a low reactivity with ozone49 This is typical for saturated hydrocarbons and in
particular ethers and tert-butyl groups46 The reactivity of saturated compounds
containing aldehyde alcohol ketone and carboxylic acid functional groups with ozone is
typically very low4650 Many of these compounds are formed as oxidation products from
the reaction of ozone with NOM
Activated carbon is reported to accelerate ozone decomposition resulting in the formation
of hydroxyl radicals52-54 It was reported5556 that incorporated metal center electrons of
the graphenic layers and the basic surface groups of the activated carbon are considered
as the main factors responsible for the decomposition of ozone at the activated carbon
surface The presence of activated carbon during the ozonation of organic pollutants leads
to a reduction in the concentration of DOC thereby increasing the applicability of this
treatment system57 Ozonation in the presence of activated carbon can lead to oxidation of
micro-pollutants either by a direct reaction of the compounds with ozone or by hydroxyl
radicals that are produced in the interaction of ozone with the surface of activated
carbon58 Sanchez-Polo et al compared the efficiency of treating water from Lake Zurich
with O3 and O3 activated carbon The results showed that O3 activated carbon process
lead to an increased transformation rate of ozone and a significant reduction of the
concentration of DOC Furthermore it was observed that the adsorption of low
concentrations of DOC on the carbon surface does not change its initiatingpromoting
activity for ozone transformation59
19 Properties of ozone
Ozone is a highly reactive allotrope of atmospheric oxygen in which the molecule is
composed of three atoms of oxygen It is generated photochemically in the stratosphere
and is believed to protect life on earth from overexposure to ultraviolet and other high
energy radiation Ozone has proved to be a highly useful and powerful oxidizing agent in
the chemical industry the cost of generating it being the only limitation for it to be used
more widely
24
More important however is the growing use of ozone in water and wastewater
purification In treating portable water wastewater and landfill leachate ozone has the
proven ability to convert bio-refractory organic material
Table 15 Important physical constants of ozone142
Combining ozone oxidation with biological water treatment methods can produce water
or wastewater with lower concentrations of problematic organic compounds more cost-
effectively than either process used individually Ozone has been used in this way in
Europe for many years after which the United States began to realize the potential of
ozone in disinfection in sewage and waste treatment and in odor color and taste control
Studies conducted by Hughes Gordy143 and co-workers during the period 1952 ndash 1956
with the microwave spectrum of ozone showed that the ozone molecule in the ground
state has an obtuse angle of 116o 45prime and an oxygen ndash oxygen bond length of 1278 Aring
The molecule has no appreciable para-magnetism and its dipole moment is low On the
basis of the abovementioned properties the structure of the ozone molecule can be
described as a resonance hybrid of the four canonical forms as illustrated in Figure 12
O
O O
+
_
O
O O
+
_
O
O O+ _
O
O O+_
Figure 12 Canonical forms of the ozone molecule143
Molecular Weight (g mol-1) 48
Boiling Point (oC) -1119
Melting Point (oC) -193
Gas Density 0 oC (g L-1) 2144
Critical Temperature (oC) -121
Critical Pressure (oC) 546
Critical Volume (oC) 1471
25
Ozone is a blue colored gas At atmospheric pressure ozone can partially dissolve in
water but at standard temperature and pressure the solubility of ozone is thirteen times
that of oxygen Although ozone is only partially soluble in water it is sufficiently soluble
and stable such that its oxidation and disinfectant properties can be fully utilized The
oxidation potential of 207 V proves that ozone is a strong oxidizer which can react with
a large variety of organic compounds resulting in the formation of oxygen containing
products Concentrated mixtures of ozone and oxygen that contain more than 20 ozone
can become explosive in both fluids and gases
110 History of ozone-organic chemistry
The history of ozone-organic chemistry divides itself into three periods each of which is
dominated by the genius of a particular researcher
Schőnbein in 1840 is generally credited with being the discoverer of ozone as a
chemical substance He gave it the name ldquoozonerdquo derived from the Greek word ozein
meaning ldquoto smellrdquo Schőnbein was the first to study the reactions of ozone with organic
and inorganic substances but in most cases there were no conclusive identification of
products
A very important period in the history of ozone chemistry began with the first paper of
Harries in 1903 He established ozonolysis as one of the classical reactions of organic
chemistry and also pioneered most of the known reactions of ozone with organic
compounds and gave us our first insight into how these reactions occur In his research
Harries observed that certain olefinic compounds reacted with ozone in the absence of
ionic solvents to give peroxidic oils which he later called ozonides and to which he
assigned structure 2 Later he changed the structure to 3 which he described as a highly
unstable initial ozone-olefin adduct called a ldquoprimary ozoniderdquo
26
C C
O O
O
2
C C
O O
O
3
Harries proposed that the primary ozonide decomposes in two ways one to give
aldehydes andor ketones and hydrogen peroxide (reaction 1) and the other to give an
aldehyde or ketone and a ldquoperoxiderdquo 4 (reaction 2) Harries suggested that the ldquoperoxiderdquo
could rearrange to a carboxylic acid if a hydrogen atom is attached to the carbon atom of
the peroxy group (reaction 3) or in some cases dimerize
C C
O O
O
3
C C
O O
O
3
C O + H2O2 + O C
C
O
O
+ O C
C
H O
O
C O H
O
H2Oreaction 1
reaction 2
reaction 3
4
Scheme 11 The Harries mechanism143
27
In 1925 Staudinger suggested a more detailed mechanism of ozonolysis than that of
Harries The useful parts are outlined below
R2C CR2 O3 R2C
O O O
CR2 O O
R2CO
R2C CR2
O O
O
R2C O + R2C O O
O O
R2C CR2
O O
C
O
OHR
if one R is hydrogen
CR2
5 6
7
8
9
Scheme 12 The Staudinger mechanism143
Staudingerrsquos proposal was that ozone reacts with olefins to form an unstable initial
adduct with a four-membered ring structure 5 which he called a ldquomol-ozoniderdquo He
suggested several transformations for the mol-ozonide the most important of which was
re-structuring to a true ozonide 6 which he called an ldquoisozoniderdquo In support of structure
6 he pointed out that reduction of ozonides gave aldehydes and ketones rather than
glycols which would be expected from Harriesrsquo ozonide structure 4 In addition
Staudinger suggested that the mol-ozonide could polymerize (5 rarr 7) and decompose to
an aldehyde or ketone and structure 8 If one R in structure 8 is hydrogen it could
rearrange to a carboxylic acid or dimerize to structure 9 a similar proposal by Harries
28
A detailed study of the active oxygen-containing products of a wide variety of
unsaturated substances in different types of solvents resulted in the development of the
Criegee mechanism of ozonolysis during the period 1949 ndash 1957 The mechanism is
outlined below
R2C CR2 R2C
O3
CR2 R2C CR2
OO O+
11
R2C+
O Opolymeric ozonides +
O O
R2C CR2O
12
R2CG
O O H
14
O O
R2C CR2
O9
+polymeric peroxides
rearrangement products
G = OH OR O C
O
R etc
O3
+ R2C O
HG
O
10
613
Scheme 13 The Criegee mechanism143
The first intermediate 10 an ozone-olefin adduct is assumed to be very unstable and
through 11 cleaved to a zwitterion 12 and an aldehyde or a ketone 13 Zwitterion 12
the key intermediate in the Criegee mechanism is a modernization of minor
intermediates predicted earlier by Harries and Staudinger The breakdown of 12
according to the Criegee mechanism depends partly on its source and partly on its
environment He suggested four different ways by which it can stabilize itself
(a) Reaction with an aldehyde or ketone (13) usually an aldehyde to give an ozonide
(6) or polymeric ozonides (aprotic solvents)
29
(b) Dimerization and polymerization to give 9 and polymeric peroxides
(favoured by aprotic solvents and by 13 being a ketone)
(c) Reaction with a protic nucleophilic solvent molecule to give 14 or
(d) Rearrangement to give ldquoabnormalrdquo ozonolysis products
111 Types of ozone attack
On the basis of the resonance description of the ozone molecule one could predict that
ozone should be able to function as a 13-dipole an electrophile or a nucleophile
1111 13-Dipolar cycloaddition
During the 1960s Huisgenrsquos classified ozone as a typical 13-dipole and the addition of
ozone to a multiple bond as a 13-dipolar cycloaddition The 13-dipolar cycloaddition of
ozone to an olefinic double bond is illustrated in Scheme 13
O
O O
C C
O
O
O
C C
OO
CC
O
O
O
C C
Scheme 14 13-dipolar cycloaddition of ozone to a double bond143
1112 Electrophilic nature of ozone reactions
The e lectrophilic reaction is restricted to molecular sit ed with strong electronic density
and certain aromatic compounds Aromatics substituted with electron donor groups such
30
as hydroxyl and amine show high e lectronic densities on carbons located in the ortho-
and para- positions are very reactive with ozone at these positions Aromatics substituted
with electron withdrawing groups such as carboxylate and nitrite groups react to a lesser
extent with oz one I n thi s case the initial a ttack b y th e oz one mol ecule takes place
mainly on the least deactivated meta-position The result of thi s reactivity is that the
aromatic c ompounds be aring the electron donor g roups D such as phenol and a niline
react quickly with ozone This reaction is schematically shown in Scheme 14
O
O
O+
D
OOO
Hand
D
O O
O
O2
D
OH
and
D
OH
Scheme 15 Electrophilic reaction of ozone with aromatic compounds144
The initial attack by the ozone molecule leads first to the formation of ortho- and para-
hydroxylated by-products These compounds are highly susceptible to further ozonation
leading to the formation of quinoid and due to the opening of the aromatic ring to the
formation of aliphatic products with carbonyl and carboxyl functional groups
1113 Nucleophilic nature of ozone reactions
The nucleophilic reaction is found locally on molecular sites which are electron deficient
and more fr equently o n carbons carrying electron withdrawing g roups In g eneral
molecular oz one r eactions are e xtremely selective a nd li mited to unsaturated aromatic
and aliphatic compounds as well as to specific functional groups Figure 13 lists some of
the organic functional groups that can be readily attacked by ozone
31
C C ( aliphatic and aromatic ) C C
C N N RSH RSSR
R S R
O
R3P (RO)3P R3As R2Se
C H
R
R
R
RCH2OR R C R
O
R2CHNH2
RCH2OH R2CHNR2 SiH Si C
Si Si C Mg C Hg
Figure 13 List of functional groups that can be readily attacked by ozone28
32
Aromatics Unsaturated Aliphatics Saturated Aliphatics( R = CnHn CnHn-1R )
R HOOC-R-CHO
HOOC-R-COOH
HOOC-R-COR
Polyhydroxy Aromatics Quinoids
R
(OH)n
O
O R
OCH-HCO OHC-COOH
HOOC-COOH HOOC-COR
HOOC-C-COOH
OHCOOH RCOOH
Total degradation
CO2 + H2O
Cl- + NH4+ + NO3
-
I II
III
Figure 14 Ozonation of aromatic compounds145
112 Aqueous ozonation chemistry
Ozone is unstable in water Its decay in natural waters is characterized by a fast initial
decrease of ozone followed by a second phase in which ozone decreases with first order
kinetics Depending on the water quality the half-life of ozone is in the range of seconds
to hours The major secondary oxidant formed from ozone decomposition in water is the
hydroxyl radical The stability of ozone largely depends on the water matrix especially
its pH ozone concentration its alkalinity and the concentration of radical scavengers
The decomposition rate measured in the presence of excess radical scavengers which
prevent secondary reactions follows pseudo first-order kinetic Staehelin and Hoigneacute
showed that the rate constant changed linearly with pH which reflects the fact that the
ozone decomposition rate is first order with respect to both ozone and hydroxide ions148
33
The chemistry of aqueous ozone is complex It involves the decomposition of the ozone
by way of a chain reaction mechanism resulting in the production of hydroxyl free radical
species The pH of the water is important because hydroxide ions initiate ozone
decomposition The initiators of the free-radical reaction are those compounds capable of
inducing the formation of superoxide radical ions O2 ∙ minus from an ozone molecule Those
are inorganic compounds (hydroxyl ions OH minus hydroperoxide ions HO2 minus and some
cations) organic compounds (glycolic acid formic acid and humic acid) and UV
radiation at 2537 nm147
Scheme 15 shows reactions for the decomposition of ozone in aqueous solution in the
presence of organic solutes The scheme shows that reaction of the hydroxyl ions with
ozone produces one hydroperoxide radical (HO2) and one superoxide radical anion
(O2∙ minus) These reactions comprise the initiation step of the chain reaction mechanism
O3 OH HO2+ + O2hydroperoxide radical
HO2 O2 + Hsuperoxide radical ion
Scheme 16 Decomposition of ozone in aqueous solution by hydroxyl ions147
Scheme 16 shows how the addition of organic solutes can result in either the direct
consumption of the ozone before the chain reaction begins or production of the ozonide
radical ion (O3 minus) by electron transfer Upon protonation within the aqueous system the
ozonide ion decomposes into hydroxyl radicals These radicals are now free to react with
the organic solutes at fast rates The hydroxyl radicals react with the functional groups of
the organic solutes producing organic radicals which add O2 and then eliminate
HO2∙ O2
minus The formation of the O2∙ minus radical has a very high rate constant compared to
34
the reactions with other solutes present in ozonated waters It is thought by Staechlin and
Hoigne147 that the production of the highly ozone selective O2 minus ion promotes the chain
reaction to produce hydroxyl free radicals OH Promoters of the free radical reaction are
organic and inorganic molecules capable of regenerating the superoxide radical anion
from the hydroxyl radical Common organic promoters include aryl groups formic acid
glycolic acid primary alcohols and humic acids Among the inorganic compounds
phosphate species is commonly used
O3 + O2 O3 + O2ozonide radical ion
O3 H++ HO3
HO3 OH + O2
O3 + OH HO4
HO4 HO2 + O2
Scheme 17 Decomposition of ozone in aqueous solution by hydroxyl radicals147
The production of ozone selective radicals is beneficial for the destruction of organic
solutes by radical reactions but other organic and inorganic substrates can also react with
the hydroxyl radicals produced Scheme 17 shows the reaction mechanism for the
decomposition of ozone in aqueous solution in the presence of a scavenger These
reactions form secondary radicals which do not predominantly produce the HO2∙ and O2
minus
radicals Species such as OOCH2COO∙ and CO32minus ldquoscavengerrdquo the hydroxyl radicals
produced preventing interaction between the OH radical and ozone leading to
35
termination of the chain reaction Some of the more common inhibitors include
bicarbonate ions alkyl groups tertiary alcohols and humic substances
HO4 HO4 H2O2+ 2O3+
HO4 + HO3 H2O2 + O3 + O2
OH + CO32- OH
+ CO3
carbonate radical ion
CO3 + O3 products( CO2 + O2 + O2 )
OH + HCO3 OH + HCO3
Scheme 18 Effect of scavengers on the decomposition of ozone in aqueous solution146
The overall pattern of the ozone decomposition mechanism (Scheme 15 rarr 17) shows
that the free radical initiating step constitutes the rate determining step in the reaction
The regeneration of the superoxide radical ion O2∙ minus or its protonic form HO2∙ from the
hydroxyl radical OH ∙ implies that 1 mol of ozone is consumed As a result of this all
the species capable of consuming hydroxyl radicals without regenerating the superoxide
radical ion will produce a stabilizing effect on the ozone molecule in water146
36
113 Motivation for the study
Shongweni landfill dump situated in Kwazulu ndash Natal is a site that accepts medical and
industrial chemical waste Aqueous leachate from the site is collected in two dams
situated below the site During the rainy season overflow from these dams enter nearby
streams and rivers Tests conducted on the leachate showed a significant increase in
levels of xylene a carcinogenic substance during certain months
Ozone gas was chosen for the oxidation process because it is a strong oxidizing agent and
environment friendly and can be particularly effective for purification of aqueous waste
streams with organic pollutants It is sometimes used as a pre-treatment method or to
disinfect wastewater after biological treatment It is faster acting than alkaline
chlorination and unlike chlorine ozone does not generate toxic ions during the oxidation
process
The toxic nature of many organic compounds has been extensively reported Efficient
methods of removing these compounds from the environment and changing them into
less toxic and value adding substances is constantly researched The work undertaken
here involves a study of the ozone initiated oxidation of toxic organic compounds found
mainly in landfill leachate Two model compounds commonly found in the landfill
leachate were chosen for this investigation namely m-xylene and 2-chloroethanol
114 Hypothesis
Ozone is an effective oxidant to convert m-xylene and 2-chloroethanol into non-
toxic or less toxic products
The presence of substances like acetic acid ethyl acetate and acetone enhance the
solubility of ozone and activated charcoal and hydrogen peroxide facilitate the
oxidation process
The pH of the aqueous media affects the ozonation process and facilitates the
substrate oxidation
37
115 Objectives of the study
The focus of the study is to investigate the impact of ozonation on the oxidation of
m-xylene formation of products as a function of ozonation time and ozonation reactions
in the presence of organic solvents
In the case of water soluble 2-chloroethanol the objective is to investigate its oxidation in
aqueous medium and influence of pH presence of hydrogen peroxide andor activated
charcoal on the reaction This would be achieved by characterization of products and
selectivity
Ozonation reactions of m-xylene and 2-chloroethanol were conducted separately as a
function of ozonation time Since many toxic organic compounds are partially soluble or
insoluble in water and landfill leachates also contain many other organics studies were
conducted to investigate the effect of ozonation in the presence of an added solvent such
as acetic acid ethyl acetate or acetone The focus here would be to identify and quantify
conversion of the substrate molecule as a function of ozone treatment time and monitor
the selectivity and yields of products formed
38
20 Introduction
The smell of oz one in the a ir during a thunde r and li ghtning storm has been obse rved
from the ti me e arth was first able to support life Man has since copied na ture and
currently us es electric discharge as his pr incipal method of generating oz one The fir st
ozonator based on corona discha rges was manufactured b y von S iemens in 1857 Two
concentrical glass tubes were used the outer tube was covered externally by a thin layer
of ti n a nd th e inner tub e wa s c overed int ernally b y a l ayer of ti n Air was circulated
through the annular sp ace This technology was later improved b y t he a ddition of
circulating c ooling fluid s along the discharge a ir or ox ygen gap re sulting in lower
generation tempe ratures and less ther mal de struction of the ozone B ecause of it s
relatively short ha lf-life ozone is always generated on-site b y an ozone generator The
two main pr inciples of oz one g eneration a re UV-light a nd corona-discharge Oz one
generation by corona-discharge is most common nowadays and has most advantages such
as greater sustainability of the unit higher ozone production and higher cost affectivity
An electric discharge ( a spark ndash also referred to a s corona discha rge) splits an oxygen
molecule into two o xygen radicals These unstable oxygen radicals combine with other
oxygen molecules to form ozone The formation of ozone is shown in Scheme 20142143
Scheme 20 Generation of ozone by corona discharge150
39
21 Ozonation experiments
In this study ozone was produced from medical grade oxygen passed through the Ozonox
LAB 7000 ndash 240 V Corona Discharge Generator An outline of the discharge unit is
shown in Figure 20 The corona discharge element (the dielectric) is a class 6 ceramic
utilizing micro-gap technology which provides the capacitive load Its function is to
control and maintain the electrical discharge
Figure 20 Schematic of a corona discharge unit showing how ozone is generated142
The generation of ozone is accompanied by heat formation This makes it important to
cool the generator An ozone reaction is reversible and this increases when temperatures
rise As a result more oxygen molecules are formed To limit the decomposition of ozone
the temperature in the discharge gap should not be higher than 25 oC The excessive heat
produced by the electrodes of the Ozonox LAB 7000 is cooled by air The generation of
ozone is very energy ndash intensive with some 90 of the power supplied to the generator
being utilized to produce light sound and primary heat Important factors that influence
ozone generation are oxygen concentration inlet gas humidity and purity of inlet gas and
electrical parameters The presence of moisture and organic impurities in the oxygen feed
40
gas must be avoided Moisture reacts with ozone which leads to a reduction of ozone
yield per kWh An additional problem of high humidity is that undesired reactions occur
in the corona unit When increased amounts of water vapour are present larger quantities
of nitrogen oxides are formed when spark discharge occurs Nitrogen oxide can form
nitric acid which can lead to corrosion of the instrument components Furthermore
highly reactive hydroxyl radicals are formed that combine with oxygen radicals and with
ozone All these factors reduce the capacity of the ozone generator The presence of about
1 hydrocarbon impurities can reduce the ozone generation nearly to zero The ozone
concentration an ozone generator delivers is also dependant on the oxygen concentration
Ozone production is increased by a factor of 17 to 25 when pure oxygen is used at
constant electric power To ensure a high yield of ozone gas production medical grade
oxygen (999 purity) was used in all experiments The concentration of ozone was
controlled by changing the current of the generator and the flow rate of the oxygen feed
gas A schematic diagram of the apparatus used for the experimental work is shown in
Figure 21
Figure 21 Schematic of experimental apparatus for ozonation reactions149
41
Ozone gas was bubbled into 25 mL of the substrate solution through a sintered porous
gas diffuser with a porosity of 2 The flow of ozone into the reactor was regulated at
200 mL min-1 using a 1000 cc flowmeter The tubing connectors and valves were
constructed of PTFE and stainless steel Prior to commencing ozonation of each
substrate ozone was allowed to flow into the system but by-passed the reactor and
flowed into a trap containing 2 WV KI in water When the influent ozone reached
steady state it was then directed into the reactor to commence the reaction The
concentrations of ozone in the influent and effluent gas streams were measured by the
iodometric method154
22 Ozonation of m-xylene and 2-chloroethanol
In order to study the ozone initiated oxidation of hazardous organic compounds 25 mL
of each solvent (m-xylene and 2-chloroethanol) was pipetted into a reaction vessel and a
constant flow of 100 g mL-1 ozone was bubbled into each solvent for 3 6 9 12 16 and
24 hours respectively at a reaction temperature of 25 oC After each time interval
observations were made on the appearance of the substrate present in the reactor A
05 L aliquot of the substrate was injected into a gas chromatograph to monitor the
percentage conversion of substrate and products formed as a function of time Product
characterization and identification were conducted by GC-MS FT-IR and NMR
spectroscopy
23 Ozonation of m-xylene and 2-chloroethanol in the presence of
organic solvents
Many studies on ozonation have been carried out in water to remove toxic organic
substances However concentrations of most target organics in water are very low and
co-exist with ozone scavengers like CO2 The ozonation in water therefore is not
necessarily the most efficient process Most organic chemicals in water such as
pesticides polycyclic aromatic hydrocarbons and chlorinated compounds are
42
hydrophobic substances108 It is easy therefore to separate these substances by extraction
using organic solvents (which do not react with ozone) directly from water or from
activated carbon after adsorption from water The separated chemical concentrated in the
organic solvent may be decomposed more effectively than when in water or when in the
pure form To test the efficiency of the ozone initiated oxidation of organic compounds in
the presence of solvents acetic acid ethyl acetate and acetone were used These solvents
are known not to react with ozone Aqueous solutions containing acetic acid and acetone
were also studied
231 Ozonation of m-xylene and 2-chloroethanol in the presence of
acetic acid and ethyl acetate
The suitability of acetic acid and ethyl acetate as solvents for the ozonolysis of m-xylene
and 2-chloroethanol was therefore investigated by placing 2520 mL of each analytical
grade reagent into separate reaction vessels A constant flow of 100 g mL-1 ozone was
continuously bubbled into each solvent for 3 6 9 and 12 hours respectively at 25 oC The
appearance of the substrate was checked for any noticeable change during and after each
time interval and the change in the concentration of the substrate as a function of time
was monitored using a gas chromatograph fitted with a flame ionization detector
2311 Ozonation of m-xylene and 2-chloroethanol in the presence of
5 acetic acid
A 250 mL mixture of acetic acid in m-xylene and 2-chloroethanol was prepared by
mixing 125 mL acetic acid in 2375 mL of m-xylene and 2-chloroethanol respectively
(5 VV) Four 20 mL aliquots of each solvent mixture were placed in the reactor and a
continuous flow of 100 g mL-1 ozone was bubbled for 3 6 9 and 12 hours respectively
The appearance of the reaction mixture and the change in concentration of the substrate
as a function of time was monitored using a GC instrument The results obtained for these
43
experiments were compared to results from the ozonolysis of m-xylene and
2-chloroethanol under solvent free conditions Characterization of products was
performed by GC-MS
2312 Ozonation of m-xylene and 2-chloroethanol in the presence of
20 acetic acid
The effect of increased moles of acetic acid in the presence of m-xylene and
2-chloroethanol was investigated by preparing a mixture of 50 mL acetic acid in 200 mL
of m-xylene and 2-chloroethanol respectively (20 VV) Four 25 mL aliquots of each
mixture were placed in the reactor and a continuous flow of 100 g mL-1 ozone was
bubbled for 3 6 9 and 12 hours respectively
The appearance of the reaction mixture and the change in concentration of m-xylene as a
function of time was monitored by gas chromatography The results obtained for these
experiments were compared to results from the ozonolysis of m-xylene in the presence of
5 VV acetic acid and m-xylene under solvent free conditions Results of
characterization and identification of product obtained by GC-MS is presented and
discussed in chapter 3
24 Ozonation of m-xylene in the presence of acetic acid in an aqueous
medium
The work published by Y Nakano et al119120 on the ozonation of water soluble organic
substances in acetic acid solution showed that decomposition was possible not only in
water but also in organic solvents in the presence of water Their studies showed that the
rates of organic substance degradation both in 70 and 100 acetic acid solutions were
higher than in distilled water The decomposition rate of orange ІІ in distilled water was
27 mg L-1 min-1 whereas those in 70 and 100 acetic acid were more than
10 mg L-1 min-1 and were more than three times that in distilled water The pH of distilled
44
water was 69 It was different from that of 70 acetic acid solution which was 17
They suggested that the difference in pH might be responsible for the difference in the
decomposition rates Since m-xylene has a very low aqueous solubility and its presence
in natural waters is minimal mixtures containing 1 m-xylene in various solvents were
used for this study
241 Ozonation of 1 m-xylene in the presence of acetic acid and
acetone
Two stock solutions containing 25 mL m-xylene in 2475 mL 100 acetic acid and
25 mL m-xylene in 2475 mL 100 acetone were prepared (1 VV m-xylene) Seven
25 mL aliquots from each stock was introduced into separate reaction vessels and a
constant flow of 100 g mL-1 ozone was continuously bubbled for 10 20 30 40 50 60
and 90 minutes into each mixture During and after the ozonation observations were
made on the appearance of the substrate present in the reactor A 05 L aliquot of the
substrate was then injected into a gas chromatograph to monitor the conversion of
m-xylene as a function of time and yield of major products formed during ozonation
Product characterization and identification were determined by GC-MS and FTIR
242 Ozonation of 1 m-xylene in acetic acid and acetone in the
presence of water
Two stock solutions containing 25 mL m-xylene in 2475 mL 70 acetic acid and
25 mL m-xylene in 2475 mL acetone were prepared (1 VV m-xylene) Seven aliquots
of 20 mL each was introduced into the reaction vessel and a constant flow of 100 g mL-1
ozone was continuously fed for 10 20 30 40 50 60 and 90 minutes into each mixture
Percent conversion of m-xylene as a function of time was monitored for this
investigation
45
25 Ozonation of m-xylene in the presence of activated carbon
Several researchers123124 found that the catalytic ozonation process using activated
carbon requires little amount of ozone and its presence accelerates the ozone
decomposition reactions A study was therefore conducted to investigate the oxidation of
m-xylene present in heterogeneous systems
A fixed mass (1 g) of activated charcoal was added to each reaction flask containing
25 mL of m-xylene A constant flow of 100 g mL-1 ozone gas was continuously bubbled
for 3 6 9 and 12 hour into the mixture respectively Percent conversion of m-xylene and
yield of products formed as a function of time was monitored for this investigation
26 GC-MS analysis
Products formed during ozonolysis of m-xylene respectively was identified using a
ThermoFinnigan Trace Gas Chromatograph fitted with AS 3000 autosampler and coupled
to a ThermoFinnigan Polaris Q Electron Impact Mass Spectrometer The instrument
parameters and developed method was used for the GC-MS analysis is shown in Table
20
Table 20 GC-MS method and instrument parameters
Column Type AlltechEC5 [955poly(dimethylsiloxane)poly(diphenylsiloxane)]
30 m X 023 mm ID 1 microm film thickness
Sample Size 1 L
Injector Temp Prog 200 oC
Oven Temp 40 oC for 1 min increase 10 oC min to 300 oC hold for 5 min
Carrier Gas Helium at 1 mL min-1
Ion Source Temp 200 oC
Scan Range 40 - 500
Solvent Delay Time 4 minutes
MS Transfer Line Temp 270 oC
46
27 Gas chromatography analysis
Determination of the concentration of reaction products for the ozonation of m-xylene
and 2-chloroethanol was performed on a Shimadzu Gas Chromatograph fitted with a
flame ionization detector A GC method which gave good separation of products was
developed for the study The method and GC instrument settings are shown in Table 21
Table 21 GC method and instruments parameters
Column Type Elite 5 MS
30 m X 025 mm ID 025 microm film thickness
Sample Size 1 L
Injector Temp 260 oC
Split Ratio 600
Oven Temp Prog 45 oC for 5 min increase 20 oC min to 250 oC hold for 2 min
Carrier Gas Helium at 30 mL min-1
Detector Gas Hydrogen at 40 mL min-1 Air at 400 mL min-1
28 Extraction of carboxylic acids from product mixture
The ozonated samples were analyzed for the presence of water insoluble carboxylic
acids Sufficient quantity of substrate that was ozonated for more than 12 hours was
dissolved in dichloromethane (CH2Cl2) in a separating funnel A 5 aqueous solution of
sodium hydrogen carbonate (NaHCO3) was added to this mixture The contents of the
funnel were thoroughly shaken and then allowed to stand until two distinct layers were
observed
47
C
O
OH + NaHCO3
water insoluble
5
H2OCO
O
+ H2CO3Na
water soluble
solution
CH3 CH3
3-methylbenzoic acid 3-methylbenzoate)( )(
ion
Scheme 21 Mechanism showing the extraction of 3-methylbenzoic acid from the 12 hour ozonated reaction mixture
The water layer was then separated from the organic layer and acidified to pH 3 using
5 HCl The acidified mixture was finally extracted with CH2Cl2 and a drop spotted on
a TLC plate using 1 part ethyl acetate and 4 parts hexane as the mobile phase Both layers
showed good separation of products To confirm the presence of carboxylic acid FTIR
scans were performed on both the layers The GCMS results showed the presence of
three carboxylic acids namely acetic acid formic acid and 3-methylbenzoic acid The
reaction showing the extraction of 3-methylbenzoic acid is illustrated in Scheme 21
29 FTIR analysis
FTIR studies were performed in the transmittance mode in ambient air using a Perkin-
Elmer FTIR 2000 spectrometer equipped with an ATR crystal Spectra of the reaction
mixture were recorded before and after 12 h ozonation with a resolution of 4 cm-1 and
averaging of 128 scans The spectrums shown in Figures A36 A37 A44 and A45 were
compared An observation of the sample scans before and after ozonation showed a
definite change in the composition of the substrate molecule The interpretation of these
spectra is discussed in the chapters to follow
48
210 Calculation of conversion of substrate molecule after ozonation
The results of the GC analysis of the reaction mixture before and after ozonation were
used to calculate the amount of substrate converted at the end of each time interval
Calculation of m-xylene conversion ( conversion) was based on the peak areas obtained
from the chromatograms The following calculation model was used to calculate the
percentage of m-xylene converted in the reaction mixture after each time interval
CH3
CH3
Molecular Mass = 106 g mol-1
Density = 087 g mL-1
Sample Volume = 25 mL
Injection Volume = 1 x 10⁻³ mL
Peak Area (reference) = 777034714 units2
Peak Area (after 3 h ozonation) = 742762795 units2
Mass of m-xylene in 25 mL aliquot sample = 25 mL x 087 g mL-1
= 2175 g
Moles of m-xylene in 25 mL aliquot sample =
= 02052 mol
1 x 10⁻³ mL injection gave a peak area of 77034714 units2
Therefore 25 mL will give a peak area of 194 x 1013 units2
49
For a Sample after 3 h Ozonation
1 x 10⁻³ mL injection gave a peak area of 742762795 units2
Therefore 25 mL will give a peak area of 185 x 1013 units2
Therefore volume of m-xylene left in the reaction vessel after 3 h ozonation = 2384 mL
Mass of m-xylene left = 2384 mL x 087 g mL-1
= 2074 g
Moles of m-xylene left =
= 01957 mol
m-xylene converted =
= 463
Similar calculations were performed for percent conversion of m-xylene in the reaction
mixture after 6 9 and 12 h respectively For 2-chloroethanol ozonation a 20 ml sample
volume was used with the same calculations followed
211 Calculation of selectivity and yield of products after ozonation
The results of the GC analysis of the reaction mixture before and after ozonation were
used to calculate the percentage selectivity and yields of products at the end of each time
interval Calculation of selectivity for a specific product and its yield ( selectivity and
yield) are based on the peak area of the product obtained from the chromatogram The
following derived formulas were used in the calculation
50
The same formulas were used to calculate the selectivity and yield of products formed
during the ozonation of 2-chloroethanol at different time intervals
51
30 Introduction
In this chapter the results for the oxidation of m-xylene at various experimental
conditions are presented and discussed Ozone exhibits variations in its reactivity with
different classes of compounds when reactions take place in non-aqueous solvents under
severe reaction conditions of high temperature high pressure and high concentrations of
ozone and the organic compound The alkanes for example are relatively unreactive
towards ozone because they are saturated compounds On the other hand unsaturated
compounds such as the alkenes and some aromatic compounds that have available
electrons above and below the plane of the aromatic ring react reasonably fast with
ozone The presence of conjugated double bonds imparts color to most compounds in
water Colour will disappear rapidly when ozone is bubbled through the water because
ozone cleaves many of these carbon-carbon double bonds109 The reaction of ozone with
the aromatic ring system is highly electrophilic in nature and also highly selective
Electron donor groups attached to the aromatic ring lead to an enhanced rate whereas
electron-withdrawing groups cause a slower rate69
31 Calibration of ozone generator
Ozone output is a function of oxygen flow rate and ammeter readings The LAB 7000
was calibrated by varying oxygen flow rate and current at a constant temperature of 25 oC
to achieve ozone concentrations of 10 20 30 40 50 100 g mL-1 respectively The
determination of ozone concentration was determined by iodometric method involving
titration with a standard solution of sodium thiosulphate154 The results of the calibration
are shown in Table 30
52
Table 30 Ozone concentration data obtained at different oxygen flow rates and currents
measured at 25 oC
O2 Flow
rate
mL min-1
Ammeter Readings
(Amperes)
[O3 ]
10 g mL-1
[O3 ]
20 g mL-1
[O3 ]
30 g mL-1
[O3 ]
40 g mL-1
[O3 ]
50 g mL-1
[O3 ]
100 g mL-1
50 0204 0123 0236 0245 0267 0320
100 0235 0260 0267 0280 0297 0390
200 0270 0279 0310 0325 0345 0420
300 0323 0310 0367 0390 0405 0470
500 0360 0367 0398 0405 0450 ---
1000 0400 0398 0436 0457 --- ---
The amount of ozone generated was varied between 10 g mL-1 to100 g mL-1 Results
from the calibration data show that for a fixed oxygen gas flow rate the concentration of
ozone produced increases with increasing current However the instrument manufacturer
recommends that we operate the instrument at current settings not greater than 05 A for
more than a one minute as this will lead to dielectric overheating and reduction in ozone
output At higher oxygen gas flow rate one would expect a decrease in the residence time
of oxygen molecules in the vicinity of the dielectric hence a reduction in ozone output
This is evident from the calibration results that for a constant current the concentration of
ozone generated is less (10 g mL-1) at the highest oxygen flow rate (1000 mL min-1) and
more (100 g mL-1) at the lowest oxygen flow rate (50 mL min-1) All experiments were
therefore conducted with an oxygen gas flow rate of 200 mL min-1 and ammeter reading
ranging from 027 to 042 A
32 Oxidation of m-xylene under solvent free conditions
The ozone initiated oxidation of m-xylene was investigated for 3 6 9 12 16 and 24
hours respectively Twenty five milliliters of m-xylene was pipetted into the reaction
53
vessel and a constant flow of 200 mL min-1 oxygen producing 100 microg mL-1 ozone was
bubbled into each vessel for 3 6 9 12 16 and 24 hours respectively at a reaction
temperature of 25 oC Data for these experiments showing percent conversion of substrate
and percent selectivity towards identified products at various time intervals are shown in
Table 31
33 Product characterization for ozonation of pure m-xylene
The isolated products formed during the ozonation of m-xylene were characterized using
GC-MS FT-IR and 1H NMR techniques The interpretation of chromatograms and
spectra obtained during the study are discussed below
331 GC-MS analysis of m-xylene and product mixture
Chromatograms of pure m-xylene before ozonation shown in Figure A30 and pure
m-xylene after 12 hours of ozonation shown in Figure A31 provides sufficient evidence
that the substrate was oxidized to a mixture of major and minor products The peak
around 10 minutes refers to the elution of unreacted m-xylene and peaks at 1495 1574
1747 1931 and 2642 minutes refer to the elution of the positively identified products
acetic acid formic acid 3-methylbenzaldehyde 3-methylbenzyl alcohol and 3-
methylbenzoic acid respectively
The interpretation of electron impact mass spectra obtained for m-xylene ozonolysis
reactions is based on comparison of mass spectra of standard compounds These
compounds provided information on characteristic fragmentation pathways and expected
ion fragments The mass spectrum of m-xylene (MW=106) presented in Figure A32
show a medium peak at mz = 105 which is due to the loss of a hydrogen atom and the
formation of a methyltropylium ion More importantly xylene loses one methyl group to
form the tropylium ion (mz = 91) The formation of a substituted tropylium ion is typical
for alkyl-substituted benzenes The tropylium ion has characteristic fragmentations of its
54
own The tropylium ion can fragment to form the aromatic cyclopentadienyl cation
(mz = 65) plus ethyne (acetylene) The cyclopentadienyl cation in turn can fragment to
form another equivalent of ethyne and the aromatic cyclopropenyl cation (mz = 39)
Scheme 30 illustrates the formation and fragmentation of the tropylium ion
HH
R H +
H
H
R
R
H R
R
+
RH
H
+
R
mz = 91 (R=H)
mz = 105 (R=CH3)
mz = 91 (R=H)mz = 105 (R=CH3)
mz = 91 (R=H)mz = 105 (R=CH3)
mz = 65 (R=H)mz = 79 (R=CH3)
mz = 39 (R=H)mz = 53 (R=CH3)
Scheme 30 Formation and fragmentation of the tropylium ion137
The mass spectrum obtained for 3-methylbenzaldehyde is shown in Figure A33 A very
weak molecular ion peak characteristic of an aromatic aldehyde appears at mz = 120
The loss of one hydrogen atom via α-cleavage occurs to give the M ndash 1 peak at mz =
119 This peak is found to be more intense than the molecular peak a typical of an
aromatic aldehyde Further fragmentation leads to the loss of the formyl radical and
formation of the tropylium ion (mz = 91) The tropylium ion which has its own
characteristic fragmentation pattern is illustrated in Scheme 30
The mass spectrum obtained for 3-methylbenzoic acid is shown in Figure A34 A fairly
intense molecular ion peak of the aromatic acid appears at mz = 136 The loss of the bullOH
55
forms the CH3C6H5CequivO+ ion appearing at mz = 119 Further loss of CO from this ion
gives rise to a strong peak at mz = 91 characteristic of the tropylium ion The
fragmentation pattern of this ion is shown in Scheme 30137
332 FTIR analysis of product mixture
Infra-red spectra obtained for pure m-xylene and ozonated m-xylene mixture were also
compared The spectrum of pure m-xylene (Figure A37) showed strong C ndash H stretching
peaks near 3030 cm-1 characteristic of the benzene derivative The four bands in the
1450 ndash 1600 cm-1 region with two peaks near 1500 and 1600 cm-1 appearing moderately
stronger is characteristic of the stretching motions of the benzene ring The meta-
disubstituted benzene compound show two peaks one strong peak between 680 and 725
cm-1 and one very strong peak between 750 and 810 cm-1
The IR spectrum of ozonated m-xylene (Figure A37) showed the peaks and bands at
their usual positions for pure m-xylene but a prominent strong absorption peak is
observed between 1630 and 1780 cm-1 which is characteristic of the carbonyl functional
group This stretching indicates the presence of aldehydes andor carboxylic acid
compounds
333 Analysis of isolated products by 1H NMR
The 1H NMR spectrum of isolated product 3-methylbenzyl alcohol is presented in Figure
A39 The signal between 65 ndash 70 ppm is characteristic of aromatic ring hydrogens
(benzene ring hydrogens) and the signal between 20 ndash 25 ppm is characteristic of
benzylic hydrogens (those attached to an adjacent carbon atom)137 The chemical shift of
the ndashOH hydrogen appears as a broad peak around 20 ppm The position of this peak and
its broadening effect may be dependent on concentration solvent temperature and
presence of water or of acidic or basic impurities The hydrogens on the adjacent carbons
(-CH2 ndash OH) appears in the range 45 ndash 50 ppm is deshielded by the attached oxygen
56
The 1H NMR spectrum of isolated product 3-methylbenzoic acid is presented in Figure
A310 The hydrogens attached to the aromatic ring are easily identified The hydrogens
on an aromatic ring are more highly deshielded than those attached to double bonds due
to the large anisotropic field that is generated by the circulation of the electrons in the
ring (ring current)137 They are found in the region between 70 ndash 85 ppm The chemical
shift of the methyl protons appearing between 20 ndash 30 ppm shows a smaller deshielding
effect The chemical shift of the ndashOH hydrogen produces a peak near 105 ppm
In Table 31 the effect of ozone treatment time over conversion of m-xylene and
selectivity for products 3-MBAlc 3-MBAlde 3-MBAcid and smaller oxygenated
products referred to as ldquootherrdquo are shown An observation of the data shows that percent
conversion of m-xylene increases as a function of ozonation time Percentage conversion
of the substrate increased from 44 for 3 hours ozonation to 376 for 24 h ozonation
The conversion of m-xylene increased steadily from 3 h to 6 h with a low conversion in
the first 9 h and thereafter a fairly rapid increase up to 24 h This pattern of m-xylene
conversion indicates that the reaction is mass transfer controlled as reported by
Bollyky112 who showed that for fast ozone reactions the rate of mass transfer of ozone
increases thereby improving substrate destruction
Table 31 Percent conversion of m-xylene and selectivity data for the ozone initiated oxidation of
25 mL m-xylene as a function of time
Oxygen flow rate = 200 mL min-1 Ozone concentration = 100 μg mL-1
3-MBAlc = 3-methylbenzylalcohol 3-MBAlde = 3-methylbenzaldehyde 3-MBAcid = 3-methylbenzoic acid Other = acetic acid formic acid and carbon oxides
Ozonation Time (h)
Conversion ()
Selectivity ()
3-MBAlc 3-MBAlde 3-MBAcid Other
3 44 243 451 00 306
6 92 310 336 118 232
9 107 301 330 114 252
12 192 349 237 163 252
16 234 348 225 180 251
24 376 357 166 220 254
57
In Figure 30 m-xylene conversion and the selectivityrsquos for the formation of 3-MBAlc
3-MBAlde 3-MBAcid and other small oxygenated products measured at a constant
ozone dose of 100 μg mL-1 are plotted as a function of ozonation time The results show a
steady decrease in selectivity towards 3-MBAlde from 451 after 3 h ozonation to 166
after 24 h ozonation and an increase in selectivity towards 3-MBAcid from 0 after 3
h ozonation to 220 after 24 h
Figure 30 Percent conversion of m-xylene and product selectivity versus ozonation time
This pattern of product formation is due to the oxidation of 3-MBAlde to 3-MBAcid
implying the existence of consecutive reactions for these products at longer ozonation
times A similar behavior was found by Van der Weile and Van den Berg118 in the
oxidation of toluene over bismuth molybdate catalysts Selectivity towards 3-MBAlc
increased gradually from 243 to 349 during the first 12 hours of ozonation and
thereafter remained constant up to 24 h ozonation The smaller oxygenated products such
as formic acetic and carbon oxides showed a decrease in selectivity for the first 6 h and
thereafter remained constant up to 24 h ozonation
0
5
10
15
20
25
30
35
40
45
50
2 4 6 8 10 12 14 16 18 20 22 24
Con
vers
ion
and
Sele
ctiv
ity (
)
Ozonation Time (h)
conversion - m-xylene S - 3-MBAlc
S - 3-MBAlde S - 3-MBAcid
S - other
58
The percentage yields of major products namely 3-MBAlc 3-MBAlde 3-MBAcid and
ldquootherrdquo products formed during the ozone initiated oxidation of m-xylene are presented in
Table 32 and Figure 31 It is evident that yield for all products increase as ozonation time
increases
Table 32 Percent yield of identified products for ozonation of m-xylene as a function of time
Ozonation Time (h)
Yield ()
3-MBAlc 3-MBAlde 3-MBAcid Other
3 11 20 00 13
6 29 31 11 21
9 32 35 12 27
12 67 46 31 48
16 81 53 42 58
24 134 63 83 96
Oxygen flow rate = 200 mL min-1 Ozone concentration = 100 μg mL-1
Figure 31 Percent yield of products versus ozone treatment time
In the first 3 h of ozonation the data obtained suggests that ozone was ineffective to
oxidize the aromatic aldehyde 3-MBAlde to its corresponding acid 3-MBAcid This
0
2
4
6
8
10
12
14
3 6 9 12 16 24
Yiel
d (
)
Ozonation Time (h)
3-MBAlc 3-MBAlde 3-MBAcid other
59
slow oxidation process indicates low ozone solubility in the substrate During the first 9 h
of ozone treatment it is observed that the yield of 3-MBAlde is marginally higher than the
yield of 3-MBAlc indicating that the aromatic alcohol once formed is rapidly oxidized
to its corresponding acid After 9 h the yield of 3-MBAlc increases significantly in
comparison to the other products formed This pattern of product formation suggests that
ozone is extremely effective in converting m-xylene to its primary product 3-MBAlc
however further oxidation of this product is slow The presence of organic solvents
during the ozonation of m-xylene is therefore going to be explored
34 Ozonation of m-xylene in the presence of organic solvents
Literature review showed that the ozonation of alkanes was studied in the presence of
several chlorinated solvents acetone tetrahydrofuran benzene etc Solvents were used
mainly to improve the solubility of ozone and to provide suitable reaction conditions
White and Bailey reported that the adsorption of ozone in acetic acid reaction mixtures
were about 80 to 90 throughout the reaction115
Acetic acid and ethyl acetate are frequently used as solvents in ozonation and are quite
resistant to ozone destruction111 However it has been reported by Paillard and Briner113
that on prolonged treatment with ozone traces of peracetic acid are produced Taube114
has claimed that under the influence of UV light this product becomes significant
Attempts also have been made to destroy acetic and oxalic acids in wastewater using
ozone Acetic acid destruction was unsuccessful except in the presence of UV light or
alkali solution Ozone plus UV light converted acetic acid to oxalic acid Oxalic acid
destruction was slow under basic conditions but conversion to CO2 occurred under acidic
conditions and influence of UV light116117 Attempts were made by Galutkina et al117 to
destroy acetone present in wastewaters They were unsuccessful however ozonation in
the presence of acetic acid converted it to acetic and oxalic acids Since acetic acid and
ethyl acetate are quite resistant to ozone attack and has found to improve the ozonation
process as reported by many researchers experiments were conducted to study the
influence of these solvents on the ozone initiated oxidation of m-xylene
60
341 Effect of acetic acid on ozonation of m-xylene
The presence of acetic acid in the ozonation of m-xylene was investigated One hundred
milligrams per litre ozone was first bubbled through pure acetic acid for 3 6 9 and 12
hours under similar experimental conditions as for the ozonation of m-xylene The
results showed no significant oxidation of the substrate molecule
A mixture containing m-xylene in 5 acetic acid was then ozonated for 3 6 9 and 12
hours using similar experimental conditions for ozonation of m-xylene Data for these
experiments showing conversion of substrate and selectivity towards identified products
at various ozonation times are illustrated in Table 33 and Figure 32
Table 33 Percent conversion and selectivity data for the ozone initiated oxidation of m-xylene in
the presence of 5 acetic acid as a function of time
Oxygen flow rate = 200 mL min-1 Ozone concentration = 100 μg mL-1
From the results shown in Table 33 it is evident that the percentage conversion of
m-xylene is marginally higher when ozonated in the presence of 5 acetic acid The
conversion of m-xylene increased from 54 after 3 h to 211 after 12 h of ozone
treatment This behavior is in accordance with former studies conducted by Nakano et
al119120 who showed that when acetic acid was used as a flushing solvent the rate of
trichloroethylene removal in the flushing process with ozone was 25 times higher
Ozonation Time (h)
Conversion ()
Selectivity ()
3-MBAlc 3-MBAlde 3-MBAcid Other
3 54 287 443 00 270
6 110 299 366 127 207
9 127 327 263 176 233
12 211 363 250 206 181
61
Acetic acid was chosen for two reasons a high capacity for ozone dissolution
(225 mg L-1 in 99 acetic acid whereas 95 mg L-1 in water at 20 oC) and a higher
trichloroethylene oxidation rate compared to that in distilled water even at the same
ozone concentration Product formation for the ozonation of m-xylene in the presence of
5 acetic acid was the same as for the oxidation of m-xylene in the absence of the acid
Figure 32 Percent conversion of m-xylene and selectivity profiles of product formation versus
ozonation time (m-xylene in the presence of 5 acetic acid)
The selectivity profiles for the ozonation of m-xylene in the presence of 5 acetic acid
showed similar trends when compared to the ozonation of m-xylene in the absence of
acid Selectivity for 3-MBAlc gradually increased from 287 after 3 h ozonation to
363 after 12 h Selectivity towards 3-MBAlde sharply decreased from 443 after 3 h
ozonation to 263 after 9 h thereafter remaining constant for the next 3 h while
selectivity towards 3-MBAcid increased from 0 after 3 to 206 at 12 h Selectivity
towards formic acetic and carbon oxides decreased from 270 after 3 h to 181 after
12 h of ozone treatment The percentage yields of major products namely 3-MBAlc 3-
MBAlde 3-MBAcid and ldquootherrdquo products formed during the ozone initiated oxidation of
m-xylene are presented in Table 34 While the data shows that yield for all products
0
5
10
15
20
25
30
35
40
45
50
2 3 4 5 6 7 8 9 10 11 12
Con
vers
ion
and
Sele
ctiv
ity (
)
Ozonation Time (h)
conversion - m-xylene S - 3-MBAlc S - 3-MBAlde
S - 3-MBAcid S - other
62
increase as ozonation time increases it is evident that the presence of 5 acetic acid has
marginally improved the yield of all products
Table 34 Percent yield of identified products for the ozone initiated oxidation of m-xylene in the
presence of 5 acetic acid as a function of time
Further experiments were conducted to study the effect of increasing the moles of acetic
acid on the ozonation of m-xylene This was achieved by ozonating a mixture containing
m-xylene in 20 acetic acid for 3 6 9 and 12 hours respectively using similar
experimental conditions for ozonation of m-xylene in the absence of acid Data for these
experiments showing percentage conversion of substrate and percentage selectivity
towards major products at various ozonation times are shown in Table 35 and Figure 33
Table 35 Percent conversion and selectivity data for the ozone initiated oxidation of m-xylene in
the presence of 20 acetic acid as a function of time
Oxygen flow rate = 200 mL min-1 Ozone concentration = 100 μg mL-1
Ozonation Time (h)
Yield ()
3-MBAlc 3-MBAlde 3-MBAcid Other
3 16 24 00 07
6 33 41 13 15
9 41 34 21 24
12 77 55 41 32
Ozonation Time (h)
Conversion ()
Selectivity ()
3-MBAlc 3-MBAlde 3-MBAcid Other
3 82 247 401 00 352
6 190 319 348 165 168
9 206 319 271 210 200
12 263 337 208 188 323
63
Figure 33 Percent conversion of m-xylene and selectivity profiles of product formation versus
ozonation time (m-xylene in the presence of 20 acetic acid)
When comparing results obtained for samples ozonated in the presence of 5 acetic acid
(Table 33) to results obtained for the ozonation of m-xylene in 20 acetic acid (Table
35) it is clearly evident that the percentage conversion of m-xylene has improved
considerably After 3 hours of ozonation 82 of m-xylene was converted to products
Exposure of the reaction mixture to ozone for a further 12 hours resulted in 263
conversion
The selectivity profiles for the ozonation of m-xylene in the presence of 20 acetic acid
showed slightly different trends when compared to the ozonation of m-xylene and
ozonation of m-xylene in the presence of 5 acetic acid Selectivity towards ldquootherrdquo
products showed a reasonably large decrease from 352 after 3 hours to 168 after
6 hours followed by a gradual increase up to 12 hours Selectivity towards 3-MBAlde
decreased from 401 at 3 hours to 208 at 12 hours while selectivity towards
3-MBAcid increased from 0 at 3 hours to 188 at 12 hours This pattern of product
formation suggests that the presence of 20 acetic acid not only has an effect on the
0
5
10
15
20
25
30
35
40
45
2 3 4 5 6 7 8 9 10 11 12
Con
vers
ion
and
Sele
ctiv
ity (
)
Ozonation Time (h)
conversion - m-xylene S - 3-MBAlc
S - 3-MBAlde S - 3-MBAcid
S - other
64
oxidation of m-xylene but also is effective in converting primary products into secondary
products which was not achieved when m-xylene was ozonated alone
Table 36 Percent yield of identified products for the ozone initiated oxidation of m-xylene in the
presence of 20 acetic acid as a function of time
Ozonation Time (h)
Yield ()
3-MBAlc 3-MBAlde 3-MBAcid Other
3 20 33 00 29
6 61 66 31 32
9 66 56 43 41
12 89 55 50 85
The percentage yields of major products namely 3-MBAlc 3-MBAlde 3-MBAcid and
ldquootherrdquo products formed during the ozone initiated oxidation of m-xylene are presented in
Table 36 While the data shows that yield for all products increase as ozonation time
increases it is evident that the presence of 20 acetic acid has marginally improved the
yield of all products formed
342 Comparison of data for ozone initiated oxidation of m-xylene in
acetic acid
A comparison of the percentage conversion of m-xylene in solvent free conditions
m-xylene in the presence of 5 acetic acid and m-xylene in the presence of 20 acetic
acid is illustrated in Figure 34 In comparing the conversion profiles at different reaction
conditions it is clearly evident that m-xylene in the presence of 20 acetic acid gave the
highest percentage conversion of substrate The presence of acetic acid resulted both in
an increase in ozone dissolution and the initiation of the ozone decomposition reaction
This behavior is in agreement with previous studies conducted which showed that the
increase in acetic acid concentration modified the chemical properties of humic acid
producing both soluble and solid fractions during the ozonation of trichloroethylene121
65
The distribution of soluble and solid humic acid fractions affected the chemical reactions
between humic acid and ozone resulting in a higher trichloroethylene decomposition
rate122
Figure 34 Comparison of percent conversion of m-xylene and m-xylene in acetic acid versus
ozonation time
Figures 35 ndash 38 illustrates percentage yields for 3-MBAlc 3-MBAlde 3-MBAcid and
smaller oxygenated products referred to as ldquoothersrdquo formed during the ozonation of
m-xylene in solvent free conditions and m-xylene in the presence of 5 and 20 acetic
acid as a function of time
A study of the product yields shows that the percentage yield of all identified products
were the highest when m-xylene was treated with ozone in the presence of 20 acetic
acid The pattern of 3-MBAlc formation during the ozonation of m-xylene was similar to
the ozonation of m-xylene in the presence of 5 acetic acid however a marginal
increase in yield at all time intervals is observed
0
5
10
15
20
25
30
2 4 6 8 10 12
Con
vers
ion
()
Ozonation Time (h)
m-xylene
m-xylene in 5 AA
m-xylene in 20 AA
66
Figure 35 Comparison of percent yield of 3-MBAlc formed during ozonation of m-xylene and
m-xylene in acetic acid versus time
Figure 36 Comparison of percent yield of 3-MBAlde formed during ozonation of m-xylene and
m-xylene in acetic acid versus time
0
1
2
3
4
5
6
7
8
9
10
2 3 4 5 6 7 8 9 10 11 12 13
Ye
ild (
)
Ozonation Time (h)
3-MBAlc (m-xylene)
3-MBAlc (m-xylene + 5 AA)
3-MBAlc (m-xylene + 20 AA)
1
2
3
4
5
6
7
2 3 4 5 6 7 8 9 10 11 12 13
Ye
ild (
)
Ozonation Time (h)
3-MBAlde (m-xylene)
3-MBAlde (m-xylene + 5 AA)
3-MBAlde (m-xylene + 20 AA)
67
Figure 37 Comparison of percent yield of 3-MBAcid formed during ozonation of m-xylene and
m-xylene in acetic acid versus time
Figure 38 Comparison of percent yield of ldquootherrdquo products formed during ozonation of m-xylene
and m-xylene in acetic acid versus time
0
1
2
3
4
5
6
2 3 4 5 6 7 8 9 10 11 12 13
Ye
ild (
)
Ozonation Time (h)
3-MBAcid (m-xylene)
3-MBAcid (m-xylene + 5 AA)
3-MBAcid (m-xylene + 20 AA)
1
2
3
4
5
6
7
8
9
2 3 4 5 6 7 8 9 10 11 12 13
Ye
ild (
)
Ozonation Time (h)
other (m-xylene)
other (m-xylene + 5 AA)
other (m-xylene + 20 AA)
68
In all cases the percent yield of 3-MBAlc increased sharply between 3 to 6 h of
ozonation thereafter remaining constant for the next 3 h and finally increasing fairly
rapidly from 9 to 12 h of ozone treatment In the presence of 20 acetic acid the yield
of 3-MBAlc increased sharply after 3 h from 2 to 61 after 6 h ozonation A steady
formation is observed for the next 3 h and thereafter a rapid increase to 89 after 12 h
ozone treatment Figure 36 show that the yield of 3-MBAlde increasing for the first 6 h
of ozonation with the highest yield recorded when m-xylene was ozonated in the
presence of 20 acetic acid It is further observed that for 5 and 20 acetic acid
mixtures the yield of 3-MBAlde decreased sharply during the 6 h to 9 h time interval
while the yield of 3-MBAcid increases sharply This trend indicates that the presence of
acetic acid during ozonation not only gives higher conversion rates of m-xylene but also
has the ability to rapidly convert the aromatic aldehydes to aromatic carboxylic acids
The yield of the smaller oxygenated products such as formic acid acetic acid and carbon
oxides also shows a rapid increase from 9 h to 12 h of ozone treatment in acidic medium
343 Effect of ethyl acetate on ozonation of m-xylene
The presence of ethyl acetate in the ozonation of m-xylene was investigated One
hundred milligrams per litre ozone was first bubbled through pure ethyl acetate for 3 6 9
and 12 h under similar experimental conditions as for the ozonation of m-xylene The
results showed no significant oxidation of the substrate molecule confirming that ethyl
acetate is resistant to ozone attack at room temperature and atmospheric pressure
A 25 mL mixture containing m-xylene in 5 ethyl acetate was then ozonated for 3 6 9
and 12 h using identical experimental conditions for ozonation of m-xylene in the
absence of solvent Data for these experiments showing percent conversion of substrate
and percent selectivity towards major products at various ozonation times are illustrated
in Table 37 and Figure 39
69
Table 37 Percent conversion and selectivity data for the ozone initiated oxidation of m-xylene in
the presence of 5 ethyl acetate as a function of time
Ozonation Time (h)
Conversion ()
Selectivity ()
3-MBAlc 3-MBAlde 3-MBAcid Other
3 89 192 405 00 403
6 196 341 242 178 239
9 299 370 186 210 233
12 375 355 157 221 266
Oxygen flow rate = 200 mL min-1 Ozone concentration = 100 μg mL-1
Figure 39 Percent conversion of m-xylene and selectivity profiles of product formation versus
ozonation time (m-xylene in the presence of 5 ethyl acetate)
0
5
10
15
20
25
30
35
40
45
2 3 4 5 6 7 8 9 10 11 12
Con
vers
ion
and
Sele
ctiv
ity (
)
Ozonation Time (h)
conversion - m-xylene S - 3-MBAlcS - 3-MBAlde S - 3-MBAcidS - other
70
It is clearly evident from the data presented in Table 37 that the presence of 5 ethyl
acetate has improved the conversion of m-xylene to the same oxygenated products
formed during ozonation without solvent Conversion of substrate increased from 89
after 3 h of ozonation to 375 after 12 h of continuous ozone treatment The selectivity
towards the aromatic alcohol 3-MBAlc increased from 192 after 3 h to 355 after
12 h ozonation Selectivity for the aromatic aldehyde showed a steady decrease of 405
after 3 h ozonation to 157 after 12 h ozonation The aromatic acid 3-MBAcid
appeared to be non-selective after 3 h of ozone treatment increasing steadily to 178
after 6 h and remaining constant for the next 6 h of ozonation This pattern of selectivity
indicates the presence of consecutive reactions between the products formed Table 38
lists the calculated data for the product yields The yield of all major products increase as
ozone treatment time is increased
Table 38 Percent yield of identified products for the ozone initiated oxidation of m-xylene in the
presence of 5 ethyl acetate as a function of time
Further experiments were conducted to study the effect of increasing the moles of ethyl
acetate on the ozonation of m-xylene This was conducted by ozonating a 25 mL mixture
containing m-xylene in 20 ethyl acetate for 3 6 9 and 12 hours respectively using
similar experimental conditions for ozonation of pure m-xylene Data for these
experiments showing percent conversion of substrate and percent selectivity towards
major products at various ozonation times are shown in Table 39 and Figure 310
Ozonation Time (h)
Yield ()
3-MBAlc 3-MBAlde 3-MBAcid Other
3 17 36 00 36
6 67 47 35 47
9 111 56 63 70
12 133 59 83 99
71
Table 39 Percent conversion and selectivity data for the ozone initiated oxidation of m-xylene in
the presence of 20 ethyl acetate as a function of time
Ozonation Time (h)
Conversion ()
Selectivity ()
3-MBAlc 3-MBAlde 3-MBAcid Other
3 125 322 276 147 256
6 248 407 174 214 205
9 305 381 165 238 216
12 425 296 133 228 343
Oxygen flow rate = 200 mL min-1 Ozone concentration = 100 μg mL-1
Figure 310 Percent conversion of m-xylene and selectivity profiles of product formation versus
ozonation time (m-xylene in the presence of 20 ethyl acetate)
10
15
20
25
30
35
40
45
2 3 4 5 6 7 8 9 10 11 12
Con
vers
ion
and
Sele
ctiv
ity (
)
Ozonation Time (h)
conversion - m-xylene S - 3-MBAlc
S - 3-MBAlde S - 3-MBAcid
S - other
72
A study of the data in Table 39 shows that m-xylene in the presence of 20 ethyl
acetate has been successfully oxidized to products and percentage conversion of the
substrate increases with an increase in ozone treatment time The products formed were
the same oxygenated products formed during ozonation without solvent Conversion of
substrate increased from 125 after 3 h of ozonation to 425 after 12 h of continuous
ozone treatment The selectivity for the aromatic alcohol increased from 322 after 3 h
to 407 after 6 h ozonation and thereafter decreased gradually to 296 Selectivity
for the aromatic aldehyde showed a steady decrease of 276 after 3 h ozonation to 133
after 12 h ozonation The aromatic acid 3-MBAcid showed good selectivity achieving
a value of 147 after 3 h of ozone treatment and thereafter increasing steadily to 214
after 6 h and finally remaining constant for the next 6 h of ozonation This pattern of
selectivity indicates the presence of consecutive reactions between the products formed
The aromatic alcohol is converted to its corresponding alcohol and thereafter to its
corresponding aromatic acid Table 310 lists the calculated data for the product yields for
the ozonation of m-xylene in the presence of 20 ethyl acetate The yield of major
products is shown to increase with an increase in ozonation time a pattern similar to
experiments conducted with 5 ethyl acetate
Table 310 Percent yield of identified products for the ozone initiated oxidation of m-xylene in the
presence of 20 ethyl acetate as a function of time
Ozonation Time (h)
Yield ()
3-MBAlc 3-MBAlde 3-MBAcid Other
3 40 34 18 32
6 101 43 53 51
9 116 50 72 66
12 126 56 97 146
73
344 Comparison of data for ozone initiated oxidation of m-xylene in
ethyl acetate
Figure 311 Comparison of percent conversion of m-xylene and m-xylene in ethyl acetate versus
ozonation time
Figure 311 compares data for the ozone initiated conversion of m-xylene in the absence
of solvent and m-xylene in the presence of 5 and 20 ethyl acetate solutions
respectively
An observation of the data reveals that the conversion of m-xylene is significantly
improved when ozonation is performed in the presence of ethyl acetate In comparing the
conversion profiles at different reaction conditions it is clearly evident that m-xylene in
the presence of 20 ethyl acetate gave the highest percentage conversion of substrate
The presence of ethyl acetate due to its nature resulted both in an increase in ozone
dissolution and the initiation of the ozone decomposition reaction
Figures 312 ndash 315 illustrates percentage yields for 3-MBAlc 3-MBAlde 3-MBAcid and
smaller oxygenated products referred to as ldquoothersrdquo formed during the ozonation of
m-xylene in solvent free conditions and m-xylene in the presence of 5 and 20 ethyl
acetate as a function of time
0
10
20
30
40
50
2 4 6 8 10 12
Con
vers
ion
()
Ozonation Time (h)
m-xylene
m-xylene in 5 EA
m-xylene in 20 EA
74
Figure 312 Comparison of percent yield of 3-MBAlc formed during ozonation of m-xylene and
m-xylene in ethyl acetate versus time
Figure 313 Comparison of percent yield of 3-MBAlde formed during ozonation of m-xylene and
m-xylene in ethyl acetate versus time
0
2
4
6
8
10
12
14
16
2 3 4 5 6 7 8 9 10 11 12 13
Yeild
()
Ozonation Time (h)
3-MBAlc (m-xylene)
3-MBAlc (m-xylene + 5 EA)
3-MBAlc (m-xylene + 20 EA)
1
2
3
4
5
6
7
2 3 4 5 6 7 8 9 10 11 12 13
Yeild
()
Ozonation Time (h)
3-MBAlde (m-xylene)
3-MBAlde (m-xylene + 5 EA)
3-MBAlde (m-xylene + 20 EA)
75
Figure 314 Comparison of percent yield of 3-MBAcid formed during ozonation of m-xylene and
m-xylene in ethyl acetate versus time
Figure 315 Comparison of percent yield of ldquootherrdquo products formed during ozonation of m-
xylene and m-xylene in ethyl acetate versus time
0
2
4
6
8
10
12
2 3 4 5 6 7 8 9 10 11 12 13
Yeild
()
Ozonation Time (h)
3-MBAcid (m-xylene)
3-MBAcid (m-xylene + 5 EA)
3-MBAcid (m-xylene + 20 EA)
1
3
5
7
9
11
13
15
17
2 3 4 5 6 7 8 9 10 11 12 13
Yeild
()
Ozonation Time (h)
other (m-xylene)
other (m-xylene + 5 EA)
other (m-xylene + 20 EA)
76
A study of the product yields shows that the percentage yield of all identified products
were the highest when m-xylene was treated with ozone in the presence of ethyl acetate
The pattern of 3-MBAlc formation during the ozonation of m-xylene was similar to the
ozonation of m-xylene in the presence of ethyl acetate however a significant increase in
yield at all time intervals is observed The percent yield of 3-MBAlc increased sharply
between 3 to 12 h when ozonation was carried out in ethyl acetate In the presence of
20 ethyl acetate the yield of 3-MBAlc increased sharply after 3 h from 4 to 101
after 6 h ozonation A steady formation is observed for the next 6 h from 116 to
126 Figure 313 show that the yield of 3-MBAlde increases gradually from 3 h to 6 h
of ozonation with the higher yields recorded when m-xylene was ozonated in the
presence of 20 ethyl acetate This trend indicates that the presence of ethyl acetate
during ozonation not only gives higher conversion rates of m-xylene but also has the
ability to rapidly convert the aromatic aldehydes to aromatic carboxylic acids The yield
of the smaller oxygenated products such as formic acid acetic acid and carbon oxides
also shows a rapid increase from 9 h to 12 h of ozone treatment
345 Ozonation of 1 m-xylene in ethyl acetate
A further study was conducted to establish the sequence of the product formation by
ozonating a 1 solution of m-xylene in ethyl acetate using shorter ozonation times but
similar experimental conditions as for pure m-xylene Results for this experiment
showing percent conversion of substrate and percent selectivity towards the major
identified products at various time intervals are summarized in Table 311 Interesting
observations were made from the analysis of the data obtained for the ozonation of a
mixture of 1 m-xylene in ethyl acetate at time intervals ranging from 10 minutes to 90
minutes (Figure 316) The selectivity towards 3-methylbenzyl alcohol was 0 from
start to end of reaction that is no formation of this product was observed during the
duration of the experiment The IR spectrum of a 12 hour ozonated sample of m-xylene
in Figure A37 shows no strong broad band in the 3200 ndash 3600 cm-1 region due to O ndashH
stretching furthermore the absence of another characteristic broad band at about 1230
cm-1 due to C ndash O stretching commonly found in Ar ndash OH functional groups is additional
77
evidence that 3-methylbenzyl alcohol is not formed as an intermediate product during the
ozonation of m-xylene
Table 311 Percent conversion and selectivity data for the ozone initiated oxidation of 1
m-xylene in the presence of ethyl acetate as a function of time
Oxygen flow rate = 200 mL min-1 Ozone concentration = 100 μg mL-1
Figure 316 Percent conversion of m-xylene and selectivity profiles of product formation for
ozonation of 1 m-xylene in ethyl acetate versus time
0
10
20
30
40
50
60
70
80
90
100
0 10 20 30 40 50 60 70 80 90 100
Con
vers
ion
and
Sele
ctiv
ity (
)
Ozonation Time (h)
conversion S - 3-MBAlde S - 3-MBAcid other
Ozonation Time (min)
Conversion ()
Selectivity ()
3-MBAlc 3-MBAlde 3-MBAcid Other
10 85 00 1000 00 00
20 204 00 901 22 78
30 220 00 166 76 758
40 326 00 120 89 790
50 485 00 89 101 810
60 764 00 62 112 826
90 833 00 55 123 822
78
The first 10 minutes of ozonation of the mixture resulted in the formation of only one
product namely 3-methylbenzaldehyde having a selectivity of 100 Its high selectivity
sharply decreased between 10 and 30 minutes to 166 and thereafter it further
decreased gradually to 55 after 90 minutes The selectivity towards 3-methylbenzoic
acid was 0 for the first 10 minutes of the reaction thereafter steadily increasing from
22 to 123 during the remainder of the reaction
The selectivity for the ldquootherrdquo products was 0 during the first 10 minutes of the
reaction and from then on increased sharply from 78 to 822 after 90 minutes This
pattern of product formation is in contrast to studies recently conducted by Guo et al110
who reported the oxidation of toluene catalyzed by cobalt tetraphenylporphyrin to benzyl
alcohol benzaldehyde and benzoic acid (Their mechanism is illustrated in Scheme 30)
the pattern of product formation for the ozonation of m-xylene indicates a stepwise
reaction with first a rapid formation of an aldehyde followed by further oxidation to a
carboxylic acid
CH3
oxide catalystO2 in autoclave
CHO
+
CH2OH
+
COOH
Scheme 30 Liquid phase oxidation of toluene with molecular oxygen over Cu-based
heterogeneous catalyst110
Hoigne and Bader69 also found that the reactivity of benzene toluene ethylbenzene and
xylene with ozone increases with the number of substituted methyl groups While
benzene was moderately reactive xylenes had a higher reactivity depending on the
position of the methyl group
79
35 Effect of activated charcoal on ozonation of m-xylene
The ozone initiated oxidation of m-xylene in the presence of activated charcoal was
investigated by placing 25 mL aliquots of the substrate and 1 g of charcoal in the reaction
vessel A constant flow of 200 mL min-1 oxygen producing 100 μg mL-1 ozone was
introduced to each mixture for 3 6 9 and 12 hours respectively Percent conversion and
selectivity of major products formed and their yields after ozonation were monitored by
gas chromatography after each time interval Data for these experiments are shown in
Table 312 and Figure 317
Table 312 Percent conversion and selectivity data for the ozone initiated oxidation of m-xylene in
the presence of activated charcoal as a function of time
Oxygen flow rate = 200 mL min-1 Ozone concentration = 100 μg mL-1
As seen in Table 312 the percent conversion of m-xylene increased proportionately with
ozone treatment time The simultaneous use of ozone and activated carbon resulted in the
conversion of 239 m-xylene after 12 hours to the same oxygenated products
Conversion of m-xylene was significantly improved by the catalytic action of activated
carbon when compared to ozonation treatment alone reported earlier in this chapter as
192 conversion after 12 hours of ozone exposure Since activated carbon was reported
to work as an absorbent and also as a catalytic agent in the ozone treatment of dyes
together with ozone123 similar reactions might have taken place in the case of m-xylene
Ozonation Time (h)
Conversion ()
Selectivity ()
3-MBAlc 3-MBAlde 3-MBAcid Other
3 113 313 446 00 241
6 180 330 288 135 247
9 207 331 268 147 256
12 239 354 231 183 235
80
Figure 317 Percent conversion of m-xylene and selectivity profiles of product formation versus
ozonation time (m-xylene in 1 g activated charcoal)
In Figure 317 m-xylene conversion and the selectivityrsquos for the formation of 3-MBAlc
3-MBAlde 3-MBAcid and the ldquootherrdquo products are plotted as a function of ozonation
time at a constant ozone dose of 100 μg mL-1 The results show a steady decrease in
selectivity towards 3-MBAlde and an increase in selectivity towards 3-MBAcid as
ozonation time increases This is due to the oxidation of 3-MBAlde to 3-MBAcid Ozone
treatment combined with activated carbon converted m-xylene more rapidly than that
with ozone alone The conversion of m-xylene as well as some of the oxidation by-
products through ozonation in the presence of activated carbon is a result of a complex
combination of homogeneous and heterogeneous reactions Both direct and indirect
ozone reactions occur in the liquid phase Additionally reactions between adsorbed
species and oxygen radicals formed on the surface of the activated carbon are thought to
occur Several authors have reported that activated carbon accelerates the decomposition
of ozone124 They concluded that both textural and surface chemical properties influence
the decomposition According to the literature two possible pathways can explain the
decomposition of ozone in the presence of activated charcoal The first pathway
0
5
10
15
20
25
30
35
40
45
50
2 3 4 5 6 7 8 9 10 11 12
Con
vers
ion
and
Sele
ctiv
ity (
)
Ozonation Time (h)
conversion - m-xylene S - 3-MBAlc
S - 3-MBAlde S - 3-MBAcid
S - other
81
suggested that activated carbon acts as an initiator of the decomposition of ozone
eventually through the formation of H2O2 yielding free radical species such as bullOH in
solution A second possibility is the adsorption and reaction of ozone molecules on the
surface of the activated carbon yielding surface free radicals
AC + O3 rarr ACminusO
Where ACminusO represents an oxygen-containing active species on the surface of the
activated carbon which can react with the adsorbed organic species151
Table 313 Percent yield of identified products for the ozone initiated oxidation of m-xylene in the
presence of activated charcoal as a function of time
Table 313 presents data for the percentage yield of products formed during ozonation of
m-xylene in the presence of activated charcoal It is clearly evident that the yield of
identified products 3-MBAlc 3-MBAlde 3-MBAcid and small oxygenated compounds
referred to as ldquootherrdquo increases with an increase in ozone treatment time Yield of
3-MBAc increased gradually from 35 after 3 h ozonation to 85 h after 12 h of ozone
treatment The yield of 3-MBAlde remained almost constant with 50 recorded after
3 h to 55 after 12 h of ozone treatment The formation of 3-MBAcid only occurred
after 3 h of ozonation with 24 being formed after 6 h increasing to 44 after 12 h
of ozonation
Ozonation Time (h)
Yield ()
3-MBAlc 3-MBAlde 3-MBAcid Other
3 35 50 00 27
6 59 52 24 45
9 68 55 30 53
12 85 55 44 55
82
351 Comparison of data for ozone initiated oxidation of m-xylene in
the presence of activated charcoal
Figure 318 gives an illustration of the ozone initiated conversion of m-xylene and
m-xylene in the presence of activated charcoal It is evident that ozone oxidation of the
substrate molecule combined with activated charcoal is more effective compared to
ozonation alone
Figure 318 Comparison of percent conversion of m-xylene and m-xylene in activated charcoal
versus ozonation time
Conversion of m-xylene to oxygenated products when ozonation is carried out in the
presence of activated charcoal is significantly higher at all time intervals This can
probably be due to catalytic effects provided by the carbon surface Higher rates of
reactivity are achieved since the carbon surface has orientated the m-xylene molecules to
allow the active radicals to successfully oxidize them There is also a higher probability
of collisions between m-xylene molecules as they are now present at few angstrom layers
on the carbon surface resulting in higher concentrations instead of being diluted in a
much larger volume
0
5
10
15
20
25
30
2 4 6 8 10 12
Con
vers
ion
()
Ozonation Time (h)
m-xylene
m-xylene in charcoal
83
Figure 319 Comparison of percent yield of 3-MBAlc formed during ozonation of m-xylene and
m-xylene in the presence of activated charcoal
Figure 320 Comparison of percent yield of 3-MBAlde formed during ozonation of m-xylene and
m-xylene in the presence of activated charcoal
0
1
2
3
4
5
6
7
8
9
2 3 4 5 6 7 8 9 10 11 12 13
Ye
ild (
)
Ozonation Time (h)
3-MBAlc (m-xylene)
3-MBAlc (m-xylene + charcoal)
1
2
3
4
5
6
2 3 4 5 6 7 8 9 10 11 12 13
Ye
ild (
)
Ozonation Time (h)
3-MBAlde (m-xylene)
3-MBAlde (m-xylene + charcoal)
84
Figure 321 Comparison of percent yield of 3-MBAcid formed during ozonation of m-xylene and
m-xylene in the presence of activated charcoal
Figure 322 Comparison of percent yield of ldquootherrdquo products formed during ozonation of m-xylene
and m-xylene in the presence of activated charcoal
0
1
2
3
4
5
2 3 4 5 6 7 8 9 10 11 12 13
Ye
ild (
)
Ozonation Time (h)
3-MBAcid (m-xylene)
3-MBAcid (m-xylene + charcoal)
1
2
3
4
5
6
2 3 4 5 6 7 8 9 10 11 12 13
Ye
ild (
)
Ozonation Time (h)
other (m-xylene)
other (m-xylene + charcoal)
85
A comparison of the yield of products formed illustrated in Figures 319 ndash 322 reveals
that the yield of all identified products is higher when ozonation is carried out in the
presence of activated charcoal An observation of Figure 320 shows that the formation of
3-MBAlde remains constant during the 12 h of ozonation It is also evident from Figure
321 that the formation of 3-MBAcid increases sharply during the same period of
ozonation This pattern of product formation suggests that ozonation in the presence of
activated charcoal not only improves the conversion rate of m-xylene but also enhances
the oxidation of the aromatic aldehyde to its corresponding acid
36 Ozonation of 1 m-xylene in the presence of water
In order to study the oxidation of m-xylene in water acetic acid and acetone was used as
a third medium to obtain a miscible reaction mixture Mixtures containing 1 m-xylene
in 100 solvent and 70 30 ratio (solvent water) were ozonated for 10 20 30 40 50
60 and 90 minutes respectively Table 314 and Figure 323 present reaction data for the
conversion of 1 m-xylene in 70 30 ratio (acetic acid water) and 100 acetic acid as
a function of ozone treatment time An observation of the data in Table 314 and Figure
323 shows that percent conversion of m-xylene increases in both cases with ozone
treatment time however it is evident that conversion of the target compound is
significantly higher when ozonation is carried out in the presence of water In the first 30
minutes 963 of m-xylene in water is converted compared to 613 conversion in the
absence of water Ozone in aqueous solution is thought to generate hydroxyl radicals138
which together with the natural oxidizing ability of ozone leads to an improvement of the
conversion rate of m-xylene
86
Table 314 Percent conversion of 1 m-xylene in 100 acetic acid and 70 30 ratio
(acetic acid water) as a function of ozone treatment time
Ozonation time (min)
Conversion
1 m-xylene in 100 acetic acid
1 m-xylene in 70 30 ratio
(acetic acid water)
10 406 476
20 498 755
30 613 963
40 661 974
50 690 998
60 903 1000
90 975 1000
Oxygen flow rate = 200 mL min-1 Ozone concentration = 100 μg mL-1
Figure 323 Comparison of percent conversion of m-xylene in 100 acetic acid and 70 30 ratio
(acetic acid water) versus ozonation time
0
20
40
60
80
100
120
0 20 40 60 80 100
Con
vers
ion
()
Ozonation time (min)
1 m-xylene in 70 30 (acetic acid water) 1 m-xylene in 100 acetic acid
87
When acetone was used as a solvent a similar pattern of m-xylene conversion was
observed Table 315 and Figure 324 presents reaction data for the conversion of 1
m-xylene in 70 30 ratio (acetone water) and 100 acetone and 1 m-xylene in
70 30 ratio (acetone water) and 100 acetone in the presence of activated charcoal as
a function of ozone treatment time
Table 315 Percent conversion of m-xylene in 100 and 70 30 ratio (acetone water) as a function of ozone treatment time
Ozonation time (min)
Conversion
m-xylene in 100 acetone
m-xylene in 70 30 acetone water
m-xylene in 100 acetone + charcoal
m-xylene in 70 30 acetone water +
charcoal 10 312 419 345 494
20 396 611 433 710
30 603 846 623 920
40 752 953 811 1000
50 805 1000 834 1000
60 854 1000 879 1000
90 988 1000 1000 1000
Oxygen flow rate = 200 mL min-1 Ozone concentration = 100 μg mL-1
It is evident from Figure 324 that the presence of water significantly improves the
conversion of m-xylene Furthermore when ozonation is conducted in the presence of
activated charcoal a further improvement in conversion rate is noted Activated carbon in
aqueous solution is able to convert ozone to hydroxyl radicals138 It is therefore suggested
that added activated charcoal increases the amount of hydroxyl radical needed for
m-xylene oxidation resulting in enhancement of conversion rate
88
Figure 324 Comparison of percent conversion of m-xylene in 100 and 70 30 ratio
(acetone water) versus ozonation time
37 Reaction sequence for m-xylene ozonation
A general pathway for the oxidation of m-xylene by ozone is proposed in Scheme 30
This reaction sequence involves all intermediates detected leading to 3-methylbenzoic
acid formic and acetic acids as ultimate generated carboxylic acids The main oxidizing
agents are O3 for ozonation alone and O3organic solvent O3hydroxyl radical and
O3activated carbon for catalyzed ozonations
CH3
CH3
O3
CH3
CH2 OH
O3
CH3
CH
O
O3
CH3
C
O
OH
m-xylene 3-methylbenzyl alcohol 3-methylbenzaldehyde 3-methylbenzoic acid
+ other
Scheme 30 General pathway for the reaction of m-xylene with ozone
0
20
40
60
80
100
120
5 15 25 35 45 55 65 75 85 95
Con
vers
ion
()
Ozonation time (min)
m-xylene in 100 acetone m-xylene in 70 30 acetone water
m-xylene in 100 acetone + charcoal m-xylene in 70 30 acetone water + charcoal
89
The pr ocess is initiated b y th e dire ct attack of the methyl group b y O3 giving
3-methylbenzyl alcohol as a pr imary ox idation product This reaction is faster in the
O3solvent and O3activated carbon system where more amount of ozone can react with
the initial reactant
Stary et al139 studied the reactions of ozone with organic substrates as possible sources of
singlet ox ygen In a nu mber of c ases they provided evidence that sin glet ox ygen is
produced in the ozonation reaction which was found to be a good source for chemical
oxidation reactions The ozonation of 3-methylbenzaldehyde is thought to proceed in this
way b y fir st forming th e 3 -methylbenzaldehyde hydrotrioxide mol ecule a nd thereafter
producing 3 -methylbenzoic acid and sing let ox ygen Th e pr oposed mechanism for thi s
reaction is shown in Scheme 31
CH3
C
O
O
O
O
H
CH3
C
O
O
O
O
H
CH3
C
O
O
H
+ O2
3-methylbenzaldehyde 3-methylbenzoic acid
H
O
1
singlet oxygen
Scheme 31 Proposed mechanism for 3-methylbenzaldehyde ozonation
The pr ocess is initiated by th e dire ct attack of the methyl group b y O3 giving
3-methylbenzyl alcohol as a pr imary ox idation product This reaction is faster in the
O3solvent and O3activated carbon system where more amount of ozone can react with
the initial reactant
Bailey et al143 proposed that aromatic compounds can react with ozone via three distinct
mechanisms (i) 13 -dipolar cycloaddition or o zonolysis a t the bond or bonds with
greatest double bond character (ii) electrophilic attack on the most polar bonds or atoms
with the lowest localization energy and (iii) thr ough a conjugated addition when there
90
is a highly reactive diene They studied the oxidation of aromatic compounds and
concluded that when the stoichiometry is one the main mechanism is 13-dipolar
cycloaddition at the double bond o highest electron density Beltraacuten et al152 corroborated
these results after analyzing the ozonation of polycyclic aromatic hydrocarbons They
found that the oxidation of phenanthrene which only occurred by 13-dipolar
cycloaddition had a stoichiometric factor of one mole ozone consumed per one mole
hydrocarbon consumed Pryor et al153 observed that the ozonation of alkenes with
electron- withdrawing substituentrsquos takes place mainly via 13-dipolar cycloaddition
Moreover olefins in which the double bond is connected to electron-donating groups
react many times faster than those in which it is connected to electron-withdrawing
groups
CH3
CH3
O3
CH3
CH3
O
OO
OO
CH3
CH3
O O
O
CH3
CH3
H2O+ + other products
Scheme 32 13 Dipolar cycloaddition of m-xylene
In the light of the above observations and the experimental results obtained it can be
proposed that the ozone attack on the aromatic ring of m-xylene proceeds mostly by
13-dipolar cycloaddition to the carbon ndash carbon double bond of the highest electron
density According to Criegee111 and Bailey143 the first step is a 13-dipolar addition of
ozone to the substrate to give the ldquoinitialrdquo or ldquoprimaryrdquo ozonide This ozonide may then
undergo various reactions to give the corresponding carbonyl products which could then
be degraded by further oxidation
91
40 Introduction The efficiency of ozone initiated oxidation of 2-chloroethanol was investigated at various
experimental conditions as a function of time Ozonation experiments were conducted
under solvent free conditions in the presence of solvents acetic acid and ethyl acetate
and in the presence of charcoal Since 2-chloroethanol is highly soluble in water
experiments were also conducted to study its conversion and product formation in the
presence of water at different pH values and in the presence of hydrogen peroxide
The kinetics of the reaction of organic compounds with ozone has been measured for
several hundred compounds The second order rate constant for the reaction of olefins
with ozone (ethane k = 18 x 105 M-1s-1) decreases by a factor of ge 10 for each additional
chlorine substituent Chloroethene reacts very quickly with ozone with a half-life of 25 s
for an ozone concentration of 1 mg L-1 Dichloroethenes still have a relatively high
reactivity with ozone The reactivity of tri- and tetrachloroethene with ozone is
substantially lower and especially in the case of tetrachloroethene the oxidation is
governed by OH∙ radicals147 Limited data is available for the oxidation of
2-chloroethanol Most studies involved the use of biodegrading agents21 and
photochemical methods125
41 Product identification for ozonation of 2-chloroethanol Chromatograms of 2-chloroethanol before ozonation shown in Figure A40 and
2-chloroethanol after 12 hours of ozonation shown in Figure A41 provides sufficient
evidence that the substrate was oxidized to a mixture of major and minor products The
isolated products formed during the ozonation were characterized and quantified by GC
analysis The peak at 857 minutes refer to the elution of unreacted 2-chloroethanol
Peaks at 7776 and 11272 minutes refer to the elution of the positively identified
products acetaldehyde (AcAlde) and acetic acid (AA) respectively
92
411 Chloride and Conductivity analysis of product mixture Analysis of the ozonated solutions for ldquofreerdquo chloride ions released by the oxidation of
2-chloroethanol was performed by ion chromatography and an ion analyzer fitted with a
chloride ion selective electrode In all cases the parts per million of chloride ions were
found to increase with an increase in ozone treatment time The chloride ions formed
during the ozonation process at different conditions showed no evidence of further
oxidation to chlorine gas Direct conductivity measurements made to the ozonated
samples showed that solution conductivity increased with increase in chloride ion
concentration This therefore suggests that the ldquofreerdquo chloride ions are the only
contributing factor for the increase in solution conductivity The trends in ppm chloride
ions and solution conductivity during ozonation are discussed later in this chapter
412 Analysis of the product mixture by 1H NMR The 1H NMR spectrum of acetaldehyde is presented in Figure A42 Two types of
hydrogens are found in aldehydes the aldehyde hydrogen and the α-hydrogens (those
hydrogens attached to the same carbon as the aldehyde group) The chemical shift of the
proton in the aldehyde group (-CHO) is found in the range 9 ndash 10 ppm Protons appearing
in this region are very indicative of an aldehyde group since no other protons appear in
this region The CH3 group adjacent to the carbonyl group appears in the range of
45 ndash 50 ppm which is typical of protons on the α-carbon
413 Analysis of the product mixture by GC-MS The mass spectrum obtained for the isolated carboxylic acid (acetic acid) is shown in
Figure A43 A very weak molecular ion peak characteristic of a short-chain acid
appears at mz = 60 The loss of OH and COOH through α-cleavage occurs on either side
of the C=O Loss of OH gives rise to a strong peak at mz = 43 Loss of COOH gives rise
to weak peak at mz = 15
93
414 Analysis of the product mixture by FTIR Infra-red spectra obtained for 2-chloroethanol before ozonation and 2-chloroethanol after
ozonation were also compared The spectrum of 2-chloroethanol (Figure A44) shows a
strong broad band due to O ndash H stretching at 3333 cm-1 characteristic of the hydrogen-
bonded alcohol Another strong broad band due to C ndash O stretching appears around the
1050 cm-1 region characteristic of a primary alcohol Two strong bands in the 800 ndash
600 cm-1 region arise from the stretching vibration of the C ndash Cl bond in 2-chloroethanol
The IR spectrum of ozonated 2-chloroethanol (Figure A45) showed the peaks and bands
at their usual positions for 2-chloroethanol but a prominent strong absorption peak is
observed at 1723 cm-1 which is characteristic of the carbonyl functional group This
stretching indicates the presence of aldehydes andor carboxylic acid compounds
42 Oxidation of 2-chloroethanol under solvent free conditions The ozone initiated oxidation of 2-chloroethanol was investigated for 3 6 9 12 18 and
24 h respectively Twenty milliliters of 2-chloroethanol was pipetted into the reaction
vessel and a constant flow of 200 mL min-1 oxygen producing 100 g mL-1 ozone was
bubbled into each vessel for 3 6 9 12 18 and 24 h respectively at a reaction
temperature of 25 oC Results for these experiments showing percent conversion of
substrate and percent selectivity towards products at various time intervals are listed in
Table 40 An observation of the data shows that percent conversion of 2-chloroethanol
increases as a function of ozonation time Percentage conversion of the substrate
increases from 10 for 3 hours ozonation to 520 for 24 h ozonation The conversion
of 2-chloroethanol increased steadily from 3 h to 6 h with low conversion in the first
9 h and thereafter a fairly rapid increase in conversion up to 24 h This pattern of
2-chloroethanol conversion is similar to the conversion of m-xylene ozonation which was
discussed extensively in chapter 3 suggesting that the reaction between 2-chloroethanol
and ozone is mass transfer controlled as reported by Bollyky112
94
In Figure 40 2-chloroethanol conversion and the selectivity data for the formation of
AcAlde and AA and the unknown products are plotted as a function of ozonation time at
a constant ozone dose of 100 g mL-1
Table 40 Percent conversion of 2-chloroethanol and product selectivity data for the ozone
initiated oxidation of 20 mL 2-chloroethanol as a function of time
Oxygen flow rate = 200 mL min-1 Ozone concentration = 100 μg mL-1 AcAlde = acetaldehyde AA = acetic acid
Figure 40 Percent conversion of 2-chloroethanol and product selectivity versus ozonation time
The results show a steady decrease in selectivity towards both AcAlde and AA and an
increase in selectivity towards the unknown products during the 3 h to 6 h time interval
0
10
20
30
40
50
60
70
0 3 6 9 12 15 18 21 24
Con
vers
ion
and
Sel
ectiv
ity (
)
Ozonation time (h)
conversion - 2-CE S - AcAlde S - AA S - unknown
Ozonation Time (h)
Conversion ()
Selectivity ()
AcAlde AA Unknown
3 10 402 598 00
6 25 352 488 160
9 99 375 484 141
12 219 372 489 139
18 413 391 485 124
24 520 384 500 116
95
thereafter remaining constant up to 24 h of ozonation This is due to the oxidation of
AcAlde to AA implying the existence of successive reactions for these products at longer
ozonation times G Pace et al125 studied the oxidation of acetaldehyde in the presence of
H2O2 using UV irradiation They found that 50 of the acetaldehyde was easily oxidized
to acetic acid in 60 minutes Since ozone is a strong oxidizing agent a similar process
may have occurred here
Table 41 Solution conductivity chloride ion content and product yields for the ozonation of
2-chloroethanol as a function of time
Oxygen flow rate = 200 mL min-1 Ozone concentration = 100 g mL-1
Figure 41 Chloride ion content and solution conductivity of ozonated 2-chloroethanol versus time
0
2000
4000
6000
8000
10000
0
200
400
600
800
1000
1200
2 4 6 8 10 12 14 16 18 20 22 24
Con
duct
ivity
(μS
cm
-1)
Chl
orid
es (p
pm)
Ozonation time (h)
Chlorides Conductivity
Ozonation Time (h)
Conductivity
( S cm-1)
Chlorides
(ppm)
Yield ()
AcAlde AA Unknown
3 318 86 04 06 00
6 2030 209 09 12 04
9 3930 445 37 48 14
12 5061 585 81 107 31
18 7017 806 161 200 52
24 8938 1014 200 260 60
96
Figure 41 and Table 41 shows the relationship between chloride ion content and
conductivity of the reaction mixture after 3 6 9 12 18 and 24 h respectively It can be
seen that the ozonation of 2-chloroethanol yield quantitative amounts of chloride ion as
one of the major products and there is a steady increase of Cl- with an increase in
ozonation time This pattern of chloride formation indicates that dechlorination is a major
reaction mechanism occurring during ozonation of 2-chloroethanol The concentration of
chloride ions released during the reaction of 2-chloroethanol with ozone was found to
range from 86 ppm after 3 h to 1014 ppm after 24 h This behavior is consistent with
studies conducted by other researchers N Graham et al126 showed that the degradation of
246-trichlorophenol with ozone resulted in the release of large amounts of chloride ions
and the number of chloride ions increased with the extent of 246-trichlorophenol
degraded G Pace et al125 reported on the oxidation of 2-chloroethanol by H2O2 under
UV irradiation Their results showed that the oxidation of 2-chloroethanol generated
significant amounts of Cl- ions and their yields increased as a function of substrate
degradation It is also evident from the results of the conductivity measurements that
there is a steady increase in conductivity of the reaction solution as the ozonation time is
increased This is most likely due to the presence of the chloride ion formed during the
ozonation process since it is the only conducting species that can contribute significantly
to the specific conductivity of the reaction mixture We would expect the conductivity of
the partially dissociated weak organic acids to be negligible
Figure 42 Percentage yield of AcAlde AA and unknown product versus ozonation time
0
5
10
15
20
25
30
3 6 9 12 18 24
Yeild
()
Ozonation time (h)
AcAlde AA unknown
97
The percentage yield of major products namely acetaldehyde (AcAlde) and acetic acid
(AA) and minor unknown products formed during the ozone initiated oxidation of
2-chloroethanol are presented in Figure 42 It is clear that yields for all products
increase as ozonation time increase At all time intervals the percentage yield of AA was
significantly higher than AcAlde suggesting that ozone has readily oxidized the
acetaldehyde to its corresponding organic acid
43 Ozone initiated oxidation of 2-chloroethanol in the presence of
organic solvents The effects of chemical characteristics of organic solvents such as acetic acid and ethyl
acetate on the decomposition of m-xylene by ozonation were extensively studied in
chapter 3 The results showed that the presence of organic solvents that do not react with
ozone like acetic acid or ethyl acetate significantly improved the rate of conversion of
m-xylene to value added products during ozonation This is consistent with many
researchers who reported that the presence of organic solvents like acetic acid ethyl
acetate and many others considerably improves the solubility of ozone in the reaction
mixture thereby increasing mass transfer effects and influencing the extent of organic
substrate conversion Since there has been no reported study on the ozonation of
2-chloroethanol in the presence of acetic acid or ethyl acetate it is not known whether or
not it will have any influence on the ozonation process Therefore a study has been
conducted to ascertain the reaction characteristics of the ozone initiated oxidation of
2-chloroethanol in the presence of acetic acid or ethyl acetate
431 Effect of acetic acid on ozonation of 2-chloroethanol The influence of acetic acid on the ozonation of 2-chloroethanol was investigated One
hundred milligrams per litre ozone was steadily bubbled through a 20 mL mixture of
2-chloroethanol and 5 acetic acid for 3 6 9 and 12 h under similar experimental
conditions as for the ozonation of 2-chloroethanol in the absence of solvent
98
Chromatographic analysis of the product mixture showed the same pattern of product
formation as for the oxidation of pure 2-chloroethanol with AcAlde and AA being the
major product No new products peaks were observed during the ozonation of
2-chloroethanol in the presence of 5 acetic acid
Data for these experiments showing conversion of substrate and selectivity for major
products AcAlde and AA and minor unknown products at different ozonation times are
illustrated in Table 42 and Figure 43
Table 42 Percent conversion and product selectivity data for the ozone initiated oxidation of
2-chloroethanol in 5 acetic acid as a function of time
Oxygen flow rate = 200 mL min-1 Ozone concentration = 100 g mL-1
Figure 43 Percent conversion of 2-chloroethanol in the presence of 5 acetic acid and selectivity
profile of products versus ozonation time
0
10
20
30
40
50
60
70
2 3 4 5 6 7 8 9 10 11 12 13
Con
vers
ion
and
Sel
ectiv
ity (
)
Ozonation time (h)
conversion - 2-CE S - AcAlde S - AA S - unknown
Ozonation Time (h)
Conversion ()
Selectivity ()
AcAlde AA Unknown
3 78 404 574 22
6 106 392 506 103
9 134 404 474 122
12 262 409 483 108
99
Results presented in Table 42 show that the percent conversion of 2-chloroethanol
increases gradually from 78 after 3 h ozonation to 134 after 9 h ozonation and
thereafter increasing rapidly to 262 after 12 h ozonation This pattern of substrate
conversion suggests that oxidation rates increase significantly when substrate molecules
are exposed to ozone gas for longer periods The selectivity profiles for the ozonation of 2-chloroethanol in the presence of 5 acetic
acid showed similar trends when compared to the ozonation of 2-chloroethanol in the
absence of solvent Selectivity towards AcAlde did not change significantly from 404
after 3 h ozonation to 409 after 12 h while selectivity towards AA decreased
gradually from 574 after 3 h to 483 after 12 h ozonation
Table 43 Solution conductivity chloride content and product yields for the ozonation of
2-chloroethanol in 5 acetic acid as a function of time
Ozonation Time (h)
Conductivity
( S cm-1)
Chlorides
(ppm)
Yield ()
AcAlde AA Unknown
3 332 92 31 45 02
6 2194 226 41 53 11
9 4068 461 54 63 17
12 5279 610 107 126 28
Table 43 shows the relationship between increasing chloride ion content and increasing
conductivity of the reaction mixture after 3 6 9 and 12 h respectively It is evident that
the ozonation of 2-chloroethanol in the presence of 5 acetic acid yields quantitative
amounts of chloride ion as one of the major products and there is a steady increase of Cl-
with an increase in ozonation time The ppm chlorides obtained in the presence of acetic
acid were slightly higher than in the absence of acetic acid The difference in the chloride
concentration ranged from 6 ppm after 3 h ozonation to 25 ppm after 12 h It is also
evident from the results of the conductivity measurements that there is a steady increase
in conductivity of the reaction solution as the ozonation time is increased The specific
conductivity of the ozonated mixture in the presence of acetic acid was slightly higher
100
than to the ozonated mixture in the absence of acetic acid The difference in specific
conductivity ranged from 14 S cm-1 after 3 h ozonation to 218 S cm-1 after 12 h
The percentage yields of major products namely acetaldehyde (AcAlde) and acetic acid
(AA) and minor unknown products are shown in Table 43 It is clear that product
formation increases as ozonation time increases At all time intervals the percentage yield
of AA was significantly higher than AcAlde indicating that the aldehyde is readily
oxidized to its corresponding organic acid The yields of the major products AcAlde and
AA obtained in the presence of acetic acid were slightly higher than in the absence of the
organic solvent The difference in the yields for AcAlde and AA after 3 h ozonation
ranged from 27 and 39 respectively and after 12 h continuous ozonation ranged
from 26 to 19 respectively
The effect of a higher concentration of acetic acid on the ozonation of 2-chloroethanol
was investigated One hundred milligrams per litre ozone was steadily bubbled through
20 mL aliquot mixtures of 2-chloroethanol and 20 acetic acid for 3 6 9 and 12 h under
similar experimental conditions as for the ozonation of 2-chloroethanol in the absence of
solvent Analyzed data for these experiments showing conversion of substrate and
selectivity towards major products AcAlde and AA and minor unknown products at
different ozonation times are illustrated in Table 44 and Figure 44
Table 44 Percent conversion and product selectivity data for the ozone initiated oxidation of
2-chloroethanol in 20 acetic acid as a function of time
Ozonation Time (h)
Conversion ()
Selectivity ()
AcAlde AA Unknown
3 173 421 533 46
6 281 407 525 68
9 481 383 503 114
12 569 398 466 136
Oxygen flow rate = 200 mL min-1 Ozone concentration = 100 g mL-1
101
Figure 44 Percent conversion of 2-chloroethanol in the presence of 20 acetic acid and
selectivity profile of products versus ozonation time
Results in Table 44 and Figure 44 show that the percent conversion of 2-chloroethanol
increases from 173 after 3 h ozonation to 569 after 12 h ozonation Most evident is
that the percentage of conversion of 2-chloroethanol improved significantly when
ozonation is carried out in the presence of 20 acetic acid The selectivity profiles for
the ozonation of 2-chloroethanol in the presence of 20 acetic acid showed similar
trends when compared to the ozonation of 2-chloroethanol in 5 acetic acid Selectivity
towards AcAlde did not change significantly from 421 after 3 h ozonation to 398
after 12 h while selectivity towards AA decreased gradually from 533 after 3 h to
466 after 12 h ozonation
Table 45 shows the relationship between increasing chloride ion content and increasing
conductivity of the reaction mixture after 3 6 9 and 12 h respectively It is evident that
the ozonation of 2-chloroethanol in the presence of 20 acetic acid yields quantitative
amounts of chloride ion as one of the major products and there is a steady increase of Cl-
ions with an increase in ozonation time The ppm chlorides obtained in the presence of
acetic acid were slightly higher than in the presence of 5 acetic acid The difference in
the chloride concentration ranged from 8 ppm after 3 h ozonation to 180 ppm after 12 h
0
10
20
30
40
50
60
2 3 4 5 6 7 8 9 10 11 12 13
Con
vers
ion
and
Sel
ectiv
ity (
)
Ozonation time (h)
conversion - 2-CE S - AcAlde S - AA S - unknown
102
Table 45 Solution conductivity chloride ion content and product yields for the ozonation of
2-chloroethanol in 20 acetic acid as a function of time
Ozonation Time (h)
Conductivity
( S cm-1)
Chlorides
(ppm)
Yield ()
AcAlde AA Unknown
3 370 100 73 92 08
6 2550 262 114 148 18
9 5431 615 184 242 55
12 6832 790 227 265 77
Oxygen flow rate = 200 mL min-1 Ozone concentration = 100 g mL-1
It is also evident from the results of the conductivity measurements that there is a steady
increase in conductivity of the reaction solution as the ozonation time is increased The
specific conductivity of the ozonated mixture in the presence of 20 acetic acid was
slightly higher when compared to the ozonated mixture in 5 acetic acid
The percentage yields of major products namely acetaldehyde (AcAlde) and acetic acid
(AA) and minor unknown products are shown in Table 45 It is clear that product
formation increases as ozonation time increases At all time intervals the percentage yield
of AA was significantly higher than AcAlde indicating that the aldehyde is readily
oxidized to its corresponding organic acid The yields of the major products AcAlde and
AA obtained in the presence of 20 acetic acid were slightly higher than that obtained in
5 acetic acid suggesting that a higher concentration of solvent favors the ozone
initiated oxidation of 2-chloroethanol
103
432 Comparison of data for ozonation of 2-chloroethanol in the
presence of acetic acid The data obtained for the ozonation of 2-chloroethanol at different reaction conditions
were consolidated and compared Results for the conversion of 2-chloroethanol with and
without the presence of 5 and 20 acetic acid mixtures are presented in Figure 45
Figure 45 Comparison of 2-chloroethanol conversion with and without the presence of acetic
acid versus ozonation time
It is evident from the conversion profiles that the percentage conversion of
2-chloroethanol is improved when ozone reactions are carried out in the presence of
acetic acid Furthermore it is observed that an increase in the concentration of the added
solvent significantly increases the conversion rate of the substrate molecule In previous
studies various organic compounds were decomposed by ozonation in several organic
solvents showed similar behavior Shigimitu133 found that certain organic solvents have a
higher capacity of ozone solubilization than water Nakano et al120 showed that the
solubility of ozone in pure acetic acid to be 87 times higher than in distilled water Henry
et al135 reported that the ozonation rate for trans-stilbene increased with the increase in
solvent polarity whereas Gomes et al134 found that the reaction rates of stilbene with
allyl chloride were independent of the solvent polarity
0
10
20
30
40
50
60
2 3 4 5 6 7 8 9 10 11 12 13
Con
vers
ion
()
Ozonation time (h)
2-CE
2-CE in 5 AA
2-CE in 20 AA
104
Selectivity Profiles of major products AcAlde and AA illustrated in Figure 46 shows that
selectivity for AA is the highest in reactions with and without the presence of acetic acid
while AcAlde shows the lowest selectivity This pattern of product formation indicates
that the AcAlde formed is rapidly oxidized to its corresponding acid AA Furthermore it
is observed that the oxidation of products increase with an increase in solvent
concentration suggesting a fast reaction in the presence of acetic acid Selectivity towards
AcAlde from 6 h to 9 h ozonation of 2-chloroethanol in 20 acetic acid showed a rapid
decrease indicating improved conversion of AcAlde to AA It can therefore be suggested
that the presence of 20 acetic acid has the greatest influence on the ozonation process
Figure 46 Comparison of selectivity for AcAlde and AA formed during the ozonation of
2-chloroethanol with and without the presence of acetic acid versus time
A comparison of the percentage yields of major products namely acetaldehyde (AcAlde)
and acetic acid (AA) formed during the ozone initiated oxidation of 2-choroethanol and
2-chloroethanol in the presence of 5 and 20 acetic acid as a function of ozonation
time is shown in Figure 47
35
40
45
50
55
60
2 3 4 5 6 7 8 9 10 11 12 13
Sele
ctiv
ity (
)
Ozonation Time (h)
AcAlde (2-CE) AcAlde (2-CE in 5 AA) AcAlde (2-CE in 20 AA)AA (2-CE) AA (2-CE in 5 AA) AA (2-CE in 20 AA)
105
Figure 47 Comparison of yield of AcAlde and AA formed during the ozonation of 2-chloroethanol
with and without the presence of acetic acid versus time
An observation of the profile shows an increase in product yield as ozonation time
increases The yield of AA was significantly higher than the yield of AcAlde implying
that the aldehyde is readily oxidized to its corresponding organic acid Higher product
yields were obtained when the substrate was ozonated in the presence of 20 acetic acid
and a significant increase in the yield of both AcAlde and AA is observed This pattern of
product formation suggests that the presence of the added solvent acetic acid has a
significant influence on the ozonation process and increasing the solvent strength further
enhances the oxidation process
The chloride ion formation during the ozonation of 2-chloroethanol with and without the
presence of acetic acid is shown in Figure 48 The pattern of chloride formation in
acetic acid is similar to that in water but the ppm Cl- in the presence of acetic acid was
higher than that in water increasing significantly in the presence of 20 acetic acid As
expected the presence of 20 solvent significantly improved the ozonation process
resulting in an increase in the C-Cl bond cleavage to thus give the highest concentration
of chloride ions in the reaction mixture
0
5
10
15
20
25
30
2 3 4 5 6 7 8 9 10 11 12 13
Yiel
d (
)
Ozonation Time (h)
AcAlde (2-CE) AcAlde (2-CE in 5 AA) AcAlde (2-CE in 20 AA)
AA (2-CE) AA (2-CE in 5 AA) AA (2-CE in 20 AA)
106
Figure 48 Comparison of chloride ion formed during the ozonation of 2-chloroethanol with and
without the presence of acetic acid versus time
433 Effect of ethyl acetate on ozonation of 2-chloroethanol The influence of ethyl acetate on the ozonation of 2-chloroethanol was investigated Four
20 ml aliquots of 5 ethyl acetate in 2-chloroethanol was ozonated for 3 6 9 and 12 h
respectively using the same experimental conditions for ozonation described in chapter 2
Gas chromatographic analysis of the product mixture was performed after each time
interval Peaks for AcAlde and AA appeared at their respective retention times and
besides an additional peak for ethyl acetate no other new product peak was observed
The interpreted results for these experiments showing percent conversion of substrate and
percent selectivity towards major products after 3 6 9 and 12 h of ozonation are
illustrated in Table 46 and Figure 49
It is evident from that the percentage conversion of 2-chloroethanol in the presence of
5 ethyl acetate increases as the ozonation time increases The results show that the
percent conversion of 2-chloroethanol increases from 73 after 3 h ozonation to 441
0
100
200
300
400
500
600
700
800
900
1000
2 3 4 5 6 7 8 9 10 11 12 13
Chl
orid
es (p
pm)
Ozonation time (h)
2-CE
2-CE in 5 AA
2-CE in 20 AA
107
after 12 h ozonation As reported previously the oxidation characteristics of ozone
increase with an increase in ozone contact time with the substrate molecule
Table 46 Percent conversion and product selectivity data for the ozone initiated oxidation of
2-chloroethanol in 5 ethyl acetate as a function of time
Ozonation Time (h)
Conversion ()
Selectivity ()
AcAlde AA Unknown
3 73 421 517 62
6 188 405 498 97
9 273 393 474 133
12 441 389 471 140
Oxygen flow rate = 200 mL min-1 Ozone concentration = 100 g mL-1
Figure 49 Percent conversion of 2-chloroethanol in the presence of 5 ethyl acetate and
selectivity profile for products as a function of ozonation time
The selectivity profiles for the ozonation of 2-chloroethanol in the presence of 5 ethyl
acetate showed similar trends when compared to the ozonation of 2-chloroethanol in the
absence of solvent AA showed the highest selectivity again indicating that AcAlde is
0
10
20
30
40
50
60
2 3 4 5 6 7 8 9 10 11 12 13
Con
vers
ion
and
Sele
ctiv
ity (
)
Ozonation time (h)
conversion - 2-CE S - AcAlde S - AA S - unknown
108
easily oxidized to its corresponding acid Selectivity towards both AcAlde and AA
decreased gradually while selectivity towards the unknown products increased slowly
with an increase in ozonation time This could probably be due to partial mineralization
of products and formation of carbon oxides
Table 47 Solution conductivity chloride ion content and product yields for the ozonation of
2-chloroethanol in 5 ethyl acetate as a function of time
Ozonation Time (h)
Conductivity
( S cm-1)
Chlorides
(ppm)
Yield ()
AcAlde AA Unknown
3 340 93 31 38 04
6 2361 243 76 94 18
9 4614 522 107 130 36
12 6184 715 172 208 62
The percentage yields of major products namely acetaldehyde (AcAlde) and acetic acid
(AA) and minor unknown compounds as a function of ozonation time are shown in Table
47 It is clear that product formation increases as ozonation time increases At all time
intervals the percentage yield of AA was significantly higher than AcAlde indicating that
the aldehyde is readily oxidized to its corresponding organic acid The yields of the major
products AcAlde and AA obtained in the presence of ethyl acetate were slightly higher
when compared to its yields in the absence of the organic solvent indicating that the
presence of the 5 dipolar aprotic solvent ethyl acetate in the reaction mixture definitely
influences the ozonation process
The effect of a higher concentration of ethyl acetate on the ozonation of 2-chloroethanol
was investigated One hundred milligrams per litre ozone was steadily bubbled through
20 mL aliquot mixtures of 20 ethyl acetate in 2-chloroethanol for 3 6 9 and 12 h
respectively under similar experimental conditions as for the ozonation of
pure 2-chloroethanol Chromatographic analysis of the product mixtures showed no new
product peaks Analyzed results from the chromatograms are illustrated in Table 48 and
Figure 410
109
Table 48 Percent conversion and selectivity data for the ozone initiated oxidation of
2-chloroethanol in 20 ethyl acetate as a function of time
Ozonation Time (h)
Conversion ()
Selectivity ()
AcAlde AA Unknown
3 129 316 649 35
6 254 344 604 52
9 341 346 587 67
12 473 353 574 73
Oxygen flow rate = 200 mL min-1 Ozone concentration = 100 g mL-1
It is evident from Table 48 that the percentage conversion of 2-chloroethanol in the
presence of 20 ethyl acetate increases as the ozonation time increases The conversion
after 3 h ozonation was 129 increasing sharply to 473 after 12 h of ozonation again
suggesting an increase in conversion rate with increase ozone gas contact time with the
substrate molecule
Figure 410 Percent conversion of 2-chloroethanol in the presence of 20 ethyl acetate and
selectivity profile of products as a function of ozonation time
0
10
20
30
40
50
60
70
2 3 4 5 6 7 8 9 10 11 12 13
Con
vers
ion
and
Sele
ctiv
ity (
)
Ozonation time (h)
conversion - 2-CE S - AcAlde S - AA S - unknown
110
The selectivity profiles illustrated in Figure 410 for the ozonation of 2-chloroethanol in
the presence of 20 ethyl acetate showed similar trends when compared to the ozonation
of 2-chloroethanol in the absence of solvent and in 5 solvent Selectivity for AA as
expected remained high Selectivity for both AcAlde and AA decreased gradually while
selectivity towards the unknown products increased slightly with an increase in ozonation
time This may have been due to partial mineralization of products and formation of
carbon oxides
Table 49 Solution conductivity chloride ion content and product yields for the ozonation of
2-chloroethanol 20 ethyl acetate as a function of time
Ozonation Time (h)
Conductivity
( S cm-1)
Chlorides
(ppm)
Yield ()
AcAlde AA Unknown
3 356 96 41 84 05
6 2495 257 87 153 13
9 4881 553 118 200 23
12 6346 734 167 272 34
Oxygen flow rate = 200 mL min-1 Ozone concentration = 100 g mL-1
The percentage yields of major products namely acetaldehyde (AcAlde) and acetic acid
(AA) and minor unknown compounds as a function of ozonation time are illustrated in
Table 49 It is clear that product yield increases as ozonation time increases At all time
intervals the percentage yield of AA was significantly higher than AcAlde indicating that
the aldehyde is readily oxidized to its corresponding organic acid The yields of the major
products AcAlde and AA obtained in the presence of 20 ethyl acetate were higher
when compared to its yields obtained in the presence of 5 ethyl acetate indicating that
the presence of the participating solvent with a higher strength has a significant influence
on the ozonation process
111
434 Comparison of data for ozonation of 2-chloroethanol in the
presence of ethyl acetate
Figure 411 Comparison of 2-chloroethanol conversion with and without the presence ethyl
acetate versus ozonation time
Figure 411 compares conversion data of 2-chloroethanol in the presence of 5 and
20 ethyl acetate respectively Most evident is that the percent conversion of
2-chloroethanol is marginally higher when ozonation is carried out in the presence of 5
ethyl acetate It is clearly evident that 2-chloroethanol in the presence of 20 ethyl
acetate gave the highest percentage conversion of substrate It is further observed that for
the first 3 h of ozone treatment the substrate molecule in the presence of solvent shows a
sharp increase in conversion rate whereas in the absence of solvent the conversion rate is
much slower This trend suggests that the presence of ethyl acetate has a significant
influence on the ozonation of 2-chloroethanol to oxygenated products Selectivity profiles
of major products AcAlde and AA are illustrated in Figure 412 The selectivity for AA is
the highest in reactions carried out with and without the presence of acetic acid while
AcAlde shows the lowest selectivity This pattern of product formation indicates that the
AcAlde formed is rapidly oxidized to its corresponding acid AA
0
10
20
30
40
50
2 3 4 5 6 7 8 9 10 11 12 13
Con
vers
ion
()
Ozonation time (h)
2-CE
2-CE in 5 EA
2-CE in 20 EA
112
Figure 412 Comparison of selectivity for AcAlde and AA formed during the ozonation of
2-chloroethanol with and without the presence of ethyl acetate versus time
An interesting observation is that the selectivity for AcAlde in reaction mixtures
containing 20 ethyl acetate showed the lowest result indicating that the conversion of
AcAlde to AA is faster in the presence of 20 ethyl acetate Furthermore it is observed
that the oxidation of products increase with an increase in solvent concentration
suggesting a fast reaction in the presence of increased solvent strength Selectivity for
AcAlde from 6 h to 9 h ozonation of 2-chloroethanol in 5 ethyl acetate showed a rapid
decrease indicating improved conversion of AcAlde to AA In view of these trends it can
therefore be suggested that the presence of 20 acetic acid has the most influence on the
ozonation process
A profile of the percentage yield of major products namely acetaldehyde (AcAlde) and
acetic acid (AA) formed during the ozone initiated oxidation of 2-choroethanol and
2-chloroethanol in the presence of 5 and 20 ethyl acetate as a function of ozone
treatment time is shown in Figure 413
30
35
40
45
50
55
60
65
2 3 4 5 6 7 8 9 10 11 12 13
Sele
ctiv
ity (
)
Ozonation Time (h)
AcAlde (2-CE) AcAlde (2-CE in 5 EA) AcAlde (2-CE in 20 EA)
AA (2-CE) AA (2-CE in 5 EA) AA (2-CE in 20 EA)
113
Figure 413 Comparison of yield of AcAlde and AA formed during the ozonation of
2-chloroethanol with and without the presence of ethyl acetate versus time
It is clear that product yield increase as ozonation time increases In all cases the
percentage yield of AA was found to be significantly higher than the yield of AcAlde
indicating that the aldehyde is readily oxidized to its corresponding organic acid Higher
product yields were obtained when the substrate was ozonated in the presence of 20
ethyl acetate and a significant increase in the yield of AA is observed This pattern of
product formation suggests that the presence of ethyl acetate has a significant influence
on the ozonation process and increasing the solvent strength further enhances the
oxidation process
The ppm chloride ions formed during the ozonation of 2-chloroethanol and
2-chloroethanol in the presence of 5 and 20 ethyl acetate is shown in Figure 414
The chloride content in the reaction mixture increases with an increase in ozone treatment
time The rate of chloride ion formation improved when ozone reactions were conducted
in the presence of ethyl acetate The pattern of Cl- ion formation is similar to that in water
but its concentrations were marginally higher than that in water Increasing the strength
of the solvent from 5 to 20 resulted in a slight improvement in C-Cl bond cleavage
0
5
10
15
20
25
30
2 3 4 5 6 7 8 9 10 11 12 13
Yiel
d (
)
Ozonation Time (h)
AcAlde (2-CE) AcAlde (2-CE in 5 EA) AcAlde (2-CE in 20 EA)
AA (2-CE) AA (2-CE in 5 EA) AA (2-CE in 20 EA)
114
Figure 414 Comparison of chloride ion formed during the ozonation of 2-chloroethanol with and
without the presence of ethyl acetate versus time
44 Effect of activated charcoal on ozonation of 2-chloroethanol The use of activated charcoal adsorption and ozonation has been identified as a suitable
treatment of many contaminants by several researchers These reports imply that the
decomposition of ozone is initiated by the adsorption on the surface of the activated
carbon and the surface characteristics of carbon significantly influence the
decomposition of ozone Activated charcoal presents a large surface area where ozone
and the contaminant could adsorb and react McKay et al156 Kainulainen et al157
Cannon et al158 Croll159 found ozone to readily destroy adsorbed aromatic molecules
which assisted in the regeneration of the activated carbon surface resulting in improved
adsorption capacity Zaror46 also reported that the activated surface groups may be
responsible for catalytic effects found in ozonation in presence of activated charcoal
In the present study the ozone initiated oxidation of 2-chloroethanol in the presence of
activated charcoal was investigated The aim is to analyze the influence of activated
charcoal on 2-chloroethanol conversion and product characterization and yields Four
20 mL aliquots of 2-chloroethanol and 1 g of activated charcoal were placed in the
reaction vessel A constant flow of 200 mL min-1 medical grade oxygen producing
0
100
200
300
400
500
600
700
800
900
2 3 4 5 6 7 8 9 10 11 12 13
Chl
orid
es (p
pm)
Ozonation time (h)
2-CE
2-CE in 5 EA
2-CE in 20 EA
115
100 g mL-1 ozone was introduced to each mixture for 3 6 9 and 12 hours respectively
Percent conversion of substrate selectivity and yields of major products formed during
the ozone reaction were monitored by gas chromatography after each time interval Data
for these experiments are shown in Table 410 and Figure 415
Table 410 Percent conversion and product selectivity for the ozone initiated oxidation of
2-chloroethanol in the presence of 1 g activated charcoal as a function of time
Ozonation Time (h)
Conversion ()
Selectivity ()
AcAlde AA Unknown
3 71 400 600 00
6 101 363 600 38
9 178 347 590 63
12 325 381 465 154
Oxygen flow rate = 200 mL min-1 Ozone concentration = 100 g mL-1
As observed in Table 410 the percent conversion increased in proportion to ozone
treatment time The simultaneous use of ozone and activated carbon resulted in the
conversion of 325 2-chloroethanol after 12 hours to the same oxygenated products
when 2-chloroethanol was ozonated alone Conversion of 2-chloroethanol was
significantly improved by the catalytic action of activated carbon when compared to
ozone treatment alone reported earlier in this chapter as 219 conversion after 12 hours
of ozone exposure Previous reports showed ozone to work as an absorbent and also as a
catalytic agent in the treatment of dyes together with activated carbon123 It is therefore
suggested that similar reactions might have taken place in the case of 2-chloroethanol
In Figure 415 2-chloroethanol conversion and the selectivityrsquos for the formation of
AcAlde AA and the unknown products are plotted as a function of ozonation time using
a constant ozone dose of 100 g mL-1
116
Figure 415 Percent conversion of 2-chloroethanol in the presence of activated charcoal and
selectivity profile for products as a function of ozonation time
The results show a steady decrease in selectivity towards AcAlde from 3 h to 9 h and
thereafter a slight increase up to 12 h The selectivity towards AA remained constant for
the first 9 hours and thereafter decreased gradually as ozonation time increases This is
due to the oxidation of AcAlde to AA and unknown products The ozone treatment
combined with activated carbon converted 2-chloroethanol more rapidly than that with
ozone alone
The percentage yield of products chloride ion content and solution conductivity as a
function of ozonation time are presented in Table 411 It is clear that the rate at which
products are formed increases as ozonation time increases It is also evident that the
conductivity of the reaction mixture increases proportionately with the amount of
chloride ions formed as a function of time This behavior suggests that the Cl- ions
formed is the only species that contributes to an increase in solution conductivity and the
breaking of the C-Cl bond in 2-chloroethanol is enhanced in the presence of activated
charcoal At all time intervals the percentage yield of AA was significantly higher than
AcAlde indicating that the aldehyde is readily oxidized to its corresponding organic acid
The yields of the major products AcAlde and AA obtained in the presence of activated
0
10
20
30
40
50
60
70
2 3 4 5 6 7 8 9 10 11 12 13
Con
vers
ion
and
Sele
ctiv
ity (
)
Ozonation time (h)
conversion - 2-CE S - AcAlde S - AA S - unknown
117
charcoal were slightly higher when compared to its yields in the absence of the charcoal
indicating that the presence of activated charcoal in the reaction mixture definitely
influences the ozonation process
Table 411 Solution conductivity chloride ion content and product yields for ozonation of
2-chloroethanol in the presence of 1g activated charcoal as a function of time
Ozonation Time (h)
Conductivity
( S cm-1)
Chlorides
(ppm)
Yield ()
AcAlde AA Unknown
3 337 91 28 43 00
6 2184 225 37 60 04
9 4240 480 62 105 11
12 5597 647 124 151 50
Oxygen flow rate = 200 mL min-1 Ozone concentration = 100 g mL-1
441 Comparison of data for ozonation of 2-chloroethanol in the
presence of activated charcoal Figure 416 compares the conversion of 2-chloroethanol with and without the presence of
activated charcoal as a function of ozone treatment time It is evident that the conversion
rate of 2-chloroethanol is significantly higher when ozonation is carried out in the
presence of activated charcoal This behavior of substrate conversion is sufficient
evidence to support other researchers that the presence of activated charcoal in reactions
of organic compounds with ozone markedly improves the oxidation process The action
of activated carbon may be two-fold Firstly the surface characteristics of carbon may
assist in the decomposition of ozone and secondly reactions between the ozonide ions and
the substrate molecules may have occurred on the surface of carbon The result of this is
an increased conversion rate of the 2-chloroethanol molecule to AcAlde AA and
unknown products
118
Figure 416 Comparison of percent conversion of 2-chloroethanol with and without the presence
of activated charcoal versus ozonation time
Figure 417 Comparison of selectivity for AcAlde and AA formed during the ozonation of
2-chloroethanol with and without the presence of activated charcoal versus time
0
5
10
15
20
25
30
35
2 3 4 5 6 7 8 9 10 11 12 13
Con
vers
ion
(
)
Ozonation time (h)
2-CE 2-CE with charcoal
30
35
40
45
50
55
60
65
2 3 4 5 6 7 8 9 10 11 12 13
Sele
ctiv
ity (
)
Ozonation Time (h)
AcAlde (2-CE) AcAlde (2-CE with charcoal)AA (2-CE) AA (2-CE with charcoal)
119
Selectivity profiles of major products AcAlde and AA are illustrated in Figure 417 The
selectivity for both AcAlde and AA is high in reactions carried out in the presence of
activated charcoal Selectivity for AcAlde from 3 h to 6 h ozonation of 2-chloroethanol in
the presence of charcoal showed a gradual decrease indicating improved conversion of
AcAlde to AA This pattern of product formation suggests that the AcAlde formed is
rapidly oxidized to its corresponding acid AA In view of these trends in selectivity it
can therefore be suggested that the presence of activated charcoal has a significant
influence on the conversion of the substrate molecule and on the products formed
Figure 418 Comparison of yield of AcAlde and AA formed during the ozonation of
2-chloroethanol with and without the presence of activated charcoal versus time
A profile of the percentage yield of major products namely acetaldehyde (AcAlde) and
acetic acid (AA) formed during the ozone initiated oxidation of 2-choroethanol and
2-chloroethanol in the presence of charcoal as a function of ozone treatment time is
shown in Figure 418 It is clear that product yield increase as ozonation time increases
In all cases the percentage yield of AA was found to be significantly higher than the yield
of AcAlde indicating that the aldehyde is readily oxidized to its corresponding organic
0
2
4
6
8
10
12
14
16
2 3 4 5 6 7 8 9 10 11 12 13
Yiel
d (
)
Ozonation Time (h)
AcAlde (2-CE) AcAlde (2-CE with charcoal)
AA (2-CE) AA (2-CE with charcoal)
120
acid Higher product yields were obtained when the substrate was ozonated in the
presence of activated charcoal and a significant increase in the yield of AA is observed
This pattern of product formation suggests that the presence of charcoal has a significant
influence on the ozonation of 2-chloroethanol to AcAlde AA and unknown products
Figure 419 Comparison of chloride ions formed during the ozonation of 2-chloroethanol with and
without the presence of activated charcoal versus time
Figure 419 shows the ppm chloride ions formed during the ozonation of 2-chloroethanol
and 2-chloroethanol in the presence activated charcoal The chloride content in the
reaction mixture increases with an increase in ozone treatment time It is clearly evident
that the rate of chloride ion formation improved when ozone reactions were conducted in
the presence of activated charcoal The pattern of Cl- ion formation is similar to that in
water but its yields were marginally higher At higher ozone contact time with the
reaction mixture it is observed that the chloride ion content increases sharply which
suggests that ozone mass transfer and hence cleaving of the C-Cl bond is improved at
higher ozonation times
0
100
200
300
400
500
600
700
800
2 3 4 5 6 7 8 9 10 11 12 13
Chl
orid
es (p
pm)
Ozonation time (h)
2-CE 2-CE with charcoal
121
45 Ozone initiated oxidation of 2-chloroethanol in aqueous medium Ozone has been successfully applied to oxidize various organic compounds in water
Ozonation can remove easily and nearly completely persistent organic substances dyes
and malodorous substances which used to be imperfectly disposed by chlorination
Hyunook et al128 studied the oxidation of nonylphenol and nonylphenol ethoxylates in
water using O3 In water ozone is always produced diluted in either oxygen or air and it
is not feasible to produce 100 of the gas In addition since ozone is sparingly soluble
in water lower mass transfer and reaction rates are expected to result in certain cases of
conventional ozone processes In order to improve the performance of ozonation ozone-
based advanced oxidation processes involving homogeneous or heterogeneous catalytic
ozonation have been studied by several workers The aim of such processes is to increase
the production of hydroxyl radicals which are highly reactive species and thought to
enhance the decomposition of ozone in water These species may also result from
photocatalytic processes which are also classified as advanced oxidation process and
have also been applied for the degradation of many organic compounds in water
Although hydroxyl radicals are highly reactive species they are unselective and thereby
may react with non-target compounds leading to undesirable oxidation by-products In
addition AOPrsquos are considered to be expensive which is a limiting factor for their
industrial application In an attempt to solve some of these problems studies were
conducted to find the most effective condition for ozonation of organic substrates 2-
chloroethanol was chosen as the target compound since it is highly soluble in water at
different conditions Ozonation studies were conducted to evaluate its conversion and
product formation in aqueous media The effect of varying pH catalytic activity of
charcoal and influence of hydrogen peroxide during the ozonation process were
investigated to find the optimal condition for a complete and fast oxidation of
2-chloroethanol
122
451 Effect of pH on the ozonation of 2-chloroethanol It is widely known that pH plays a major role in the decomposition of ozone in solution
Kurniawan et al136 reported that in alkaline conditions (pH gt8) once the reaction of free
radical was initiated by ozone a series of oxidative degradation reactions that completely
oxidized the recalcitrant organic material into CO2 and H2O occurred in the solution
Therefore the effects of pH on the treatment performance of ozonation were studied by
varying the solution pH from 4 to 10 while keeping ozone dose concentration and
temperature of the reaction mixture constant
To evaluate the effect of solution pH on the conversion of 2-chloroethanol 100 μg mL-1
of ozone gas was constantly bubbled through 20 mL aliquots of 10 2-chloroethanol in
water at pH 4 7 and 10 respectively Gas chromatographic analysis of the product
mixture was performed after each time interval Peaks for AcAlde and AA eluted at their
respective retention times with no other new product peak appearing Table 412 and
Figure 420 summarize the reaction data for the conversion of 10 2-chloroethanol in
water at pH 4 and selectivity profiles of AcAlde AA and the unknown products
Table 412 Conversion and selectivity data for ozonation of 10 2-chloroethanol in water at pH 4
as a function of time
Ozonation Time (h)
Conversion ()
Selectivity ()
AcAlde AA Unknown
3 109 637 311 52
6 204 620 301 80
9 251 573 288 139
12 293 556 272 172
Oxygen flow rate = 200 mL min-1 Ozone concentration = 100 g mL-1
An observation of the data in Table 412 and Figure 420 shows that percent conversion
of 2-chloroethanol increases with ozonation time Percentage conversion of the substrate
increases from 109 after 3 h ozonation to 293 after 24 h ozonation It is evident
123
that the conversion rate of 2-chloroethanol increases sharply from 3 h to 6 h and
thereafter increases gradually up to 12 h
Figure 420 Percent conversion of 10 2-chloroethanol in water at pH 4 and selectivity profiles of
AcAlde AA and unknown versus ozonation time
This pattern of m-xylene conversion indicates that ozone dissolution increases with
increasing contact time with the substrate solution This is in agreement with Ozomax Ltd
who reported that the maximum number of moles of O3 transferred to the solution may be
calculated from
Mozone = NA x S x t
Where Mozone = number of moles O3 transferred
NA = Avogadrorsquos number
S = total bubble surface area and
t = contact time
This equation reveals that ozone dissolution in the substrate solution increases with
increasing contact time The results show that the selectivityrsquos towards AcAlde and AA is
high after 3h ozonation and steadily decreases with an increase in ozonation time
This is due to the oxidation of AcAlde to AA implying the existence of consecutive
reactions for these products at longer ozonation times
0
10
20
30
40
50
60
70
2 3 4 5 6 7 8 9 10 11 12
Con
vers
ion
and
Sel
ectiv
ity (
)
Ozonation time (h)
conversion - 2-CE S - AcAlde S - AA S - unknown
124
The effect of increasing the pH of the substrate solution to neutral (pH = 7) shows a
marginal increase in conversion of 2-chloroethanol as ozonation time is increased
Table 413 and Figure 421 summarize the reaction data for the conversion of 10
2-chloroethanol in water at pH 7 and selectivity profiles of AcAlde AA and unknown
products
Table 413 Conversion and selectivity data for ozonation of 10 2-chloroethanol in water at pH 7
as a function of time
Ozonation Time (h)
Conversion ()
Selectivity ()
AcAlde AA Unknown
3 145 617 325 59
6 227 575 341 84
9 308 547 335 117
12 328 527 414 59
Oxygen flow rate = 200 mL min-1 Ozone concentration = 100 g mL-1
Figure 421 Percent conversion of 10 2-chloroethanol in water at pH 7 and selectivity profiles of
AcAlde AA and unknown versus ozonation time
0
10
20
30
40
50
60
70
2 3 4 5 6 7 8 9 10 11 12 13
Con
vers
ion
and
Sel
ectiv
ity (
)
Ozonation time (h)
conversion - 2-CE S - AcAlde S - AA S - unknown
125
An observation of the data in Table 413 and Figure 421 shows that percent conversion
of 2-chloroethanol increases with ozonation time Percentage conversion of the substrate
increases from 145 after 3 h to 328 after 12 h when treated with 100 g mL-1
ozone It is evident that the conversion rate of 2-chloroethanol increases sharply during
the first 9 h of ozonation and thereafter increases gradually up to 12 h The oxygenated
product AcAlde showed the highest selectivity starting at 617 after 3 h ozonation and
thereafter decreasing to 527 after 12 h ozonation This pattern of product formation
indicates that AcAlde is readily oxidized to its corresponding carboxylic acid in aqueous
medium at neutral pH
Table 414 and Figure 422 summarize the reaction data for the conversion of 10
2-chloroethanol in water at pH 10 and selectivity profiles of AcAlde AA and unknown
products The effect of increasing the pH of the substrate solution to alkaline shows a
rapid increase in conversion of 2-chloroethanol as ozonation time is increased
Table 414 Conversion and selectivity data for ozonation of 10 2-chloroethanol in water at
pH 10 as a function of time
Ozonation Time (h)
Conversion
()
Selectivity ()
AcAlde AA Unknown
3 206 660 321 19
6 261 548 415 37
9 335 507 441 52
12 399 438 539 23
Oxygen flow rate = 200 mL min-1 Ozone concentration = 100 μg mL-1
An observation of the data in Table 414 and Figure 422 shows that percent conversion
of 2-chloroethanol increases with ozonation time Percentage conversion of the substrate
increases from 206 after 3 h of ozone treatment to 399 after 12 h of ozone
treatment It is evident that the conversion rate of 2-chloroethanol increases steadily
during the 12 h of ozonation
126
Figure 422 Percent conversion of 10 2-chloroethanol in water at pH 10 and selectivity profiles
of AcAlde AA and unknown versus ozonation time
The oxygenated product AcAlde showed the highest selectivity starting at 660 after 3
h ozonation and thereafter decreasing to 438 after 12 h ozonation Selectivity towards
AA increased steadily from 321 after 3 h to 539 after 12 h This pattern of product
formation indicates that AcAlde is readily oxidized to its corresponding carboxylic acid
AA in aqueous medium at pH 10
452 Comparison of data for ozonation of 2-chloroethanol at different
pH levels A comparison of the data was studied to ascertain the most efficient pH level for the
ozonation of 2-chloroethanol in water Data plotted in Figure 423 shows the percent
conversion of 2-chloroethanol in water at pH 4 7 and 10 respectively as a function of
ozone treatment time It is clear from the data that 2-chloroethanol can be easily oxidized
in acidic neutral and alkaline conditions by molecular ozone however more interesting
is that the conversion of 2-chloroethanol increases with ozonation time as the pH of the
solution increases
0
10
20
30
40
50
60
70
2 3 4 5 6 7 8 9 10 11 12 13
Con
vers
ion
and
Sele
ctiv
ity (
)
Ozonation time (h)
conversion - 2-CE S - AcAlde S - AA S - unknown
127
Figure 423 Comparison of percent conversion of 10 2-chloroethanol in water at pH 4 7 and 10
versus ozonation time
When comparing the three different conditions it is evident that the conversion of
2-chloroethanol at pH 4 was the lowest at all time intervals and marginally higher in
neutral water The conversion of 2-chloroethanol in water at pH 10 showed the best
results It can be suggested from the results obtained that the pH of the solution has a
significant influence on the conversion of 2-chloroethanol with conversion being
optimum in a more alkaline medium than in an acidic medium This is in good agreement
with Staehelin and Hoigneacute66 who reported that in pure water decomposition of ozone is
accelerated by increasing the pH Ozone at pH levels lt 7 reacts primarily as the O3
molecule by selective and sometimes relatively slow reactions Ozone at pH levels gt 8
rapidly decomposes into hydroxyl free radicals as described in chapter one which react
very fast Many organic compounds that are slow to oxidize in acidic or neutral water
will oxidize rapidly at high pH levels It was found that solution pH from 8 to 10 gave
the best results for oxidation of organic molecules in water The initial step of the
decomposition of ozone is the reaction between ozone and the hydroxide ion to form
ozone ion and hydroxyl radical The hydroxyl radical being highly reactive then reacts
further with ozone This process would then explain the increased solubility of ozone
with increasing alkalinity Glaze129 concluded that the hydroxyl radical may be the most
active species in the ozonation process
0
5
10
15
20
25
30
35
40
45
2 3 4 5 6 7 8 9 10 11 12 13
Con
vers
ion
()
Ozonation time (h)
pH 4 pH 7 pH 10
128
Figure 424 Comparison of selectivity for AcAlde and AA formed during the ozonation of 10
2-chloroethanol in water at pH 4 7 and 10 versus time
Figure 425 Comparison of yield of AcAlde and AA formed during the ozonation of 10
2-chloroethanol in water at pH 4 7 and 10 versus time
25
30
35
40
45
50
55
60
65
70
2 3 4 5 6 7 8 9 10 11 12 13
Sele
ctiv
ity (
)
Ozonation Time (h)
AcAlde (pH 4) AcAlde (pH 7) AcAlde (pH 10)AA (pH 4) AA (pH 7) AA (pH 10)
0
5
10
15
20
25
2 3 4 5 6 7 8 9 10 11 12 13
Yiel
d (
)
Ozonation time (h)
AcAlde (pH 4) AcAlde (pH 7) AcAlde (pH 10)
AA (pH 4) AA (pH 7) AA (pH 10)
129
Figures 424 and 425 shows the selectivity profiles and percentage yields of the major
products AcAlde and AA respectively It is evident that the selectivity for AcAlde at pH
4 and 7 decreases gradually with ozonation time whereas at pH 10 it decreases sharply It
is further observed that the selectivity for AA increases sharply as a function of ozonation
time at pH 10 This behavior of oxidation is further evidence that the presence of
hydroxyl ions improves the ozonation process of 2-chloroethanol an assumption that is
in good agreement with other researchers66129 A profile of the percentage yield of
AcAlde and AA also shows high results at pH 10 indicating that the reactivity at high pH
is fast Studies on trichlorophenol ozonation conducted by Chu and Wong132 also
confirmed that a linear increase in pseudo-first order reaction rates is obtained with pH in
the range greater than 7 and less than 11
Figure 426 Comparison of chloride ions formed during the ozonation of 10 2-chloroethanol in
water at pH 4 7 and 10 versus time
A comparison of the chloride ion content of the reaction mixture after 3 6 9 and 12 h at
pH 4 7 and 10 levels measured using a chloride ion selective electrode is shown in
Figure 426 It is evident that the pattern of chloride ion formation is the same at all pH
levels showing an increase in concentration from 3 h to 12 h of ozone treatment time
Ozonation of the reaction mixture maintained at pH 10 produces the highest amount of
chloride ions suggesting that the presence of a high concentration of hydroxide ions
readily causes the decomposition of ozone to ozone ions and hydroxyl radicals which
leads to a higher conversion rate of 2-chloroethanol thereby favouring a high
concentration of chloride ions
0
20
40
60
80
2 3 4 5 6 7 8 9 10 11 12 13
Chl
orid
es (p
pm)
Ozonation Time (h)
pH = 4 pH = 7 pH = 10
130
46 Effect of activated charcoal on the ozonation of 2-chloroethanol in
water Activated charcoal has been widely used as a powerful adsorbent in wastewater and gas
treatment The chemical reactivity of the activated carbon surface has shown in many
studies to catalyze oxidation reduction halogenations dehydrogenation polymerization
and nucleophilic reactions among others Combined ozone-activated charcoal treatment
processes have been shown to modify the chemical composition of the activated carbon
surface groups130
To investigate the influence of activated charcoal on the conversion of 2-chloroethanol
100 g mL-1 of ozone gas was bubbled through a mixture containing 20 mL aliquots of
10 2-chloroethanol in water at pH 4 7 and 10 in the presence of 1 g activated charcoal
for 3 6 9 and 12 h respectively Gas chromatographic analysis of the product mixture
after each time interval showed major peaks for AcAlde and AA eluting at their usual
retention times with no new product peak observed Table 415 and Figure 427
summarizes the reaction data for the conversion of 2-chloroethanol in water at different
pH levels and the selectivity profiles of major and unknown products
Table 415 Conversion and selectivity data for ozonation of 10 2-chloroethanol and 1 g
activated charcoal in water at pH 4 as a function of time
Ozonation Time (h)
Conversion ()
Selectivity ()
AcAlde AA Unknown
3 115 672 320 08
6 242 628 348 24
9 291 600 365 35
12 315 576 409 15
Oxygen flow rate = 200 mL min-1 Ozone concentration = 100 g mL-1
131
Figure 427 Percent conversion of 2-chloroethanol and selectivity profile of products versus time
(reaction mixture = 10 2-chloroethanol + 1 g activated charcoal in water at pH 4)
The data confirms that ozone initiated oxidation of 2-chloroethanol in the presence of
activated charcoal slightly improves the oxidation process and thereby increasing the
conversion of 2-chloroethanol as the ozone contact time increases The conversion of
2-chloroethanol was 115 after 3 h ozonation increasing steadily to 315 after 12 h
ozonation The selectivityrsquos towards AcAlde is 672 after 3h ozonation and steadily
decreases to 576 with an increase in ozonation time The results imply that AcAlde is
the first oxygenated product to be formed which is then rapidly further oxidized to its
corresponding carboxylic acid AA
Table 416 Conversion and selectivity data for ozonation of 10 2-chloroethanol and 1 g
activated charcoal in water at pH 7 as a function of time
Ozonation Time (h)
Conversion ()
Selectivity ()
AcAlde AA Unknown
3 133 629 336 35
6 253 584 353 64
9 336 570 351 79
12 389 537 425 38
Oxygen flow rate = 200 mL min-1 Ozone concentration = 100 g mL-1
0
10
20
30
40
50
60
70
80
2 3 4 5 6 7 8 9 10 11 12 13
Con
vers
ion
and
Sel
ectiv
ity (
)
Ozonation time (h)
conversion - 2-CE S - AcAlde S - AA S - unknown
132
Table 416 and Figure 428 summarizes the reaction data for the conversion of 10
2-chloroethanol in water at pH 7 in the presence of 1 g activated charcoal and the
selectivity profiles of AcAlde AA and unknown products
Figure 428 Percent conversion of 2-chloroethanol and selectivity profile of products versus time
(reaction mixture = 10 2-chloroethanol + 1 g activated charcoal in water at pH 7)
The effect of increasing the pH level of the substrate solution to neutral shows a rapid
increase in conversion of 2-chloroethanol as ozonation time is increased After 3 h of
ozone treatment 133 of 2-chloroethanol is converted to products rapidly increasing to
389 after 12 h ozonation Selectivity towards AcAlde has decreased from 629 after
3 h to 537 after 12 h Selectivity towards AA increased from 336 after 3 h
ozonation to 425 after 12 h of ozonation It is clear that the increase in pH level has
marginally influenced the oxidation process of both substrate conversion and product
formation This behavior is in agreement with previous studies131 which reported that the
ozone decomposition process showed very strong pH dependence At pH gt 4 the reaction
with hydroxide ions dominates the reaction process while it is probable that a no-radical
process which can also be described as a surface effect dominates at low pH level (~2)
0
10
20
30
40
50
60
70
2 3 4 5 6 7 8 9 10 11 12 13
Con
vers
ion
and
Sel
ectiv
ity (
)
Ozonation time (h)
conversion - 2-CE S - AcAlde S - AA S - unknown
133
Table 417 and Figure 429 summarizes the analyzed data for the conversion of 10
2-chloroethanol in water at pH 10 in the presence of 1 g activated charcoal and the
selectivity profiles of AcAlde AA and unknown products
Table 417 Conversion and selectivity data for ozonation of 10 2-chloroethanol and 1 g
activated charcoal in water at pH 10 as a function of time
Ozonation Time (h)
Conversion ()
Selectivity
AcAlde AA Unknown
3 236 694 284 21
6 367 604 389 07
9 417 442 474 84
12 477 389 564 47
Oxygen flow rate = 200 mL min-1 Ozone concentration = 100 g mL-1
Figure 429 Percent conversion of 2-chloroethanol and selectivity profile of products versus time
(reaction mixture = 10 2-chloroethanol + 1 g activated charcoal in water at pH 10)
The effect of increasing the pH level of the substrate solution to alkaline shows a rapid
increase in conversion of 2-chloroethanol as ozonation time is increased After 3 h of
ozone treatment 236 of 2-chloroethanol is converted to products rapidly increasing to
0
10
20
30
40
50
60
70
80
2 3 4 5 6 7 8 9 10 11 12 13
Con
vers
ion
and
Sel
ectiv
ity (
)
Ozonation time (h)
conversion - 2-CE S - AcAlde S - AA S - unknown
134
477 after 12 h ozonation Selectivity towards AcAlde has decreased from 694 after
3 h to 389 after 12 h Selectivity towards AA increased from 284 after 3 h
ozonation to 564 after 12 h of ozonation It is clear that the increase in pH level to a
great extent influences the oxidation process of both substrate conversion and product
formation corresponding favorably to studies conducted by other researchers on the
effects of activated carbon and pH levels on the ozonation process129 131
461 Comparison of data for ozone initiated oxidation of an aqueous
solution of 2-chloroethanol in the presence of activated charcoal The data presented in Figure 430 shows a comparison of percentage conversion of the
ozone initiated oxidation of a mixture of 10 2-chloroethanol with and without 1 g
activated charcoal in water at pH 4 7 and 10 respectively as a function of ozone
treatment time
Figure 430 Comparison of percent conversion of 2-chloroethanol versus ozonation time
(10 2-chloroethanol + 1 g activated charcoal in water at pH 4 7 and 10 respectively)
10
15
20
25
30
35
40
45
50
2 3 4 5 6 7 8 9 10 11 12 13
Con
vers
ion
()
Ozonation time (h)
water (pH 4) water + charcoal (pH 4) water (pH 7)water + charcoal (pH 7) water (pH 10) water + charcoal (pH 10)
135
It is evident from the plots that the presence of 1 g activated charcoal has a significant
influence on the ozone process at all pH levels studied The conversion rates increased in
proportion to treatment time Ozone treatment combined with activated carbon converted
2-chloroethanol more rapidly than that with ozone alone Furthermore the conversion
rates were the highest in the activated carbon-ozone treatment at pH 10 Activated carbon
is believed to promote the decomposition of aqueous ozone leading to the formation of
oxygen active species both in the liquid phase and on the carbon surface that are
responsible for enhancing the conversion of 2-chloroethanol to smaller oxygenated
products Upon contact of the ozone gas with the activated carbon in water higher ozone
concentrations in the aqueous phase is achieved which can enable faster oxidation rates
Better and effective ozone utilization can also be expected Tizaoui C et al reported that
ozone can be adsorbed at high concentrations from an oxygen or air stream on to a silica-
based adsorbent (eg silica gel adsorbs 710 gm3 O3 at 20oC and 50 gm3 NTP gasndash
ozone) Thus if activated charcoal is in contact with water aqueous ozone may reach
higher concentrations than those obtainable with ozonewater systems leading to
enhanced bulk reaction rates Furthermore if 2-chlorothanol molecules are adsorbed on
the absorbent they will be exposed to high ozone concentrations the reactions taking
place on the surface of the solid material will result in potential benefits such as selective
oxidation and kinetic enhancement
Figure 431 Comparison of percentage yield of AcAlde and AA formed during the ozonation of
1 g activated charcoal and 10 2-chloroethanol in water at pH 4 versus ozonation time
0
2
4
6
8
10
12
14
16
18
20
2 3 4 5 6 7 8 9 10 11 12 13
Yiel
d (
)
Ozonation time (h)
AcAlde (water) Acalde (charcoal) AA (water) AA (charcoal)
136
Figure 432 Comparison of percentage yield of AcAlde and AA formed during the ozonation of
1 g activated charcoal and 10 2-chloroethanol in water at pH 7 versus ozonation time
Figure 433 Comparison of percentage yield of AcAlde and AA formed during the ozonation of
1 g activated charcoal and 10 2-chloroethanol in water at pH 10 versus ozonation time
0
5
10
15
20
25
2 3 4 5 6 7 8 9 10 11 12 13
Yiel
d (
)
Ozonation time (h)
AcAlde (water) AcAlde (charcoal) AA (water) AA (charcoal)
0
5
10
15
20
25
30
2 3 4 5 6 7 8 9 10 11 12 13
Yiel
d (
)
Ozonation time (h)
AcAlde (water) AcAlde (charcoal) AA (water) AA (charcoal)
137
Figures 431 ndash 433 compares the percentage yields of the major products AcAlde and
AA formation during the ozonation of 10 2-chloroethanol with and without activated
charcoal in water at pH 4 7 and 10 respectively as a function of ozone treatment time
The product yields obtained for ozonation of 2-chloroethanol under acidic conditions
(pH 4) shows the final oxidation products AcAlde and AA to be highly refractory to
ozonation and thus found to persist in solution Both products displayed good selectivity
in the presence of activated charcoal with AcAlde showing the highest selectivity and
yield The profile of product yields obtained at pH 7 was similar to product yields
obtained at pH 4 A significant change in the product yield pattern was observed when
ozonation was carried out under basic conditions The yield of AcAlde increased sharply
for the first three hours of ozone treatment and thereafter decreased sharply during the
next three hours It then remained steady up to 12 h During the same time period a
gradual increase in AA yield was noticed This pattern of product formation and
destruction can only be explained as consecutive reactions taking place The ozonation of
2-chloroethanol in the presence of activated charcoal in a highly basic reaction mixture
not only enhances the conversion of substrate but further assists in the oxidation of
primary products into secondary products
Figure 434 Comparison of chloride ion formation during the ozonation of 1 g activated charcoal
and 10 2-chloroethanol in water at pH 4 7 and 10 respectively versus time
10
20
30
40
50
60
70
80
2 3 4 5 6 7 8 9 10 11 12 13
Chl
orid
es (p
pm)
Ozonation Time (h)
water (pH 4) water + charcoal (pH 4) water (pH 7)water + charcoal (pH 7) water (pH 10) water + charcoal (pH 10)
138
A comparison of the chloride ion content of the reaction mixture containing activated
charcoal after 3 6 9 and 12 h at pH 4 7 and 10 levels measured using a chloride ion
selective electrode is shown in Figure 434 It is evident that the pattern of chloride ion
formation is the same at all pH levels showing an increase in concentration from 3 h to
12 h of ozone treatment time Ozonation of the reaction mixture containing activated
charcoal at pH 10 produces the highest amount of chloride ions suggesting that the
presence of a high concentration of hydroxide ions in activated charcoal readily causes
the decomposition of ozone to ozone ions and hydroxyl radicals leading to a higher
conversion rate of 2-chloroethanol
47 Effect of hydrogen peroxide on ozonation of 2-chloroethanol in
water Since hydrogen peroxide reacts well with ozone to produce highly reactive OH- and O2
-
species127 a study was conducted to investigate the influence of hydrogen peroxide on
the ozone initiated oxidation of 2-chloroethanol Experiments were conducted by
introducing 100 μg mL-1 of ozone gas through 20 mL mixtures of 10 2-chloroethanol
and hydrogen peroxide at pH 4 7 and 10 for 3 6 9 and 12 h respectively Gas
chromatographic analysis of the product mixture after each time interval showed major
peaks for AcAlde and AA eluting at their usual retention times with no additional product
peaks emerging
Tables 418 and Figure 435 gives the reaction data for the conversion of a mixture of
10 2-chloroethanol and 5 hydrogen peroxide at pH 4 7 and 10 respectively and the
selectivity profiles of AcAlde AA and the unknown products as a function of ozone
treatment time An observation of the data shows that percent conversion of
2-chloroethanol increases with ozonation time Percentage conversion of the substrate
increases from 113 after 3 h ozonation to 322 after 24 h ozonation It is evident
that the conversion rate of 2-chloroethanol increases sharply from 3 h to 9 h and
thereafter increases gradually up to 12 h This pattern of 2-chloroethanol conversion
indicates that ozone dissolution increases with increasing contact time with the substrate
139
solution Selectivity towards AcAlde was high starting from 659 after 3 h ozonation
and gradually decreasing to 574 after 12 h ozonation Selectivity towards AA
increased slightly from 331 after 3 h to 372 after 12 h
Table 418 Conversion and selectivity data for ozonation of 10 2-chloroethanol and 5 H2O2
in water at pH 4 as a function of time
Ozonation Time (h)
Conversion
()
Selectivity ()
AcAlde AA Unknown
3 113 659 331 11
6 238 647 335 18
9 307 600 359 41
12 322 574 372 54
Oxygen flow rate = 200 mL min-1 Ozone concentration = 100 g mL-1
Figure 435 Percent conversion of 2-chloroethanol and selectivity profile of products versus
ozonation time (reaction mixture = 10 2-chloroethanol + 5 H2O2 in water at pH 4)
0
10
20
30
40
50
60
70
2 3 4 5 6 7 8 9 10 11 12
Con
vers
ion
and
Sel
ectiv
ity (
)
Ozonation time (h)
conversion - 2CE S - AcAlde S - AA S - unknown
140
Table 419 and Figure 436 summarizes the reaction data for the conversion of 10
2-chloroethanol in the presence of 5 hydrogen peroxide in water at pH 7 and
selectivity profiles of AcAlde AA and unknown products
Table 419 Conversion and selectivity data for ozonation of 10 2-chloroethanol and 5 H2O2
in water at pH 7 as a function of time
Ozonation Time (h)
Conversion ()
Selectivity ()
AcAlde AA Unknown
3 154 648 344 08
6 273 596 340 64
9 349 557 376 67
12 392 549 385 66
Oxygen flow rate = 200 mL min-1 Ozone concentration = 100 g mL-1
Figure 436 Percent conversion of 2-chloroethanol and selectivity profile of products versus
ozonation time (reaction mixture = 10 2-chloroethanol + 5 H2O2 in water at pH 7)
0
10
20
30
40
50
60
70
2 3 4 5 6 7 8 9 10 11 12
Con
vers
ion
and
Sel
ectiv
ity (
)
Ozonation time (h)
conversion - 2-CE S - AcAlde S - AA S - unknown
141
After 3 h of ozone treatment 154 of 2-chloroethanol was completely oxidized to
AcAlde AA and a small quantity of unknown products Further ozonation up to 12 h
resulted in the conversion of 2-chloroethanol increasing rapidly to 392 AcAlde
showed the highest selectivity decreasing slightly from 648 after 3 h of ozone
treatment to 549 after 12 h This pattern of substrate conversion and selectivity
profiles of products were very similar to the ozonation reactions conducted at pH 4
Table 420 Conversion and selectivity data for ozonation of 10 2-chloroethanol and 5 H2O2
in water at pH 10 as a function of time
Ozonation Time (h)
Conversion ()
Selectivity ()
AcAlde AA Unknown
3 271 629 344 27
6 382 541 433 26
9 455 477 494 30
12 516 369 598 33
Oxygen flow rate = 200 mL min-1 Ozone concentration = 100 g mL-1
Figure 437 Percent conversion of 2-chloroethanol and selectivity profile of products versus
ozonation time (reaction mixture = 10 2-chloroethanol + 5 H2O2 in water at pH 10)
0
10
20
30
40
50
60
70
2 3 4 5 6 7 8 9 10 11 12
Con
vers
ion
and
Sel
ectiv
ity (
)
Ozonation time (h)
conversion - 2-CE S - AcAlde S - AA S - unknown
142
Table 420 and Figure 437 summarize the reaction data for the conversion of 10
2-chloroethanol in the presence of 5 hydrogen peroxide in water at pH 10 and
selectivity profiles of AcAlde AA and unknown products
Increasing the pH level of the substrate solution to alkaline shows a rapid increase in
conversion of 2-chloroethanol as ozonation time is increased After 3 h of ozone
treatment 271 of 2-chloroethanol is converted to products rapidly increasing to
516 after 12 h ozonation Selectivity towards AcAlde has decreased from 629 after
3 h to 369 after 12 h Selectivity towards AA increased from 344 after 3 h
ozonation to 598 after 12 h of ozonation
The effect of increasing the strength of the hydrogen peroxide from 5 to 10 was
investigated Experiments were conducted by bubbling 100 g mL-1 of ozone gas with
20 mL mixtures of 10 2-chloroethanol in the presence of 10 hydrogen peroxide at
pH 4 7 and 10 for 3 6 9 and 12 h respectively
Table 421 and Figure 438 summarizes the reaction data for the conversion of 10
2-chloroethanol and 10 hydrogen peroxide in water at pH 4 and the selectivity profiles
of AcAlde AA and unknown products as a function of ozone treatment time
Table 421 Conversion and selectivity data for ozonation of 10 2-chloroethanol and 10 H2O2
in water at pH 4 as a function of time
Ozonation Time (h)
Conversion ()
Selectivity ()
AcAlde AA Unknown
3 164 647 344 09
6 252 568 348 83
9 347 524 409 67
12 353 512 430 57
Oxygen flow rate = 200 mL min-1 Ozone concentration = 100 g mL-1
143
The results presented in Table 421 show that the percentage conversion of
2-chloroethanol increases from 164 after 3 h of ozonation to 353 after 12 h
Selectivity towards AcAlde decreased from 647 to 512 as ozone treatment time
was increased Selectivity towards AA increased from 344 after 3 h of ozonation to
43 after 12 h This pattern of product formation indicates that consecutive reactions
between the two products have occurred
Figure 438 Percent conversion of 2-chloroethanol and selectivity profile of products versus
ozonation time (reaction mixture = 10 2-chloroethanol + 10 H2O2 in water at pH 4)
Table 422 Conversion and selectivity data for ozonation of 10 2-chloroethanol and 10 H2O2
in water at pH 7 as a function of time
Ozonation Time (h)
Conversion ()
Selectivity ()
AcAlde AA Unknown
3 169 778 148 74
6 292 715 199 86
9 369 667 297 36
12 412 664 316 20
Oxygen flow rate = 200 mL min-1 Ozone concentration = 100 g mL-1
0
10
20
30
40
50
60
70
2 3 4 5 6 7 8 9 10 11 12
Con
vers
ion
and
Sele
ctiv
ity (
)
Ozonation time (h)
conversion - 2-CE S - AcAlde S - AA S - unknown
144
Table 422 and Figure 439 summarize the reaction data for the conversion of 10
2-chloroethanol in the presence of 10 hydrogen peroxide in water at pH 7 and
selectivity profiles of AcAlde AA and unknown products
Figure 439 Percent conversion of 2-chloroethanol and selectivity profile of products versus
ozonation time (reaction mixture = 10 2-chloroethanol + 10 H2O2 in water at pH 7)
The results show a steady decrease in selectivity towards AcAlde and an increase in
selectivity towards AA as ozonation time increases This is due to the oxidation of
AcAlde to its corresponding acid AA implying the existence of consecutive reactions for
these products at longer ozonation times Percent conversion of 2-chloroethanol increased
from 169 to 412 after 12 h of ozone treatment indicating that the extent of
oxidation of the substrate molecule is dependent on ozonation contact time
Table 423 and Figure 440 summarize the reaction data for the conversion of 10
2-chloroethanol in the presence of 10 hydrogen peroxide in water at pH 10 and
selectivity profiles of AcAlde AA and unknown products The results show that the
percentage conversion of 2-chloroethanol is significantly higher when ozonation is
carried out in the presence of 10 hydrogen peroxide The conversion 2-chloroethanol
increased from 363 after 3 h of ozone treatment to 555 after 12 h After 3 h of
ozonation AcAlde showed the highest selectivity of 642 thereafter decreasing to 265
0
10
20
30
40
50
60
70
80
90
2 3 4 5 6 7 8 9 10 11 12
Con
vers
ion
and
Sele
ctiv
ity (
)
Ozonation time (h)
conversion - 2-CE S - AcAlde S - AA S - unknown
145
in 12 h The selectivity of AA increased sharply from 356 after 3 h of ozonation to
632 after 12 h This pattern of product formation indicates that AcAlde in the presence
of 10 hydrogen peroxide and sufficient hydroxide ions can easily be oxidized to AA
Acetic acid on the other hand is found to be resistant to further ozone oxidation
Table 423 Conversion and selectivity data for ozonation of 10 2-chloroethanol and 10 H2O2
in water at pH 10 as a function of time
Ozonation Time (h)
Conversion ()
Selectivity ()
AcAlde AA Unknown
3 363 642 356 02
6 424 514 471 15
9 477 393 589 18
12 555 265 632 103
Oxygen flow rate = 200 mL min-1 Ozone concentration = 100 g mL-1
Figure 440 Percent conversion of 2-chloroethanol and selectivity profile of products versus
ozonation time (reaction mixture = 10 2-chloroethanol + 10 H2O2 in water at pH 10)
0
10
20
30
40
50
60
70
2 3 4 5 6 7 8 9 10 11 12
C
onve
rsio
n a
nd S
elec
tivity
()
Ozonation time (h)
conversion - 2-CE S - AcAlde S - AA S - unknown
146
471 Comparison of data for ozone initiated oxidation of an aqueous
solution of 2-chloroethanol in the presence of hydrogen peroxide
Figure 441 Comparison of percent conversion of 2-chloroethanol with and without the presence
of H2O2 versus ozonation time (10 2-chloroethanol + 5 H2O2 in water at pH 4)
Figure 442 Comparison of percent conversion of 2-chloroethanol with and without the presence
of H2O2 versus ozonation time (10 2-chloroethanol + 5 H2O2 in water at pH 7)
0
5
10
15
20
25
30
35
40
2 3 4 5 6 7 8 9 10 11 12 13
Con
vers
ion
()
Ozonation time (h)
2-CE in water 2-CE in 5 H2O2 2-CE in 10 H2O2
0
5
10
15
20
25
30
35
40
45
2 3 4 5 6 7 8 9 10 11 12 13
Con
vers
ion
()
Ozonation time (h)
2-CE in water 2-CE in 5 H2O2 2-CE in 10 H2O2
147
Figure 443 Comparison of percent conversion of 2-chloroethanol with and without the presence
of H2O2 versus ozonation time (10 2-chloroethanol + 5 H2O2 in water at pH 10)
A comparison of the data was performed to establish the most efficient condition for the
ozonation of 2-chloroethanol in the presence of 5 and 10 hydrogen peroxide in
water at pH level 4 7 and 10 Data plotted in Figures 441 ndash 443 shows the percent
conversion of 2-chloroethanol with and without hydrogen peroxide in water at pH 4 7
and 10 respectively as a function of ozone treatment time It is observed that after ozone-
hydrogen peroxide treatment the percentage of 2-chloroethanol conversion as a function
of time has significantly improved compared to ozonation alone At pH 10 the conversion
of 2-chlorethanol to products showed the most excellent result This could be attributed to
the fact that in alkaline conditions the concentration of OH- in the solution increases
thereby acting as a promoterinitiator for the decomposition of ozone into intermediate
compounds such as peroxide ions (O2-) and the HO2
bull radical In the presence of hydrogen
peroxide the hydroxyl radical is formed and acts as an initiator for the oxidation of
2-chloroethanol With the increasing OH- in the solution that initiated the intermediate
chain reactions the rate of ozone decomposition also becomes significantly faster
Figures 444 ndash 446 compares the percentage yields of the major products AcAlde and
AA formation during the ozonation of 10 2-chloroethanol with and without hydrogen
peroxide in water at pH 4 7 and 10 respectively as a function of ozone treatment time
0
10
20
30
40
50
60
2 3 4 5 6 7 8 9 10 11 12 13
Con
vers
ion
()
Ozonation time (h)
2-CE in water 2-CE in 5 H2O2 2-CE in 10 H2O2
148
Figure 444 Comparison of percent yield of AcAlde and AA formed with and without the presence
of H2O2 versus ozonation time (10 2-chloroethanol +H2O2 in water at pH 4)
Figure 445 Comparison of percent yield of AcAlde and AA formed with and without the presence
of H2O2 versus ozonation time (10 2-chloroethanol +H2O2 in water at pH 7)
3
5
7
9
11
13
15
17
19
2 3 4 5 6 7 8 9 10 11 12 13
Yiel
d (
)
Ozonation time (h)
AcAlde (water) Acalde (5 H2O2) AcAlde (10 H2O2)AA (water) AA (5 H2O2) AA (10 H2O2)
2
7
12
17
22
27
2 3 4 5 6 7 8 9 10 11 12 13
Yiel
d (
)
Ozonation time (h)
AcAlde (water) Acalde (5 H2O2) AcAlde (10 H2O2)AA (water) AA (5 H2O2) AA (10 H2O2)
149
Figure 446 Comparison of percent yield of AcAlde and AA formed with and without the presence
of H2O2 versus ozonation time (10 2-chloroethanol +H2O2 in water at pH 10)
The pattern for the formation of major products AcAlde and AA at pH 4 and pH 7 were
very similar however their percentage yields were higher in the presence of hydrogen
peroxide In all cases the yields of AcAlde and AA increased gradually with an increase
in ozone treatment time Increasing the concentration of hydrogen peroxide resulted in a
marginal increase in the yields of both AcAlde and AA Ozonation of the reaction
mixture maintained at pH level 10 showed the most promising results Product formation
is rapid with the yield of AcAlde decreasing sharply and yield of AA increasing sharply
from 3 h to 12 h ozonation This pattern of product formation indicates that ozonation of
2-chloroethanol in the presence of hydrogen peroxide in water at pH 10 occurs extremely
fast
Figures 447 ndash 449 compares the parts per million chloride ion formation during the
ozonation of 10 2-chloroethanol with and without hydrogen peroxide in water at pH 4
7 and 10 respectively as a function of ozone treatment time
6
11
16
21
26
31
36
2 3 4 5 6 7 8 9 10 11 12 13
Yiel
d (
)
Ozonation time (h)
AcAlde (water) Acalde (5 H2O2) AcAlde (10 H2O2)AA (water) AA (5 H2O2) AA (10 H2O2)
150
Figure 447 Comparison of parts per million chloride ion formed with and without the presence of
H2O2 versus ozonation time (10 2-chloroethanol + H2O2 in water at pH 4)
Figure 448 Comparison of parts per million chloride ion formed with and without the presence of
H2O2 versus ozonation time (10 2-chloroethanol + H2O2 in water at pH 7)
0
20
40
60
80
100
2 3 4 5 6 7 8 9 10 11 12 13
Chl
orid
es (p
pm)
Ozonation time (h)
water 5 H2O2 10 H2O2
0
20
40
60
80
100
2 3 4 5 6 7 8 9 10 11 12 13
Chl
orid
es (p
pm)
Ozonation time (h)
water 5 H2O2 10 H2O2
151
Figure 449 Comparison of parts per million chloride ion formed with and without the presence of
H2O2 versus ozonation time (10 2-chloroethanol + H2O2 in water at pH 10)
An observation of the data show that in all cases the concentration of chloride ion
increases with an increase in ozone treatment time Furthermore it is evident that the
presence of hydrogen peroxide has a positive effect on the ozonation process by cleaving
a higher percentage of C ndash Cl bonds in 2-chloroethanol Increasing the pH to 10 and
hydrogen concentration to 10 resulted in the formation in the highest amount of
chloride ions formed
48 Reaction pathway for ozonation of 2-chloroethanol
A general sequence for the oxidation of 2-chloroethanol by ozone is proposed in Scheme
40 This reaction sequence involves all intermediates detected leading to acetic acid as
the ultimate generated carboxylic acid The main oxidizing agents are O3 for ozonation
alone and O3 organic solvent hydrogen peroxide and activated carbon for catalytic
ozonation The process is initiated by the direct attack of either the carbon attached to the
oxygen or the carbon attached to the chlorine atom by bullOH andor O3 giving acetaldehyde
0
20
40
60
80
100
120
140
2 3 4 5 6 7 8 9 10 11 12 13
Chl
orid
es (p
pm)
Ozonation time (h)
water 5 H2O2 10 H2O2
152
as a primary oxidation product This reaction is faster in the O3solvent and O3activated
carbon system where higher amounts of ozone is able to react with the initial reactant
When ozonation of 2-chloroethanol is carried out in the presence of hydrogen peroxide
two main chemical reactions occur (i) two ozone molecules produce two hydroxyl
radicals which react with the organic compound and (ii) direct reaction of the organic
compound with ozone
Cl-CH2-CH2-OH + OH Cl-CH-CH2-OH Cl-CH2-CH-OH H2O+ +
1 2
Cl CH2 OHCH CH2 CH OH
3
+ Cl
CH2 C
O
HCH2 CH OH H
CH2 C
O
H+ Cl-CH2-CH2-OH 1 or 2 + CH3 C
H
O
(acetaldehyde)
OH CH3 C
O
HO
(acetic acid)
+ minorproducts
Scheme 40 Proposed radical type reaction pathway for the ozonation of 2-CE in H2O or H2O
H2O2 system
Reaction of bullOH with chlorinated organic compounds affords mainly hydrogen
abstraction Interaction of 2-chloroethanol with bullOH radicals are believed to yield two
main organic radicals 1 and 2 These two radicals decompose rapidly leading to the
release of Cl- ions and the formation of radical 3 Interaction of 2-CE with radical 3
produces the primary oxidation product acetaldehyde which is easily oxidized to its
corresponding carboxylic acid acetic acid
153
50 Conclusions
In the present work the ozone initiated oxidation of two selected model toxic compounds
commonly found in the environment was studied The ozonation of m-xylene and
2-chloroethanol leads to conversion of both compounds after a short reaction period and
their conversion increases as a function of ozonation time This suggests that the partial
removal of these non-biodegradable compounds from aqueous solutions can be
accomplished by ozone treatment alone The extent of conversion of 2-chloroethanol was
found to be higher than that of m-xylene under similar reaction conditions and ozone
treatment time This may be due to the difference in chemical nature and reactivity of the
two compounds
51 Ozonation of m-xylene Ozonation of m-xylene produced good yields of 3-methylbenzylalcohol
3-methylbenzaldehyde 3-methylbenzoic acid and smaller straight chain carboxylic acids
as oxidation products Their yields were found to increase as a function of ozonation
time The carboxylic acids and 3-methylbenzoic acid were found to be resistant to
further oxidation under the experimental conditions used
The presence of 5 acetic acid which is resistant to ozone attack was found to enhance
ozone solubility in the media and thus increase the rate of m-xylene conversion in
comparison to ozonation alone When the strength of the solvent was increased to 20
the conversion of m-xylene was found to increase proportionately with ozonation time
The presence of 5 and 20 ethyl acetate which also was found to be resistant to
ozone attack under the experimental conditions used showed similar trends The pattern
of product formation when ozonation was carried out in the presence of solvent was
similar in when compared to ozonation alone however it was observed that the
selectivity for 3-methylbenzaldehyde decreased while the selectivity for 3-methylbenzoic
acid increased as a function of ozone treatment time Ozone was consumed not only for
the conversion of the substrate molecule but also conversion of oxygenated intermediates
154
and final products This method of using solvents during ozone treatment can be
advantageous if the toxic compounds are insoluble in water
It is evident from the study that the use of activated charcoal-ozone combined treatment
clearly improves the conversion of m-xylene to oxygenated products Therefore
conversion of the substrate is mainly due to the catalytic activity or promoting action of
activated charcoal on the ozone decomposition and reaction of the intermediate products
52 Ozonation of 2-chloroethanol Ozonation of 2-chloroethanol was transformed to dechlorinated intermediates and
chloride ions The amount of chloride ions formed increased with an increase in ozone
treatment time Therefore it is possible to follow the conversion rate of 2-chloroethanol
by monitoring the chloride ion The electric conductivity of the reaction mixture was
found to change proportionately with the amount of chloride ions formed This simple
technique can not only be used to monitor the conversion of the halogenated organic
substrate but at the same time be used to follow the kinetics of the oxidation reaction
The ozone initiated oxidation of 2-chloroethanol produced good yields of acetaldehyde
and acetic acid as products Their yields were found to increase as a function of ozonation
time The carboxylic acids resisted ozone attack under the experimental conditions used
The presence of 5 acetic acid was found to enhance ozone decomposition and thus
increase the rate of 2-chloroethanol conversion in comparison to ozonation alone When
the strength of the solvent was increased to 20 the conversion of 2-chloroethanol was
found to increase proportionately with ozonation time The pattern of product formation
when ozonation was carried out in the presence of solvent was similar to that of
ozonation alone
The presence of 5 and 20 ethyl acetate showed similar trends however the rate of
substrate conversion and product formation showed significant improvement Ozonation
of aqueous solutions of 2-chloroethanol maintained at different pH levels produced good
yields of acetaldehyde and acetic acid as major products Conversion of substrate
155
molecule was most effective when ozonation was performed at pH 10 The increase in
hydroxide ion concentration in the reaction mixture was found to be responsible to
enhance not only the conversion rate of 2-chloroethanol but also the conversion of the
product acetaldehyde to acetic acid
The presence of activated charcoal also showed improved conversion rates of the
substrate molecule and good yields of acetaldehyde and acetic acid The activity of
charcoal seems to perform better when ozonation of the organic compound is carried out
in water The presence of charcoal in reaction mixtures maintained at pH 10 showed the
most improved conversion rates and yield of products The initiating action of activated
charcoal through surface reactions is thought to have influenced the overall ozonation
process
The ozonation of 2-chloroethanol in the presence of hydrogen peroxide in water at
different pH levels showed interesting observations Solutions of 2-chloroethanol
maintained at pH level 4 and 7 showed marginal changes in conversion rates compared to
ozonation alone however conversion rates improved significantly when the pH of the
solution was increased to 10 Increasing the strength of the hydrogen peroxide in the
reaction mixture from 5 to 10 had very little effect in the conversion rates of
2-chloroethanol and product formation
53 Future work
The work undertaken in this thesis has shown that ozone is a good oxidant to convert
m-xylene and 2-chloroethanol two toxic compounds that can persist in the environment
for long periods to less toxic compounds and in the latter case dechlorination of the
hazardous organic compound was successfully achieved The use of advance oxidation
process such as organic solvents that are resistant to ozone attack activated charcoal and
hydrogen peroxide or a combination of these processes was found to significantly
improve the ozonation process however complete mineralization of the toxic organic
compound could not be achieved using these methods alone
156
It is therefore recommended that future work be undertaken by investigating the use of
metal catalysts and other oxidation enhancers to assist in accomplishing complete
mineralization of the studied compounds and improve the economic considerations of the
ozone initiated oxidation process such as reduced ozone treatment time and lower ozone
dosage concentrations
157
REFERENCES 1 Bingen HG and Crutzen PJ J Geophys Res 1987 92 2182
2 Emberton JR and Parker A Waste Manage Res 1987 5 473
3 Nozhevnikova AN Lebedevand VS Lifshitz AB Microbiological processes
occurring in landfills Proceedings of the Symposium on Anaerobic Digestion of
Solid Waste Venice Italy 1992 303
4 Blakey NC Model Prediction of Landfill Leachate Production In Christensen
TH Cossu R and Stegmann R Editors Sanitary Landfilling Process
Technology and Environmental Impact Academic Press San Diego CA 1989
5 Amonkrane A Comel C Veron J Water Res 1997 31 (11) 2775
6 Trebouet D Schlumpt JP Jaouen P and Quemeneur F Water Res 2001 35
(12) 2935
7 Rodriguez J Castrillon L Maranon E Sastre H and Fernandez E Water Res
2004 38 3297
8 Schultz B Kjeldsen P Water Res 1986 20 (8) 965
9 Harmsen J Water Res 1983 17 (6) 699
10 Baig S Coulomb I Courant P and Liechti P Ozone Sci Eng 1999 21 (1) 1
11 Oman C Hynning P Environ Pollut 1993 80 265
12 Reinhart DR Waste Manage Res 1993 11 257
13 Fishbein L International Agency for Research on Cancer IARC Scientific
Publications No 85 1988 109
14 Strotmann UJ Pentenga M and Janssen DB Arch Microbiol 1990 154 294
15 Greenpeace Report The Effects of Organochlorines on Aquatic Ecosystems
September 1992
16 Jorio H Bibeau L Viel G and Heitz M Chem Eng J 2000 76 (3) 209
17 Abumaizar RJ Kocher W and Smith EH J Hazard Mater 1998 60 111
18 Strauss JM Riedel K J and du Plessis CA Appl Microbiol Biotech 2004
64 855
19 Saravanan V and Rajamohan N J Hazard Mater 2009 162 (2-3) 981
20 Chen F Ma H and Wang B J Hazard Mater 2009 162 (2-3) 668
158
21 McCann J Simmon V Streitwieser D and Ames BN Proc Natl Acad
Sci USA 1975 72 3190
22 Stucki G and Leisinger T FEMS Microbiol Lett 1983 16 123
23 Janssen DB Keuning S and Witholt B J Gen Microbiol 1987a 133 85
24 Janssen DB Scheper A Dijkhuizen L and Witholt B Appl Environ
Microbiol 1985 49 673
25 Strotmann UJ Pentaga M and Janssen DB Arch Microbiol 1990 154 294
26 Glaze WH Kang JW Chaplin DH Ozone Sci Eng 1987 9 335
27 Sliter JT Journal (Water Pollution Control Federation) 1974 46 (1) 4
28 Rice RG Ozone and Eng 1997 18 477
29 Staehelin J and Hoigne J Environ Sci Technol 1985 19 1206
30 Hoigne J and Bader H Wat Res 1976 10 377
31 Amy GL Sierka RA Bedessem J Price D Tan L J AWWA 1992 84 67
32 Miltner RJ Shukairy HM Summers R S J AWWA 1992 8452
33 Richardson SD ldquoDrinking water disinfection by-products in Meyers RA Ed The
encyclopedia of environmental analysis and remediationrdquo NY John Wiley and
Sons 1998 3 1398
34 Melin ES and Odegaard H Wat Res 2000 34 4464
35 Kuo ChK J Chromatography A 1998 804 265
36 Schechter DS and Singer PC Ozone Sci Eng 1995 17 53
37 Nawrocki J and Kalkowska I J Water SRT ndash Aqua 1998 47 50
38 Muumlller MB Schmitt D Frimmel F H Env Sci Technol 2000 34 4867
39 Zhu A R and Tsang SC Chem Commun 2002 2044
40 Seddon KR and Stark A Green Chem 2002 2 119
41 Ishii Y Sakagushi S Iwahama T Adv Synth Catal 2001 343 393
42 Snia-Viscosa Hydrocarbon Proc 1977 134 210
43 Garrell T Cohen S Dismukes GC J Mol Catal A 2002 187 3
44 Xie Y and Reckhow DA Ozone Sci Eng 1992 14 269
45 Nawrocki J Swietlik J Raczyk-Stanislawiak U Dabrowska A Bilzor S
Ilecki W Ozone Sci Eng 2003 25 53
46 Zaror CA J Chem Tech Biotechnol 70 21 1997
159
47 Exner O Correlation analysis of chemical data NY Plenum Press 1988
48 Trapido M Veressinina J and Munter R Ozone Sci Eng 1994 16 475
49 Acero JL Haderlein SH Schmidt T Suter MJ-F von Gunten U Environ
Sci Technol 2001 35 4252
50 Hoigne J and Bader H Wat Res 1983 17185
51 Chamarro E Marco A Prado J Esplugas S Sociedad Chilena de Quimica
1996 12 28
52 Jans U and Hoigne J Ozone Sci Eng 1998 20 67
53 Beltran FJ Rivas J Alvarez P Montero de Espinosa R Ozone Sci Eng 2002
24 22
54 Ma J Sui MH Chen ZL Wang LN Ozone Sci Eng 2004 26 3
55 Rivera-Utrilla J and Sanchez-Pollo M Appl Catal B Environ 2002 39 329
56 Rivera-Utrilla J and Sanchez-Polo M Langmuir 2004 20 9217
57 Rivera-Utrilla J and Sanchez-Polo M Mondaca MA Zaror CA J Chem
Technol Biotechnol 2002 77 883
58 Elovitz MS and von Gunten U Ozone Sci Eng 1999 21 239
59 Sanchez-Polo M von Gunten U Rivera-Utrilla J Wat Res 2005 39 3189
60 Hoigne J ldquoChemistry of aqueous ozone and transformation of pollutants by
ozonation and advanced oxidation processes In J Hubrec Editor The handbook
of environmental chemistry quality and treatment of drinking waterrdquo Berlin
Springer 1998
61 Glaze WH and Kang J Int Eng Chem Res 1989 28 1573
62 Meijers RT Oderwald-Muller EJ Nuhm P Kruithof J Ozone Sci Eng 1995
17 673
63 Beltran JB Gonzalez M AcedoB Rivaz FJ J Hazard Mater 2000 B80
189
64 Aeita EM Reagan KM Lang J S McReyonlds L Kang J Glaze WH J
AWWA 1988 80 64
160
65 Karimi AA Redman JA Glaze W H Stolarik GF J Am Water Works
Assoc 1997 89 41
66 Staehelin J and Hoigne J J Environ Sci Technol 1985 19 1206
67 Bigda RJ Chem Eng Prog 1995 91 62
68 Hoigne J and Bader H Ozone Sci and Eng 1979 1 73
69 Hoigne J and Bader H Ozone Sci and Eng 1983 17 173
70 Bell GM Sillaker RO Padgham MDJ and Standring P Xylenes London
health and safety executive Tox Rev 1992 166
71 ECETOC Joint assessment of commodity chemicals No 6 Xylenes 1986
72 Verschueren K Handbook of environmental data on organic chemicals 2nd ed
New York Van Nostrand Reinhold Co 1983 1188
73 Carpenter CP Kinkead ER Geary DL Jr Sullivan LJ and King JM
Toxicol Appl Pharmacol 1975 33 543
74 Health-based recommended occupational exposure limit for xylene The Hague
Directorate-General of Labour 1991
75 IARC Xylene In Some organic solvents resin monomers and related
compounds pigments and occupational exposures in paint manufacture and
painting 1989 47 125
76 Jori A Calamari D Di Domenico A Galli CL Galli E Marinovich M and
Silano V Ecotoxicol Environ Saf 1986 11 44
77 Young PJ and Parker A Waste Manage Res 1983 1 213
78 Wiesenburg DA Bodennec G and Brook JM Bull Environ Contam Toxicol
1981 27 167
79 Barker JF Barbash JE and Labonte M J Contam Hydrol 1988 31
80 Sabel GV and Clark TP Waste Manage Res 1984 2 119
81 Morgan P and Watkinson RJ Water Sci Technol 1990 22 63
82 Kawamura K and Kaplan IR Environ Sci Technol 1983 17 497
83 Davey JF and Gibson DT J Bacteriol 1974 119 923
84 Raymond RL Jamison VW and Hudson JO Appl Microbiol 1969 17 512
85 Jamison VW Raymond RL and Hudson JD Proceeds of the 3rd International
Biodegradation Symposium Allied Science Publishers 1976 187
161
86 Kappeler TH and Wuhrmann K Water Res 1978a 12 327
87 Kappeler TH and Wuhrmann K Water Res 1978b 12 335
88 Tabak HH Desai S and Govind R Proceedings of the 44th Industrial Waste
Conference 1989 405
89 Alvarez PJJ and Vogel TM Appl Environ Microbiol 1991 57 2981
90 Thomas JM Gordy VR Fiorenza S and Ward CH Water Sci Technol
1990 22 53
91 Wilson BH Wilson JT Kampbell DH Bledsoe BE and Armstrong JM
Geomicrobiol J 1990 8 225
92 Kuhn EP Colberg PJ Schnoor JL Wanner O Zehnder AJB and
Schwarzenbach RP Environ Sci Technol 1985 19 961
93 Chiang CY Salanito JP Chai EY Colthart JD and Klein CL Ground
Water 1989 27 823
94 Wilson BH Smith GB and Rees JF Environ Sci Technol 1986 20 997
95 Seyfried B Glod G Schocher R Tschech A and Zeyer J Appl Environ
Microbiol 1994 60(11) 4047
96 Hutchins SR Sewell GW Kovacs DA and Smith GA Environ Sci
Technol 1991a 25 68
97 Hutchins SR Downs WC Wilson JT Smith GB Kovacs DA Fine DD
Douglass RH and Hendrix DJ Ground Water 1991b 29 571
98 Hutchins SR Appl Environ Microbiol 1991 57 2403
99 Edwards EA Willis LE Reinhard M and Grbic-Galic D Appl Environ
Microbiol 1992 58 794
100 Edwards EA and Grbic-Galic D Appl Environ Microbiol 1994 60(1) 313
101 Reinhard M Goodman NL and Barker JF Environ Sci Technol 1984 18
953
102 Kuhn EP Zeyer J Eicher P and Schwarzenbach RP Appl Environ
Microbiol 1988 54 490
103 Major DW Mayfield CI and Barker JF Ground Water 1988 26 8
104 Zeyer J Kuhn EP and Schwarzenbach RP Appl Environ Microbiol 1986
52 944
162
105 Gab S Schmizer J Tham H Parlar H and Korte F Nature (Lond) 1977 270
331
106 Gery MW Fox DL Kaems RM and Stockburger L Environ Sci Technol
1987 21 339
107 Grosjean D J Air Waste Manage Assoc 1990 40 1397
108 Morioka Y J Jpn Soc Envion 1996 19 7
109 Fronk CA Ozone Sci and Eng 1987 9 265
110 Guo C-C Liu Q Wang X-T and Hu H-Y Appl Catal A 2005 282 55
111 Bailey PS ldquoOzonation in Organic Chemistryrdquo Vol 1 Academic Press New
York 1978
112 Bollyky LJ Ozone Sci and Eng 1981 3 181
113 Paillard H and Briner E Helv Chim Acta 1942 25 1528
114 Taube H Trans Faraday Soc 1957 53 656
115 White HM and Bailey PS J Org Chem 1965 3037
116 Kuo PPK Chian ESK and Chang BJ Environ Sci Technol 1977 50 2624
117 Galutkina KA Nemchenko AG and Karazeeva LN Zh Prikl
Khim(Leningrad) 1975 48 1548 J Appl ChemUSSR (Eng Transl) 1975
50 2498
118 Van der Weile K Van den Berg PJ J Catal 1975 39 437
119 Nakano Y Okawa K Nishijima W and Okada M J Jpn Soc Water Environ
2002 25 619
120 Nakano Y Okawa K Nishijima W and Okada M Water Res 2003 37 2495
121 Shishkov VF Verkhodanova NN Egorrsquokov AN Tuturina VV Solid Fuel
Chem 1984 18 31
122 Verkhodanova NN Myakina IA Egorrsquokov AN Shishkov VF
Tuturina VV Solid Fuel Chem 1981 15 48
123 Jans U Hoigne J Activated carbon and carbon black catalyzed transformation of
aqueous ozone into OH radicals Ozone Sci and Eng 1998 20 67 ndash 90
124 Alvarez PM Garcia-Araya JF Beltran FJ Giraldez I Jaramillo J Gomez-
Serrano V Carbon 2006 44 3102
163
125 Pace G Berton A Calligaro L Mantovani A and Uguagliati P J Chrom A
1995 706 350
126 Graham N Chu W and Lau C Chemosphere 2003 51 240
127 Woods RJ and Pikaev AK Applied Radiation Chemistry Radiation
Processing John Wiley and Sons Inc New York (1994)
128 Hyunook K Guisu P Myongjin Y Eunjung K Youngkook H and Colosimo
Mark F Oxidation of Nonylphenol in water using O3 Res J Chem Environ
2007 Vol 11(2) 7 ndash 12
129 Glaze 1980
130 Valdeacutes H Saacutenchez-Polo M Rivera-Utrilla J and Zaror CA Effect of Ozone
Treatment on Surface Properties of Activated Carbon Langmuir 2002 18 2111
131 Hahn J Lachmann G and Pienaar JJ Kinetics and Simulation of the
Decomposition of Ozone in Acidic Aqueous Solutions SAfr J Chem 2002
53(2) 134 ndash 137
132 Chu W and Wong CC A disappearance model for the prediction of
trichlorophenol ozonation Chemosphere 2003 51
133 Shigimitu H The foundation and Application of Ozonation Ourin Ltd Japan
Chapter 2 1995
134 Gomes M Razumovskii SD Zaikov GE Effect of Solvent Polarity on the Rate
of Ozone Reaction with Unsaturated Compounds Int J Chem Kinetics 1984
16 1-5
135 Henry H Zador M and Fliszar S A Quantitative Investigation of the Ozonolysis
Reaction XVIII A Kinetic Study of the Ozone Attack on Phenylethylenes Can
J Chem 1973 51 3398
136 Kurniawan TA Lo WH and Chan GYS Degradation of Recalcitrant
Compounds from Stabilized Landfill Leachate using a Combination of Ozone-
GAC Adsorption Treatment J Haz Materials 2006 447
137 Lampman GM Pavia DL Kriz GS and Vyvyan JR Spectroscopy
International Edition 4th edition 2010 461-483
164
138 Faria PCC Jose JM and Manuel F Mineralization of colored aqueous
solutions by ozonation in the presence of activated carbon Water Res 39 2005
1461
139 Stary FE Emge D E Murray RW J Am Chem Soc 1976 98 1880
140 httpenwikipediaorgwiki2-chloroethanol
141 httpwwwnovazonenettech_ozonehtm298
142 httpwwwlenntechcomozoneozone-propertieshtm298
143 Bailey PS ldquoOzonation in Organic Chemistryrdquo Academic Press New York Vol
2 1982
144 Langlais B Reckhow DA Brink DR Introduction In ldquoOzone in Water
Treatment Application and Engineeringrdquo Chelsea Michigan Lewis Publishers
317 1991
145 Langlais B Bellamy WD Damez F Moneiel A Rakness KL Reckhow DA
Robson CM Engineering aspects In ldquoOzone in Water Treatment Application
and Engineeringrdquo Chelsea Michigan Lewis Publishers 8 1991
146 Cooper C and Burch R An Investigation of Catalytic Ozonation for the
Oxidation of Halocarbons in Drinking Water Preparation Wat Res Vol 33 No
18 3695-3700 1999
147 von Gunten U Ozonation of drinking water Part 1 Oxidation kinetics and
product formation Wat Res Vol 37 1445 2003
148 Staehelin J and Hoigneacute J Decomposition of ozone in water rate of initiation by
hydroxide ions and hydrogen peroxide Environ Sci Technol 16 679 1982
149 Rajasekhar Pullabhotla V S R Southway C and Jonnalagadda S B Springer
Science+Business Media 2008
150 httpwwwozoneapplicationscominfoozone_corona_dischargehtm299
151 Faria PCC Oacuterfatildeo JJM and Pereira MFR Catalytic ozonation of sulfonated
aromatic compounds in the presence of activated carbon App Cat B Environ
83 150-159 2008
152 Beltraacuten F J Ovejero G Encinar J M and Rivas J Ind Eng Chem Res 34
1596 1995
153 Pryor WA Giamalva D and Church DF J Am Chem Soc 105 6858 1983
165
154 Vogal A ldquoTextbook of Quantitative Inorganic Analysisrdquo 4th Ed Longman 379
1978 Rakness K Gordon G Langlais B Masschelein W Matsumoto N
Richard Y Robson CM and Somiya I Ozone Sci Eng 8 209 1996
155 ldquoDioxin Digestrdquo ndash Volume 4 Issue 1 Jan 1999
156 McKay G and McAleavey G Chem Eng Res Des 66 532 1988
157 Kainulainen TK Tuhkanen TA Vartiainen TK and Kalliokoski Ozone Sci
Eng 17 449 1995
158 Cannon FS Dusenbury J Paulsen PD Singh J Mazyck DW and Maurer
DJ Ozone Sci Eng 18 417 1996
159 Croll BT Ozone Sci Eng 18 19 1996
160 Zaror CA J Chem Tech Biotechnol 70 21 1997
166
Figure A30 Chromatogram of pure m-xylene before ozonation
Figure A31 Chromatogram of pure m-xylene after 12 h ozonation
167
Figure A32 Mass spectrum of m-xylene
Figure A33 Mass Spectrum of 3-methylbenzaldehyde
CH3
CH3
CH3
HC
O
168
Figure A34 Mass spectrum of 3-methylbenzoic acid
Figure A35 Mass spectrum formic acid
C
CH3
OHO
C OHH
O
169
4000
036
0032
0028
0024
0020
0018
0016
0014
0012
0010
0080
060
040
00
0051015202530354045505560657075808590
973
cm-1
T
3016
10
2921
36
2863
94
2731
60
2343
00
1931
98 18
537
11773
86
1654
35
1613
50
1592
12 14
920
2
1460
2013
766
1
1170
00 10
942
8
1039
67
904
45
875
94
768
89724
87
691
08
665
55
439
96
Figu
re A
36
FTIR
spe
ctru
m o
f pur
e m
-xyl
ene
befo
re o
zona
tion
170
4000
036
0032
0028
0024
0020
0018
0016
0014
0012
0010
0080
060
040
00
00510152025303540455055606570758085
907
cm-1
T
3016
18
2922
83
2862
87
2731
85
2627
07
2556
7523
365
419
327
9 1853
17 17
734
2
1715
6516
134
2
1591
93 14
919
3
1458
6013
765
31289
68
1249
86
1214
62
1169
9610
944
2
1040
18
904
74
876
43
769
21691
47
665
14626
04
455
87
Figu
re A
37
FTIR
spe
ctru
m o
f m-x
ylen
e af
ter 1
2 ho
urs
ozon
atio
n
171
Figu
re A
38
1 H N
MR
spe
ctru
m o
f 3-m
ethy
lben
zyl a
lcoh
ol
172
Figu
re A
39
1 H N
MR
spe
ctru
m o
f 3-m
ethy
lben
zoic
aci
d
173
Figure A40 Chromatogram of 2-chloroethanol before ozonation
Figure A41 Chromatogram of 2-chloroethanol after 18 hours ozonation
174
Figu
re A
42
1 H N
MR
spe
ctru
m o
f ace
tald
ehyd
e
175
Figure A43 Mass spectrum of acetic acid
CH3 C
O
OH
176
4000
036
0032
0028
0024
0020
0018
0016
0014
0012
0010
0080
060
038
00
509556065707580859095
100
3
cm-1
T
2-ch
loro
etha
nol P
ure
3333
89
2961
38
1430
31
1298
36
1252
45 11
641
6 1071
02
1027
5293
853
848
28
747
39
658
84
472
66
Figu
re A
44
FTIR
spe
ctru
m o
f 2-c
hlor
oeth
anol
bef
ore
ozon
atio
n
177
4000
036
0032
0028
0024
0020
0018
0016
0014
0012
0010
0080
060
038
00
59062646668707274767880828486889092949698
999
cm-1
T
2-ch
loro
etha
nol 1
8hrs
3378
97
2963
06
1723
89
1431
47
1299
94
1169
76
1071
59 1026
78
937
56
848
49
747
47
660
18
473
91
Figu
re A
45
FTIR
spe
ctru
m o
f 2-c
hlor
oeth
anol
afte
r 18
hour
s
ozon
atio
n