School of Chemical Technology A METHOD FOR … · diagrams (P&IDs). As the core development tools,...
95
School of Chemical Technology Degree Programme of Chemical Technology Qiang Sun A METHOD FOR GENERATING PROCESS TOPOLOGY-BASED CAUSAL MODELS Master’s thesis for the degree of Master of Science in Technology submitted for inspection, Espoo, 6 June, 2013. Supervisor Professor Sirkka-Liisa Jämsä-Jounela Instructor M.Sc. Jukka Kortela M.Sc. Vesa-Matti Tikkala
Transcript of School of Chemical Technology A METHOD FOR … · diagrams (P&IDs). As the core development tools,...

School of Chemical Technology Degree Programme of Chemical Technology
Qiang Sun
A METHOD FOR GENERATING PROCESS TOPOLOGY-BASED
CAUSAL MODELS
Master’s thesis for the degree of Master of Science in Technology
submitted for inspection, Espoo, 6 June, 2013.
Supervisor Professor Sirkka-Liisa Jämsä-Jounela
Instructor M.Sc. Jukka Kortela
M.Sc. Vesa-Matti Tikkala

Preface
This Master’s Thesis was carried out in the Research Group of Process Control
and Automation at the School of Chemical Technology, Aalto University. It was
written in the period from November 2012 to May 2013. My work was obtained
substantial support from many people around me during this period.
First of all, I would like to thank my supervisor, Professor Sirkka-Liisa Jämsä-
Jounela, for providing me the precious opportunity to study abroad and to
complete the thesis in the laboratory. I also appreciate her constant encouragement
and illuminating guidance in both academic and writing aspects throughout my
thesis work.
I would also like to thank my instructors, Jukka Kortela and Vesa-Matti Tikkala,
for their self-giving and patient supports from the beginning to the end of my
thesis. They spent a large amount of personal time to solve my problems.
Furthermore, I wish to thank all other staff in the laboratory who always offered
me constant spiritual supports and tried their best to help me when I needed help.
Sincerely thank you: Alexey, Sasha, Octavio, Tushar, Miao, Rinat and Jerri.
Finally, I would like to express my special appreciation to my family and friends
for their invaluable encouragement and material aids during my study in Finland.
Espoo,
6 June 2013
Qiang Sun

School of Chemical Technology Abstract of Master’s Thesis Degree Programme of Chemical Technology Author
Qiang Sun Title of Thesis
A Method for Generating Process Topology-based Causal Models
Abstract
Process disturbances always spread along the connected equipment in a plant and are
detected in many places. In order to identify the root disturbance, many data-based fault
detection and diagnosis (FDD) methods have been developed in recent years. However,
most of these methods can generate spurious solutions. Several authors have observed
that FDD methods are enhanced if topology information about the causal relationships of
a process is considered as well. Generally, this topology information is manually created
by using the process knowledge. However, such a way is always time-consuming and the
result is imprecise. Hence, there is a requirement for an automated generation of
effective topology-based causal models.
This thesis developed a thorough approach to implement two types of causal models, i.e.,
a connectivity matrix and a causal digraph, based on piping and instrumentation
diagrams (P&IDs). As the core development tools, AutoCAD P&ID and object-oriented
programming (OOP) of MATLAB were used. The development included three
procedures: generate topology data, define the class for generating causal models, and
obtain the causal models by instantiating the class with the topology data.
In conclusion, it appears that both the connectivity matrix and causal digraph manifest
the internal relationship between different process components caused by material flows
and signal flows in a clear way. Therefore, these models can play an important role in
the research associated with the FDD methods.
Chair Chair code
Process Control KE-90
Supervisor Pages
Professor Sirkka-Liisa Jämsä-Jounela 81+7
Instructor Language
M.Sc. Jukka Kortela M.Sc. Vesa-Matti Tikkala
English
Keywords Date
Topology-based causal models, Digraph, Connectivity matrix, Fault detection and diagnosis (FDD), XML
06.06.2013

CONTENTS
1 INTRODUCTION .................................................................................................................. 1
LITERATURE PART
2 FAULT DETECTION AND DIAGNOSIS AND GRAPHICAL MODELS .......................................... 4
2.1 Definition of the FDD .......................................................................................................... 4
2.2 Classification of the FDD ..................................................................................................... 6
2.3 Graphical Models Used for the FDD ................................................................................... 9
2.3.1 An Overview of the SDG............................................................................................. 9
2.3.2 An Overview of the Process Topology-based Causal Models .................................. 10
3 GRAPHICAL REPRESENTATION OF PROCESS TOPOLOGY - P&ID ........................................ 11
3.1 Definition of the P&ID ....................................................................................................... 11
3.2 P&ID Standards ................................................................................................................. 14
3.2.1 An Introduction to the P&ID standards ................................................................... 14
3.2.2 A Comparison between Different P&ID Standards .................................................. 17
3.3 Component Identification in the P&ID.............................................................................. 17
3.3.1 P&ID Symbols and Tagging ..................................................................................... 18
3.4 Intelligent P&ID Applications ............................................................................................ 23
3.4.1 AutoCAD P&ID, AVEVA P&ID and Intergraph SmartPlant P&ID .............................. 24
4 XML REPRESENTATION OF THE P&IDS.............................................................................. 27
4.1 Engineering Data Exchange Standards ............................................................................. 27
4.1.1 ISO 10303(STEP) -221 .............................................................................................. 28
4.1.2 ISO 15926 ................................................................................................................ 30
4.1.3 Comparisons between the AP 221 and the ISO 15926 ............................................ 32
4.2 XML Representation for the P&IDs ................................................................................... 34
4.2.1 Introduction to XML ................................................................................................. 34
4.2.2 XML Schemas for the P&IDs .................................................................................... 35
4.2.2.1 XMpLant Schema ............................................................................................................. 35
4.2.3 A P&ID Model Conforming to the XMpLant Schema ............................................... 37
4.3 Intelligent P&ID Applications Supporting the XML Representation ................................. 39
4.3.1 Comos P&ID ............................................................................................................. 39
4.3.2 AVEVA P&ID ............................................................................................................. 40
4.3.3 SmartPlant P&ID ...................................................................................................... 41
EXPERIMENTAL PART
5 AIM OF THE EXPERIMENTAL PART ................................................................................... 43
6 DEVELOPMENT OF THE PROCESS TOPOLOGY-BASED CAUSAL MODELS ............................ 45
6.1 Tools and Methods Used to Generate Process Topology-based Causal Models .............. 45
6.1.1 Definition of the Topology-based Causal Models .................................................... 46
6.1.2 Methods for Capturing Topology Information from the AutoCAD P&ID ................. 48
6.1.2.1 Design a P&ID Drawing .................................................................................................... 49
6.1.2.2 Extract Topology Data from the P&ID Drawing ................................................................ 50
6.1.3 Methods for Generating Causal Models with the MATLAB OOP ............................. 52
6.1.3.1 Introduction to the MATLAB OOP .................................................................................... 52
6.1.3.2 Procedures for Generating Causal Models with the MATLAB OOP.................................. 55
6.2 Case Study for the Drying Section of a Board Machine .................................................... 56
6.2.1 Description of the Drying Section of the Board Machine 4 ...................................... 57
6.2.2 Acquisition of Topology Data for the Drying Section of the BM4 ............................ 60
6.2.3 Generation of Causal Models for the Drying Section of the BM4 ............................ 64
6.2.3.1 Phase 1: Classification of the Problem ............................................................................. 64
6.2.3.2 Phase 2: Definition of a Class ........................................................................................... 65
6.2.3.3 Phase 3: Instantiation for the Created Class .................................................................... 68
6.2.4 Results ..................................................................................................................... 69
7 CONCLUSIONS .................................................................................................................. 73
REFERENCES ................................................................................................................................................. 74
LIST OF APPENDICES
Appendix 1: MATLAB Codes for Class Generation
Appendix 2: MATLAB Codes for Class Instantiation
Appendix 3: P&ID Drawing of the Drying Section of the BM4
Appendix 4: Causal Digraph of the Drying Section of the BM4
ABBREVIATIONS
AP Application Protocol
API Application Programming Interface
BM4 Board Machine 4
BSI British Standards Institution
CAD Computer Aided Design
CAEX Computer Aided Engineering Exchange
DLL Dynamic-link Library
FDD Fault Detection and Diagnosis
GUI Graphical User Interface
ISA International Society of Automation
LC Level Controller
LV Level Valve
OOP Object-oriented Programming
P&ID Piping and Instrumentation Diagram
PCA Principal Component Analysis
POSC Caesar Association
PC Pressure Controller
PDC Pressure Difference Controller
PFD Process Flow Diagram
PIP Process Industry Practices
PLS Partial Least Square
PV Pressure Valve
QCS Quality Control System
QSIM Qualitative Simulation
QTA Qualitative Trend Analysis
RDBMS Relational Database Management System

RDL Reference Data Library
SDG Signed Directed Graph
SG Steam Group
STEP Standard for the Exchange of Product Model Data
W3C World Wide Web Consortium
XLS/XLSX Microsoft Excel File Format
XML Extensible Markup Language

1
1 INTRODUCTION
Modern industrial processes present complicated structures with a large number of
control loops and equipment which are interlinked. Hence, process disturbance
occurring at one point always propagates along the plant and leads to the
variances in many other variables. The term fault refers to the variance exceeds
the acceptable scope of a variable. The procedure to determine the faults and
further locate the origin of faults is called fault detection and diagnosis (FDD). In
several decades, many data–based FDD methods have been proved their
effectiveness in finding the root cause from numerous potential fault points.
However, such methods tend to create spurious solutions. In other words, there
are always more than one root cause calculated and these methods do not have a
satisfied precision.
Diagnosis of the root cause of plant-wide faults is improved when process
topology is considered together with the results of traditional data-based FDD
methods (Thomhii, 2006). Generally, the process topology information, for
instance, the connections between process equipment can be identified from a
process drawing, such as a piping and instrumentation diagram (P&ID) (Di
Geronimo Gil, 2011). However, this type of drawing is always designed for
engineering applications, e.g. construction and maintenance. It is, therefore,
complicated and contains a large amount of information unrelated to the FDD
research, which only requires the connecting information of process components
without their geometric shape and size. This provides the motivation to simplify
the P&ID drawing and create a brief and readable topology-based model for the
FDD research. There are two types of topology-based causal models including the
topology-based causal digraph and the connectivity matrix, which can be
considered as a graphical representation and a numerical representation of process
schematics, respectively.
In recent years, more and more researchers have employed topology-based causal
models to eliminate the spurious solutions generated from data-based methods

2
(Thomhii, 2006; Yim, 2006; Thambirajah, 2007 ; Benabbas, 2009). Thomhii et al.
(2006) proposed a prototype software, which combines XML representations of
process schematics with the results of a signal analysis tool to locate the root
causes. Thambirajah et al. (2007) offered a strategy which utilizes a connectivity
matrix created from an XML description of the process diagram to reduce the
spurious solutions generated from a data-driven analysis called transfer entropy.
Further, Benabbas et al. (2009) converted the results of transfer entropy method to
a cause-and-effect matrix with the aid of a connectivity matrix to diagnose the
root cause. All these articles indicate the root cause can be more effectively
located by data-based methods when the topology information about plant
connectivity is considered.
In all the above work, though extensive attention has been given to confirm the
validity of topology-based causal models applied in data-based methods, the
detailed procedures and methodologies that are used to develop these models have
not been studied. This provides the intention of this thesis, which proposes a
systematic way to convert process schematics to topology-based causal models.
This thesis proposes a convenient method to extract causal models from a kind of
process schematic, P&ID. As the core development tools, AutoCAD P&ID and
object-oriented programming (OOP) of MATLAB are used to generate the two
kinds of causal models, i.e., a connectivity matrix and a causal digraph. The
development includes three procedures. The first step is to employ AutoCAD
P&ID software to generate an electronic P&ID drawing and export the topology
data, such as the names and coordinates of process items, and the connections
between them. In the second step, a problem solving class is established by
MATLAB OOP. Finally, the topology data is imported to the class and the
connectivity matrix and digraph are obtained by invoking corresponding methods
defined in the class. The remainder of the thesis is arranged as follows:
The literature part consists of three chapters. Chapter 2 briefly introduces the
traditional FDD methods and gives an overview of the graphical models
3
employed in promoting the performance of data-based FDD methods. Chapter 3
presents the graphical representation of process topology and introduces a series
of symbol standards which are used in a P&ID drawing. Some common
application software used for drawing the P&IDs are also specified. Chapter 4
mainly focuses on the electronic representation of the P&ID drawing. Two types
of industrial standards for topology data exchanges are introduced.
The experimental part specifies the thorough procedures for generating topology-
based causal models. It briefly introduces relevant techniques, such as AutoCAD
P&ID and MATLAB OOP, before describing how they are applied in the
formation of the causal models. Then, the drying section of a board machine is
used as the case study to present the application of the proposed method. The
thesis ends with the summary and conclusion.
4
LITERATURE PART
2 FAULT DETECTION AND DIAGNOSIS AND
GRAPHICAL MODELS
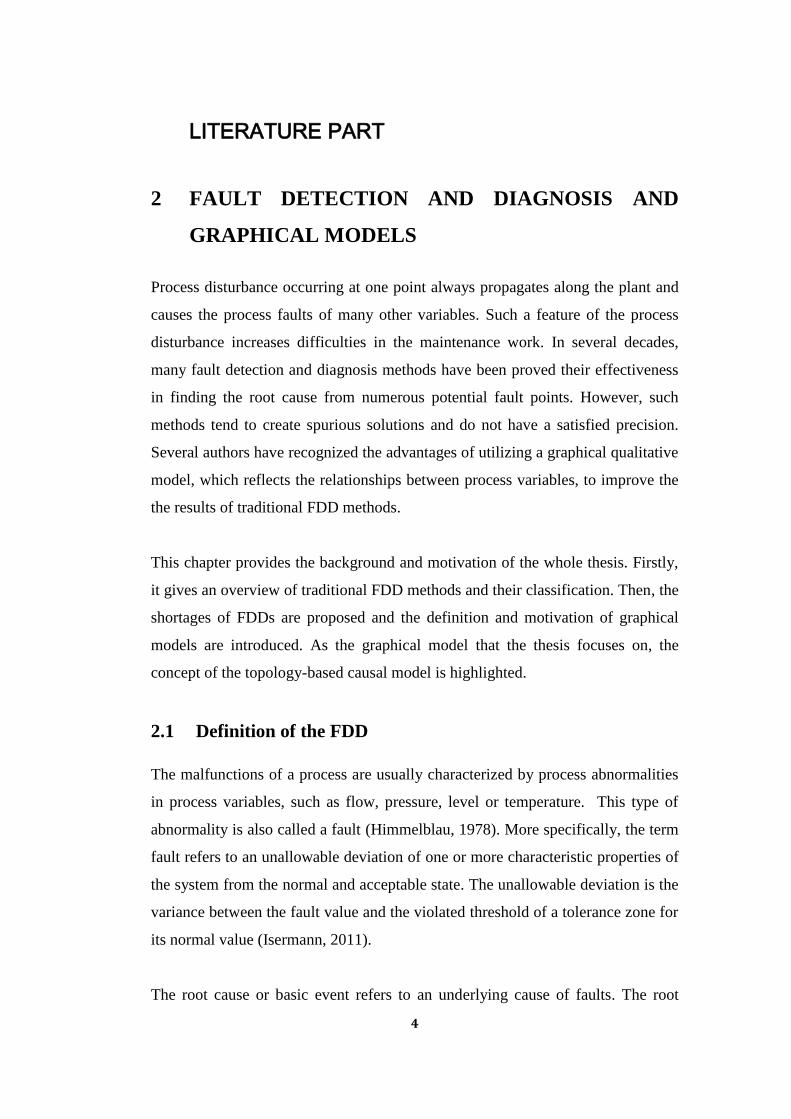
Process disturbance occurring at one point always propagates along the plant and
causes the process faults of many other variables. Such a feature of the process
disturbance increases difficulties in the maintenance work. In several decades,
many fault detection and diagnosis methods have been proved their effectiveness
in finding the root cause from numerous potential fault points. However, such
methods tend to create spurious solutions and do not have a satisfied precision.
Several authors have recognized the advantages of utilizing a graphical qualitative
model, which reflects the relationships between process variables, to improve the
the results of traditional FDD methods.
This chapter provides the background and motivation of the whole thesis. Firstly,
it gives an overview of traditional FDD methods and their classification. Then, the
shortages of FDDs are proposed and the definition and motivation of graphical
models are introduced. As the graphical model that the thesis focuses on, the
concept of the topology-based causal model is highlighted.
2.1 Definition of the FDD
The malfunctions of a process are usually characterized by process abnormalities
in process variables, such as flow, pressure, level or temperature. This type of
abnormality is also called a fault (Himmelblau, 1978). More specifically, the term
fault refers to an unallowable deviation of one or more characteristic properties of
the system from the normal and acceptable state. The unallowable deviation is the
variance between the fault value and the violated threshold of a tolerance zone for
its normal value (Isermann, 2011).
The root cause or basic event refers to an underlying cause of faults. The root

5
cause is also known as a malfunction or a failure (Venkatasubramanian, 2003).
Venkatasubramanian et al. further divides failures occurring in industrial systems
into three types, namely process parameter changes, structural changes, actuator
and sensor problems. The parameter changes indicate a disturbance entering the
process through exogenous variables (Huang, 2002). For instance, an alteration in
the flow rate of the feed stream is typically such a case. Structural changes mean
that changes occur within the process. They are mainly caused by hard failures in
equipment such as a controller failure or a broken pipe, etc. (Venkatasubramanian,
2005). Actuator and sensor problems, which result from a fixed failure, a constant
bias or an out of range failure, refer to the incorrect measurements and wrong
implementation of the controller commands (Venkatasubramanian, 2003).
The process supervision loop, as shown in Figure 1, explicitly describes the
concept and function of FDD. A process fault can be identified by timely
checking if particular measurements are within a tolerable scope of the normal
value. The fault message will be determined if this check is not passed and that
process is called fault detection. Once a fault is detected, the following step
named fault diagnosis will be taken, where the root cause is identified and located.
In the rest stages, the hazard grade of the fault cause is assessed and
corresponding actions are taken. If it is tolerable, the operation continues,
otherwise, a series of changes will be performed to the operation. Typically, the
operation must be stopped and the fault must be eliminated when the fault is
intolerable (Isermann, 1984).
Figure 1: Process supervision loop (Isermann, 1984)
6
FDDs are essential in the process industry. Traditionally, operators are required to
detect and find out the root cause of process faults by their experience and
knowledge. Next some actions are made to correct the fault which could result in
innumerous damages to the plant due to its chain reaction (Kokawa, 1983).
However, these tasks are very difficult for human labor as the scale of modern
process industries is becoming increasingly complicated.
A modern typical chemical process is always composed of a large number of
components, such as equipment, instrumentation, and valves, which are
interconnected by pipes and signal lines through which the mass and signals flow.
The connectivity of a continuous process means that faults usually spread between
subsystems. The root cause cannot be determined by a single fault since it might
be aroused by an upstream fault. Hence, it is time-consuming and difficult to
locate the source of a fault by observing vast abnormal signals by human labor
(Thambirajah, 2009). Moreover, disturbances that propagate plant-wide have an
extremely large impact on product quality and running costs, and even cause
serious accidents which damage the facility and threaten the personal safety
(Thornhill, 2003). Finally, if the root cause can be early found and removed, the
propagation will be limited at an early stage so as to reduce the workload of
further problem solutions. These considerations provide the motivation for the
development of effective FDD methods when an abnormal measurement is
detected.
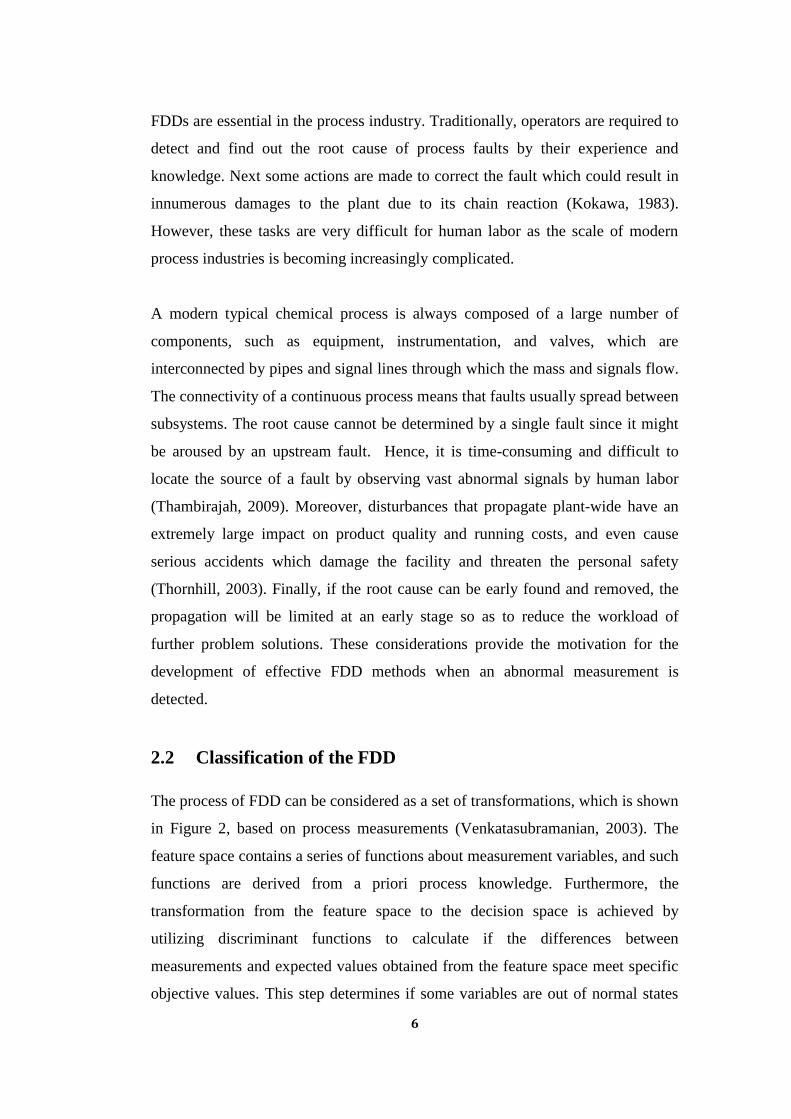
2.2 Classification of the FDD
The process of FDD can be considered as a set of transformations, which is shown
in Figure 2, based on process measurements (Venkatasubramanian, 2003). The
feature space contains a series of functions about measurement variables, and such
functions are derived from a priori process knowledge. Furthermore, the
transformation from the feature space to the decision space is achieved by
utilizing discriminant functions to calculate if the differences between
measurements and expected values obtained from the feature space meet specific
objective values. This step determines if some variables are out of normal states

7
so as to realize the fault detection. Lastly, the root cause is decided through the
comparison between the decision variables and the fault symptoms stored in the
class space.
Figure 2 : FDD flow from the perspective of transformations on
measurements (Venkatasubramanian, 2003)
Based on the FDD flow discussed above, a priori process knowledge is the first
section of the FDD and plays a key role to decide the effects of the fault diagnosis.
The basic a priori knowledge for fault diagnosis is divided into model-based
knowledge and history-based knowledge. Model-based knowledge can be either
mathematical relationships between the inputs and outputs of a process
(quantitative model) or qualitative functions based on different units (qualitative
model). In contrast, the history-based knowledge means the features extracted
from historical process data (Venkatasubramanian, 2003). Venkatasubramanian et.
al. further classified the FDD methods into the three categories including
quantitative model based methods, qualitative model based methods, and process
history based methods, according to the a priori knowledge which they use. Figure
3 shows the classification diagram.
Figure 3: Classification of the diagnostic algorithms (Venkatasubramanian,
2003)

8
Quantitative model-based methods are applied by searching for residuals between
measurements and estimated values predicted by a specific mathematical model,
which can be derived either from physical understanding or a black-box scheme.
The models used for residuals generation mainly includes diagnostic observers,
parity relations, Kalman filters, and parameter estimation (Ding, 2008). However,
an accurate mathematical model is always hard to develop for a complicated
process which is characterized by complexity and nonlinearity. Hence,
quantitative model-based methods are not suitable for a large-scale process system
(Venkatasubramanian, 2003).
Qualitative model-based methods capture cause-effect relationships between
variables and failures based on understanding of the physics and chemistry of the
process (Venkatasubramanian, 2005). Qualitative models do not depend on
precise expressions and numerical models about the process. The most typical
qualitative model-based methods contain signed directed graph (SDG), fault trees,
and qualitative simulation (QSIM) (Venkatasubramanian, 2003). A typical
qualitative method, such as SDG, involves the connecting information of process
variables, with which the fault propagation path can be readily identified. Hence,
qualitative models are suitable for locating root causes in a large-scale process
(Jamsa-Jounela, 2012).
Process history based methods exploit the internal connections between process
variables from measurements. This kind of method can be either qualitative or
quantitative according to the extracted information. Specifically, the methods that
extract qualitative information, called qualitative methods for short, include expert
systems and qualitative trend analysis (QTA). The quantitative methods involve
non-statistical methods (e.g. neural networks) and statistical methods, which can
be further classified as principal component analysis (PCA) and partial least
squares (PLS) (Venkatasubramanian, 2003).
However, the diagnostic effect becomes restricted when the FDD method
mentioned above is applied alone in the large-scale process system. Maurya et al.

9
have noticed that signed direct graph (SDG) methods can create several spurious
candidates when it is used alone for diagnosis (Maurya, 2007). It is also difficult
to judge if a specific variable is the root cause by only analyzing process
measurements since there are more than one candidate root causes calculated
(Chiang, 2003; Jiang, 2009; Benabbas, 2009). Hence, a combination of two or
more diagnosis methods is commonly applied in actual cases.
2.3 Graphical Models Used for the FDD
Several authors have recognized the advantages of utilizing a graphical qualitative
model, which reflects the relationships between process variables, to improve the
process data based analysis. Such a model usually contains process understanding
and offers an explanation of the means by which a fault propagates from the root
cause to other positions (Thornhill, 2003).The most typical graphical qualitative
models include variable-based SDGs and process topology-based causal models
(Yang, 2010).
2.3.1 An Overview of the SDG
The SDG is a graph where the nodes denote the process variables and the edges
correspond to the direct influences between the variables. Additionally, both
nodes and edges consist of signs associated with them. These signs indicate
variations of variables and the influence of these variations on other variables (Iri,
1979). The SDG can be derived from either mathematical equations or process
knowledge. Chiang (2003) applied SDGs in multivariate statistical analysis to
improve the fault diagnosis. Lee et al. (2003) used a SDG to decompose a process
into subprocesses and applied partial least-squares for each measured variable in
each subprocess so as to promote the diagnostic precision. Maury et al. (2007)
employed a SDG method to reduce spurious solutions generated by a data-based
analysis of QTA for the fault diagnosis.

10
2.3.2 An Overview of the Process Topology-based Causal Models
Topology-based causal models are a type of qualitative model, which indicates the
physical connections of process items including equipment, valves, and
instrumentations. Such a model can be derived from a process schematic without
the request for first principles (Di Geronimo Gil, 2011). Different from the SDG
which directly reveals the relationships of process variables, topology-based
causal models indirectly show interactions between variables in different
components, which have resulted from physical or signal flows along the
components in a system.
Topology-based models are readily to be developed, since the topology data
which is required to build such models can be easily exported from computer
aided engineering tools, such as AutoCAD P&ID, SmartPlant P&ID and
ComosPT, in the form of XML (extensible markup language) or XLS/XLSX
format (Microsoft Excel file format).
There are two types of topology-based causal models including the topology-
based causal digraph and the connectivity matrix, which can be considered as a
graphical representation and a numerical representation of process schematics,
respectively. The topology-based causal digraph uses nodes and directional arcs to
represent the positional information of process items and their connections. The
connectivity matrix, the other form of the causal model, is a matrix which
represents the relationships between components with binary numbers. Elements
in the matrix can be either ‘1’ or ‘0’ according to whether there is a directional
connection from the row header to the column header, which represents a specific
process component (Benabbas, 2009). The detailed concept of the topology-based
causal models will be specified in the Section 6.1.1 of the experimental part.

11
3 GRAPHICAL REPRESENTATION OF PROCESS
TOPOLOGY - P&ID
The process topology refers to positions of process components and their
connections. Piping and instrumentation diagrams (P&IDs), which are usually
applied to plant design, construction, and maintenance, clearly reflect such
topology information. In order to guarantee the consistency of the P&IDs, a series
of the P&ID standards for graphical symbols and lettering abbreviations are
published. The most common ones comprise the PIP, ISA, ISO, BS, and DIN
standards. The graphical symbols and their identifications defined by different
standards always vary; hence, a thorough understanding of these representations
and the differences between them is very essential. With the development of
information technology, the traditional printed P&ID drawings are being
gradually replaced by the more effective electronic P&IDs which present huge
advantages in the design, maintenance and data exchange of the P&ID drawings.
Based on the above introduction, this chapter first presents the definition of the
P&IDs and their applications. Next, some common standards used for P&IDs are
described. Section 3.3 mainly concentrates on the identification of the various
component symbols and lettering abbreviations. The last section introduces
several intelligent P&ID design applications.
3.1 Definition of the P&ID
A process layout or topology in a plant is usually presented by a series of the
process components such as equipment and instrumentation, and the piping
between them. In the engineering applications such as project designing and
construction, the process drawings are commonly used to describe such a process
topology. The most ordinary process drawings applied in the process industry
include a process flow diagram (PFD) and a piping and instrumentation diagram
(P&ID) (Bumble, 2000).

12
The PFD is a process sketch which uses standard symbols to represent the process
equipment and reveal the general flow of the plant processes. The PFD depicts the
connecting information about the primary piping between the major plant
equipment so that it only identifies physical flows, i.e., gas and liquid flows along
the process and does not show details about control loops (Matt, 2009).
The P&ID is developed from the PFD and includes the control loops (Dev, 2013).
Compared with the PFD, the P&ID is a more detailed graphical description of the
plant topology and it displays both the pipe lines and signal lines along with the
connected equipment and instrumentation. Hence, the P&ID reflects both process
flow and control functions. As an important constituent, the instrumentation in
P&IDs refers to a combination of devices in the control loop which are used to
measure, display and control a variable. The common instruments include
measurement devices (e.g., a transmitter), indication devices (e.g., an indicator),
control devices(e.g., a controller) and actuating devices (e.g., a control valve)
(Meier, 2007). As shown in Figure 4, in which a PFD (left) and a P&ID (right)
based on the same process are presented, the P&ID possesses more control
functions such as control valves and controllers, which are not presented on the
PFD.
Figure 4: Comparison between the PFD (left) and the P&ID (right) (Matt,
2009)
Besides the graphical symbols, the P&IDs also assign a tagging system to
uniquely identify the process items. Such a system includes abbreviations and

13
numbers of equipment, valves, and instruments, as well as the numbers of piping
and control loops. Moreover, the size of piping and valves is also marked.
The P&ID provides essential information required for constructing and operating
the process and further conducting the fault diagnosis. It presents detailed
information about piping connections between process components so as to
provide a feasible foundation for the engineering applications. On the other hand,
the connecting lines imply the internal connections such as physical or signal
flows between different components. This assists the normal FDD methods to
precisely locate the most probable root causes when faults occur (Thambirajah,
2009). Overall, the P&ID realizes the following four functions (Cook, 2010):
1. It provides clear illustration and relative position information of all equipment,
piping and instruments to all people who want to understand the process.
2. It is strong evidence upon which engineers conduct process hazards analysis
and fault diagnosis.
3. It is an essential guideline for process construction, operation and maintenance.
4. When improvements are applied, the P&IDs can be treated as a project
reference and changes can be planned safely and effectively.
Although the P&ID clearly describes the overall process topology and identifies
each equipment and instrument, it still lacks some detailed information. For
instance, it only generally presents the symbols and relative locations of devices
rather than their actual size and real positions. It does not contain operating
specifications such as flow rates, compositions, pressure, and temperature
(Christopher, 2007). Therefore, other supplementary documents are usually
needed to provide more details. Such documents include: the plant layout
drawings showing the distance between units, the PFDs providing detailed
mass/energy balance data and stream compositions, the material specifications
explaining materials needed for construction, and the equipment and
instrumentation specifications deeply describing some details about equipment
and instruments (Cook, 2010).

14
For a large process, the structure of the P&ID diagram needs to be broken down
into manageable sections according to the areas in the plant, functions or other
criteria that affect to the project (Cook, 2010). Correspondingly, each diagram
should be equipped with notations directing to the linked diagram. The separation
of the P&IDs facilitates the development of the drawing as well as its readability.
3.2 P&ID Standards
P&IDs must be designed systematically and uniformly within a company
(Christopher, 2007). Firstly, the development and implementation of a P&ID
project always involve professional engineers from various departments.
Inconformity can lead to confusion among different participants so as to affect the
project implementation. Moreover, the follow-up maintenances and improvements
based on the P&IDs are always conducted by different developers. The revisions
reflecting the process changes should therefore follow the same form each time.
Inconsistent formats of the P&IDs are confusing and misunderstanding by the
upstreaming technicians.
Based on above reasons, a thorough set of standards must be determined before
the P&ID development either for creating a P&ID by hand or on a computer.
These standards define the format of symbol and identification label for each
component of the P&ID (Medida, 2007). P&ID symbols are graphical
representations for process components, e.g., equipment, piping, and
instruments. Identification labels are a combination of letters and numbers used to
uniquely recognize a process item. Currently, there are many standards for
instrument symbols and lettering abbreviations of the P&IDs. The most common
ones comprise the PIP, ISA, ISO, BS, and DIN standards.
3.2.1 An Introduction to the P&ID standards
PIP standard. The industry group Process Industry Practices (PIP) is an
association of a series of member companies, with the aim to harmonize the
15
internal standards of member companies for design, construction, and
maintenance. It establishes a set of harmonized documents as “Practices” in
various process disciplines such as power, pulp & paper, and pharmaceuticals
(PIP, 2012).
The P&ID standard issued by PIP is enclosed in PIP PIC001, Piping and
Instrumentation Diagram Documentation Criteria, which defines the P&ID format
(drawing size, item layout, tag format, text arrangement, etc.), symbols , drafting
rules, and tagging and numbering scheme for the equipment (tanks, exchangers,
pumps, reactors, etc.), piping (piping lines, valves, and fittings), and
instrumentation and controls (controllers, control valves, transmitters, Interlocks,
relief devices) (PIP, 2008).
ISA standard. The latest version of American standard ANSI/ISA-5.1,
Instrumentation Symbols and Identification, is approved by Standards and
Practices Board of International Society of Automation (ISA) in 2009. It is used
to describe instrumentation symbolism, and identification systems. This standard
introduces a consistent mechanism that comprises identification schemes and
graphic symbols in order to describe and identify instruments and process items
and their functions. The ISA standard is widely applied in commercial process
software, which is used for measuring, monitoring, and controlling actual process
production (ISA, 2009).
ISO 14617 standard. The P&ID standard published by the International
Organization for Standardization (ISO) technical committees belongs to the
standard series ISO 14617, graphical symbols for diagrams. The purpose of ISO
14617 is to develop a library of the harmonized graphical symbols for diagrams
used in technical applications. The sections associated to the P&IDs involve:
14617-3 specifies graphical symbols for functional connections, pipelines, and
connection joints; 14617-4 specifies graphical symbols for basic elements in the
actuator, complete actuators, and actuating devices in diagrams; 14617-5 and

16
14617-6 specify graphical symbols for measurement, and control devices and
functions; 14617-8 specifies graphical symbols for valves (SFS, 2004).
BS standard. British standard BS 1646 (1-4) has been developed by the
Industrial-process measurement and control standards committee of the British
Standards Institution (BSI) from 1979 to 1984. This standard provides a set of
symbolic representations for process measurement control functions, and
instrumentation. The standard is presented in four parts (BSI, 1979-1984): the
part 1 and part 2 create a symbol system which involves a series of the graphical
representations describing the functions of measurement and control equipment in
a process. This system only clarifies the identification of the instrument functions
without affording approaches of depicting specific instruments. The part 3
specifies instrument symbols, such as signal lines, measurement devices, for use
on interconnection diagrams. The part 4 specifies symbols for the representation
of the process computer and/or shared display/control functions in process
measurement and control. The symbols can be used in conjunction with the
symbols given in the part 1 and part 2 of BS 1646.
DIN standard. DIN 19227-1-1993 and DIN 19227-2-1991 are issued by German
Institute for Standardization. This standard applied to the preparation of design
documentation for process control engineering incorporates existing measurement,
operation, and control instrumentation (DIN, 1993).
The name of DIN 19227-1 is ‘Control Technology - Graphical Symbols and
Identifying Letters for Process Control Engineering - Symbolic Representation for
Functions’. This document defines graphical symbols for the basic representation
of process instrumentation and controls including conventional measurement and
control equipment. DIN 19227-2, namely ‘Control Technology - Graphical
Symbols and Identifying Letters for Process Control Engineering - Representation
of Details’, deals with the detailed representation of the functions as specified in
DIN 19227-1.

17
3.2.2 Comparisons between Different P&ID Standards
The ISA standard is an extension of the PIP standard (PIP, 2008). In other words,
the ISA standard is developed from the PIP PIC001. The cross-licensing
agreement between ISA and PIP allows ISA to broaden the symbol library of the
PIP standard and extend its application beyond the member companies of the PIP
(PRNewswire, 2000). Meanwhile, PIP can also get access to the ISA symbols in
the PIC001. Hence, the ISA standard possesses more complete symbol libraries
than PIP.
The ISO standard is widely employed by the European industries. The BS
standard is developed from the ISO standard and it therefore follows the similar
expression form and the drawing rule than the ISO standard. However, the BS
standard focuses on process control functions and instrumentation sections, but
ignores the equipment and pipes (BSI, 1979-1984).
The DIN standard defines special P&ID graphical systems which is different from
others. Similar to the BS standard, this standard concentrates on the graphical
symbols and identifying letters for instrumentation. Since there exist similarities
between different standards, the following section describes the components
identification in the P&ID with ISA standard.
3.3 Component Identification in the P&ID
As mentioned in the last section, the development of a P&ID should follow a
certain norm. There are two factors, P&ID drawing styles and component
identification, which should be considered when an understandable P&ID is
developed (Nasby, 2012).
Drawing styles refer to the arrangement of symbols and piping on a P&ID. The
ISA standard defines a three-layer hierarchy for a P&ID drawing, which is shown
as the field equipment, local control panels, and central control systems, from the
bottom to the top. In contrast, the other standards do not propose a specific

18
drawing style. Normally, the layout of the process components can be determined
by the specific design requirements of a company and it should reflect actual
positions of the process components.
Component identification refers to the representation of the actual process items
in a P&ID. Such a representation refers to a combination of the graphical symbols
and identification labels of the process items. The following depicts three of the
most important items: equipment, lines, and instrumentation.
3.3.1 P&ID Symbols and Tagging
Different types of process equipment are distinguished by different symbols,
while the tag scheme can be applied to differentiate the equipment within the
same type. Figure 5 shows some common equipment symbols with corresponding
tags based on ISA standard. Equipment tags usually possess a letters-plus-number
tagging scheme (ISA, 2009). The letter designates the type of equipment, such as
V is vessel, P is pump, and T is tank, while the number is the identifier of a piece
of specific equipment. The tag can also involve the type of service which can also
be represented with a number. For instance, 30 is process gas and 60 is fuel gas.
Hence, the tag TK-60100 means the number 100 tank with fuel gas service.
Figure 5: Commonly used equipment symbols with the alphanumeric labels
(Nasby, 2012)

19
Pipes and signal lines are usually denoted by different line symbols, which are
used to describe the connectivity between different process components and the
internal materials that pipes/lines serve for. Process industry usually involves two
types of pipes, primary pipes, and secondary pipes, which are distinguished by
lines with a different size. The direction of material flow is usually identified by
arrows, and the pipe labels are placed along the lines to provide further
information about the pipe, for instance, a diameter of the pipe, the component in
the stream, material of the pipe, and insulation. The format of the labels is usually
company-specific. Figure 6 shows a case of the pipe line symbols, which
represents the number 39 pipe with a 4" diameter. The stream that the pipe carries
is denoted 'N', the pipe is made of carbon steel, and there is no insulation.
Figure 6: A pipe line segment with labels (Halley, 2009)
The signal line symbols describe how signals are transmitted within a control loop.
This type of lines should be lighter than the process pipe lines. Moreover, the
signal types, such as electrical and pneumatic, should be reflected by different
forms of lines. Table 1 describes the most common signal lines defined in the
ISA-5.1 (Meier, 2011).
Table 1: Commonly used signal line symbols (Halley, 2009)

20
As shown in Figure 7, the pipe and signal lines, also known as the major and
minor lines, should be broken according to the hierarchy in the order of major-
minor-primary-secondary lines, when they cross.
Figure 7: Crossing lines (Walker, 2009)
Instrumentation symbols reflect process instruments, e.g., transmitters, indicators,
and controllers. These symbols with the attached tags can easily identify the
instrument functions, and their locations. The following figure extracted from the
ISA standard document lists the common instrumentation symbols.
Figure 8: General Instrument and Function Symbols (Meier, 2011)

21
As shown in Figure 8, all the graphical shapes, such as circles, squares, hexagons,
and diamonds, possess specific denotation. A circle indicates a device is located in
the field area of a plant. A circle with an external square represents devices or
functions which belong to a shared display and control system, e.g., a DCS system.
A hexagon represents a computer function. A diamond with an external square
defines functions within a programmable logic controller. The symbol with one
line inside means the device is located in the central control room, whilst the one
with two lines indicates the device is located in a local panel. A circle with a
dotted line in the center means the device is installed behind the panel and
inaccessible to the operator (Meier, 2011). The ISA-5.1 clarifies meanings of the
identification letters for the instrument, and the function system in a tabular form
as shown in Table 2.
Table 2: Instrumentation identification letters (ISA, 2009)

22
This table is classified into five columns which consist of two parts, describing
process variables, and the type of device respectively. The first part includes the
first two columns, representing process variables the instrument is intended to
control, and the further description (modifier) about the process variables,
respectively. The most common process variables involve: flow (F), level (L),
pressure (P), and temperature (T) (Meier, 2011). The next three columns define a
device. The function, readout (e.g. record) or output (e.g. valve), of the device are
defined by the third and fourth column respectively. The last column defines the
output functionality.
The instrumentation within the same loop should carry the corresponding loop
number. In other words, all devices combined to conduct a single specific action
should be tagged with the same identifier based on the loop. This number
combined with the identification letters uniquely identifies each device. For
instance, FT-002 is a flow transmitter in the 2nd loop.
In addition, a prefix in the form of the area-unit-plant can be combined with the
instrument number to distinguish the instrument location, when the project is
implemented in several areas, units and plants; thus, 234-PT-102 is a pressure
transmitter in the loop 102, which is located in the area 2, the unit 3 and the plant
4. When a particular area involves several P&IDs, the variation of these diagrams
can be reflected with the first digit of the instrument number. For example, FT-
1230 means the device in the 30th loop of the 12th P&ID (Meier, 2011).
The instruments can be uniquely identified when the identification letters,
instrument numbers and symbols are combined in a specific form, namely
‘Instrument Symbol Tag Identification’ (Cook, 2010). The “Instrument Symbol
Tag Identification” in a control symbol contains two lines inside it: an
abbreviation for the instrument and function system on the top line, and a loop
number at the bottom. Figure 9 is an example representing a discrete flow element
in the 150th loop and it is field mounted.

23
Figure 9: An example of the ‘Instrument Symbol Tag Identification’ (Cook,
2010)
3.4 Intelligent P&ID Applications
The P&IDs can be generated in an electronic form by the computer-aided design
(CAD) programs. These programs are beneficial to produce the clean and neat
P&IDs that can be stored and viewed electronically.
Figure 10: Electronic P&ID and its database (Walker, 2009)
The electronic or intelligent P&IDs are more efficiently generated than the printed
ones. Firstly, there is usually a complete symbol library behind the CAD tools.
This provides users convenience to perform drag-and–drop operations and
reduces the repetitive works. Moreover, the symbols presented in the P&ID are
more consistent since all of them are from the same source. Secondly, electronic
drawing is more intelligent which is characterized by the following aspects: the
lines are automatically broken when they cross; a line is automatically broken
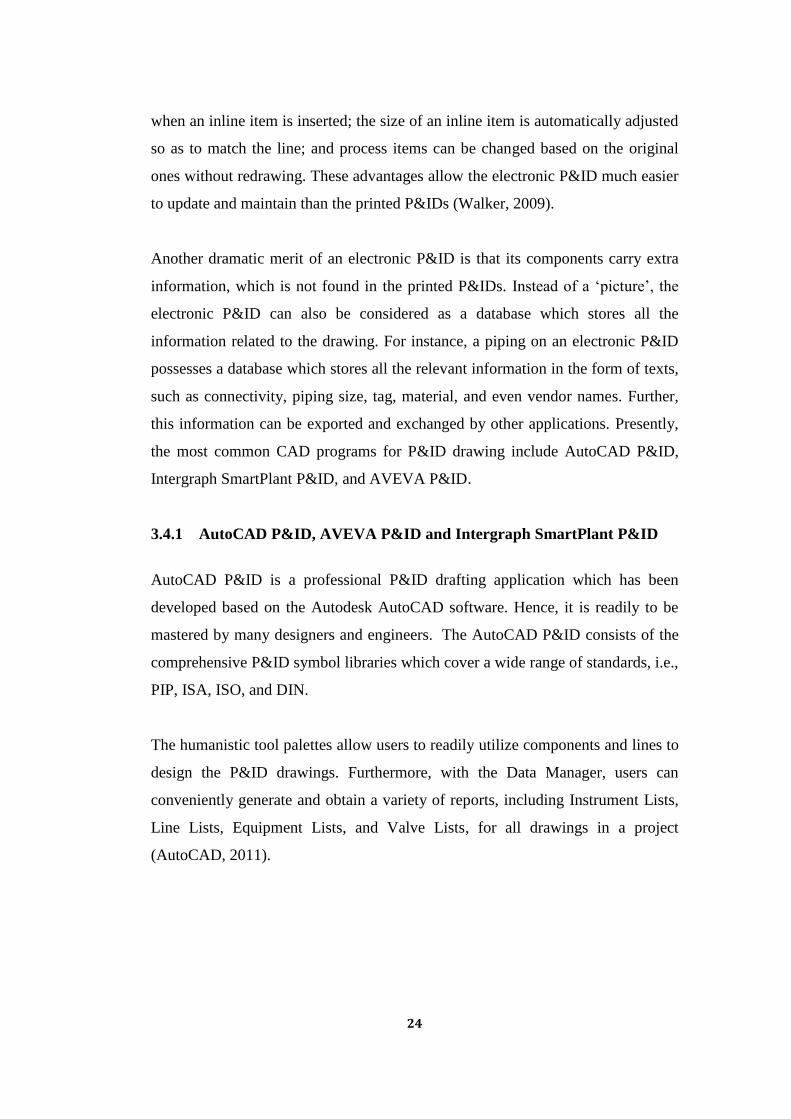
24
when an inline item is inserted; the size of an inline item is automatically adjusted
so as to match the line; and process items can be changed based on the original
ones without redrawing. These advantages allow the electronic P&ID much easier
to update and maintain than the printed P&IDs (Walker, 2009).
Another dramatic merit of an electronic P&ID is that its components carry extra
information, which is not found in the printed P&IDs. Instead of a ‘picture’, the
electronic P&ID can also be considered as a database which stores all the
information related to the drawing. For instance, a piping on an electronic P&ID
possesses a database which stores all the relevant information in the form of texts,
such as connectivity, piping size, tag, material, and even vendor names. Further,
this information can be exported and exchanged by other applications. Presently,
the most common CAD programs for P&ID drawing include AutoCAD P&ID,
Intergraph SmartPlant P&ID, and AVEVA P&ID.
3.4.1 AutoCAD P&ID, AVEVA P&ID and Intergraph SmartPlant P&ID
AutoCAD P&ID is a professional P&ID drafting application which has been
developed based on the Autodesk AutoCAD software. Hence, it is readily to be
mastered by many designers and engineers. The AutoCAD P&ID consists of the
comprehensive P&ID symbol libraries which cover a wide range of standards, i.e.,
PIP, ISA, ISO, and DIN.
The humanistic tool palettes allow users to readily utilize components and lines to
design the P&ID drawings. Furthermore, with the Data Manager, users can
conveniently generate and obtain a variety of reports, including Instrument Lists,
Line Lists, Equipment Lists, and Valve Lists, for all drawings in a project
(AutoCAD, 2011).

25
Figure 11: AutoCAD P&ID user interface (AutoCAD, 2011)
AVEVA P&ID is a P&ID drawing application which originates from the
AutoCAD. It provides a symbol library which only supports the ISA standard.
The P&ID sketch can be intelligently drawn by AVEVA which is characterized
by the fact that the process items and the connectivity between them can be
perceptively identified when symbols and flow lines are introduced into a drawing.
Engineering tag information for the equipment, pipeline and instrument can be
added as the items to extend the application scope of the P&ID drawings.
The project explorer in the Graphical User Interface (GUI) presents a list of
process items on a drawing and symbol libraries, which enable the edition process
conveniently. Furthermore, the users can add tags for process items in properties
dialog boxes, which can integrate seamlessly with the AutoCAD software
(AVEVA, 2010).

26
Figure 12: AVEVA P&ID user interface (AVEVA, 2010)
The SmartPlant P&ID is a P&ID application which is based on drawing data.
Similar to the AutoCAD P&ID and AVEVA P&ID, the SmartPlant P&ID also
includes two parts, a graphical drawing function and a drawing database, which
are managed by the SmartPlant P&ID Drawing Manager and the SmartPlant
P&ID Engineering Manager, respectively. This software provides the P&ID
symbols conforming to the ISO and ISA standards (Intergraph, 2007).
Figure 13: SmartPlant P&ID user interface (Intergraph, 2007)

27
4 XML REPRESENTATION OF THE P&IDS
In the modern industry, design data always needs to be exchanged among diverse
CAD systems in order to complete a whole design process. However, different
CAD systems always possess an individual data format, which seriously limits the
data exchange.
Typically, a pictorial representation of the plant topology, such as a P&ID
drawing, is of limited use to exchange data with computer programming tools.
Thus, the definition of a generic text format is essential to ensure data consistency
in different tools (IEC, 2005). As a commonly accepted data sharing format, XML
is vendor independent and can be used to represent the plant topology, such as
process components and their attributes, and the interconnections between them.
As two accepted schemas, Computer Aided Engineering Exchange (CAEX) and
XMpLant define the XML syntax when using XML files to represent the plant
topology (Thambirajah, 2009). These schemas are developed based on a series of
data exchange standards, e.g., ISO 10303, IEC/PAS 62424 and ISO 15926 (Alabi,
2010).
Nowadays, more and more CAD tools for P&ID design are beginning to support
exporting P&ID drawings in the form of XML, for instance, Comos P&ID from
Siemens, SmartPlant P&ID from Intergraph, and AVEVA P&ID (Thambirajah,
2009). In addition, for the P&ID design software which cannot export XML files,
e.g., AutoCAD, it is possible to create XML files by means of programming
languages, such as C++ and C#, in a self-defined format.
4.1 Engineering Data Exchange Standards
The requirement for standards that support data exchange results from the
incompatibilities between computer systems (Fowler, 1995). There is no problem
arising when one application separately operates. Nevertheless, the
incompatibilities of data formats used by different applications restrict the
cooperation between two or more different applications. Hence, a neutral format is

28
required when several computer systems communicate. This is the driving force
behind a series of data exchange standards for the process plant industry (B2MML,
2009). Figure 14 shows the communication process based on the data exchange
standards.
Figure 14: Neutral format data exchange (Fowler, 1995)
Engineering data exchange standards used in the process industries comprise ISO
10303(STEP) -221 and ISO15926.
4.1.1 ISO 10303(STEP) -221
The ISO 10303, also known as ‘STEP’ (Standard for the Exchange of Product
Model Data), is a complete standard that depicts how to express and exchange
digital manufacturing data (STEP Tools , 2013). It can be applied by a variety of
disciplines in industry, e.g., automotive, aerospace, and chemical industries
(Wiesner, 2011).
Application Protocols (APs), i.e., the implementable parts of the ISO 10303,
define a series of models data exchange can be based on. The data structures in
different engineering disciplines are specified by different APs. The AP applied in
the process plant is developed by the European EPISTLE consortium and
numbered as AP 221 “Functional data for process plant and their schematic
representation”. This standard involves the most common process schematics, e.g.,
P&IDs and PFDs, and the engineering facts which these schematics represent
(Leal, 2005).

29
The AP221 can be described as an artificial language that computers can
communicate with each other. Such a language contains two elements: the objects
and the relationships between the objects. Therefore, the AP221 language consists
of two main sections: the dictionary and the grammar, which define the objects
and the rules for relationships between these objects, respectively.
The AP221 grammar, also called the AP221 Data Model, defines a standard
sentence structure, such as ‘… is a part of a …’ and ‘… has property …’. These
sentence structures can be used to express the associations between two objects.
For example, ‘a valve is a part of a pipe segment’. The element of the expression
between the two objects is called the “association type”. The AP221 grammar
consists of 60 such association types. The sentence structures can also be used to
describe the events, activities, and behavior of objects in relation to each other. At
the vacancies on both sides of the ‘association types’, the terms which represent
equipment and plants, or their design and operation can be filled in.
In several cases, the terms filled in these places should be made from the AP221
Dictionary, also called STEPlib, which contains many thousands of terms. These
terms include not only the types of plants and their properties, but also the process
materials, design, operation and maintenance activities, and the roles of people
and organizations involved.
The dictionary terms in the AP221 language are mainly used to express what
things are, i.e., how they are classified or how their roles are classified. Thus,
every term in the dictionary is a name of a class of the object, which is either a
class of the physical object, a class of the events, a class of the role, a class of the
property. Therefore, by using the association types, the sentence can be written as:
‘… is classified as … (class of the object)’ or ‘… has a role as … (class of the role)
in activity …’. For instance: V-200 is classified as a valve and V-200 has a role as
a performer in an activity ‘control fluid’.

30
4.1.2 ISO 15926
ISO 15926, also known as ‘Life cycle data for process plant’, is a standard
for information integration, distribution, and exchange between different
computer systems. It is developed from the AP 221 of the STEP and can record
not only the instant state of the process plant, but also how the process plant
changes (Leal, 2005). It aims at involving all engineering data in the whole life
cycle of a chemical plant. Therefore, it can improve the data exchange between all
engineering procedures starting from design to construction and operation
(Wiesner, 2011). Leal (2005) summarized the contents that the standard involves:
all physical items within a plant, the identifiers, properties and classifications of
the physical items. In addition, the standard also defines how these process items
are assembled and connected.
The ISO 15926 consists of 11 parts (Topping, 2011). The core of the ISO 15926 is
the data model (Part 2) and the Reference Data Library (RDL) (Part 4). These two
parts define how the data can be understood and the rest of the parts define how it
is transferred.
Part 2 and Part 4 define the basic data template for communications between
different applications. Such a template imitates the characteristic of the natural
language, which includes the words and grammars. Particularly, if two people
know the meaning of the words and how they are organized together (grammar),
they can communicate seamlessly. Similarly, when two applications have a
common dictionary which defines a series of words, and uses a common data
model which defines the grammar, they can communicate seamlessly. Thus, the
Part 4 (the dictionary) and the Part 2 (the data model) are the two most important
parts of the ISO 15926. When two computer applications use the same terminol-
ogy, i.e., the same RDL, and organize their information by same means, i.e., use
the same data model, they can communicate freely.

31
Figure 15:ISO 15926 Metaphor (Topping, 2011)
The following pyramid figure shows the structure of the ISO 15926, which is
organized from generic classes to the specific objects from the top towards the
bottom.
Figure 16: ISO 15926 pyramid (Leal, 2005)

32
Specifically, the Part 2 defines generic concepts of things, classes, and their
relationships such as connection, composition, containment. The means by which
the objects change with time are also defined. The Part 4 defines the core RDL for
the usage of the ISO 15926 Part 2. The core RDL contains the core classes and
reference individuals, which are arranged in an ontology of subtypes of the classes
in the Part 2. Currently there are almost 20,000 classes in the Part 4 and the library
is still extensible. Part 7, the Template Methodology, specifies a series of
templates which are predefined expressions organized based on the generic
formats defined in the Part 2. This means that it is possible for users to self-define
and develop the grammar rules following the ISO 15926 protocols. It also allows
users to implement the Part 2 data model in a convenient way without
understanding details in the Part 2.
4.1.3 Comparisons between the AP 221 and the ISO 15926
As introduced in the 4.1.1 and 4.1.2, the AP 221 and ISO 15926 possess the
similar structures, both of which define a general data model and reference data
libraries. Figure 17 shows a P&ID case which is recorded by data exchange
standards.
Figure 17: Records of the P&ID with the AP 221 and the ISO 15926 standards
(Leal, 2005)

33
In this example, the P&ID shown on the left side describes the representations and
interconnections of the several process items with the graphical symbols and
annotations. There is a centrifugal pump which has an outlet nozzle p4506a-N2.
The nozzle is further connected to the pipe segment S1a. Such information is
recorded by the data exchange standards in the form of the structural texts on the
right side of Figure 17 (Leal, 2005). The relationships such as identification,
classification, composition, and connection are marked with shadow frames and
they are defined within the ISO 15926-2 or the Grammar of the AP 221. The class
names such as centrifugal pump, nozzle, outlet, and pipe segment are marked with
blank frames and they are defined within the ISO 15926-4 or the Dictionary of the
AP 221.
As shown in Figure 18, even if some overlaps, such as identification and
connection of the physical objects existing in both the ISO 15926 and the AP 221
standards, there remain two differences between them. Leal (2005) referred that
the AP 221 defines the detailed grammar rules for the relationships between
objects in a P&ID, while it is not directly defined in the ISO 15926-2. Moreover,
the ISO 15926 can record the process components in both temporal and spatial
dimensions. By contrast, the AP 221 can only preserve information in spatial
dimension, while hardly represent the varieties of a process over time.
Figure 18: Relationships between the AP 221 and the ISO 15926 (Leal, 2005)

34
4.2 XML Representation for the P&IDs
4.2.1 Introduction to XML
Extensible Markup Language, abbreviated XML, was developed by the XML
Working Group established by the World Wide Web Consortium (W3C) in 1996
(W3C, 2013). It is designed for the exchange of various kinds of information in
the Web development, especially to structure, store and transport data or
information.
An entire XML program comprises several single elements which can be
classified as root elements (parent nodes) and their sub-elements (child nodes).
All elements serve as a tree structure that starts at the root elements and extends to
the branches (sub-elements) of the tree. XML can be simply considered as pure
information wrapped in tags. The tags are enclosed in brackets (< >) and they
define XML data structures (Alabi, 2010). Any element should have a start and an
end tags in order to form an effective XML. It can also contain attributes that
provide extra information about the elements (Bray, 1997). A typical XML
structural representation can be summarized in Figure 19.
Figure 19: Structural representation of XML (Alabi, 2010)

35
4.2.2 XML Schemas for the P&IDs
The plant topology should be represented by the specific XML syntax, which is
defined by the XML schemas. As the most common schema, XMpLant is
developed based on the ISO 15926 standard and has been employed in increasing
P&ID engineering applications.
4.2.2.1 XMpLant Schema
XMpLant is an XML standard developed by Noumenon and it is based on the ISO
15926. The aim is to establish a consistent, non-proprietary XML scheme for the
storage and exchange of data (Noumenon, 2008). The XMpLant can be used to
map data in a specific proprietary software to a format of the ISO 15926 and then
transfer it to any other desirable proprietary system (Siemens, 2011).
Figure 20: XMpLant conversion (Noumenon, 2008)
Figure 20 shows the data exchange process between different applications with
the XMpLant. Data created in an engineering application is imported to the
mapping subsystem, which is defined by the XML mapping files. These files
provide relationships between the external information and classes defined in the
ISO 15926. With such files, the data from native applications is converted into a

36
neutral XMpLant model which is a dictionary compliant file based on the
XMpLant schema and independent of the original application and format.
Similarly, the data is exported from the neutral model to the application based on
the XML mapping files as well (Noumenon, 2008).
Based on the classes of the ISO 15926-3 (geometry) and the ISO 15926-4 (plant
item), the XMpLant Schema defines a specific XML structure which is intended
to support the whole process engineering information, including process objects,
topology, and geometry. The XMpLant schema is organized as the structure
shown in Figure 21.
Figure 21: Structure of the XMpLant schema (Noumenon, 2008)
At the top of the XMpLant schema, the formats of attributes which are used by the
plant item classes are defined, including integer, double and string. The second
layer clarifies the formats of the key engineering attributes, the name of which is
provided by the RDL of the ISO 15926-4. The fixed object classes for geometry
and PlantItem are clarified in the following layer. The PlantItem class is the
universal abstract object of all the specific plant items and it specifies their generic

37
attributes. At the bottom of the schema, the specific plant items are presented by
adding extra key attributes to the PlantItem class (Noumenon, 2008).
4.2.3 A P&ID Model Conforming to the XMpLant Schema
POSC Caesar Association (PCA) and Fiatech presented a detailed information
model for P&IDs based on the XMpLant schema in 2008. Nowadays, the
XMpLant-compliant P&ID model has been employed into process design
applications by the major system vendors.
This model describes the XML exchange format for P&IDs using the classes of
the ISO 15926-4 Reference Data Library. The elements in a P&ID can be
classified into component objects and connectivity objects according to the
defined model. The model comprises two kinds of component objects: PlantItem
and AnnotationItem. PlantItem refers to an abstract super-type for all physical
assets e.g. equipment, piping components, etc. Each of item has eight attributes:
ID, TagName, Specification, ComponentClass, ComponentName,
ComponentType, Revision, and Status. All attributes are optional except ID.
An AnnotationItem is an abstract super-type for objects that are referenced in the
P&ID but that does not represent a physical asset. The typical AnnotationItem
includes drawing borders, tables, and notes, etc. AnnotationItem has six attributes:
ID, ComponentClass, ComponentName, ComponentType, Revision, and Status.
Connectivity objects in the XMpLant model consists of Connection and
ConnectionPoints. Connection has four attributes: FromID, FromNode, ToID, and
ToNode. ConnectionPoints possesses two attributes: FlowIn and FlowOut.
The selection of the Connectivity objects needs to be considered according to the
different cases. The internal connectivity within a PipingSegment is defined by
the sequence of the components in it. The Connection Element can be used as an
identifier of the connectivity between PipingSegments and other PlantItems. The

38
connectivity within a PipingComponenent, InstrumentComponent, or PipeTube
can be identified with the ConnectionPoints Element (Noumenon, 2008).
The XML representation for a P&ID should be divided into fragments based on
PipingSegment, where the engineering parameters are constant. In other words, a
PipingSegment should start and end at a place where a key engineering parameter
changes or the flow splits. Nozzles, reducers, and tees are typical components
which indicate the start and end of the PipingSegments.
Within the XML of a single PipingSegment, the IDs of the start and end points
should be identified in the initial line. The following lines introduce the detailed
information, such as IDs, Tags, and classes, of all components included in the
segment in a sequential order. The junction where a process instrument is
connected to a PipingSegment should be also reflected. Figure 23 illustrates an
example of the XML representation for a P&ID fragment shown in Figure 22.
Figure 22: A P&ID fragment with two PipingSegments (Adrian, 2009)

39
Figure 23: XML texts for Figure 22 (Adrian, 2009)
4.3 Intelligent P&ID Applications Supporting the XML
Representation
For the aim of the convenient P&ID data sharing, more and more P&ID software
manufactures are integrating the XML export module into their applications. The
most well-known ones are AVEVA P&ID Tool, Comos P&ID, SmartPlant P&ID,
and AutoCAD P&ID.
4.3.1 Comos P&ID
The COMOS P&ID module implements an XMpLant interface, with which a
P&ID can be exported to an XMpLant-compliant XML file which includes the
following data (Siemens, 2011):
1. P&ID objects include Equipment, Instrumentation, Functions and their
positions, Pipes, pipe branches, and pipe segments. These objects are exported
as PlantItems. Each object can contain the following data: "Label" property,
"SystemFullName" property, attributes which are located on the subtabs of the
"Attributes" tab and whose "Value" is set, and P&ID coordinates of the object.

40
2. Data lines and effect lines are exported as PlantItems of the ‘SignalLine’ type
and P&ID coordinates are included.
3. Purely graphical elements of the P&ID include Texts, Lines, Circles, and
Elbows. These elements are exported as ShapeItems and P&ID coordinates
and Graphics or text are included.
Figure 24: XMpLant output from the Comos tool (Siemens, 2011)
4.3.2 AVEVA P&ID
AVEVA P&ID is a P&ID design application which saves intelligent engineering
data involving tagged items, quantities, and connectivity data. The tool can also
create a thorough report of the plant from the P&ID drawing which is in
accordance with the ISO 15926 and it consists of all the information about a plant
throughout its life cycle.
Figure 25 shows an example of the XMpLant output displayed in the viewer of
the AVEVA P&ID. The detailed information about any process item, such as
equipment, instrument, or pipe, can be read by clicking it on the Plant Items tree

41
window. The information covers tags, geometry, coordinates, and other
information about the plant as specified in the ISO 15926 (Alabi, 2010).
Figure 25: XMpLant output from the AVEVA P&ID tool (Alabi, 2010)
4.3.3 SmartPlant P&ID
XML data exchanges in the SmartPlant P&ID is completed through the XMpLant
interface, which supports the bi-directional conversions between the P&IDs and
ISO 15926 XML files.
The XMpLant read interface imports the P&ID files with the SmartSketch API
and obtains the related engineering data from the ORACLE relational database
management system (RDBMS) tables. The ISO 15926 XML files which are
created by the interface conform to the XMpLant schema and store the complete
plant topology. The graphical symbols in the P&ID is preserved in the
ShapeCatalogue.
The XMpLant write interface creates P&ID files from the ISO 15926 files with
the SmartPlant P&ID Automation layer, which generates physical symbols for

42
new P&ID files by matching symbol names in ShapeCatalogue to those in the
SmartPlant P&ID library, and generates physical connections based on ‘PipeRuns’
and ‘SignalRuns’ properties. Identified tags are also added to the corresponding
symbols by mapping the attributes shown in the XML files (Adrian, 2008).
Figure 26: Relationships between P&ID files and ISO 15926 files in
SmartPlant P&ID (Adrian, 2008)

43
EXPERIMENTAL PART
5 AIM OF THE EXPERIMENTAL PART
Some of the FDD methods, e.g., process history-based and qualitative model-
based methods, can generate spurious solutions for the root disturbance. Such a
problem can be alleviated when process topology information is considered
(Thomhii, 2006).
The process topology information such as the connections between process items
can be recognized from a process drawing, for instance, a P&ID drawing (Di
Geronimo Gil, 2011). However, this type of drawing is usually designed for
construction, and it is complicated and contains a large amount of information
unrelated to the FDD research, which only requires the cause-effect relationships
between process components without their geometric shape and size. This
provides the motivation of the experimental part. That is, developing topology-
based causal models which express process schematics in a brief way.
The topology-based causal model can be typically represented as a digraph, which
uses nodes and directional arcs to represent the positional information about
process items and their connections. The connectivity matrix, the other form of
the causal model, is a matrix which represents the relationships between
components with binary numbers. An element in the matrix is ‘1’ if the process
component represented by the row header connects to another represented by the
column header; otherwise, the value of the element is ‘0’.
The experimental part explains the development of these two causal models based
on a drawing application, AutoCAD P&ID and a programming language,
MATLAB OOP. This part starts by describing the tools and methods used to
generate process topology-based causal models. Then, a case of the drying section
of a board machine is introduced to clarify how the proposed methods are applied

44
to a practical scenario, and the detailed implementation of the methods is also
presented. The experimental part concludes with presenting the experimental
results of the proposed case.

45
6 DEVELOPMENT OF THE PROCESS
TOPOLOGY-BASED CAUSAL MODELS
The process topology-based causal model refers to a brief representation of the
connections between the process items as shown in a process schematic, such as a
P&ID drawing. It is manifested in the form of causal digraphs or connectivity
matrices. The topology-based causal model plays an accessorial role in the FDD
research since it expresses the relationships of the process components in a brief
and readable way, thus assisting the conventional FDD methods to precisely
locate the most probable root cause (Benabbas, 2009). This chapter describes the
thorough procedures to develop the topology-based causal model with the
AutoCAD P&ID and the MATLAB OOP. A case study of the drying section of a
board machine is further used to specify the application of the proposed method.
6.1 Tools and Methods Used to Generate Process Topology-
based Causal Models
The topology-based causal models are generated through a procedure consisting
of three steps, as indicated in Figure 27. The first step is completed by the P&ID
drawing software, and the causal models are further developed with the Object –
Oriented Programming (OOP) which is performed in the second and the third
steps.
Figure 27: Schematic of generating topology-based causal models
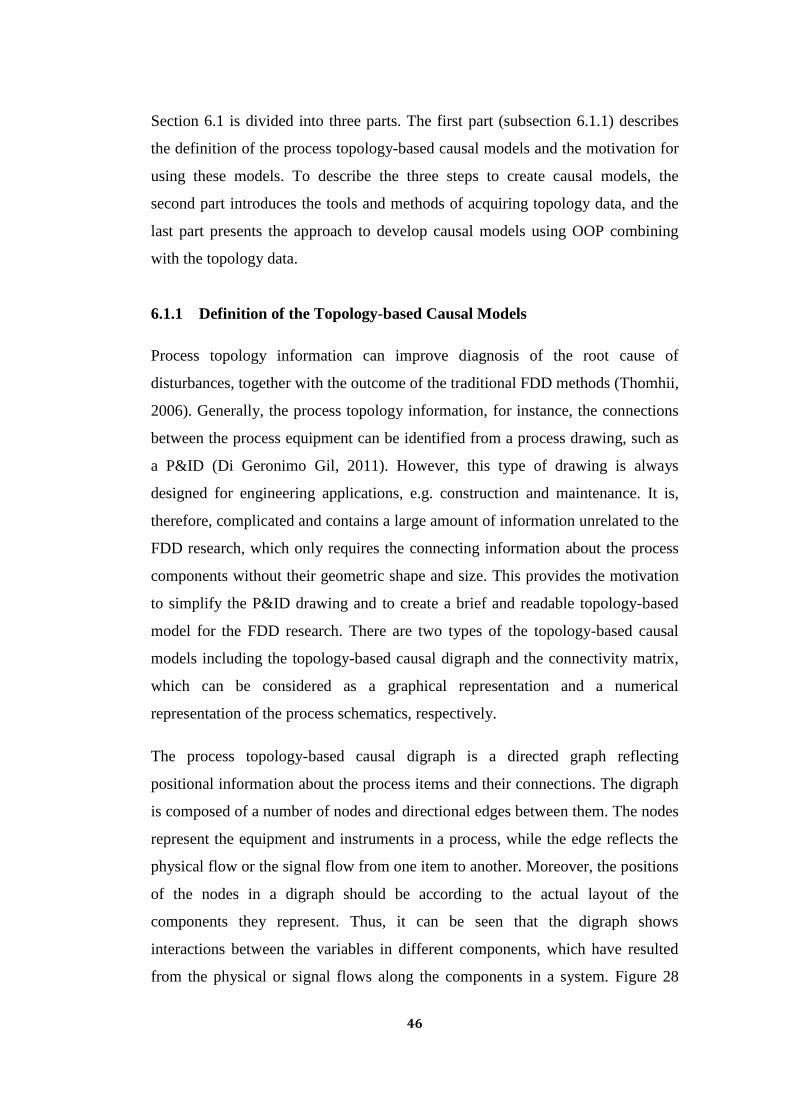
46
Section 6.1 is divided into three parts. The first part (subsection 6.1.1) describes
the definition of the process topology-based causal models and the motivation for
using these models. To describe the three steps to create causal models, the
second part introduces the tools and methods of acquiring topology data, and the
last part presents the approach to develop causal models using OOP combining
with the topology data.
6.1.1 Definition of the Topology-based Causal Models
Process topology information can improve diagnosis of the root cause of
disturbances, together with the outcome of the traditional FDD methods (Thomhii,
2006). Generally, the process topology information, for instance, the connections
between the process equipment can be identified from a process drawing, such as
a P&ID (Di Geronimo Gil, 2011). However, this type of drawing is always
designed for engineering applications, e.g. construction and maintenance. It is,
therefore, complicated and contains a large amount of information unrelated to the
FDD research, which only requires the connecting information about the process
components without their geometric shape and size. This provides the motivation
to simplify the P&ID drawing and to create a brief and readable topology-based
model for the FDD research. There are two types of the topology-based causal
models including the topology-based causal digraph and the connectivity matrix,
which can be considered as a graphical representation and a numerical
representation of the process schematics, respectively.
The process topology-based causal digraph is a directed graph reflecting
positional information about the process items and their connections. The digraph
is composed of a number of nodes and directional edges between them. The nodes
represent the equipment and instruments in a process, while the edge reflects the
physical flow or the signal flow from one item to another. Moreover, the positions
of the nodes in a digraph should be according to the actual layout of the
components they represent. Thus, it can be seen that the digraph shows
interactions between the variables in different components, which have resulted
from the physical or signal flows along the components in a system. Figure 28

47
displays a P&ID case of the level control loop of a tank and its causal digraph. As
shown in the picture, the digraph only saves the relationship resulting from the
physical and signal flows between different components, while ignoring the
irrelevant information, such as the specific geometrical shapes of process items.
Figure 28: Comparison between a P&ID drawing and its causal digraph
Similar to the digraph, the connectivity matrix indicates the relationship in the
form of the binary matrix with N-dimension, where N is the number of the
elements. The row and column headers separately represent the start and ending
points of each edge. Elements in the matrix can be either ‘1’ or ‘0’ according to
the existence of a directional connection from the row header to the column
header, which represents a specific process component (Benabbas, 2009). Table 3
reveals the connectivity matrix of the example above. The directional connections
can be obviously identified through binary numbers. For instance, the 1 in the
intersection of the second row and third column means there is a signal flow from
the tank to the level controller (LC).
Table 3: An example of the connectivity matrix
Tank LC LV
Tank 0 1 1
LC 0 0 1
LV 0 0 0

48
6.1.2 Methods for Capturing Topology Information from the AutoCAD
P&ID
As essential information for generating causal models, topology data is a standard
semantic expression of the process schematic in the XML or XLS/XLSX format.
This type of data depicts the properties of the process items and the relationship
between them. Specifically, as shown in Figure 29, the topology data used in
causal models can be divided into three aspects: the name of the process items, the
coordinates of the process items, and the connections between them. The topology
data improves the exchange of the graphical information among different systems
and allows the drawing to be conveniently reused by downstream engineering and
design activities, therefore extends the application scope of the original P&IDs.
Figure 29: Classification of the topology data
Topology data is derived from the electronic P&ID which is drawn by the
specialized P&ID drafting applications. These type of software can not only
perform the normal P&ID drawing, but also possesses the database which stores
and manages the topology data. The most popular CAD programs used in P&ID
drawings include AutoCAD P&ID, Intergraph SmartPlant P&ID, AVEVA P&ID,
and COMOS P&ID, etc. Topology data exported from the AutoCAD P&ID is in
the format of XLS/XLSX, while the other software mainly supports the schematic
information defined by the ISO 15926-compliant XML scheme.
The AutoCAD P&ID is used as an example to explicate the method for extracting
topology data as it is the primary tool applied in the experimental part. The

49
generation of the topology data is performed in two steps: design a P&ID drawing,
and then extract topology data from the P&ID drawing.
6.1.2.1 Design a P&ID Drawing
The alteration of the topology data always depends on the modification of the
schematic drawing since the AutoCAD P&ID provides abundant process
component and line symbols, each of which comprises data linking to the Data
Manager from which the topology data is extracted. Thus, the most important
steps of designing a P&ID drawing are placing, tagging, and connecting process
components, which correspond to the three aspects of the topology data
respectively. Figure 30 shows the correspondence between the three phases of
drawing a P&ID and the matching topology data they affect.
Figure 30:Procedures of designing a P&ID drawing
The first step of designing a P&ID drawing is to add components to a blank P&ID
template. The P&ID components in the P&ID tool palette include
equipment (such as, pumps and tanks), instruments (such as, control valves and
instrument bubbles), and inline components (such as valves). The position of the
component is automatically determined when it is chosen in the P&ID tool palette
and placed in a specific drawing area. The location of each component is specified
and stored as absolute cartesian coordinates which identify the distance of an item
from the point of origin.
After the components are placed on a drawing, tags are then assigned to these
items by entering the required data in the Assign Tag dialog box. The tag is an

50
identifier which uniquely distinguishes components or lines in a project. Tag
formats can be self-defined by combining different properties such as area
property, type property, and number.
The last step is to add pipe lines and signal lines between all the components that
need to be connected. A significant aspect of the topology data are the physical
connections, in which the physical material or signals flow between different
components. Different from the AutoCAD lines, the P&ID schematic lines
include additional data, e.g. the moving path and direction of gas, liquid or signal
flow along the process, in addition to the physical connecting information. Hence,
the schematic lines imply the internal connections between the components.
The schematic lines are put on the basis of whether there is an internal connection
such as material or signal flow between the components. In other words, a new
directional line is added whenever there is a material or signal flow between two
items. The arrow at the end of each line indicates the flow direction. Whenever a
line segment is built in the P&ID drawing, the tags of start and end components of
the line are synchronously created and stored in the Data Manager. Similarly, as
the line segments are moved or connected components are changed, the ‘To’ and
‘From’ information of this line is correspondingly updated.
6.1.2.2 Extract Topology Data from the P&ID Drawing
One of the most important features of the AutoCAD P&ID is that it can
intelligently manage the drawing data by the Data Manager module, which is used
to store, view, edit, and manipulate data for P&ID objects in a drawing (P&ID,
2013).
The data extracted from the Data Manager for generating the causal models
involves the tags of the initial component and the terminal component of every
line segment. Such information is stored as ‘From’ and ‘To’ properties in the Line
Segments Report which lists the data of the entire lines in the drawing. The Line
Segments Report can be reconfigured by reserving the required properties, such as

51
‘From’ and ‘To’ properties, and removing the extra ones based on the default
report template, which contains several properties relevant to the line segments.
The Line Segments Report involving the start and terminal points of each line is
then exported in the form of the Microsoft Excel spreadsheet (XLS/XLSX).
Furthermore, this file is handled by the MATLAB programs to generate the
topology information about the connections between process components
In contrast to the connecting information directly acquired from the Data Manager
of the AutoCAD P&ID, the names and position data are attained by entering a
self-defined command in the command window. The command is developed by
using C# programs to manipulate the database of drawing files through the
AutoCAD .NET application programming interface (API), which is a collection of
the DLL (Dynamic-link library) files that comprise a variety of classes. With
these classes, the database in an AutoCAD drawing file can be accessed.
The database object invoked by the AutoCAD .NET API includes both graphical
and non-graphical information related to a P&ID drawing. Figure 31 illustrates the
structure of the Database object. Typically, as an important part of the database,
BlockTables includes two types of the BlockTableRecords, namely ‘Paper_Space’
and ‘Model_Space’, where all graphical entities (lines and components) are stored.
Figure 31: Hierarchical structure of the Database object

52
The names and coordinates of the P&ID components are captured with a self-
defined command, which is developed based on an iteration statement traversing
all entities recorded in the ‘Model_Space’. The name and coordinate of an entity
are read and saved in a user-defined XML template if it is identified as an ‘asset’
(process component) instead of ‘lineSegment’. It should be noted that the
structure of the XML template can be defined as any schema, for instance,
XMpLant. In this way, the AutoCAD P&ID will support the files exported in the
multiple XML schemas, thus enhancing the data exchange of the software.
Eventually, the XML report containing the names and coordinates of all
components are exported from the AutoCAD P&ID by quoting the defined
command. This data is further captured by the MATLAB program and converted
into the topology information about ‘names of process components’ and
‘coordinates of process components’.
6.1.3 Methods for Generating Causal Models with the MATLAB OOP
The generation of causal models is performed by the MATLAB OOP, which
considers the task as a class and defines the variables about the topology data as
static characteristics (called Properties) and the steps of developing causal models
as dynamic characteristics (called Methods). After this, the causal models are
obtained when the specific values are assigned to the Properties and a series of
Methods are invoked and implemented. This section introduces the concepts of
the MATLAB OOP and its applications in the development of causal models
combining with the topology data.
6.1.3.1 Introduction to the MATLAB OOP
Object-oriented programming, as its name implies, is a programming paradigm
which is based on objects. Different from traditional procedural programming
languages, such as C and Pascal, with top-to-down structures, the object-oriented
programming is organized in the form of several blocks shown as individual
objects. Since the late 1960s, when the first object-oriented programming

53
language Simula was published, a large number of languages based on OOP have
been launched and been extensively applied.
MATLAB has started to support OOP since the version R2008a when MATLAB
introduced a new syntax for defining classes (MathWorks, 2012). Similar to the
common OOP languages, MATLAB possesses the typical patterns of OOP,
including class, object, property, and method. It also possesses basic
characteristics of OOP, such as inheritance, encapsulation, and Polymorphism.
The basic idea of object-oriented programming originates from problem
decomposition (Urban, 2012). Figure 32 indicates the procedures for solving a
problem with MATLAB OOP. The solution is always implemented with three
phases: classification of a problem, definition of a class, and instantiation of the
class. These three steps can also be treated as a process: 1) from concrete to 2)
abstract, and finally to 3) concrete.
Typically, one problem tends to be classified into several groups, each of which
has several objects with common characteristics. Furthermore, a group of objects
is generalized to a class. As the structure of objects, the class describes these
common features named properties and methods, also known as static data
member descriptions and dynamic behaviors separately. Properties expressed by
variables reflect which states the objects maintain, while methods shown as a set
of functions clarify which behaviors can be performed to the objects. Classes are
further instantiated to the objects by assigning specific values to the properties.
The problem is finally solved by invoking different methods to access and
manipulate the objects.

54
Figure 32:Scheme of MATLAB OOP. Step 1: classification of a problem
(concrete). Step 2: definition of a class (abstract). Step 3: instantiation of the
class (concrete).
MATLAB OOP has several merits over conventional procedural programming.
Firstly, OOP can be treated as a precise classification of procedural codes; that is,
object-oriented codes encapsulate data and behaviors in individual objects that
interact with each other through the object's interface. Such an encapsulation, on
the one hand, optimizes the structure of codes and makes them more convenient to
be used. Objects afford interfaces that hide implementation details. Codes
therefore can be easily implemented by invoking methods without knowing the
internal states. On the other hand, it allows an object to be modified independently
without affecting others. Moreover, the information hiding can ensure the security
of codes and avoid the malicious access. Secondly, OOP is good at managing the
data transmission between functions. Hence, it is suitable for the cases which
contain a large number of functions. Furthermore, codes for each responsibility
are packed into individual functions which can be conveniently organized and
called according to requirements. Lastly, inheritance allows the class to be easily
extended without redundant coding. Due to these advantages, OOP has more
advantages when developing complicated and large-scale applications.

55
6.1.3.2 Procedures for Generating Causal Models with the MATLAB OOP
The approach to develop casual models is established according to the procedures
shown in Figure 32. The target of the task is to generate causal models including
the connectivity matrix and the causal digraph. Since both of the causal models
can be obtained based on the same kinds of topology data shown in Figure 29,
generations of the two models are classified into one group. Hence, only one
object, i.e. generation of causal models, is considered in this case.
The second step focuses on the establishment of a class which defines the basic
factors (properties) and manners (methods) required to solve a problem.
Specifically, static and dynamic characteristics of the object are explored and
generalized to a class. In this case, the variables individually representing the
three types of topology data are defined as static features (properties), since the
causal models are derived from these data.
The methods, known as dynamic characteristics of the class, define three kinds of
functions to develop the causal models. The first type of functions named
property functions is used to obtain the specific values of three variables defined
in the properties. These functions describe the detailed process to generate the
properties which are the return values, whereas the arguments of such functions
are the original drawing data from P&ID tools.
The second type of functions aims to create causal models. They present the
procedures to achieve the connectivity matrix and the causal digraph, respectively.
These functions are implemented with the inputs of property values returned from
property functions.
The last type of functions, namely operational functions, is defined for modifying
generated causal models to satisfy the research requirements. These functions
simulate what actually happens when modifying the process topology by
increasing or decreasing connections, increasing or decreasing nodes to causal
models. Such functions act based on modifications to the three properties of the

56
class. The causal models then vary with the alteration of properties since both
matrix and digraph functions are constructed in terms of these properties. Figure
33 shows the relationship between the three functions and clarifies the realization
process of the methods.
Figure 33: The implementation flow of the methods for generating causal models
Finally, in Step 3, the class is instantiated to the specific object by assigning
values to the properties. This process is implemented by calling property functions
which use the drawing data from the P&ID tool as arguments. Furthermore, the
connectivity matrix and digraph are obtained by invoking corresponding functions.
The established models can be also readily adjusted by calling the operational
functions according to requirements.
6.2 Case Study for the Drying Section of a Board Machine
This section aims at describing how the methodology for generating topology-
based causal models proposed in Section 6.1 is applied in the practice, and
presenting the detailed implementation for the methods. The drying section of a
board machine is used as the case study. This section first describes the process
of the drying section after giving a brief introduction to the production process of
the whole board machine. The following parts specify the thorough procedures of
generating the causal models for the drying section, which include extracting
drawing data from the AutoCAD P&ID and developing causal models with

57
MATLAB OOP. Section 6.2 concludes with the exhibition and analysis of the
results.
6.2.1 Description of the Drying Section of the Board Machine 4
This part describes the process structure of the drying section of the board
machine 4 (BM4). In order to generate causal models, a P&ID drawing of the
drying section is used as the case. As the facility of Stora Enso Imatra Mills, the
BM4 produces three-layer liquid packaging boards. As shown in Figure 34, the
production process comprises a sequence of five sections: (1) three short
circulation sections, (2) a wire section, (3) a press section, (4) a drying section,
and (5) a calendering and reeling section (Kuuluvainen, 2012).
Figure 34: BM4 production flow (Kuuluvainen, 2012)
The boards are produced from the raw materials to the final end products by the
following steps. Firstly, the stock from the machine chest is diluted, cleaned and
further mixed with additives in the short circulations sections (1). Furthermore,
the flow without debris and dirt is delivered to the headbox where the stock is
evenly spread on the wire. In the wire section (2), the water in the stock is dried
through the wire while the fibers and other solid materials remain to form the web.
The webs from three layers are in combination with chemical bonds at the end so
2
. 1
.
3
.
4
.
5
.

58
as to form the final three-layer board. Then, in the press section (3), the water is
removed from the web with the help of mechanical pressure. Moreover, a balance
press is used to adjust the thickness and the surface properties of the board. Next,
the moisture of the board is precisely controlled by the evaporation process in the
drying section (4). The process of production is ended in the calendering and
reeling section (5), which adjusts the thickness of the board and rolls it into reels
for next procedures, such as winding and coating.
The case study focuses on the drying section which is in charge of controlling the
moisture of the board. The drying section can be divided into six similar parts,
shown in Figure 35. Each part consists of a condensate tank and a steam group
(SG) comprising a series of drying cylinders. The steam is fed into the cylinders
and releases its heat through the tube wall to evaporate the water of the board web.
The mixture of condensate and steam is then collected into the condensate tank
where they are separated. Steam is transported back for reuse, while the
condensates are collected and delivered to the power plant.
Figure 35: Steam groups of the drying section of BM4
Each part of the drying section performs the similar control schemes which
include three control systems. As shown in Figure 36, there are three control loops
with their own controllers, namely steam pressure controller (PC), pressure
difference controller (PDC), and level controller (LC), which are responsible for

59
controlling the steam pressure, the steam pressure difference, and the level of
condensate tank separately.
PC
PDC
LC
10 bar steam
5 bar steam
Condensate
tank
Figure 36: Control scheme of the single part: steam pressure controller (PC),
pressure difference controller (PDC), and level controller (LC)
Specifically, the steam source provides the steam groups with 5-bar and 10-bar
headers. The pressure controller adjusts two control valves connected to the two
headers to obtain the required steam pressure. That is, only one valve is applied
when the pressure demand is low, otherwise both valves are opened. The setpoints
of SGs 1 to 4 are set by operators while the SG 8 gains the setpoint from the
quality control system (QCS) in the top control level. SG 7 achieves the steam
control with the target proportional to the SG 8.
The steam pressure difference between the steam and condensate headers should
be maintained within a reasonable range. Therefore, the controller must present a
moderate output, which guarantees the pressure difference both in order to ensure
that the steam is fully condensated in the cylinder and the condensate is
discharged from the cylinder. This control is accomplished by regulating two

60
control valves in the steam exit of the condensate tank. Only one valve works
when lower pressure difference is required and vice versa.
For each steam group, there is a condensate tank installed below the cylinder to
collect the condensate. The level of the condensate tank is adjusted by the outlet
valve which acts according to the signal from the level controller.
6.2.2 Acquisition of Topology Data for the Drying Section of the BM4
Since the drying section comprises six parts with similar structures, one single
part is therefore used as the case to describe the process of extracting topology
data. The described method can be generalized to the whole drying section.
According to the methods proposed in Section 6.1.2, the topology data is
generated starting at drawing a P&ID drawing. Firstly, a project named ‘drying
section’ is configured with the Project Setup wizard where the ISO-based P&ID
symbology standard is chosen. Additionally, the tag formats of the components
including Equipment, Valves, and Instrumentation are defined as ‘Type-Number’.
‘Type’ reflects the class of the component while ‘Number’ distinguishes the
components in the same class from each other.
Figure 37: Tag format setup
Once the project is set up, a new drawing namely ‘the third part’ is built based on
the existing AutoCAD drawing which does not include data information. There
are two ways for formulating a P&ID drawing from an AutoCAD schema. The

61
first one is to import the AutoCAD drawing as an external reference, which is the
template for designing a new P&ID drawing. Attached references are a link of the
external drawing instead of the actual one, thus disassociating them from the
present project. The other is to convert blocks or groups in the AutoCAD one by
one to the specific P&ID components or lines; for instance, a group of the
AutoCAD lines can be converted to a single component of the ‘tank’ class. The
converted objects possess the same characters as the AutoCAD P&ID components
and they are also referenced in the Data Manager.
In order to shorten the drawing period, the first method is employed. The
AutoCAD drawing with the DWG format is attached to the current blank drawing
as a reference, which is placed under the current layer. The visibility of the
referenced layer is adjusted to an appropriate level in order that the external
drawing can be well referred while not interfering with the ongoing drawing.
The third part of the drying section consists of three types of components such as
valves, tanks, and instruments, which are selected from the P&ID tool palette and
placed in the drawing area where their counterparts are located in the reference.
When all the components are placed in the drawing, tag information is then
entered for each item in the Assign Tag dialog box based on the format set up in
the project configuration.
Finally, the pipe and signal schematic lines are added between components
referring to the physical connections shown in the AutoCAD reference. However,
different from the AutoCAD lines which reflects the physical connections, the
P&ID schematic lines also need to depict the internal flows. Therefore, a new
directional line is added whenever there is a material or signal flow between two
items. Figure 38 shows the P&ID drawing of the third part of the drying section
finished in the AutoCAD P&ID environment. Blue and red connections represent
the pipe and signal lines, respectively.

62
Figure 38: P&ID drawing of the third part of the drying section
Once the P&ID drawing is finished, the reports with drawing information are
synchronously generated in the Data Manager. The most important reports needed
to export are the reports of the Line Segments which include the required
topology data. The structure of the reports is first configured before they are
exported. In the Report Setting pane, the properties ‘From’ and ’to’ of the Line
Segments are selected as the items of the reports. Subsequently, the Line reports
in the self-defined form can be queried in the Data Manager which classifies the
reports into the Pipe Line Segments and Signal Line Segments, as shown in
Figure 39 and Figure 40, respectively.

63
Figure 39: Report of Pipe Line Segments
Figure 40: Report of Signal Line Segments
The reports of the Line segments are then exported to the Microsoft Excel
spreadsheets with the names 'the third part-Pipe Line Segments.xls' and 'the third
part-Signal Line Segments.xls'. These Excel files include all the columns and
rows displayed in the Data Manager.
The name and coordinate information of the components is acquired with an
AutoCAD command which is developed using C# programs to access the
database of the drawing file through the API. In fact, this command can be
considered as a self-defined method defined by the C#.

64
The process of building the command method begins with assigning a name
‘GetComponents’ to the method under which a series of procedures applied to
capture the components’ data are created. More specifically, the database of the
current drawing is first obtained by the database property of the document object.
Furthermore, before the entities are accessed, the ‘TransactionManager’ property
of the current database is quoted to start a transaction which can integrate multiple
operations on several objects into a single operation (AutoCAD, 2011). After this,
the BlockTableRecord ‘Model_Space’ is opened with the ‘GetObject’ method.
The ‘GetEnumerator’ and ‘MoveNext’ methods are then applied to navigate the
‘Model_Space’ from line to line distinguishing the ‘Components’ entities from the
‘Linesegments’ entities. For each identified component, the ‘Position’ and
‘TagValue’ properties are captured and inserted into a textual template with the
self-defined XML schema, which is expressed as ‘<coordinate=’ Position’
tagname=’ TagValue ‘/>’.
Finally, the XML report including coordinates and names of all components is
generated when entering the ‘GetComponents’ command in the command
window of the AutoCAD P&ID.
6.2.3 Generation of Causal Models for the Drying Section of the BM4
In the light of the methodology specified in Section 6.1.3.2, the causal models of
the drying section are developed in three phases: (1) classification of the problem,
(2) definition of a class, and (3) instantiation of the class.
6.2.3.1 Phase 1: Classification of the Problem
In the first phase, the problem is classified. The problem contains two tasks:
creating the connectivity matrix and the causal digraph. These two models possess
the common characters since both of them are obtained from the same topology
data. Moreover, a relationship exists between the two models since the digraph is
built based on the matrix. Thus, the two tasks can be consolidated into one group

65
which is treated as an object named ‘Generation of causal models for the drying
section’.
6.2.3.2 Phase 2: Definition of a Class
In the second phase, i.e., the definition of a class, a class with the name
‘generation of causal models’ is constructed, and it extracts the features of the
object confirmed in the first phase. The static characteristics (properties)
including the names of components, the coordinates of components and
directional connections between them are defined as three array variables, namely
‘cmNames’, ‘cmPos’, and ‘cmLines’. The default values of all properties remain
empty and they will be assigned by calling the functions in the methods block.
In the methods block, eight functions are defined which can be classified into
three types. The 'getLines' function and 'getPositions' function define the
algorithms to gain the property values. More specifically, the 'getLines' function
respectively reads the Excel files of the pipe line and signal line segments and
extracts the start and end points of all connections, which are further stored as an
array in the property ‘cmLines’. Similarly, the 'getPositions' function reads the
XML file of the coordinates and captures the implicit topology data such as names
and coordinates of all components and reserves them into ‘cmNames’ and ‘cmPos’
properties separately.
The most critical tasks, the creation of the connectivity matrix and causal digraph,
are conducted by the 'getMatrix' function and the ‘digraph’ function. The
'getMatrix' function first defines the initial state for the connectivity matrix state
as a null matrix with N-dimension, N is the number of components. The row and
column headers of the matrix are the component names from the ‘cmNames’
property. The value of the entry where a column and a row intersects is set to ‘1’,
when the process component represented by the header of the row directly
connects to that represented by the column header. The position of the intersection
is determined by matching each row in the ‘cmLines’ property with the row and
column headers of the connectivity matrix. That is, the row number of the cross

66
cell is determined when a ‘From’ point in the ‘cmLines’ property matches a
certain element in the row header of the connectivity matrix, and the same way is
applied for confirming the column number. Figure 41 shows the realization of the
proposed method using three connected components as a case. The connection
from ‘PV-1652.2’ to ‘steam group-003’ is identified by ‘1’ value in the
intersection of the second row and the third column, since the components in the
second row of the ‘cmLines’ property are in accordance with the headers of the
second row and the third column of the connectivity matrix, respectively.
Figure 41: Scheme for generating the connectivity matrix
The ‘digraph’ function drafts the digraph based on the ‘cmPos’ property,
‘cmNames’ property, and the established connectivity matrix. A set of nodes
representing all components are drawn in the plane using their coordinates
information from the ‘cmPos’ property as the center of circles. The radius of the
nodes can be self-defined. Meanwhile, the components’ names from ‘cmNames’
property are also marked on these nodes. Furthermore, the directional edges
between nodes are determined by the link information from the connectivity
matrix. That is, a ‘for loop’ is executed to traverse every entry of the connectivity
matrix and a connecting line with an arrow is drawn when the ‘1’ value is
detected.
The directional edge between two nodes can be developed with three steps. Firstly,

67
the start and end points of the edge (shown as B and C in Figure 42) are
confirmed from the intersections of the connecting line of two circle centers
(shown as A and D in Figure 42) and the circumferences of the circles. From the
geometrical relationship shown in Figure 42, the coordinates of the two terminal
points (B and C) are determined by the positions of two circle centers (the ‘cmPos’
property of the nodes), the included angle Q between the edge and the horizontal
line, and the radius of the nodes. As shown in Eq. (1), the angle Q is derived from
the coordinates of the circle centers. Eq. (2) to Eq. (5) present the generation of
the angle coordinates of the start point (XB , YB) and the end point (XC , YC),
which are further saved in the X and Y arrays.
𝑄 = arctan(𝑌𝐷 − 𝑌𝐴𝑋𝐷 − 𝑋𝐴
) (1)
𝑋𝐵 = 𝑋𝐴 + 𝑟 × cos(𝑄) (2)
𝑌𝐵 = 𝑌𝐴 + 𝑟 × sin(𝑄) (3)
𝑋𝐶 = 𝑋𝐷 + 𝑟 × cos(𝑄 + 𝜋) (4)
𝑌𝐶 = 𝑌𝐷 + 𝑟 × sin(𝑄 + 𝜋) (5)
Figure 42: Generation of the edge between two nodes
Secondly, the arrowhead is constructed on the premise that the terminal points (M
and N) are settled according to the positional relationship between the arrowhead

68
and the connecting line. Specifically, the coordinates of M and N are computed
based on the angle Q, the coordinate of point C, the length of the arrowhead line
MC and NC, and the included angle P. Eq. (6)-(9) show the calculation of the
coordinates of arrowhead points M (XM, YM) and N (XN, YN), which are stored
in the Xa and Ya arrays. The length of MC and the angle P are self-defined.
𝑋𝑀 = 𝑋𝐶 + 𝐿 × 𝑐𝑜𝑠(𝑄 − 𝑃 + 𝜋) (6)
𝑌𝑀 = 𝑌𝐶 + 𝐿 × 𝑠𝑖𝑛(𝑄 − 𝑃 + 𝜋) (7)
𝑋𝑁 = 𝑋𝐶 + 𝐿 × 𝑐𝑜𝑠(𝑄 + 𝑃 + 𝜋) (8)
𝑌𝑁 = 𝑌𝐶 + 𝐿 × 𝑠𝑖𝑛(𝑄 + 𝑃 + 𝜋) (9)
Finally, the ‘Line’ command is executed to connect the four end points B, C, M,
and N, whose coordinates have been confirmed in the second step, to three
intersectant lines, BC, MC, and NC, which constitute the directional edge
connecting the two nodes.
The generated models are usually required to be modified to satisfy the research
requirements. Four operational functions are therefore defined which can perform
the ‘addline’, ‘removeline’, ‘addnode’, and ‘removenode’ operations to the
created causal models. The ‘addline’ and ‘removeline’ functions create and
remove a connection between any two given nodes by adding and removing a
connecting record to and from the ‘cmLines’ property, respectively. Similarly, the
function ‘addnode’ adds a new node to models by increasing the name and
position data to the ‘cmNames’ and ‘cmPos’ properties, separately. The function
‘removenode’, however, removes the given node and the lines connected with it
from models by deleting the node’s name and coordinate information from the
‘cmNames’ and ‘cmPos’ properties, respectively. The causal models then change
along with the properties as both matrix and digraph functions are constructed in
terms of these properties.
6.2.3.3 Phase 3: Instantiation for the Created Class
In the third phase of the causal model development, the program of class
69
instantiation is compiled after the ‘generation of causal models’ class is
established, and the topology information about the drying section is thereby
imported into the defined class, which is instantiated to the specific ‘drying
section’ object. The instantiation is started with assigning the object name
‘Drying section’ to the abstract class, and then the two Excel files namely 'drying
section-Pipe Line Segments.xls' and 'drying section-Signal Line Segments.xls' are
introduced into the ‘getLines’ function, which provides the specific value to the
‘cmLines’ property of the object. Next, the XML file 'coordinate.html' is
imported into the ‘getPosition’ function in order to acquire the exact value of the
‘cmNames’ and ‘cmPos’ properties of the ‘drying section’ object. Furthermore,
the connectivity matrix and digraph can be gained by typing ‘getMatrix’ and
‘digraph’ functions respectively in the command window. The established models
can also be modified by calling the four operational functions to satisfy the actual
requirements.
6.2.4 Results
This section uses the third part of the drying section as a case, which was applied
in Section 6.2.2, to present the results of the experimental part due to the
limitation of the textual space. The causal digraph of the whole drying section can
be found in the appendix D.
After running the program of class instantiation, the causal models are displayed
when the corresponding functions are entered in the command window. The
connectivity matrix indicated in Table 4 appears when the ‘getMatrix’ function is
implemented, and it presents the topology connections of the P&ID drawing in
Figure 38 in a binary format. The 9- dimensional matrix indicates the relationship
of all the nine components shown in the P&ID drawing through the binary
numbers. The entry with the value ‘1’ denotes that a directional edge exists from
its row header to its column header. Hence, there are in total of 15 entries which
take ‘1’ values and they are consistent with the number of connecting lines in the
P&ID shown in Figure 38.

70
Table 4: Connectivity matrix of the third part of the drying section
PV
-165
2.2
PV
-165
2.1
Ste
am
gro
up
-003
PC
-165
2
PC
-671
PV
-671
.2
Co
nd
ensa
te
tan
k-0
04
LC
-653
LV
-653
PV-1652.2 0 0 1 1 1 0 0 0 0
PV-1652.1 0 0 1 1 1 0 0 0 0
Steam
group-003 0 0 0 0 1 0 1 0 0
PC-1652 1 1 0 0 0 0 0 0 0
PC-671 0 0 0 0 0 1 0 0 0
PV-671.2 0 0 0 0 0 0 0 0 0
Condensate
tank-004 0 0 0 0 0 1 0 1 1
LC-653 0 0 0 0 0 0 0 0 1
LV-653 0 0 0 0 0 0 0 0 0
The causal digraph shown in Figure 43 is obtained when the ‘digraph’ function is
applied. It is clear that the nodes in the graph are arranged at the same positions as
the process components in the P&ID shown in Figure 38. Meanwhile, the edges
marked in the digraph clearly present the physical linkages between nodes, which
are in accordance with the topology information about the original P&ID drawing.
However, the digraph manifests the internal relationship between different
components caused by material flows and signal flows in a clearer way, as it only
reserves the information of relative locations and connections without showing the
geometrical shape of components. Therefore, this kind of model can play an
important role in the research associated with the fault tracking and diagnosis.

71
Figure 43: Causal digraph of the third part of the drying section
Operational functions can be invoked to flexibly modify the causal models so as
to imitate the adjustment occurred in the actual process. Figure 44 presents how
the operational functions are utilized to modify the causal digraph through a case,
which simulates a series of changes to the process connections where a new valve
is added between the steam group and the condensate tank, and the valve ‘PV-
1652.1’ is removed from the process. The first step uses the function
‘steamgroup.removeline ('Steam group-003','Condensate tank-004')’ to remove
the connection between the steam group and the condensate tank. The second
phase applies the function ‘steamgroup.addnode ('PV-671.1',529,120)’ to add a
new node called ‘PV-671.1’ at the given coordinate (529,120). The steam group
and the condensate tank are connected to the new component with the functions
‘steamgroup.addline ('Steam group-003','PV-671.1')’ and ‘steamgroup.addline
('PV-671.1','Condensate tank-004')’. Finally, the function
‘steamgroup.deletenode('PV-1652.1')’ is used to remove the node ‘PV-1652.1’
and the connecting lines associated with it. The results reveal the right changes of

72
the digraph following the expectant requests so as to verify the effectiveness of
the operational functions proposed in Section 6.2.3.
Figure 44: Modifications to the generated digraph. Step 1: remove the
connecting line between ‘Steam group-003’and ‘Condensate tank-004’. Step 2:
add the valve ‘PV-671.1’ between ‘Steam group-003’and ‘Condensate tank-
004’. Step 3: add connecting lines between ‘Steam group-003’and ‘PV-
671.1’and‘Condensate tank-004’. Step 4: remove the node ‘PV-1652.1’.

73
7 CONCLUSIONS
This thesis provides an easy and practicable method to generate the causal model
reflecting the relationship of process equipment. The information sources used to
build the model are readily obtained from the intelligent P&ID design tools, and
the proposed algorithm based on the MATLAB OOP has several merits: (1) it
completes a variety of tasks via calling corresponding functions, which is easy to
apply even by those who are not familiar with programming, (2) the definition of
a class provides a template to solve similar problems, i.e., it possesses the feature
of universality. It can be applied in other similar situations without changing the
codes but by defining a new instance to the class. The established models are
extremely meaningful in the study of fault detection and diagnosis.
However, the proposed method still possesses limitations, since it was developed
based on topology data in a specific format, i.e., Excel files extracted from
AutoCAD P&ID. As a popular format for the data exchange, XML has been
employed by increasing P&ID design applications. The proposed approach should
be extended to be capable of handling the XML format in addition to the Excel
files when building the causal models.
In addition, a topology-based model derived from a P&ID shows items of
equipment and the directional connections between them, and it can only be used
as an accessory tool to aid the FDD (Di Geronimo Gil, 2011). It is more valuable
to link information about variables such as temperature, composition, pressure,
and flow rate with connectivity models to enhance the cause-effect representation
of the process. Maurya et.al. (2003) proposed a first principles structural model,
which is derived from mathematical equations of the equipment and shows the
variable relationship within one single equipment item. Thus, another
development of topology-based causal models should concentrate on their
combination with the first principles structural models.

74
REFERENCES
Adrian, L., 2008. SmartPlant P&ID R/W interface. [online]. Noumenon
Consulting Ltd. Bedfordshire, UK. [cited 10.12.2012]. Available in the Internet:
http://www.noumenon.org.uk/UserFiles/XMpLant%20SP%20P&ID%20interface.
Adrian, L., 2009. ISO 15926 P&ID model. [online]. Fiatech. Austin. [cited 22.12.
2012].Available in the Internet: https://www.posccaesar.org/raw-attachment/wiki/
IdsAdiProject/IdsAdiProteusProject/ISO%2015926%20P%26ID%20model.doc
Alabi, D. B., 2010. Automated analysis of control degrees of freedom. Master’s T
hesis. Imperial College London. London. 78p.
AutoCAD, 2011. AutoCAD 2011 Help. [Online] Available at: http://docs.autodes
k.com/ACD/2011/ENU/filesMDG/WS73099cc142f48755-5c83e7b1120018de8c0
-233d.htm [Accessed 18 April 2013].
AVEVA, 2010. AVEVA P&ID 12.1 User Guide. 12th edition. AVEVA Corporati
on. Cambridge, UK. 182p.
B2MML, 2009. Business to Manufacturing Markup Language. [Online] Available
at: http://www.empystudio.com/Mdf/Isa95/B2MML.aspx [Accessed 20 Decembe
r 2012].
Benabbas, L., Thambirajah, J., Bauer, M., & Thornhill, N. F., 2009. Cause-and-eff
ect analysis in chemical processes utilizing XML, plant connectivity and quantitat
ive process history. Computers & Chemical Engineering, 33(2), pp. 503-512.
Bray, T., 1997. Extensible markup language (XML). World Wide Web Journal,
2(4), pp. 27-66.
BSI, 1979-1984. Symbolic representation for process measurement control
functions and instrumentation, BS 1646 part 1-4: 1979-1984, British Standards
Institution, London.

75
Bumble, S., 2000. Computer simulated plant design for waste
minimization/pollution prevention. 1st edition. CRC Press. Florida, US. 208p.
Chiang, L. H., & Braatz, R. D., 2003. Process monitoring using causal map and
multivariate statistics: fault detection and identification. Chemometrics and
intelligent laboratory systems, 65(2), pp. 159-178.
Christopher B., Jennifer D., Merrick M., & Evan L., 2007. PIDStandardStructure.
[Online] Available at: https://controls.engin.umich.edu/wiki/index.php/PIDStanda
rdStructure [Accessed 23 September 2012].
Cook, R., 2010. Interpreting Piping and Instrumentation Diagrams. [Online] Avail
able at: http://chenected.aiche.org/plant-operations/interpreting-piping-and-instru
mentation-diagrams-part-2-of-5/ [Accessed 23 November 2012].
Dev, A., 2013. P&ID , FLOW DIAGRAM, PIPE DRAWING, SYMBOL. [Online]
Available at: http://www.piping-and-instrumentation-diagram.com/[Accessed 26
February 2013].
Di Geronimo Gil, G. J., Alabi, D. B., Iyun, O. E., & Thornhill, N. F., 2011.
Merging process models and plant topology. 4th International Symposium on
Advanced Control of Industrial Processes (ADCONIP), Hangzhou, PRC. May 23-
26, 2011. IEEE. pp.15-21.
DIN, 1993. Graphical Symbols and Identifying Letters for Process Control
Engineering, DIN 19227: 1993, German institute for standardisation, Berlin.
Ding, S. X., 2008. Model-based fault diagnosis techniques: design schemes,
algorithms, and tools. 2nd edition. Springer. Berlin, Germany. 471p.
Fowler, J., 1995. STEP for data management, exchange and sharing. 1st Edition.
Technology Appraisals. Twickenham, UK. 226p.
Gertler, J., 1991. Analytical redundancy methods in fault detection and isolation.
IFAC/IAMCS symposium on safe process, Fairfax, US. 1991. George Mason
University. pp. 9-21.

76
Halley C., Andrew L., Maurice T. & Emily Y., 2009. PIDStandardNotation. [Onli
ne] Available at: https://controls.engin.umich.edu/wiki/index.php/PIDStandardNo
tation[Accessed 18 December 2012].
Himmelblau, D., 1978. Fault detection and diagnosis in chemical and
petrochemical processes. 1st edition. Elsevier. Amsterdam, Holland. 414p.
Huang, Y., Reklaitis, G. V., & Venkat V., 2002. A model-based fault
accommodation system. Industrial & engineering chemistry research , 41(16), pp.
3806-3821.
IEC, 2005. Representation of process control engineering requests in P&IDs and
for data exchange between P&ID tools and PCE-CAE tools, PAS 62424: 2005,
International Electrotechnical Commission, Geneva.
Intergraph, 2007. SmartPlant P&ID User's Guide. 5th edition. Intergraph
Corporation. Alabama. 688p.
Intergraph, 2012. ISO 15926 and Intergraph. [Online] Available at: http://www.int
ergraph.com/ppm/iso15926.aspx [Accessed 5 December 2012].
Iri, M., 1979. An algorithm for diagnosis of system failures in the chemical
process. Computers & Chemical Engineering, 3(1), pp. 489-493.
ISA, 2009. Instrumentation Symbols and Identification, ANSI/ISA-5.1:2009,
International Society of Automation, North Carolina.
Isermann, R., 2011. Fault-Diagnosis Applications. 1st edition. Springer. Berlin,
Germany. 354p.
Isermann, R., 1984. Process Fault Detection Based on Modeling and Estimation
Methods - A Survey. Automatica, 20(4), pp. 387-404.
Jamsa-Jounela, S. L., Tikkala, V. M., Zakharov, A., & Garcia, O. P., 2012.
Outline of a fault diagnosis system for a large-scale board machine. IEEE
International Conference on Control Applications (CCA), Dubrovnik. Oct 3-5,
2012.IEEE. pp. 1633-1639.
77
Jiang, H., Rohit P., & Sirish L. S., 2009. Root cause diagnosis of plant-wide
oscillations using the concept of adjacency matrix. Journal of Process Control,
19(8), pp. 1347-1354.
Kokawa, M., Miyazaki, S., & Shingai, S., 1983. Fault location using digraph and
inverse direction search with application. Automatica, 19(6), pp. 729-735.
Kuuluvainen, 2012. Fault detection and diagnosis toolkit testing for a board
machine. Master’s Thesis. Aalto university. School of Chemical Technology.
Espoo.
Leal, D., 2005. ISO 15926" Life cycle data for process plant": An overview." Oil
& gas science and technology, 60(4), pp. 629-637.
Lee, G., Han, C., & Yoon, E. S., 2004. Multiple-fault diagnosis of the Tennessee
Eastman process based on system decomposition and dynamic PLS. Industrial &
engineering chemistry research, 43(25), pp. 8037-8048.
Lee, G., Song, S. O., & Yoon, E. S., 2003. Multiple-fault diagnosis based on
system decomposition and dynamic PLS. Industrial & engineering chemistry
research, 42(24), pp. 6145-6154.
Leung, D., & Romagnoli, J. , 2002. An integration mechanism for multivariate
knowledge-based fault diagnosis. Journal of Process Control, 12(1), pp. 15-26.
Matt R.,2009. PFD/PID industry example Wiki Page.[online] Available at: https://
controls.engin.umich.edu/wiki/index.php/PFD/PID_industry_example_Wiki_Page
#Process_Flow_Diagrams_vs._Process_and_Instramentation_Diagrams
Maurya, M. R., Rengaswamy, R., & Venkatasubramanian, V., 2003. A systematic
framework for the development and analysis of signed digraphs for chemical
processes. 1. Algorithms and analysis. Industrial & Engineering Chemistry
Research, 42(20), pp. 4789-4810.
Maurya, M. R., Rengaswamy, R., & Venkatasubramanian, V., 2007. A signed
directed graph and qualitative trend analysis-based framework for incipient fault
diagnosis. Chemical Engineering Research and Design, 85(10), pp. 1407-1422.

78
MathWorks, 2012. MATLAB Object-Oriented Programming. 8th edition.
MathWorks Inc. Natick, US. 621p.
Medida, S., 2007. Pocket Guide on Industrial Automation. 1st Edition. IDC
Technologies. Silicon Valley, US. 172p.
Meier, Frederick A., & Meier Clifford A., 2011. Instrumentation and Control
Systems Documentation. 2nd Edition. International Society of Automation. North
Carolina, US. 217p.
Meier, Frederick A. & Meier Clifford A., 2007. P&IDs and Symbols. In:
Instrumentation and Control Systems Documentation. 1st Edition. International
Society of Automation. North Carolina, US. pp. 19-53.
Nasby, G., 2012. Using process flowsheets as communication tools. Chemical En-
gineering Progress. [article]. 2010:10 [cited 15.1.2013]. pp. 36-44. Available in th
e Internet: http://isawwsymposium.com/wp-content/uploads/2012/01/NasbyG_Usi
ng-Process-Flowsheets-As-Communication-Tools_AIChE-CEP_Oct2012.pdf
Noumenon, 2008. Noumenon Homepage. [Online]. Available at:
http://www.noumenon.org.uk/index.php [Accessed 3 December 2012].
P&ID, A., 2013. AutoCAD P&ID Help. [Online]. Available at: http://docs.autode
sk.com/PNID/2013/ENU/ [Accessed 20 April 2013].
PIP, 2012. PROCESS INDUSTRY PRACTICES. [Online]. Available at:
http://www.pip.org/ [Accessed 7 December 2012].
PIP, 2008. Piping and Instrumentation Diagram Documentation Criteria, PIP
PIC001:2008, Process Industry Practices, Austin.
PRNewswire, 2000. ISA, PIP Announce Cross-Licensing Agreement for Piping a
nd Instrumentation Document Criteria. [Online]. Available at: http://www.thefreel
ibrary.com/ISA,+PIP+Announce+Cross-Licensing+Agreement+for+Piping+and...
-a065456165 [Accessed 20 April 2013].

79
SFS, 2004. Graphical symbols for diagrams. Part 6: Measurement and control
functions, ISO 14617: 2004, Finnish Standards Association, Helsinki.
Siemens, 2011. COMOS operating manual, 7th edition. Siemens AG Industry
Sector. Nurnberg, Germany. 288p.
STEP Tools , 2013. STEP iso 10303. [Online]. Available at: http://www.steptools.
com/library/standard/ [Accessed 2 May 2013].
Thambirajah, J., Benabbas, L., Bauer, M., & Thornhill, N. F., 2009. Cause-and-
effect analysis in chemical processes utilizing XML, plant connectivity and
quantitative process history. Computers & Chemical Engineering, 33(2), pp. 503-
512.
Thambirajah, J., Benabbasx, L., Bauer, M., & Thornhill, N. F, 2007. Cause and
Effect Analysis in Chemical Processes Utilizing Plant Connectivity Information.
IEEE Advanced Process Control Applications for Industry Workshop, Vancouver,
US. May 14-16, 2007. IEEE. Vol. 14 pp. 16.
Thomhii, N.F., Yim, S.Y. & Ananthakumar, H. G., 2006. Using the Process
Schematic in Plant-wide Disturbance Analysis. 16th european symposium on
computer aided process engineering and 9th international symposium on process
systems engineering, Garmisch-Partenkirchen, Germany. July 9-13, 2006.
Elsevier. pp. 1431-1436.
Thornhill, N. F., & Horch, A. , 2007. Advances and new directions in plant-wide
disturbance detection and diagnosis. Control Engineering Practice, 15(10), pp.
1196-1206.
Thornhill, N. F., Cox, J. W., & Paulonis, M. A., 2003. Diagnosis of plant-wide
oscillation through data-driven analysis and process understanding. Control
Engineering Practice, 11(12), pp. 1481-1490.
Topping, R. E., 2011. An Introduction to ISO 15926. 1st edition. Fiatech. Austin,
US. 181p.
80
Urban, J., 2012. Interfacing C++ libraries to Matlab. Master’s Thesis.
Masarykova Univerzita Fakulta Informatiky. Brno. 49p.
Venkatasubramanian, V., 2005. Prognostic and diagnostic monitoring of complex
systems for product lifecycle management: Challenges and opportunities.
Computers & chemical engineering, 29(6), pp. 1253-1263.
Venkatasubramanian, V., Rengaswamy, R., Yin, K., & Kavuri, S. N., 2003. A
review of process fault detection and diagnosis Part I: Quantitative model-based
methods. Computers & Chemical Engineering, 27(3), pp. 293-311.
Venkatasubramanian, V., Rengaswamy, R., Yin, K., & Kavuri, S. N., 2003. A
review of process fault detection and diagnosis: Part II: Qualitative models and
search strategies. Computers & Chemical Engineering , 27(3), pp. 313-326.
Venkatasubramanian, V., Rengaswamy, R., Yin, K., & Kavuri, S. N., 2003. A
review of process fault detection and diagnosis: Part III: Process history based
methods. Computers & Chemical Engineering, 27(3), pp. 327-346.
W3C, 2013. W3C Recommendation. [Online] Available at:
http://www.w3.org/TR/REC-xml/ [Accessed 20 April 2013].
Walker, V., 2009. Designing a Process Flowsheet. Chemical Engineering Progress.
[article]. 2009:5 [cited 18.1.2013]. pp. 15-21. Available in the Internet:
http://coade.typepad.com/coadeinsider/2009/06/CEP-May-09-Piping-and
Instrument-Diagrams-COADE.pdf
Wiesner, A., Morbach, J., & Marquardt, W., 2011. Information integration in
chemical process engineering based on semantic technologies. Computers &
Chemical Engineering, 35(4), pp. 692-708.
Yang, F., Xiao, D., & Shah, S. L., 2010. Qualitative fault detection and hazard
analysis based on signed directed graphs for large-scale complex systems. Fault
Detection, pp. 15-50.

81
Yim, S. Y., Ananthakumar, H. G., Benabbas, L., Horch, A., Drath, R., &
Thornhill, N. F., 2006. Using process topology in plant-wide control loop
performance assessment. Computers & chemical engineering, 31(2), pp. 86-99.

82
Appendix 1: MATLAB Codes for Class Generation
%% define a class namely ‘topology_based_causal_models’
classdef topology_based_causal_models
properties cmLabels = [];%components' names cmPos = [];%components' coordinates cmLines = [];%start and end points of each connection end
methods
%% 'getLabel' function creats 'cmLines' property function obj = getLabel(obj, excelfile) [NUMERIC,X] = xlsread(excelfile); % convert the excel
into matrix, NUMERIC is the numeric array, X is the text array startCol = strmatch('From',X(1,:)); % the 'column
number' of the 'from' header endCol = strmatch('To',X(1,:)); % the 'column number'
of the 'to' header startNodes = X(2:size(X,1),startCol);% obtain all
start points endNodes = X(2:size(X,1),endCol); % obtain all end
points newLines = [startNodes endNodes]; obj.cmLines = [obj.cmLines; newLines]; % start and
end points of all connections end
%% 'getPosition' function creats 'cmLabels' and 'cmPos'
properties function obj = getPositon(obj, excelfile) [NUMERIC,X] = xlsread(excelfile); % convert the excel
into matrix, NUMERIC is the numeric array, X is the text array obj.cmLabels = X(2:size(X,1),1); %capture names of all
components obj.cmPos = NUMERIC(:,1:2); %capture coordinates of
all components end
%% 'getMatrix' function creats the connetivity matrix function connectMat = getMatrix(obj) connectMat=zeros(length(obj.cmLabels)); for i=1:size(obj.cmLines,1)
r=strmatch(obj.cmLines{i,1},obj.cmLabels,'exact'); %the row number
of the start point of each line
c=strmatch(obj.cmLines{i,2},obj.cmLabels,'exact'); %the column
number of the end point of each line connectMat(r,c)=1; %the entry determined by the
row and column numbers should be 1 end end

83
%% 'getTable' function creats the connectivity table which
combines the matrix and text headers function connectTable = getTable(obj) connectTable=cell(size(obj.cmLabels,1)+1); %define a
cell matrix with the dimension of all components plus one connectTable(2:end,1)=obj.cmLabels; connectTable(1,2:end)=obj.cmLabels';
connectTable(2:end,2:end)=mat2cell(getMatrix(obj),ones(1,size(obj.
cmLabels,1)),ones(1,size(obj.cmLabels,1)));% convert matrix into
cell array end
%% Build four basic operations for the digraph model %% 'addline' function adds a line between two nodes function obj = addline(obj,strFrom,strTo) if(isempty(strmatch(strFrom,obj.cmLabels))) str = sprintf('The equipment %s doesn''t
exist.',strFrom); disp(str) return; end if(isempty(strmatch(strTo,obj.cmLabels))) str = sprintf('The equipment %s doesn''t
exist.',strTo); disp(str) return; end
newLine = [{strFrom} {strTo}]; obj.cmLines = [obj.cmLines; newLine]; % add a new
line into the ‘cmLines’ property end
%% 'deleteline' function removes the connection between
two nodes function obj = deleteline(obj,strFrom,strTo) if(isempty(strmatch(strFrom,obj.cmLabels))) str = sprintf('The equipment %s doesn''t
exist.',strFrom); disp(str) return; end if(isempty(strmatch(strTo,obj.cmLabels))) str = sprintf('The equipment %s doesn''t
exist.',strTo); disp(str) return; end
cmLinesTmp=[]; for i=1:length(obj.cmLines) if(~(strcmp(obj.cmLines(i,1),strFrom) &&
strcmp(obj.cmLines(i,2),strTo))) cmLinesTmp = [cmLinesTmp; obj.cmLines(i,:)];%
update ‘cmlines’ property without the given node end

84
end obj.cmLines = cmLinesTmp; end
%% 'addnode' function adds a node into the digraph function obj = addnode(obj,strLabel,x,y) if(~isempty(strmatch(strLabel,obj.cmLabels))) str = sprintf('The equipment %s has
existed.',strLabel); disp(str) return; end obj.cmLabels = [obj.cmLabels;{strLabel}]; obj.cmPos = [obj.cmPos;x y]; %add a new line to the
coordinate matrix end
%% 'deletenode' function deletes the given node and its
connections function obj = deletenode(obj,strLabel) indexTemp = strmatch(strLabel,obj.cmLabels); if(isempty(indexTemp)) str = sprintf('The equipment %s doesn''t
exist.',strLabel); disp(str) return; end labelTemp = obj.cmLabels(indexTemp);
obj.cmLabels = obj.cmLabels([1:indexTemp-1
indexTemp+1:length(obj.cmLabels)]); obj.cmPos = obj.cmPos([1:indexTemp-1
indexTemp+1:length(obj.cmPos)],:);
cmLinesTmp=[]; for i=1:length(obj.cmLines) if(~(strcmp(obj.cmLines(i,1),labelTemp) ||
strcmp(obj.cmLines(i,2),labelTemp))) cmLinesTmp = [cmLinesTmp; obj.cmLines(i,:)]; end end obj.cmLines = cmLinesTmp; end
%% function 'display' creates the digraph function digraph(obj) figure % draw the nodes r = 2; % radius of each node t = linspace(0,2*pi,50); X = r*cos(t); Y = r*sin(t); n = length(obj.cmLabels); clf for i=1:n patch(obj.cmPos(i,1)+X,obj.cmPos(i,2)+Y,'c')
text(obj.cmPos(i,1),obj.cmPos(i,2),obj.cmLabels{i},'Horiz','center

85
','Vert','middle'); end axis equal axis off
connMatrix = getMatrix(obj);
% draw connection lines L = 4; % length of the arrows A = 30*pi/180; % angle of the arrows for i=1:n for j=1:n if connMatrix(i,j) Q = atan2(obj.cmPos(j,2)-obj.cmPos(i,2),
obj.cmPos(j,1)-obj.cmPos(i,1)); X = [ obj.cmPos(i,1)+r*cos(Q)
obj.cmPos(j,1)+r*cos(Q+pi)]; Y = [ obj.cmPos(i,2)+r*sin(Q)
obj.cmPos(j,2)+r*sin(Q+pi)]; Xa = X(2) + [L*cos(-A+Q+pi) 0
L*cos(A+Q+pi)]; Ya = Y(2) + [L*sin(-A+Q+pi) 0
L*sin(A+Q+pi)]; line([X NaN Xa],[Y NaN Ya]) end end end end end end

86
Appendix 2: MATLAB Codes for Class Instantiation
clear clc
dryingsection = topology_based_causal_models; %instantiation of
the class,e.g., define an object 'dryingsection' as an instance of
the class
dryingsection =dryingsection.getLabel('steam group-Pipe Line
Segments.xls'); %load the excel file of pipe line segments and
return the 'cmLines' property
dryingsection =dryingsection.getLabel('steam group-Signal Line
Segments.xls'); %load the excel file of signal line segments and
update the 'cmLines' property
dryingsection =dryingsection.getPositon('coordinate.xls'); %load
the excel file of coordinates and return 'cmLabels' and 'cmPos'
properties

87
Appendix 3: P&ID Drawing of the Drying Section of the BM4

88
Appendix 4: Causal Digraph of the Drying Section of the BM4


![[OOP - Lec 04,05] Basic Building Blocks of OOP](https://static.fdocuments.in/doc/165x107/58e63bf21a28abe3108b50b3/oop-lec-0405-basic-building-blocks-of-oop.jpg)