School of Accounting Seminar Series - UNSW Business School · 2014-04-29 · School of Accounting...
56
School of Accounting Seminar Series Semester 2, 2012 The Interactive Effects of Incentive Threshold and Narcissism on Managerial Decision-Making Kelsey Dworkis University of California, Marshall School of Business. Date: Friday, 9 th November 2012 Time: 3.00pm – 4.30pm Venue: Tyree Energy Technologies Building LGO5 (Refer to campus map reference H6 here ) Australian School of Business School of Accounting
Transcript of School of Accounting Seminar Series - UNSW Business School · 2014-04-29 · School of Accounting...

School of Accounting Seminar Series Semester 2, 2012
The Interactive Effects of Incentive Threshold and Narcissism on Managerial Decision-Making
Kelsey Dworkis
University of California, Marshall School of Business.
Date: Friday, 9th November 2012 Time: 3.00pm – 4.30pm Venue: Tyree Energy Technologies Building LGO5
(Refer to campus map reference H6 here)
Australian School of Business School of Accounting
The Interactive Effects of Incentive Threshold and Narcissism on Managerial Decision-Making
Kelsey Kay Dworkis
University of Southern California
Marshall School of Business
Leventhal School of Accounting
October 16, 2012
Comments are Welcome
I gratefully acknowledge the support and comments on my dissertation from my dissertation co-
chairs S. Mark Young and Sarah E. Bonner and committee member, Peter Kim. I thank David
Erkens, Ken Merchant, Maria Ogneva, Maria Loumioti, David Maber, Jim Manegold, William
Holder, Randy Beatty, Yu Tian, Kari Olsen, Jong Hwan (Simon) Kim, Karen Ton, Jim
Stekelberg, Kara Wells, Jeff McMullin, Bryce Schonberger, and workshop participants at the
University of Southern California for their many comments. I am thankful to Linda Ramos, the
Leventhal School of Accounting, The Marshall School of Business and the Institute of
Management Accountants (IMA) Doctoral Grant Program for their generous support.

2
The Interactive Effects of Incentive Threshold and Narcissism on Managerial Decision-Making
ABSTRACT: This study investigates the effects of extrinsic motivation, as provided by a bonus
threshold in a compensation plan, and intrinsic motivation that derives from narcissism on capital
investment decision-making quality. Using an experiment, this study examines Millennial
managers’ (i.e., managers born between 1978-1995) decision-making quality under two levels of
bonus threshold (high, low) and two levels of measured narcissism (high, low). Results show that
a manager’s level of narcissism and bonus threshold condition to which they are randomly
assigned interact to result in systematically different performance levels on the capital
investment task. Millennial managers higher in narcissistic characteristics outperform less
narcissistic managers in a capital investment task under a low bonus threshold; however, this
performance result is reversed under a high bonus threshold. Implications of MCS adaptations
that can enhance decision-making of Millennial managers are discussed.
Keywords: management control system design; managerial decision-making; incentive
compensation; narcissism
Data Availability: Contact the author
3
I. INTRODUCTION
Management Control Systems (MCS) consist of standards and procedures to increase
performance within an organization. In designing MCS, firms aim to achieve congruence
between MCS incentives and organizational performance. Achieving such congruence in
practice allows MCS to be both effective, by motivating employees, and efficient in its use of
resources. An enduring goal of MCS research is to understand the effects of elements of MCS
such as the use of monetary incentives. As organizations evolve, these MCS elements also must
adapt in order to continue to remain effective and efficient. By gaining an understanding of
systematic shifts in characteristics of work place employees, research can better inform practice
as to how MCS and accounting outcomes can be implicated.
Currently, the organizational environment is experiencing significant demographic shifts.
Today in the U.S. there are roughly 80 million Millennials in and entering the workforce. By the
end of 2012, Millennials will comprise 37% of the workforce. Millennials are a generation
comprised of individuals born between 1978 and1995. Millennial employees differ from their
predecessors, Generation X (born 1965-1977) and Baby Boomers (born 1946-1964) in many
ways, namely their social and technological practices and the way they view their role as an
employee. Research on MCS design has begun to explore the match or mismatch between the
traditional MCS and the Millennial manager since research in management and psychology has
shown significant systematic personality and work attitude differences between the Millennials
and older generations (Twenge and Campbell 2008; Dworkis, Olsen and Young 2012). As a
result of these personality and attitude differences, traditional MCS effectiveness and efficiency
may be compromised if these systems are met with unforeseen reactions by the new generation

4
of managers. Investigation of this possibility can help shed light on fundamental differences in
MCS effectiveness and potential complications for incentive design.
One key dimension on which the Millennial generation of managers differs from other
generations is on their reported level of narcissism. Narcissism is defined as a “pervasive pattern
of grandiosity (in fantasy or behavior), need for admiration, and lack of empathy, beginning by
early adulthood and present in a variety of contexts,” (American Psychiatric Association 2000).
The attributes that comprise a manger’s level of narcissism are stable personality characteristics
that affect motivations towards and away from positive and negative events, such as monetary
incentives (Foster and Brennan 2011). Research indicates that levels of narcissism among the
Millennials have increased at an alarming rate over the last twenty years (Pinsky and Young
2009; Alsop 2008). Possible consequences of this rise relate to findings in psychology that have
shown systematic differences in decision-making behavior in narcissists, with narcissists
showing a stronger response to positive outcomes or events than to negative outcomes or events
compared to their non-narcissistic counterparts.
While findings in narcissism research indicate systematic differences in the intrinsic
motivations of narcissistic decision-makers, monetary incentives provide an extrinsic motivation
for decision-makers. One common type of monetary incentive provided to managers is a bonus
threshold. A bonus threshold sets an explicit goal above which a manager is rewarded. Bonus
thresholds set at lower levels provide positive feedback along a wider range of possible outcomes
whereas bonus thresholds set at higher levels provide negative feedback along a wider range of
possible outcomes. Given the unique motivations of narcissists described above, the incentive
threshold employed by a firm may have direct consequences on the observed performance of
accounting related outcomes such as capital investment decision-making quality.

5
This study addresses a call in the management control literature to determine the extent to
which MCS design differentially influences performance in managers with different “individual
culture” or personalities (Merchant and Otley 2007 pp. 798) by examining the extent to which
narcissism plays a role in corporate investment decisions that have the potential of affecting
corporate profits and stakeholder wealth. Researchers studying accounting outcomes have begun
to investigate the roles played by manager characteristics on corporate decisions (Bertrand and
Schoar 2003), voluntary disclosure (Bamber et al. 2010), CFO accounting choices (Ge,
Matsumoto and Zhang 2011), financial misreporting (Schrand and Zechman 2011), tax
avoidance strategies (Dyreng, Hanlon and Maydew 2010), reported earnings-per-share, stock
price and audit fees (Olsen, Young and Dworkis 2012) and stakeholder communication
(Amernic and Craig 2010). Many of these studies use archival data and examine the relationship
between these managerial characteristics and accounting performance outcomes.
This study extends existing archival research on managerial characteristics by
experimentally manipulating extrinsic incentives (bonus threshold) and measuring intrinsic
incentives (narcissism and approach-avoidance motivation). This design allows a more direct
test of the interaction of incentive threshold and managerial characteristic effects on accounting
outcomes. Furthermore, this study contributes to the growing literature in management and
accounting on CEO narcissism and firm-level consequences (Chatterjee and Hambrick 2007) by
measuring narcissism with a well-validated psychological instrument, the Narcissistic
Personality Inventory (NPI), and directly testing its effect on observed investment decision-
quality. Finally, this study contributes to the literature currently underway in psychology on
narcissism and decision-making (Foster and Brennan 2011) and investigates decision-making
behavior in an MCS context across different generations of managers.
6
The purpose of this study is to examine the interactive effects of bonus threshold
condition and level of narcissism on the capital investment decision-making quality of Millennial
managers. In this study, Millennial managers are assigned into one of two levels of bonus
threshold conditions and their level of narcissism is measured using the Narcissistic Personality
Inventory (NPI) (Raskin and Terry 1988). Manager participants are then asked to make
investment decisions on behalf of their firm. The results show that bonus threshold and
narcissism have a significant interactive effect on resulting investment decision-quality. Under a
low bonus threshold condition, managers higher in narcissism perform better on an investment
decision task compared to managers lower in narcissism. Conversely, under a high bonus
threshold, managers higher in narcissism perform worse on an investment decision task
compared to managers lower in narcissism. Relative approach-avoidance motivation (i.e.,
motivation towards (away from) rewards (penalties)) partially mediates the relationship between
these variables, indicating that narcissistic managers’ performance differences are driven in part
by their underlying reward sensitivity. Furthermore, narcissistic managers’ decisions appear to
be influenced more strongly by self-serving incentives (i.e., bonus threshold) than by firm-stated
incentives (i.e., firm guidance). Finally, an extension of the study to older generations (Gen X
and Baby Boomer) shows that the interactive effect of narcissism is not significant in older
generations. The highly significant interaction in the Millennial managers indicates a systematic
shift in the decision-making behavior of Millennial managers. As Millennials continue to enter
the workforce and occupy management positions, it is important that MCS research considers
systematic shifts in motivations that drive decision-making behavior since such behavior can
affect accounting outcomes.
7
The remainder of the paper is organized as follows: Section II discusses the motivation of
the study and key independent and dependent variables of interest. In Section III hypotheses are
developed. Section IV describes the experimental procedures, design, task and measurement
instruments. Section V presents the results of the tests of the hypotheses. Section VI presents an
additional analysis extending the research question to other generations. Finally, Section VII
concludes and discusses limitations and future research.
II. INCENTIVES AND NARCISSISM IN MANAGERIAL DECISION-MAKING
Decision-Making and Bonus Incentive Thresholds in Managerial Accounting
MCS can be categorized into two types of controls—formal control systems such as
direct supervision and monitoring and cybernetics control systems such as budgeting and
incentive plans. Under cybernetics control systems, standards of performance are determined,
measuring systems gauge performance, comparisons are made between the standard and the
actual performance and feedback is given to provide information on variances (Fisher 1988).
Decision-making research in managerial accounting has attempted to understand and explain the
effect of such controls on the decision-quality of managers (Sprinkle 2000). A common decision
that managers make is the allocation of the firm’s resources in investments. These decisions can
be referred to as capital budgeting decisions (Kida et al. 2001; Moreno et al. 2002; Sawers 2005;
Vera-Muñoz 1998; Chenhall and Morris 1991; Awasthi and Pratt 1990). Many firms have
implemented formal MCS systems to consider both financial and non-financial information
when allocating capital to investments. These systems often employ the Balanced Scorecard
(BSC, Kaplan and Norton 1992) which captures relevant financial and non-financial information.
The BSC categorizes relevant information into four dimensions: financial performance,

8
customer satisfaction, internal process efficiency, and learning and growth. In addition to
formal controls such as the BSC, cybernetics controls, such as the use of monetary incentives for
high quality investments, are used by firms to increase the probability of a successful decision.
Monetary incentives used by firms have several forms. Incentives can be distributed
uniformly over a period (flat wage), for reaching certain goals or targets (quota system), per unit
of output (variable system), or for top performance (tournament system). Evidence on incentive
plans suggests that quota systems, such as a bonus threshold, consistently predict increased
performance compared to tournament or flat wage schemes (Bonner, Hastie, Sprinkle and Young
2000). Incentive plans induce control through motivation to increase effort, which in turn
increases performance (Bonner and Sprinkle 2002). The increase in effort and motivation occurs
as a result of increases in expectancy (Vroom 1964), goal commitment (Locke et al. 1981; Locke
and Latham 1990), and self-efficacy (Bandura 1977). Another key determinant of motivation is
an individual's relative approach and avoidance motivations (Carver and White 1994), which
lead an individual to move toward positive stimuli or events (approach motivation) and/or to
move away from negative stimuli or events (avoidance motivation).
Bonus threshold quota schemes offer incentives to managers by incorporating an explicit
and assigned goal. Despite differences in assigned thresholds across incentive plans, these
schemes consistently show positive effects on resulting performance on management accounting
tasks. However, thresholds are often set for a manager without consideration of the manager’s
unique goals or intrinsic motivations, such as those associated with narcissistic personality
characteristics. Given research that finds narcissists respond uniquely to different levels of
positive and negative outcome feedback (Foster and Brennan 2011), the level of bonus threshold
faced by the manager may evoke different levels of resulting motivation and effort. As discussed
9
in the following section, these motivations play an important role in resulting motivation, effort,
and observed performance. Consequently, decision-making quality may be affected by the bonus
threshold set by the firm, the level of narcissistic personality characteristics of the manager, or an
interaction of these two variables.
Narcissistic Personality as a Determinant of Decision-Making Quality
Manager personality characteristics have become an increasingly popular topic of
research in recent years. Much of this research relies on Upper Echelons Theory to explain the
association between characteristics of powerful actors in an organization and the accounting
outcomes observed (Hambrick and Mason 1984). Upper Echelons Theory, which evolved from
classical management theories introduced by Cyert and March (1963) and March and Simon
(1958), considers choice a product of a decision-maker’s bounded rationality and his multiple
and conflicting goals. A person’s goals are driven by, among other things, personality
characteristics (Elliot and Thrash 2002). Recent research in management and accounting shows
that one such managerial characteristic-- narcissism, can lead to accounting outcomes such as
riskier asset investments (Chatterjee and Hambrick 2007), self-enhancing reports of performance
(Hales et al. 2012) and increased Accounting and Auditing Enforcement Releases (AAERs)
(Schrand and Zechman 2011). Additionally, research has discussed how narcissistic managers
can facilitate self-promotion through accounting reporting (Amernic and Craig 2010).
Narcissism is defined in this study as it is in most non-clinical research on the topic.
Specifically, narcissism is defined as a pervasive pattern of grandiosity (in fantasy or behavior),
need for admiration, and lack of empathy, beginning by early adulthood and present in a variety
of contexts. Narcissism has important implications for MCS at the individual, group, and firm
level. Brown (1997) details six consequences of narcissistic traits at the organization level--
10
denial (e.g., denial of market demands), rationalization (post-hoc justification of a firm decision
that had negative consequences), self-aggrandizement (creation of subcultures that discourage
change or innovation), attributional egotism (attribution of negative outcomes to external
factors), entitlement (priorities driven by convenience of managers rather than welfare of
stakeholders) and anxiety (managers lack stability and the organization fails to maintain a
common sense of culture). Such consequences can result in decreased financial performance as
reflected in accounting performance outcomes.
Narcissism can be summarized by seven contributing factors: Authority, Self-
Sufficiency, Superiority, Exhibitionism, Exploitativeness, Vanity, and Entitlement (Raskin and
Terry 1988). Not all elements of narcissism are considered “bad”. In an organization, managers
high in authority and self-sufficiency often perform very well. High levels of performance in
high authority and high self-sufficiency managers are likely to occur more frequently when
managers also exhibit higher levels of superiority. The high level of superiority contributes to
the manager’s belief in their abilities (i.e., their self-efficacy), which can increase motivation and
effort. Of course, some of the characteristics of narcissism are destructive and can have adverse
consequences if manifested at a group or organizational level. Exploitativeness can lead to
dysfunctional behavior such as a lack of control compliance and willingness to cheat or to
exploit MCS. Vanity can predispose managers to hubris, an exaggerated pride or self-
confidence. This exaggerated sense of self can lead managers to believe they can do no wrong.
Such hubris has been shown to influence managers to pay higher equity premiums for
acquisitions or investments because they believe they can turn the investment target into a more
profitable project or entity (Hayward and Hambrick 1997). Entitlement can lead to unwillingness
to make tradeoffs in a workplace and can decrease motivations of managers that do not believe

11
they are adequately compensated because they have an enduring feeling of privilege. Finally,
exhibitionism can cause managers to take actions or exhibit behaviors to get attention, which can
disrupt workflow and productivity. As a result of the myriad of possible consequences of
narcissistic motivations, there are no consistent findings as to whether there exist any ability or
performance differences in narcissists (Wallace and Baumeister 2002). In other words,
narcissists’ performance is not consistently better or worse. However, these findings do not
consider the unique motivations of the narcissists with respect to different assigned goals such as
bonus thresholds. As such, it is an empirical question how these intrinsic motivations will
interact with the level of bonus threshold in motivating performance on a capital investment
decision task.
In addition to the possible consequences of narcissism in managers, an important
consideration of MCS is that narcissism is a stable set of personality characteristics. Narcissistic
individuals are not able to attenuate their behavior in certain domains, such as in an employment
setting. As a result, narcissism becomes an integral part of a manager’s intrinsic motivation and
an important determinant of success in the usefulness of bonus thresholds.
Intrinsic motivations play a key role in a manager’s decision-making process.
Psychological models of narcissism (Morf and Rhodewalt 2001; Morf 2006) describe these
effects as follows: each individual has a unique “internal control system” that regulates his or her
thoughts and behaviors. A theoretical account, known as the Agency Model of Narcissism
(AMON)1 (Campbell et al. 2006; Campbell and Foster 2007) has been developed that shows that
narcissists have systematically different internal control systems from non-narcissists.
1 The term “Agency” in the Agency Model of Narcissism refers to the individual-level analysis (i.e., how the narcissist affects his or her own well-being). This model should not be confused with the definition of agency as a contracted relationship or of the economic theory of Agency and Agency Costs (Jensen and Meckling 1976).

12
Differences in narcissists internal control system result from differences in both extrinsic and
intrinsic motivation. The systematic differences in the narcissist’s self-regulatory (i.e., internal
control) system are fourfold. First, narcissists have a high approach/low avoidance orientation.
This is the motivation to move toward (away from) good (bad) outcomes. Second, narcissists
have an inflated and entitled view of themselves. Third, narcissists have a general desire for self-
esteem. Fourth, narcissists emphasize self-focused goals over group or organizational goals.
The differences in both extrinsic and intrinsic motivation described above suggest a
possible interaction of effects when both are present at different levels. Of the four
characteristics, relative approach-avoidance motivations have perhaps the most immediate
consequences on investment decision-making behavior since this motivation relies heavily on
incentive compensation and feedback. Given the approach-avoidance differences of narcissists,
studies have examined how quickly narcissists adjust their tactics to suit changing situational
demands and if their approach orientations affect their tactics. These studies have investigated
narcissism and dysfunctional impulsivity (Dickman 1990), narcissists’ risk seeking behavior in
gambling (Lakey et al. 2008), and investment strategy and investment decisions (Foster et al.
2009; 2011), and show consistent support for the narcissists’ high approach motivation. Such
motivations are explained by developmental theories on narcissism (Kohut 1977). These theories
explain the determinants of narcissism and how it develops in an individual. This research has
linked permissive parenting to levels of narcissism, which explains how narcissists become
approach oriented. Children of indulgent parents come to expect constant positive reinforcement
and rewards (Capron 2004). As a result, when these children enter the workforce and occupy
management positions, their motivations differ to the extent they are approach and avoidance-

13
driven. In the next section, the four characteristic traits of narcissists are described in more detail
as they relate to the hypotheses tested in this study.
III. HYPOTHESES DEVELOPMENT
To further develop the model of decision-making that is applied to this study, the four
fundamental characteristics of narcissists are now discussed in greater detail. The first trait of
narcissists2 is their unique approach and avoidance motivation. Approach motivation is the
motivation to move toward a positive event, such as an increase in cash bonuses for good
management investments. Avoidance motivation is the motivation to move away from negative
events such as losses of potential bonuses for bad management investments. Thus, one would
expect stronger approach motivation in the presence of $100 compared to $1 (ceteris paribus) -
$100 is “better” than $1. Likewise, one would expect stronger avoidance motivation in the
presence of an adult lion compared to a lion cub- an adult lion is more dangerous and poses more
of a threat than a lion cub.
Not all individuals exhibit the same level of approach or avoidance motivation.
Specifically, narcissists are less sensitive to losses than they are to gains. In other words, a
narcissist should respond more strongly to (or be more motivated by) a $50 gain than to a loss of
$50, whereas a non-narcissist would respond more strongly to the loss of $50 than to the $50
gain and adjust behavior as a result of such a loss. Conversely, a narcissist would not be as
bothered by a $50 loss as the non-narcissist, and would be less motivated to adjust behavior as a
2 In this study, the term “narcissist” refers to individuals or managers with high levels of narcissistic personality characteristics. These narcissistic personality traits are typically studied at the sub-clinical level. This is different than narcissistic personality disorder (NPD), which is typically studied at the clinical level. The terms “narcissistic (non-narcissistic) manager” and “High (Low) N manager” are used interchangeably to describe managers with higher (lower) than average NPI scores.

14
result of the loss3. The narcissistic manager is not as “phased” by the losses and continues to take
on risky investments without re-consideration4. As a result of their high level of sensitivity to
rewarding outcomes, narcissistic managers (High N managers) who receive positive outcomes
along a wider range of investment decisions will exhibit more pronounced approach motivation
and risk-seeking behavior than non-narcissistic managers (Low N managers). A low bonus
threshold allows a wider range of positive outcomes, rewarding any investment averaging more
than 40%. On the other hand, a high bonus threshold constricts the range of positive outcomes,
rewarding only outcomes that average more than 60%. The narrow range of successful
investment prospects conflicts with the High N manager’s approach-oriented motivation and can
impede their learning and performance under the constricted conditions.
The second and third traits of narcissists are that they have an entitled and inflated self-
view while simultaneously desiring self-esteem. While narcissists have a high explicit self-
esteem (they have a high opinion of their competence and abilities) they have a low implicit self-
esteem (how they actually feel about themselves and their opinion of their love or likeability)
(Bosson and Weaver 2011). Narcissists have a grandiose and vulnerable self-concept (Rhodewalt
and Eddings 2002). On the surface, narcissists have very inflated self-views and entitled
behavior (high explicit self-esteem); however, these observed behaviors are defense mechanisms
the narcissist employs to mask their vulnerability. Beneath the outward grandiose behavior,
narcissists have an underlying fear that they are worthless and inferior (low implicit self-esteem).
As a result, narcissists employ mechanisms such as seeking self-affirming feedback (i.e., praise)
and overestimating their attractiveness and intelligence to regulate their self-worth (Ziegler-Hill
3 Prospect Theory (Kahneman and Tversky 1979) would predict higher avoidance motivation (or heightened sensitivity in the loss domain). 4 Other research has contended that narcissism reliably predicts strong approach motivation but only weakly predicts
avoidance motivation (Foster and Trimm 2008). In all cases, approach motivation is a strongly associated with
narcissism.

15
and Jordan 2011). This self-enhancement, or tendency to claim greater standing on a
characteristic or more credit than is objectively warranted (Alicke and Sedikides 2009), is
manifested through both monetary and social mechanisms such as fame or social promotion
(Young and Pinsky 2006; 2009). Any failure on a task is externalized by frustration and a
reinforcing need to display his or her heightened self-view and seek self-enhancement through
future actions (Wallace 2011). Additionally, narcissists have self-esteem that is contingent upon
performance outcomes (Morf et al. 2000).
These second and third traits of narcissists serve a reinforcing role to the approach and
avoidance motivation of narcissists. Every time a narcissistic manager is rewarded for approach
behavior such as taking an investment that yields a reward, their inflated self-view is confirmed
and getting a correct response reinforces their self-esteem. Every time the narcissistic manager is
penalized for approach behavior, such as taking an investment that yields a penalty, the manager
receives neither confirmatory feedback on their self-view nor attention to their self-esteem. The
manager disregards the negative reinforcement and penalty because such information does not
serve the manager’s own interests of grandiosity, entitlement, and need for self-enhancement.
As a result, the avoidance motivation, or the motivation to stay away from adverse approach
behavior is not as discerning in the narcissistic manager.
The first three characteristics of narcissists form the basis for the first set of hypotheses.
The strong implicit motivations of narcissistic managers (approach and avoidance motivations,
inflated self-view and need for self enhancement), coupled with a threshold condition consisting
of positive (negative) stimuli across a wider range of investment criteria, will create differential
effects on the performance for High and Low N managers. As such, the first predictions are as
follows:

16
Hypothesis 1: The interaction of incentive threshold condition (Low: LTC, High: HTC)
and narcissistic characteristics in managers will differentially affect a manager’s
performance on an investment decision task.
H1a: Managers higher in narcissistic characteristics will outperform managers
lower in narcissistic characteristics under a low bonus threshold condition (LTC).
H1b: Managers higher in narcissistic characteristics will underperform managers
lower in narcissistic characteristics under a high bonus threshold condition (HTC).
Furthermore, because the approach-avoidance motivation is a key characteristic in the
differential relationship between high and low narcissistic managers, it is important to determine
whether these motivations are ultimately responsible for observed performance differences. If
these motivations are responsible for the relationship between the threshold-narcissism
interaction and performance, approach and avoidance should fully mediate the statistical
relationship between the interaction variable and performance (i.e., the statistical relationship
between NPI and performance should be attenuated when approach-avoidance is included in the
analysis). On the other hand, if there are characteristics of narcissists beyond these approach and
avoidance differences (such as those described above) that lead to differences in decision-making
behavior, full mediation will not be observed. As such, the third prediction is as follows:
H2: High Approach-Low Avoidance motivation will partially mediate the differential
relationship of incentives and narcissism on performance.
The fourth fundamental trait of narcissists is that they are extremely self-focused in their
goal setting and motivational behavior. That is, they place more value on getting ahead than on
getting along. When faced with a budgeting decision that is not a prudent investment for the
firm, but will likely produce a personal payoff and reinforce their self-esteem, the narcissistic

17
manager will opt to invest in the project. This type of systematic bias in decision-making can
lead to important firm level consequences such as over-investment and reckless decision-making.
Strongly motivated by rewarding incentives and positive feedback which both serve self-focused
goals; High N Managers are expected to invest in more projects than Low N Managers. When
given the option to invest in a project that provides monetary incentives as well as positive
outcome feedback, High N managers will be both extrinsically motivated by the bonus potential
and intrinsically motivated by potential positive reinforcement of behavior that narcissists seek.
As an example, in deciding on whether to invest in a project, a manager will consider
both their individual bonus threshold (a self-focused goal) and the firm guidance (a communal
goal). If a manager has been assigned a 40% bonus threshold (i.e., the percentage an investment
must yield for the manager to receive a bonus) but has been given firm-guidance to invest only in
projects that yield more than 50%, a High N manager is expected to accept all investments that
fall between their bonus threshold and the firm guidance (i.e., projects between 40%-50%). The
High N Manager will be more strongly influenced by the bonus compensation and positive
reinforcement available for such an investment than by the firm’s guidance of 50%. The self-
focused goal and resulting motivation will trump the motivation to adhere to the firm’s guidance.
In the case of a High N manager who has been assigned a higher bonus threshold of 60%
(and the same firm guidance of 50%) the implications are somewhat more ambiguous. On the
one hand, if the manager only seeks to attain self-driven goals then it is likely that she will not
take on any investments that fall between the firm guidance and her bonus threshold (i.e.,
projects between 50%-60%). These investments will not yield either a compensation bonus or
positive feedback because they do not meet the 60% threshold. Hence, High N managers would
be expected to take fewer investments when assigned to a higher threshold condition (i.e., 60%
18
vs. 40%), resulting in an overall insignificant net effect of the total investments taken across the
conditions (more investments in lower threshold condition and fewer investments in higher
threshold condition).
However, as discussed above, High N managers are also expected to have relatively low
levels of avoidance motivation with respect to their investment decision behavior. This
motivation is the motivation to move away from losses. In a higher threshold environment
avoidance motivation is an advantage since there is a narrower range of correct investment
prospects. Therefore, a High N manager will likely take more faulty decisions because of their
handicapped avoidance motivation. Given these two conflicting possible outcomes, it is unclear
whether the High N manager will choose to take fewer investments in the higher threshold
condition (as the fourth trait suggests) or more investments (as the first trait suggests). In
summary, it is expected that High N managers will take more investments when presented with a
low bonus threshold (40%) but not a significantly different number of investments when
presented with a high bonus threshold (60%). Taken together this leads to the following
predictions:
Hypothesis 3: The interaction of incentive threshold condition (Low: LTC, High: HTC)
and narcissistic characteristics in managers will differentially affect a manager’s
investment frequency.
H3a: Managers higher in narcissistic characteristics will invest more frequently
than managers lower in narcissistic characteristics under a low bonus threshold
condition (LTC).
H3b: Managers higher in narcissistic characteristics will invest as frequently as
managers lower in narcissistic characteristics under a high bonus threshold
condition (HTC).

19
Furthermore, because managers higher in narcissism are more highly motivated by self-
focused goals, these managers’ investment decisions should theoretically be more strongly
influenced by their bonus threshold (as it represents a self-focused goal) than the firm’s guidance
(as it represents a communal goal). This influence will be reflected in the variance of the projects
a manager chooses to invest. Managers will focus on a target, either self-focused (their bonus
threshold) or communal (firm guidance) and take investments based on this target. As a result,
the more weight or decision-making influence the information carries, the more the manager will
rely on it when choosing to invest in a project or not. This leads to the last hypothesis:
H4: Managers higher in narcissistic characteristics will choose investments based on
individual thresholds rather than firm-driven thresholds.
IV. METHOD
To test the hypotheses, this study employs a 2x2x4 between and within-subjects
experimental design. The two between subjects factors are narcissism (high, low) and bonus
threshold (high, low), and the within-subjects factor is the period (4 periods). Participants are
156 participants between the ages of 18-34 located in the United States. They were recruited
using Amazon Mechanical Turks Applications. Amazon Mechanical Turks (AMT, MTurks) is
an internet labor market launched in 2005 (see
https://www.mturk.com/mturk/help?helpPage=overview#what_is for detailed information).
MTurks is a relatively new application for social science research (Buhrmester et al. 2011), but
has become increasingly popular because it enables a large, readily accessible, and representative
subject pool (Paolacci, Chandler and Ipeirotis 2010). Recent research in accounting has
successfully conducted experimental research using MTurks to explore investor reaction (Bonner
20
et al. 2012; Rennekamp 2012), investor social norms (Koonce, Miller and Winchel 2012), and
fraud and misconduct (Brown, Rennekamp, Seybert and Zhu 2011).
Experimental Task
Decision Task
Participants completed a managerial investment decision-making task. Participants
played the role of a manager making a series of capital budgeting decisions on behalf of their
firm. Participants were instructed to choose investments based on graphical representations of
the hypothetical investments. To simulate such a setting, investments were shown as graphic
depictions of the four Balanced Scorecard (BSC) dimensions: financial performance, customer
satisfaction, internal process efficiency, and learning and growth. Participants were told that
their firm viewed an investment as “good” if the four categories averaged more than 50%;
however, their bonus compensation may be based on a different threshold.
The complete task instructions and compensation details are included in Appendix A5.
Following the instructions, participants were required to answer three questions correctly to
ensure they understood the instructions6. Once the participant had answered all three questions
correctly they were directed to the practice round of investment decisions.
Participants viewed graphical balanced scorecards for 40 investments7 and made
decisions to either invest or not invest in each project. Appendix B displays an example
investment prospect. The first ten investments were not eligible for bonus compensation.
5 The task was adapted from Smillie, Dalgeish, and Jackson (2007) Experiment 1 and Foster, Reidy, Misra and Goff (2011). 6 One of these questions included asking participants what percent the four BSC categories must average to be considered a “good” investment by the firm. Participants were required to correctly answer 50%. This not only ensured the participants understood the firm’s guidance, but also made it salient to the manager participant. 7 These 40 investments consisted of 4 periods of 10 trials.

21
Participants were given feedback after each decision. This feedback could be used to help the
manager estimate their bonus threshold but they were not compensated in these initial ten trials.
Following the ten practice decisions, the participant was reminded that the next 30 decisions
would be eligible for bonus compensation.
Participants were rewarded for each investment they chose to invest in that met or
exceeded their bonus threshold and penalized for every investment they undertook that was
below their bonus threshold. Decisions not to invest were neither rewarded nor penalized. Each
participant started with a flat wage of $1.00 and the bonus for each investment correctly taken
was 20% of the flat wage. In other words, participants could “play it safe” and neither gain nor
lose money from their compensation if they did not take any investments.
Following the task the participants estimated their bonus threshold, evaluated their
confidence of their estimate, completed BAS/BIS scales, a post-experimental questionnaire and
then received their final base and bonus compensation amount.
Bonus Threshold Manipulation
The bonus threshold was manipulated between subjects. Managers were randomly
assigned into one of two bonus threshold conditions: low or high. These two levels serve as
proxies for the variation that exists in firms’ incentive plans. The bonus threshold manipulates
the range of values over which a participant would receive positive feedback on a given
investment decision. The low threshold condition (LTC) includes primarily positive stimuli and
the high threshold condition (HTC) includes primarily negative stimuli. Each condition had the
same number of investments that would generate an incentive so total maximum compensation is
equivalent in both conditions.

22
In the low threshold condition (LTC), participants received bonus compensation for any
investment they chose that averaged at least 40% on the four balanced scorecard dimensions. In
the HTC, participants received bonus compensation for any investment they chose that averaged
at least 60% on the four dimensions of the balanced scorecard. In both conditions, if a
participant chose an investment below their threshold, their bonus compensation was deducted
by the same amount as they would have otherwise been compensated had the decision been
correct.
Trial Manipulation
Trials are manipulated within subjects. Each manager completed four periods of trials.
The first period was the practice investment period and the investments were standardized for
every manager. Following the standard practice investments, each manager saw 30 investments
with an equal number of good and bad projects in each condition. In other words, the 30
investment prospects eligible for bonus compensation contained an equal number of “good”
investments and “bad” investments as determined by the manager’s bonus threshold.
Dependent Variable Measurement: Total Bonus Compensation
Performance is measured by the total amount of bonus compensation earned by the
manager. Recall that incentives could only be garnered for investments in good projects-- those
that meet or exceed the manager’s bonus threshold. Although the decision to not invest in a bad
investment is a correct decision, the manager receives no additional compensation for declining
to invest. In this situation, they neither gain nor lose any money from their accounts. This
design is intentional for two reasons: first, the alternative decision (investing in a bad company)
yields a deduction in their account. Given that the participant has no control over whether the
given investment is good or bad, the choice to not invest in a bad investment is economically
23
superior to the choice to invest. Additionally, the conservative decision is optimal for the firm in
the absence of the manager’s knowledge of their bonus threshold. That is, if the participant
chooses projects based on the viability of the project only (not considering the threshold),
investments may serve firm-level goals even if they do not serve self-focused goals. Hence, the
design of the payments predicts differential behavior based on self-focused (firm-driven) goals,
which is the fourth fundamental trait of a narcissist.
Second, given a good investment, a participant receives no deduction if they choose to
not invest. Once again, this is not the optimal solution for the manager but they are
economically equivalent to the expected value had they received a bad investment.8 Given that
each condition contains an equal number of winners and losers (based on the manager’s bonus
threshold), the expected value of the additional incentives is zero if the participant randomly
guesses. Outcome feedback provided after each investment provides information as to the bonus
threshold for the manager.
NPI and Approach/Avoidance Motivation Measurement
Two personality instruments that have been previously used and validated are used to
measure narcissism and approach/avoidance motivation. Prior to completing the task,
participants completed the Narcissistic Personality Inventory (NPI, Raskin and Terry 1988;
Raskin and Hall 1979). The NPI is a 40-item forced choice instrument. The NPI measures
overall narcissistic personality characteristics across seven dimensions-- authority, self-
sufficiency, superiority, entitlement, exhibitionism, exploitativeness, and vanity and is the most
commonly used measure in nonclinical narcissism research (Campbell and Foster 2007).
Following the task participants completed the 20-item approach/avoidance scale (Behavioral
8 The expected value of payout on any given decision= $0.10 (-$0.10) = [$0.20 (-$0.20)*50% winners (losers) + $0.00* 50% winners (losers)] if the participant simply randomly guessed.
24
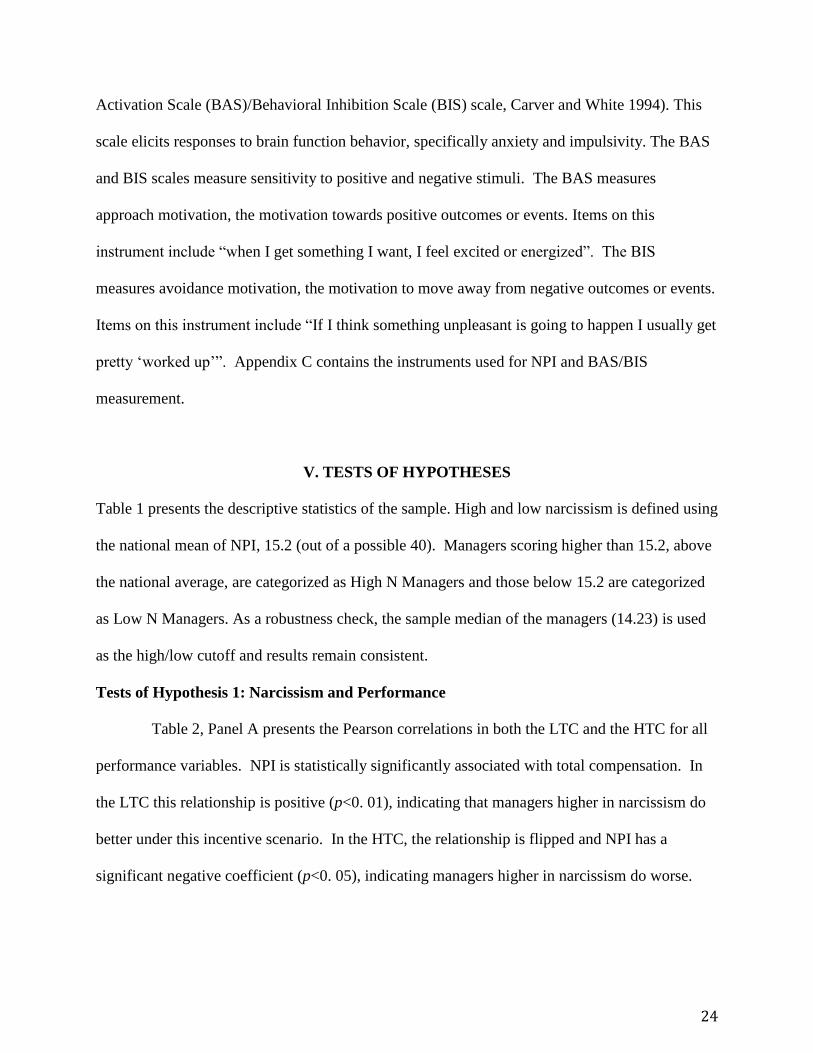
Activation Scale (BAS)/Behavioral Inhibition Scale (BIS) scale, Carver and White 1994). This
scale elicits responses to brain function behavior, specifically anxiety and impulsivity. The BAS
and BIS scales measure sensitivity to positive and negative stimuli. The BAS measures
approach motivation, the motivation towards positive outcomes or events. Items on this
instrument include “when I get something I want, I feel excited or energized”. The BIS
measures avoidance motivation, the motivation to move away from negative outcomes or events.
Items on this instrument include “If I think something unpleasant is going to happen I usually get
pretty ‘worked up’”. Appendix C contains the instruments used for NPI and BAS/BIS
measurement.
V. TESTS OF HYPOTHESES
Table 1 presents the descriptive statistics of the sample. High and low narcissism is defined using
the national mean of NPI, 15.2 (out of a possible 40). Managers scoring higher than 15.2, above
the national average, are categorized as High N Managers and those below 15.2 are categorized
as Low N Managers. As a robustness check, the sample median of the managers (14.23) is used
as the high/low cutoff and results remain consistent.
Tests of Hypothesis 1: Narcissism and Performance
Table 2, Panel A presents the Pearson correlations in both the LTC and the HTC for all
performance variables. NPI is statistically significantly associated with total compensation. In
the LTC this relationship is positive (p<0. 01), indicating that managers higher in narcissism do
better under this incentive scenario. In the HTC, the relationship is flipped and NPI has a
significant negative coefficient (p<0. 05), indicating managers higher in narcissism do worse.

25
Mean bonus compensation in each cell is presented in Table 2, Panel B. As expected by
Hypothesis 1a, High N managers (those individuals who scored higher than the national average
of NPI, 15.2) performed better (188) in the LTC when they were presented with more positive
stimuli than low N managers (156). In contrast, consistent with Hypothesis 1b, High N
managers performed worse in the HTC (165) when they were presented with more negative
stimuli or outcomes than low N managers (193). Figure 1 plots the total compensation for each
condition and the interaction of level of narcissism (Level N) and bonus incentive conditions
(LTC, HTC). The observed performance differences increased in magnitude throughout the four
periods, indicating learning had occurred. Analysis of variance, presented in Table 2, Panel C
confirms a statistically significant interaction between level of narcissism and performance based
on the threshold condition (p=0.01 in the LTC and p=0.03 in the HTC).
Tests of simple effects, presented in Table 2, Panel D show a significant interaction
between level of narcissism and condition (F=12.165, p=0. 001) with no main effect of either
level narcissism (p=0. 96) or condition (p=0.86). Managers with higher levels of narcissism did
significantly better in the LTC, and significantly worse in the HTC providing strong support for
hypotheses H1a and H1b. The non-significant main effects are also as predicted. Neither
independent variable-- level of narcissism nor threshold condition, explain differences in
performance in isolation. The results of hypothesis 1a and 1b indicate that a match of narcissistic
personality and incentive threshold is crucial in producing high levels of decision-making
quality.
Test of Hypothesis 2: Mediational Role of Approach/Avoidance Motivation
Table 3 presents the test of Hypothesis 2. Hypothesis 2 predicts that approach and
avoidance motivation will partially mediate the relationship between narcissism and performance
26
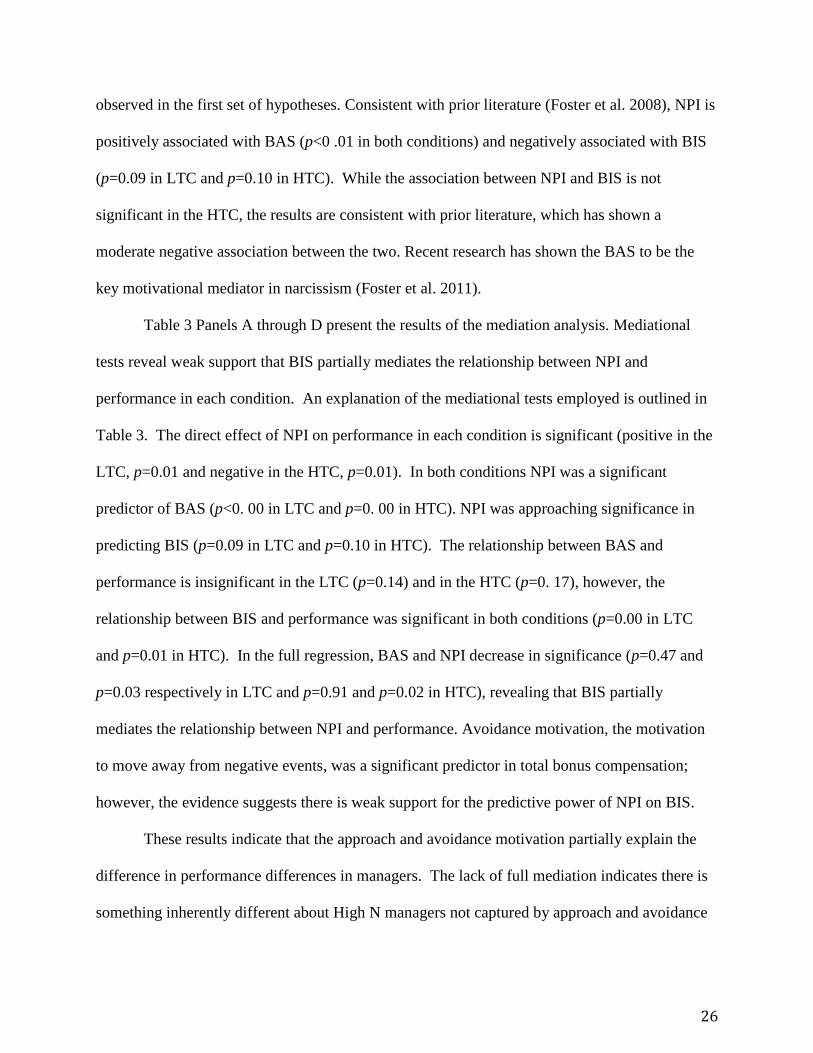
observed in the first set of hypotheses. Consistent with prior literature (Foster et al. 2008), NPI is
positively associated with BAS (p<0 .01 in both conditions) and negatively associated with BIS
(p=0.09 in LTC and p=0.10 in HTC). While the association between NPI and BIS is not
significant in the HTC, the results are consistent with prior literature, which has shown a
moderate negative association between the two. Recent research has shown the BAS to be the
key motivational mediator in narcissism (Foster et al. 2011).
Table 3 Panels A through D present the results of the mediation analysis. Mediational
tests reveal weak support that BIS partially mediates the relationship between NPI and
performance in each condition. An explanation of the mediational tests employed is outlined in
Table 3. The direct effect of NPI on performance in each condition is significant (positive in the
LTC, p=0.01 and negative in the HTC, p=0.01). In both conditions NPI was a significant
predictor of BAS (p<0. 00 in LTC and p=0. 00 in HTC). NPI was approaching significance in
predicting BIS (p=0.09 in LTC and p=0.10 in HTC). The relationship between BAS and
performance is insignificant in the LTC (p=0.14) and in the HTC (p=0. 17), however, the
relationship between BIS and performance was significant in both conditions (p=0.00 in LTC
and p=0.01 in HTC). In the full regression, BAS and NPI decrease in significance (p=0.47 and
p=0.03 respectively in LTC and p=0.91 and p=0.02 in HTC), revealing that BIS partially
mediates the relationship between NPI and performance. Avoidance motivation, the motivation
to move away from negative events, was a significant predictor in total bonus compensation;
however, the evidence suggests there is weak support for the predictive power of NPI on BIS.
These results indicate that the approach and avoidance motivation partially explain the
difference in performance differences in managers. The lack of full mediation indicates there is
something inherently different about High N managers not captured by approach and avoidance
27
motivation that affects performance. Taken together, these results are consistent with research
indicating that NPI is a strong predictor of approach motivation and a moderate predictor of
avoidance motivation and this motivation is related to decision-making performance (Foster and
Brennan 2011).
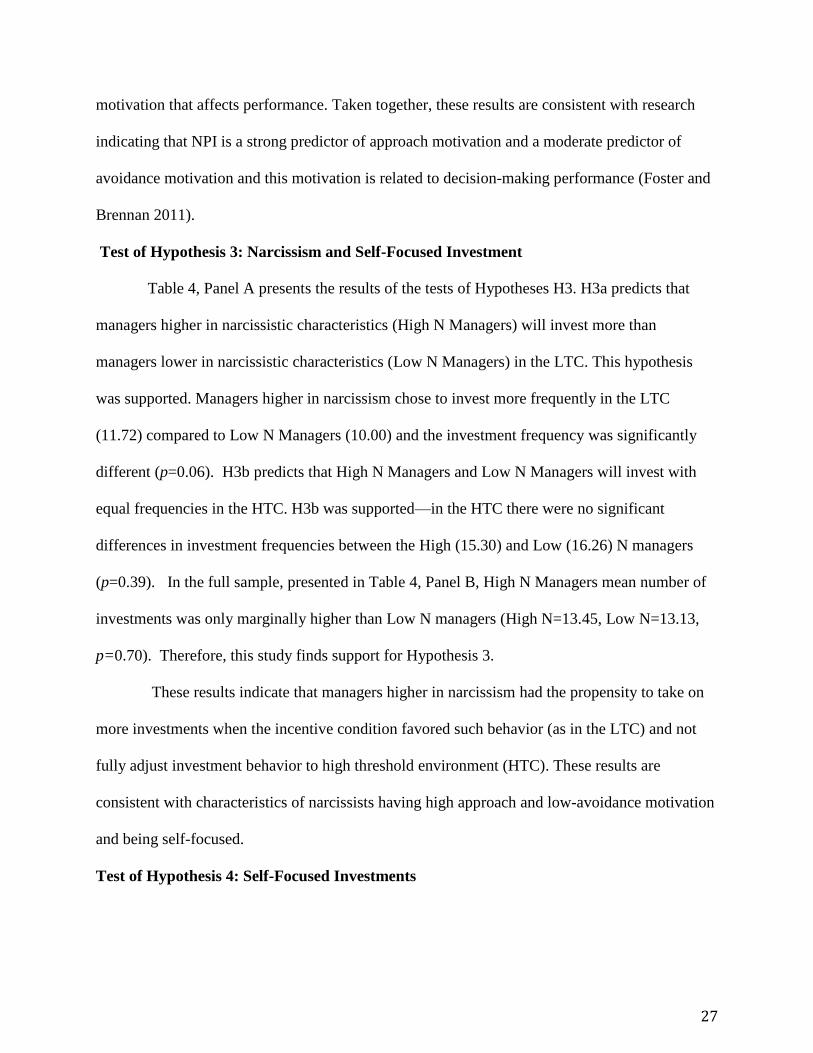
Test of Hypothesis 3: Narcissism and Self-Focused Investment
Table 4, Panel A presents the results of the tests of Hypotheses H3. H3a predicts that
managers higher in narcissistic characteristics (High N Managers) will invest more than
managers lower in narcissistic characteristics (Low N Managers) in the LTC. This hypothesis
was supported. Managers higher in narcissism chose to invest more frequently in the LTC
(11.72) compared to Low N Managers (10.00) and the investment frequency was significantly
different (p=0.06). H3b predicts that High N Managers and Low N Managers will invest with
equal frequencies in the HTC. H3b was supported—in the HTC there were no significant
differences in investment frequencies between the High (15.30) and Low (16.26) N managers
(p=0.39). In the full sample, presented in Table 4, Panel B, High N Managers mean number of
investments was only marginally higher than Low N managers (High N=13.45, Low N=13.13,
p=0.70). Therefore, this study finds support for Hypothesis 3.
These results indicate that managers higher in narcissism had the propensity to take on
more investments when the incentive condition favored such behavior (as in the LTC) and not
fully adjust investment behavior to high threshold environment (HTC). These results are
consistent with characteristics of narcissists having high approach and low-avoidance motivation
and being self-focused.
Test of Hypothesis 4: Self-Focused Investments

28
To test H4, i.e., whether managers were taking more self-focused investments9, a
measure of a participant’s variance in investments based on self-versus-firm-driven incentives is
constructed. To compute this index the following variables are computed as follows:
Self Focused Index=∑ (
)
10
This measure represents an index of each participant’s deviation from their threshold
divided by their deviation from the firm guidance (50%). Smaller indices indicate more deviation
in investments from the firm’s minimal investment criteria. Table 5 reports the firm-driven
variance indices by condition. As predicted, High N managers in the LTC had smaller firm-
driven variance (2.83) compared to Low N Managers in the LTC (2.87). The same trend
occurred in the HTC. High N managers exhibited more self-focused strategies, basing their
variance in investments on their own threshold compared to the firm threshold. High N managers
in the HTC had a variance index of 0.36 compared to Low N managers with an average index of
0.40. These results indicate that the High N managers had more self-focused goals and higher
sensitivity to the positive stimuli, however, neither the HTC nor LTC mean differences in self-
focused index reach statistical significance (HTC: p=0.73, LTC: p=0.96) and hence, H4 is not
supported.
Ruling out Alternative Explanations
One possibility for the aforementioned results is that some other variable(s), highly
correlated with narcissism but distinct from narcissism is (are) driving the performance
differences. For example, if narcissism was highly correlated with intelligence, the NPI
9Self-focused investments proxy for self-focused goals. This operationalization assumes managers will set goals to maximize compensation benefits available to them given their knowledge of their threshold and the investment prospects they evaluate. 10 Variance in investments based on self (firm)-driven incentives. Variance is computed by creating an index of each
participant’s deviation from their threshold divided by their deviation from the firm objective. Smaller indices
indicate more deviation in investments from the firm’s minimal investment criteria.
29
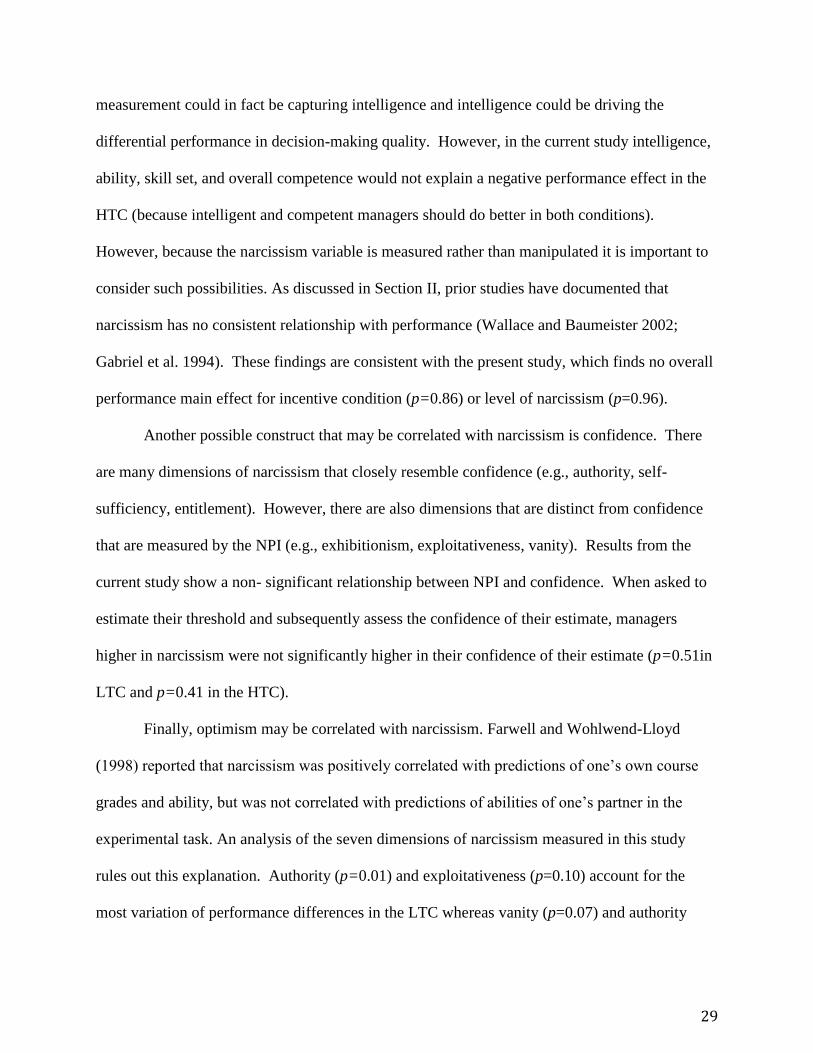
measurement could in fact be capturing intelligence and intelligence could be driving the
differential performance in decision-making quality. However, in the current study intelligence,
ability, skill set, and overall competence would not explain a negative performance effect in the
HTC (because intelligent and competent managers should do better in both conditions).
However, because the narcissism variable is measured rather than manipulated it is important to
consider such possibilities. As discussed in Section II, prior studies have documented that
narcissism has no consistent relationship with performance (Wallace and Baumeister 2002;
Gabriel et al. 1994). These findings are consistent with the present study, which finds no overall
performance main effect for incentive condition (p=0.86) or level of narcissism (p=0.96).
Another possible construct that may be correlated with narcissism is confidence. There
are many dimensions of narcissism that closely resemble confidence (e.g., authority, self-
sufficiency, entitlement). However, there are also dimensions that are distinct from confidence
that are measured by the NPI (e.g., exhibitionism, exploitativeness, vanity). Results from the
current study show a non- significant relationship between NPI and confidence. When asked to
estimate their threshold and subsequently assess the confidence of their estimate, managers
higher in narcissism were not significantly higher in their confidence of their estimate (p=0.51in
LTC and p=0.41 in the HTC).
Finally, optimism may be correlated with narcissism. Farwell and Wohlwend-Lloyd
(1998) reported that narcissism was positively correlated with predictions of one’s own course
grades and ability, but was not correlated with predictions of abilities of one’s partner in the
experimental task. An analysis of the seven dimensions of narcissism measured in this study
rules out this explanation. Authority (p=0.01) and exploitativeness (p=0.10) account for the
most variation of performance differences in the LTC whereas vanity (p=0.07) and authority
30
(p=0.19) account for the most variation of performance differences in the HTC. Hence,
authority, exploitativeness and vanity-- all distinct constructs from optimism have significant
effects on performance in both conditions.
VI. ADDITIONAL ANALYSIS: GENERATIONAL DIFFERENCES
The primary analysis examines only Millennial managers (managers born between 1978
and 1995). To examine whether these results extend to other generations, additional participants
were recruited using MTurks. These managers were born before 1978. While the focus of this
paper is on the implications for MCS design, which must adapt to the entering Millennial
managers, it is important to understand whether these findings transcend generations. Recent
research on generational differences in narcissism and management control attitudes (Dworkis,
Olsen and Young 2012) shows significant differences between generational cohorts.
In a separate analysis, 70 managers who are born before 1978 were recruited. The same
procedures outlined in section IV of this paper were used for these non-Millennial managers.
Table 6 shows the sample statistics for the non-Millennials population. The average age of the
non-millennial sample is 46. The average NPI (mean) is 15.5, which is consistent with national
averages between 15 and 17 (Miller and Campbell 2008; Emmons 1987), and the national
average used in the previous analysis (15.2). Table 7, Panel A shows the correlations of key
variables for the non-millennial sample by incentive condition.
Unlike the millennial sample, there are no significant performance differences in either
incentive condition in the non-millennial sample. While directionally, the correlations and
performance results are consistent (positive relation for LTC, negative for HTC) there are no
significant differences. For comparison, Table 7, Panel B presents the performance for each cell
31
for the non-Millennial managers. Table 7, Panel C presents the analysis of variance for each
condition. Table 7, Panel D presents the tests of simple effects for the non-Millennial sample.
Unlike the Millennial managers, there was no significant interaction effect of incentive condition
and level of narcissism (p=0.64).
Table 8, Panel A presents the means comparison of the three generational cohorts. Panel
B presents the ANOVA results by generation. While Gen X has the highest NPI (16.14),
Millennials report the highest levels of BAS (49.15) and confidence in their estimate (64.49%).
Approach motivation (BAS) is significantly different across generations (Gen X=48.80 and
Boomer=45.29); indicating that reward responsiveness in entering Millennial employees is
heightened compared to the other two generations. Confidence is also significantly different
across generations, with Generation X reporting the lowest levels of self-confidence in their
threshold estimate (45.63%) compared to Boomers (56.10%) and Millennials (64.49%). This
high level of confidence reported by Millennials is not surprising considering the heightened
level of explicit grandiosity anecdotally observed in the workplace (Alsop 2008), a fundamental
trait of narcissists.
Overall, the significant difference of narcissism on performance in the Millennial
generation (p<0.01) but not in the other two generations (p=0.64) indicates that these traits play a
more significant role in the performance of entering managers. Narcissism in Millennials has
significantly stronger interaction effects on performance in managerial decision-making than in
other generational cohorts. Millennial managers have heightened levels of decision-making
biases with respect to their narcissistic personality characteristics, perhaps due to their increased
levels of reward responsiveness.

32
VII. CONCLUSION
This study examines the effects of narcissistic personality characteristics and incentives
on the managerial decision-making performance of Millennial managers. The results indicate
that the interaction of narcissism and incentive threshold has a significant effect on resulting
performance. Managers high in narcissism perform better on a managerial decision task in a low
threshold environment compared to individuals lower in narcissism. Conversely, managers high
in narcissism perform worse on a managerial decision task in a high threshold environment.
Avoidance motivation (BIS) partially mediates the NPI- performance link in both conditions.
These results indicate that personality characteristics affect how various bonus thresholds affect
performance.
In extending the task to older generations, results indicate the interaction of narcissism
and threshold condition on performance is non-significant in Gen X and Boomer generations.
This implies that as narcissism has increased in younger managers, the interaction effect has
become increasingly systematic and significant. The Millennial managers have relatively high
performance on the task and not surprisingly, they show high sensitivity to any positive or
negative outcomes, as exhibited by their BAS and BIS. Millennials are significantly more
confident in their accuracy of their bonus threshold. Such over-confidence can lead to systematic
over-investing or risk taking, as evidenced by prior archival research on over-confident CEO’s
(Malmendier and Tate 2005).
The findings that Millennial managers respond more to agentic self-driven concerns than
to communal or organizational concerns (e.g., taking investments that increase their own bonus
threshold but do not align with the firm’s guidance) indicate that Millennial managers may be
more likely to deviate from MCS. This deviation from MCS is illustrated by a recent survey of
33
Millennial employees, which compares responses to MCS attitude and personality scales across
generations. Millennial employees reported the lowest scores on a measure of control
compliance, a measure that captures an employee’s propensity to embrace MCS tenants such as
authority and goal congruence (Dworkis, Olsen and Young 2012).
The phenomena observed in these studies are not limited to the workforce. A recent
study of university cheating indicates that cheating behavior has increased in recent years and
has become easier to do with tools such as the Internet (Pérez-Peña 2012). This cheating has
become a game to many students, as illustrated by a quote from Donald McCabe, a Rutgers
professor who studies cheating behavior, “There have always been struggling students who cheat
to survive. But more and more, there are students at the top who cheat to thrive”.
The results of this study indicate that there exist systematic differences in motivation and
resulting performance across managers of different generations. Millennial managers report
higher levels of narcissistic personality characteristics and approach-avoidance motivation.
Millennial managers are so sensitive to rewards that they often engage in MCS deviance simply
for the thrill of the potential reward, being insensitive to the potential downside. While many
Millennials were not managers at the time, and therefore did not play a significant role in the
events that lead to the Global Financial Crisis of 2008, the mentality and actions of managers,
leaders and other society figures may have influenced the adolescent and young adult
Millennials. Millennials have been left hungry for the thrill they saw the generations before
them experience in the late 1990’s and early 2000’s as the U.S. economy boomed.
MCS effectiveness and efficiency will ultimately be affected by the systematic shifts in
motivations. As Millennials continue to enter the workplace and climb the corporate ladder,
MCS design must carefully consider the ramifications of the above findings. High N Millennial

34
managers perform better when given a low bonus threshold and when presented with increases in
reward incentives and positive feedback. As NPI has been shown to be increasing over the last
twenty years, it may be beneficial for MCS design to consider adapting to the narcissistic
managers. Implementing controls designed to reward may produce superior accounting and
financial outcomes. The match between personality traits such as narcissism and incentive
thresholds is imperative to consider since the results of this study indicate this match is highly
significant in predicting performance on an investment decision task.
Given the experimental nature of the study, certain limitations exist in generalizing to
overall managerial decision performance. While capital budgeting is a significant task of
management accountants, there are other managerial tasks that may not be influenced by
narcissistic personality traits or where potential motivational biases may be controlled.
Additionally, depending on macro-economic conditions, bonus threshold may not be flexible to
adapting to personality traits of managers. For example, in times of economic expansion,
presenting low bonus thresholds for managers may induce more narcissistic managers to do
better; however, if economic conditions decline, the firm may not be able to sustain these bonus
thresholds. Managers may anchor on these low thresholds and become decreasingly motivated
and hence perform worse when higher thresholds are required. Careful consideration of the
long-term incentive consequences must be considered before implementing these findings into
MCS design.
While the findings strongly indicate the interactive effect of narcissism and incentive
threshold on performance, future research can explore different facets of incentive plans. Given
the approach motivation of higher narcissism managers, flat wage or salary pay may prove to be
an ineffective compensation plan. It may be more effective to pay Millennial managers

35
performance contingent-pay at a higher frequency, so as to maximize their motivation. Future
research can also investigate other personality characteristics’ effects on performance under
different incentive conditions. Narcissism is but one of many stable personality characteristics
that can influence decision-making quality and accounting outcomes. Other stable personality
characteristics such as optimism, self-esteem, and social identity may also influence decision
quality. Finally, future research can explore different types of accounting tasks; for example-
planning, fraud detection and reporting can be investigated to more fully understand the new
Millennial era of management and the Millennial managers’ motivations and resulting
performance.
The current research offers important insights into differential motivations of Millennial
managers and how MCS can adapt to optimize effectiveness and efficiency. Future research on
personality variables or other managerial characteristics offers many future research prospects
examining other relevant accounting outcome variables important in MCS design. After all, “It
is necessary to the sustainability of the workplace to develop future talent and train tomorrow’s
leaders. Tomorrow’s leaders happen to be Millennials” (Schawbel 2011).
36
REFERENCES
Alicke, M.D. and C. Sedikides. 2009. Self-enhancement and self-protection: What they are and
what they do. European Review of Social Psychology, 20: 1-48.
American Psychiatric Association. 2000. Diagnostic and statistical manual of mental disorders
(4th
ed., text rev.) Washington, DC: American Psychiatric Association.
Alsop, R. 2008. The Trophy Kids Grown Up: how the millennial generation is shaking up the
workplace. San Francisco, CA: Wiley.
Amernic, J. H. and R.J. Craig. 2010. Accounting as a Facilitator of Extreme Narcissism. Journal
of Business Ethics, 96 (1): 79-93.
Awasthi, V. and J. Pratt. 1990. The Effects of Monetary Incentives on Effort and Decision
Performance: The Role of Cognitive Characteristics. The Accounting Review, 65 (4): 797-
811.
Bamber, L.S., J.X. Jiang and I.W. Yang. 2010. What’s My Style? The Influence of Top
Managers on Voluntary Corporate Financial Disclosure. The Accounting Review, 85 (4):
1131-1162.
Bandura, A. 1977. Self-efficacy: Toward a unifying theory of behavioral change. Psychological
Review, 84 (2): 191-215.
Baron, R.M. and D.A. Kenny. 1986. The moderator–mediator variable distinction in social
psychological research: Conceptual, strategic, and statistical considerations. Journal of
Personality and Social Psychology, 51 (6): 1173-1182.
Bertrand, M. and A. Schoar. 2003. Managing with style: The effect of managers on firm policies.
The Quarterly Journal of Economics, 118 (4): 1169-1208.
Bonner, S.E., R. Hastie, G. B. Sprinkle and S. M. Young. 2000. A Review of the Effects of
Financial Incentives on Performance in Laboratory Tasks: Implications for Management
Accounting. Journal of Management Accounting Research, 12 (1): 19-64.
Bonner, S.E. and G.B. Sprinkle. 2002. The effects of monetary incentives on effort and task
performance: theories, evidence, and a framework for research. Accounting, Organizations,
and Society, 27 (4-5): 303-345.
Bonner, S.E. 2008. Judgment and decision making in accounting. Upper Saddle, NJ:
Pearson/Prentice Hall.
Bonner, S.E., S. Clor-Proell, L. Koonce, and T. Wang. 2012. Disaggregating Gains and Losses:
The Effects of Sign and Magnitude on Managers’ Reporting Behavior. Working paper.
37
Bosson, J.K. and J.R. Weaver. 2011. “I Love me some me” Examining the Links Between
Narcissism and Self-Esteem. In W.K. Campbell and J.D. Miller (Eds.) The Handbook of
Narcissism and Narcissistic Personality Disorder, Hoboken, NJ: John Wiley &Sons, Inc.
Brown, A.D. 1997. Narcissism, Identity, and Legitimacy. Academy of Management Review, 22
(3): 643-686.
Brown, T., K.M. Rennekamp, N. Seybert and W. Zhu. 2011. Who Stands at the Top and Bottom
of the Slippery Slope? (June 15, 2011). Available at SSRN:
http://ssrn.com/abstract=1810833 or http://dx.doi.org/10.2139/ssrn.1810833.
Buhrmester, M., T. Kwang and S.D. Gosling. 2011. Amazon's Mechanical Turk A New Source
of Inexpensive, Yet High-Quality, Data. Perspectives on Psychological Science, 6 (1) 3-5.
Campbell, W.K., A.B. Brunel and E.J. Finkel. 2006. Narcissism, Interpersonal Self-Regulation,
and Romantic Relationships An Agency Approach Model. In K.D. Vohs and E.J. Finkel
(Eds.) Self and Relationships: Connecting Intrapersonal and Interpersonal Processes. New
York, NY: Guilford.
Campbell, W.K. and J.D. Foster. 2007. The narcissistic self: Background, and extended agency
model, and ongoing controversies. In C. Sedikides and S.J. Spencer (Eds.) The self (pp. 115-
138). New York, NY: Psychology Press.
Campbell, W.K. and J.D. Green. 2008. Narcissism and interpersonal self-regulation. In J.V.
Wood, A. Tesser and J.G. Holmes (Eds.) Self and Relationships. New York, NY:
Psychology Press.
Capron, E.W. 2004. Types of pampering and the narcissistic personality trait. Journal of
Individual Psychology, 60 (1): 77-93.
Carver, C.S. and T.L. White. 1994. Behavioral inhibition, behavioral activation, and affective
responses to impending reward and punishment: The BIS/BAS Scales. Journal of
Personality and Social Psychology, 67 (2): 319-333.
Chaiken, S. and Y. Trope. 1999. Dual Process Theories in Social Psychology. New York, NY:
Guilford.
Chatterjee, A. and D.C. Hambrick. 2007. It's all about me: Narcissistic chief executive officers
and their effects on company strategy and performance. Administrative Science Quarterly,
52(3): 351-386.
Chen, S. and S. Chaiken. 1999. The Heuristic-Systematic Model in Its Broader Context. In S.
Chaiken and Y. Trope (Eds.) Dual Process Theories in Social Psychology. New York, NY:
Guilford.
38
Chenhall, R. and D. Morris. 1991. The effect of cognitive style and sponsorship bias on the
treatment of opportunity costs in resource allocation decisions. Accounting, Organizations,
and Society, 16 (1): 27-46.
Cyert, R.M. and J.G. March. 1963. A Behavioral Theory of the Firm. Englewood Cliffs, NJ:
Prentice-Hall.
Dickman, S.J. 1990. Functional and dysfunctional impulsivity: Personality and cognitive
correlates. Journal of Personality and Social Psychology, 58 (1): 95-102.
Dworkis, K.K., K.J. Olsen and S.M. Young. 2012. Compliance with Management Control
Systems: A Comparative Study of Baby Boomers, Generation X, and Millennials. Working
paper, University of Southern California.
Dyreng, S.D., M. Hanlon and E. Maydew. 2010. The Effects of Executives on Corporate Tax
Avoidance. The Accounting Review, 85 (4): 1163-1189.
Elliot, A.J. and T.M. Thrash. 2002. Approach-avoidance motivation in personality: Approach
and avoidance temperament and goals. Journal of Personality and Social Psychology, 82
(5): 804-818.
Emmons, R.A. 1987. Narcissism: Theory and Measurement. Journal of Personality and Social
Psychology, 52 (1): 11-17.
Fisher, J.G. 1988. Contingency Theory, Management Control Systems and Firm Outcomes: Past
Results and Future Directions. Behavioral Research in Accounting, 10 (S): 46-64.
Foster, J.D. and J.C. Brennan. 2011. Narcissism, The Agency Model, and Approach-Avoidance
Motivation. In W.K. Campbell and J. Miller (Eds.), Handbook of Narcissism and
Narcissistic Personality Disorder: Theoretical Approaches, empirical findings, and
treatment. Hoboken, NJ: Wiley.
Foster, J.D., T.A. Misra and D.E. Reidy. 2009. Narcissists are approach-oriented toward their
money and friends. Journal of Research in Personality, 43: 764-769.
Foster, J.D., J.W. Shenesy and J. Goff. 2009. Why do narcissists take more risks? Testing the
roles of perceived risks and benefits on risky behaviors. Personality and Individual
Differences, 47: 885-889.
Foster, J.D., D.E. Reidy, T.A. Misra and J.S. Goff. 2011. Narcissism and stock market investing:
Correlates and consequences of cocksure investing. Personality and Individual Differences,
50 (6): 816-821.
39
Foster, J.D. and R.F. Trimm, IV. 2008. On being eager and uninhibited: Narcissism and
approach-avoidance motivation. Personality and Social Psychology Bulletin, 34: 1004-
1017.
Gabriel, M. T., J. W. Critelli, and J.S. Ee .1994. Narcissistic illusions in
self-evaluations of intelligence and attractiveness. Journal of Personality,
62: 143–155.
Ge, W., D. Matsumoto and J.L. Zhang. 2010. Do CFO’s have style? An Empirical Investigation
of the Effect of Individual CFO’s on Accounting Practices. Contemporary Accounting
Research, 28 (4): 1141-1179.
Hales, J., J. Hobson and R.J. Resutek. 2012. The Dark Side of Socially Mediated Rewards: How
Narcissism and Social Status Affect Managerial Reporting. Working paper, Georgia
Institute of Technology.
Hambrick, D.C. and P.A. Mason. 1984. Upper Echelons: The Organization as a reflection of Its
Top Managers. The Academy of Management Review, 9 (2): 193-206.
Hayward, M.L.A. and D.C. Hambrick. 1997. Explaining the Premiums Paid for Large
Acquisitions: Evidence of CEO Hubris. Administrative Science Quarterly, 42 (1): 103-127.
Jensen, M.C. and W.H. Meckling. 1976. Theory of the firm: Managerial behavior, agency costs
and ownership style. Journal of Financial Economics, 3 (4): 305-360.
Kahneman, D. and A. Tversky. 1979. Prospect Theory: An Analysis of Decision under Risk.
Econometrica, 47 (2): 263-292.
Kahneman, D. and A. Tversky. 1992. Advances in Prospect Theory: Cumulative Representation
of Uncertainty. Journal of Risk and Uncertainty, 5 (4): 297-323.
Kahneman, D. 2011. Thinking Fast and Slow. New York City, NY: Macmillan.
Kaplan, R.S. and D.P. Norton. 1992. The Balanced Scorecard-Measures That Drive
Performance. Harvard Business Review, 70 (1): 71-79.
Kenny, D.A., D.A. Kashy and N. Bolger. 1998. Data Analysis in Social Psychology. In D.
Gilbert, S. Fiske, and G. Lindzey (Eds.) Handbook of Social Psychology (4th
ed., pp: 259-
265). New York, NY: McGraw-Hill.
Kets de Vries, M.F.R. and D. Miller. 1985. Narcissism and Leadership: An Object Relations
Perspective. Human Relations, 38 (6): 583-601.
Kida, T.E., K.K. Moreno and J.F. Smith. 2001. The Influence of Affect on Manager’s Capital
Budgeting Decisions. Contemporary Accounting Research, 18 (3): 477-494.
40
Kohut, H. 1977. The restoration of the self. New York, NY: International Universities Press.
Koonce, L., J.S. Miller and J. Winchel. 2012. Norms and Derivative Use (June 26, 2012).
Available at SSRN: http://ssrn.com/abstract=2094589.
Lakey, C.E., P. Rose, W.K. Campbell and A.S. Goodie. 2008. Probing the link between
narcissism and gambling: The mediating role of judgment and decision-making biases.
Journal of Behavioral Decision Making, 21(2): 113-137.
Lauriola, M. and I.P. Levin. 2001. Personality traits and risky decision-making in a controlled
experimental task: an exploratory study. Personality and Individual Differences, 31 (2):
215-226.
Locke, E.A., K.N. Shaw, L.M. Saari and G.P. Latham. 1981. Goal Setting and Task
Performance: 1969-1980. Psychological Bulletin, 90 (1): 125-152.
Locke, E.A. and G.P. Latham. 1990. A theory of goal setting & task performance. Edgewood
Cliffs, NJ: Prentice Hall.
Luft, J. and M. D. Shields. 2011. Psychology Models of Management Accounting. Hanover, MA:
Now Publishers.
Malmendier, U. and G. Tate. 2005. CEO Over-confidence and Corporate Investment. The
Journal of Finance, 60 (6): 2661-2700.
March, J.G. and H.A. Simon. 1958. Organizations. Oxford, England: Wiley.
Mason, W. and D.J. Watts. 2010. Financial Incentives and the “performance of crowds”. ACM
SIGKDD Explorations Newsletter, 11 (2): 100-108.
Merchant, K.A. and D.T. Otley. 2007. A Review of the Literature on Control and Accountability.
In Chapman, C.S., A.G. Hopwood and M.D. Shields (Eds.) Handbook of Management
Accounting Research. Oxford, UK: Elsevier.
Miller, J.D. and W.K. Campbell. 2008. Comparing Clinical and Social-Personality
Conceptualizations of Narcissism. Journal of Personality, 76 (3): 449-476.
Miller, J.D., W.K. Campbell, D.L. Young, C.E. Lakey, D.E. Reidy, A. Zeichner and A.S.
Goodie. 2009. Examining the relations among narcissism, impulsivity, and self-defeating
behaviors. Journal of Personality, 77: 761-794.
Millon, T., C.M. Millon, S. Meagher, S. Grossman and R. Romnath. 2004. Personality Disorders
in Modern Life. Hoboken, NJ: John Wiley & Sons, Inc.
Moreno, K., T. Kida and J.F. Smith. 2002. The Impact of Affective Reactions on Risky Decision
Making in Accounting Contexts. Journal of Accounting Research, 40 (5): 1331-1349.
41
Morf, C.C., C. Weir and M. Davidov. 2000. Narcissism and intrinsic motivation: The role of
goal congruence. Journal of Experimental Social Psychology, 36 (4): 424-438.
Morf, C.C. and F. Rhodewalt. 2001. Unraveling the paradoxes of narcissism: A dynamic self-
regulatory processing model. Psychological Inquiry, 12: 177-196.
Morf, C.C. 2006. Personality reflected in a coherent idiosyncratic interplay of intra- and
interpersonal self-regulatory processes. Journal of Personality, 74 (6): 1527-1556.
Olsen, K.J., S.M. Young and K.K. Dworkis. 2012. CEO Narcissism and Accounting: A Picture
of Profits. Working paper, University of Southern California.
Paolacci, G., J. Chandler and P.G. Ipierotis. 2010. Running Experiments on Amazon Mechanical
Turk. Judgment and Decision Making, 5 (5): 411-419.
Pérez-Peña, R. 2012. Studies Find More Students Cheating, With High Achievers No Exception.
The New York Times, September 7. Available at:
http://www.nytimes.com/2012/09/08/education/studies-show-more-students-cheat-even-
high-achievers.html?_r=2&adxnnl=1&ref=education&adxnnlx=1347282516-
2q9+JX4OlkZhaSY6fezc7g.
Pinksy, D. and S.M. Young. 2009. The Mirror Effect. New York, NY: HarperCollins.
Raskin, R. and C.S. Hall. 1979. A narcissistic personality inventory. Psychological Reports, 45:
590-590.
Raskin, R. and H. Terry. 1988. A principal-components analysis of the Narcissistic Personality
Inventory and further evidence of its construct validity. Journal of Personality and Social
Psychology, 54 (5): 890-902.
Rennekamp, K.M. 2012. Processing Fluency and Investors’ Reaction to Disclosure Readability.
Journal of Accounting Research, forthcoming.
Reeves, T. and J. Woodward. 1970. The study of managerial control. In J. Woodward (Ed.)
Industrial Organizations: Behavior and Control. London, UK: Oxford University Press.
Rhodewalt, F. and S.K. Eddings. 2002. Narcissus reflects: Memory distortion in response to ego-
relevant feedback among high and low-narcissistic men. Journal of Research in Personality,
36 (2): 97-116.
Sawers, K. M. 2005. Evidence of Choice Avoidance in Capital-Investment Judgments.
Contemporary Accounting Research, 22 (4): 1063-1092.

42
Schawbel, D. 2011. The Expanding Role of Millennials in the Workplace. Forbes, December 13.
Available at: http://www.forbes.com/sites/danschawbel/2011/12/13/the-expanding-roles-of-
millennials-in-the-workplace/.
Schrand, C.M. and S.L.C. Zechman. 2011. Executive overconfidence and the slippery slope to
financial misreporting. Journal of Accounting and Economics, 53 (1-2): 311-329.
Smillie, L.D., L.I. Dalgleish and C.J. Jackson. 2007. Distinguishing Between Learning and
Motivation in Behavioral Tests of the Reinforcement Sensitivity Theory of Personality.
Personality and Social Psychology Bulletin, 33 (4): 476-489.
Sprinkle, G.B. 2000. The Effect of Incentive Contracts on Learning and Performance. The
Accounting Review, 75 (3): 299-326.
Sprinkle, G.B. and M.G. Williamson. 2006. Experimental Research in Managerial Accounting.
In C.S. Chapman, A.G. Hopwood and M.D. Shields (Eds.) Handbooks of Management
Accounting Research, 1: 415-444.
Thaler, R.H. and C.R. Sunstein. 2008. Nudge: Improving Decisions about Health, Wealth, and
Happiness. Yale University Press.
Twenge, J.M. and W.K. Campbell. 2008. Increases in Positive Self-Views Among High School
Students Birth-Cohort Changes in Anticipated Performance, Self-Satisfaction, Self-Liking,
and Self-Competence. Psychological Science, 19 (11): 1082-1086.
Vera-Muñoz, S.C. 1998. The Effects of Accounting Knowledge and Context on the Omission of
Opportunity Costs in Resource Allocation Decisions. The Accounting Review, 73 (1): 47-72.
Vroom, V.H. 1964. Work and Motivation. Oxford, England: Wiley.
Wallace, H.M. and Baumeister, R.F. 2002. The Performance of Narcissists Rises and Falls with
Perceived Opportunity for Glory. Journal of Personality and Social Psychology, 82 (5):
819-834.
Wallace, H.M. 2011. Narcissistic Self-Enhancement. In W.K. Campbell and J. Miller (Eds.),
Handbook of Narcissism and Narcissistic Personality Disorder: Theoretical Approaches,
empirical findings, and treatment. Hoboken, NJ: Wiley.
Young, S.M. and D. Pinsky. 2006. Narcissism and celebrity. Journal of Research in Personality.
40 (5): 463-471.
Zeigler-Hill, V. and Jordan, C.H. 2011. Behind the mask: Narcissism and implicit self-esteem. In
W.K. Campbell and J. Miller (Eds.), Handbook of Narcissism and Narcissistic Personality
Disorder: Theoretical Approaches, empirical findings, and treatment. Hoboken, NJ: Wiley.
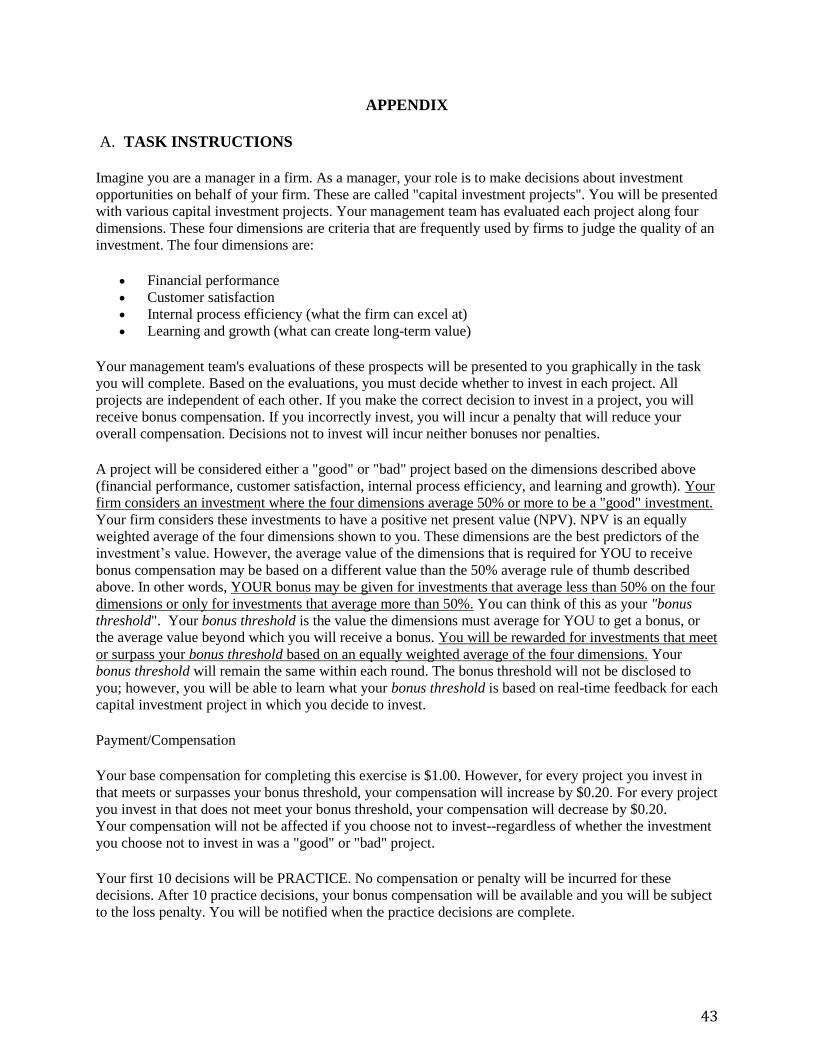
43
APPENDIX
A. TASK INSTRUCTIONS
Imagine you are a manager in a firm. As a manager, your role is to make decisions about investment
opportunities on behalf of your firm. These are called "capital investment projects". You will be presented
with various capital investment projects. Your management team has evaluated each project along four
dimensions. These four dimensions are criteria that are frequently used by firms to judge the quality of an
investment. The four dimensions are:
Financial performance
Customer satisfaction
Internal process efficiency (what the firm can excel at)
Learning and growth (what can create long-term value)
Your management team's evaluations of these prospects will be presented to you graphically in the task
you will complete. Based on the evaluations, you must decide whether to invest in each project. All
projects are independent of each other. If you make the correct decision to invest in a project, you will
receive bonus compensation. If you incorrectly invest, you will incur a penalty that will reduce your
overall compensation. Decisions not to invest will incur neither bonuses nor penalties.
A project will be considered either a "good" or "bad" project based on the dimensions described above
(financial performance, customer satisfaction, internal process efficiency, and learning and growth). Your
firm considers an investment where the four dimensions average 50% or more to be a "good" investment.
Your firm considers these investments to have a positive net present value (NPV). NPV is an equally
weighted average of the four dimensions shown to you. These dimensions are the best predictors of the
investment’s value. However, the average value of the dimensions that is required for YOU to receive
bonus compensation may be based on a different value than the 50% average rule of thumb described
above. In other words, YOUR bonus may be given for investments that average less than 50% on the four
dimensions or only for investments that average more than 50%. You can think of this as your "bonus
threshold". Your bonus threshold is the value the dimensions must average for YOU to get a bonus, or
the average value beyond which you will receive a bonus. You will be rewarded for investments that meet
or surpass your bonus threshold based on an equally weighted average of the four dimensions. Your
bonus threshold will remain the same within each round. The bonus threshold will not be disclosed to
you; however, you will be able to learn what your bonus threshold is based on real-time feedback for each
capital investment project in which you decide to invest.
Payment/Compensation
Your base compensation for completing this exercise is $1.00. However, for every project you invest in
that meets or surpasses your bonus threshold, your compensation will increase by $0.20. For every project
you invest in that does not meet your bonus threshold, your compensation will decrease by $0.20.
Your compensation will not be affected if you choose not to invest--regardless of whether the investment
you choose not to invest in was a "good" or "bad" project.
Your first 10 decisions will be PRACTICE. No compensation or penalty will be incurred for these
decisions. After 10 practice decisions, your bonus compensation will be available and you will be subject
to the loss penalty. You will be notified when the practice decisions are complete.

44
B. EXAMPLE INVESTMENT PROSPECT/DECISION
C. PERSONALITY INSTRUMENTS
BIS/BAS Scales
Please indicate your answer on a scale from 1-strongly disagree to 4-strongly agree in the
blank following each statement
Example: I love accounting class ____4_______
BIS
1) If I think something unpleasant is going to happen I usually get pretty “worked up”
__________
2) I worry about making mistakes __________
3) Criticism or scolding hurts me quite a bit __________
4) I feel pretty worried or upset when I think or know somebody is angry at me __________
5) Even if something bad is about to happen to me, I rarely experience fear or nervousness
__________
6) I feel worried when I think I have done poorly at something __________
7) I have very few fears compared to my friends __________
BAS Reward Responsiveness
8) When I get something I want, I feel excited or energized __________
9) When I’m doing well at something, I love to keep at it __________
10) When good things happen to me, it affects me strongly __________
11) It would excite me to win a contest __________
12) When I see an opportunity for something I like, I get excited right away __________
BAS Drive
13) When I want something, I usually go all-out to get it __________
14) I go out of my way to get things I want __________
15) If I see a chance to get something I want, I move on it right away __________
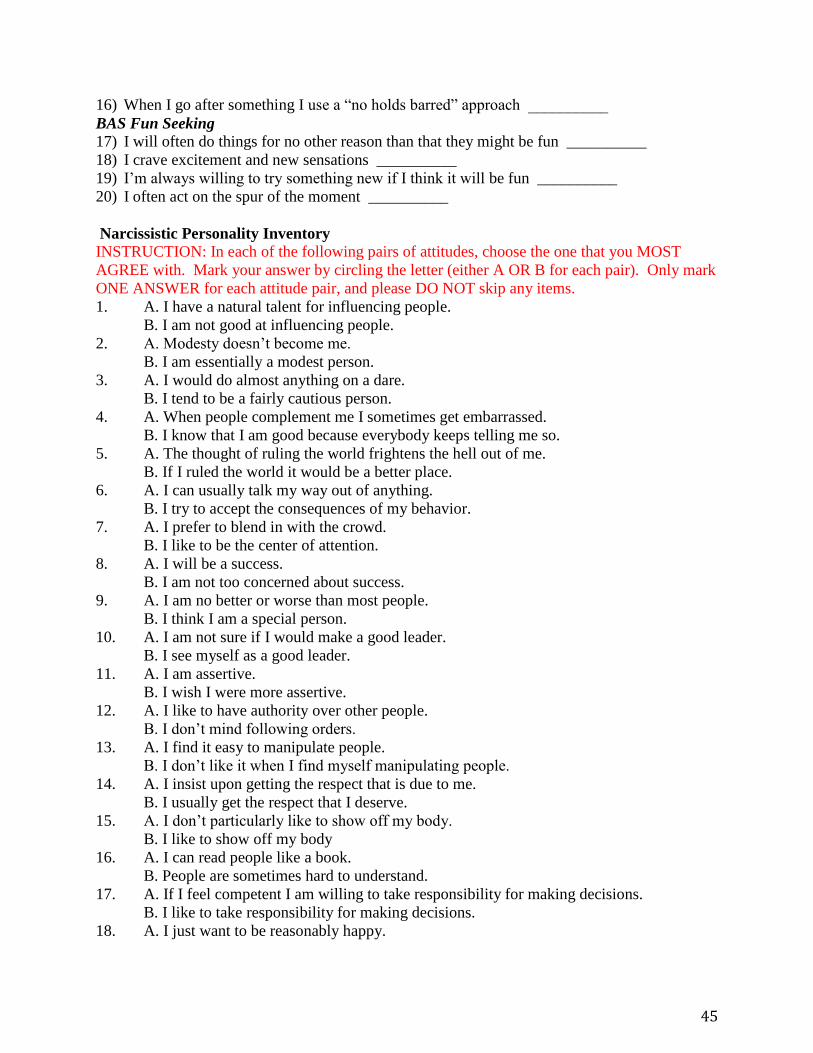
45
16) When I go after something I use a “no holds barred” approach __________
BAS Fun Seeking
17) I will often do things for no other reason than that they might be fun __________
18) I crave excitement and new sensations __________
19) I’m always willing to try something new if I think it will be fun __________
20) I often act on the spur of the moment __________
Narcissistic Personality Inventory
INSTRUCTION: In each of the following pairs of attitudes, choose the one that you MOST
AGREE with. Mark your answer by circling the letter (either A OR B for each pair). Only mark
ONE ANSWER for each attitude pair, and please DO NOT skip any items.
1. A. I have a natural talent for influencing people.
B. I am not good at influencing people.
2. A. Modesty doesn’t become me.
B. I am essentially a modest person.
3. A. I would do almost anything on a dare.
B. I tend to be a fairly cautious person.
4. A. When people complement me I sometimes get embarrassed.
B. I know that I am good because everybody keeps telling me so.
5. A. The thought of ruling the world frightens the hell out of me.
B. If I ruled the world it would be a better place.
6. A. I can usually talk my way out of anything.
B. I try to accept the consequences of my behavior.
7. A. I prefer to blend in with the crowd.
B. I like to be the center of attention.
8. A. I will be a success.
B. I am not too concerned about success.
9. A. I am no better or worse than most people.
B. I think I am a special person.
10. A. I am not sure if I would make a good leader.
B. I see myself as a good leader.
11. A. I am assertive.
B. I wish I were more assertive.
12. A. I like to have authority over other people.
B. I don’t mind following orders.
13. A. I find it easy to manipulate people.
B. I don’t like it when I find myself manipulating people.
14. A. I insist upon getting the respect that is due to me.
B. I usually get the respect that I deserve.
15. A. I don’t particularly like to show off my body.
B. I like to show off my body
16. A. I can read people like a book.
B. People are sometimes hard to understand.
17. A. If I feel competent I am willing to take responsibility for making decisions.
B. I like to take responsibility for making decisions.
18. A. I just want to be reasonably happy.

46
B. I want to amount to something in the eyes of the world.
19. A. My body is nothing special.
B. I like to look at my body.
20. A. I try not to be a show off.
B. I will usually show off if I get the chance.
21. A. I always know what I am doing.
B. Sometimes I am not sure of what I am doing.
22. A. I sometimes depend on people to get things done.
B. I rarely depend on anyone else to get things done.
23. A. Sometimes I tell good stories.
B. Everybody likes to hear my stories.
24. A. I expect a great deal from other people.
B. I like to do things for other people.
25. A. I will never be satisfied until I get all that I deserve.
B. I take my satisfactions as they come
26. A. Compliments embarrass me.
B. I like to be complemented.
27. A. I have a strong will to power.
B. Power for its own sake doesn’t interest me.
28. A. I don’t care about new fads and fashions.
B. I like to start new fads and fashions.
29. A. I like to look at myself in the mirror.
B. I am not particularly interested in looking at myself in the mirror.
30. A. I really like to be the center of attention.
B. It makes me uncomfortable to be the center of attention.
31. A. I can live my life in any way I want to.
B. People can’t always live their lives in terms of what they want.
32. A. Being an authority doesn’t mean that much to me.
B. People always seem to recognize my authority.
33. A. I would prefer to be a leader.
B. It makes little difference to me whether I am a leader or not.
34. A. I am going to be a great person.
B. I hope I am going to be successful.
35. A. People sometimes believe what I tell them.
B. I can make anybody believe anything I want them to.
36. A. I am a born leader.
B. Leadership is a quality that takes a long time to develop.
37. A. I wish somebody would someday write my biography.
B. I don’t like people to pry into my life for any reason.
38. A. I get upset when people don’t notice how I look when I go out in public.
B. I don’t mind blending into the crowd when I go out in public.
39. A. I am more capable than other people.
B. There is a lot that I can learn from other people.
40. A. I am much like everybody else.
B. I am an extraordinary person.
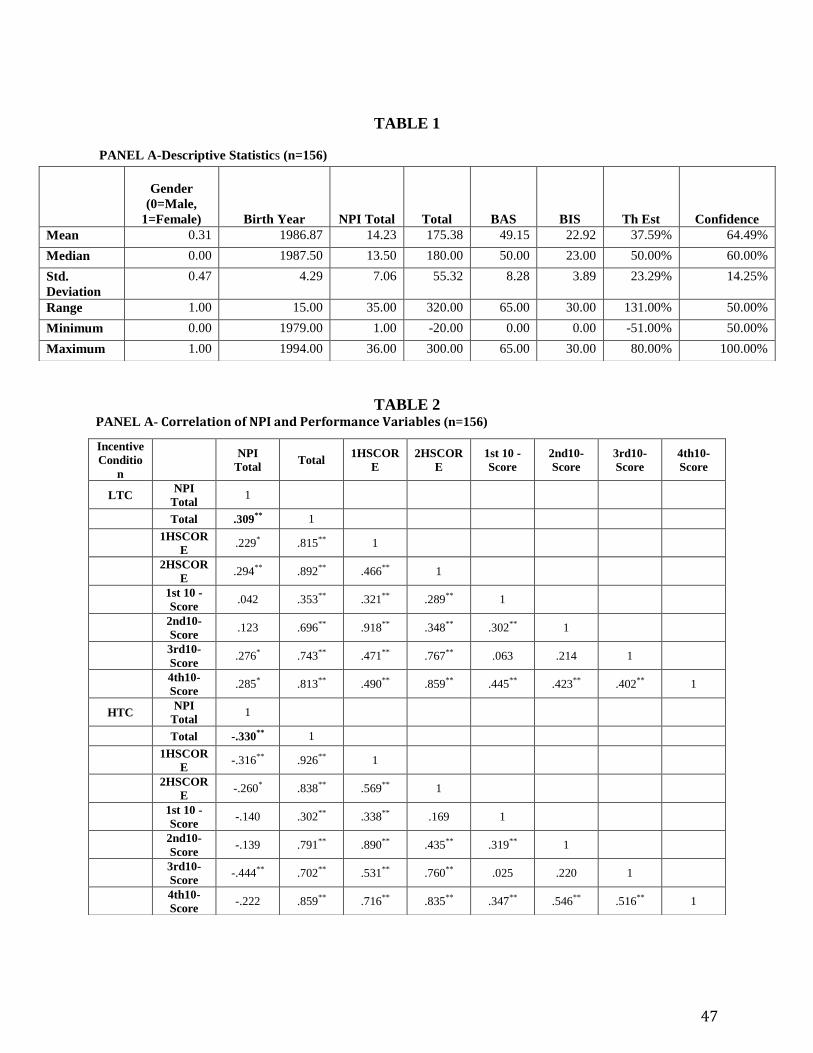
47
TABLE 1
PANEL A-Descriptive Statistics (n=156)
TABLE 2 PANEL A- Correlation of NPI and Performance Variables (n=156)
Gender
(0=Male,
1=Female) Birth Year NPI Total Total BAS BIS Th Est Confidence
Mean 0.31 1986.87 14.23 175.38 49.15 22.92 37.59% 64.49%
Median 0.00 1987.50 13.50 180.00 50.00 23.00 50.00% 60.00%
Std.
Deviation
0.47 4.29 7.06 55.32 8.28 3.89 23.29% 14.25%
Range 1.00 15.00 35.00 320.00 65.00 30.00 131.00% 50.00%
Minimum 0.00 1979.00 1.00 -20.00 0.00 0.00 -51.00% 50.00%
Maximum 1.00 1994.00 36.00 300.00 65.00 30.00 80.00% 100.00%
Incentive
Conditio
n
NPI
Total Total
1HSCOR
E
2HSCOR
E
1st 10 -
Score
2nd10-
Score
3rd10-
Score
4th10-
Score
LTC NPI
Total 1
Total .309** 1
1HSCOR
E .229* .815** 1
2HSCOR
E .294** .892** .466** 1
1st 10 -
Score .042 .353** .321** .289** 1
2nd10-
Score .123 .696** .918** .348** .302** 1
3rd10-
Score .276* .743** .471** .767** .063 .214 1
4th10-
Score .285* .813** .490** .859** .445** .423** .402** 1
HTC NPI
Total 1
Total -.330** 1
1HSCOR
E -.316** .926** 1
2HSCOR
E -.260* .838** .569** 1
1st 10 -
Score -.140 .302** .338** .169 1
2nd10-
Score -.139 .791** .890** .435** .319** 1
3rd10-
Score -.444** .702** .531** .760** .025 .220 1
4th10-
Score -.222 .859** .716** .835** .347** .546** .516** 1

48
PANEL B- Mean Performance by Condition (n=156)
Level N
High Low
Threshold
Condition
High 165 193* H1b Supported
Low 188** 156 H1a Supported
*indicates difference between groups is significant at the p<0.05 level
**indicates difference between groups is significant at the p<0.01 level
PANEL C- ANOVA Results by Incentive Condition and Level N (n=156)
Incentive
Condition
Sum of
Squares df Mean Square F Sig.
LTC Total *
LEVELN
19961.032 1 19961.032 7.095 .01**
216636.436 77 2813.460
236597.468 78
HTC Total *
LEVELN
14899.589 1 14899.589 5.174 .03**
215967.943 75 2879.573
230867.532 76
PANEL D-Simple Effects Test (n=156)
Source
Type III Sum
of Squares df Mean Square F Sig.
Incentive Condition 1826.431 1 1826.431 0.053 0.86
LEVELN 138.747 1 138.747 0.004 0.96
Incentive Condition * LEVELN 34623.452 1 34623.452 12.165 0.001**
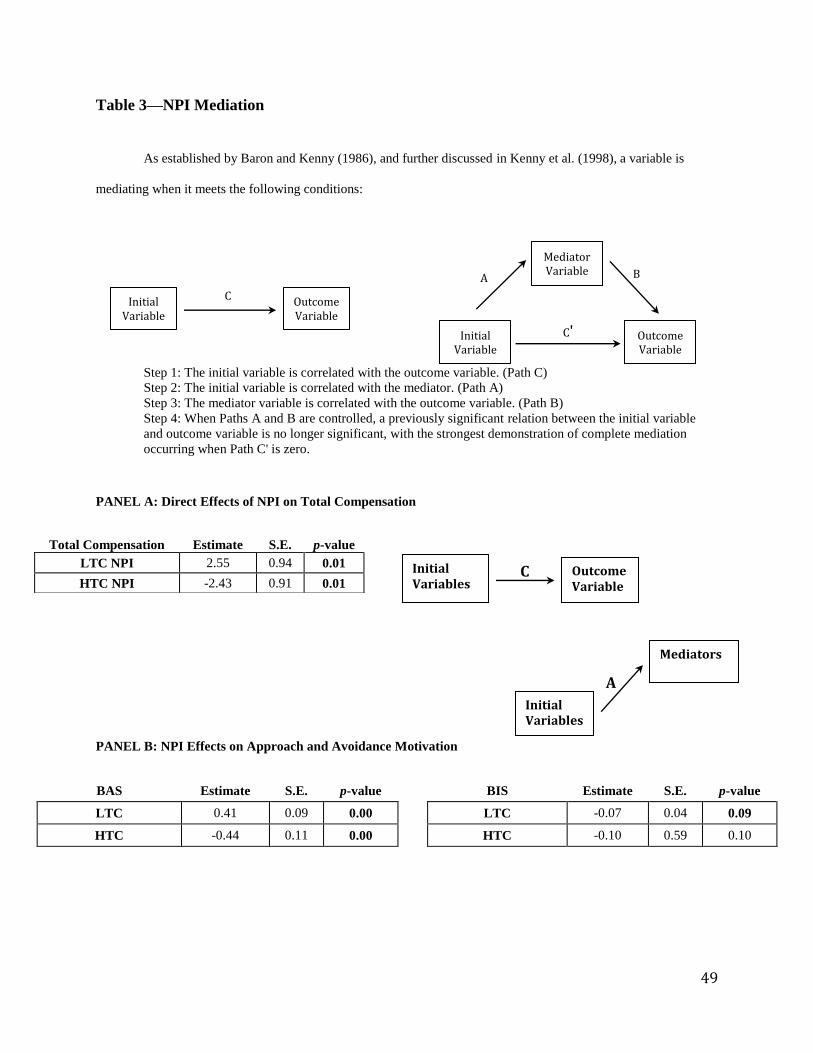
49
Initial Variable
Outcome Variable
C
Initial Variable
Outcome Variable
C'
Mediator Variable
A B
Table 3—NPI Mediation
As established by Baron and Kenny (1986), and further discussed in Kenny et al. (1998), a variable is
mediating when it meets the following conditions:
Step 1: The initial variable is correlated with the outcome variable. (Path C)
Step 2: The initial variable is correlated with the mediator. (Path A)
Step 3: The mediator variable is correlated with the outcome variable. (Path B)
Step 4: When Paths A and B are controlled, a previously significant relation between the initial variable
and outcome variable is no longer significant, with the strongest demonstration of complete mediation
occurring when Path C' is zero.
PANEL A: Direct Effects of NPI on Total Compensation
PANEL B: NPI Effects on Approach and Avoidance Motivation
Total Compensation Estimate S.E. p-value
LTC NPI 2.55 0.94 0.01
HTC NPI -2.43 0.91 0.01
BAS Estimate S.E. p-value BIS Estimate S.E. p-value
LTC 0.41 0.09 0.00 LTC -0.07 0.04 0.09
HTC -0.44 0.11 0.00 HTC -0.10 0.59 0.10
Initial Variables
Mediators
A
Initial Variables
Outcome Variable
C
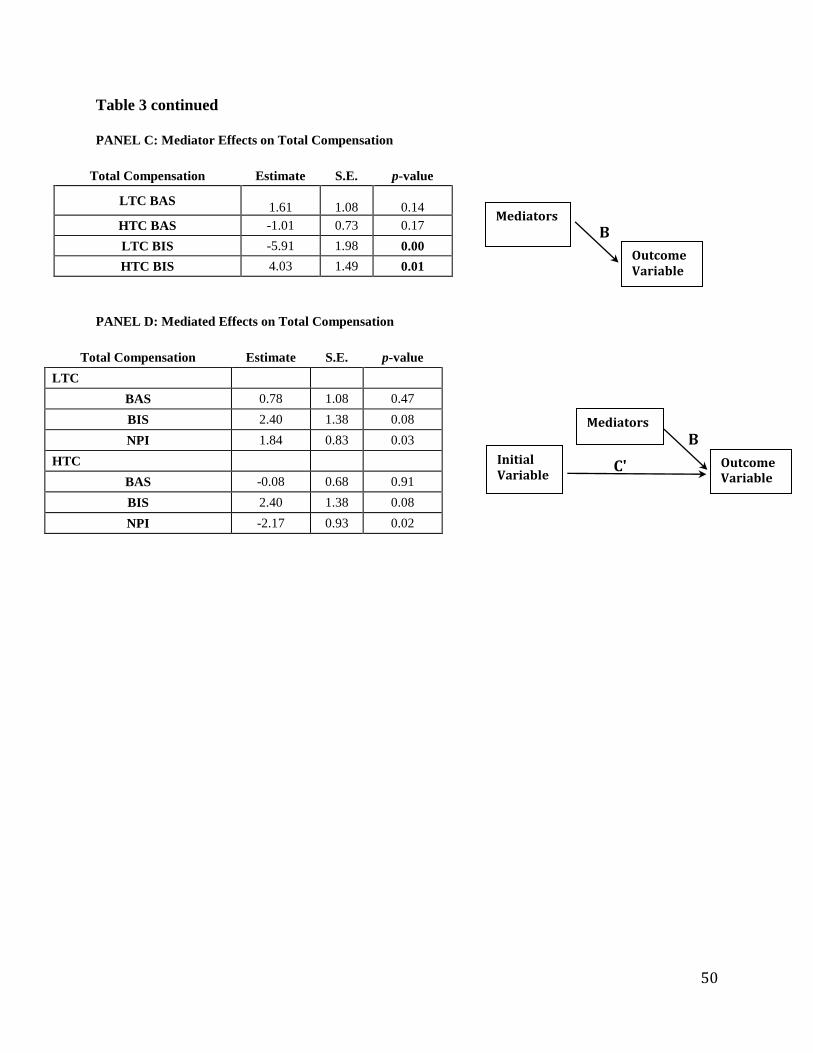
50
Table 3 continued
PANEL C: Mediator Effects on Total Compensation
Total Compensation Estimate S.E. p-value
LTC BAS 1.61 1.08 0.14
HTC BAS -1.01 0.73 0.17
LTC BIS -5.91 1.98 0.00
HTC BIS 4.03 1.49 0.01
PANEL D: Mediated Effects on Total Compensation
Total Compensation Estimate S.E. p-value
LTC
BAS 0.78 1.08 0.47
BIS 2.40 1.38 0.08
NPI 1.84 0.83 0.03
HTC
BAS -0.08 0.68 0.91
BIS 2.40 1.38 0.08
NPI -2.17 0.93 0.02
Outcome Variable
Mediators
B
Initial Variables
C' Outcome Variable
Mediators
B

51
TABLE 4 PANEL A-Investments and Percent Correct Investments by Condition (n=156)
PANEL B-Mean Investments by Level N (n=156)
LEVELN #Invest Sig.
LON 13.13
HIN 13.45 0.70
TABLE 5
Firm Focused Index by Incentive Condition (n=156)
Incentive Condition LEVELN #Invest Sig.
LTC
LO N
Mean 10.00
N 47
Std. Deviation 4.56
HI N
Mean 11.72 0.06*
N 32
Std. Deviation 2.83
HTC
LO N
Mean 16.26
N 47
Std. Deviation 3.65
HI N
Mean 15.30 0.39
N 30
Std. Deviation 6.06
Incentive Condition LEVELNSAMPLE Mean N Std. Deviation Significance
LTC
LO N 2.87 36 .92
HI N 2.83 41 .47
Total 2.85 77 .71 0.96
HTC
LO N 0.39 40 .14
HI N 0.36 37 .20
Total 0.38 77 .17 0.73
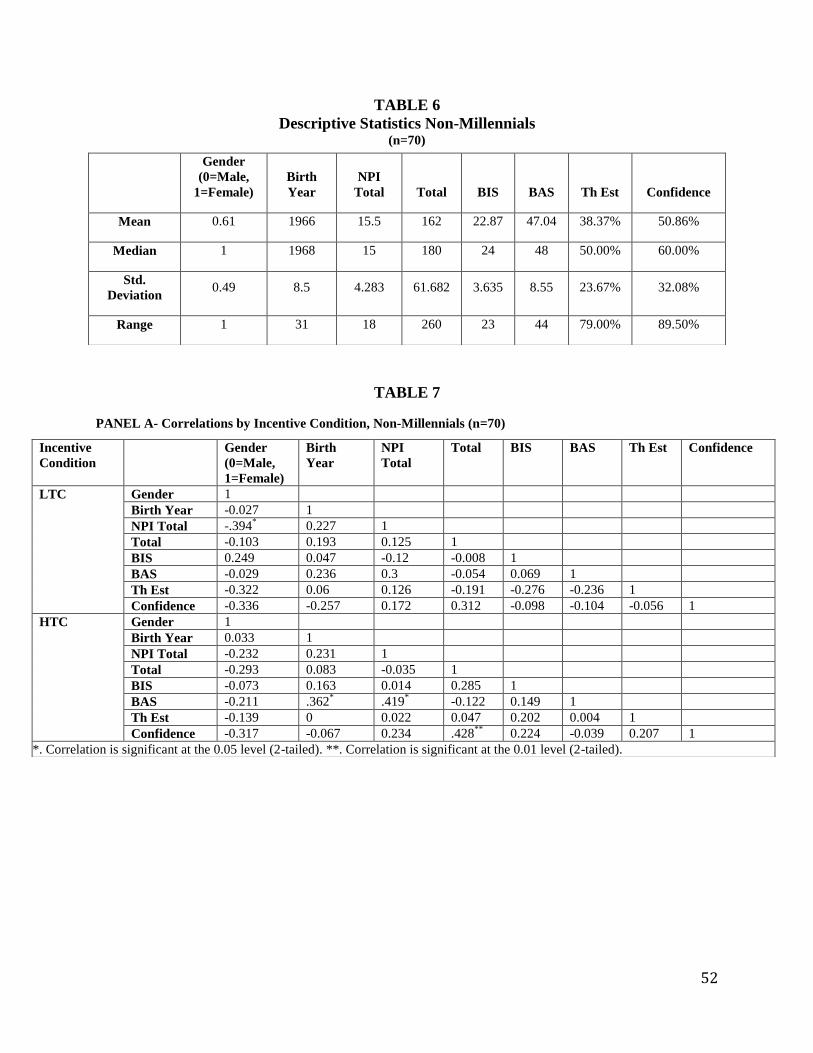
52
TABLE 6
Descriptive Statistics Non-Millennials (n=70)
TABLE 7
PANEL A- Correlations by Incentive Condition, Non-Millennials (n=70)
Gender
(0=Male,
1=Female)
Birth
Year
NPI
Total Total BIS BAS Th Est Confidence
Mean 0.61 1966 15.5 162 22.87 47.04 38.37% 50.86%
Median 1 1968 15 180 24 48 50.00% 60.00%
Std.
Deviation 0.49 8.5 4.283 61.682 3.635 8.55 23.67% 32.08%
Range 1 31 18 260 23 44 79.00% 89.50%
Incentive
Condition
Gender
(0=Male,
1=Female)
Birth
Year
NPI
Total
Total BIS BAS Th Est Confidence
LTC Gender 1
Birth Year -0.027 1
NPI Total -.394* 0.227 1
Total -0.103 0.193 0.125 1
BIS 0.249 0.047 -0.12 -0.008 1
BAS -0.029 0.236 0.3 -0.054 0.069 1
Th Est -0.322 0.06 0.126 -0.191 -0.276 -0.236 1
Confidence -0.336 -0.257 0.172 0.312 -0.098 -0.104 -0.056 1
HTC Gender 1
Birth Year 0.033 1
NPI Total -0.232 0.231 1
Total -0.293 0.083 -0.035 1
BIS -0.073 0.163 0.014 0.285 1
BAS -0.211 .362* .419
* -0.122 0.149 1
Th Est -0.139 0 0.022 0.047 0.202 0.004 1
Confidence -0.317 -0.067 0.234 .428**
0.224 -0.039 0.207 1
*. Correlation is significant at the 0.05 level (2-tailed). **. Correlation is significant at the 0.01 level (2-tailed).

53
PANEL B- Mean Performance by Condition, Non-Millennials (n=70)
Level N
High Low
Threshold
Condition
High 168 179
Low 150 147
PANEL C- ANOVA Results by Incentive Condition and Level N, Non-Millennials (n=70)
Incentive
Condition
Sum of
Squares df Mean Square F Sig.
LTC Total *
LEVELN
88.275 1 86.275 0.021 .886
131266.667 32 4102.083
131352.941 33
HTC Total *
LEVELN
1067.937 1 1067.937 0.306 .584
118620.952 34 3488.852
119688.889 35
PANEL D- Tests of Simple Effects Non-Millennial Sample (n=70)
Source F Sig.
LEVEL N .065 .800
Incentive Condition 2.758 .102
LEVEL N * Incentive Condition .225 .637
TABLE 8
Generational Differences PANEL A-Means by Generation
GENERATION Total NPI
Total
Th Est Confidence BAS BIS
BOOMER Mean 145.71 14.86 38.49% 56.10% 45.29 22.49
N 35 35 35 35 35.00 35.00
GENX Mean 178.29 16.14 38.26% 45.63% 48.80 23.26
N 35 35 35 35 35.00 35.00
MILLENN Mean 175.38 14.23 42.74% 64.49% 49.15 22.92
N 156 156 156 156 156.00 156.00
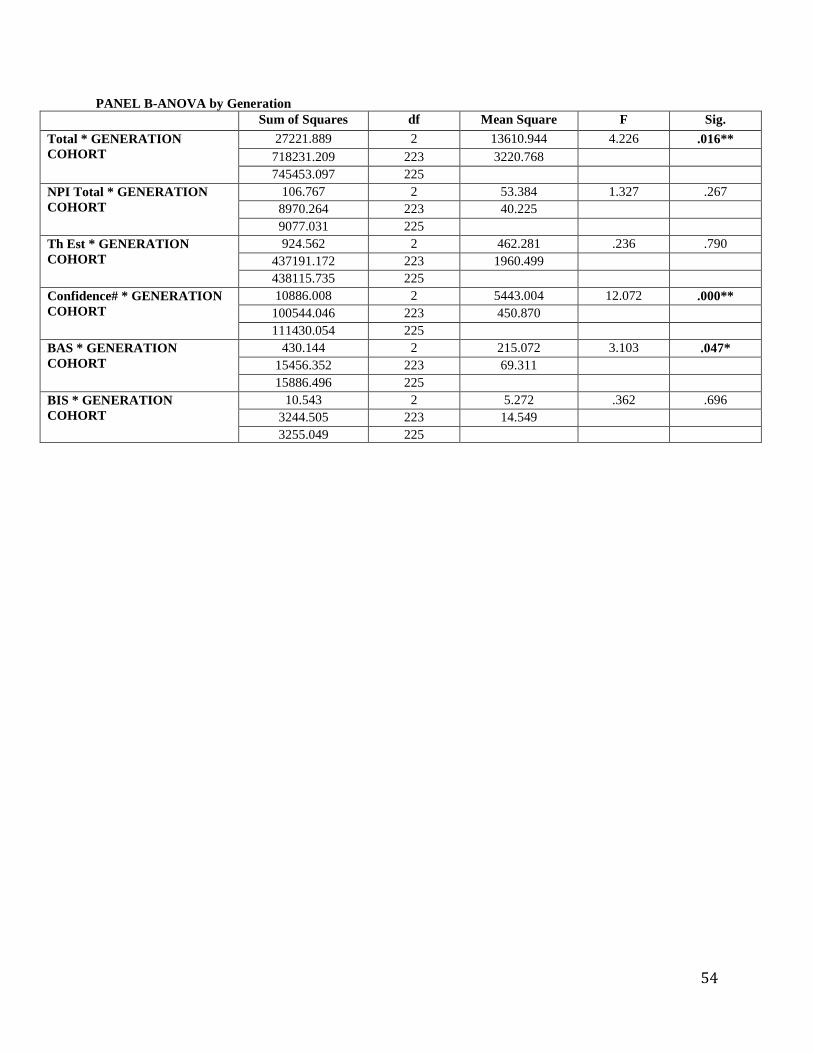
54
PANEL B-ANOVA by Generation
Sum of Squares df Mean Square F Sig.
Total * GENERATION
COHORT
27221.889 2 13610.944 4.226 .016**
718231.209 223 3220.768
745453.097 225
NPI Total * GENERATION
COHORT
106.767 2 53.384 1.327 .267
8970.264 223 40.225
9077.031 225
Th Est * GENERATION
COHORT
924.562 2 462.281 .236 .790
437191.172 223 1960.499
438115.735 225
Confidence# * GENERATION
COHORT
10886.008 2 5443.004 12.072 .000**
100544.046 223 450.870
111430.054 225
BAS * GENERATION
COHORT
430.144 2 215.072 3.103 .047*
15456.352 223 69.311
15886.496 225
BIS * GENERATION
COHORT
10.543 2 5.272 .362 .696
3244.505 223 14.549
3255.049 225
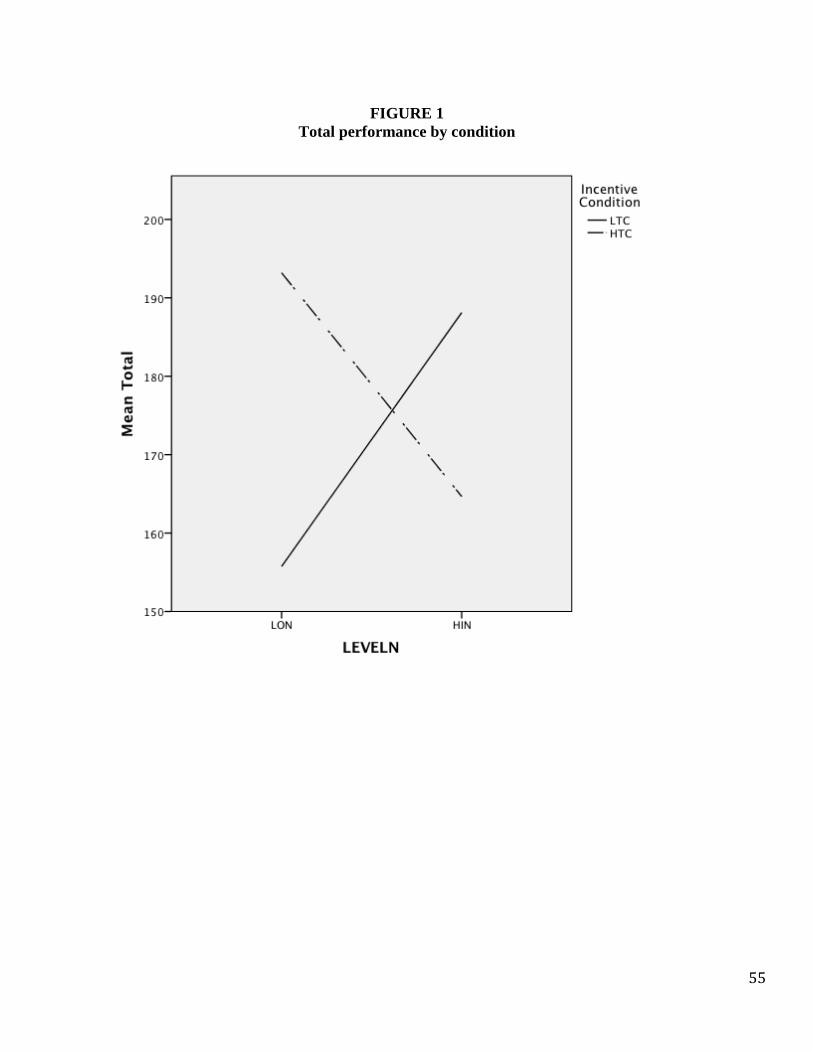
55
FIGURE 1
Total performance by condition