School Meals in Primary Schools in...
183
School Meals in Primary Schools in England M Nelson, J Nicholas, S Suleiman, O Davies, G Prior, L Hall, S Wreford, J Poulter King’s College London TNS Social Research Nutrition Works! Research Report RR753 R ESEARCH
-
Upload
trinhkhanh -
Category
Documents
-
view
215 -
download
1
Transcript of School Meals in Primary Schools in...

School Meals in Primary Schoolsin England
M Nelson, J Nicholas, S Suleiman, O Davies,G Prior, L Hall, S Wreford, J Poulter
King’s College LondonTNS Social ResearchNutrition Works!
Research Report RR753
RESEARCH

Research Report No 753
School Meals in Primary Schools in England
M Nelson, J Nicholas, S Suleiman, O Davies, G Prior, L Hall, S Wreford, J Poulter
King�s College London TNS Social Research
Nutrition Works!
The views expressed in this report are the authors� and do not necessarily reflect those of the Department for Education and Skills or the Food Standards Agency © King�s College London ISBN 1 84478 738 9

Table of contents EXECUTIVE SUMMARY ..................................................................................................................................... 5
INTRODUCTION....................................................................................................................................................... 5 OVERALL FINDINGS................................................................................................................................................ 5 DETAILED FINDINGS............................................................................................................................................... 6 METHODS............................................................................................................................................................... 8 DISCUSSION AND CONCLUSIONS............................................................................................................................ 9 LOOKING AHEAD..................................................................................................................................................11
1 INTRODUCTION........................................................................................................................................14 1.1 BACKGROUND .......................................................................................................................................14 1.2 AIMS AND OBJECTIVES ..........................................................................................................................15 1.3 PROJECT OVERVIEW ..............................................................................................................................15 1.4 NATIONAL NUTRITIONAL STANDARDS: HISTORICAL PERSPECTIVE......................................................16 1.5 CAROLINE WALKER TRUST GUIDELINES FOR SCHOOL MEALS. ...........................................................17 1.6 OVERVIEW OF SCHOOL MEALS SERVICES ..............................................................................................18
2 SAMPLING, RECRUITMENT, DATA COLLECTION AND CODING............................................21 2.1 SAMPLING AND RECRUITMENT..............................................................................................................21 2.2 DEVELOPMENT OF DATA COLLECTION TOOLS AND PILOTING ...............................................................25 2.3 DATA COLLECTION ...............................................................................................................................28 2.4 DATA PREPARATION .............................................................................................................................31 2.5 LIMITATIONS .........................................................................................................................................33 2.6 DATA CHECKING ...................................................................................................................................33 2.7 STATISTICAL ANALYSIS ........................................................................................................................34
3 THE CATERING SERVICE, COOKING PRACTICES AND THE EATING ENVIRONMENT ..36 3.1 THE SCHOOL MEALS SERVICE................................................................................................................37 3.2 THE EATING ENVIRONMENT .................................................................................................................41 3.3 COOKING PRACTICES.............................................................................................................................43 3.4 HEALTHY EATING ACTIVITY..................................................................................................................45 3.5 CONSULTATION .....................................................................................................................................46 3.6 STAFF TRAINING ....................................................................................................................................46 3.7 SCHOOL PARTICIPATION IN SPECIAL INITIATIVES..................................................................................47
4 CONTRACTS AND SPECIFICATIONS..................................................................................................48 4.1 RESPONSE RATE ....................................................................................................................................49 4.2 CONTENT OF DOCUMENTATION.............................................................................................................49 4.3 GOOD PRACTICE....................................................................................................................................58 4.4 CONCLUSION .........................................................................................................................................58
5 FOOD PROVISION.....................................................................................................................................59 5.1 MEETING THE NATIONAL NUTRITIONAL STANDARDS..........................................................................60 5.2 INVENTORY ANALYSIS...........................................................................................................................66 5.3 FOOD PROVISION AND THE NUTRITIONAL STANDARDS .........................................................................72 5.4 SET MEALS AND THE CWT GUIDELINES ...............................................................................................72
6 FOOD CHOICES OF PRIMARY SCHOOL PUPILS AT LUNCHTIME...........................................73 6.1 FOOD CHOICES OF PRIMARY SCHOOL CHILDREN ...................................................................................74 6.2 EATING HABITS......................................................................................................................................76 6.3 WHAT FACTORS WERE ASSOCIATED WITH FOOD CHOICES? ..................................................................76 6.4 NUTRIENT CONTENT OF SCHOOL MEALS AND THE CWT GUIDELINES ..................................................78
7 DISCUSSION AND CONCLUSIONS.......................................................................................................87 7.1 SURVEY REPRESENTATIVENESS AND QUALITY OF DATA.......................................................................87 7.2 THE CATERING SERVICE, COOKING PRACTICES AND EATING ENVIRONMENT........................................88 7.3 ANALYSIS OF SPECIFICATIONS ..............................................................................................................88 7.4 NATIONAL NUTRITIONAL STANDARDS .................................................................................................89 7.5 INVENTORY AND TRAY CHECK ..............................................................................................................89 7.6 OVERALL CONCLUSIONS .......................................................................................................................90
8 LOOKING AHEAD.....................................................................................................................................92

9 ACKNOWLEDGEMENTS.........................................................................................................................95
10 REFERENCES .............................................................................................................................................95
11 APPENDICES (SEE SEPARATE VOLUME) .........................................................................................96 APPENDIX A1. SCHOOL CATERER TELEPHONE INTERVIEW ................................................................................96 APPENDIX A2. SEMI-STRUCTURED TELEPHONE INTERVIEW WITH BURSAR/HEAD/LA......................................96 APPENDIX A3. EATING ENVIRONMENT ASSESSMENT.........................................................................................96 APPENDIX A4. PORTION WEIGHTS BOOKLET......................................................................................................96 APPENDIX A5. MEAL RECORD BOOKLET............................................................................................................96 APPENDIX A6. SCHOOL MEAL CHECKLIST .........................................................................................................96 APPENDIX A7. SPECIFICATIONS ANALYSIS TOOL (PART 1 � QUANT) ................................................................96 APPENDIX A8. SPECIFICATIONS ANALYSIS TOOL (PART 2 - QUAL) ...................................................................96 APPENDIX A9. FOOD INVENTORY........................................................................................................................96 APPENDIX A10. VISIBILITY QUESTIONNAIRE......................................................................................................96 APPENDIX A11. TRAY CHECK .............................................................................................................................96 APPENDIX A12. MAJOR CHANGES IN SCHOOL MEALS PROVISION POST 1980 .....................................................96 APPENDIX A13. THE 9 COMPULSORY ELEMENTS OF THE NATIONAL NUTRITIONAL STANDARDS......................96 APPENDIX A14. CLASSIFICATION OF FOODS IN 19 FOOD GROUPS.......................................................................96 APPENDIX A15. A WORKED EXAMPLE FOR THE ANALYSIS OF FOOD PROVISION ................................................96 APPENDIX A16. COMPARISON OF NUTRIENT INTAKES WITH 2005 CWT GUIDELINES........................................96 APPENDIX A17. GUIDELINES FOR GOOD PRACTICE IN WRITING SPECIFICATIONS ...............................................96
List of tables Table 1.1. The national nutritional compulsory standards: At least one item from each food group must be
available every day. ......................................................................................................................................17 Table 1.2. Additional recommendations for school lunches..............................................................................17 Table 1.3. Summary of Caroline Walker Trust nutritional guidelines for school meals# .............................18 Table 1.4. Organisation and types of documentation defining the school meals service...............................19 Table 1.5. Types of contractual agreements for provision of school meals services. .....................................19 Table 1.6. Types of subsidies operating between schools/LAs and providers.................................................20 Table 2.1. Profile of issued sample, eligible and participating schools compared with all primary schools
in England. ....................................................................................................................................................23 Table 2.2. Response by GOR, school stage and school type and urban/rural locality: primary schools in
England..........................................................................................................................................................24 Table 2.3. Multiple deprivation score (MDS) for the issued sample, ineligible, refused, and participating
primary schools in England. .......................................................................................................................25 Table 2.4. Main reasons given for non participation in 87 primary schools in England...............................25 Table 2.5. Data collection tools, main purpose and level of collection of data in 151 primary schools in
England..........................................................................................................................................................26 Table 2.6. Distribution by school year, age and gender of 7 058 pupils participating in the study in 151
primary schools in England. .......................................................................................................................31 Table 3.1. Provision of the school meals service in 151 primary schools in England.....................................37 Table 3.2. Delegation of funding in 151 primary schools in England. .............................................................37 Table 3.3. Type of contract or service level agreement (SLA) in 151 primary schools in England. ............37 Table 3.4 Number and percent of schools with various types of service in 151 primary schools in England.
........................................................................................................................................................................38 Table 3.5. Number and percent of schools with two or less, or three or more choices of protein, vegetable,
starch, dessert and drink options in 143* primary schools in England.................................................38 Table 3.6. Number and percent of school meal and free school meal uptake in 150* primary schools in
England..........................................................................................................................................................39 Table 3.7 How children paid for their school meals in 151 primary schools in England..............................40 Table 3.8. How pupils entered the dining room in 151 primary schools in England.....................................41 Table 3.9. Assessment by interviewers of the eating environment in 151 primary schools in England. .....42 Table 3.10. Number and percent of schools where children were able to purchase food in the dining room
at lunchtime or other times of the day in 151 primary schools in England...........................................43 Table 3.11. Number and percent of schools where children were able to purchase food not in the dining
room at lunchtime or other times of the day in 151 primary schools in England.................................43 Table 3.12. Usual methods of cooking fish and chicken/turkey products in 148* primary schools in
England..........................................................................................................................................................43 Table 3.13. Usual methods of cooking potato products in 148* primary schools in England.......................44

Table 3.14. Number and percent of school caterers who used salt in cooking in 148* primary schools in England..........................................................................................................................................................45
Table 3.15. Examples of different types of healthy eating activities reported by caterers in 93 primary schools in England. .......................................................................................................................................46
Table 3.16. Examples of different types of fruit and vegetable promotions as reported in 80 primary schools in England. .......................................................................................................................................46
Table 3.17 Number and percent of schools reporting participation in initiatives in 151 primary schools in England..........................................................................................................................................................47
Table 3.18. Number and percent of schools reporting participation in Food in Schools programmes in 151 primary schools in England. .......................................................................................................................47
Table 4.1. Specifications related to healthy eating within contractual documentation obtained for 112
primary schools in England. .......................................................................................................................50 Table 5.1. Number and percent of school lunch services failing to meet one or more compulsory standards
on one or more days at the beginning and end of service in 146 primary schools in England. ..........61 Table 5.2. Number and percent of school lunch services that failed to meet each standard or component of
a standard every day at the beginning and end of service in 146 primary schools in England. .........61 Table 5.3. Relationship between type of catering provider and whether the school lunch service met all
the compulsory standards............................................................................................................................63 Table 5.4. Number and percent of school caterers who were able to recall each nutritional standard or
component of a standard in 103 primary schools in England.................................................................63 Table 5.5. Estimated frequency of formal monitoring of the lunchtime service in 100 primary schools ....64 Table 5.6 Infant, junior and either average portion sizes in 149* primary schools in England compared to
those recommended......................................................................................................................................65 Table 5.7. Foods and food groups on offer in 151 primary schools in England, as a percentage of all foods
or food groups offered, and number of items offered on average per day in each food group across all schools.......................................................................................................................................................66
Table 5.8. Number and percent of 151 primary schools in England offering foods from different food groups, according to number of days offered per week, and mean number of days on which food from food group was offered.......................................................................................................................67
Table 5.9. Number of days per week on which specific food groups were offered in 112 primary schools in England according to whether the specification was mentioned, was deemed mandatory or was not mentioned in the contract/service level agreement...................................................................................71
Table 5.10. Summary of factors associated with the provision of healthier and less healthy foods in 151 primary schools in England. .......................................................................................................................71
Table 6.1. Foods and food groups* chosen by 7 058 pupils in 151 primary schools in England, as a
percentage of all foods or food groups chosen, and number of items chosen on average per pupil in each food group across all schools. .............................................................................................................74
Table 6.2. Energy and nutrient content and percent energy from macronutrients of school meals as chosen and as eaten by 3 035 infant pupils in 151 primary schools in England, together with the CWT (1992) guidelines and percent of meals meeting the guidelines....................................................79
Table 6.3. Energy and nutrient content and percent energy from macronutrients of school meals as chosen and as eaten by 4 023 junior pupils in 151 primary schools in England, CWT (1992) guidelines, and percent of meals meeting the guidelines. ........................................................................80
Table 6.4. Percent of 7058 primary school pupils whose meals met CWT guidelines. .................................80 Table 6.5. Energy and nutrient content and percent energy from macronutrients of 6 441* primary school
meals as eaten in 148� primary schools in England, by meal price or in receipt of a free school meal.........................................................................................................................................................................83
Table 6.6. Percent of pupils whose meals* met CWT guidelines for specific nutrients: all pupils and those who met six or more guidelines, by infant and junior. ............................................................................84
Table 6.7. Predictors of high CWT score in 7 058 pupils in 151 primary schools in England, based on stepwise multiple regression analysis.........................................................................................................86

List of figures Figure 1. The Balance of Good Health Model. ...................................................................................................68 Figure 2. Foods offered in 151 primary schools in terms of the Balance of Good Health.............................69 Figure 3. Percent of 7 058 pupils choosing specified foods in 151 primary schools in England. ..................75 Figure 4. Comparison of food groups offered with food groups chosen by 7 058 pupils in 151 primary
schools in England. .......................................................................................................................................75 Figure 5. Foods offered to and chosen by pupils in 151 primary schools in relation to the Balance of Good
Health.............................................................................................................................................................76 Figure 6. Percent of 7058 English primary school pupils whose intakes from school lunch provided a
given percentage of the RNI for vitamin A. .............................................................................................81 Figure 7. Percent of 7058 English primary school pupils whose intakes from school lunch provided a
given percentage of the RNI for iron. .......................................................................................................82 Figure 8. Food choice profiles of infants and juniors attending 151 primary schools in England, according
to whether or not their food choice met 6 or more of the CWT guidelines ...........................................85 Figure 9. Food choice profiles of pupils attending 151 primary schools in England, according to whether
or not their food choices met the six most discriminating CWT guidelines (folate, non-starch polysaccharides, percent energy from fat, 30% of energy EAR, calcium, vitamin C).........................86
The views expressed in this report are those of the authors and do not necessarily reflect those of the Department for Education and Skills or the Food Standards Agency.

Executive summary
Introduction Following concern about the quality of children�s diets and the contribution of school meals, statutory National Nutritional Standards were reintroduced in April 2001.14 These standards set out the frequency with which school caterers must provide items from the main food groups (meat, fish and alternative sources of protein, starchy foods, milk and dairy foods, fruit and vegetables). They apply to all maintained schools in England. The Department for Education and Skills (DfES) and the Food Standards Agency (FSA) commissioned a survey to assess compliance with the standards, to assess whether the food provided met the guidelines set by the Caroline Walker Trust (CWT),7 to measure food consumption in primary school pupils, and to compare nutrient intakes to the CWT guidelines. This report presents the findings from a nationally representative sample of 151 primary schools in England which provided information about catering practice and food provision at lunchtime, and information on the food selections of 7 058 primary school pupils age 4-12 years. This research study was commissioned before the start of the school food transformation programme. This report was preceded by School Meals in Secondary Schools in England, published in 2004.6
Overall findings The study had 3 main aims:
• To assess whether the food provided by the school caterer met the statutory 2001 National Nutritional Standards, set out in the regulations and associated guidance,14 15 for all the children throughout the service period.
• To assess whether the food provided met the guidelines set out by the Caroline
Walker Trust in 1992.7
• To identify the food consumption and nutrient intakes of primary school children from school meals, and to compare these to the Caroline Walker Trust guidelines.
In 146 of the 151 schools, it was possible to collect data on food provision over 5 consecutive days. These data were needed to address the first aim. Of these 146 schools, 34 (23%) met all of the compulsory standards at the beginning of service over 5 days. This fell to 25 schools (17%) by the end of service. The standards most commonly failed were �starchy food cooked in oil or fat not to be served more than 3 times a week� (failed by 53%), and �fruit based desserts to be served twice a week� (failed by 33%). The �additional recommendation� to provide drinking water was met by 140 schools (96%) at the beginning of service and by 139 schools (95%) at the end of service. The �additional recommendation� to provide drinking milk was met by 39 schools (27%) at the beginning of service, falling to 31 schools (21%) by the end of service. With regard to the second aim, it was not possible to evaluate food provision in relation to the Caroline Walker Trust guidelines because meals were served so as to allow pupils choices within meal components (main dish, vegetable, starchy food, dessert), rather than as fixed items comprising a set meal.

Regarding the third aim, pupils� food choices did not conform to the Balance of Good Health.8 They chose too many foods containing fat and foods and drinks containing sugar, and too few fruits and vegetables and milk and dairy products. The majority of pupils chose foods that met the CWT guidelines for energy (70%), protein (97%) and vitamin C (67%). About half of pupils chose meals that met the guidelines for non-starch polysaccharides (NSP), vitamin A, folate, calcium, and for percent energy from fat, carbohydrate and non-milk extrinsic sugars (NMES). 45% met the guideline for percent energy from saturated fat, and 24% met the guideline for iron. The number of pupils whose consumption met the CWT guidelines was substantially lower than the number whose food choices met the guidelines because pupils did not eat all of the food chosen. While more than half met the guidelines for energy (57%), protein (89%), and vitamin C (55%), only about half met the guidelines for percent energy from fat, carbohydrate and NMES, and fewer still met the guidelines for percent energy from saturated fat, vitamin A (39%), calcium (37%), folate (32%), NSP (30%) and iron (15%).
Detailed findings The study had objectives designed to achieve the main aims and, in addition, �to identify factors related to catering provision and the school environment that were associated with the provision and consumption of �healthier� foods�. The main findings are described below.
Catering service, cooking practices and the eating environment • The catering service was usually provided by a Direct Service Organisation
(DSO)/Local Authority (LA) provider (60%), or a contractor appointed by the LA (21%). 7% of schools appointed a contractor directly and in 3% of schools the service was provided �in-house�. The most common type of contract was fixed cost/fixed price (81%), followed by profit and loss/breakeven (11%). The majority of schools (92%) offered a prepaid cafeteria style service with choice.
• Schools reported that on average, 42% of pupils took a school meal, with uptake ranging from 11 to 99%. 17% of all pupils had applied for free school meals, and mean uptake was 85%. Overall, 34% of all meals served were free school meals.
• The average costs for paid meals and free school meals were £1.48 for infants and £1.49 for juniors.
• Most schools oven baked rather than fried chicken/turkey, fish and potato products, with the exception of chips which were deep fried in 90% of schools serving them.
• 96% of schools used vegetable oil for frying, and those schools using spread on bread or sandwiches used mainly sunflower (46%) or soft margarine (31%). Only 11% used low fat spread.
• 34% of schools used no salt at all in cooking, while 10% added salt to dishes and when cooking potatoes, rice, pasta and vegetables. Salt was not available to pupils in 91% of schools.
• 28% of caterers had completed some type of training in healthy eating/healthy cooking in the last 12 months.
• School participation in the Healthy Schools programme and the School Fruit and Vegetable Scheme (69% and 87% of schools respectively), training of lunchtime supervisory staff in the promotion of healthy eating, healthier products offered in tuckshops, and the display of materials to promote healthy eating in dining rooms showed that some schools were undertaking a number of different activities to promote healthy eating.
Contracts and specifications • 64% of head teachers were aware of some type of written documentation for their
school meals service

• 66 documents were received, covering 112 schools (74% of schools sampled). • The language used within documents tended to be imprecise, qualitative and open to
interpretation. • All of the documents contained some content relevant to healthy eating. 91% made
reference to the National Nutritional Standards and 29% referred to Caroline Walker Trust (CWT) guidelines. There was little evidence of schools or LAs setting their own quantitative nutritional standards.
• There were few references to salt, obesity or use of sustainable procurement practices. • There were few examples of elements of good practice in incorporating healthy eating
into service specifications.
Compliance with National Nutritional Standards • 34 of 146 schools (23%) met all of the compulsory standards at the beginning of
service over 5 days. This fell to 25 (17%) by the end of service. • The standards most commonly failed were �starchy food cooked in oil or fat not to be
served more than 3 times a week� (failed by 53%), and �fruit based desserts to be served twice a week� (failed by 33%).
• 96% of schools met the additional recommendation for drinking water and 27% for drinking milk at the beginning of service, falling to 95% and 21% respectively by the end of service.
• No associations were found between meeting the standards and the type of catering provider, type of contract, or whether the standards were monitored.
Food provision • The foods most commonly offered in schools were desserts, vegetables and fruit.
Desserts and vegetables were offered 4-5 days per week in 99% of schools and fruit in 97%.
• 70% of schools offered higher fat main dishes 4-5 days per week, compared to 64% for lower fat main dishes. A third of schools (33%) did not offer soft drinks, 90% did not offer crisps and other savoury snacks, and 58% did not offer fruit juice.
• The profile of foods offered did not conform to the Balance of Good Health, with too many foods containing fat and foods and drinks containing sugar on offer to pupils at lunchtime.
• Schools in which the contract specification made reference to monitoring healthy eating practices, and schools in which caterers reported having run promotions to encourage healthy eating offered potatoes not cooked in oil or fat more often. Schools in which the head teacher was aware of the nutritional standards offered higher fat main dishes less often.
Pupil food choices and nutrient intakes • Information was collected on the lunchtime food choices of 7 058 pupils. • Desserts were the most commonly chosen food (chosen by 78% of pupils), followed
by vegetables and salads (56% of pupils). • Higher fat main dishes and chips and other potatoes cooked in oil or fat (chosen by
53% and 48% of pupils, respectively) were chosen nearly twice as often as lower fat main dishes and potatoes not cooked in oil or fat (29% and 25%, respectively).
• The profile of foods chosen did not conform to the Balance of Good Health, with too many foods containing fat and foods and drinks containing sugar, and not enough starchy foods, milk and dairy foods, or fruit and vegetables chosen.
• Pupils chose desserts, vegetables and salads, higher fat main dishes, chips and other potatoes cooked in oil or fat, pasta and other cereals and soft drinks proportionately more often when compared with the frequency with which these foods were offered.

• Pupils chose more vegetables and salads in schools where the caterer had received some training in healthy eating/cooking, in schools where the caterer reported having run promotions to encourage healthy eating, and in schools where the lunchtime supervisors were observed to encourage healthy eating.
• Analysis of nutrient intakes against 1992 CWT guidelines suggested that for meals as chosen, mean intakes of most nutrients either met or were close to the recommendations, although percent energy from saturated fat was higher than recommended for both infants and juniors, and mean intakes of energy, folate, and iron were lower than recommended for juniors.
• Similarly, for meals as eaten, mean percent energy from saturated fat was higher then recommended, and mean intakes of energy, non-starch polysaccharides (fibre), calcium and iron were lower then recommended for both infants and juniors. Mean folate intakes in junior pupils were also low.
• Overall, less than 50% of meals as chosen and as eaten met individual CWT guidelines for non-starch polysaccharides, vitamin A, folate, calcium, iron, percent energy from fat and percent energy from saturated fat.
• Pupils whose meals met six or more CWT guidelines chose more baked beans, and fewer chips and other potatoes cooked in oil or fat, and main dishes.
• Less choice was associated with a healthier profile of foods being chosen by pupils, and also with a higher proportion of meals meeting 6 or more CWT guidelines.
Methods A representative sample of 151 primary schools were recruited into the study. Response rates were 59% of the original sample, and 63% of schools eligible for inclusion. Data were collected at the school and pupil level. Pairs of interviewers from Taylor Nelson Sofres visited each school over five consecutive lunchtimes. They recorded all the food and drink items on offer each day, and assessed compliance with the National Nutritional Standards at the beginning of the lunch period and again 10 minutes before the end of service. Individual pupil�s food choices were also recorded. Interviewers approached a pupil after he or she had collected lunch. After ascertaining their willingness to participate, the interviewer recorded what was on the pupil�s tray, attached an identifying label to the tray, administered a brief questionnaire, and asked the pupil to return his or her tray with all leftovers to a �weighing table� set up in the school dining room. Ten pupils were asked to participate each lunchtime. Food choices of 7 058 pupils were recorded. At the beginning of service, one of the interviewers collected from the catering staff two portions of a range of food and drink items. These items were weighed by the interviewers to establish typical portion sizes. Individual pupil leftovers were also weighed. Telephone interviews were conducted with the school caterer and a school representative (Head/Bursar/LA) by researchers at King�s College London. These interviews ascertained the nature of catering provision in the school, uptake of paid and free school meals, whether there was any documentation for the school meals service, details on cooking methods and promotion of healthy eating, and monitoring procedures. The nutrient content of food from inventories and individual pupil�s food choices were determined using data from the Food Standards Agency Nutrient Databank. Statistical analysis was conducted using the Statistical Package for Social Sciences (SPSS). Compliance with the National Nutritional Standards was assessed in relation to food provision. The nutrient profiles of the pupils� food choices were compared with the 1992 Caroline Walker Trust (CWT) Guidelines. Food provision and pupil food choice was also assessed in terms of food groups and the Balance of Good Health.

Copies of school meal contracts or service level agreements were requested and obtained for 112 of the 151 schools (66 documents in total). A quantitative and qualitative analysis was conducted of the content specific to nutrition and healthy eating.
Discussion and Conclusions Between one-quarter and one-third of energy and nutrients are provided by school meals on the days that they are eaten. School meals, therefore, have the potential to help make a significant contribution to nutrient intakes. The present findings show that many pupils were not making healthier food and drink choices at lunchtime, even though healthier options were available in most schools. This imbalance in selection is partly due to the failure of most schools to offer a distribution of foods that conformed to the Balance of Good Health. On balance, schools offered too many foods containing fat and foods and drinks containing sugar. When faced with such choices, pupils selected more of the less healthy options. A key finding is that less choice was usually associated with a healthier profile of foods being offered and hence being chosen. More choice was associated with the selection of meals that were less likely to meet the CWT guidelines, especially for folate, non-starch polysaccharides, percent energy from fat, calcium, percent energy from saturated fat, vitamin A and iron. However, as the number of schools on which these associations were based was small, this finding should be interpreted with caution.
Catering service, cooking practices and the eating environment The types of catering providers and contracts observed in the present study were consistent with that expected to be found in primary schools in England. The type of service was primarily a cafeteria style with choice, where pupils were usually offered a two course meal with a drink. Pupils were given a wide range of choice, particularly in terms of dessert options, with schools typically offering fruit and yoghurt as well as items such as cakes and biscuits. Data showed that the majority of pupils chose the less healthy options when available. Many schools appeared to encourage or promote healthy eating. There were limited opportunities for pupils to purchase snacks and drinks at school, and nearly two-thirds of tuckshops offered healthier choices. Training of lunchtime supervisors in healthy eating and participation in schemes such as Healthy Schools and the School Fruit and Vegetable Scheme suggested that some schools were undertaking a number of different activities to promote healthy eating. Evidence of the promotion of healthy eating was seen in over half of school dining rooms. Many schools followed some healthier cooking practices. For example, most schools offered low calorie/no added sugar squash and low fat yoghurt, and salt was available to pupils in only a few schools. Few schools offered crisps or confectionery, and salad bars were common, usually offered as an extra which pupils could choose as well as the vegetable option on offer. However, there were also some less healthy practices. Schools frequently offered products high in salt and fat, such as processed potato products and processed chicken/turkey and fish products, and salt was used in cooking in two-thirds of schools. Despite this apparent emphasis on healthy eating, results showed that many pupils were not making healthier food and drink choices at lunchtime, even though healthier options were available in most schools. In some schools, pupils could have a dessert or fruit but not both. Few positive associations were found between practices intended to promote healthy eating and pupils� choices.

Contracts and specifications Documents were obtained covering 74% of schools, ranging from very detailed specifications to vague guidance notes for cooks. Although virtually all made some reference to healthy eating, few schools or LAs specified their own mandatory quantitative guidelines relating to the nutritional quality of school meals, good catering practice, or to the tools and processes to be used in implementation and monitoring. Most documents referred to the nutritional standards, which are put forward by DfES as a minimum requirement. There was little evidence of schools setting additional standards. There was some evidence that caterers were considering the nutrient content of school meals, with a third of documents referring to CWT guidelines, and some reporting that foods or menus were submitted for nutrient analysis. The language used in documents demonstrated awareness of and commitment to the promotion of healthy eating, but few examples of good practice were found. Associations between contract specifications and food provision or pupil choices were generally weak and inconsistent.
Compliance with National Nutritional Standards Primary schools performed poorly in terms of meeting the compulsory standards for food provision. Only 23% of school lunch services met all the standards every day at the beginning of service, falling to 17% at the end of service. Schools commonly failed the standards by serving starchy foods cooked in oil or fat (usually potato products such as hash browns) more than three times a week, and not serving fruit-based desserts at least twice a week. School caterers reported that lunch services and compliance with nutritional standards were monitored in the majority of schools, yet most schools failed to meet all of the compulsory standards. Compliance was commonly reported to be indirectly monitored via menus, so either the monitoring was not happening in practice, was ineffective, or caterers believed that their menus offered foods that would meet the standards.
Food provision, pupil food choices and nutrient intakes Schools offered a wide variety of foods but neither the distribution of foods on offer nor the foods chosen by pupils conformed to the Balance of Good Health. Overall, schools offered too many foods containing fat and foods and drinks containing sugar. Although healthier options were on offer, pupils chose more of the less healthy options, for example choosing higher fat main dishes nearly twice as often as lower fat main dishes despite both options being offered equally often. Less choice within the meal on offer was usually associated with a healthier profile of foods being offered and hence being chosen. Mean nutrient intakes for both infants and juniors were lower than recommended in the CWT guidelines for a number of nutrients. Less than half of meals as eaten met the guidelines for non-starch polysaccharides, vitamin A, folate, calcium, iron, percent energy from fat, and percent energy from saturated fat. The food choices of pupils who met the six CWT guidelines most likely to be associated with a high CWT score were characterised by more baked beans, and fewer main dishes (both higher and lower fat) and chips and other potatoes cooked in oil or fat. Schools offering the least choice had the highest proportion of pupils choosing meals that met 6 or more of the CWT guidelines, whilst the smallest proportion was found in schools with cash cafeterias.

Looking ahead The evidence from the present study suggests a number of ways in which the food provision in schools at lunchtime may need to change if healthier meals are to be made available and consumed by school children in England. Many of these suggestions are similar to the recommendations made in the previous report, School Meals in Secondary Schools in England.6 Since the publication of that report in 2004 and the commissioning of the present research, the DfES has published 35 recommendations for the transformation of school meals in both primary and secondary schools in England, based on the work of the School Meals Review Panel (SMRP).4 Many of the suggestions made here and in the previous report have been addressed in the DfES recommendations. It was felt worthwhile to link the evidence from the present research with some suggestions for improvement that reflect, in part, the new recommendations. Evidence Potential ways forward Neither the profile of foods on offer to pupils nor that chosen by pupils reflected the Balance of Good Health. This was true for both schools that met the current National Nutritional Standards and those that did not. The present food-based guidelines do not appear sufficient to ensure that foods containing fat and foods and drinks containing sugar are offered and chosen in accordance with the Balance of Good Health. More than half of all meals eaten did not meet the CWT guidelines for non-starch polysaccharides, vitamin A, folate, iron, calcium, percent energy from fat and percent energy from saturated fat. Food-based standards alone do not appear to be sufficient to ensure that the CWT guidelines are met.
National Nutritional Standards for school food should not only be compulsory but should be based on a combination of food-based and nutrient-based guidelines.
Most schools reported that compliance with the Nutritional Standards was monitored, yet only 23% of schools met the standards every day at the beginning of lunchtime. One explanation for this is that the standards have been misinterpreted, and there is confusion amongst caterers and those planning menus as to which foods count towards which standards.
National Nutritional Standards should be clear and easily measurable.

Evidence Potential ways forward The majority of heads and caterers reported that compliance with the standards was monitored, yet less than a quarter of schools met the standards, suggesting that monitoring was either not happening or was ineffective. Caterers commonly reported that compliance to the standards was assessed by menu analysis. As less than a quarter of schools were meeting the standards, this was either not taking place in practice, the method was ineffective, or the catering providers believed that the foods and drinks they were providing met the standards.
Monitoring of the catering service (particularly compliance to the standards) should be compulsory, using a standard reporting framework supported by robust tools. A database of compliant menus should be made available. Training in monitoring for catering staff should be part of the training relating to healthy eating. A standard reporting format should be specified in monitoring requirements.
Fewer schools met the standards at the end of service than at the beginning.
Schools should ensure that foods that meet the standards are available to pupils throughout the lunchtime service. This links with the suggestions on monitoring.
Nutrient intakes in primary school pupils were better than in secondary. This may in part reflect the fact that primary schools offered soft drinks, confectionery and savoury snacks, chips and other potatoes cooked in oil or fat less often, and vegetables/salad more often than secondary schools. The schools offering less choice were more likely to provide meals that met CWT guidelines.
The range of choice should be restricted to a range of healthier options.
Only 28% of catering staff had received training in healthy eating /cooking. Only 68% of school caterers questioned were aware of the National Nutritional Standards, and of those, only 4% were able to identify all the components whilst 46% were unable to name any. There was some evidence of healthier options being chosen where catering staff had had training in healthy eating/cooking.
All head cooks and catering managers should receive training in healthy catering and how to meet the new standards.

Evidence Potential ways forward Many schools were participating in government sponsored initiatives such as Healthy Schools and the National School Fruit and Vegetable Scheme.
For healthy eating messages to be effective and impact on health, it is likely that they need to be reflected in all aspects of school life, including teaching and food provision outside lunchtime. Therefore, schools should be encouraged to develop a �whole school nutrition policy�, to be made available to parents and carers.
The school catering contracts or service level agreements examined offered only isolated examples of good practice in incorporating healthy eating into specifications, and language tended to be imprecise
Contract documents should emphasise monitoring in order to ensure compliance with compulsory standards. Where necessary, schools should be given guidance on setting contracts.

1 Introduction
1.1 Background School meals make a vital contribution to the dietary intake of school children in England. Every day, over 3 million school meals are served.1 There are 7,600,000 English primary and secondary school pupils and 43% of these take a school meal. In 2004 17.3% of primary pupils were eligible for free school meals (FSMs), but it is estimated only 4 in 5 children took this up.2 Data from the National Diet and Nutrition Survey (NDNS) of young people aged 4 to 18 years were analysed to examine the specific nutritional contribution of school meals.3 In the primary sector school lunches provided between 22% and 33% of the daily intake of energy, fat, protein, iron and zinc, calcium, folate and vitamin C. There was also evidence that school meals helped to compensate for poor intakes of some nutrients.4 For example, intakes of zinc and non starch polysaccharide (dietary fibre) were poor and sodium intakes high amongst primary girls, and school meals went some way to improving intakes. Not surprisingly, school lunch was especially important for those children who missed breakfast, estimated as 8% of all 8 to 16 year-old children, and rising to 9% in children living in poor households.5 Nutrient intakes from school meals are a result of not only what is provided but also what is chosen by children. Both parts of this equation give cause for concern. Analysis of �set meals� provided in secondary schools revealed that none of these meals met the standards for the nutrient content set by the Caroline Walker Trust.6 7 Data from the NDNS 3 showed that foods chosen and consumed by pupils from school lunches were very different from the balance recommended for good health.8 Too few foods from the starch, fruit and vegetable and dairy groups were selected, whilst too many of the foods high in fat and sugar were chosen. A Consumers Association survey of primary and secondary schoolchildren�s meal intake in 2002 found that pizza, chicken nuggets and fish cakes were among the most popular main courses. Chips and fried potato products were the most frequently consumed starchy foods, and baked beans the most popular vegetable.9 School meals contributed, on average, less than one portion to their daily fruit and vegetable intake. The recommended intake for children and adults is at least five portions (about 400g) per day.10 It is important to put school meal intakes into the context of the overall diet and health patterns for young children. NDNS data suggested that for many children average daily intakes of saturated fats, sugars and sodium were high and intakes of Vitamin A, riboflavin, folate, zinc, iron, magnesium, calcium and potassium were low compared to reference nutrient intakes (RNIs). Coupled with these high saturated fat and low micronutrient intakes has been the rise in the level of obesity in children. Since 1992 the number of school children in England who are overweight or obese has doubled.11 1 in 3 boys and 1 in 4 girls were obese or overweight in 2002,12 and these figures continue to worsen. Conservative estimates suggest that by 2020 1 in 5 boys and 1in 3 girls will be in the severely obese range and many more will be overweight. The chronic disease consequences of this epidemic are huge and are likely to result in accelerating rates of diabetes, heart disease and many cancers.13 Concern about children�s diets, what they are eating in school and the quality of school meal provision provides the context for this survey in primary schools. In addition, in 2001, statutory National Nutritional Standards for school lunches were re-introduced,14 after an absence of 21 years. These standards stipulated the menu frequency of certain food groups. They are currently being revised. A new set of nutritional standards will come into force early in 2006. In order to understand the potential changes in the contribution of school lunches to

daily intake following the introduction of the 2001 standards, the Department for Education and Skills (DfES) and the Food Standards Agency (FSA) jointly commissioned a survey of school meals in a representative sample of English primary schools. It follows a parallel study of secondary schools conducted in 2004.6 The present study was designed to assess whether school meal providers were complying with the 2001 statutory standards, to identify food choices available to primary school children, and to assess food consumption and nutrient intake from the lunchtime meal in primary schools in 2005. This report presents the findings of that survey.
1.2 Aims and objectives
1.2.1 Aims The study had 3 main aims:
• To assess whether the food provided by the school caterer met the statutory 2001 National Nutritional Standards, set out in the regulations and associated guidance,14 15 for all the children throughout the service period.
• To assess whether the food provided met the guidelines set out by the Caroline
Walker Trust in 1992.7
• To identify the food consumption and nutrient intakes of primary school children from school meals, and to compare these to the Caroline Walker Trust guidelines.
1.2.2 Objectives The main objectives were to:
• Recruit into the study a country-wide selection of 150 primary schools using appropriate sampling techniques
• Determine food provision, availability and visibility of food and drink within dining
rooms and cafeterias in these primary schools • Measure consumption of lunchtime meals in approximately 7 500 primary pupils
nationwide • Evaluate food availability, food consumption and nutrient intake against National
Nutritional Standards and guidelines for healthy eating in schools.
• Identify factors related to catering provision and the school environment that were associated with the provision and consumption of �healthier� foods
• Undertake additional analyses as appropriate and in consultation with the sponsors.
1.3 Project overview One hundred and fifty one primary schools in England participated in the mainstage of this project. Fieldwork was conducted from April through June 2005. Two trained interviewers from the market research company Taylor Nelson Sofres (TNS) visited each school over five consecutive lunchtimes and recorded the foods and beverages offered to pupils by the caterers. The food and beverage choices of approximately 10 pupils were recorded each lunch time and their leftovers were weighed. A total of 7 317 pupils were approached to provide information on food chosen and eaten and complete a brief interviewer administered questionnaire. Information on catering practice and the lunch service was collected via a telephone interview with the head cook or catering manager. Information on the type of

contract for each school was collected via a telephone interview with the relevant person responsible for this contract (e.g. Head teacher, bursar, LA officer). Sixty-six copies of specifications or service level agreements were obtained, covering 112 (74%) of the 151 schools. A pilot study to test measuring instruments and logistics was conducted in ten schools in February 2005, prior to the mainstage study.
1.4 National Nutritional Standards: historical perspective The school meals service was introduced in 1906, provoked by concern about severe malnutrition and the realisation that many children were attending school underfed and unable to benefit from their education. The Second World War brought about a shift in Government policy from a service designed to benefit undernourished children to one that was intended to benefit all children. The first nutritional standards for school meals were set in 1941 covering energy, protein and fat. These were updated in 1955, and again in 1975 following publication of the Committee on Medical Aspects of Health�s (COMA) report on Diet and Coronary Heart Disease.16 The 1980 Education Act brought about major changes in the school meals service. The Act removed the obligation for LAs to provide school meals, except to those children entitled to free school meals. It also removed the obligation to meet any nutritional standards. LAs had autonomy over the price, type and quality of the meals they provided, if indeed they decided to continue providing meals. A potential benefit of this major change was to save money: net expenditure on the school meals service was over £400 million per year in 1980, and school meals were identified as an area where substantial savings could be made to public expenditure. Some LAs dismantled their catering services and today around 13% of schools have no kitchen facilities, and in these schools only sandwiches are provided to those entitled to free meals. It was not until 2001 that compulsory National Nutritional Standards for school meals were reintroduced, as a result of concerns about the quality of children�s diets. Major changes in school meal provision post 1980 are summarised in Appendix A12.
1.4.1 National Nutritional Standards for school lunches: compulsory standards and additional recommendations Data on food provision collected within this primary school survey were evaluated against the statutory Nutritional Standards for School Lunches which came into force in April 2001.14 Despite the climate of change these were the standards to which schools were operating during the period of study. They set out minimum standards, in terms of food groups, that school caterers must meet. Similar standards for secondary schools were used as the evaluative yardstick for the previous survey of secondary school meals.6 The standards apply to lunches whether they are free or paid for. The Regulations for primary schools stipulate that at least one item from each of the food groups in the left-hand column of Table 1.1 must be available every day. There are also additional requirements, shown in the right-hand column. Together these comprise the �compulsory standards�.

Table 1.1. The national nutritional compulsory standards: At least one item from each food group must be available every day.
Food group Additional Requirement
Starchy foods Starchy food cooked in oil or fat should not be served more than three times a week.
Vegetables and fruit Both a fruit and a vegetable must be available. Fruit based desserts must be available twice a weeka
Milk and dairy foods Fish must be served at least once a week. Meat, fish and alternative
(non-dairy) sources of protein Red meat must be served at least twice a week.
Cheese may be included in the protein group for primary children.
The DfES produced guidance to school caterers on how to implement these standards.15 Included in this guidance were �additional recommendations� regarding drinking water, drinking milk and provision of hot food (Table 1.2).
Table 1.2. Additional recommendations for school lunches.
The Secretary of State: • Expects that drinking water should be available to all pupils every day, free of charge • Strongly recommends that schools should offer some hot food, particularly in the Winter months • Strongly recommends that drinking milk is available as an option every day
Further recommendations given in the guidance for school caterers included serving oily fish as part of the �once a week� fish requirement and making milk free to pupils entitled to free school meals. The guidance also included recommended portion sizes (uncooked weights are specified) for primary school pupils. Ensuring that the National Nutritional Standards are met is the responsibility of the LA, or school governing body if the school meals budget has been delegated.
1.5 Caroline Walker Trust Guidelines for School Meals. In addition to monitoring compliance with the standards, school caterers are also advised to monitor the nutrient content of the meals they provide, either by the use of food composition tables (specialist computer software exists), or via laboratory analysis of samples. The results from the analysis may then be compared with the Caroline Walker Trust (CWT) Guidelines for School Meals. The CWT guidelines �provide figures for the recommended nutrient content of an average school meal provided for children over a one-week period�. The values are based on the recommendations contained in the COMA report Dietary Reference Values for Food Energy and Nutrients for the United Kingdom.17 The CWT guidelines were first released in 1992,7 and an updated version of figures was released in September 2005.18 During the period of this study, primary schools would have been using the 1992 figures as a reference point. The more recent nutrient figures are similar to those released in 1992, but are updated to include figures for zinc, and also sodium following the release of new recommendations on salt intake.19 Both sets of figures are set out in Table 1.3.
a Editors Note: the proportion of fruit in �fruit based desserts� is not defined in the standards

Table 1.3. Summary of Caroline Walker Trust nutritional guidelines for school meals#
Nutrient 1992 Guideline 2005 Guideline
Energy 30% of the Estimated Average Requirement (EAR)*
30% of the Estimated Average Requirement (EAR)*
Fat Not more than 35% of food energy** Not more than 35% of food energy** Saturated fatty acids Not more than 11% of food energy Not more than 11% of food energy Carbohydrate Not less than 50% of food energy Not less than 50% of food energy Non-milk extrinsic sugars Not more than 11% of food energy Not more than 11% of food energy Non-starch polysaccharides (fibre)
Not less than 30% of the Calculated Reference Value†
Not less than 30% of the Calculated Reference Value†
Protein Not less than 30% of the Reference Nutrient Intake (RNI)‡
Not less than 30% of the Reference Nutrient Intake (RNI)‡
Iron Not less than 40% of the Reference Nutrient Intake (RNI)
Not less than 40% of the Reference Nutrient Intake (RNI)
Zinc No recommendation Not less than 40% of the Reference Nutrient Intake (RNI)
Calcium Not less than 35% of the Reference Nutrient Intake (RNI)
Not less than 40% of the Reference Nutrient Intake (RNI)
Vitamin A (retinol equivalents)
Not less than 30% of the Reference Nutrient Intake (RNI)
Not less than 40% of the Reference Nutrient Intake (RNI)
Folate Not less than 40% of the Reference Nutrient Intake (RNI)
Not less than 40% of the Reference Nutrient Intake (RNI)
Vitamin C Not less than 35% of the Reference Nutrient Intake (RNI)
Not less than 40% of the Reference Nutrient Intake (RNI)
Sodium Should be reduced in catering practice Not more than 30% of SACN## recommendations
#2005 nutrient guidelines that differ from 1992 guidelines are shown in bold type * Estimated Average Requirement (EAR) = �estimated average requirement of a group of people. About half will usually need more than the EAR, and half less�.17 In the analysis of school meals in this report, �30%� has been interpreted as �providing between 20% and 40% of the EAR for energy in a single meal�. ** Food energy = energy obtained from food, assuming no contribution from alcohol.17 � Calculated Reference Value = a value calculated by the Working Group for children based on a non-starch polysaccharides (NSP) intake of 8g/1000 kcal. � Reference Nutrient Intake (RNI) = �an amount of the nutrient that is enough, or more than enough, for about 97% of people in a group. If the average intake of a group is at RNI, then the risk of deficiency in the group is very small�.17 ##Scientific Advisory Committee on Nutrition.19
1.6 Overview of school meals services Over the last 25 years a number of legislative changes and policy initiatives have had considerable impact on the shape of school meals services in England (see Appendix A12). In particular, the introduction of Compulsory Competitive Tendering (CCT) (1988) required LAs to invite bids for the provision of school meals from private catering contractors as well as the authority�s own service, known as �Direct Service Organisations� (DSO�s). This tendering precipitated a clear division in roles within school meals catering between �client services� within LAs and providers. At this time it was up to LA officers, who had responsibility for the school meal contract, to define the quality of catering services within schools through detailed specifications. Catering service providers would then demonstrate how they would meet the service specification through a tender, which would be evaluated along with others before a contract was awarded.
At this time, the degree to which specifications addressed healthy eating and nutrition was controlled by the LA and varied considerably.20 However, CCT embedded a stronger commercial focus in which the major pre occupation was efficient promotion of the service to

sustain numbers and financial viability at a time when most secondary schools had moved to a cash cafeteria service offering a wide range of choices priced individually. In contrast, primary schools generally offered a more limited choice based around a two course meal.20 Subsequently, local management of schools and the delegation of catering budgets to schools led to further diversity in the organisation of school meals services (Table 1.4). In 2003, over 80% of LAs delegated funding universally to all schools.21 There is some evidence that delegation eroded the promotion of healthy eating through school catering.20 As a result of all these changes, there are now several options for schools to procure catering services and these are summarised in Table 1.4. In primary schools in England, 69% of catering contracts are operated by DSOs, 22% by large private contractors, and 9% are either self-operated (�in-house�) or run by other small contractors.1 This diversity of organisation of school meals has led to a varied mix of documentation, contractual terminology and language, which have been adopted to define catering services for schools and set out standards against which the service needs to be delivered (Table 1.4). There is also wide variability in the financial structure of school meals contracts/agreements. These are summarised in Table 1.5.
Table 1.4. Organisation and types of documentation defining the school meals service.
Types of organisation of the school meals service
• Schools employ their own staff directly to deliver the catering • Schools are part of a group contract organised by their Local Authority with catering then provided
by a local authority provider (DSO) or by a private sector contractor • Schools tender their catering individually to a private sector contractor or a local authority �in house�
provider (DSO) • Schools and Local Authorities who have closed their school lunch services provide the minimum
legal requirement of a sandwich meal to those with an entitlement to free school meals.
Types of documentation defining the school meals service
• Schools hold a service level agreement with LAs • There is some type of contractual agreement containing specifications between school and
contractor or LA and contractor • Schools may have developed their own catering service specifications
Table 1.5. Types of contractual agreements for provision of school meals services.
Type of Agreement/Contract Financial organisation
Fixed Cost/Fixed Price The school pays an agreed cost for a specified service. This cost or price for service provision may be varied e.g. if the number of pupils changes considerably
Management Fee/Cost Plus All the costs of providing the service are paid by the provider and recharged, with a management fee, or part management fee, to the school
Management Contract The school pays a contractor to manage the service for them, however there is less incentive for the contractor to make revenue for the school
Profit and Loss/Breakeven (sometimes referred to as a �Nil Cost/Nil Subsidy contract�)
The provider has control over the menu and pricing and the service is paid for by the pupils. There is no subsidy of the service by the school and the provider tends to have more autonomy over what is offered

In addition, there is a further layer of financial complexity within school meals linked to the different types of subsidies operating between schools/LAs and providers. Again there is wide variability in the type and size of these subsidies (Table 1.6).
Table 1.6. Types of subsidies operating between schools/LAs and providers.
• Cross subsidy between free school meals and paid meals
• Cross subsidy between secondary and primary schools • A subsidy of the service (e.g. school or LA subsidise new equipment or management service to help
run the service efficiently) • School or LA specifically subsidise the management of the catering service • The contractor pays back an agreed portion of the profit from the catering service to the school or LA • If a contractor fails to meet predicted meal targets then the school or LA may subsidise this deficit • If catering staff have transferred over from LA to contractor employment then the LA or schools may
subsidise any fall in rates of pay
As suggested by the findings of the survey on school meals delegation,21 the financial drivers of school meals services may have direct relevance to the nutritional quality of that service. In theory, commercial influences could impact adversely on the ability of that service to offer healthier choices. For example, where the school expects to make a profit from the catering service, this may set a climate of expectation and drive the caterers to provide and promote foods that they perceive children will purchase and therefore have potential for greatest profit. Conversely, where there is a cost plus agreement with a level of subsidy from the school, the caterer may have more confidence to experiment with different dishes incorporating foods that they perceive are not liked by children. The potential impact of these factors on the foods being offered or pupils� choices has been examined in this report.

2 Sampling, recruitment, data collection and coding
2.1 Sampling and recruitment
2.1.1 Selecting the schools Two samples were drawn from the DfES database EduBase,b from which the pilot and mainstage schools were recruited. The samples were drawn in January 2005. The sample frame included primary and middle deemed primary schools in England, which were open in the Summer term of 2005. Community, Voluntary Aided, Voluntary Controlled and Foundation Schools were included in the sample. Schools that had been inspected by Ofsted during the previous nine months were excluded. The Edubase sample received by TNS contained 17 375 schools. Further exclusion criteria included schools that were due to close (21), those due to open after April 2005 (67), those with less than 50 pupils (402), and those with pupil numbers not stated (42). The resulting sample frame contained 16 843 schools. Prior to drawing the sample, the sample frame was stratified or ordered using EduBase variables: 1. Region - the schools were split into the nine Government Office Regions (GOR). 2. School stage � within region, schools were grouped by school stage � Primary or
Middle Deemed Primary, creating 18 bands. The schools were listed in the same order within each GOR.
3. School type � within each of these 18 bands, the schools were grouped into the four school types (Community, Foundation, Voluntary Aided and Voluntary Controlled) in the same order, creating 72 bands.
4. Postcode � finally, schools were sorted by postcode within each band. The mainstage sample of schools was drawn with probability proportional to size.c The total number of pupils in each school was cumulated down the complete stratified list of schools. A sampling interval was calculated and administered after generating a random starting point. 255 schools were selected, with the intention of recruiting 150. The pilot sample was drawn as a �quota�, ensuring a good spread of the relevant school characteristics including school type, region, size and whether the school was located in an urban or rural area. 40 schools were selected, with the intention of recruiting ten.
2.1.2 Recruitment of schools Mainstage and pilot sample schools were approached by letter in January 2005. The letters were followed up by telephone calls.
b Edubase is a register of all educational establishments in England and Wales, and is maintained by the DfES (www.edubase.gov.uk). It contains data on numerous characteristics of individual schools such as location, name of head teacher, type of establishment, number of pupils on roll, etc. c �Probability proportional to size� means that schools were sampled in proportion to their total number of pupils. Therefore, larger schools had a higher chance of selection than smaller schools. This ensures that the schools selected are representative of all schools in England.

2.1.3 Response rate Pilot sample Ten schools were recruited for the pilot study, representative of the main school characteristics likely to be encountered in the main stage survey. Mainstage sample Although schools with fewer than 50 pupils were excluded from the sample, a number of sampled schools were found to have very small numbers of pupils who ate a school meal. This was usually because the school did not provide school meals to pupils generally, and provided only a packed lunch to those who were eligible for free school meals. It was decided that it was impractical for the study to include schools where fewer than 30 pupils were supplied with a school meal, and these schools were therefore deemed ineligible. 17 of the sampled schools (7%) were ineligible for this reason, leaving 238 eligible schools for recruitment. Of the 238 eligible schools, 151 were recruited for the main stage study, giving a response rate of 63%, or 59% of the issued sample of 255. Responders and non-responders Table 2.1 shows the profile of participating, eligible and sampled schools by GOR, school stage, school type, and urban/rural location compared with all schools. The sample of schools was drawn with probability proportional to size, and so was in proportion to the number of pupils by region, school stage and school type. This means that the profile of schools in the sample would not necessarily match the population of all schools, if the average school size varied by region, school stage or school type. Other factors affecting the profile of participating schools are differential refusal and ineligibility rates by region, school stage or school type. There were no significant differences with respect to region, school stage and school type between the participating, eligible and issued samples, showing that ineligibility and non-response did not significantly affect the profile of schools participating in the survey. There were some minor differences between the issued sample and all schools with respect to school type, with the sample more likely to be Community schools, and less likely to be Voluntary Controlled or Voluntary Aided. This is because the mean number of pupils per school in Community schools is larger than the overall mean, and in Voluntary Controlled and Voluntary Aided schools it is smaller. This also explains the difference in proportion of urban and rural schools between the issued sample and all schools, as rural schools tend to have fewer pupils. There were no significant differences between the issued sample and all schools by GOR or school stage.

Table 2.1. Profile of issued sample, eligible and participating schools compared with all primary schools in England.
All schools Issued
sample
Eligible Participated
n % n % n % n %
East Midlands 1 638 10 22 9 16 7 11 7 Government Office Region East of England 1 972 12 27 11 25 11 15 10
London 1 804 11 38 15 37 16 19 13
North East 883 5 13 5 13 5 7 5
North West 2 482 15 37 15 36 15 24 16
South East 2 610 15 38 15 34 14 23 15
South West 1 837 11 24 9 22 9 14 9
West Midlands 1 813 11 29 11 29 12 18 12
Yorks & Humber 1 804 11 27 11 26 11 20 13
School stage Primary 16 720 99 251 98 234 98 149 99
Middle deemed primary 123 1 4 2 4 2 2 1
School type Community 10 586 63 177 69 169 71 105 70
Foundation 359 2 7 3 6 3 5 3
Voluntary Aided 3 577 21 47 18 41 17 25 17
Voluntary Controlled 2 321 14 24 9 22 9 16 11
Urban/Rural Urban 12 130 72 218 85 209 88 129 85
Rural 4 713 28 37 15 29 12 22 15
All schools 16 843 100 255 100 238 100 151 100
The responding and non-responding schools were compared in relation to Government Office Region, school stage, school type and urban/rural location. Table 2.2 shows the breakdown of response (participated, refused, ineligible) by these factors. Although base sizes for the different categories are small, the percentage participating/refusing/ineligible is shown for ease of comparison. Schools in London and in the North East were most likely to refuse to participate, while those in the East Midlands were most likely to be ineligible. Voluntary Aided schools were less likely to participate than Foundation or Voluntary Controlled schools.

Table 2.2. Response by GOR, school stage and school type and urban/rural locality: primary schools in England. Issued
sample Ineligible Refused Participated
n % n % n % n % of issued
% of eligible
East Midlands 22 100 6 27 5 23 11 50 69 Government Office Region East of England 27 100 2 7 10 37 15 56 60
London 38 100 1 3 18 47 19 50 51
North East 13 100 0 - 6 46 7 54 54
North West 37 100 1 3 12 32 24 65 67
South East 38 100 4 11 11 29 23 61 68
South West 24 100 2 8 8 33 14 58 64
West Midlands 29 100 0 - 11 38 18 62 62
Yorks & Humber 27 100 1 4 6 22 20 74 77
School stage Primary 251 100 17 7 85 34 149 59 64
Middle deemed
primary
4 100 0 - 2 50 2 50 50
School type Community 177 100 8 5 64 36 105 59 62
Foundation 7 100 1 14 1 14 5 71 83
Voluntary Aided 47 100 6 13 16 34 25 53 54
Voluntary
Controlled
24 100 2 8 6 25 16 67 70
Urban/Rural Urban 218 100 15 7 74 34 129 59 64
Rural 37 100 2 5 13 35 22 59 63
All schools 255 100 17 100 87 100 151 100 100
Responding and non-responding schools were also compared in terms of deprivation. The Indices of Deprivation 2004,22 are measures of deprivation for every ward and local authority area in England. A number of indicators covering a range of domains (income, employment, health deprivation and disability, education, skills and training, housing and geographical access to services) are combined into a multiple deprivation score (MDS) for each area. A higher score indicates a greater degree of deprivation. Table 2.3 compares ineligible, participating and non-participating schools with the deprivation score for the issued sample. There were no significant differences for deprivation score between groups.

Table 2.3. Multiple deprivation score (MDS) for the issued sample, ineligible, refused, and participating primary schools in England.
Issued sample Ineligible Refused Participated MDS
n % n % n % n %
0-9 10 4 1 6 2 2 7 5 10-19 112 44 13 76 37 43 62 41 20-29 75 29 3 18 26 30 46 30 30-39 43 17 0 0 15 17 28 19 40-49
15 6 0 0 7 8 8 5
All schools 255 100 17 100 87 100 151 100 The main reasons given for refusal to participate are given in Table 2.4. Thirty four schools (39%) did not give a specific reason. Ten schools (11%) had �other� reasons for not participating such as they were already looking at their school meals, the kitchen was being refurbished, or the head was simply not interested.
Table 2.4. Main reasons given for non participation in 87 primary schools in England. Reasons for refusal n %
Too busy 18 21 Personnel changes 9 10 Ofsted inspection imminent 4 5 Do not take part in surveys 3 3 Involved in other similar surveys/healthy eating schemes 2 2 Cook refused 2 2 Kitchen too busy at lunchtime 5 6 Other 10 11 Not given
34 39
Total 87 100
2.2 Development of data collection tools and piloting
2.2.1 Pilot Study The data collection and research protocols were piloted in nine schools over two consecutive lunchtimes and in one school for a single lunchtime during February 2005. All interviewers received a one-day face to face briefing and attended a full day de-briefing session in which they provided feedback on the data collection tools and method. The briefing protocols were adapted from the previous survey, School Meals in Secondary Schools in England.6
2.2.2 Data Collection Tools Table 2.5 lists the data collection tools and the main purpose of each of them. Copies of the actual tools are included in the appendices. There were two levels of data collection: at school level and at pupil level. All data collection tools were based on those successfully used in the previous survey School Meals in Secondary Schools in England.6

Table 2.5. Data collection tools, main purpose and level of collection of data in 151 primary schools in England. Data collection tool Main purpose
School level information Food Inventory Questionnaire To record all food and drink items on offer each day in the school
dining room. Food Visibility Questionnaire To assess compliance with the guidelines for school meal provision
at the beginning and end of lunchtime Eating Environment Assessment To assess the potential of the dining room as an environment to
encourage healthy eating Portion Weights Booklet To record weight of two portions of up to twelve food items each
day (infant and junior portions weighed on alternate days). Meal Record Booklet To characterise the choices on offer to pupils in terms of set
meals/meal combinations. School Caterer Telephone Interview To obtain information about the lunch service, cooking practices,
healthy eating activities and monitoring. Bursar/ Head/ LA Telephone Interview To obtain information on the nature of contract, monitoring, school
participation in schemes, and to obtain a copy of the specification/service level agreement for the school lunch service.
Specifications �Qual� & �Quant� Tools To extract qualitative and quantitative information from the school lunch specification/service level agreement.
Pupil level information Tray Check Sheet To record pupil food and drink choices and leftover weights of all
items Pupil Questionnaire To record age, sex and lunchtime activities Free School Meal Record Sheet To identify which meals were free school meals.
2.2.3 School level data collection tools Food Inventory Questionnaire The food inventory was intended to record all foods and beverages offered each day by the school caterers at lunchtime, to assess food provision. Interviewers completed the questionnaire each day using CAPI (Computer Assisted Personal Interviewing). Items which were known to be commonly available in schools were included specifically so that interviewers would have to code �yes� or �no� for each of them. Foods were grouped into categories (e.g. main meals, vegetables, sandwiches) and interviewers typed in any additional items which were on offer within that category but were not explicitly listed. An additional field was included for pre-packaged foods to record the weight where it might vary from school to school. The inventory was completed once each day at the beginning of service. Food Visibility Questionnaire A tool was needed which specifically measured whether the school was compliant with the nutritional standards. The Nutritional Standards for School Lunches14 stipulate that certain foods from the major food groups must be available each day. Because the expectation is that the foods that meet the compulsory standards should be available throughout the service,d the Visibility questionnaire was used twice each day, at the beginning of service and 10 minutes before the end of service. The Food Visibility questionnaire (also completed using CAPI) was therefore different from the Food Inventory in that it was used specifically to check whether items were available that complied with the standards at the beginning and end of service. For example, the questionnaire asked whether at least one item from the milk and dairy foods group was available, requiring a �yes or no� answer, as opposed to a list of all milk and dairy products available. Items which were available but not visible, for example
d This is made explicit in the catering guidance for secondary schools but not for primary schools.

items being kept warm or cold may not have been captured in the Inventory questionnaire, or may have been visible at the beginning, but then have run out shortly after service began. For each of the standards, the interviewer had to input whether he or she could see an item which would meet it. If they could not, they were prompted to ask a member of staff whether there was an available item which met the standards and if so, what the item was and why it was not visible. The Visibility questionnaire also recorded whether drinking water and drinking milk were available. While it is not compulsory for them to be provided in schools, caterers are strongly recommended to make them available to pupils. Eating Environment Assessment This questionnaire was completed once during the week in each school (again using CAPI). It was designed to record features of the school dining room such as whether menus were displayed, whether staff encouraged children to eat healthily, whether specialist diets were catered for, and whether there were competing outlets present (eg tuckshops), with a view to assessing how well the dining room provided an environment to promote healthy eating. Portion Weights Booklet Information on typical portion weights was needed for the nutrient analysis of foods eaten by pupils. Each day, interviewers weighed 2 portions of each of 12 different food items and recorded the weights in the Portion Weights Booklet. In schools where different size portions were served to infants and juniors, the interviewers alternated daily between weighing infant and junior portions, weighing junior size portions on one day and infant portions the next day. Caterers were reimbursed for the cost of this food, so the cost of items taken each day was also recorded on the sheet. Meal Record Booklet Interviewers were asked to complete this each day to identify the meals or meal combinations on offer to pupils. School Caterer Telephone Interview A semi-structured questionnaire was developed (based on the one used for the Secondary School Meals project) which was administered to school head cooks or catering managers via a telephone interview. The interview was used to obtain details of the school food service, including when food was offered, numbers of meals served, proportion of free school meals, competing outlets, the nature of the contract, and cooking practices particularly relating to the use of salt and fat and the provision of fruit and vegetables. The information gathered on cooking practices not only provided insight into adoption of healthier catering practices, but also assisted with the coding of food items within the inventory data. Bursar / Head/ LA Telephone Interview A questionnaire was also developed (based on the one used for the Secondary School Meals project) to be administered to the Head Teacher or Bursar, or LA representative via a telephone interview. The main objectives were to establish the nature of the catering contract, the nature of the monitoring of nutritional standards, and to obtain other information about the lunch service within the school. It was also designed to elicit a copy of the specification/service level agreement relating to the school meals service, if such a document existed. It was often necessary to conduct the interview with more than one respondent (usually someone at the school and then an LA/caterer representative) in order to obtain all the data. Specifications ‘Quant’ & ‘Qual’ Tools In order to examine whether and how the school meal specification or service level agreement was addressing nutrition and healthy eating, two data collection instruments were

devised using both a quantitative and qualitative approach (�Quant Tool� and �Qual Tool�). This approach was taken because it was believed that the level and content of specifications relating to nutrition and healthy eating would be extremely diverse. The purpose of the tools was to capture and interpret this variation in an analytical and descriptive way. One key strand within the quantitative analysis was to determine to what degree any statements relevant to nutrition within the documentation were mandatory. The two tools were designed to be used in parallel. The �Quant Tool� and the �Qual Tool� contained the same headings. The purpose of the �Qual Tool� was to extract and record the relevant text from the documents. The design and development of these tools was based loosely on the approach of Coles and Turner.20
2.2.4 Pupil level data collection tools Tray Check Sheet The Tray Check Sheet was designed to record individual pupil lunchtime choices. The design was based around the Inventory, in that foods were grouped under the same section headings (e.g. main meals, vegetables, sandwiches). Items which were known to be commonly offered were pre-printed on the sheet with tick boxes next to them to capture first and second helpings. Several blank spaces were included under each section heading for the interviewers to write in items which were on pupils� trays but not in the pre-printed lists. These sheets also included a box for the leftover weight of each item to be recorded, whether the item was pre-printed or written in. Pupil Questionnaire The individual pupil questionnaire was printed on the reverse side of the Tray Check Sheet. It was designed to record age, sex, year and form, and whether the child had eaten fruit in school that day. For those aged 7 or over, the questionnaire asked whether they participated in any activities at lunchtimes which impacted on the time they have available for eating lunch, and whether they had purchased any other food or drinks at school that day, other than at lunchtime. Free School Meal Record Sheet As most primary school meals are prepaid, it was not usually possible for interviewers to determine at the time of interview which pupils were eating a free school meal. Interviewers were asked to record the pupil�s name next to a sticker with their pupil number on it, and the sheet was taken to the school secretary for those pupils receiving free school meals to be identified. Once a �Yes� or �No� had been ticked for each pupil number, the list of names was removed to maintain confidentiality.
2.3 Data Collection
2.3.1 Main-stage briefings Before main-stage fieldwork, 11 one-day face to face interviewer briefings were held. The briefings were designed and conducted by researchers from TNS Social and King�s College London (KCL), having been tested in the pilot study. A total of 116 interviewers were briefed. The protocol called for interviewers to work together in teams of two in each school. Generally, interviewers collected data in more than one school over the fieldwork period. The briefings included an explanation of each of the tools and then practical exercises so that the interviewers could practice using them correctly in preparation for fieldwork. All interviewers received a detailed set of project instructions.
2.3.2 Pre-fieldwork Visit One of the interviewers from the pair visited the school, usually in the week before fieldwork. The purpose of this visit was to confirm the dates of fieldwork, to make contact with the

Head / Cook / Catering Manager and to observe a lunchtime service to inform their planning on how best to manage data collection. He or she also left behind posters to be displayed in the dining hall to advertise the dates of fieldwork. We do not believe that this advertising significantly affected food provision or food choice. Schools plan well in advance for their catering provision and would not have been able to alter their menus in response to the survey. Moreover, the advertising was minimal (a single poster).
2.3.3 Fieldwork The interviewers worked in pairs. Each interviewer was allocated the role of either a ‘Weigher’ or a ‘Selector’. The Weigher and Selector were both provided with a CAPI machine for the duration of the fieldwork. Schools were visited on five consecutive school days. In most cases this was Monday to Friday in a single week, but in 18 schools, due to Bank Holidays, General Election days or other school-specific reasons, the sequence was not five consecutive days within a single week. In these situations, the schools were visited on the next available day. The two interviewers in the team arrived at the school between half an hour and an hour before the start of lunchtime service. The Weigher collected the food portions to be weighed, completed the Meal Record Booklet to indicate the meals or meal combinations on offer, and completed the first Visibility questionnaire on their CAPI machine, while the Selector recorded all food and drink items on the Inventory on their machine. They also set up a �weighing table�, which was covered with a brightly coloured cloth to increase visibility. The length of the lunch service varied greatly between schools and ranged between 25 minutes and 75 minutes. The Selector was responsible for selecting 10 children at regular intervals, spread throughout the lunchtime service, after the child had chosen and collected their meal. If the pupil refused or was unable to participate, the interview was recorded as �unproductive� and the interviewer then waited another time interval before selecting another pupil. Generally, the interviewer followed each selected child to his or her table and interviewed the child there, but in some cases the child was interviewed at the food service point. The Selector attached a label with an individual pupil number to the Tray Check Sheet and recorded what was on the child�s tray. The Selector then administered the pupil questionnaire and asked the pupil to take his or her tray with any leftovers to the weighing table once they had finished their lunch. Another sticker with the pupil�s unique number was affixed to the tray so that the leftovers could be linked with the Tray Check information. The Selector was instructed to approach 10 pupils per day with an expected response rate of close to 100%. In schools with fewer than 50 pupils eating a school lunch each day, interviewers were instructed to approach the number of children on each of the 5 days that would capture all of the children in the school who were taking school meals. There were many different catering arrangements across the schools studied. Some schools had more than one dining room and/or service point. In these schools, interviewers selected pupils from all service points. At the beginning of service the Weigher obtained two portions of 12 different items from the catering staff. The caterer was asked whether infants and juniors were served different size food portions, and if so, the Weigher was instructed to weigh infant portions on one day and junior portions the next. He or she was instructed to obtain the components of the main meals first and then to choose popular foods up to a total of 12. These were weighed to the nearest 2g on kitchen scales (Soenhle) and recorded on the Portion Weights sheets.

In those schools where the lunch break was short, the Weigher was needed to assist the Selector in selecting and interviewing pupils. Ten minutes before the end of the lunch service, the Weigher completed a second Food Visibility questionnaire on their CAPI machine to fully assess compliance with the nutritional standards. At the end of the lunch service, the Tray Check Sheets were matched with the trays containing any leftovers. All leftovers were weighed to the nearest 2g and recorded on the Tray Check Sheets. This procedure was repeated each day. If a child was selected who had participated previously, the next child leaving the service area was approached. The Eating Environment Assessment was completed on one day towards the end of the week on the Weigher�s CAPI machine.
2.3.4 Telephone interviews Telephone interviews with the Head Cook/Catering Manager and Head/Bursar/LA were conducted by nutritionists from KCL in the week prior to or during the week of fieldwork for each school. An initial call was made to the head and to the school cook to arrange a convenient time to carry out the interview and to explain its purpose. This call also identified the most appropriate person with whom to conduct the interview. For the Head/Bursar/LA interview, 79% of respondents were head or deputy head teachers and 21% were Bursars or school secretaries. For the Head Cook/Catering Manager interview, 85% of respondents were head cooks or cooks, 5% were catering managers, 7% were dinner ladies and 3% were school administrators or supervisory staff. Respondents were contacted at the agreed times, and interviews were carried out using semi-structured questionnaires. If the respondent was unable to provide all the required information, a further respondent was identified and contacted. The median length of the telephone interviews was 15 minutes with the Head/Bursar/LA and 25 minutes with the Head Cook/Catering Manager.
2.3.5 Pupil Response Rate A total of 7 317 pupils were approached and had a Tray Check Form partially or fully completed. The original intention was to sample 50 pupils in each of 150 schools, resulting in a total of 7 500 pupils. In the issued sample, there were a number of schools with fewer than 50 pupils eating a school lunch each day, and it was decided to include these schools in the survey, with fewer pupils being sampled each day. Of the 7 317 pupils approached, 32 (0.4%) refused to participate and a further 50 (0.7%) agreed to take part but their Tray Checks were not able to be used as they had been completed incorrectly by the interviewers. It was also necessary to exclude from the analysis those pupils for whom age and school year or sex were not known based on the completed forms (177). Analysis was thus conducted on 7 058 pupils (3 455 boys, 3 603 girls). Of these, 3035 were infants (Keystage 1: Reception, Year1 and Year 2), and 4023 were juniors (Keystage 2: Years 3 to 6). Table 2.6 shows the breakdown of the sample by school year, age and gender.
2.3.6 School level response rate Data were collected over five days in all schools. This was usually Monday to Friday, but in 18 schools the fieldwork ran into a second week due to Bank Holidays, the General Election or staff training (INSET) days. Interviews with the Head Cook/Catering Manager and the Head/Bursar/LA interview were conducted with all 151 schools. 66 sets of documentation on the school meals service were obtained, relating to 112 schools.

Table 2.6. Distribution by school year, age and gender of 7 058 pupils participating in the study in 151 primary schools in England. Boys Girls
School year n % n % Reception 417 12 420 12 1 520 15 522 14 2 579 17 577 16 3 466 13 561 16 4 496 14 533 15 5 478 14 494 14 6 499 14 496 14 Age 4 133 4 147 4 5 439 13 451 13 6 552 16 555 15 7 516 15 529 15 8 482 14 559 16 9 499 14 498 14 10 469 14 522 14 11 364 11 342 9 12 1 0 1 0 Total 3 455 49 3 603 51
2.4 Data Preparation Food coding The Food Standards Agency (FSA) nutrient databank was used as the source of nutrient data. The food and drink items recorded by interviewers on the Inventory questionnaires were coded at KCL. Information obtained in the caterer interview on types of cooking oil or fat used, cooking methods, type of milk used, type of spread on bread or sandwiches and addition of salt to cooking water was used to assign codes appropriate for each school to each food. Information on the ingredients in dishes and recipes was obtained from the school caterers and used to identify an appropriate existing code on the databank, or to create a new food code. In addition, the codes created for School Meals in Secondary Schools in England6 for items such as sandwiches were used and amended as necessary. New data were entered onto the nutrient databank to create new permanent codes where required. The coded inventory data were then passed back to TNS to be merged in with Tray Check data at the pupil level. The Tray Check Sheets were computer scanned and the data coded, then food names were matched against the inventory data and the relevant code applied to each food chosen by a pupil. Queries were referred to KCL nutritionists for clarification. Allocation of food groups Food groups for Inventory and Tray Check analysis were similar to those used in School Meals in Secondary Schools in England,6 (based on a combination of nutrient databank food allocations (e.g. �white bread�, �egg dishes�, �sausages�, �peas�) and inventory food group descriptions (�main meals�, �salads�, �jacket fillings�, �bread (unfilled)�, �dessert�). The 116 easily identified groups of food and drink were further aggregated into 19 groups (Appendix A14) which highlighted the key food types e.g. chips and other potatoes cooked in oil or fat,

baked beans, lower fat or higher fat main dishes, and facilitated a presentation of food group profiles that linked to the nutritional standards and the CWT guidelines. Portion size allocation The selection of food portions for weighing (Section 2.2.3) generated over 8 400 food weights based on the foods offered in 149 schools (data were not obtained for 2 schools). Weights were not recorded for every individual item offered in every school. Therefore it was necessary to compute weights to estimate the nutrient content of all foods chosen and eaten where the weight in a school had not been recorded. The following steps were followed to establish a weight for every item: 1. The school specific and age specific (infant or junior) weight of food as recorded by the
interviewer was used (approximately 78% of tray check foods). 2. The average weight of the food (infant or junior specific) based on information in all of
the schools where a weight had been recorded (a further 16% of foods). 3. The weight of food corresponding to the average weight in 116 food groups measured
using all of the weights recorded in all the schools (remaining 4% of foods). A number of average weights were computed for some food groups reflecting the difference in serving size for simple and composite foods. The weights allocated in this step were individually checked.
This generated a weight for every item chosen by a pupil. Where a tray check sheet indicated that a second helping had been taken, a factor of 0.4 was used to compute the size of the second helping (i.e. second helpings were assumed to weigh 40% of the first helping). Second helpings of drinks were allocated a factor of 1.0, as second helpings of drinks tended to be full glasses or cartons. When estimating the nutrient content of foods as eaten, the leftover weight of the food was subtracted from the allocated portion weight. This was the basis for estimating the nutrient content of the food actually consumed. In 3.3% of cases, the weight of the leftover was greater than the allocated portion weight, and in these instances, the following steps were taken:
• The food codes associated with negative weights were identified within each school • If a food code was associated with a negative weight more than once and on 50% or
more of the occasions on which it was chosen, the school specific weight was replaced with the average age specific weight for that food code. This weight was allocated to all pupils choosing the food. This assumes that the portion weight recorded by the interviewer was not typical of the weight of the food actually served in that school.
• If the weight eaten was between -20g and 0g, the discrepancy was assumed to be due to normal variation in serving size, the child was assumed to have eaten none of the food, and the weight eaten for that food for that child was assumed to be zero.
• If the negative weight eaten was greater than -20g, it was assumed that either an error had occurred in the weighing of the leftover or that the pupil had been served an atypical portion, so a weight equivalent to half of the originally allocated weight of food served was assumed to have been eaten by that child.

2.5 Limitations Sampling. Primary schools with less than 50 pupils on roll were not included in the sampling frame, and a number of schools were deemed ineligible due to the small numbers of children taking school meals. The exclusion of these schools from the survey means that small schools are under-represented, and these schools are likely to be those with no hot meal provision at lunchtime. Inventory. There were some instances where water provision in schools may have been underestimated. Water was often not available at the food service points (served at the table or available at water coolers etc.) and may therefore have been missed off the Inventories completed by the interviewers. Visibility. Due to technical difficulties with CAPI, visibility data in 5 schools were collected on 4 days rather than 5. These schools were excluded from the analysis when considering the nutritional standards. It is likely that the results reported in Section 5.1 slightly over estimate the number of schools failing to meet the standards, because checks run against food inventories showed items being offered that were not listed on the visibility questionnaire. It was not possible to run cross-checks between the visibility and inventory questionnaires at both the beginning and the end of service, so the visibility data as reported provided the basis for the analyses. Tray checks. 50 tray checks incorrectly completed by the interviewers and tray checks for 177 pupils for whom either age/school year or gender were not known were excluded from the food choice and nutrient analysis. Information on free school meals was not available for 470 of the 7 058 pupils sampled. Negative weights. 1 260 instances of negative weights of food eaten were identified following the allocation of portion weights to tray check data, representing 3.3% of all foods chosen. These were evenly spread across a large number of foodcodes and across infant and junior pupils, suggesting that the problem was not confined to particular schools or interviewers. Jamie Oliver. The present study was commissioned by the DfES and FSA in 2004 as the next step following the School Meals in Secondary Schools in England survey.6 However, at the time of fieldwork in 2005, there was increased awareness of issues about school meals, mainly due to the broadcast of Jamie’s School Dinners on Channel 4. Possible effects on the present study, as indicated by comments made by school and catering staff, included a reduced takeup of school meals, defensiveness amongst school caterers, and increased interest in the study.
2.6 Data Checking
2.6.1 Data collection and coding of interviewer data All divisions within TNS are adherents to the ICC/ESOMAR International Code of Marketing and Social Research Practice. In addition, all researchers in the UK are bound by the Code of Conduct of the Market Research Society. TNS is also affiliated to the BMRA, and is registered under the Data Protection Act as a market research company with all the relevant legal responsibilities as far as confidentiality is concerned. In 1992 TNS was registered by the BSI as being able to produce goods or provide services in accordance with ISO 9001: 1987/EN 29001: 1987/BS5750: Part 1. TNS have received accreditation to provide services in accordance with BS7911 (MRQSA). The TNS quality policy entails the

formulation, implementation and maintenance of an effective quality assurance system, in accordance with BS EN ISO 9001 and adherence to BS 7911 as the service standard. TNS� fieldwork operation is IQCS (Interviewer Quality Control Scheme) accredited. Key quality control measures which related to this contract were as follows: • Final questionnaires were checked by two TNS executives, and were approved by the
client prior to release/printing. • All interviewers and supervisors were personally briefed by the research team. • The CAPI ((Computer Assisted Personal Interviewing) data collection method ensured
that all questions were answered in all schools as interviewers were unable to move on without inserting answers where required and that for example only one answer could be given to avoid confusion (e.g. Shepherds Pie available must be answered either �yes� or �no�).
• A minimum of 5% of all coding (including the coding of �other� responses) was checked by another coder. If the work of any individual coder involved frequent errors, then that coder�s work was 100% verified and re-worked if necessary.
• For scanned questionnaires, early survey returns were entered both manually with 100% verification and via the scanning system. The scanning system was then adjusted until the accuracy of the scanner was above that of 100% verified data.
• For keyed data, data were entered using a micro-based system of data entry with software which automatically provided checks on the accuracy of data entry and sought to prevent column slippage. There was a 10% verification of the data.
• Computer edit checks for completeness, range limits and internal logic were made for each questionnaire. An error listing was produced of any edit failures on each questionnaire. Corrections were made by the research executive with reference to the source document or the scanned image of the source document. For this project, specific items checked included: leftover weights greater than 200g (Tray Check questionnaire); food items not matching the coded Inventories (Tray Check questionnaire).
• All data were checked both by a data processor and a TNS executive before being released to the client.
• Written reports were checked by two TNS executives prior to release to the client.
2.6.2 Preparation of dataset Use of FSA databank. New recipe and food data sheets were compiled and checked by KCL nutritionists prior to being entered onto the databank. Data entry was also checked for accuracy. Inventory coding. Allocation of FSA databank foodcodes to inventories was checked for consistency within and between schools. Classification of foods into food groups was checked against databank sub-groups. Foodcode and food group allocations were checked against food names. Portion weight data. Food group portion weight ranges were checked and outliers removed. Portion weight allocations based on food groups were checked manually for accuracy.
2.7 Statistical Analysis Statistically significant differences in the profiles of food provision between groups of schools (e.g. according to region, type of school) were assessed using analysis of variance. Differences in the profiles of food consumption were assessed using chi-squared tests. Statistically significant differences in the average amounts of food or nutrients consumed by different groups of pupils (e.g. between boys and girls or between age groups) were assessed using unpaired t-tests or one-way analysis of variance. Univariate general linear modelling

was used to assess the statistical significance of differences between groups of schools or pupils when additional factors (e.g. school year or age) were taken into account. The cut-off point for statistical significance was p<0.05. Due to the large number of comparisons made, some of the apparently statistically significant differences may be due to chance (type 1 error), but there was no straightforward or consistent way to correct for the number of analyses made with respect to the cut-off points chosen. In addition, due to the large number of observations in some analyses, very small differences may appear statistically significant and these have been reported with due caution. The present study was purely observational, and so it was not possible to infer cause and effect when reporting associations. It should be remembered that:
• If there are causes of different meal choices, they may lie in variables that were not measured in the study (e.g. economic evaluation by caterers of takeup and wastage when particular foods are offered)
• Inter-correlations among measured variables make attribution of causes problematic • The direction of causation is unclear

3 The Catering service, cooking practices and the eating environment
KEY FINDINGS 1. The school catering service was usually provided by a Direct Service organisation (60%)
or a contractor appointed by the Local Authority (21%). 7% of schools appointed their own contractors, 3% provided catering �in-house�, and 9% had other types of catering service.
2. The majority of schools (81%) had fixed cost/fixed price contracts (including buy back
agreements with the Local Authority), and 11% of schools had profit and loss contracts. 3. Most schools (92%) operated a cafeteria-style service with choice. 3% offered family
service with no choice, 2% were cash cafeterias, and 1% offered a packed lunch service. 4. Mean school meal uptake was 42%. Of the pupils that had applied for free school meals,
85% took them. 34% of all school meals taken were free school meals. The mean prices of school meals and free school meals were £1.48 for infants and £1.49 for juniors. In 90% of schools, meals were prepaid.
5. 31 schools had tuckshops and 5 had vending machines (3 offering cold drinks, 1 offering
hot drinks and 1 offering snacks). Pupils had access to 10 of the tuckshops and the 3 cold drinks vending machines at lunchtime.
6. 78% of schools cooked meals on the premises. 4% prepared or cooked some food on site,
and 18% of schools had their meals delivered. 7. Most school caterers grilled or oven-baked chicken/turkey, fish and potato products, with
the exception of chips, which were usually fried. 96% of caterers used vegetable oil for frying.
8. Caterers using spread on bread or sandwiches used mostly sunflower (46%) or soft spread
(31%). Only 11% used a low fat spread. 74% of caterers offered low fat yoghurt, and 81% of squash drinks offered were low calorie/no added sugar.
9. Salt was available to pupils in only 9% of schools, mostly on request rather than at the
serving point. 34% of school caterers used no salt when preparing food whilst 10% added salt to recipes and to water when cooking vegetables, rice, pasta and potatoes.
10. Over 60% of school caterers said they had been involved in activities to promote healthy
eating to pupils in the last year, and approximately half (53%) had run promotions aimed at encouraging pupils to choose more fruit and vegetables.
11. 28% of caterers had completed some form of training in healthy eating or healthy cooking
in the past 12 months. 12. Most schools were participating in the Healthy Schools programme (69%) and the School
Fruit and Vegetable Scheme (87%).

3.1 The school meals service Information regarding the school meals service was obtained through telephone interviews with the school cook or catering manager and with the head or bursar or LA contact.
3.1.1 Who provided the catering service? The principal provider of school catering services was either a Direct Service Organisation (DSO) or a contractor appointed by the LA (Table 3.1). However, 7% of schools appointed their own contractor and 3% of schools provided their own catering service (�in-house�). There were 13 schools (9%) which had another type of service provider, such as service provided as part of a PFI scheme and 4 schools that were part of a consortium (a group of schools joining together to arrange their catering service).
Table 3.1. Provision of the school meals service in 151 primary schools in England. Provider of school meals service n % Local Authority Service Provider/DSO 90 60 Contractor appointed by the LA 32 21 Contractor appointed by the school 11 7 Other 13 9 In-house 5 3
3.1.2 How was funding delegated? At the time of the survey, funding for school meals was not always automatically delegated to primary schools, as compared to secondary schools in which funding is automatically delegated. If the LA decided not to automatically delegate their funding, primary schools could choose to have their funding delegated (delegated by request) or the funding remained in the control of the LA. In the present sample, 82% of schools had their funding automatically delegated, 12% chose to have it delegated, and 6% had their funding controlled by the LA (Table 3.2).
Table 3.2. Delegation of funding in 151 primary schools in England. Delegation of funding n %Automatically delegated by LA 124 82Delegated by request 18 12LA controlled 9 6
3.1.3 Types of contract or service level agreement (SLA) The majority of schools (81%) had fixed cost/fixed price contracts for their school meals service, including buy back agreements between the school and the LA, in which funding was delegated to the school and automatically given back to the LA to pay for the school meals (Table 3.3). Seventeen schools (11%) had a profit and loss/breakeven contract, which included all of the schools who had in-house catering.
Table 3.3. Type of contract or service level agreement (SLA) in 151 primary schools in England.
Type of contract n % Fixed cost/fixed price 122 81 Management fee/cost plus 10 7 Profit & loss/breakeven 17 11 Other 2 1

Of the 151 schools in the survey, six expected to and did make a profit from their catering service, while twelve had made a profit but did not expect to, and the remaining 133 schools (88%) did not expect to make a profit. Of the schools making a profit, 11 invested their profit in the catering service, 4 put it into the catering service and other services, and 3 schools used it for other services.
3.1.4 The lunchtime service Prior to the start of the study, it was anticipated that the main type of service at lunchtime in primary schools was a family service (pupils served at tables with either no choice or a very limited choice of food and drink items).20 However, it was found that the majority of schools (92%) operated a cafeteria-style service with choice, where children took a tray up to a hatch and chose a meal from various options of main, starch, vegetables/salad, dessert and drink (Table 3.4). Cash cafeterias (in which pupils were able to purchase freely from all the items on offer) were scarce. Two schools had a combination of two types of service, usually one for infants and one for juniors.
Table 3.4 Number and percent of schools with various types of service in 151 primary schools in England.
Type of service n % Cafeteria (choice) 139 92 Family service (no choice) 4 3 Cafeteria (no choice) 2 1 Cash cafeteria 2 1 Packed lunch 2 1 Cafeteria (choice) & Cash cafeteria 1 1 Cafeteria (choice) & Family service (choice) 1 1
School caterers were asked about the amount of choice available to pupils, categorized as �two or less� or �three or more� options for each element of the meal (Table 3.5). Two thirds of schools offered 3 or more choices of the protein containing element of a meal, and three quarters offered either 1 or 2 vegetables, while 83% offered 3 or more dessert choices.
Table 3.5. Number and percent of schools with two or less, or three or more choices of protein, vegetable, starch, dessert and drink options in 143* primary schools in England.
Number of choices Part of meal Two or less Three or more n % n % Protein 55 38 88 62 Vegetable 107 75 36 25 Starch 117 82 26 18 Dessert 24 17 119 83 Drink 111 78 32 22
* Excludes cold or packed lunch schools as well as those which stated they had no choice within the menu. Caterers were asked whether fruit was counted as a dessert option or an extra and whether salad was counted as a vegetable option or an extra. Of 148 schools (packed-lunch-only schools excluded) 123 (84%) considered fruit as a dessert option and 49 (33%) considered salad as a vegetable. This meant that a pupil was not allowed a dessert as well as fruit, or a salad in addition to a hot vegetable. The majority of schools (85%) encouraged pupils to take all the components of the meal, while 12% required pupils to have all the components; 3% said it was the pupils� choice.

One school used a points system. Each item on the menu was allocated a number of points (protein = 4, vegetable (including salad items) = 1, starch = 2, dessert = 2, drink = 1) and pupils were allowed up to 10 points. Within this points system pupils were required to have either fruit or a vegetable/salad option. The pupil roll number for the 151 primary schools surveyed ranged from 65 to 753, with a median of 247. The number of pupils having a school meal ranged from 22 to 325, median of 103 (IR=70-155), representing between 11% and 99% of the children on roll in each school, with a mean uptake of 42% (SD=15%) (Table 3.6). In the school with the highest uptake (99%), the caterer was unable to identify why school meals were so popular. At the lower end of the range, possible reasons given by caterers for poor uptake included a fall off in pupil numbers during the summer term when school trips were more frequent and more pupils brought a packed lunch, and the effect of the negative media coverage of school meals at the time of the study.
Table 3.6. Number and percent of school meal and free school meal uptake in 150* primary schools in England. Mean SD Median IR Min Max School Meal Uptake Number of pupils 291 137 247 183-389 65 753 Number of pupils taking a school meal 119 66 103 70-155 22 325 Percent uptake of school meals 42 15 39 31-51 11 99 Free School Meal Uptake Number of pupils applied for FSM** 51 46 40 16-70 2 245 Number of pupils taking FSM 43 42 30 10-64 1 217 Percent uptake of FSM** 85 16 90 77-100 33 100 FSM as % of all pupils 14 12 11 5-22 1 56 FSM as % of all school meals 34 22 32 14-50 2 98 *excluding one school providing free meals to all pupils **data on FSM applications only available from 131 schools In the present study, 20 schools were unable to provide figures for the number of pupils either eligible or who had applied for FSM, and the remaining 131 were only able to provide information on the number of pupils who had applied to receive a FSM, rather than the number eligible. The majority of schools said that they were aware of a pupil�s entitlement to a free school meal only if an application had been completed, hence the figures reported are based on applications rather than eligibility (which may be greater). The number of free school meals taken daily in each school ranged from 1 to 217, with a median of 30 (Table 3.6). Of the 131 schools that were able to provide data on free school meal uptake, the median number of FSM applied for was 51, ranging from 2 to 245. Using these figures, percentage uptake of free school meals was calculated, which ranged from 33 to 100%, with a mean of 85% (SD=16%) of the number who applied. However, this figure is likely to be an over-estimation as it is calculated from the number of pupils who had applied for a free school meal, rather than the number actually eligible. Primary schools were generally divided into infants (Key Stage 1 � encompassing reception, year 1 and year 2) and juniors (Key Stage 2 � encompassing years 3 to 6). It was found that on average, the cost of an infant school meal was £1.48 (SD=£0.13) over 129 schools. The average cost of a junior school meal was £1.49 (SD=£0.14), over 139 schools. Infant and junior meal prices were not obtained from all schools because some schools had only infant or junior pupils, some operated cash cafeterias, and in 1 school meals were provided free of charge to all pupils by the LA.

The price of a free school meal was similar to that of a paid school meal. The average for infants was £1.48 (SD=£0.14) and for juniors was £1.49 (SD=£0.14), over 128 and 136 schools respectively. Free school meal prices were not obtained for all schools, either because schools did not know the price of a free school meal, or because the LA was unable to specify the price of an individual free school meal. There were 2 schools where children could pay extra for a drink which was not included in a free school meal. School caterers were asked how children paid for their school meals (Table 3.7). In the majority of schools (90%), pupils paid for meals in advance. In 5% of schools pupils paid a fixed price each day in the dining room, 1% used smart cards and 1% operated cash cafeterias. There was one school in which all the meals were served to pupils free of charge (a scheme run by the LA).
Table 3.7 How children paid for their school meals in 151 primary schools in England How children pay for their meals n %Pre-paid 136 90Fixed price (ticket) 8 5Cash cafeteria 2 1Smart card/cashless 2 1Cash cafeteria & Pre-paid 1 1Pre-paid & other 1 1Other 1 1
Schools reported that for the majority of pupils receiving free school meals, it was not apparent to the other pupils that they were in receipt of a free school meal. Pupils were identifiable in only 8 schools of the 151 surveyed. In 6 of these schools, pupils were identified through use of a token or pass system, and in 2 schools the only school meal provision was for pupils entitled to free school meals who received a packed lunch. In all other schools, pupils receiving free school meals were anonymous because there was no difference in provision between paid and free school meals. The length of the lunch period (including lunch service and recreation time) varied between 30 and 105 minutes, with a median of 60 minutes. Of the 151 primary schools surveyed, 84 schools (55%) had one sitting, 63 schools (42%) had two sittings and 4 schools (3%) had three sittings. Table 3.8 shows the variety of ways in which schools organised the service of food to large numbers of pupils at lunch time. In most schools (45%), the pupils entered by year, with the order being rotated so that the same year was not last every day. Those schools classed as �by sittings� are those where it was unknown how the pupils entered within those sittings. In 23 schools, pupils entered the dining room in the same order each day (either within various sittings or not), meaning that pupils who ate lunch towards the end of service may have been at a consistent disadvantage in terms of the food choices available if the school had the tendency to run out of popular items. It was not possible to calculate throughpute accurately (as was done for School Meals in Secondary Schools in England6), as the figures given by school caterers for the number of
e Throughput = time available for lunch (min) x number of seats available number of pupils taking lunch

seats available included seats used by children eating packed lunch brought from home, and time available for lunch included eating lunch and play time.
Table 3.8. How pupils entered the dining room in 151 primary schools in England How pupils entered the dining room n % By form/year (rotated) 68 45 By sittings 33 22 By form/year (same order each day) 21 14 By sittings & by form/year (rotated) 14 9 All at once 6 4 By sittings & all at once 3 2 Another way 3 2 By sittings & by form/year (same order each day) 2 1 By sittings & another way 1 1
The majority of schools (78%) cooked their meals on the premises. Twenty-seven schools (18%) did not cook/prepare their food on the premises and 6 schools (4%) prepared some of it on the premises. If schools did not cook their food on the premises it was usually transported hot from another location. There were some schools with regeneration kitchens, in which most of their food was cooked (reheated) from chilled or frozen. In addition, the sample contained three schools with cold/packed lunch where the food was made elsewhere and transported cold.
3.2 The Eating Environment Information about the eating environment was obtained from a brief questionnaire focused on the dining room environment and completed by interviewers at the latter end of the fieldwork period. The results are summarised in Table 3.9. Menus were displayed in just over half of schools (Table 3.9). The majority of schools (86%) did not display information or label any of their foods in the dining room. Where labelling did occur, the most common label was vegetarian (13%), followed by halal (2%) and organic (1%). There were no schools where food was labelled as kosher. When school caterers were asked if there was any need to offer or not offer particular foods, 14% said that they offered halal food, 72% offered vegetarian, 42% offered no beef, 23% offered no pork, and 1 school offered kosher food. 9% of schools annotated the school lunch menu with healthy eating information by highlighting healthier choices. A common example was home-made dishes being identified on menus, although these were not necessarily �healthier�. Other menus identified foods that were vegetarian and locally produced, or indicated that healthier dessert options such as fruit and yoghurt were available every day, or stated that no salt was used in food preparation. The source of promotional materials was vast, ranging from materials produced by the school caterer to those originating from trade bodies (eg: the British Potato Council, the Dairy Council) to those produced by the LA or the school itself. The main form of promotional material used was posters (54%). There was limited evidence of commercial marketing. One school was found to have a special promotion during the week of the survey, which was a healthy eating week.

Table 3.9. Assessment by interviewers of the eating environment in 151 primary schools in England.
Eating environment characteristic n % Menu displayed in dining room 85 56 Items labelled to indicate suitability for certain groups Halal 3 2 Vegetarian 19 13 Organic 2 1 No pork 1 1 None
130 86
Evidence of promotion of healthy eating Posters 82 54 Leaflets 10 7 Food labelling 7 5 Menu labelling
13 9
Source of healthy eating materials Food company 9 6 School caterer 28 19 Health Education Authority (HEA) 14 9 Food Standards Agency (FSA) 2 1 British Nutrition Foundation (BNF) 3 2 School 37 25 NHS 11 7 British Diabetic Association 4 3 Local Authority Caterer�s Association (LACA) 6 4 Trade bodies 7 5 National Nutritional Standards 1 1 Local Authority
7 5
Evidence of commercial marketing 12 8 In 93% of schools, children entered the dining hall in a queue organised so that all pupils had to walk past the area where the main meals were served. This was typical of the cafeteria style service seen in most of the schools surveyed. Interviewers reported that some schools required children to eat most of their meal before eating dessert (29%) while some never did (28%). Over three quarters of schools (78%) required children to eat most of their meal before leaving the table. School caterers were asked if there were places in the eating area or elsewhere in the school where children could buy food and drink at lunchtime and other times (Table 3.10 and Table 3.11). 31 schools had tuckshops either in the dining room or elsewhere in the school. Of these, 19 were classed as �healthier� tuckshops (selling fruit, fruit juice, milk etc.), 5 were classed as �less healthy� (selling cakes and biscuits etc.) and it was not known what the other 7 sold. No schools had snack vending machines in the dining area. There was one school with a snack vending machine elsewhere in the school, but the children were not allowed to use it at lunchtime. Two schools had cold drinks vending machines in the dining room, which were available to be used at lunchtime.

Table 3.10. Number and percent of schools where children were able to purchase food in the dining room at lunchtime or other times of the day in 151 primary schools in England. Type of vending machine/tuckshop
Could use at lunchtime
Could not use at lunchtime
n % n % Tuckshop 7 5 9 6 Cold drinks vending machine 2 1 0 0 Hot drinks vending machine 0 0 0 0 Snack vending machine 0 0 0 0 Other 1 1 0 0
Table 3.11. Number and percent of schools where children were able to purchase food not in the dining room at lunchtime or other times of the day in 151 primary schools in England. Type of vending machine/tuckshop
Could use at lunchtime
Could not use at lunchtime
n % n % Tuckshop 3 2 12 8 Cold drinks vending machine 1 1 0 0 Hot drinks vending machine 0 0 1 1 Snack vending machine 0 0 1 1 Other 1 1 1 1 The two schools with other ways for children to buy food and drink at lunchtime or at other times from the dining room or elsewhere in the school included a school with a snack trolley serving crisps and sandwiches (not available to those who had a hot lunch) and a school where bottled water could be purchased from reception. School caterers were also asked about breakfast and mid-morning break services. 12 (8%) of caterers provided a breakfast service, one of which ran only on a Friday, and 15% provided a mid-morning break service. A further 34 schools (23%) had a breakfast club, usually run by the school.
3.3 Cooking practices In 151 primary schools the school caterers were asked questions regarding their cooking methods or practices. This included issues such as the type of oil used for frying or whether they fried or oven baked certain products. Table 3.12 and Table 3.13 summarise the usual methods for cooking different fish, chicken/turkey and potato products.
Table 3.12. Usual methods of cooking fish and chicken/turkey products in 148* primary schools in England.
Cooking method Fish in batter
Fish fingers/ fish cakes
Other fish in breadcrumb
Chicken/ turkey burger
Other chicken/ turkey products
n %† n %† n %† n %† n %†
Fry 22 20 3 3 7 6 0 0 0 0Grill/oven bake 86 79 141 96 114 93 103 96 86 98Fry & grill/oven bake 0 0 0 0 0 0 0 0 1 1Other 1 1 1 1 1 1 4 4 1 1Did not serve 39 3 26 41 59
* 3 schools serving cold food only were excluded. �The percentage of those that serve these items

Table 3.13. Usual methods of cooking potato products in 148* primary schools in England.
Cooking method Chips Croquettes Hash browns Waffles Wedges n %† n %† n %† n %† n %† Fry 130 90 17 21 6 12 19 19 36 28 Grill/oven bake 13 9 62 77 42 86 77 76 84 65 Fry & grill/oven bake
1 1 2 2 1 2 4 4 6 5
Other 0 0 0 0 0 0 1 1 3 2 Did not serve 4 67 99 47 19
* 3 schools serving cold food only were excluded. �The percentage of those that serve these items The tables above suggest some use of healthier cooking methods within the schools studied. The majority of fish and chicken/turkey products were either grilled or oven baked. One caterer either fried or grilled/oven baked these items, depending on the type of product supplied. Potato products, if served, were normally grilled or oven baked, apart from chips, which were usually fried. Most caterers (51%) used medium straight cut chips. Eight caterers (6%) used low fat oven chips, but six of them added extra fat through frying (thereby undermining the benefit of the lower fat content of oven chips compared with fried chips). 96% of caterers used vegetable oil for frying, and of the other 4%, the majority used an oil rich in polyunsaturated fatty acids (PUFA). There was little evidence of caterers using fats high in unsaturates when making cakes, puddings and pastry. 28% of schools used hard block margarine and 26% used a packet mix when making cakes or puddings. 25% used a combination of hard block margarine and packet mix (depending on what they were making). Although packet mixes contain hydrogenated and therefore saturated fats, they are a lower fat option when compared to cakes made in the traditional way. 41% of schools used hard block margarine to make their pastry. Other schools used a variety including ready made puff pastry or frozen pastry, a mix of hard block margarine and lard, or a mix of lard and soft margarine. Of the 141 school caterers who used spread on their bread/sandwiches, most used either sunflower (46%) or soft (31%) spread. Only 11% used a low fat spread. Of the 148 school caterers, 77 (52%) said they had a policy written down about using salt in cooking, while 70 (47%) did not, and one cook did not know if there was one or not. The three schools not included were those which served only a cold or packed lunch. Table 3.14 shows the responses given by caterers when asked if they used salt in cooking, either added to water or to recipes. Approximately one-third of caterers added salt to the water when they were cooking vegetables, potatoes, rice or pasta. 10% of caterers added salt to both cooking water and to recipes, while 34% did not use any salt in cooking. When asked whether the children were allowed to use table salt, caterers in 137 schools (91%) reported that salt was not available to children, and 14 (9%) said it was. Responses suggested that salt was often available only on days when chips were served, although in some schools children could ask for salt and the cook would provide it from behind the counter, or the cook or midday assistant would put the salt on the child�s food. Only two schools had salt available at the serving point, and in one school this was only for use by older pupils.

Table 3.14. Number and percent of school caterers who used salt in cooking in 148* primary schools in England
Salt use n % Salt added to water when cooking vegetables 39 26 Salt added to water when cooking potatoes 40 26 Salt added to water when cooking rice 42 28 Salt added to water when cooking pasta 39 26 Salt added to recipes 84 57 Salt added to water and to recipes 14 10 No salt used in cooking 50 34
*3 schools serving cold lunch only were excluded The majority of school caterers said they did not add fat to boiled potatoes or vegetables. Caterers in 11 schools reported adding butter to their boiled potatoes and 38 added margarine. These values do not include the 3 packed lunch schools or the 6 schools which did not serve boiled potatoes. In 148 schools serving hot food, 13 caterers added butter to their hot vegetables and 12 added margarine. Of the 148 schools which served mashed potato, 44% made it fresh, 37% used instant, 11% used both (either depending on the dish or on what was supplied), and 7% used frozen mash. Of these schools, 58% added milk to mash, 17% added butter and 50% added margarine. Over two-thirds of the schools studied served some sort of squash drink, and most of these (81%) used a low calorie/no added sugar (NAS) variety. 16% used ordinary squash and 3% used both ordinary and NAS. Relatively few schools reported using a low calorie mayonnaise or salad cream. 30% of schools used ordinary mayonnaise, 29% used salad cream and 26% used low fat mayonnaise. Some schools used both ordinary mayonnaise and salad cream (1%), low fat mayonnaise and salad cream (4%), or neither (9%). Most school caterers reported using a combination of fresh, frozen and canned vegetables. 140 schools (93%) used fresh vegetables, 145 (97%) used frozen vegetables and 140 (93%) used canned vegetables (including baked beans). Of the 151 primary schools studied, 74% served low/reduced fat yoghurt, 17% served ordinary yoghurt, 3% served diet yoghurt, 3% served both ordinary and low fat, and 3% did not serve yoghurt. Of those schools serving yoghurt, 61% served fruit yoghurt (with pieces of fruit in it) and 36% served fruit flavoured yoghurt. 1% served both fruit and fruit flavoured, 1% served other flavours (such as toffee) and 3% served frozen yoghurt.
3.4 Healthy eating activity School caterers were asked if they had undertaken any activity to promote healthier choices to children such as a prize giving or a theme day relevant to healthy eating. More than half (62%) said they had been involved in some type of promotional activity while 38% said they had not. They were also asked if they had been involved in any promotions in the last year that encouraged children to choose more fruit and vegetables from the menu, and approximately half (53%) reported that they had. Examples of the responses given by caterers when asked to describe the types of healthy eating activities and fruit and vegetable promotions that they had been involved in are shown in Table 3.15 and Table 3.16.

Table 3.15. Examples of different types of healthy eating activities reported by caterers in 93 primary schools in England.
• Made pizza with children and put vegetables on it • Gave children a high-five or special handshake if they chose vegetables • Dig for victory � children took home a potato to cook as a way of promoting fresh potatoes. • Issued certificates, sat with children to encourage them to select and eat healthier options. • Menu displayed and annotated to identify healthier choices. • Stickers for eating all their vegetables. • LA promotion with a dragon who promotes healthy eating throughout the schools. • Healthy eating week where healthier options were highlighted. • Healthy days � more fruit and milk served. • Passport to health campaign. • Introduction of more salads, fresh produce used. • Taster sessions - cook made different dishes and children tried a little of each. • Dietitian (organised by LA) spoke to children about packed lunches. School policy that they
are not allowed to bring sweets and can only bring water to drink.
Table 3.16. Examples of different types of fruit and vegetable promotions as reported in 80 primary schools in England.
• Children eating all their vegetables all week received a prize at the end of the week. • One day each week fruit was the only dessert option. • Cook held a cooking demonstration with children and explained why they should eat fruit and
vegetables. • Tropical days to promote fruit and vegetables. • Apple day where children were given an apple as part of their dinner. • Fruit week � each morning children brought in their own fruit and were shown how to cut it up. • Once a term had healthy eating days with new foods for children to try. Children were given a
sticker if they tried something. • Stickers given for taking and eating a vegetable. • Promotions linked with what children were learning in class. • Frozen vegetables were changed to fresh and fruit was put on display • Health diaries � children got stamps in their booklet for finishing their vegetables. When their
booklet was full, they were entered into a prize draw with one girl and one boy winning. • Fruit and vegetables displayed on a platter. • More salads and options of what the children wanted to eat. • Promotion of fruits and vegetables through relating the benefits to health (eg eyes).
3.5 Consultation 43% of school caterers reported that they had consulted pupils and/or parents and/or governors about the school meals service. 29% had consulted pupils, usually in the form of a comments box or a survey, 25% had consulted parents, primarily through a special event such as a parents evening, and 6% had consulted governors, usually through some sort of meeting dialogue either at the School Council or directly at Governor meetings. Following consultation, 38% of the caterers made changes, 35% did not, and 27% reported that no changes were necessary.
3.6 Staff training 28% of school caterers interviewed said they had participated in some form of training linked to healthy eating/catering. Mostly this training was on general healthy eating/healthy cooking. A few caterers had completed qualifications such as an NVQ, and others had completed short nutrition courses, some of which focused specifically on children�s nutrition, including how to encourage them to eat more fruit and vegetables.

In the majority of schools (55%), lunchtime supervisory staff were a mix of teaching and non-teaching staff, with 42% of schools using all non-teaching staff, and 3% all teaching staff. 25 schools (17%) reported that lunchtime supervisors had participated in training aimed at the promotion of healthy eating. In six schools the training was as part of the Healthy Schools Award. In one school the type of training was not specified, and in the other 18 schools types of training included discussions at staff meetings, staff inductions, and a dietitian or catering representative talking about the promotion of healthy eating.
3.7 School participation in special initiatives Table 3.17 shows the number and percent of schools participating in special initiatives. The initiatives schools usually participated in were the Healthy Schools Standard/Healthy Schools Award,f the School Nutrition Action Group/School Council and the School Fruit and Vegetable Scheme. Of the 19 schools not participating in the School Fruit and Vegetable Scheme, 15 were junior schools (ineligible for the scheme as it only extends to infant pupils), and 1 was starting the scheme in the new school year, after the survey had been carried out.. There were three schools which were not participating in any initiatives at the time of the interview.
Table 3.17 Number and percent of schools reporting participation in initiatives in 151 primary schools in England.
Initiative Schools participating n %
School Fruit and Vegetable Scheme 132 87 Healthy Schools Standard/Healthy Schools Award 104 69 School Nutrition Action Group/School Council 102 68 School Milk Scheme 77 51 Whole School Food Policy 2 1 Growing Schools 1 1 DfES Food Partnerships Project 1 1 None 3 2
Schools were also asked if they were participating in any of the regional Food in Schools programmes (Table 3.18).
Table 3.18. Number and percent of schools reporting participation in Food in Schools programmes in 151 primary schools in England.
Food in Schools Programmes Schools Participating n %
Healthier Breakfast Clubs 6 4 Water Provision 4 3 Dining Room Environment 4 3 Cookery Clubs 2 1 Growing Clubs 2 1 Healthier Lunch Boxes 1 1 Healthier Tuck Shops 1 1 Healthier Vending Machines 0 0
f At the time of the study, it was not compulsory for schools to follow the healthy eating module of the initiative. Information was not collected from schools as to which modules they were following.

4 Contracts and Specifications KEY FINDINGS 1. 64% of head teachers were aware of some type of written documentation for their school
meals service. 66 documents were obtained covering 112 schools (74%). 2. Documents demonstrated a high level of commitment to healthy eating, although there
was little evidence of either LAs or schools setting their own mandatory quantitative specifications to stipulate the nutritional quality of school meals.
3. The language used tended to be imprecise, qualitative, and open to wide interpretation by
providers. 4. Of the 112 schools:
• 91% had contractual documents which either mentioned or made explicit mandatory requirements for providers to meet the compulsory National Nutritional Standards.
• Documents for 29% made reference to the CWT standards. • Few set quantitative guidance for the salt content of school meals (2%) or
made reference to access to salt by pupils (13%), although 38% made reference to salt in cooking. Documents covering 13% of schools made reference to the prevention of obesity.
• Documents for 59% made reference to customer consultation, and collecting feedback was deemed to be mandatory in half of these schools. Specific details as to how this was to be done were rarely found.
• Documents for 69% said something about monitoring in relation to the nutritional quality of the catering services. Some merely expressed an intention to monitor whilst others set out detailed procedures with schedules. More than half of the schools had some sort of compulsory statement about monitoring.
5. Isolated examples of good practice in writing healthy eating into specifications were
found within the documents examined. These set clear measurable standards and described measures to ensure that these standards were met, supported by monitoring processes.

4.1 Response Rate Of the 151 schools surveyed, 96 (64%) were aware of some sort of written documentation for their school meals service, and about half indicated that they were able to send the researchers a copy. The most common reasons given by schools for not providing copies of documentation were that they were not sure where to find it or that they did not have a copy. Further contact with the school meals provider resulted in 66 documents being obtained, covering 112 (74%) of the 151 schools (28 documents applied to more than one school). This observation reflects the prevalence of �group contracts� in the primary sector. The documents were obtained mainly from local authority catering departments, as 122 of the 151 schools in the survey were catered for by DSO�s or contractors appointed by the LA. Another common reason given for documents not being provided was change in provision arrangements. Many schools/caterers said they were updating some element of their catering services and as a consequence any documentation supplied would be out of date. These schools/caterers did not submit their documents even when requested to supply current specifications. The response rate (74%) was higher than that found for the School Meals in Secondary Schools in England study (62%) and may be due to:
• the fieldwork being conducted in the wake of some negative media coverage of school meals. The researchers sensed a degree of defensiveness within school catering and as a result perhaps more inclination to provide any written evidence regarding the quality of provision.
• primary schools seemingly less �over-burdened� than secondary schools. There was a wide variety of documents collected. This reflects the diverse nature of school catering services summarised in Table 1.4 (Chapter 1). One third of the documents received were Service Level Agreements and these were between a variety of partners (DSO�s and schools or their governing bodies; Local Authorities and contractors). A further third of documents were Specifications mostly set by either the Local Authority or the school. In a small number of cases it appeared that the providers (contractor or DSO) had defined these specifications. 9% of the documents received were contractual agreements between client and provider and the rest were a collection of documents including letters (6%), briefing notes (3%), nutritional guidelines (3%), schedule of services (1%), policies (2%), or leaflets (4%).
4.2 Content of documentation The documents were searched for evidence of healthy eating activity which related to both the compulsory National Nutritional Standards and other aspects of food provision that might impact on healthy eating. The figures and percentages quoted relate to the 112 schools with documentation. All of the documents collected contained some content relevant to healthy eating. However the level of detail within the documents varied enormously. Some documents contained comprehensive nutritional standards, with matching menus, portion sizes, and recipes. Others contained no more than a couple of passing sentences expressing commitment to healthy eating. As was found within the secondary survey, the content was either directly relevant to healthy eating (e.g. minimum nutritional standards will be implemented at all times) or related to some element of catering practice which would influence nutrition (e.g. the introduction of chips with 33% less fat to all schools).

A summary of analysis of the healthy eating or nutrition content within the documents covering 112 schools is shown in Table 4.1.
Table 4.1. Specifications related to healthy eating within contractual documentation obtained for 112 primary schools in England. Is there any reference to�? Mentioned* Mandatory# No reference+
n % n % n % 1.Guidelines/Policy a) Recommendations in terms of the nutritional content 25 22 41 37 46 41 b) The minimum nutritional standards set by DfES 13 12 89 80 10 9 c) A �Healthy Eating/Nutrition Policy/Food Policy� 18 16 22 20 72 64 d) Encouraging healthy eating aims, objectives, targets 28 25 16 14 68 61 e) Obesity/ Overweight/ Weight Control 13 12 2 2 97 87 f) COMA/SACN 7 6 8 7 97 87 g) 30% RDA/DRV 2 2 14 13 96 86 h) CWT Guidelines 14 13 19 17 79 71 i) Encouraging healthier choices through pricing 11 10 4 4 97 87 j) Encouraging healthier choices through positioning/counter layout
43 38 27 24 42 38
2. Nutrient specifications: QUALITATIVE a) Fat 16 14 19 17 77 69 b) Sugar 19 17 16 14 77 69 c) Salt 19 17 15 13 78 70 d) Fibre 11 10 9 8 92 82 e) others
4 4 3 3 105 94
3a. Menu planning guidance 17 15 81 72 14 13 3b. A set mealg at a fixed price 29 26 47 42 36 32 4. Standard menus and Recipes a) Standard menus 27 24 66 59 19 17 b) Standard recipes
10 9 25 22 77 69
5. Standard portion sizes 16 14 39 35 57 51 6. Nutritional specifications for manufactured foods or ingredients to be used
16 14 57 51 39 35
7. Nutrient specifications: QUANTITATIVE a) Energy 2 2 9 8 101 90 b) Carbohydrate 4 4 10 9 98 88 c) Fat 3 3 9 8 100 89 d) Protein 2 2 10 9 100 89 e) Vitamin C 1 1 10 9 101 90 f) Vitamin A 0 0 4 4 108 96 g) Vitamin D 0 0 2 2 110 98 h) Iron 0 0 10 9 102 91 i) Calcium 1 1 8 7 103 92 j) Salt/sodium 1 1 1 1 110 98 k) Others 4 4 9 8 99 88 ELEMENTS OF GOOD PRACTICE 8. Cooking Methods 31 28 20 18 61 55
g Documents were searched for the term �set meal� which in most cases referred to a meal comprising a protein, starch and vegetable element for main course with a dessert and sometimes a drink, or, alternatively, a two-course meal with or without a drink. The majority of the �set meals� therefore included elements of choice rather than being defined entirely in terms of specific foods.

Is there any reference to�? Mentioned* Mandatory# No reference+
n % n % n % 9. Salt a) salt in cooking practice 23 21 20 18 69 62 b) access to salt by pupils 9 8 6 5 97 87 10. Specific �healthy� foods and drinks to be served 29 26 43 38 40 36 11. Specific foods and drinks NOT to be served 9 8 25 22 78 70 12. Additives 8 7 42 38 62 55 13. Organic Food 9 8 1 1 102 91 14. GM/Irradiated Food 7 6 38 34 67 60 15. Monitoring 14 13 63 56 35 31 16. Customer/school consultation 33 30 33 30 46 41 17. Local sourcing of commodities 8 7 3 3 101 90 18. Meeting special dietary needs 28 25 61 55 23 21 * Mentioned - the number of documents mentioning (but not expressing this in mandatory terms (e.g. �the contractor should endeavour to ��) # Mandatory - the number of documents saying something mandatory about a specific aspect of nutrition or healthy eating (e.g. �the contractor must ��) + No reference - the number of documents making no reference to a specific aspect of nutrition or healthy eating
4.2.1 Overview of Content Overall there seemed to be little evidence of schools working to tight quantitative nutritional standards for school meals services supported by precise specifications for catering practice to enable people in the kitchens to meet these standards. However, there were:
• isolated documents which contained some elements of good practice. • a number of Local Authorities and Contractors who used the expertise of dietitians
and registered nutritionists to support the technical aspects. In these instances nutritional standards and healthier catering specifications had tighter specifications on paper.
In general, there seemed to be more awareness and consideration of healthy eating within the documentation for primary schools compared with that seen in the School Meals in Secondary Schools in England survey.6 The documents from the primary sector were more likely to make reference to specific healthy eating/catering issues. However, common themes not referred to by documents were obesity, access to salt by pupils, and use of organic food and sustainable procurement practices (although these are not compulsory requirements, obesity and salt are current public health issues, and organic food and sustainable procurement practices are increasingly regarded by some as being good practices in procurement). These are current health and school food provision issues, and were more likely to be mentioned in documents that had been produced or updated recently. Apart from the wording around requirements to meet national nutritional standards and set meal prices, much of the language used to specify how healthy eating should be integrated into school meals provision tended to be vague and open to interpretation. Specificity and precision in language with detail on how to achieve specific recommendations were sparse. Generally, the wording within documents tended to be intentional and worthy but failed to be specific about how objectives should be achieved.
4.2.2 Policies and Nutritional Guidelines A high proportion of documents (covering 102 (91%) of the 112 schools, 68% of all schools) made reference to the National Nutritional Standards. Most of these acknowledged their

mandatory nature and were very explicit in the requirement for lunchtime services consistently to meet the standards. Some documents included extracts from DfES�s own publication Healthy School Lunches,15 so there was absolute clarity on what was expected. Other documents specified DfES 2001 standards as a minimum and this implied that providers would be expected to go further in providing and promoting healthier choices for primary pupils, for example: “The contractor must provide a lunch service which complies, as a minimum, with the Nutritional Standards and DfES guidance”h National Nutritional Standards were mentioned more frequently within the documents for primary compared with secondary schools (for 91% and 65% of schools with documentation, respectively). Documents covering over half of the schools (58%) made some sort of general recommendation about the nutritional content of the meals provided to children. However, like the documents within the secondary survey, the language was often loose and ambiguous. Wording like �well balanced meal�, �sufficient menu choice�, �wholesome� and �nutritious� were frequently used to specify the nutritional quality of the meal which should be available to children. Few documents went further to quantify nutrient parameters for these terms (see section 4.2.3). There were few primary schools in which the school lunch services seemed to work to any type of healthy eating policy. Documents for only 36% of schools made any reference to a policy designed to promote healthy eating in schools, and approaches varied. Some:
• asked contractors to submit a policy • referred to policies kept elsewhere (these were not collected by the researchers) • included policies which ranged in length from one sentence to 2-3 pages.
The most detailed policy contained very specific agreed rules on what could and could not be served or used within the school catering operation. There was some evidence of the recognition of school meal provision in the context of a whole school approach to healthy eating, but this was not consistent across the documents examined. Obesity was mentioned in very few documents examined. Generally, if obesity was recognised within contracts, then it was as a special condition or implicit within other initiatives designed to promote healthier choices (e.g. Heartbeat Award). “Special diets are available for customers with obesity” Overall, there was limited evidence of a depth of understanding of the measures that caterers could take to prevent children becoming overweight. Specific items looked for in relation to obesity prevention were:
• careful portion control and a commitment not to �supersize� portions, particularly of high fat/high calorie foods
• consistent efforts to drive down the fat content of products offered through carefully designed commodity specifications and healthier modifications to standard recipes
• diluting the calorie density of meals by adding larger portions of vegetables and starchy carbohydrate foods and decreasing serving sizes of higher fat/protein items
h All quotes are taken directly from specifications and are intended to be examples of typical wording found in these documents.

• helping pupils to understand the differences in the calorie content of different portions of school food in relation to their own daily energy requirements.
Comments were found, for example, in relation to portion control, but not specifically in relation to the control of overweight or obesity.
4.2.3 Quantitative Nutrient Specifications and CWT guidelines Documents for a number (between 28% and 31%) of schools asked or required their catering services to continue to reduce the fat, sugar and salt content whilst increasing the levels of fibre within meals, recipes, menus, or the food service as a whole. The statements were typically qualitative: “Menus should be created to provide reduced fat, reduced salt and reduced sugar.” “In preparing menus the contractor must address the fat content – decrease the use of saturated and animal fats and increase unsaturated fats used in cooking.” Few primary schools seem to be working to any quantitative nutrient standards for their lunches or recommendations (e.g. an average meal should provide a minimum of 10g protein). In particular, documents for only 29% of schools made any reference to the CWT guidelines. The key strengths of these standards are that they are specific, precise and measurable. Meals within 19 schools (17%) were required to adhere to the CWT guidelines. As a consequence, there was absolute clarity on the expected nutritional quality of the school lunch provision, as follows: “The contractor shall meet the CWT guidelines for school meals.” However, in other specifications the wording was diluted to imply that the CWT guidelines could be used as a reference point � but they were not made mandatory. “Contractors should refer to the CWT guidelines.’ Only a few documents described any detail as to how menus might be planned or checked against CWT guidelines. These documents either implied some usage of computer software to plan menus against CWT guidelines, or specialist technical input to undertake this, for example: “All our menus are sent to the Community Dietitian for analysis against the CWT.” Overall there was little evidence on paper of intention or skill and knowledge to effectively deliver school meal services which met the CWT guidelines. Nor were there any recommendations in any of the documentation of ways in which catering practices should change if menus failed to meet the guidelines. Very few documents (covering only 2% of schools) set any quantitative guidance for the salt content of their school meals. This was a similar finding to that in secondary schools.6 This lack of detail in controlling the salt content of meals could be for a number of reasons:
• the perceived difficulty of controlling salt addition in school catering practice • lack of available resources and skills to set standards and monitor salt standards for
school meals • outdated contractual documentation which had not been updated to incorporate
SACN guidance on salt.19

There was a similar lack of quantitative guidance regarding the nutritional quality of manufactured foods used in school catering. However, there was a high level of nutritional awareness around foods and ingredients used. Almost two thirds of schools (65%) had documents which made some reference to the nutritional quality of foods bought in. These statements varied in their level of definition, for example:
“By choosing low fat or lean ingredients.” “Avoidance of convenience foods that have a high amount of salt.” “Healthier options for breaded shaped products, which are lower in salt content.” “Inclusion of wholemeal bread, pasta and other high fibre ingredients.”
4.2.4 Marketing Healthier Choices and Customer Consultation Relatively few documents (covering 15 schools (13%)) said anything about encouraging healthier choices through pricing. In the past, pricing interventions have mostly been used in the secondary sector to encourage the uptake of healthier items like jacket potatoes, salad and fruit by making them relatively cheap compared with less healthy options like chips, cakes and biscuits. These strategies fit cash cafeterias where items are individually priced. However, they are controversial within school catering services which are still commercially driven to remain viable, and this may explain why there was little guidance to use pricing as a way of enhancing the uptake of healthier options within the primary school meals service. However, it is more likely to be a reflection of the type of service in the primary schools surveyed � only 3 of the 151 schools operated a cash cafeteria system, with the majority of school meals being prepaid. Documents covering 70 schools (63%) referred to positioning of meal components (e.g. putting fresh fruit closer to pupils than higher fat/sugar desserts; placing boiled potatoes in front of chips on the service counter) as a way of promoting uptake of healthier choices. Overall evidence of innovation in marketing was sparse. Documents tended to contain general statements about techniques to boost uptake: “All food is expected to be attractively presented.” Examples of creative marketing ideas like the following were infrequent within the documents examined, and there was no definition of �healthy options� in the document quoted. “Children are encouraged to choose healthy options by being entered into a draw if they choose healthy foods. A local company is funding prizes. We are looking to promote this further via the smart card.� “Costume characters and promotional materials are available for special events and theme days.” Documents covering 59% of schools made reference to customer consultation. Collecting feedback for customers was deemed mandatory in half of these schools. A few documents were very specific about how this should be done, whilst others merely outlined that something should be done to talk to customers, for example: “Stakeholders (including customers) will be canvassed for their opinions, which will be reflected in a regular menu review and development culture.”

There was, however, no mention of how or whether information was to be fed back to the catering team or implemented in catering practice.
4.2.5 Menu planning and catering practice The majority (88%) of the documents examined contained some guidance or requirement specifically relating to menu planning. This usually took the form of describing the range of food choices that needed to be offered daily and this tended to be based on a standard meal model commonly consisting of:
• a 2 course meal • sometimes including a drink (milk, squash or water) • offering 2-3 choices of �meal centre� (e.g. meat, fish, or vegetarian option) • 1-3 choices of starchy foods • 1-3 choices of vegetables and salad • Commonly a choice of 1-2 desserts or fresh fruit or yogurt or cheese and biscuits.
Guidance framed in this way suggests a great deal of flexibility open to wide interpretation. Often, only qualitative statements were provided as menu planning advice. Overall, there was little evidence of caterers being tied into agreed menu cycles which had been designed to deliver consistently healthier choices and essential nutrients. A minority of documents attached menu cycles (commonly 4 weeks) or weekly sample menus. These were either provided as examples of what could be provided, or specified as the cycle which school caterers needed to adhere to.
In terms of incorporating healthy eating principles into menu planning, statements were frequently qualitative, and not necessarily related to healthy eating, for example planning menus around fresh and seasonal produce. “All menus are intended to give variety and be balanced using dishes and recipes known from experience to be popular with children.” “New school menus have been designed which incorporate an increase in fresh seasonal produce.” Documents covering 30% of schools said something about specific items not to be served. The most common theme was to limit the frequency of some less healthy foods and the most frequent example was chips: “There should be no more than 2 (types of) fried potatoes per week.” It seemed that banning less healthy foods was a less popular approach. There were isolated examples in which confectionery and fizzy drinks (except mineral water) were not allowed to be served as part of the school lunch. To complement this control on the availability of less healthy items, documents for 64% of schools were specific about the frequency of provision/usage of items perceived as �healthier�. More than half of these documents made mandatory statements. Stipulations concerning drinking water, salads, vegetables, bread, jacket potatoes and fruit were the most common. Some of these stipulations were a repeat of those already laid down by the DfES in the National Nutritional Standards.

There was some reference to usage of standard recipes within documents covering 31% of schools. Some tenders provided evidence that contractors were implementing standard recipes: “All unit managers and kitchen staff are trained to follow our approved recipes closely to ensure quality and correct quantities for each meal.” Generally, however, there was little evidence of schools stipulating standard recipes, especially those which incorporated healthier modifications. Qualitative statements about recipe modification were common but often meaningless or unquantifiable, such as: “Menus must contain a high percentage of home-made dishes.” “The menu cycle should feature recipes with reduced sugar content.” Documents covering one half of schools made reference to portion sizes and the majority set some sort of compulsory standard to adhere to. Most reference was made to the �Government� guidance on portion sizes, for example: “Minimum portion sizes will be in accordance with the Nutritional Standards and guidance notes issued by DfEE.” Relatively few documents set out strict quantified standards for portion sizes. There was often a lack of clarity as to whether the provider �must� or �should� adhere to these. There was some notion that portion sizes would locally be agreed between school or LA and the contractor. For example: “Each meal served in primary schools shall comprise of portion sizes approved by the Council. The contractor shall be required to submit a schedule detailing portion sizes to be provided.” There was no evidence in the documents examined of manipulation of standard portion sizes to encourage smaller portions of high fat or high calorie foods and larger portions of starchy carbohydrate meal components, vegetables and salad. Evidence drawn from the documents suggests that almost half (46%) of the schools had something written down about healthier cooking methods, and 18 schools (out of a total sample of 112) had mandatory statements. The most common statements referred to the frequency of frying (or frying practice), oven baking and grilling, such as: “Oven bake burgers, sausages and fish items as opposed to deep frying.” “The fat content should be kept to a minimum by using low fat cooking methods.” There was some reference to vitamin retention practices within a number of documents, for example: “Vitamin C – care over cooking methods is essential to preserve this heat sensitive vitamin.” Although very few schools (2%) set any quantitative guidance for the salt content of school meals (Section 4.2.3), 38% of the 112 schools had something written down about salt in cooking. Some schools (18 out of 112 (16%)) stipulated practice to control salt. However

there was no evidence of structured quality assurance procedures in place to control the amounts and frequency of salt in school kitchens. The extracts below typify the qualitative intentional statements found within the documents within this survey. “Try cutting down on salt used in cooking gradually so that it is not noticed.” “Do not add salt to recipes.” “The contractor will be required to use salt sparingly.” Fewer documents (covering 15 schools (13%)) made reference to access to salt by pupils. These references were generally intentional and qualitative, such as: “The addition of salt at table to be discouraged.”
4.2.6 Additives, organic food and sustainable practice. The usage of additives, organic food and sustainable practice are not part of the compulsory standards. However, there was a much higher awareness of additives compared to organic food in the documents examined. Additives were referred to in documents for 50 of the 112 schools (45%) whilst 11 school catering services (10%) were concerned with organic food. Data from Table 4.1 suggests that 38% used mandatory statements with reference to additives, but on closer examination many of these were either open to interpretation or impractical. Examples include: “Our menus are created to provide reduced additives and preservatives.” “We continue to eliminate products which contain prohibited E numbers and other non-essential additives.” Within the documents examined, there seemed little evidence of sustainable procurement practices. Documents for only 11 schools (10%) said anything about local sourcing of ingredients and commodities, and these statements were generally within the bounds of �wherever possible� or �within financial confines�, such as: “Our food purchasing policy ensures that fresh fruit and vegetables are available daily and fresh meat and fish are purchased locally wherever possible.” “Wherever possible in our menus we use locally grown fruit and vegetables.”
4.2.7 Monitoring Documents covering two thirds of schools said something about monitoring in relation to the nutritional quality of the catering services. The level of detail varied enormously. Some merely expressed an intention to monitor whilst others set out detailed procedures with schedules. More than half of the schools had some sort of compulsory statement about monitoring. Approaches varied and included:
• external monitoring where Local Authority officers conducted a dialogue with providers
• internal/self monitoring where contractors checked that agreed standards were adhered to.
Methods also varied. There was evidence of:
• checklists being used (although there was no evidence of schools using the example checklist from the DfEE guidance for school caterers document.

• random inspections involving the collection of qualitative information • feedback meetings (between providers and schools or Local Authority personnel).
Schedules to ensure compliance with procedures and standards varied � they could be monthly, termly, or annually.
4.3 Good Practice Within the sample of documents there were isolated examples of good practice in writing healthy eating into specifications for school catering services for primary schools. Within these documents there was a strong clarity of purpose and process. They set clear measurable standards (often expressed in quantitative nutrient or food/catering practice terms), then described transparent measures to make sure services met these standards. This implementation of measurable standards (expressed in nutrient and food terms) was supported by monitoring processes to demonstrate that the �healthy eating� related standards had been met (although no evidence was gathered to determine whether this actually happened in practice). The elements of good practice found in the documents examined have been used to form part of guidance on how best to write specifications relevant to healthy eating. This guidance can be found in Appendix A17.
4.4 Conclusion There appeared to be a high level of commitment to healthy eating within the contractual documents examined, which covered 74% of schools within the sample. It was clear that, on paper, school catering in primary schools supported the notion of healthy eating. However, there was scant evidence of schools or Local Authorities setting their own mandatory quantitative specifications which stipulated the nutritional quality of the school meals or elements of �healthy catering practice� or detail on how these standards would be monitored. The language used to specify delivery of healthy eating within the contractual documents examined was often imprecise, qualitative and open to wide interpretation by providers. There was, however, some evidence of a higher awareness of CWT guidance within the documents examined for primary schools (contractual documents covering 29% of schools made reference) compared to the previous secondary school meals survey (15% made reference). This may be useful preparation for the introduction of nutrient-based standards. Over 91% of schools had contractual agreements which made reference to the national nutritional standards set by DfES. There were some examples of elements of good practice in incorporating healthy eating into service specifications. Associations between these specifications and food provision and choice are explored in Chapters 5 and 6.

5 Food Provision KEY FINDINGS 1. Only 34 of 146 primary schools in England (23%) met all the compulsory nutritional
standards for school meals every day at the beginning of lunchtime. This fell to 25 schools (17%) by the end of service.
2. 140 (96%) met the additional recommendation for drinking water at the beginning of
service, and 139 (95%) by the end. For drinking milk, 39 (27%) met the recommendation at the beginning of service, and 31 (21%) by the end.
3. 144 of the 146 schools met the additional recommendation to �offer some hot food�. 4. The two standards most commonly failed were �starchy food cooked in oil or fat to be
available no more than three times a week� (failed by 53% of lunch services), and �fruit-based desserts to be available twice a week� (failed by 33%). In 27 schools (18%), failure to meet the standards was associated with failing to meet one standard on one day.
5. There was no association between the type of catering provider or type of contract and
whether or not the nutritional standards were met. 6. 82% of head teachers and 68% of school cooks claimed to be aware of the nutritional
standards, and these were reportedly monitored in three quarters of schools. There was no association between awareness of, or monitoring compliance with, the nutritional standards and whether or not they were met.
7. The foods and drinks most commonly offered on at least 4 days per week were desserts
and vegetables/salad (99% of schools), fruit (97%) and milk and milk products (87%). Chips and other potatoes cooked in oil or fati were offered on more than 4 days per week in 63 schools (42%). Higher fat main dishes were offered on most days in more schools (70%) than lower fat main dishes (64%). A third of schools (33%) did not offer soft drinks, 90% did not offer crisps or savoury snacks, and 58% did not offer fruit juice.
8. The profile of foods offered to pupils did not conform to the Balance of Good Health
model. 9. Schools in which the head was aware of the National Nutritional Standards offered higher
fat main dishes less often (mean of 3.9 vs 4.4 days per week). 10. Schools in which caterers had run a promotion to promote healthy eating offered potatoes
not cooked in oil or fat more often (3.7 vs 3.1 days per week). 11. Schools in which the contract specification made reference to monitoring healthy eating
practices offered potatoes not cooked in oil or fat more often.
i This group of foods includes chips, sauté and roast potatoes and processed potato products such as hash browns and potato croquettes, but not mashed potatoes with butter/margarine added.

5.1 Meeting the National Nutritional Standards.
5.1.1 National Nutritional Standards Adherence to the nutritional standards (Table 1.1) was assessed using the Food Visibility Questionnaire. This was completed by interviewers at the beginning of the lunch service and again approximately 10 minutes before the end of service on each day of data collection. This check was carried out over a school week, usually five consecutive days, for most of the 151 schools in the survey. In 18 schools, four days of data were collected in the first week due to the schools being closed for a bank holiday, an INSET day (for staff training), or for the general election, and the fifth day of data collection was the first school day of the following week. Due to technical difficulties with CAPI machines, one day of data collection was missed in each of 5 schools. Analysis is therefore based on those 146 schools for which a complete 5 days of data were collected. For the caterer to meet the compulsory nutritional standards (see Appendix 13), lunches for primary school pupils must contain at least one item from each of the following groups on a daily basis, and must also meet the additional requirements stated for each group.
• Starchy foods. Starchy food cooked in oil or fat should not be served more than three times a week.
• Vegetables and fruit. Both a fruit and a vegetable must be available. Fruit based desserts must be available twice a week.j
• Milk and dairy foods. • Meat, fish and alternative sources of protein. Fish must be served at least once a week.
Red meat must be served at least twice a week. Cheese may be included in this group for primary children.
The 9 standards (Appendix A13 lists the 9 standards individually) apply to all lunches provided for pupils whether free or paid for, and to hot and cold lunches. They are considered to be the minimum standards, and if the Local Authority or school has set higher nutritional standards, the caterer should meet those. The wording used leaves some of the standards open to interpretation. For the purpose of analysis it was deemed that:
• Starchy food cooked in oil or fat included any fried starchy food (e.g. chips/sauté potatoes, fried rice) as well as those starchy foods to which fat had been added at some stage during the cooking process (e.g. processed potato products such as hash browns and croquette potatoes).
• Instant custard made up with water was not considered as a milk or dairy food because the calcium content was significantly less than other milk and dairy foods such as milk, yoghurt etc.
• Fruit-based desserts included all desserts with some fruit content, but not fruit, fruit salad (fresh or tinned) or fruit juice.
Only 34 schools (23%) met all of the compulsory nutritional standards every lunchtime at the beginning of service. This fell to 25 schools (17%) by the end of service. Table 5.1 shows the number of schools that failed to meet one or more standards. Of the 112 schools that did not meet all of the compulsory standards at the beginning of service, 60 schools failed to meet 1 standard (with 27 of these schools failing the standard on only one day), while 39 schools failed to meet 2 standards. j Editor�s Note: the proportion of fruit in �fruit based desserts� is not defined in the standards.

Table 5.1. Number and percent of school lunch services failing to meet one or more compulsory standards on one or more days at the beginning and end of service in 146 primary schools in England.
Number of Standards failed
Beginning
End
n % n %0 34 23 25 171 60 41 46 322 39 27 43 293 11 8 13 94 0 0 12 85 0 0 5 36 2 1 1 17 0 0 1 18 0 0 0 09 0 0 0 0
Primary schools compared poorly with secondary schools. The School Meals in Secondary Schools in England study found that 83% of school lunch services met all of the standards every day at the beginning of service, while 47% met all standards at the end of service.6 The standards differ slightly for primary and secondary schools, mainly in terms of the number of foods from each group that should be available every day and the availability of starchy foods cooked in oil or fat. There is no standard for fruit-based desserts for secondary schools. The nutritional standards that school caterers were most likely not to meet are shown in Table 5.2. Failure to restrict the availability of starchy food cooked in oil or fat to no more than three times a week was common across schools, with 53% failing this standard at the beginning of service. Provision of fruit based desserts at least twice a week was the other commonly failed standard (not met by 33% of caterers at the beginning of service.
Table 5.2. Number and percent of school lunch services that failed to meet each standard or component of a standard every day at the beginning and end of service in 146 primary schools in England.
Failing a standard
Standard Beginning End n % n % Starchy food cooked in oil or fat (not more than three days per week) 78 53 75 51 Fruit based dessert (at least twice per week ) 48 33 56 38 Milk and dairy (every day) 23 16 43 30 Red meat (at least twice per week) 7 5 15 10 Fruit (every day) 9 6 32 22 Meat, fish or alternative protein (every day) 6 4 19 13 Starchy food (every day) 6 4 6 4 Vegetable (every day) 4 3 8 6 Fish (at least once per week) 2 1 3 2 One possible reason for the high number of schools failing to meet the nutritional standards could be misinterpretation of the standards by school caterers. 53% of caterers failed to meet the standard specifying that starchy food cooked in oil or fat should not be available more than three times a week. It is possible that some may have considered only deep-fried starchy foods as counting towards this standard, rather than including those foods in which fat had

been added in the processing. 33% of caterers failed to provide fruit based desserts at least twice a week. It is possible that some may have considered fruit or fruit salad to be fruit-based desserts. Also, when school caterers were asked which of the standards they could recall, the two recalled least often were those failed most often, i.e. starchy food cooked in oil or fat not to be available more than three times a week, and fruit-based desserts to be available twice a week (see Table 5.4). This lack of awareness is another possible explanation for the high number of schools failing to meet the standards.
5.1.2 Additional Recommendations The guidance produced for school caterers sets out additional recommendations that caterers are expected to meet:
• Drinking water to be available to all pupils every day, free of charge • Drinking milk to be available as an option every day • Strongly recommended that the school should offer some hot food, particularly in the
winter months. Most schools met the additional recommendation for drinking water at both the beginning (96%) and end of service (95%). Drinking milk was available every day at the beginning of service in 39 schools (27%), and on four days out of five in a further 9 schools. 60 schools (41%) did not offer drinking milk at all. By the end of service, drinking milk was available on each day in 31 schools (21%). All schools met the recommendation for serving hot food apart from two schools that served a packed lunch only. One school served a predominantly cold lunch, but provided soup every day.
5.1.3 Visibility versus availability The visibility questionnaire recorded whether foods meeting the standards were visible to pupils as they selected their lunch, or whether they were not visible, but still available. Foods commonly recorded by interviewers as being available but not visible to pupils were milk and other dairy foods. Milk was available but not visible to children on a total of 30 days spread across 16 different schools, ranging from not being visible on any day in one school to only one day in 9 schools. Other dairy foods were not visible on 18 days across 11 schools, ranging from 4 days in 2 schools to 1 day in 8 schools. Other items not visible were fish (on a total of 8 days across 7 schools), and red meat (2 days across 2 schools). The main reasons given by school caterers for why these items were not visible to pupils were �being kept cold�, �being kept warm�, and �only available on request�.
5.1.4 Meeting the standards vs. type of contract No association was found between the type of provider or the type of contract and whether or not the nutritional standards were met. However, none of the five schools with in-house catering provision met the standards every day, whereas nearly half of the schools employing their own contractor did so (Table 5.3).

Table 5.3. Relationship between type of catering provider and whether the school lunch service met all the compulsory standards Type of provider Met standards Yes No All schools n % n % n Contractor appointed by the school 5 45 6 55 11 Contractor appointed by the LA 7 25 21 75 28 Local Authority Service Provider/DSO 20 22 69 78 89 In-house 0 0 5 100 5 Other 2 15 11 85 13 Total 34 23 112 77 146
5.1.5 Awareness and monitoring of the Nutritional Standards During the telephone interview, school caterers were asked if they were aware of the nutritional standards for school lunches, and if they could recall some or all of them (Table 5.4). Of the 103 school cooks or caterers who claimed to have heard of them, 6 (4%) listed all the standards, while 49 (46%) could not name any. The standards for vegetables and fruit were the most commonly known (44% and 42% respectively).
Table 5.4. Number and percent of school caterers who were able to recall each nutritional standard or component of a standard in 103 primary schools in England. Nutritional standard or component of standard n % At least 1 vegetable 47 44 At least 1 fruit 44 42 At least 1 starchy food 32 30 At least 1 meat, fish or alternative source of protein 31 29 At least 1 milk or dairy 28 26 Fish at least once a week 24 23 Red meat at least 2 times a week 19 18 Starchy food cooked in oil or fat not more than 3 times a week 18 17 Fruit-based dessert at least 2 times per week 17 16 During the telephone interviews, heads and caterers were asked about monitoring practices. Evidence of actual monitoring was not collected. Heads in 123 schools (82%) claimed to be aware of the Nutritional Standards. Of these, 109 reported that the standards were monitored in their school, either by the school (17), by someone else (89), or jointly (3). 81% of school caterers reported that compliance with the Nutritional Standards was monitored, 1% that it was not, and 18% did not know. The response most commonly given when caterers were asked about how compliance was monitored was that it was indirectly monitored via the school menu, with menus designed to meet the standards and the lunch service monitored to ensure that the foods offered matched those on the menu. There was no association between the school lunch service meeting the standards and either the school caterers or heads being aware of the standards or reporting that the standards were monitored. The discrepancy between the reported monitoring of compliance to the nutritional standards and the number of schools meeting the standards implied that either:
• The monitoring was not taking place in practice • the method of monitoring was ineffective or • catering providers believed that the foods and drinks they were providing met the
standards.
Virtually all (99%) of school caterers reported that the lunchtime service in general was monitored. From their responses, monitoring was classified as formal and informal. Formal monitoring included quality assurance visits, audits, visits where checklists were completed, and visits from which reports were produced. Informal monitoring included visits to check that there were no problems with the lunch service, area managers dropping in, and visits to watch a lunchtime service. From caterers� responses, 66% of lunchtime services were considered to be formally monitored, 33% informally, and in 1 school the lunchtime service was not monitored. The estimated frequency of formal monitoring (as reported by caterers) is detailed in Table 5.5
Table 5.5. Estimated frequency of formal monitoring of the lunchtime service in 100 primary schools Number of times service
monitored per year n %
1 28 19 2 19 13 3 39 26 4 1 1 6 13 9
Total 100 66
5.1.6 Recommended portion sizes The guidance document produced by DfES for school caterers15 includes recommendations for food portion sizes in primary schools. Weight ranges are specified for uncooked foods including rice and pasta, bread, potatoes, vegetables, salads, fruit, milk, cheese, red meat, poultry, fish and vegetarian equivalents. Where necessary, these weights were adjusted to produce weight ranges for cooked foods.k The portion weight data collected in 149 schools were used to calculate the mean portion weights served to infants, juniors, and to pupils in schools where infant and junior portions are the same (either) for a number of the foods for which portion size ranges were specified. Table 5.6 shows the comparison. Generally, portion sizes served to pupils for starchy foods were below or at the lower end of the recommended range, with the exception of all types of potatoes which were within the recommended ranges. Portions of milk and dairy products generally fell in the recommended ranges, except drinking milk which was lower than recommended. Servings of roast meat and burgers were higher than the recommended minimums, whilst other protein options (sausages, fish fingers, shaped poultry) were at the lower end of the ranges. Servings of fruit and vegetables were generally within the recommended ranges except for fruit juice and non-leafy non salad vegetables, which were lower than recommended.
k The conversion was performed using data detailing percentage changes in weight recorded during cooking from McCance and Widdowson�s �The Composition of Foods� (6th Ed.) Appendix 4.3i.

Table 5.6 Infant, junior and either average portion sizes in 149* primary schools in England compared to those recommended
Food Suggested weight
Infant Junior Either
from to Mean n Mean n Mean n Pasta 75 119 71 23 77 23 70 63 Rice 98 180 68 18 80 19 77 48 Bread Sliced bread, rolls, French stick 56 70 42 22 35 27 41 80 Pizza 84 98 71 16 66 35 74 75 Cracker Biscuits (for cheese) 42 63 15 18 17 10 17 31 Salads Coleslaw 28 42 45 24 58 23 53 61 Salad veg (mixed salad) 42 56 45 23 51 30 49 116 Milk Drinking milk 200 200 145 21 160 46 151 77 Custard 84 98 97 61 95 61 88 167 Milk puddings 98 112 97 6 112 12 124 24 Cheese Cheese 28 42 26 27 32 31 33 70 Yoghurt 85 125 105 32 106 40 102 95 Sausages (pork) 53 85 56 14 65 22 61 48 Fish & fish products Fish cakes and other fish shapes 57 57 62 13 48 21 52 65 Fish fingers (2-3 fish fingers) 58 84 53 17 58 16 53 53 Fruit salad & fruit juice Fruit salad (tinned) 70 115 103 7 105 6 108 19 Fruit salad (fresh) 40 70 92 25 93 24 82 67 Fruit juice 200 200 100 25 130 40 127 90 Vegetables Vegetables (not leafy, not salad)a 56 70 48 169 55 182 52 497 Leafy vegetables (not salad)b 42 56 45 34 51 39 49 103 Baked beans 70 84 85 30 81 39 83 119 Red Meat, poultry and vegetarian equivalents
Red meat and poultry (in roast dinners)
30 c 40 c 51 29 52 33 51 109
Shaped chicken and products 53 67 47 22 47 23 50 71 Burgers (beef, lamb, pork and vegetarian mince)
32 c 42 c 46 8 51 14 55 33
Potatoes (including sweet potatoes and yams)
Mashed, boiled 84 98 89 52 102 53 91 146 Jacket 112 170 154 26 148 30 155 103 Chips, roast, other potatoes cooked in fatd
70 84 67 95 80 97 70 289
*Portion weights data not collected in 2 schools a. Peas, green beans, sweetcorn, carrots, mixed vegetables, cauliflower, swede, turnip b. Cabbage, spinach, spring greens, Brussels sprouts, broccoli and other leafy vegetables c. (minimum depending on age) d. e.g. jacket wedges and processed potato products

5.2 Inventory analysis Food provision was assessed using food inventory questionnaires completed by interviewers on 5 days in all 151 schools. In total, 1 281 different foods were recorded (e.g. lettuce, tomato etc.). These 1 281 foods were offered on a total of 18 886 different occasions (�offering events�, e.g. lettuce offered on 2 days = 2 �offering events�). The foods were grouped into 116 food groups and then further aggregated into 19 groups for analysis. The grouping of foods is shown in Appendix A14. Once condiments had been excluded from the analysis,l a total of 1 266 different foods were offered in 18 groups on 17 925 different occasions (�offering events�). The first column of values in Table 5.7 shows the percentages of foods offered in all schools at lunchtime. The foods most commonly offered at lunchtime were vegetables and salads, desserts (puddings, cakes, biscuits and ice cream), and fruit. To better reflect the balance of food groups that were on offer in primary schools at lunchtime, foods were further aggregated (so that 6 different salad items and 2 hot vegetables served on one day in a school were counted once as vegetables) into 18 food groups. The distribution of food groups offered and the average number of items in each group are shown in the middle and right-hand columns of Table 5.7. In total the 18 food groups were offered on 7 896 different occasions (�offering events�). (See Appendix A15 for a worked example). Similar proportions of higher and lower fat main dishes were offered (7.6% compared to 7.2%), and the same was seen for chips and other potatoes cooked in oil or fat and potatoes not cooked in oil or fat (6.3% each). Water was offered more than soft drinks, which were offered twice as often as fruit juice.
Table 5.7. Foods and food groups on offer in 151 primary schools in England, as a percentage of all foods or food groups offered, and number of items offered on average per day in each food group across all schools. Food group
Percent of foods offered
%
Percent of food groups offered
%
Number of items per food group
n Vegetables and salads 19.2 9.4 4.6 Desserts, cakes, biscuits, ice cream 14.1 9.5 3.4 Fruit (fresh, tinned, dried) 13.8 9.3 3.3 Milk and milk products 8.1 8.6 2.1 Pasta, rice, bread, other cereals 8.0 8.2 2.2 Sandwiches 7.0 3.9 4.1 Higher fat main dishes (pizza, burgers) 5.3 7.6 1.6 Lower fat main dishes (carcass meat) 5.2 7.2 1.6 Potatoes not cooked in oil or fat 3.9 6.3 1.4 Water 3.8 8.6 1.0 Soft Drinks 3.5 5.4 1.5 Chips and other potatoes cooked in oil or fat 3.2 6.3 1.2 Fruit juice 1.5 2.4 1.4 Baked beans 1.4 3.2 1.0 Butter, margarine 1.0 1.9 1.2 Eggs and egg dishes 0.5 1.1 1.0 Savoury snacks, nuts and seeds 0.3 0.6 1.2 Sugar, preserves, confectionery 0.3 0.6 1.0 Base 17 925 7 896 -
l Condiments were excluded as they were commonly offered (5% of foods served), but have varying nutritional value, and their inclusion leads to misrepresentation of the profile of foods on offer.

Table 5.8 shows how often the different food groups were offered in primary schools. The first two columns show the number and percent of foods either not offered or offered on at least 4 days per week.m Nearly all schools offered vegetables/salad, desserts and fruit on most days (99%, 99% and 97% of schools respectively). Soft drinks were offered on most days in 52% of schools, but not offered at all in 33% of the schools. Fruit juice was not offered at all in more than half of the schools (58%), and offered most days in only 19% of the schools. Higher fat main dishes (e.g. burgers, pizza, breaded/crumbed meat ) were offered on most days in 70% of the schools, compared to 64% of schools offering lower fat main dishes (e.g. poultry, stews etc.) on most days. The one school that did not offer any higher fat main dishes served only packed lunches. 42% of schools offered chips and other potatoes cooked in oil or fat more than three days per week. The nutritional standards limit provision to not more than three times per week. Of the four schools (3%) that did not offer chips and other potatoes cooked in oil or fat at all, three offered cold lunches only. The inventory data suggested that drinking water was not offered at all in five schools. This seems unlikely: if it was not served with the food at the hatch, but placed elsewhere in the dining room, it may have been missed by the interviewers when completing the inventory.
Table 5.8. Number and percent of 151 primary schools in England offering foods from different food groups, according to number of days offered per week, and mean number of days on which food from food group was offered.
Schools Average number of days offered per week
Food group
Food group not offered
Offered 4-5 days per week
In schools offering food group
Across all schools
n % n % mean SD mean SDVegetables and salads 1 1 149 99 5.0 0.2 5.0 0.2Pasta, rice, bread, other cereals
1 1 120 80 4.3 1.1 4.3 1.0
Desserts, cakes, biscuits, ice cream
0 0 150 99 4.9 0.3 4.9 0.3
Fruit 0 0 147 97 4.9 0.5 4.9 0.5Milk and milk products 5 3 131 87 4.7 0.8 4.5 1.3Higher fat main dishes 1 1 105 70 4.0 1.1 4.0 1.0Potatoes not cooked in oil or fat
6 4 72 48 3.5 1.3 3.4 1.4
Water 5 3 136 90 4.6 0.8 4.5 0.9Lower fat main dishes 1 1 96 64 3.8 1.0 3.8 0.9Soft drinks 50 33 79 52 4.2 1.4 2.8 2.3Chips and other potatoes cooked in oil or fat
4 3 64 42 3.4 1.1 3.3 1.2
Fruit juice 87 58 29 19 3.0 1.6 1.3 1.8Baked beans 19 13 14 9 1.9 1.1 1.7 1.2Butter, margarine 99 66 21 14 2.8 1.7 1.0 1.6Eggs and egg dishes 83 55 1 1 1.3 0.6 0.6 0.8Savoury snacks, nuts and seeds
136 90 6 4 2.9 1.8 0.3 1.0
Sugar, preserves, confectionery
115 76 2 1 1.3 0.9 0.3 0.7
Sandwiches 70 46 55 36 3.8 1.7 2.0 2.3
m In the remaining schools (not shown in the table), the foods were on offer between 1 and 3 days per week.

5.2.1 Meal Provision and the Balance of Good Health The National Nutritional Standards are based on the food groups in the Balance of Good Health,8 a plate model which shows the types and proportions of different food groups which make up a healthy, balanced diet (Figure 1). It covers five major food groups: bread, other cereals and potatoes; fruit and vegetables; meat; fish and alternatives; milk and dairy foods; foods containing fat and foods and drinks containing sugar. In the guidance to caterers,15 the recommendation is to provide foods in accordance with the Balance of Good Health. Inventory data have been analysed to ascertain whether food provision in primary schools reflects the Balance of Good Health. Foods not fitting into the five groups (water (3.8% of foods offered) and soup (0.1%)) were excluded from this analysis. Figure 2 shows that in relation to the Balance of Good Health model, schools were offering too many foods containing fat and foods and drinks containing sugar (83% of schools offered at least three types of dessert each day), and not enough starchy foods, milk and dairy foods, or meat, fish and alternative protein foods. In contrast, schools were offering plenty of fruit and vegetables, which accounted for 39% of all foods on offer.
Figure 1. The Balance of Good Health Model.n
n Reproduced by kind permission of the Food Standards Agency.

Figure 2. Foods offered in 151 primary schools in terms of the Balance of Good Health
Bread, other cereals and potatoes
Fruit and vegetables
Milk and dairy foods
Meat, fish and alternatives
Recommended
Observed
Foods containing fat Foods and drinks containing sugar
5.2.2 Factors associated with food provision One of the aims of the study was to identify associations between food provision (particularly �healthier� foods) and the eating environment, catering practices and training, and contract specifications. Analysis of the associations between these factors was based on the comparison of the mean number of days each week on which particular food groups were offered in schools, using analysis of variance. Only statistically significant differences of 0.5 days or more are reported. See statistical comments in Section 2.7. Type of service provider, type of contract Milk and milk products were offered most often by contractors appointed by the school or in-house providers (5.0 days) and least often by contractors appointed by the LA (4.0). Chips and other potatoes cooked in oil or fat were offered most often by DSO�s and least often by contractors appointed by the LA (3.7 vs. 2.7 days). Baked beans were offered most often by contractors appointed by the school and least often by in-house caterers (2.9 vs. 1.2 days per week). There was no association between food provision and delegation of funding or type of contract. Profit making by school There were no differences in food provision between schools making a profit and schools that were not. Cost of school meal There was no association between the cost of a school mealo and the profile of foods on offer in schools. Whether or not the standards were monitored There was no difference in food provision at lunchtime according to whether or not the head or school caterer claimed that compliance with the nutritional standards was monitored. o Schools were divided into 2 groups for this analysis (based on the median meal price in all schools), those with a meal price of ≤£1.45 and those with a meal price of ≥£1.46.

Staff awareness and training Schools in which the head was aware of the nutritional standards offered higher fat main dishes less often (3.9 days) than in schools in which the head was not aware of the standards (4.4 days). There were no differences in provision associated with whether the caterer had received training in healthy eating/cooking or was able to list two or more of the Nutritional Standards. Eating environment No factors associated with the eating environment influenced the provision of food at lunchtime. Participation in special initiatives Schools involved in the Healthy Schools programme offered sugar,preserves,confectionery less often than schools not participating (1.1 vs 1.8 days respectively). There were no significant differences in provision between schools participating in the School Milk Scheme or the School Fruit and Vegetable Scheme and other schools, although further analysis indicated that of the 77 schools participating in the School Milk Scheme, 44% offered milk at lunchtime whereas 56% did not. There were no differences in provision associated with whether the school had a School Council/School Nutrition Action Group. Healthy eating or fruit and vegetable promotions Schools that had held a promotion linked to healthy eating in the last year offered more potatoes not cooked in oil or fat (3.7 vs 3.1 days). Tuckshops/other opportunities to purchase food Schools with additional places for pupils to buy food or drinks at lunchtime offered more lower fat main dishes (4.5 vs 3.7 days) and more fruit juice (4.2 vs 2.8 days). Those schools in which pupils were able to buy food or drinks at any time offered more savoury snacks (3.8 vs 1.2 days). School characteristics, regionp and deprivation There were no differences in food provision according to type of school, urban/rural or index of deprivation. Schools in the South offered fewer potatoes not cooked in oil or fat than those in the Midlands or in the North (2.8 vs. 3.6 vs. 4.0 days per week respectively). Contract specifications In the 112 schools for which documentation relating to the contract or service level agreement was obtained, the specifications that were mentioned or were mandatory were assessed in relation to food provision (Table 5.9). There were some statistically significant associations between specifications and food provision. However, many of the associations were not consistent and/or did not relate to the specification. For example:
• schools with no reference in their contract/service level agreement to a nutrition policy offered lower fat main meals more often than schools in which a nutrition policy was mentioned or deemed mandatory
• soft drinks were offered most often in schools where a nutrition policy was deemed mandatory
• soft drinks were offered least often in schools with mandatory qualitative specifications for fat and energy, and most often in schools where these specifications were mentioned.
p The nine government regions were grouped into 3 regions for the purpose of analysis. The North East, the North West and Yorkshire and the Humber were grouped as the North of England; the South East, the South West and London as the South of England; and the West Midlands, the East Midlands and the East of England as the Midlands.

Fruit was offered more often when the nutritional standards were either mentioned or deemed mandatory than when they were not mentioned. Baked beans were offered most often in schools where the nutritional standards were mentioned. Finally, potatoes not cooked in oil or fat were offered most often in those schools in which monitoring of healthy eating practice was referred to (mandatory or mentioned), and milk and milk products were offered most often when monitoring was deemed mandatory rather than mentioned or not referred to. There were no associations between food provision and specifications for CWT guidelines or cooking practices.
Table 5.9. Number of days per week on which specific food groups were offered in 112 primary schools in England according to whether the specification was mentioned, was deemed mandatory or was not mentioned in the contract/service level agreement. Days per week on which food provided, according to type of reference in
specification
Specification Food Mentioned Mandatory Not mentioned National Nutritional Standards Fruit 5.0 4.8 4.4 Baked beans 2.7 1.7 2.3 Nutrition policy Lower fat main dishes 3.1 3.7 4.0 Soft drinks 4.7 3.4 4.3 Encouraging healthy eating through positioning/layout/other promotional activities
Milk & milk products 4.8 4.7 4.1
Nutrient specifications Fat (quantitative) Soft drinks 4.7 2.3 4.3 Energy (quantitative) Soft drinks 5.0 2.3 4.3 Monitoring healthy eating practices Milk & milk products 4.2 4.8 4.2 Potatoes not cooked in oil
or fat 3.3 3.7 2.8
Table 5.10 provides a summary of the associations between food provision and eating environment characteristics, catering practices and training.
Table 5.10. Summary of factors associated with the provision of healthier and less healthy foods in 151 primary schools in England. Factor Healthier foods Less healthy foods In-house service provision More milk and milk products Contractor appointed by the LA Fewer chips and other potatoes cooked in oil
or fat
Contractor appointed by the school More milk and milk products More desserts DSO service provision More chips and other potatoes
cooked in oil or fat Healthy eating promotion More potatoes not cooked in oil or fat Head aware of nutritional standards Fewer higher fat main dishes Participation in Healthy Schools Less sugar,preserves,confectionery Places that are available at lunchtime for pupils to buy food
More lower fat main dishes More fruit juice
Places that are available anytime anywhere in the school for pupils to buy food
More savoury snacks
South of England Fewer potatoes not cooked in oil or fat
North of England More potatoes not cooked in oil or fat

5.3 Food provision and the nutritional standards Schools that met the nutritional standards offered chips and other potatoes cooked in oil or fat less often (2.6 days a week) than those that did not meet the standards (3.6 days a week). There were no other significant differences in food provision between schools that met the standards and those that did not. This is consistent with the finding that the standard most often not met related to the provision of starchy food cooked in oil or fat not more than three days per week.
5.4 Set meals and the CWT guidelines One of the aims of the survey was to evaluate meals offered in primary schools in terms of meeting the CWT guidelines. Evidence from a previous survey of provision of lunchtime meals in primary schools,20 suggested that a substantial number of primary schools in the present sample would offer a family service type of lunchtime provision, with one or possibly two set meals available each day. It would then have been possible to analyse the nutrient contents of these �set meals� and to determine whether or not meals met the 1992 CWT guidelines that were in place when the survey was carried out. Once the survey was underway, however, it became apparent that a family service based around set meals was not a common feature of primary schools lunchtime food provision. Most schools offered a cafeteria style of service with pupils choosing from a number of main dishes, starchy foods, vegetables, desserts and drinks. It was not uncommon for schools to offer as many as 3 or 4 main course choices (36% of schools offered 3 choices, 22% offered 4 or more), and 5 dessert options daily (23% of schools offered 5 or more). The large amount of choice available meant that it was impossible to attempt any analysis of meals offered in terms of the CWT guidelines, simply because of the vast number of possible combinations of foods that might have been served. Equally, attempts to predict likely meal combinations or to compute the profile of a �typical� meal were not possible with no information on the numbers of portions of each food on offer each day in schools. Finally, there was no certainty that the meal combinations selected by the researchers were those chosen by the children. This was further complicated by the fact that a number of schools offered a self-service salad bar from which children could help themselves, and that some schools had a selection of sandwiches available daily for those children who were either hungry or did not want to eat the main meals on offer. Of the schools that participated in the �School Meals in Secondary Schools in England� survey, 89% offered set meals, as one of the options available in a predominantly cash cafeteria type of provision, and it was possible to evaluate the nutrient content of these meals in terms of the CWT guidelines.6 Of the 151 primary schools, only 3 schools operated cash cafeterias, and these did not serve set meals of the type identified in secondary schools. Analysis of the nutrient content of meals as chosen and eaten by primary school pupils, and the relationship between nutrients consumed and the CWT guidelines, are presented in Chapter 6.

6 Food choices of primary school pupils at lunchtime KEY FINDINGS 1. The most popular food choices were desserts (19% of choices), vegetables and salads
(14%), and higher fat main dishes (10%). Higher fat main dishes and chips and other potatoes cooked in oil or fat were chosen nearly twice as often as their lower fat counterparts.
2. The profile of foods chosen did not conform to the Balance of Good Health. Pupils chose
too many foods containing fat and foods and drinks containing sugar. 3. There were no significant differences in the profile of food choices between boys and
girls or infants and juniors. 4. Pupils chose more vegetables and salads in schools where the caterer had received some
training in healthy cooking/eating. More vegetables were also chosen in schools which had run promotions to encourage healthy eating in the past 12 months, and in schools where the lunchtime supervisors were observed to encourage healthy eating.
5. Pupils at schools offering the least choice chose more vegetables and salads and lower fat
main dishes, and fewer higher fat main dishes than pupils at schools offering more choice. Pupils at schools operating cash cafeterias chose more higher fat main dishes, soft drinks, and chips and other potatoes cooked in oil or fat, and fewer vegetables and salads and lower fat main dishes than pupils at other schools.
6. There were no differences in the profile of food choices between pupils who paid for a
school meal (average cost of £1.48 for infants and £1.49 for juniors) and those who received a free school meal.
7. Overall, less than 50% of meals as chosen and as eaten met individual CWT guidelines
for non-starch polysaccharides, vitamin A, folate, calcium, iron, % energy from fat and % energy from saturated fat.
8. Pupils whose meals met six or more CWT guidelines were making different food choices
from those whose meals met less than six guidelines. They chose more baked beans, and fewer chips and other potatoes cooked in oil or fat, and main dishes (both higher and lower fat). The proportion of pupils� meals meeting 6 or more CWT guidelines was greatest at schools offering the least choice.

6.1 Food choices of primary school children Data collected from 7 058 pupils were used to analyse the food choices and nutrient contents of school lunches in 151 primary schools. Pupils� choices are summarised in Table 6.1 and Figure 3. Higher fat main dishes included foods such as burgers, coated poultry products, pizza, sausages, sausage rolls and meat pies. Lower fat main dishes were typically pasta and rice dishes, stews, curries, and vegetable dishes. The most commonly chosen food (and food group) was desserts chosen by 78% of pupils, followed by vegetables (56% of pupils). Higher fat main dishes were chosen by nearly twice as many pupils (53%) as lower fat main dishes (29%), and the same was true for chips and other potatoes cooked in oil or fat (chosen by 48% of pupils) compared to potatoes not cooked in oil or fat (chosen by 25% of pupils). While vegetables were the second most common food chosen (56% of pupils), fruit accounted for only 3.5% of choices. Soft drinks were chosen more often than water, with fruit juice chosen rarely. Very few pupils chose items such as crisps and confectionery because they were generally not available.
Table 6.1. Foods and food groups* chosen by 7 058 pupils in 151 primary schools in England, as a percentage of all foods or food groups chosen, and number of items chosen on average per pupil in each food group across all schools.
Food group
Percent of foods chosen
%
Percent of food groups
chosen %
Number of items per
food group n
Desserts, cakes, biscuits, ice cream 18.6 16.7 1.2 Vegetables and salads 13.8 12.0 1.3 Higher fat main dishes 10.4 11.4 1.0 Chips and other potatoes cooked in oil or fat 9.6 10.4 1.0 Pasta, rice, bread, other cereals 9.5 8.9 1.2 Soft drinks 6.9 7.6 1.0 Lower fat main dishes 5.9 6.3 1.0 Water 5.8 6.4 1.0 Potatoes not cooked in oil or fat 5.0 5.3 1.0 Milk and milk products 4.7 4.8 1.1 Fruit 3.4 3.5 1.1 Baked beans 2.9 3.2 1.0 Sandwiches 1.4 1.4 1.1 Fruit juice 1.0 1.1 1.0 Butter, margarine 0.3 0.3 1.0 Eggs and egg dishes 0.3 0.4 1.0 Savoury snacks, nuts and seeds 0.2 0.2 1.0 Sugar, preserves, confectionery 0.2 0.2 1.0 Base 36 131 33 004 - *condiments excluded from analysis
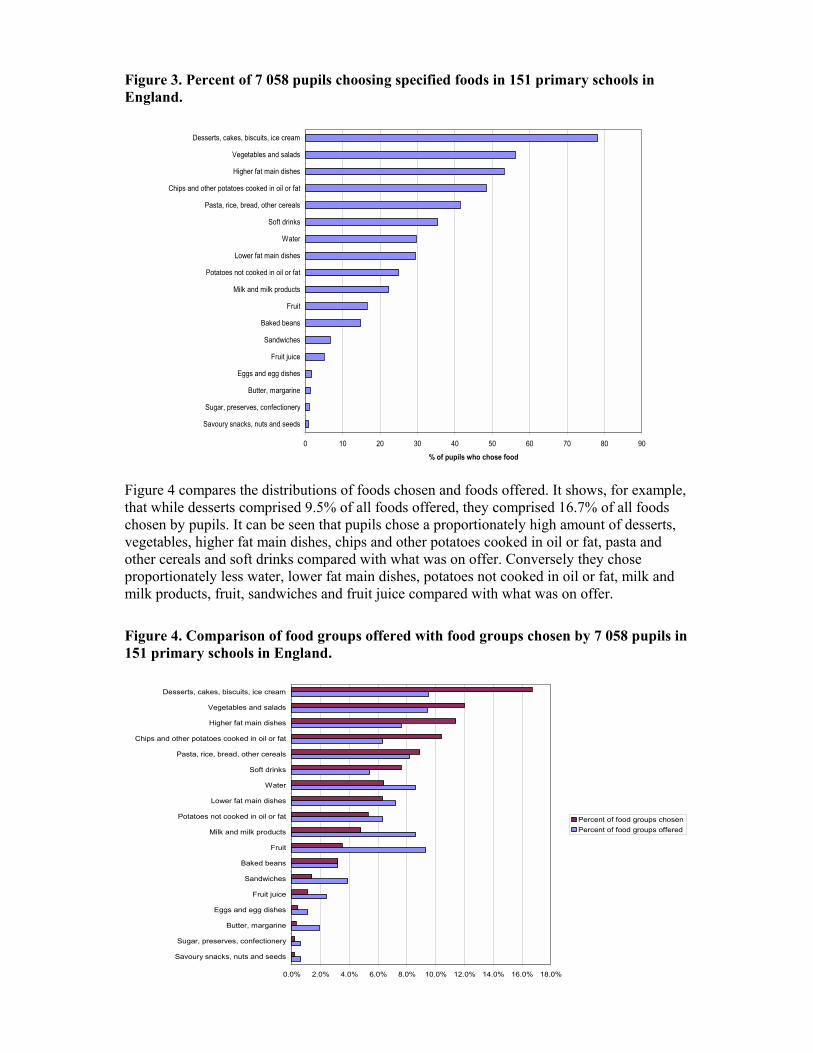
Figure 3. Percent of 7 058 pupils choosing specified foods in 151 primary schools in England.
0 10 20 30 40 50 60 70 80 90
Savoury snacks, nuts and seeds
Sugar, preserves, confectionery
Butter, margarine
Eggs and egg dishes
Fruit juice
Sandwiches
Baked beans
Fruit
Milk and milk products
Potatoes not cooked in oil or fat
Lower fat main dishes
Water
Soft drinks
Pasta, rice, bread, other cereals
Chips and other potatoes cooked in oil or fat
Higher fat main dishes
Vegetables and salads
Desserts, cakes, biscuits, ice cream
% of pupils who chose food
Figure 4 compares the distributions of foods chosen and foods offered. It shows, for example, that while desserts comprised 9.5% of all foods offered, they comprised 16.7% of all foods chosen by pupils. It can be seen that pupils chose a proportionately high amount of desserts, vegetables, higher fat main dishes, chips and other potatoes cooked in oil or fat, pasta and other cereals and soft drinks compared with what was on offer. Conversely they chose proportionately less water, lower fat main dishes, potatoes not cooked in oil or fat, milk and milk products, fruit, sandwiches and fruit juice compared with what was on offer.
Figure 4. Comparison of food groups offered with food groups chosen by 7 058 pupils in 151 primary schools in England.
0.0% 2.0% 4.0% 6.0% 8.0% 10.0% 12.0% 14.0% 16.0% 18.0%
Savoury snacks, nuts and seeds
Sugar, preserves, confectionery
Butter, margarine
Eggs and egg dishes
Fruit juice
Sandwiches
Baked beans
Fruit
Milk and milk products
Potatoes not cooked in oil or fat
Lower fat main dishes
Water
Soft drinks
Pasta, rice, bread, other cereals
Chips and other potatoes cooked in oil or fat
Higher fat main dishes
Vegetables and salads
Desserts, cakes, biscuits, ice cream
Percent of food groups chosenPercent of food groups offered

Pupils� food choices were compared to the profile of food groups in the Balance of Good Health model (see Figure 1).8 Figure 5 shows the profiles of foods offered and foods chosen compared to the model. Figure 5(b) shows that pupils� choices included proportionately far more foods containing fat and foods and drinks containing sugar (mainly desserts, higher fat main dishes, and chips and other potatoes cooked in oil or fat), more than three times that represented in the model, roughly the recommended amount of meat, fish and alternative protein foods, and fewer foods from the other three groups. Pupils chose two-thirds less milk and dairy foods than recommended, nearly a third less fruit and vegetables, and a fifth less starchy foods. It can be seen that the profile of foods chosen by pupils was less healthy than that offered, especially in terms of fruit and vegetables and foods containing fat and foods and drinks containing sugar.
Figure 5. Foods offered to and chosen by pupils in 151 primary schools in relation to the Balance of Good Health
a) Foods offered b) Foods chosen Bread, other cereals and potatoes
Fruit and vegetables
Milk and dairy foods
Meat, fish and alternatives
Recommended
Observed
Foods containing fat Foods and drinks containing sugar
Bread, other cereals and potatoes
Fruit and vegetables
Milk and dairy foods
Meat, fish and alternatives
Recommended
Observed
Foods containing fat Foods and drinks containing sugar
6.2 Eating habits The majority (85%) of junior school pupils reported that they had a school meal 5 days a week, with 5% having a meal just once a week. 19% took part in an activity at lunchtime, usually once a week. Over 50% of these pupils said that on these occasions they ate their school meal as normal, 28% ate at a different time, 14% ate their lunch quickly and 2% brought a packed lunch from home. 34% of all pupils reported having eaten fruit earlier that day. The data collected did not enable a distinction to be made between fruit eaten as part of the School Fruit and Vegetable Scheme and that brought from home.
6.3 What factors were associated with food choices? Due to the very large number of observations (38 665 food choices), all of the comparisons between distributions were statistically significant using a chi-squared test, even allowing for the fact that the food choices were clustered in 151 schools. The patterns of distributions were usually little different, however, according to the factor investigated. Results are expressed as a percentage of all food chosen by each subgroup. Differences of 2% or more are noted. See statistical comments in Section 2.7. Meeting the National Nutritional Standards Pupils at the schools which met all of the compulsory Nutritional Standards chose more vegetables and salads (15% vs. 13%) and less chips and other potatoes cooked in oil or fat (8% vs. 10%) than pupils at schools that did not meet the standards. This reflects the differences in foods offered in these schools (section 5.3).

Age and gender No differences in the profile of food choices were found between infants and juniors or boys and girls. Type of school Pupils at foundation schools chose vegetables and salads less often than pupils at community and voluntary controlled schools (8% vs. 14%), and chose less potatoes not cooked in oil or fat (3% vs. 5%) compared with all other schools. They also chose less water (3% vs. 6%) and fewer low fat main dishes than community schools (4% vs. 6%). Pupils at foundation schools chose more chips and other potatoes cooked in oil or fat than in voluntary controlled schools and other schools (11% vs. 7% and 9%), chose more higher fat main dishes (13% vs. 10%), and had more soft drinks than all other types of schools (12% vs. 6% in community schools, and 8% in voluntary aided and voluntary controlled schools). Region, deprivation and urban/rural Compared with those in the South, pupils in the North chose more soft drinks (8% vs. 5%) and less vegetables and salads (11% vs. 15%). Pupils from the most socio-economically deprived areas chose less vegetables (11% vs. 17%), more pasta and rice (13% vs. 10%), more fruit (5% vs. 2%) and four times more soft drinks (4% vs. 1%) than those from better off areas, who in turn chose five times more fruit juice (2% vs. 0.4%). Pupils� choices did not differ between urban and rural areas. Factors related to time for lunch, morning break, use of tuck shop/vending machines at lunchtime The duration of the lunch period did not have an influence on food choices. Access to food through out the day (at morning break, tuck shops or vending machines) did not influence the profile of food choice. Pupils able to purchase food or drinks from vending machines at lunch time chose more milk and milk products (6% vs. 4%). There were no differences between the food choices of pupils who had eaten fruit at school that morning and those that had not. Factors related to healthy eating At schools which reported having held promotions related to healthy eating and encouraging the consumption of fruit and vegetables, pupils chose more vegetables and salads (14% vs.12%). Similarly, pupils at schools where the cook had training in healthy cooking/eating also chose more vegetables (15% vs. 13%). In the 66% of schools where lunchtime supervisors were observed to be encouraging healthier eating pupils chose more vegetables and salads than in schools where there was no such encouragement (14 vs. 12% of choices). If the cook was aware of the nutritional standards, pupils chose less pasta and rice (8% vs.11%), but no association was found with food choice when the cook could name two or more of the nutritional standards. Service provider and type of contract In schools with a caterer appointed by the LA, pupils chose more vegetables and salads than those in schools appointing their own contractor (14% vs. 11%), who in turn chose more pasta and rice than pupils in schools with DSO or other caterers (11% vs. 9%). Pupils in schools with contractors appointed by the LA chose more soft drinks than pupils in all other schools (9% vs.6%), and more baked beans than pupils at schools with in-house and other types of catering providers (4% vs. 2%). In schools with in-house catering, pupils chose more fruit than those in schools appointing their own caterer or those with other types of catering providers (5% vs. 3% & 2% respectively). They also chose more higher fat main dishes than in schools with DSO catering (12% vs. 10%), more fruit juice than all other schools (3% vs.1%), and more chips and other potatoes cooked in oil or fat than pupils in schools with a

contractor appointed by the LA or the school (12% vs. 9%). In schools with �other types� of catering provider, pupils chose more desserts (19% vs. 16%), and more water (6% vs. 3%) than those in schools in which catering was provided in-house. No associations were found between the type of contract, how the funding was delegated, or whether the school was expecting to make a profit or not and pupils� food choices. Type of service There were a number of differences in pupil choices between schools operating a service with no choice (6 schools, 4 with family service and 2 with cafeteria service) and those operating a cash cafeteria (3 junior cafeterias). Pupils at schools with no choice were given more vegetables (19% vs 8%), fewer higher fat main dishes (8% vs 19%), and more lower fat main dishes (7% vs 2%) than pupils at schools with cash cafeterias, with the percent in the remaining schools intermediate between these extremes. Pupils at schools with no choice were given less chips and other potatoes cooked in oil or fat than pupils at all other schools (7% vs 10% overall). Pupils at schools with cash cafeterias chose more soft drinks than other pupils (13% vs 7% overall). Participation in initiatives There were no differences in foods chosen by pupils according to whether the school was involved in the Healthy Schools Standard or had a School Council/School Nutrition Action Group. From the data collected, it was not known whether schools were following the healthy eating module of Healthy Schools, or whether healthy eating was a subject covered by School Councils. Contract specifications As with the associations between provision and contract specifications, there were some significant associations, but most were inconsistent and not relevant to the specification. Pupils at schools whose contractual documents stated that compliance with nutritional standards was mandatory chose more vegetables and salads (14% vs. 12% of choices) and lower fat main dishes (6% vs. 4% of choices). Pupils chose more higher fat main dishes (12% vs. 10% of choices) and more pasta and other cereals (11% vs.8%) when the standards were mentioned rather than mandatory or not referred to. More lower fat main dishes were chosen by pupils at schools with a mandatory specification to meet the nutritional standards than if the specification was not referred to or mentioned (6% vs. 5% vs. 4% of choices).
6.4 Nutrient content of school meals and the CWT guidelines The mean energy and nutrient contents of lunchtime food selections made by 7 058 primary school pupils (3035 infants and 4023 juniors), together with percent energy from macronutrients, are shown in Table 6.2 (infants) and Table 6.3 (juniors). Values are shown for meals as chosen and as eaten. The tables also show the CWT guidelines (see Table 1.3) for each nutrient for the purpose of comparison, and the percentage of pupils whose lunch met or exceeded the guideline. For infants, the mean nutrient contents of the meals as chosen met or were close to most of the CWT guidelines. The main exception was percent energy from saturated fatty acids, which was higher than recommended. The mean contents of meals as eaten, however, were lower in energy, non-starch polysaccharides (NSP), calcium and iron than the CWT guidelines, with only 21% of meals meeting the guideline for iron intake.

Table 6.2. Energy and nutrient content and percent energy from macronutrients of school meals as chosen and as eaten by 3 035 infant pupils in 151 primary schools in England, together with the CWT (1992) guidelines and percent of meals meeting the guidelines. Infants (n=3 035)
As chosen As eaten % meeting guideline Nutrient per meal Mean SE Mean SE
CWT guideline As chosen As eaten
Energy (kcal) 469 2.80 387 2.83 489 71 57Protein (g) 16.1 0.10 13.2 0.10 5.9 99 92Fat (g) 18.8 0.16 15.7 0.15 - - -Carbohydrate (g) 62.7 0.40 51.5 0.40 - - -Saturated fatty acids (g) 6.6 0.07 5.5 0.06 - - -Non-starch polysaccharides (g) 4.1 0.03 3.2 0.03 3.9 50 30Non-milk extrinsic sugars (g) 14.1 0.18 12.0 0.17 - - -Vitamin A (mcg) 245 5.96 186 4.97 120 52 41Vitamin C (mg) 20 0.33 16 0.29 11 67 52Folate (mcg) 51 0.44 40 0.41 40 63 43Calcium (mg) 180 1.96 150 1.79 158 50 39Iron (mg) 2.3 0.02 1.8 0.02 2.4 35 21Sodium
699 6.07 593 5.80 - - -
% energy from: Protein 14.3 0.08 14.3 0.09 - - -Fat 35.2 0.17 35.3 0.19 <35 48 47Saturated fatty acids 12.3 0.10 12.4 0.10 <11 45 45Monounsaturated fatty acids 12.5 0.08 12.5 0.09 - - -Polyunsaturated fatty acids 6.3 0.05 6.4 0.06 - - -Carbohydrate 50.5 0.16 50.3 0.19 >50 52 51Non-milk extrinsic sugars 11.1 0.13 11.6 0.15 <11 54 53- No CWT guideline Mean nutrient values for meals as chosen by junior pupils (Table 6.3) again met or were close to most of the guidelines, although energy, folate and iron were lower than recommended, and % energy from saturated fatty acids was higher. Mean intakes of energy, NSP, calcium , folate and iron were lower than recommended for meals as eaten. Only 10% of meals as eaten met the CWT guideline for iron intake; for folate the figure was 24%. An analysis of nutrient intakes against revised CWT (2005) guidelines can be found in Appendix A16. Salt intakes as eaten were 1.48g for infants (about half of the daily SACN recommendation of 3g per day for 4-6 year olds), and 1.67g for juniors (about one-third of the daily SACN recommendation of 5g per day for 7-10 year olds).19 A CWT score was computed for each pupil, equivalent to the number of guidelines met. Mean (SD) CWT scores were 5.5 (2.2) for all pupils, 5.7 (2.3) for infants, and 5.3 (2.1) for juniors.

Table 6.3. Energy and nutrient content and percent energy from macronutrients of school meals as chosen and as eaten by 4 023 junior pupils in 151 primary schools in England, CWT (1992) guidelines, and percent of meals meeting the guidelines. Juniors (n=4 023)
As chosen As eaten % meeting guideline Nutrient per meal Mean SE Mean SE
CWT guideline As chosen As eaten
Energy (kcal) 506 2.61 440 2.73 557 69 57 Protein (g) 17.2 0.10 14.8 0.10 8.5 95 86 Fat (g) 20.1 0.15 17.6 0.15 - - - Carbohydrate (g) 68.1 0.37 59.0 0.38 - - - Saturated fatty acids (g) 7.1 0.06 6.2 0.06 - - - Non-starch polysaccharides (g) 4.4 0.03 3.6 0.03 4.5 43 30 Non-milk extrinsic sugars (g) 15.6 0.16 14.1 0.16 - - - Vitamin A (mcg) 241 4.76 196 4.10 150 45 38 Vitamin C (mg) 21 0.30 17 0.27 11 67 57 Folate (mcg) 55 0.41 46 0.40 60 36 24 Calcium (mg) 198 1.90 174 1.80 193 44 35 Iron (mg) 2.5 0.02 2.1 0.02 3.5 16 10 Sodium
757 5.69 667 5.64 - - -
% energy from: Protein 14.1 0.07 14.1 0.08 - - - Fat 34.8 0.15 34.9 0.16 <35 48 47 Saturated fatty acids 12.2 0.08 12.3 0.08 <11 44 44 Monounsaturated fatty acids 12.3 0.07 12.3 0.07 - - - Polyunsaturated fatty acids 6.3 0.05 6.3 0.05 - - - Carbohydrate 51.0 0.14 51.0 0.16 >50 53 52 Non-milk extrinsic sugars 11.4 0.11 12.0 0.12 <11 50 49 - No CWT guideline Table 6.4 shows the overall percent of pupils whose meals met individual CWT guidelines. Less than 50% of meals as chosen or as eaten met the CWT guidelines for non-starch polysaccharides, vitamin A, folate, calcium, iron, percent energy from fat and percent energy from saturated fat.
Table 6.4. Percent of 7058 primary school pupils whose meals met CWT guidelines. % of pupils meeting guideline CWT guideline As chosen As eaten Energy and nutrients Energy: 30% of EAR (20%-40%) 70 57 Protein: not less than 30% of RNI 97 89 Non-starch polysaccharides: not less than 30% of CRV 46 30 Vitamin A: not less than 30% of RNI 48 39 Vitamin C: not less than 35% of RNI 67 55 Folate: not less than 40% of RNI 48 32 Calcium: not less than 35% of RNI 46 37 Iron: not less than 40% of RNI 24 15 % energy from: Fat: not more than 35% of food energy 48 47 Saturated fatty acids: not more than 11% of food energy 45 45 Carbohydrate: not less than 50% of food energy 53 52 Non-milk extrinsic sugars: not more than 11% of food energy 52 50

Figure 6 and Figure 7 show the percentage of pupils whose meals met the CWT guidelines for vitamin A and iron, respectively. The vertical bar (at 30% of RNI for vitamin A and 40% of RNI for iron) indicates the CWT guideline. Although the mean intake of vitamin A from school meals exceeded the CWT guideline in both infant and junior pupils (Table 6.2 and Table 6.3, respectively), the majority of pupils (61%) ate meals that contained less than the guideline amount. The high mean values for vitamin A arose because of the 10% of pupils whose meals contained vitamin A in excess of the RNI. For iron, mean intakes from school meals were only 75% and 60% of the CWT guideline in infant and junior pupils (Table 6.2 and Table 6.3, respectively). The distribution of the %RNI for iron in meals eaten (Figure 7) shows that the majority of pupils derived much less than the CWT guideline amount from their school meals.
Figure 6. Percent of 7058 English primary school pupils whose intakes from school lunch provided a given percentage of the RNI for vitamin A. ( CWT guideline = 30% of RNI)
0
5
10
15
20
25
30
<10% 10%-20%
20%-30%
30%-40%
40%-50%
50%-60%
60%-70%
70%-80%
80%-90%
90%-100%
≥100%
Percent of RNI: Vitamin A
% o
f pup
ils

Figure 7. Percent of 7058 English primary school pupils whose intakes from school lunch provided a given percentage of the RNI for iron. ( CWT guideline = 40% of RNI)
0
5
10
15
20
25
30
35
<10% 10%-20%
20%-30%
30%-40%
40%-50%
50%-60%
60%-70%
70%-80%
80%-90%
90%-100%
≥100%
Percent of RNI: Iron
% o
f pup
ils
Table 6.5 shows the energy and nutrient content of school meals, percent of energy from macronutrients and the percent of meals meeting each CWT guideline according to meal price or receipt of a free school meal. There were only minor differences in intakes between the three groups. Mean (SD) CWT scores were 5.6 (2.2) for pupils paying £1.45 or less, 5.5 (2.2) for pupils paying £1.46 or more, and 5.4 (2.2) for pupils receiving free school meals. There were no differences in food choices between the three groups of pupils, and 99% of caterers reported that the choices offered to pupils that paid for their meal were the same as those offered to pupils receiving a free school meal.

Table 6.5. Energy and nutrient content and percent energy from macronutrients of 6 441* primary school meals as eaten in 148� primary schools in England, by meal price or in receipt of a free school meal.
Meal price ≤£1.45 (n=2 222)
Meal price ≥£1.46 (n=2 106)
Free School Meal (n=2 113)
Nutrient per meal Mean SE
% meeting
CWT Mean SE
% meeting
CWT Mean SE
% meeting
CWT Energy (kcal) 422 3.56 58 418 3.59 59 413 3.69 55 Protein (g) 14.4 0.13 91 14.1 0.13 88 14.2 0.14 87 Fat (g) 16.9 0.19 - 16.9 0.19 - 16.6 0.20 - Carbohydrate (g) 56.7 0.51 - 55.7 0.51 - 54.9 0.51 - Saturated fatty acid (g) 5.9 0.08 - 6.0 0.08 - 5.9 0.08 - Non-starch polysaccharides (g) 3.5 0.04 31 3.6 0.04 31 3.3 0.04 26 Non-milk extrinsic sugar (g) 13.3 0.20 - 13.3 0.21 - 13.1 0.21 - Vitamin A (mg) 208 6.44 41 186 5.27 39 181 5.44 37 Vitamin C (mg) 16 0.34 54 18 0.38 59 16 0.36 50 Folate (mcg) 43 0.52 33 45 0.53 33 42 0.53 30 Calcium (mg) 164 2.31 39 156 2.21 32 173 2.50 40 Iron (mg) 2.0 0.02 15 2.1 0.02 15 2.0 0.02 14 Sodium
636 7.17 - 657 7.62 - 627 7.47 -
% energy from: Protein 14 0.10 - 14 0.11 - 14 0.11 - Fat 35 0.22 47 35 0.21 45 35 0.22 49 Carbohydrate 51 0.22 53 50 0.21 51 51 0.22 53 Saturated fatty acid 12 0.16 47 12 0.12 43 12 0.12 44 Monounsaturated fatty acid 12 0.10 - 13 0.10 - 12 0.10 - Polyunsaturated fatty acid 6 0.07 - 6 0.07 - 6 0.07 - Non-milk extrinsic sugar 12 0.17 51 12 0.16 49 12 0.18 50 *Information on meal price or receipt of free school meal was not available for 617 pupils. �Excludes 2 schools with cash cafeterias and 1 school where all meals were free of charge to all pupils. - No CWT guideline Table 6.6 shows for each CWT guideline the percent of pupils whose meals met the guideline, for those who met six or more guidelines and for all pupils. 52% of infants and 44% of juniors chose combinations of foods that met six or more CWT guidelines.q 10 infants chose meals that met all twelve CWT guidelines, while none of the junior meals chosen met all the guidelines. 12 infants and 23 juniors chose meals that met none of the CWT guidelines. Pupils whose choices met six or more guidelines met them most often for protein, folate, vitamin C, energy, percent energy from carbohydrate and percent energy from fat.
q In secondary schools, by contrast, 28% of boys and 26% of girls chose foods that met six or more CWT guidelines.

Table 6.6. Percent of pupils whose meals* met CWT guidelines for specific nutrients: all pupils and those who met six or more guidelines, by infant and junior. Percent meeting CWT guidelines Infants Juniors
n ≥6
1 586 All
3 035 ≥6
1 758 All
4 023 Energy and Nutrients 30% of energy EAR (20%-40%) 72 57 75 57 Protein: not less than 30% of RNI 99 92 97 86 Non-starch polysaccharides: not less than 30% of RNI 55 30 58 30 Retinol equivalents: not less than 30% of RNI 53 41 52 38 Vitamin C: not less than 35% of RNI 72 52 79 57 Folate: not less than 40% of RNI 72 43 50 24 Calcium: not less than 53% of RNI 54 39 54 35 Iron: not less than 40% of RNI 36 21 20 10 % energy from: Fat: Less than 35% of energy from fat 61 47 62 47 Saturated fatty acids: Less than 11% of energy from sfa 55 45 57 44 Carbohydrate: More than 50% of energy from carbohydrate 67 51 70 52 Non-milk extrinsic sugars: Not more than 11% of energy from NMEs 55 53 52 49 *meals as eaten At schools in which pupils were given no choice of meal at lunchtime (6 schools), 58% of meals eaten met 6 or more CWT guidelines, compared to only 30% of meals in schools with cash cafeterias (3 schools). Overall, 47% of meals eaten by pupils met 6 or more CWT guidelines. Figure 6 shows the differences in food choices made by pupils whose meals met less than half (0-5) and those whose meals met at least half (6-12) of the CWT guidelines, for both infants and juniors. Both infants and juniors achieved a CWT score of 6 or more by choosing fewer higher fat main dishes and by choosing more vegetables and salads and baked beans. These findings are consistent with those in secondary schools,6 although the differences in food choices related to a narrower range of food groups in primary schools. In order to identify the profile of food choices that was likely to be associated with a high CWT score, all of the CWT guidelines were included in a stepwise regression analysis with CWT score as the outcome variable. Six guidelines (for folate, non-starch polysaccharides, percent energy from fat, percent of EAR for energy, calcium and vitamin C) explained 84% of the variation in score (Table 6.7), i.e. meeting these guidelines was associated with a high score and not meeting them was associated with a low score. The importance of each guideline in contributing to a high score (percent of variation in CWT score explained for each additional guideline) is shown in the final column. Thus, the CWT guideline for folate alone explained 39% of the variation in CWT score. Meeting the CWT guidelines for non-starch polysaccharides, fat and energy contributed a further 14%, 11% and 8% respectively, and the guidelines for calcium and vitamin C a further 6% each.

Figure 8. Food choice profiles of infants and juniors attending 151 primary schools in England, according to whether or not their food choice met 6 or more of the CWT guidelines
a) Infants
0 2 4 6 8 10 12 14 16 18 20
Butter, margarine
Sugar, preserves, confectionery
Savoury snacks, nuts and seeds
Sandwiches
Eggs and egg dishes
Soft drinks
Fruit juice
Water
Milk and milk products
Fruit
Desserts, cakes, biscuits, ice cream
Pasta, rice, bread, other cereals
Chips and other potatoes cooked in oil or fat
Potatoes not cooked in oil or fat
Vegetables and salads
Baked beans
Lower fat main dishes
Higher fat main dishes
Percent of food choices
6-12 CWT Guidelines0-5 CWT Guidelines
b) Juniors
0 2 4 6 8 10 12 14 16 18 20
Butter, margarine
Sugar, preserves, confectionery
Savoury snacks, nuts and seeds
Sandwiches
Eggs and egg dishes
Soft drinks
Fruit juice
Water
Milk and milk products
Fruit
Desserts, cakes, biscuits, ice cream
Pasta, rice, bread, other cereals
Chips and other potatoescooked in oil or fat
Potatoes not cooked in oil or fat
Vegetables and salads
Baked beans
Lower fat main dishes
Higher fat main dishes
Percent of food choices
6-12 CWT Guidelines0-5 CWT Guidelines

Table 6.7. Predictors of high CWT score in 7 058 pupils in 151 primary schools in England, based on stepwise multiple regression analysis Percent of variation in CWT score
explained: Predictors In total For each additional
guideline 1
Folate: not less than 40% RNI
39%
39%
2 Non-starch polysaccharides: not less than 30% CRV 53% 14% 3 Not more than 35% food energy from fat 64% 11% 4 Energy: 30% of energy EAR (20%-40%) 72% 8% 5 Calcium: not less than 35% RNI 78% 6% 6 Vitamin C: not less than 35% RNI 84% 6% 7 Not more than 11% food energy from saturated fatty acids 87% 3% 8 Vitamin A: not less than 30% RNI 91% 4% 9 Not more than 11% food energy from non-milk extrinsic sugars 95% 4% 10 Iron: not less than 40% RNI 97% 2% 11 Not less than 50% food energy from carbohydrate 98% 1% 12 Protein: not less than 30% RNI 100% 2% Figure 9 compares the food choice profiles of pupils meeting and not meeting the six most discriminating CWT guidelines. Pupils meeting these six guidelines (and as a result more likely to achieve a high CWT score) chose more baked beans, and fewer main dishes (both higher and lower fat), and chips and other potatoes cooked in oil or fat. Consuming this balance of foods means that a pupil would be more likely to achieve a high CWT score because baked beans contribute significantly to both folate and non-starch polysaccharide intakes, and chips and other potatoes cooked in oil or fat contribute significantly to fat intake.
Figure 9. Food choice profiles of pupils attending 151 primary schools in England, according to whether or not their food choices met the six most discriminating CWT guidelines (folate, non-starch polysaccharides, percent energy from fat, 30% of energy EAR, calcium, vitamin C).
0.0 2.0 4.0 6.0 8.0 10.0 12.0 14.0 16.0 18.0 20.0
Butter, margarine
Sugar, preserves, confectionery
Savoury snacks, nuts and seeds
Sandwiches
Eggs and egg dishes
Soft drinks
Fruit juice
Water
Milk and milk products
Fruit
Desserts, cakes, biscuits, ice cream
Pasta, rice, bread, other cereals
Chips and other potatoes cooked in oil or fat
Potatoes not cooked in oil or fat
Vegetables and salads
Baked beans
Lower fat main dishes
Higher fat main dishes
Met six most discriminating guidelinesDid not meet six most discriminating guidelines

7 Discussion and conclusions
7.1 Survey representativeness and quality of data There was generally good agreement between the characteristics of the schools in the issued sample and those of the national sampling frame from Edubase (Table 2.1). It is likely that small schools were under-represented in both the issued and the participating samples when compared to schools nationally, simply because one of the exclusion criteria for the sampling frame was schools with less than 50 pupils. This may explain the differences in urban and rural schools between the issued sample and all schools. Profiles for deprivation and other characteristics (e.g. school type, government region) were similar between the issued sample, eligible, participating and non-participating schools. During the recruitment stage, 17 schools were deemed ineligible to participate in the survey, mainly because they had very small numbers of pupils having school meals. These schools were mainly in Local Authorities where meals were provided only to those pupils entitled to free school meals, usually in the form of a packed lunch. Survey logistics meant that schools with less than 30 pupils eating school meals could not be included. Thus, those schools providing meals only to free school meal pupils are under-represented. The distribution of catering providers in the sample surveyed was consistent with that expected to be found nationally in primary schools. All primary schools surveyed were mixed schools, and nearly equal numbers of boys and girls were sampled. Data on the distributions of infant and primary schools were not reported in Edubase, but the age distribution of pupils surveyed (Table 2.6) suggested that the numbers of infant and junior pupils would be representative of all pupils in primary schools. Finally, the co-operation rate was nearly 100% (only 32 pupils of 7 317 approached refused to participate). With regard to sampling, therefore, it is reasonable to conclude that the findings in this report are representative of catering provision in primary schools in England and the food choices of their pupils. The data collection tools used in the survey were those developed for the 2004 School Meals in Secondary Schools in England survey.6 These were modified appropriately for primary schools and trialled in 10 schools in the pilot study. Interviewer feedback and analysis of the data collected in the pilot study informed the final modifications. As a result, there were few practical problems encountered during fieldwork. The main problem reported by interviewers was completing all the required tasks in relatively short lunchtimes in a number of schools. Loss of data caused by equipment and procedural failures was minimal and was not thought by the authors to impact significantly on results. When considering foods consumed by pupils, there were a number of instances where the portion weight allocated to a particular food was less than the leftover amount of that food as weighed and recorded by the interviewers. These instances of negative weights of foods eaten were considered to be most likely due to variations in portions served to pupils by school caterers. Because these effects were small, the effect on estimates of nutrients consumed is likely to be minimal. Specification analysis was carried out by one researcher, ensuring consistency of technique, and telephone interviews with head teachers and school cooks were carried out by three KCL nutritionists who followed a structured questionnaire and agreed protocol. TNS interviewers encountering problems in the field were strongly encouraged to contact the senior researcher at TNS for advice on how to proceed, and the pre-fieldwork visits conducted at all schools

ensured that data was collected as planned, even when there was unavoidable disruption of the schedule due to holidays, INSET days and related factors. Approximately 10% of schools were visited during the fieldwork period to monitor data collection procedures and to gain insight into types of catering provision in primary schools to inform analysis.
7.2 The catering service, cooking practices and eating environment The range of catering providers (Table 3.4) and contracts (Table 3.3) observed in the present study was consistent with that expected to be seen in primary schools in England.1 The type of service was primarily a cafeteria style with choice, where pupils were usually offered a two course meal with a drink. Pupils were given a surprising amount of choice, particularly in terms of dessert options with schools typically offering fruit and yoghurt as well as items such as cakes and biscuits. Many schools appeared to encourage or promote healthy eating. There were limited opportunities for pupils to purchase snacks and drinks at school, and nearly two-thirds of tuckshops offered healthier choices. Training of lunchtime supervisors in healthy eating and participation in schemes such as Healthy Schools and the School Fruit and Vegetable Scheme suggested that some schools were undertaking a number of different activities to promote healthy eating. Promotion of healthy eating was reported by survey fieldworkers in over half of school dining rooms (Table 3.9). Many schools followed some healthier catering practices. For example, most schools offered low calorie/no added sugar squash and low fat yoghurt, and salt was available to pupils in only a few schools. Few schools offered crisps or confectionery, and salad bars were common, usually offered as an extra which pupils could choose as well as the vegetable option on offer. However, there were also some less healthy practices. Schools frequently offered products high in salt and fat, such as processed potato products (e.g. hash browns), and processed chicken/turkey and fish products (e.g. turkey footballers and fish sharks), and salt was used in cooking in two-thirds of schools. Despite this apparent emphasis on healthy eating, results showed that many pupils were not making healthier food and drink choices at lunchtime, even though healthier options were available in most schools. A few positive associations were found between practices intended to promote healthy eating and pupils� choices (Section 6.3).
7.3 Analysis of specifications Documents were obtained relating to 74% of schools. These ranged from very detailed specifications to vague guidance notes for cooks. Although virtually all made some reference to healthy eating, and the majority referred to the compulsory standards set by the DfES, few schools or LAs included their own specific mandatory quantitative guidelines relating to the nutritional quality of school meals, good catering practice, or to the tools and processes to be used in implementation and monitoring. Most documents (91%) referred to the statutory National Nutritional Standards, which are a minimum requirement. There was little evidence of schools setting additional standards. There was evidence that some caterers were considering the nutrient content of school meals, with 29% of documents referring to CWT guidelines, and some reporting that foods or menus had been submitted for nutrient analysis. The language used in documents demonstrated awareness of and commitment to the promotion of healthy eating, but few examples of good practice were found. Associations between contract specifications and food provision or pupil choices were generally inconsistent.

7.4 National Nutritional Standards Primary schools performed poorly in terms of meeting the compulsory nutritional standards for food provision. Only 23% of school lunch services met all the standards every day at the beginning of service, falling to 17% at the end of service. Schools commonly failed the standards by offering starchy foods cooked in oil or fat (usually potato products such as hash browns) more than three times a week, and not offering fruit-based desserts at least twice a week. The guidance document for school caterers includes little detail on exactly which foods count towards each standard or component of a standard. For example, there is no specification for a fruit-based dessert. We believe that this has led to misinterpretation of the standards, and confusion amongst cooks in schools as well as those involved in putting together menus, as to which foods can be counted towards each standard. In theory the move away from a traditional family service type of provision towards a cafeteria style setup with more choices should make meeting the standards easier to achieve, but the provision of more choice may have contributed to the over provision of starchy foods cooked in oil or fat. School caterers reported that lunch services and compliance with nutritional standards were monitored in the majority of schools, yet most schools failed to meet all of the compulsory standards. Compliance was commonly reported to be indirectly monitored via menus. It was therefore either not happening in practice, not effective, or caterers believed that their menus offered foods that would meet the standards.
7.5 Inventory and tray check Schools offered a wide variety of foods but neither the distribution of foods on offer nor foods chosen conformed to the Balance of Good Health model. Overall, schools offered too many foods containing fat and foods and drinks containing sugar. Although healthier options were on offer, pupils chose more of the less healthy options, for example choosing higher fat main dishes nearly twice as often as lower fat main dishes, despite both options being offered equally often. Less choice within the meal was associated with a healthier profile of foods being chosen, as pupils at schools offering the least choice chose more vegetables and salads and lower fat main dishes and fewer higher fat main dishes than pupils at other schools. Pupils at schools with cash cafeterias chose more higher fat main dishes, soft drinks, and chips and other potatoes cooked in oil or fat, and fewer vegetables and salads and lower fat main dishes than other pupils. Mean nutrient intakes for both infants and juniors were lower than recommended in the 1992 CWT guidelines for a number of nutrients. Less than half of meals as eaten met the guidelines for non-starch polysaccharides, vitamin A, folate, calcium, iron, percent energy from fat, and percent energy from saturated fat for both infants and juniors. These results are in accordance with NDNS data for 4-18 year olds from 1997.3 Percent energy from fat and saturated fat was somewhat lower in the present study than in the 1997 data. Intakes of micro-nutrient based on the present findings were also lower than reported in 1997. The present findings do not provide evidence of an improvement in the profile of nutrient intake from school meals following the introduction of the National Nutritional Standards in 2001.4 The proportion of pupils whose meals met 6 or more CWT guidelines was higher at schools offering less choice, and lower at schools with more choice. The food choices of pupils who met the six most discriminating CWT guidelines (those most likely to be associated with a high CWT score) were characterised by more baked beans, and fewer main dishes (both higher and lower fat) and chips and other potatoes cooked in oil or fat (Figure 9).

Mean nutrient intakes for pupils in primary schools were better than in secondary schools, despite fewer school lunch services meeting the nutritional standards. This may in part reflect the difference in type of service (reflected in the food choices on offer to pupils), with a predominance of cafeterias offering some choice within a meal in primary schools, and cash cafeterias with unrestricted choice in secondary schools. The majority of primary pupils were offered a meal consisting of a protein item, a starchy food, a vegetable and a dessert, whereas secondary pupils were generally able to choose any combination of items.
7.6 Overall conclusions Amongst primary school pupils in England, mean daily intakes of non-starch polysaccharides and zinc fall substantially below requirements, intakes of iron and vitamin A are borderline in their adequacy, intakes of saturated fatty acids and non-milk extrinsic sugars are one-quarter higher than is deemed healthy, and sodium intakes are more than double the recommended achievable goals.3 4 Between one-quarter and one-third of energy and nutrients are provided by school meals on the days that they are eaten. School meals, therefore, have the potential to help make good these dietary inadequacies or excesses. The study had 3 main aims:
• To assess whether the food provided by the school caterer met the statutory 2001 National Nutritional Standards, set out in the regulations and associated guidance,14 15 for all the children throughout the service period.
• To assess whether the food provided met the guidelines set out by the Caroline
Walker Trust in 1992.7
• To identify the food consumption and nutrient intakes of primary school children from school meals, and to compare these to the Caroline Walker Trust guidelines.
In relation to the first aim:
• Of 146 schools, only 34 (23%) met all of the compulsory standards at the beginning of service over 5 days. This fell to 25 schools (17%) by the end of service. The standards most commonly failed were �starchy food cooked in oil or fat not to be served more than 3 times a week� (failed by 53%) and �fruit based desserts to be served twice a week� (failed by 33%).
• The �additional recommendation� to provide drinking water was met by 140 schools (96%) at the beginning of service and by 139 schools (95%) at the end of service. The �additional recommendation� to provide drinking milk was met by 39 schools (27%) at the beginning of service, falling to 31 schools (21%) by the end of service.
The percentage meeting the nutritional standards was considerably less in primary schools than in secondary schools (83% and 47%, respectively). This was partly because the standards are framed in terms of the foods that should be on offer each lunch time. Because there are typically more pupils in a secondary than in a primary school, caterers in secondary schools offer more options and thereby meet the standards more readily. Nevertheless, given the straightforward nature of the food-based standards, it is surprising that the standards were not met the majority of the time even in primary schools. This points to either a lack of understanding on the part of the caterers about what the standards require, or a disregard of the standards in planning food provision, or both. With regard to the second main aim, because meals were served so as to allow pupils choices within meal components (main dish, vegetable, starchy food, dessert), rather than as fixed items comprising a set meal, it was not possible to evaluate food provision in relation to the Caroline Walker Trust guidelines.

Regarding the third aim, the present findings show that many pupils were not making healthier food and drink choices at lunchtime, even though healthier options were available in most schools. This imbalance in selection is partly due to the failure of most schools to provide a distribution of foods on offer that conformed to the Balance of Good Health. On balance, schools offered too many foods containing fat and foods and drinks containing sugar, and too few fruits and vegetables and milk and dairy products. When faced with such choices, pupils selected more of the less healthy options. Desserts, higher fat main dishes (e.g. burgers, sausage rolls, processed chicken/turkey products), chips and other potatoes cooked in oil or fat and soft drinks made up nearly half of all food choices. The majority of pupils chose foods that met the CWT guidelines for protein (97%) and about two-thirds met the requirements for energy (70%) and vitamin C (67%) (Table 6.4). About half of pupils chose meals that met the guidelines for non-starch polysaccharides (NSP), vitamin A, folate, calcium, and for percent energy from fat, carbohydrate and non-milk extrinsic sugars (NMEs). 45% met the guideline for percent energy from saturated fat, and 24% met the guideline for iron. However, pupils did not eat all of the food chosen. The number of pupils whose consumption met the CWT guidelines was substantially lower than the number whose food choices met the guidelines. While more than half met the guidelines for energy (57%), protein (89%), and vitamin C (55%), only about half met the guidelines for percent energy from fat, carbohydrate and NMEs, and fewer still met the guidelines for percent energy from saturated fat (45%), vitamin A (39%), calcium (37%), folate (32%), NSP (30%) and iron (15%). Mean salt intake was 1.5g per meal, almost half of the SACN19 target for infants (less than 3g/day) and about one-third of the target for juniors (5g/day). The study had objectives designed to achieve the main aims and, in addition, �to identify factors related to catering provision and the school environment that were associated with the provision and consumption of �healthier� foods�. A key finding is that less choice was usually associated with a healthier profile of foods being offered and hence being chosen. More choice was associated with the selection of meals that were less likely to meet the CWT guidelines, especially for folate, non-starch polysaccharides, percent energy from fat, calcium, percent energy from saturated fat, vitamin A and iron. However, as the number of schools on which these associations were based was small, this finding should be interpreted with caution. Pupils whose meals met six or more of the 12 CWT guidelines chose vegetables and salads and baked beans more often, and higher fat main dishes less often than pupils whose meals met five or less CWT guidelines. Less choice was associated with a healthier profile of foods being chosen by pupils, and also with a higher proportion of meals meeting 6 or more CWT guidelines. In relation to encouraging pupils to make healthier food choices, few associations were found between the eating environment, contract specifications, or type of catering provider on foods offered to or chosen by pupils in primary schools. Some positive associations were found relating to foods offered to and chosen by pupils. Schools in which the head was aware of the National Nutritional Standards offered higher fat main dishes less often, and schools in which caterers had run a promotion to encourage healthy eating offered potatoes not cooked in oil or fat more often. Pupils chose more vegetables and salads in schools where the caterer had received some training in healthy eating/cooking, in schools which had run promotions to encourage healthy eating, and in schools where the lunchtime supervisors were observed to encourage healthy eating. Thus, it appears that both the foods on offer and pupils� choices can be influenced positively through

increased staff training and awareness. These influences went only a small way, however, to improve the quality of the diets that the children were eating.
8 Looking ahead The evidence from the present study suggests a number of ways in which the food provision in schools at lunchtime may need to change if healthier meals are to be made available and consumed by school children in England. Many of these suggestions are similar to the recommendations made in the previous report, School Meals in Secondary Schools in England.6 Since the publication of that report in 2004 and the commissioning of the present research, the DfES has published 35 recommendations for the transformation of school meals in both primary and secondary schools in England, based on the work of the School Meals Review Panel (SMRP).4 Many of the suggestions made here and in the previous report have been addressed in the DfES recommendations. It was felt worthwhile to link the evidence from the present research with some suggestions for improvement that reflect, in part, the new recommendations. Evidence Potential ways forward Neither the profile of foods on offer to pupils nor that chosen by pupils reflected the Balance of Good Health. This was true for both schools that met the current National Nutritional Standards and those that did not. The present food-based guidelines do not appear sufficient to ensure that foods containing fat and foods and drinks containing sugar are offered and chosen in accordance with the Balance of Good Health. More than half of all meals eaten did not meet the CWT guidelines for non-starch polysaccharides, vitamin A, folate, iron, calcium, percent energy from fat and percent energy from saturated fat. Food-based standards alone do not appear to be sufficient to ensure that the CWT guidelines are met.
National Nutritional Standards for school food should not only be compulsory but should be based on a combination of food-based and nutrient-based guidelines.
Most schools reported that compliance with the Nutritional Standards was monitored, yet only 23% of schools met the standards every day at the beginning of lunchtime. One explanation for this is that the standards have been misinterpreted, and there is confusion amongst caterers and those planning menus as to which foods count towards which standards.
National Nutritional Standards should be clear and easily measurable.

Evidence Potential ways forward The majority of heads and caterers reported that compliance with the standards was monitored, yet less than a quarter of schools met the standards, suggesting that monitoring was either not happening or was ineffective. Caterers commonly reported that compliance to the standards was assessed by menu analysis. As less than a quarter of schools were meeting the standards, this was either not taking place in practice, the method was ineffective, or the catering providers believed that the foods and drinks they were providing met the standards.
Monitoring of the catering service (particularly compliance to the standards) should be compulsory, using a standard reporting framework supported by robust tools. A database of compliant menus should be made available. Training in monitoring for catering staff should be part of the training relating to healthy eating. A standard reporting format should be specified in monitoring requirements.
Fewer schools met the standards at the end of service than at the beginning.
Schools should ensure that foods that meet the standards are available to pupils throughout the lunchtime service. This links with the suggestions on monitoring.
Nutrient intakes in primary school pupils were better than in secondary. This may in part reflect the fact that primary schools offered soft drinks, confectionery and savoury snacks, chips and other potatoes cooked in oil or fat less often, and vegetables/salad more often than secondary schools. The schools offering less choice were more likely to provide meals that met CWT guidelines.
The range of choice should be restricted to a range of healthier options.
Only 28% of catering staff had received training in healthy eating /cooking. Only 68% of school caterers questioned were aware of the National Nutritional Standards, and of those, only 4% were able to identify all the components whilst 46% were unable to name any. There was some evidence of healthier options being chosen where catering staff had had training in healthy eating/cooking.
All head cooks and managers should receive training in healthy catering and how to meet the new standards.

Evidence Potential ways forward Many schools were participating in government sponsored initiatives such as Healthy Schools and the National School Fruit and Vegetable Scheme.
For healthy eating messages to be effective and impact on health, it is likely that they need to be reflected in all aspects of school life, including teaching and food provision outside lunchtime. Therefore, schools should be encouraged to develop a �whole school nutrition policy�, to be made available to parents and carers.
The school catering contracts or service level agreements examined offered only isolated examples of good practice in incorporating healthy eating into specifications, and language tended to be imprecise
Contract documents should emphasise monitoring in order to ensure compliance with compulsory standards. Where necessary, schools should be given guidance on setting contracts.

9 Acknowledgements We would like to thank everyone who contributed to this survey and the production of this report, in particular:
• The pupils, school staff and school cooks and catering managers • The school catering providers • Deidre Hamill and Marissa-Catherine Carrarini • Taylor Nelson Sofres interviewers
This project was commissioned and funded jointly by the Department for Education and Skills and the Food Standards Agency.
10 References 1 Local Authority Caterers Association (2004). School Meals Survey 2004. Woking: LACA. 2 Statistics of Education (2003). Schools in England 2003. www.dfes.gov.uk 3 Gregory et al (2000). National Diet and Nutrition Survey of Young People aged 4 to 18 years. London: The Stationery Office. 4 School Meals Review Panel (2005). Turning the Tables – Transforming School Food, Appendices: The Development and implementation of nutritional standards for school lunches. 5 Sodexho (2002). The Sodexho School Meals and Lifestyle Survey 2002. Kenley: Sodexho Limited. 6 Nelson M, Bradbury J, Poulter J, Mcgee A, Msebele S, Jarvis L. (2004). School Meals in Secondary Schools in England. Research Report RR557. London: Department for Education and Skills. http://www.food.gov.uk/multimedia/pdfs/secondaryschoolmeals.pdf 7 The Caroline Walker Trust (1992). Nutritional Guidelines For School Meals. Report of an Expert Working Group. London: The Caroline Walker Trust. 8 Food Standards Agency. Balance of Good Health. 9 Which? Magazine (2003). School Dinners. London: Consumers Association. 10 Department of Health. Policy and Guidance. Health and Social Topics. “5 a day “general information and publications. 11 Department of Health (2004). Choosing Health – Making Healthier Choices Easier. London: DH 12 DH (2002). Health Survey for England. 13 World Health Organisation (2003). Diet, Nutrition and the Prevention of Chronic Diseases. Geneva: WHO 14 Statutory Instrument 2000 No. 1777. Education (Nutritional Standards for School Lunches)(England) Regulations 2000. London: TSO 15 Department for Education and Employment (2001). Healthy School Lunches For Pupils in Primary Schools. Nottingham: DfEE 16 DH (1974). Report on Diet and Coronary Heart Disease. Report of the Advisory Panel of the Medical Aspects of Food Policy. Report on Health and Social Subjects 7. London: HMSO 17 Department of Health (1991). Dietary Reference Values for Food Energy and Nutrients for the United Kingdom. Report of the Panel on Dietary Reference Values of the Committee on Medical aspects of Food Policy. Report on Health and Social Subjects 41. London: HMSO 18 The Caroline Walker Trust (2005). Eating Well at School. Nutritional and Practical Guidelines. London: CWT National Heart Forum 19 Scientific Advisory Committee on Nutrition (2003). Salt and Health. London: The Stationery Office 20 Coles and Turner (1992). Catering for Healthy Eating in Schools. Nutritional Specifications in School Meals. A Review of Steps taken by Local Education Authorities to Encourage Healthy Eating in Schools. London: Health Education Authority 21 Storey and Candappa (2004). School Meals Funding Delegation. DfES 22 Indices of Deprivation 2004. http://www.odpm.gov.uk/odpm./SOA/countycouncilsummaries2004.xls Accessed 27/10/05

11 Appendices
Appendix A1. School Caterer Telephone Interview
Appendix A2. Semi-structured Telephone Interview with Bursar/Head/LA
Appendix A3. Eating Environment Assessment
Appendix A4. Portion Weights Booklet
Appendix A5. Meal Record Booklet
Appendix A6. School Meal Checklist
Appendix A7. Specifications Analysis Tool (Part 1 – Quant)
Appendix A8. Specifications Analysis Tool (Part 2 - Qual)
Appendix A9. Food Inventory
Appendix A10. Visibility Questionnaire
Appendix A11. Tray Check
Appendix A12. Major changes in school meals provision post 1980
Appendix A13. The 9 compulsory elements of the National Nutritional Standards
Appendix A14. Classification of foods in 19 food groups
Appendix A15. A worked example for the analysis of food provision
Appendix A16. Comparison of nutrient intakes with 2005 CWT guidelines
Appendix A17. Guidelines for good practice in writing specifications


Appendix A1
Mainstage
School Caterer Telephone Interview School: Name of respondent: Position of respondent: Tel: Catering Provider: LEA: Fieldwork Dates: Interview booked for � Date: ����������������� Time: ����������������� Interview conducted � Date: �����������������.. Time: ����������������� Interviewer name: �������������������

THE SERVICE 1 Firstly, can you tell me when you serve food?
11 1 2 Co
BREAK Foods served
Do you offer a breakfast service? Yes 1
q1b1
Breakfast
No 2
q1b2
If yes, approximately how many pupils use it?
q1b3
If no, is there a breakfast club? Yes 1
No 2
Who runs it? ________________________________
q1m1
Do you offer a mid-morning break service? Yes 1
Morning Break
No 2
q1m2
If yes, approximately how many pupils use it?
q1L1
How long is the lunch period?___________________________
q1L2
Lunch
How many sittings do you have?
q1L3 How many pupils do you usually serve?
q1L4 How many teachers/staff do you usually serve?
Comments
q1L5
2 Are there other places in the eating area where children can buy food and drinks e.g. vending machines or a tuckshop? Can they use them at lunchtime?
Dining Room 11 1 5 Use at l nchtime
Snack VM Yes
1
11.2
_
11.3 Yes 1
1
q2_u1
No 2 q2_d1 No 2 q2_u1
Cold drinks VM Yes 1 q2_d2 Yes 1 q2_u2
No 2 q2_d2 No 2 q2_u2
Hot drinks VM Yes 1 q2-d3 Yes 1 q2_u3
No 2 q2-d3 No 2 q2_u3
Tuckshop Yes 1 q2_d4 Yes 1 q2_u4

No 2 q2_d4 No 2 q2_u4
Other Yes 1 q2_d5 Yes 1 q2_u5
No 2 q2_d5 No 2 q2_u5
11.4.1 Comments
_______________________________________________________
3 11.4.2 Are there places elsewhere in the school where children can buy
foods and drinks? Can they use them at lunchtime?
Elsewhere in school 11.4.4 Use at lunchtime
Snack VM Yes
1
11.5 3_
11.6 Yes 1
1
q3_u1
No 2 q3_e1 No 2 q3_u1
Cold drinks VM Yes 1 q3_e2 Yes 1 q3_u2
No 2 q3_e2 No 2 q3_u2
Hot drinks VM Yes 1 q3_e3 Yes 1 q3_u3
No 2 q3_e3 No 2 q3_u3
Tuckshop Yes1 q3_e4 11.8 Yes
1
q3_u4
No 2 q3_e4 No 2 q3_u4
Other Yes 1 q3_e5 Yes 1 q3_u5
No 2 q3_e5 11.9 No
2
q3_u5
COMMENTS ___________________________________________________
4 How many pupils can the dining room seat at one time?
5 At lunchtime, how do the pupils come into the dining room?
11.10 By sittings
1
By form/year 2/3
All at once 4
Describe: ������������������������������� Another way 5
6 What style of service operates?
Cafeteria (choice) 1
Cafeteria (no choice) 2
Family service (choice) 3
Family service (no choice) 4

Cash cafeteria 5
If cash cafeteria, ask if they can send a price list if you send a SAE
7 How do the children pay for their meals?
11.11 (Go to Q11) Cash cafeteria
1
(Go to Q11) Fixed price (ticket) 2
Smart card/cashless 3
4
5
8
Do parents have access to information from the smart card system about what their children have bought for lunch?
11.15 Yes
1
No 2
9 Has the smart card system been modified to encourage healthier eating? 11.16
s
1
(Go to Q11) No 2
10 If yes, how has it been modified?
11 11.17.1.1 Approximately how many of the school meals you 11.11
11.18 Don’t know
9999
12 How do you know who is entitled to a free school meal?
(Why don�t you know?)
13 How much is a school meal worth? Infant £
Junior £
14 How much is a free school meal worth? Infant £
Junior £
15a Is the choice available to pupils receiving free school meals the same as that

available to other children? Yes 1
No 2
If no, describe�������������������������..
b 11.19 If there is a cash cafeteria, what can free school meal children
choose with their entitlement?
11.20
Main/set meal 1
Any combination 2
16 What does a (set/main) meal include? Protein source q16_1 1 / 2
Vegetable Source q16_2 1 / 2
Starchy food q16_3 1 / 2
Dessert q16_4 1 / 2
Drink q16_5 1 / 2
Describe �������������������� Other q16_6 1 / 2
Regulars: Bread q16_7 1 /2
Salad q16_8 1 / 2
Fruit q16_9 1 / 2
Describe�������������������� Other regular q16_10 1 / 2
17 Is there a choice within the meal? q17_1
(ie pupils can choose from more than 1 option of protein source, starchy food etc) Yes 1
No 2 q17_2
If yes, what is the choice? (ie can choose 1 from 3 proteins, 2 of 2 veg etc) Protein source: __choice(s) from __ option(s) Vegetable source: __choice(s) from __ option(s) Starchy food: __choice(s) from __ option(s) Dessert: __choice(s) from __ option(s) Drink: __choice(s) from __ option(s) Comments:
18 Is fruit counted as a dessert or is it an extra? Dessert 1
(ie if a pupil chooses an apple, can they also have ice cream?) Extra 2
19 Is salad counted as a vegetable or is it an extra? Vegetable 1
Extra 2
20 Are children encouraged/required to have all the components?
Encouraged 1

Required 2
Their choice 3
21 Do you provide packed lunches for school trips?
Yes 1
No 2
If yes, what does this usually include?
COOKING METHODS
22 Is the food cooked/made on the premises?
11.211.22 11.23 (Go to
Q23) Yes 1
11.25 No
23 If no, how and where is it produced and heated?
Probe: how and where produced and heated Transported hot q23_1 1 / 2
q23_5
Cook Chill q23_2 1 / 2
Cook Frozen q23_3 1 / 2
OTHER
q23_4 1 / 2
24 What fats and oils do you use for������.
q24_1
Frying (shallow & deep) 11.27 Veg oil
1
11.27.2 ������..
q24_2
CAKES & PUDDINGS Hard block marg 1 Other 3 ���.. Pkt Mix 2
q24_3
PASTRY Hard block marg 1 Lard 2 Pkt Mix 3
Veg shortening 4 5 ������..
25 How would you usually cook the following foods? Grill, oven bake, fry or another method?
Fry Grill Oven Other N/A
Fish in batter 1 2 3 4 5 q25_1
Fish in breadcrumbs 1 2 3 4 5 q25_2

Fish fingers & fish cakes 1 2 3 4 5 q25_3
Chicken/turkey burgers 1 2 3 4 5 q25_4
12.1.2.1 Chicken
nuggets/Drummers
1 2 3 4 5
q25_5
Chicken/turkey shapes 1 2 3 4 5 q25_6
Chips 1 2 3 4 5 q25_7
Croquette potatoes 1 2 3 4 5 q25_8
Hash browns 1 2 3 4 5 q25_9
Waffles 1 2 3 4 5 q25_10
Wedges 1 2 3 4 5 q25_11
12 1 4
Thick Fine
26 Are the chips you use�..cut? 4 6
27 q27_1 1 / 2
Frozen q27_2 1 / 2
Canned q27_3 1 / 2
28 Do you usually make mashed potatoes from fresh or instant potatoes 12.3 Fr
esh
29 Do you usually add milk and/or butter or margarine to your mash? q29_1 1 / 2
q29_2 1 / 2
Margarine q29_3 1 / 2
30 12.6.1.1 Do you put butter or margarine on the hot
vegetables? 12.6.1.2
utter
1
q30_1 1 / 2
Margarine q30_2 1 / 2
No
31 q31_1 1 / 2
Margarine q31_1 1 / 2
No
32 What type of milk do you use in cooking?

12.8 Full fat/whole
q32_1 1 / 2
Semi skimmed/half fat q32_2 1 / 2
Dried skimmed q32_3 1 / 2
Dried skimmed with added veg. Fat q32_4 1 / 2
Other q32_5 1 / 2
33 Do you buy in sandwiches and filled rolls or make them on the premises?
1
2
Make 3
34 Do you use spreading fat on bread/sandwiches? 12.13 Yes
1
(Go to Q36) No 2
35 What do you use?
12.15 Low/red.
Fat spread
1
12.16 Soft
marg/spread
2
12.17 Sunflower
3
1 / 2 / 3
12.18 Hard
block marg
4
Butter
5
�������..Other
6
4 / 5 / 6
36 What type of bread do you use?
White 1 High fibre white 2 ������Other 5 1 / 2 / 5
Brown 3 Wholemeal 4 Don�t use 6 3 / 4 / 6
37 What type of squash do you use?
Ordinary 1 Low cal/no added sugar 2 Don�t use 3 1 / 2 / 3
38 What type of mayonnaise do you use?
Ordinary 1 Low /reduced fat 2 Don�t use 3 1 / 2 / 3
39a What type of yoghurt do you use?
Ordinary 1 Diet 2 Low/reduced fat 3 Don�t use 4 1 / 2 / 3 / 4
b Is the �fruit� yoghurt
Fruit 1 Fruit-flavoured 2 1 / 2
40 Do you have any type of policy written down about using salt in cooking? Yes 1
No 2
Describe �����������������������������.
��������������������������������.

41 Do you add salt to the water when you are cooking ���..
12.20 Vegetables 12.21 Y
es
1
q41_1
No 2 q41_1
Potatoes Yes 1 q41_2
No 2 q41_2
Rice Yes 1 q41_3
No 2 q41_3
Pasta Yes 1 q41_4
No 2 q41_4
42 Do you season recipes/dishes with salt?
12.22 Yes
1
(Go to Q38) No 2
43 If yes, how do you measure the salt you use?
44 And what about the children? Can they use table salt?
44_2 PROBE HOW AVAILABLE?
1
No 2
(Go to Q40)
45 Is there a need to serve any of these types of food in your school?
Halal q45_1 1 / 2
Kosher q45_2 1 / 2
Vegetarian q45_3 1 / 2
No beef q45_4 1 / 2
No pork q45_5 1 / 2
HEALTHY EATING ACTIVITY
46 Have you undertaken any activity to promote healthier choices to children?
46_2 12.23 Probe: Healthy days, theme days, prize giving……
Yes 1
q46_1
No 2 q46_1
47 Have you been involved in any promotions in the last year that encouraged

children to choose more fruits and vegetables from the menu?
47_2
12.24 Probe: can you tell me a bit about this please? 12.25 Yes
11
q47_1
No 2 q47_1
48
Have any of your staff undergone any training related to healthy eating or healthy cooking in the last 12 months?
12.27 Yes
1
(Go to Q44) No 2
49 a
If yes: Can you describe this training to me? Probe: what & who did it involve? Who provided it?
b Did you make any changes as a result of this training? Describe
50 Have you done anything in the last year to find out what pupils, parents or governors think of the service? Such as�����
Comments box/book
Survey 12.27.1 S
i l
Other
a b c d 50_1 Pupils
a b c d 50_2 Parents
a b c d 50_3 Governors
Describe:
51 If yes, did you make any changes as a result?
51_2
12.28 Probe: Can you tell me a bit about this please? 12.29 Yes
11
q51_1
No 2 q51_1
None

3 q51_1
THE CONTRACT
52 Who employs you?
1 2 Local Authority Service 3 4 1 / 2 / 3 / 4
provider/DSO
53 How many catering/serving staff are present in the eating area at lunchtime?
54 I would like to contact your Line Manager to obtain a copy of any specification relating to the catering service. Can you give me their details?
54_1 Name: ������������������������.
54_2 Position/job title: �������������������...
54_3 Tel: �������������������������
55 There are now regulations about which foods must be served every day, called the Nutritional Standards for School Lunches. Have you heard about these?
12.33 Yes
1
(Go to Q57) No 2
56 If yes, can you describe what these say?
12.34 At least 1 fruit 12.35 Y
es
q56_1 1 / 2
At least 1 vegetable Yes q56_2 1 / 2
At least 1 starchy food Yes q56_3 1 / 2
At least 1 milk or dairy Yes q56_4 1 / 2
At least 1 meat, fish and alternative Yes q56_5 1 / 2
Red meat at least 2/week Yes q56_6 1 / 2
Fish at least 1/week Yes q56_7 1 / 2
Fruit-based desserts at least 2/week Yes q56_8 1 / 2
Starchy food cooked in oil or fat not more than three times a week Yes q56_9 1 / 2
57 Who monitors the catering service in your school?
57_1
Don�t know

12.36 Not monitored
57_2 How is it monitored?
57_3 How often/when is it monitored?
57_4 Do they check the Nutritional Standards for School Lunches?
Yes 1
No 2
Don�t know 9999
Appendix A2
12.36.1 Mainstage Semi-structured Telephone Interview with Bursar/Head/LEA
School: Catering Manager/Head Cook: Name of respondent: Position of respondent: Tel: Fieldwork Dates:

Interview booked for � Date: ����������������� Time: ����������������� Interview conducted � Date: �����������������.. Time: ����������������� Interviewer name: ������������������� Warm-up/introduction of project
1 Who provides the school�s catering service?
Code
13 Contractor appointed by
school
1
Contractor appointed by LEA 2
Local Authority Service Provider/DSO 3
Catering staff employed by school 4
Other (please describe) 5
2 How is the funding delegated?
14 Automatically 1
15 Delegated by 2
16 1 LEA controlled
3
3 Who is the agreement between?

4 Can you tell me a little bit about how the agreement is financially organised?
The school pays an agreed cost for a specified service. Cost can be varied ie if pupil numbers change 16 2 Fixed cost/fixed price
1
Costs of providing the service are paid by the provider and recharged, with a management fee, to the school 16 3 Management fee/cost plus
2
Provider has control over the menu and pricing � no subsidy from school and service paid for by pupils 16.4 Profit & loss/breakeven
3
Other (please describe) 4
5 How many pupils have school lunches each day?
6 How many pupils are eligible for/entitled to a free school meal? 9999 7 How many pupils have a free school meal each day? 8 Does the school expect to make a profit from its catering service?
16.6 Yes
(Go to Q11) No
(Go to Q11) Don�t know 9999
16.7 Catering
9 Does the profit go back to the catering service or to other services in the school?
16.8
16.9 Other
Don�t know 9999
10 What is the rate of return? (percentage) 11 Are you aware of any type of written specification for the school meals service
for your school?
16.10 (Go to Q12) Yes
1
(Go to Q13) No 2

12 Yes 1
If yes, can you send us a copy of the relevant part of the specification that relates to food service (i.e. menu choice, portion size, percentage of items prepared on site, range of fresh vegetables, nutrition/healthy eating), and the part that relates to monitoring?
No 2
(We are particularly interested in seeing any part of the specification that relates to nutrition/healthy eating)
13 If no, who should we contact to obtain the specification? Name ������������������ Phone number/email ������������. 14
There are now regulations/standards about which foods must be served every day, called the Nutritional Standards for School Lunches. Are you aware of these?
(GO TO Q15)
Yes 1
(Go to Q17) No 2 15 Are these standards monitored within the school?
16.11 Yes
(Go to Q17) No
(Go to Q17) Don�t know 9999 16 Can you tell me a little about how you monitor these standards within the school? 16_1 Who?
16_2 How?
16_3 Tools?

16_4
How often?
17 If pupils go on school trips, are packed lunches provided for those who normally
have school lunches?
(Go to Q19) No 18 How often per term would this happen per child? 19 How many school staff (non-catering) supervise the children in the dining room
at lunch time?
20 Are there any non-teaching supervisory staff present?
21 Have any of the supervisors had any training in the promotion of healthy eating?
1
2 3 If yes, describe ��������������������������
��������������������������������. ��������������������������������.
22 Is there any documentation regarding this training? 1 2 23 1 2 24

GROWING SCHOOLS
1 A DfES created resource which primary and secondary teachers can use to create growing areas in their school grounds
WHOLE SCHOOL FOOD
2 DfES published guidance in Sept 2003 to encourage a whole school approach to bring together messages about food throughout the day, from breakfast to after school clubs
DfES/DoH initiative 3
Healthy Schools Standard /Healthy Schools Award
School Nutrition Action Group/School Council
4
School based alliance in which staff, pupils and caterers, supported by health & education professionals work together to review & expand the range of food & drink available to increase the uptake of a healthier diet and to ensure consistent messages from the curriculum & the food service
FRUIT IN SCHOOLS
5
SCHOOL MILK SCHEME
6
DfES Food Partnerships Project
7
25 1 25_1
Were you involved in one of the following Food in Schools programmes? Yes No 2
IF YES, WHICH ONE:
25_2 West Midlands Healthier breakfast clubs 1
South West Healthier tuck shops 2
East of England Healthier vending machines 3
South East Healthier lunch boxes 4
DoH strand comprises 8 projects that follow the child throughout the school day. Operating in limited number of selected schools.
East Midlands & North East Water provision 5
South East Dining room environment 6
North West Cookery Clubs 7
17 Growing Clubs 8
18
1 25_3 19 If yes, is the project still
running?
Yes
No 2
INFO PAGE
Any additional information referring to the financial structure of the contracts/service level agreements/communication with the LEA etc.

Appendix A3

J. 112546
Primary School Meals Survey
Eating Environment Assessment
Fieldwork start date School Name School ID number: Interviewer name Day of the week
INTERVIEWER NOTE: Please take this questionnaire with you to the school each day, but use ONLY IF you experience problems with CAPI that make it impossible to complete the questionnaire using CAPI. Contact the office if you do experience CAPI problems and have to use this questionnaire.
2005
Day Month

Eating Environment Assessment Please complete on 4th day
1) Is the menu displayed in the dining room? Yes
No
2) Is there any information displayed in the dining room about the suitability of foods for certain groups e.g. foods such as halal, vegetarian, kosher? (Tick all that apply)
No:
Yes: Halal
Kosher
Vegetarian
Organic
No Beef
No Pork
3) Is there any evidence of the promotion of healthy eating?
(Tick all that apply) None Go to Q5
Posters
Leaflets
Food labelling
Go to Q4
Menu labelling
Other (please describe)
4) Who were the materials produced by?

(Tick all that apply) Don�t Know
Food company
School caterer
Health Education Authority (HEA)
Food Standards Agency (FSA)
British Nutrition Foundation (BNF)
School
Other (please describe)
5) Did you hear any of the catering staff encouraging healthy eating (eg. by asking the pupils to select healthier options or recommending that they eat their vegetables)
Yes
No
6) Did you hear any of the teachers/helpers encouraging healthy eating (eg. by asking the pupils to select healthier options or recommending that they eat their vegetables)
Yes
No
7) Did you see any evidence suggesting that children are normally required to eat most of their meal before:
a. Eating dessert
Most of the time
Some of the time
Occasionally
Never
b. Leaving the table
Most of the time
Some of the time
Occasionally
Never
8) On average, what proportion of pupils have vegetables on their
(please tick one box) All
More than half
About half

Less than half
None
9) Is there any commercial marketing? e.g. brands such as Walkers, Flora, etc.
Yes
No
Yes 10) Are there any special promotions on this week? e.g. free piece of fruit. No
If yes, please describe:
Yes
No
11) Do children who bring packed-lunches sit with those who eat a
school lunch?
12) How many tills or paying points are there in operation?
Yes 13) When children enter the dining hall, is the queue organised so that all pupils have to walk past the area where the set meals are served?
No
Yes
ASK Q15
14) Is there a tuckshop operating in the school dining room which children are allowed to use during lunchtime?
No
END
15) In the tuckshop, what types of foods/drinks are sold?
Sandwiches/rolls
Crisps and savoury snacks
Chocolate and sweets

Cakes and biscuits
Fruit
Soft drinks
Water
Fruit juice
Milk
Other (please describe)
Appendix A4
JN 112546 Primary School Meals survey
Portion Weights Booklet
Fieldwork start date
2005
Day Month

School Name Assignment Number Use the Day 1 number for the Weigher. Interviewer name Question to head cook: Do you serve different size food portions to infant and junior children? Yes
No
N/A

DAY 1 INFANT Size Portion 1
19.1.1.1
19.1.1.2 Day of the week (tick)
19.1.1.3
Food Weight 1 Weight 2
• Weigh 2 portions of 12 food/drink items each day. • Ask to be served two infant size portions of the meal components of the day,
including desserts and drinks. • Make up the total items to 12 by choosing other foods/drinks that are popular
Monday Tuesday Wednesday Thursday Friday
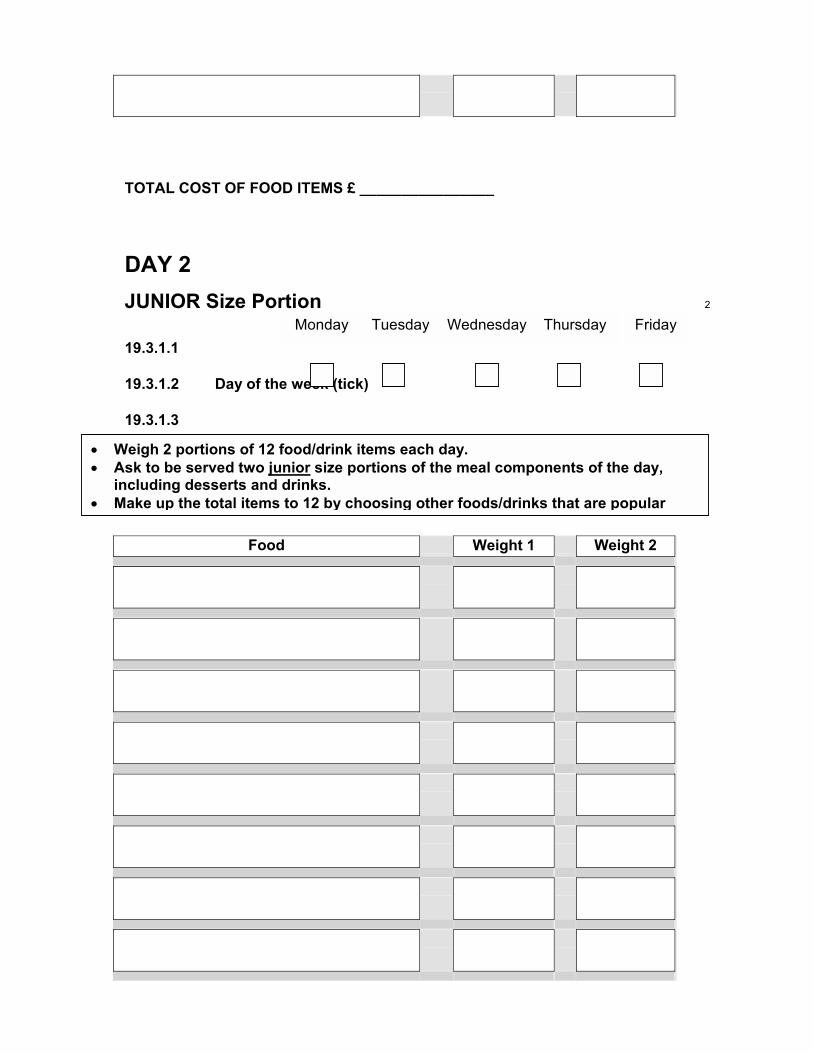
TOTAL COST OF FOOD ITEMS £ ________________
DAY 2 JUNIOR Size Portion 2
19.3.1.1
19.3.1.2 Day of the week (tick)
19.3.1.3
Food Weight 1 Weight 2
• Weigh 2 portions of 12 food/drink items each day. • Ask to be served two junior size portions of the meal components of the day,
including desserts and drinks. • Make up the total items to 12 by choosing other foods/drinks that are popular
Monday Tuesday Wednesday Thursday Friday

TOTAL COST OF FOOD ITEMS £ ________________
DAY 3 INFANT Size Portion 1
19.5.1.1
19.5.1.2 Day of the week (tick)
19.5.1.3
Food Weight 1 Weight 2
• Weigh 2 portions of 12 food/drink items each day. • Ask to be served two infant size portions of the meal components of the day,
including desserts and drinks. • Make up the total items to 12 by choosing other foods/drinks that are popular
Monday Tuesday Wednesday Thursday Friday

TOTAL COST OF FOOD ITEMS £ ________________
DAY 4 JUNIOR Size Portion 2
19.7.1.1
19.7.1.2 Day of the week (tick)
19.7.1.3
Food Weight 1 Weight 2
• Weigh 2 portions of 12 food/drink items each day. • Ask to be served two junior size portions of the meal components of the day,
including desserts and drinks. • Make up the total items to 12 by choosing other foods/drinks that are popular
Monday Tuesday Wednesday Thursday Friday

TOTAL COST OF FOOD ITEMS £ ________________
DAY 5 INFANT Size Portion 1
19.9.1.1
19.9.1.2 Day of the week (tick)
19.9.1.3
• Weigh 2 portions of 12 food/drink items each day. • Ask to be served two infant size portions of the meal components of the day,
including desserts and drinks. • Make up the total items to 12 by choosing other foods/drinks that are popular
Monday Tuesday Wednesday Thursday Friday

Food Weight 1 Weight 2
TOTAL COST OF FOOD ITEMS £ ________________
Appendix A5

JN 112546 Primary School Meals survey
Meal Record Booklet
Fieldwork start date School Name Assignment Number Use the Day 1 number for the Weigher. Interviewer name
TO BE COMPLETED EVERY DAY
MONDAY Day of the week (tick)
2005
Day Month
Monday Tuesday Wednesday Thursday Friday

Do you have a menu for today? (Please tick one) Yes Go to Section A
No Go to Section B
20 Section A Compare the foods being served today to the menu. Are there any differences? Yes If yes, record the differences below: No END
Items listed on the menu but not available
Items available but not listed on the menu
21
22 Section B Schools may have set meals, for example:
- Fish OR - Chicken curry - Chips - Rice - Peas - Carrots - Jelly with fruit - Banana split
Or there may be a choice within the meal, for example:
- Fish or chicken curry - Chips or rice - Peas or carrots - Jelly with fruit or banana split
23 What happens in your school? Pupils have a choice within the meal END
There are set meals Complete Section C below Other Please describe_______________________________________________
24 Section C Record details of all set meals Set Meal 1:
Set Meal 2: Set Meal 3:

Appendix A6
JN 112546 Primary School Meals survey
School Meal Checklist
Fieldwork start date School Name Assignment Number Use the Day 1 number for the Selector Interviewer name
2005
Day Month

School Meal Checklist
Take the form to the secretary at the end of the week and ask her to tick a box for each child. If the school wish, they can remove the list of names to preserve confidentiality. Does the pupil receive a FSM Yes No STICK LABEL HERE
Pupil Name: __________________________________
Does the pupil receive a FSM Yes No STICK LABEL HERE
Pupil Name: __________________________________
Does the pupil receive a FSM Yes No STICK LABEL HERE
Pupil Name: __________________________________
Does the pupil receive a FSM Yes No STICK LABEL HERE
Pupil Name: __________________________________
Does the pupil receive a FSM Yes No STICK LABEL HERE
Pupil Name: __________________________________

Appendix A7
Primary School Meals Research Project Specifications Analysis Tool (Part 1 – Quant) School Name: School Serial Number: Source of Contract/Specification (LEA/School): Type/Title of Document: (e.g. Service Level Agreement/Tender/Contract/Specification) Name of researcher: Date of analysis:

24.1 MENTIONED 24.2 MANDATORY Is there any reference to:
√ Page no.’s √ Page no.’s
NO REF √
1. Guidelines/Policy a) Recommendations in terms of the nutritional content
b) The minimum nutritional standards set by DfES
c) A ‘Healthy Eating/Nutrition Policy/Food Policy’
d) Encouraging healthy eating aims, objectives, targets
e) Obesity/Overweight/Weight Control
f) COMA/SACN
g) 30% RDA/DRV
h) CWT Guidelines
i) Encouraging healthier choices through pricing
j) Encouraging healthier choices through positioning/layout/other promotional activities
2. Nutrient specifications – QUALITATIVE
a) Fat
b) Sugar
c) Salt
d) Fibre
e) others
3 a) The range and number of dishes/items that must be available

on a daily basis and menu planning
MENTIONED 24.3 MANDATORYIs there any reference to:
√ Page no.’s √ Page no.’s
NO REF
√ 3 b) A set meal at a fixed price
4. Specifying menus and recipes a) Menus
b) Standard recipes
5. Standard portion sizes
6. Nutritional specifications for commodities/ingredients to be used
7. Nutrient specifications – QUANTITATIVE
a) Energy
b) Carbohydrate
c) Fat
d) Protein
e) Vitamin C
f) Vitamin A
g) Vitamin D
h) Iron
i) Calcium
j) Salt/sodium
k) Others

MENTIONED 24.4 MANDATOR
Y Is there any reference to:
√ Page no.’s √ Page no.’s
NO REF
√
ELEMENTS OF GOOD PRACTICE
8. Cooking Methods
9. Salt a) salt in cooking practice
b) access to salt by pupils
10. Specific �healthy� foods and drinks to be served
11. Specific foods and drinks NOT to be served
25 12. Additives
13. Organic Food
14. GM/Irradiated Food
15. Monitoring
16. Customer/school consultation
17. Local sourcing of commodities
18. Meeting special dietary needs

Appendix A8 Primary School Meals Research Project Specifications Analysis Tool (Part 2 - Qual) School Name: School Serial Number: Source of Contract/Specification (LEA/School): Type/Title of Document: (e g Service Level Agreement/Tender/Contract/Specification) Name of researcher: Date of analysis:

MEN 25.1.1
What does service level agreement/contract/spec say?
1. Guidelines/Policy
a) Recommendations in terms of the nutritional content
b) The minimum nutritional standards set by DfES
c) A ‘Healthy Eating/Nutrition Policy/Food Policy’
d) Encouraging healthy eating aims, objectives, targets
e) Obesity/Overweight/Weight Control
f) COMA/SACN
g) 30% RDA/DRV
h) CWT Guidelines
i) Encouraging healthier choices through pricing
j) Encouraging healthier choices through positioning/layout/other promotional activities
2. Nutrient specifications - QUALITATIVE
a) Fat
b) Sugar
c) Salt

d) Fibre
e) others
3 a) The range and number of dishes/items that must be available on a daily basis
3 b) A set meal at a fixed price
4. Specifying menus and recipes
a) Menus
b) Standard recipes
5. Standard portion sizes
6. Nutritional specifications for commodities/ingredients to be used
7. Nutrient specifications - QUANTITATIVE
a) Energy
b) Carbohydrate
c) Fat
d) Protein
e) Vitamin C
f) Vitamin A
g) Vitamin D
h) Iron
i) Calcium
j) Salt/sodium

k) Others
ELEMENTS OF GOOD PRACTICE
8. Cooking Methods
9. Salt
a) salt in cooking practice
b) access to salt by pupils
10. Specific �healthy� foods and drinks to be served
11. Specific foods and drinks NOT to be served
26 12. Additives
13. Organic Food
14.GM/Irradiated Food
15. Monitoring
16. Customer/school consultation
17. Local sourcing of commodities
18. Meeting special dietary needs

Appendix A9
J. 112546
Primary School Meals Survey
Food Inventory
Fieldwork start date School Name School ID number: Interviewer name Day of the week
INTERVIEWER NOTE:
2005Day Mont

Please take this questionnaire with you to the school each day, but use ONLY IF you experience problems with CAPI that make it impossible to complete the questionnaire using CAPI. Contact the office if you do experience CAPI problems and have to use this questionnaire.
Food availability
INVENTORY Yes No
Shepherds Pie Cottage Pie Curry � ChickenCurry � VegetableLasagne � Beef Lasagne � VegetableMeatballsMacaroni and cheeseRoast Pork Roast Turkey Roast Lamb Roast Beef Gravy Yorkshire Pudding Stuffing Chicken nuggets Cod � in batter Cod � in breadcrumb FishfingersSausage Roll Pizza (specify type) Pizza (specify type)
Other main meal 1 ���������...
Other main meal 2 ���������...
Other main meal 3 ���������...
61
Other main meal 4 ���������...
63
Other main meal 5 ���������...
65
Yes �
with Yes � no
bun No
• Please record all food items that areavailable today.
• For each item a tick must be placedin either the yes or the no box.
• If there are items available that arenot on the lists then add them in the

a bun Burger - vegetarianBurger � BeefBurger � Chicken Burger � Turkey Hot Dog (ie: frankfurter) Vegetarian sausage
Sausage
Yes No
Cheese Egg HamTunaOther plated salads 1 ���������...
78
Other plated salads 2 ���������...
80
Are there any sandwiches or filled rolls available today?
YES NO
If YES, below is a listing of sandwiches, rolls and baguettes. Please specify the fillings available as well as the type of bread. Please also record the weight (if it is pre-packaged and the weight is shown on the label). Note: �plain� does not include with mayonnaise.
If NO, then go on to rice and pasta.
SANDWICH Please tick the type of bread for the filling.
FILLING Yes No White
slicedBrown sliced
White roll
Brown roll
Bagu-ette
Other ����
Wt
Plain cheese Plain ham
Plain salad Plain tuna

Other fillings 1 �������.
Other fillings 2 �������.
Other fillings 3 �������.
Yes NoPlain boiled rice Plain pasta Spaghetti hoops/shapes Other rice and pasta 1 ���������...
Other rice and pasta 2 ���������...
Boiled Chips Croquettes
Roast Sauté Waffles Potato Wedges Jacket (ie: baked potatoes, whole or half)
Hash Browns Other potatoes 1 ���������...
Other potatoes 2 ���������...
Butter

Cheese Other jacket fillings 1 ���������..
Other jacket fillings 2 ���������..
Yes NoBaked Beans Broccoli Brussel Sprouts Cabbage Carrots Green/French Beans Onion Rings (battered) Peas Sweetcorn Tomato Lettuce Coleslaw Cucumber Other vegetables/salad 1 ���������...
Other vegetables/salad 2 ���������...
YES NO
WHITE SLICED
BROWN SLICED
HALF SLICE OF
HALF SLICE OF

Other bread 1 ���������...
Other bread 2 ���������...
YES NO
MARGARINE PORTION
Other condiments 1 ���������...
Other condiments 2 ���������...

Dessert Extras Yes No
Custard
88 Jam
Chocolate Sauce
OTHER DESSERT EXTRAS 1
Other dessert extras 2 ���������...
FRUIT
APPLE
Yes No
Fruit salad (tinned) Short bread Chocolate mousse Yoghurt (fruit/flavoured) Jelly Flapjack Jam tart Other desserts 1 �����������
Other desserts 2 �����������

BANANA
KIWI FRUIT
ORANGE
PEAR
SATSUMA
GRAPES
MELON
OTHER FRUIT 1
OTHER FRUIT 2
The following grids are to record the availability of different kinds of pre-packaged foods on offer. Tick all that are available. Add weights for each available item in the weight column for the pre-packaged foods. NB: You are not expected to weigh any of the foods in these grids yourself � just record any weight printed on the packaging. Are there any crisps or other packaged savoury snacks (eg crisps, nuts, rice crackers) available today? YES NO If YES, then please fill in the savoury snacks table as per the above instructions. If NO, then proceed to the next section, confectionery.

S O
WT Yes No
Discos Doritos Lite Crisps
89
Salt & Shake Crisps 91
Walkers Sensations
93
French Fries 95
Frisps Footballs Hula Hoops Mini Cheddars Monster Munch Nik Naks Peanuts, salted Popcorn, sweet Potato Crisps -any flavour Pringles Quavers Real McCoys Skips Snack a Jacks Crispy Square Thai Bites Twiglets Wheat Crunchies Wotsits Other snacks 1 ����������..
Other snacks 2 ����������..

Are there any chocolate bars or other packaged sweets available today? YES NO If YES, then please record those which are available as well as the weight, as printed on the package in the weight column. If NO, please proceed to the next section, fruit juice.
CONFECTIONERY CHOCOLATE BARS Wt Yes No Aero Boost Bounty Cadbury�s Caramel Cadbury�s Fudge Cadbury�s Marble Cadbury�s Snack Crunchie Dairy Milk Chocolate Drifter Double Decker Fruit & Nut Chocolate Fuse Galaxy Kit Kat Lion Bar Magic Stars Mars Bar Milky Bar Milky Way Minstrels Penguin Picnic Snickers Toffee Crisp Topic Twix Wispa Yorkie Bar Other chocolate bars 1 ����������..
Other chocolate bars 2 ����������..

You now will be asked to enter the weights of drinks. NB: There may be more than one weight to be entered as the drinks may come in a number of sizes. Please enter the appropriate weight for all types. If the drink is available only in a cup, please tick ‘cup’ (you do not need to put in a weight).
95.15 Can Bottle
Carton
Cup
95.21 FRUIT JUICE (100%)
Apple Juice Orange Juice Other juice 1 �����������...
Other juice 2 �����������...
MILK DRINKS Milk - skimmed Milk - semi skimmed/half fat Milk - full fat/whole Flavoured milk Milkshake Other milk drinks 1 �����������...
Other milk drinks 2 �����������...
95.30 OTHER DRINKS
Water
Orange Squash
Blackcurrant Squash
Other drinks 1 �����������...
Other drinks 2 �����������...

Are there any other pre-packaged soft drinks (excluding milk in cartons, juices, water, squash etc). YES NO If YES, please indicate whether it is supplied in a can, bottle, carton or other type of container and record the weight. If NO, END.
95.31 SOFT DRINKS Can
Bottle
Carton Other
Calypso Capri Sun Coca Cola/Pepsi Coca Cola/Pepsi Diet
96 Dr Pepper
97 5 Alive
98
101 Fanta
102
105 Fruitina
106
109 Lilt
110
113 Lilt Light
114
117 Lucozade Energy
118
121 Lucozade Sport
122
Oasis 125
Orangina Panda Pops Panda Still Ribena Ribena Light Ribena Toothkind Robinson�s Fruit Shoot 7 UP 7 Up, diet

Slush Puppie Sprite Sprite, diet Sunny Delight, regular Sunny Delight, no add sugar Tip Top
126
Vimto Other soft drinks 1 �����������...
Other soft drinks 2 �����������...
Appendix A10
J. 112546
Primary School Meals Survey
Visibility Questionnaire
Fieldwork start date School Name School ID number: Interviewer name Day of the week
2005
Day Month

INTERVIEWER NOTE: Please take this questionnaire with you to the school each day, but use ONLY IF you experience problems with CAPI that make it impossible to complete the questionnaire using CAPI. Contact the office if you do experience CAPI problems and have to use this questionnaire.

Visibility of food questionnaire 1 BEGINNING OF SERVICE
Day: Mon Tues Wed Thurs Fri Beginning of service
1) Red Meat Beef, lamb, pork, ham, bacon, gammon, mince, sausages (beef or pork), beef/ham burgers, cottage pie, meat lasagne, bolognaise sauce for pasta, etc. NOT CHICKEN OR TURKEY 1) Can you see a red meat-based dish? (Red meat only has to be served 2 times per week so it may not be available) a) Yes b) No
Ask a member of staff if there is a red meat-based dish available now.
Yes No Go to Q2
1 What is it? ________________________
2 Why wasn’t it visible? Tick all that apply
Being kept warm
Being kept cold
Only available on request to all pupils
Only available for certain pupils
Other reason specify:

2) 2) Can you see a fish-based dish/item? (Fish only has to be served once a week so it may not be available) a) Yes b) No
3) Meat, Fish and Alternative sources of protein Meat: roast, chops, stews and casseroles, chicken burgers, chicken nuggets, turkey drummers, ham, sausages, beef burgers, mince etc. Fish: tuna, cod/haddock (with or without batter or breadcrumbs), fish fingers etc. Alternative: kidney beans, lentils, chickpeas, nuts, eggs, Quorn, tofu, soya/veggie mince, cheese. NOT MILK
3) Can you see at least 1 meat, fish or alternative sources of protein dish or item? a) Yes b) No
Ask a member of staff if there is a fish-based dish/item available now.
Yes No Go to Q3
Ask a member of staff if there is a protein food available now.
Yes No Go to Q4
3 What is it? ________________________
4 Why wasn’t it visible? Tick all that apply
Being kept warm
Being kept cold
Only available on request to all pupils
Only available for certain pupils
5 What is it? ________________________
6 Why wasn’t it visible? Tick all that apply
Being kept warm
Being kept cold
Only available on request to all pupils
Only available for certain pupils
2) Fish Fish fingers, fishcakes cod/haddock (with or without batter or breadcrumbs), tuna, sardines, mackerel, prawns, fish pie, fish bake, etc.

4) Starchy foods Potatoes – boiled, mashed, roasted, wedges, jacket, chips, sweet potatoes, yams, waffles, croquettes, hash browns, fritters, sauté Rice – boiled white, boiled brown, risotto, pilau/pilaff, rice salad, fried rice, paella Pasta – white, wholewheat or tricoloured shells, macaroni, spaghetti, pasta bake, pasta salad, macaroni cheese, tinned spaghetti shapes in tomato sauce Bread – slices, rolls, sandwiches, filled rolls and baguettes, pitta bread, crispbread, scones, chapatis 4) Can you see at least 1 starchy food? a) Yes b) No Can you see any of these: Potatoes - chips, roast, sauté, potato wedges, croquettes, waffles, hash browns. Rice - fried rice. Yes No Can you see any of these: pasta/pasta salad, boiled rice/risotto/rice salad, bread, potatoes (boiled, mashed/creamed, jacket). Yes No
Ask a member of staff if there is a starchy food available now.
Yes No Go to Q5
7 What is it? ________________________
8 Why wasn’t it visible? Tick all that apply
Being kept warm
Being kept cold
Only available on request to all pupils
Only available for certain pupils
Other reason specify:

5) Vegetables or salad
Vegetables: include fresh, tinned or cooked from frozen. Include baked beans. NOT SPAGHETTI HOOPS. Salad: include mixed, green or plated salads, coleslaw, lettuce, tomato, cucumber, carrot NOT RICE OR PASTA SALADS
5) Can you see at least 1 vegetable or salad? a) Yes b) No
6) Plain Drinking Milk Plain milk – include whole/full-fat, semi-skimmed or skimmed, soya milk or soya drink (plain). NOT FLAVOURED, SWEETENED OR MILKSHAKE
6) Can you see drinking milk? a) Yes b) No
Ask a member of staff if there is a vegetable or salad available now.
Yes No Go to Q6
Ask a member of staff if there is drinking milk available now.
Yes No Go to Q7
9 What is it? ________________________
10 Why wasn’t it visible? Tick all that apply
Being kept warm
Being kept cold
Only available on request to all pupils
Only available for certain pupils
11 What is it? ________________________
12 Why wasn’t it visible? Tick all that apply
Being kept warm
Being kept cold
Only available on request to all pupils
Only available for certain pupils

7) Other Milk and Dairy Foods Any yoghurt, fromage frais, flavoured milks and milk shakes, custard, cheese. Includes soya products. NOT PLAIN DRINKING MILK NOT BUTTER, EGGS, CREAM, ICE CREAM
7) Can you see at least 1 item from the milk and dairy foods group? a) Yes b) No
8) Fruit Include fresh fruit – apples, pears, oranges, bananas etc (whole or sliced) - and tinned or dried fruit, fruit salad. 100% fruit juice NOT JUICE DRINKS e.g. 5 Alive, Oasis, Ribena, squash (“high fruit juice” or any other squash)
8) Can you see at least 1 fruit option? a) Yes b) No What is it? (tick one or more boxes) 100% Juice Fruit salad Fresh fruit
Ask a member of staff if there is any fruit available now.
Yes No Go to Q9
Ask a member of staff if there is an item from the milk and dairy foods group available now. Yes No Go to Q8
13 What is it? ________________________
14 Why wasn’t it visible? Tick all that apply
Being kept warm
Being kept cold
Only available on request to all pupils
Only available for certain pupils
15 What is it? ________________________
16 Why wasn’t it visible? Tick all that apply
Being kept warm
Being kept cold
Only available on request to all pupils
Only available for certain pupils

Tinned fruit

9) Fruit based desserts
Include: fruit pie, fruit crumble, fruit sponge, banana split, jelly & fruit etc. NOT JAM TART/SPONGE, BAKEWELL TART, FRUIT SALAD, WHOLE/SLICED FRESH FRUIT, TINNED FRUIT, 100% FRUIT JUICE 9) Can you see a fruit based dessert? (Fruit-based desserts only have to be served twice a week so it may not be available.) a) Yes b) No
10) Drinking water – must be free of charge
10) Can you see drinking water?
a) Yes b) No
Ask a member of staff if there is a fruit based dessert available now.
Yes No Go to Q10
Ask a member of staff if there is drinking water available now.
Yes No
17 What is it? ________________________
18 Why wasn’t it visible? Tick all that apply
Being kept warm
Being kept cold
Only available on request to all pupils
Only available for certain pupils
19 What is it? ________________________
20 Why wasn’t it visible? Tick all that apply
Being kept warm
Being kept cold
Only available on request to all pupils
Only available for certain pupils

Visibility of food questionnaire 2 END OF SERVICE
Day: Mon Tues Wed Thurs Fri End of service
1) Red Meat Beef, lamb, pork, ham, bacon, gammon, mince, sausages (beef or pork), beef/ham burgers, cottage pie, meat lasagne, bolognaise sauce for pasta, etc. NOT CHICKEN OR TURKEY 1) Can you see a red meat-based dish? (Red meat only has to be served 2 times per week so it may not be available) a) Yes b) No
Ask a member of staff if there is a red meat-based dish available now.
Yes No Go to Q2
21 What is it? ________________________
22 Why wasn’t it visible? Tick all that apply
Being kept warm
Being kept cold
Only available on request to all pupils
Only available for certain pupils
Other reason specify:

2) Can you see a fish-based dish/item? (Fish only has to be served once a week so it may not be available) a) Yes b) No
3) Meat, Fish and Alternative sources of protein Meat: roast, chops, stews and casseroles, chicken burgers, chicken nuggets, turkey drummers, ham, sausages, beef burgers, mince etc. Fish: tuna, cod/haddock (with or without batter or breadcrumbs), fish fingers etc. Alternative: kidney beans, lentils, chickpeas, nuts, eggs, Quorn, tofu, soya/veggie mince, cheese. NOT MILK
3) Can you see at least 1 meat, fish or alternative sources of protein dish or item? a) Yes b) No
Ask a member of staff if there is a fish-based dish/item available now.
Yes No Go to Q3
Ask a member of staff if there is a protein food available now.
Yes No Go to Q4
23 What is it? ________________________
24 Why wasn’t it visible? Tick all that apply
Being kept warm
Being kept cold
Only available on request to all pupils
Only available for certain pupils
25 What is it? ________________________
26 Why wasn’t it visible? Tick all that apply
Being kept warm
Being kept cold
Only available on request to all pupils
Only available for certain pupils
2) Fish Fish fingers, fishcakes cod/haddock (with or without batter or breadcrumbs), tuna, sardines, mackerel, prawns, fish pie, fish bake, etc.


4) Starchy foods
Potatoes – boiled, mashed, roasted, wedges, jacket, chips, sweet potatoes, yams, waffles, croquettes, hash browns, fritters, sauté Rice – boiled white, boiled brown, risotto, pilau/pilaff, rice salad, fried rice, paella Pasta – white, wholewheat or tricoloured shells, macaroni, spaghetti, pasta bake, pasta salad, macaroni cheese, tinned spaghetti shapes in tomato sauce Bread – slices, rolls, sandwiches, filled rolls and baguettes, pitta bread, crispbread, scones, chapatis 4) Can you see at least 1 starchy food? a) Yes b) No Can you see any of these: Potatoes - chips, roast, sauté, potato wedges, croquettes, waffles, hash browns. Rice - fried rice. Yes No Can you see any of these: pasta/pasta salad, boiled rice/risotto/rice salad, bread, potatoes (boiled, mashed/creamed, jacket). Yes No
Ask a member of staff if there is a starchy food available now.
Yes No Go to Q5
27 What is it? ________________________
28 Why wasn’t it visible? Tick all that apply
Being kept warm
Being kept cold
Only available on request to all pupils
Only available for certain pupils
Other reason specify:

5) Vegetables or salad
Vegetables: include fresh, tinned or cooked from frozen. Include baked beans. NOT SPAGHETTI HOOPS. Salad: include mixed, green or plated salads, coleslaw, lettuce, tomato, cucumber, carrot NOT RICE OR PASTA SALADS
5) Can you see at least 1 vegetable or salad? a) Yes b) No
6) Plain Drinking Milk Plain milk – include whole/full-fat, semi-skimmed or skimmed, soya milk or soya drink (plain). NOT FLAVOURED, SWEETENED OR MILKSHAKE
6) Can you see drinking milk? a) Yes b) No
Ask a member of staff if there is a vegetable or salad available now.
Yes No Go to Q6
Ask a member of staff if there is drinking milk available now.
Yes No Go to Q7
29 What is it? ________________________
30 Why wasn’t it visible? Tick all that apply
Being kept warm
Being kept cold
Only available on request to all pupils
Only available for certain pupils
31 What is it? ________________________
32 Why wasn’t it visible? Tick all that apply
Being kept warm
Being kept cold
Only available on request to all pupils
Only available for certain pupils

7) Other Milk and Dairy Foods Any yoghurt, fromage frais, flavoured milks and milk shakes, custard, cheese. Includes soya products. NOT PLAIN DRINKING MILK NOT BUTTER, EGGS, CREAM, ICE CREAM
7) Can you see at least 1 item from the milk and dairy foods group? a) Yes b) No
8) Fruit Include fresh fruit – apples, pears, oranges, bananas etc (whole or sliced) - and tinned or dried fruit, fruit salad. 100% fruit juice NOT JUICE DRINKS e.g. 5 Alive, Oasis, Ribena, squash (“high fruit juice” or any other squash)
8) Can you see at least 1 fruit option? a) Yes b) No What is it? (tick one or more boxes) 100% Juice Fruit salad Fresh fruit
Ask a member of staff if there is any fruit available now.
Yes No Go to Q9
Ask a member of staff if there is an item from the milk and dairy foods group available now. Yes No Go to Q8
33 What is it? ________________________
34 Why wasn’t it visible? Tick all that apply
Being kept warm
Being kept cold
Only available on request to all pupils
Only available for certain pupils
35 What is it? ________________________
36 Why wasn’t it visible? Tick all that apply
Being kept warm
Being kept cold
Only available on request to all pupils
Only available for certain pupils

Tinned fruit

9) Fruit based desserts
Include: fruit pie, fruit crumble, fruit sponge, banana split, jelly & fruit etc. NOT JAM TART/SPONGE, BAKEWELL TART, FRUIT SALAD, WHOLE/SLICED FRESH FRUIT, TINNED FRUIT, 100% FRUIT JUICE 9) Can you see a fruit based dessert? (Fruit-based desserts only have to be served twice a week so it may not be available.) a) Yes b) No
10) Drinking water – must be free of charge
10) Can you see drinking water?
a) Yes b) No
Ask a member of staff if there is a fruit based dessert available now.
Yes No Go to Q10
Ask a member of staff if there is drinking water available now.
Yes No
37 What is it? ________________________
38 Why wasn’t it visible? Tick all that apply
Being kept warm
Being kept cold
Only available on request to all pupils
Only available for certain pupils
39 What is it? ________________________
40 Why wasn’t it visible? Tick all that apply
Being kept warm
Being kept cold
Only available on request to all pupils
Only available for certain pupils

Appendix A11 TRAY CHECK
PUPIL LABEL
Sex
(Please circle one number.)
ASK ALL PUPILS:
BOY GIRL Age
School Year (R-6) R 1 2 3 4 5 6
Teacher�s Name

ASK THE FOLLOWING TO PUPILS YEAR 3 AND ABOVE (aged 7 or
older):
2 How many days a week do you usually have a school lunch? (Please tick one box.)
127 128 129 130 131 132 133 134 135 136 137 13
3 Do you belong to any clubs or school teams that meet at lunchtime?
139 1 1 139 1139 1 3 139 1 4 139 1139 1 6 Go to13
4 140 How many days each week do you usually do this?
1 2 3 4 5
5 What do you usually do on these days, do you� (Please tick one)
140 1 2 eat your lunch as 140 1 3140 1 4 14
140 1 6 eat your lunch at a 140 1 7140 1 8 14
140 1 10 eat your lunch 140 1 1140 1 12 14
140 1 14 skip lunch 140 1 1140 1 16 14
eat less
141 or do something 142 143 14
6
146 At lunchtime, does a grown-up help you choose what to eat? (Tick one box)
147
Yes 148 149
No 150 151 152 15
7 Did you buy any snacks or drinks at school this morning?
Yes Go to Q8 No End Not available End
8 If yes,
What did you buy? (record type(s) of food purchased)
How much do you spend? (pence) P
1 Did you have any fruit or vegetables at school this morning? Yes No
If yes, what did you have?

FOOD/DRINK 2nd LO 2nd LO
BREAD (UNFILLED)
Burger � Beef/Ham White roll/French bread Burger � Cheese Brown roll
Burger � Chicken Sliced Bread (white) + spread Burger � Turkey Sliced Bread (brown) +spread
Fish fingers SANDWICH/WHITE
Shepherds Pie Filling:
Lamb Roast Filling: SANDWICH/BROWN/OTHER
Beef Roast Filling: FILLED ROLL WHITE
Roast Pork Filling: FILLED ROLL
Gravy Filling:
FRUIT
Plain boiled rice Apple Plain pasta Banana
Spaghetti hoops/shapes Orange
POTATOES DESSERTS
Boiled Apple crumble Chips Custard
Mash/Creamed Ice cream���������.
Roast Yogurt (flavoured)
Wedges Fruit salad Jacket
JACKET FILLINGS CONDIMENTS
Butter Ketchup Cheese DRINKS
Water
Squash���������
VEGETABLES/SALA
Baked Beans Fruit juice�������� Carrots Milk����������
Peas Sweetcorn
Coleslaw

Appendix A12
Major changes in school meals provision post 1980. 1980 The 1980 Education Act removed the obligation of Local Education Authorities (LA�s) to provide
school meals (except for children entitled to free school meals), sell meals at a fixed price, or meet any nutritional standards.
1983 A dietary survey of British school children was commissioned to assess the impact of the school meals provision of the Education Act (1980) on the diets of children.
1986 The Social Security Act (1986) restricted eligibility for free school meals to children of parents receiving Income Support only, removing over 400,000 children from eligibility. Those families receiving Family Credit received a small cash allowance instead.
1988 The Local Government Act (1988) introduced Compulsory Competitive Tendering (CCT), obliging all LA�s to put school meals services out to tender. The guiding principle was �lowest bid wins� and economy was the driving force within school meal provision. Local Authority providers who won contracts were defined as Direct Service Organisations (DSOs) and private sector companies entered the market.
1989 The findings from the survey commissioned in 1983 were published in The Diets of British Schoolchildren.r Three quarters of the children surveyed had a fat intake greater than 35% of energy; iron in girls was below the recommended intake as was calcium and riboflavin in older girls. School meals contributed between 34% and 58% of the children�s daily chip consumption and 32% to 60% of buns and pastries.
1992 The Caroline Walker Trust (CWT) convened an Expert Working Group on Nutritional Guidelines to formulate nutritional guidelines for school meals based on COMA 1991s recommendations.
1998 �Fair Funding� provisions came into force which meant funding for school meals was delegated to all secondary schools, creating school level decision-making about school meals. Primary schools were also given the right to control their own school meal budgets. In addition the principle of �Best Value� replaced CCT for public service procurement and as a result decisions about school meal provision were increasingly financially driven.
2001 Concern about the nature of school meal provision grew. In 2000 the NHS Plan announced the National School Fruit Scheme. National Nutritional Standards for school lunches were reintroduced in April 2001 but the format of these standards was very different to those previously adopted. They set standards for menu planning and the frequency of which certain foods groups should be available to children.
2003 The DfES and the FSA commissioned the secondary school meals survey.
2004
The DfES, the DH, the FSA and Department for Environment, Food and Rural Affairs (DEFRA) published the Healthy Living Blueprint for Schools.t Amongst its proposals there was a commitment to review the nutritional standards for school meals.
In July School Meals in Secondary Schools in England was published. In November DH published its public health white paper �Choosing Health� strengthening the intention to revise nutritional standards, considered introducing nutrient �based standards and extended new standards to cover food served across the school day. The DfES and the FSA commissioned the primary school meals survey.
r DH (1989) The Diets of British School Children. Report on Health and Social Subjects No 36 London: Her Majesty�s Stationery Office s Department of Health (1991). Dietary Reference Values for Food Energy and Nutrients for the United Kingdom. Report of the Panel on Dietary Reference Values of the Committee on Medical Aspects of Food Policy. Report on Health and Social Subjects 41. London: HMSO. t DfES (2004) Healthy Living Blueprint for Schools. London: DfES. Accessed from www.dfes.gov.uk

2005 DH published Delivering Choosing Health in March 2005. This provided more detail on commitments to bring to bear standards to school meals, guidance on food across the school day, extend training for catering staff, include school food within Ofsted inspections and set up an independent School Food Trust.
The Caroline Walker Trust published revised guidelines for school meals �Eating Well at School: Nutritional and Practical Guidelines�, based on COMA 1991s recommendations. The DfES announced a series of measures to improve food in schools and convened an expert panel (The School Meals Review Panel) to set new nutritional standards for school meals. The panel recommended adapting the CWT 2005 standards and a set of food based standards designed to maximise availability of healthier items like fruit and water, to remove access to those items high in fat, sugars and salt such as confectionery, crisps and high sugar fizzy drinks, and to limit the availability of fried foods.

Appendix A13
The 9 compulsory elements of the National Nutritional Standards for school lunches in primary schools
Element Food group Requirement 1 Starchy foods At least one item from this group must be
available every day 2 Starchy food cooked in oil or fat should not
be served more than three times a week 3 Vegetables and fruit A vegetable must be available every day 4 A fruit must be available every day 5 Fruit-based desserts must be available twice a
week 6 Milk and dairy foods At least one item from this group must be
available every day 7 Meat, fish and alternative
sources of protein At least one item from this group must be available every day
8 Red meat must be served at least twice a week
9 Fish must be served at least once a week

Appendix A14
Classification of foods into 19 food groups
Food group Foods included
1. Vegetables and salads
Carrots (raw); salad and other vegetables (raw); tomatoes (raw); peas (not raw); green beans (not raw); leafy green vegetables (not raw); carrots (not raw); tomatoes (not raw); other vegetables(not raw)
2. Pasta, rice, bread and other cereals
Pasta; rice; other cereals (eg Yorkshire pudding, cheese and onion pastie); white bread; wholemeal bread; other breads (eg garlic bread, brown bread, naan bread)
3. Desserts, cakes, biscuits, ice cream
Biscuits; fruit pies; buns, cakes & pastries; cereal based milk puddings; sponge puddings; other puddings (eg fruit crumble, angel delight (made with water), jelly, cheesecake)
4. Fruit Apples & pears not canned; citrus fruits not canned; bananas; canned fruit in juice; canned fruit in syrup; other fruit not canned
5. Milk & milk products
Whole milk; semi-skimmed milk; cream; other milk (eg milkshake, flavoured milk); cottage cheese; other cheese (eg cheddar, Dairylea); fromage frais; yogurt; other dairy desserts (eg mousse)
6. Higher fat main dishes
Pizza; coated chicken & turkey; liver products & dishes; burgers & kebabs; sausages; meat pies & pastries; white fish coated or fried including fish fingers
7. Potatoes not cooked in oil or fat
Other potatoes, potato salads & dishes (eg mashed/boiled/jacket potatoes, potato and cheese pie)
8. Water Tap water 9. Lower fat main
dishes Bacon & ham; beef, veal & dishes; lamb & dishes; pork & dishes; chicken & turkey dishes; other meat & meat products (eg corned beef hash, luncheon meat); other white fish & fish dishes (eg cod/plaice, fish pie); oily fish; vegetable dishes (not raw); soups
10. Soft drinks Concentrated soft drinks (not diet); carbonated soft drinks (not diet); ready to drink; soft drinks (not diet); carbonated soft drinks (diet); ready to drink soft drinks (diet)
11. Chips and other potatoes cooked in oil or fat
Chips, fried or roast potatoes & fried potato products; potato products not fried, with fat, grilled or oven baked (eg waffles, croquettes, hash browns)
12. Fruit juice Fruit juice 13. Baked beans Baked beans 14. Butter, margarine Butter; polyunsaturated margarine; soft margarine not polyunsaturated; reduced
fat spread polyunsaturated 15. Eggs and egg
dishes Eggs; egg dishes
16. Savoury snacks, nuts and seeds
Crisps and savoury snacks
17. Sugar, preserves, confectionary
Sugar; preserves; sweet spreads; sugar confectionery; chocolate confectionery
18. Sandwiches School sandwiches 19. Condiments Savoury sauces, pickles, gravies, condiments

Appendix A15
A worked example for the analysis of food provision
A school offers a total of 65 foods to pupils over a one week period. Food offered Food group allocation according to food type M Tu W Th F Total Roast chicken Lower fat main dishes Y Shepherds pie Lower fat main dishes Y Beef stew Lower fat main dishes Y Tomato pasta Pasta, rice, bread, other cereals Y Rice Pasta, rice, bread, other cereals Y Noodles Pasta, rice, bread, other cereals Y Pizza Higher fat main dishes Y Sausage roll Higher fat main dishes Y Burger Higher fat main dishes Y Chicken nuggets Higher fat main dishes Y Hash browns Chips and other potatoes cooked in oil or fat Y Chips Chips and other potatoes cooked in oil or fat Y Roast potatoes Chips and other potatoes cooked in oil or fat Y Jacket potato Potatoes not cooked in oil or fat Y Y Y Mashed potato Potatoes not cooked in oil or fat Y Y Sweetcorn Vegetables and salads Y Carrots Vegetables and salads Y Broccoli Vegetables and salads Y Green beans Vegetables and salads Y Lettuce Vegetables and salads Y Y Y Y Tomatoes Vegetables and salads Y Y Y Y Cucumber Vegetables and salads Y Y Y Shortbread Desserts, cakes, biscuits, ice cream Y Peach sponge Desserts, cakes, biscuits, ice cream Y Instant whip Desserts, cakes, biscuits, ice cream Y Chocolate muffin Desserts, cakes, biscuits, ice cream Y Ice cream Desserts, cakes, biscuits, ice cream Y Apples Fruit Y Y Y Y Y Bananas Fruit Y Y Grapes Fruit Y Y Orange Fruit Y Yoghurt Milk and milk products Y Y Y Milk Milk and milk products Y Y Y Flavoured milk Milk and milk products Y Orange squash Soft drinks Y Y Y Y Y Water Water Y Y Y Y Y No.foods* 15 12 14 10 14 65 No. food groups** 11 9 10 7 10 47
* Total number of food �offering events� (all days in all schools) in the study = 17 925
** Total number of food group �offering events� (all days in all schools) in the study = 7 896

Food group
No. of foods
offered
% of foods
offered
No. of food
groups offered
% of food
groups offered
Number of items per
food group
% % n Vegetables and salads 15 23 5 11 3 Desserts, cakes, biscuits, ice cream 5 8 5 11 1 Fruit 10 15 5 11 2 Milk and milk products 7 11 4 9 1.75 Pasta, rice, bread, other cereals 3 5 3 6 1 Sandwiches - - - - - Higher fat main dishes 4 6 4 9 1 Lower fat main dishes 3 5 3 6 1 Potatoes not cooked in oil or fat 5 8 5 11 1 Water 5 8 5 11 1 Soft Drinks 5 8 5 11 1 Chips and other potatoes cooked in oil or fat
3 5 3 6 1
Fruit juice - - - - - Baked beans - - - - - Butter, margarine - - - - - Eggs and egg dishes - - - - - Savoury snacks, nuts and seeds - - - - - Sugar, preserves, confectionery - - - - - Base 65 100 47 100 -

Appendix A16
Comparison of nutrient intakes with 2005 CWT guidelines 2005 CWT guidelines and percent of meals meeting the guideline for school meals as chosen and as eaten by 3 035 infant pupils in 151 primary schools in England. Infants (n=3 035)
as chosen as eaten %meeting guideline Nutrient per meal Mean SE Mean SE
CWT guideline as chosen as eaten
Energy (kcal) 469 2.80 387 2.83 489 71 57 Protein (g) 16.1 0.10 13.2 0.10 5.9 99 92 Non-starch polysaccharides (g) 4.1 0.03 3.2 0.03 3.9 50 30 Vitamin A (mcg) 245 5.96 186 4.97 160 41 31 Vitamin C (mg) 20 0.33 16 0.29 12 61 46 Folate (mcg) 51 0.44 40 0.41 40 63 43 Calcium (mg) 180 1.96 150 1.79 180 41 31 Iron (mg) 2.3 0.02 1.8 0.02 2.4 35 21 Sodium (mg) 699 6.07 593 5.80 353 14 25 Zinc (mg) 1.8 0.02 1.4 2.6 2.6 15 8 % energy from: Fat 35.2 0.17 35.3 0.19 <35 48 47 Saturated fatty acids 12.3 0.10 12.4 0.10 <11 45 45 Carbohydrate 50.5 0.16 50.3 0.19 >50 52 51 Non-milk extrinsic sugars 11.1 0.13 11.6 0.15 <11 54 53 2005 CWT guidelines and percent of meals meeting the guideline for school meals as chosen and as eaten by 4 023 junior pupils in 151 primary schools in England. Juniors (n=4 023)
as chosen as eaten %meeting guideline Nutrient per meal Mean SE Mean SE
CWT guideline as chosen as eaten
Energy (kcal) 506 2.61 440 2.73 557 69 57 Protein (g) 17.2 0.10 14.8 0.10 8.5 95 86 Non-starch polysaccharides (g) 4.4 0.03 3.6 0.03 4.5 43 30 Vitamin A (mcg) 241 4.76 196 4.10 200 35 28 Vitamin C (mg) 21 0.30 17 0.27 12 61 50 Folate (mcg) 55 0.41 46 0.40 60 36 24 Calcium (mg) 198 1.90 174 1.80 220 36 29 Iron (mg) 2.5 0.02 2.1 0.02 3.5 16 10 Sodium (mg) 757 5.69 667 5.64 588 36 47 Zinc (mg) 1.9 0.02 1.6 .01 2.8 14 9 % energy from: Fat 34.8 0.15 34.9 0.16 <35 48 47 Saturated fatty acids 12.2 0.08 12.3 0.08 <11 44 44 Carbohydrate 51.0 0.14 51.0 0.16 >50 53 52 Non-milk extrinsic sugars 11.4 0.11 12.0 0.12 <11 50 49

Appendix A17
Guidelines for good practice in writing specifications
A. Use CWT guidelines as local nutritional standards for school catering provision. This
leaves no ambiguity on the nutritional quality of the meals service required. These standards are measurable and specific.
B. Set a clear timetable/deadline by which the meals service should be meeting CWT
standards. C. Set out a clear pathway to help school caterers meet these standards. The pathway
should revolve around the inclusion of a suggested menu cycle. A 4 week cycle designed to meet CWT standards could be constructed using computer software to analyse menus and evaluate the nutrient content of meals against the standards. Menu cycle planning should additionally be based on knowledge of what school caterers could produce and what children enjoyed.
D. Menu Cycle accompanied by:
• Reference to development and usage of standard recipes which have been developed and evaluated to integrate healthy eating principles. (i.e. recipes sensitively developed to minimise saturated fat, sugar and salt but maximise starch/fruit/vegetable/fibre content).
• Standard portion sizes based on Government guidelines, but also designed to yield meals which meet CWT standards.
• Inclusion of target nutrient specifications for bought-in commodities (i.e. foods/manufactured products used by school caterers).
E. Include well defined monitoring procedures which focus on delivery of a
nutritionally sound service which provides and promotes healthier choices. These procedures should include:
• self monitoring by provider demonstrating that planned menus met CWT standards, and a programme of inspection of locations to check that menus planned on paper are delivered consistently on the plate
• sample tools to be used for monitoring • Monitoring and reporting schedule clearly set out • dialogue between providers and client (school or Local Authority) to discuss
monitoring results (regular meetings scheduled). F. Customer Consultation. Requirement to carry out a formal customer care survey in
each school at least once a year � complemented by a process to continually collect customer feedback. Recognition that forums like School Nutrition Action Groups play an important part of the whole school approach to healthy eating. Provider to actively work with schools within their individual forums to address whole school approaches.
G. Marketing School Meals. Specification should include some element stipulating
activity to market �healthier meals� and �healthier choices� to children. Specification could include a requirement for the contractor to develop a marketing strategy with objectives, timetable and activity plan. These plans should be informed by the results of the customer consultation exercise.

Copies of this publication can be obtained from:
DfES PublicationsP.O. Box 5050Sherwood ParkAnnesleyNottinghamNG15 0DJ
Tel: 0845 60 222 60Fax: 0845 60 333 60Minicom: 0845 60 555 60Oneline: www.dfespublications.gov.uk
© King’s College London
Produced by the Department for Education and Skills
ISBN 1 84478 738 9Ref No: RR753www.dfes.go.uk/research