School Finance, Equivalent Educational Expenditure, and ...
36
Syracuse University Syracuse University SURFACE SURFACE Center for Policy Research Maxwell School of Citizenship and Public Affairs 2004 School Finance, Equivalent Educational Expenditure, and Income School Finance, Equivalent Educational Expenditure, and Income Distribution: Equal Dollars or Equal Chances for Success? Distribution: Equal Dollars or Equal Chances for Success? Kathryn Wilson Kristina T. Lambright Syracuse University Timothy M. Smeeding Syracuse University Follow this and additional works at: https://surface.syr.edu/cpr Part of the Education Policy Commons Recommended Citation Recommended Citation Wilson, Kathryn; Lambright, Kristina T.; and Smeeding, Timothy M., "School Finance, Equivalent Educational Expenditure, and Income Distribution: Equal Dollars or Equal Chances for Success?" (2004). Center for Policy Research. 101. https://surface.syr.edu/cpr/101 This Working Paper is brought to you for free and open access by the Maxwell School of Citizenship and Public Affairs at SURFACE. It has been accepted for inclusion in Center for Policy Research by an authorized administrator of SURFACE. For more information, please contact [email protected].
Transcript of School Finance, Equivalent Educational Expenditure, and ...

Syracuse University Syracuse University
SURFACE SURFACE
Center for Policy Research Maxwell School of Citizenship and Public Affairs
2004
School Finance, Equivalent Educational Expenditure, and Income School Finance, Equivalent Educational Expenditure, and Income
Distribution: Equal Dollars or Equal Chances for Success? Distribution: Equal Dollars or Equal Chances for Success?
Kathryn Wilson
Kristina T. Lambright Syracuse University
Timothy M. Smeeding Syracuse University
Follow this and additional works at: https://surface.syr.edu/cpr
Part of the Education Policy Commons
Recommended Citation Recommended Citation Wilson, Kathryn; Lambright, Kristina T.; and Smeeding, Timothy M., "School Finance, Equivalent Educational Expenditure, and Income Distribution: Equal Dollars or Equal Chances for Success?" (2004). Center for Policy Research. 101. https://surface.syr.edu/cpr/101
This Working Paper is brought to you for free and open access by the Maxwell School of Citizenship and Public Affairs at SURFACE. It has been accepted for inclusion in Center for Policy Research by an authorized administrator of SURFACE. For more information, please contact [email protected].

ISSN: 1525-3066
Center for Policy Research Working Paper No. 62
SCHOOL FINANCE, EQUIVALENT
EDUCATIONAL EXPENDITURE AND INCOME DISTRIBUTION: EQUAL DOLLARS OR EQUAL CHANCES FOR SUCCESS?*
Kathryn Wilson, Kristina Lambright,
and Timothy M. Smeeding
Center for Policy Research Maxwell School of Citizenship and Public Affairs
Syracuse University 426 Eggers Hall
Syracuse, New York 13244-1020 (315) 443-3114 | Fax (315) 443-1081
e-mail: [email protected]
August 2004
$5.00
Up-to-date information about CPR’s research projects and other activities is available from our World Wide Web site at www-cpr.maxwell.syr.edu. All recent working papers and Policy Briefs can be read and/or printed from there as well.
CENTER FOR POLICY RESEARCH – Spring 2004
Timothy Smeeding, Director Professor of Economics & Public Administration
__________
Associate Directors
Margaret Austin Douglas Holtz-Eakin Associate Director, Professor of Economics
Budget and Administration Associate Director, Center for Policy Research
Douglas Wolf John Yinger Professor of Public Administration Professor of Economics and Public Administration
Associate Director, Aging Studies Program Associate Director, Metropolitan Studies Program
SENIOR RESEARCH ASSOCIATES
Dan Black............................................... Economics Stacy Dickert-Conlin............................... Economics William Duncombe ................. Public Administration Gary Engelhardt ....................................Economics Deborah Freund ....................Public Administration Madonna Harrington Meyer .....................Sociology Christine Himes........................................Sociology William C. Horrace .................................Economics Bernard Jump ........................Public Administration Duke Kao ...............................................Economics Eric Kingson ........................................ Social Work Thomas Kniesner ..................................Economics Jeff Kubik ...............................................Economics
Andrew London ....................................... Sociology Len Lopoo ..............................Public Administration Jerry Miner .............................................Economics John Moran ............................................Economics Jan Ondrich ........................................... Economics John Palmer ...........................Public Administration Lori Ploutz-Snyder .. Health and Physical Education Jeff Racine ............................................ Economics Grant Reeher.................................Political Science Stuart Rosenthal.....................................Economics Ross Rubinstein .....................Public Administration Michael Wasylenko................................ Economics Janet Wilmoth.......................................... Sociology
GRADUATE ASSOCIATES
Anna Amirkhanyan.................Public Administration Beth Ashby.............................................Economics Dana Balter ............................Public Administration Gabby Chapman....................................Economics Yong Chen .............................................Economics Christopher Cunningham .......................Economics Ana Dammert .........................................Economics Tae Ho Eom...........................Public Administration Val Episcopo ............................................Sociology Mike Eriksen ..........................................Economics Kate Farrar.............................Public Administration Garey Fuqua ..........................Public Administration Jose Galdo.............................................Economics Andrzej Grodner.....................................Economics Glenda Gross...........................................Sociology Anil Kumar .............................................Economics
Kristina Lambright ................. Public Administration Xiaoli Liang............................................ Economics Liqun Liu ............................................... Economics Joseph Marchand.................................. Economics Cristian Meghea ................................... Economics Desmond Nation.................... Public Administration Emily Pas ............................................. Economics Seth Richards .......................Public Administration Cynthia Searcy ......................Public Administration Claudia Smith ........................................Economics Sara Smits ..............................................Sociology Adriano Udani........................Public Administration Wen Wang.............................Public Administration Bo Zhao.................................................Economics Na Zhao...................................................Sociology
STAFF
Kelly Bogart ....................... Administrative Secretary Martha Bonney....... Publications/Events Coordinator Karen Cimilluca............. Librarian/Office Coordinator Kim Desmond ................... Administrative Secretary
Kati Foley .................... Administrative Assistant, LIS Kitty Nasto ..........................Administrative Secretary Candi Patterson.......................Computer Consultant Mary Santy .........................Administrative Secretary
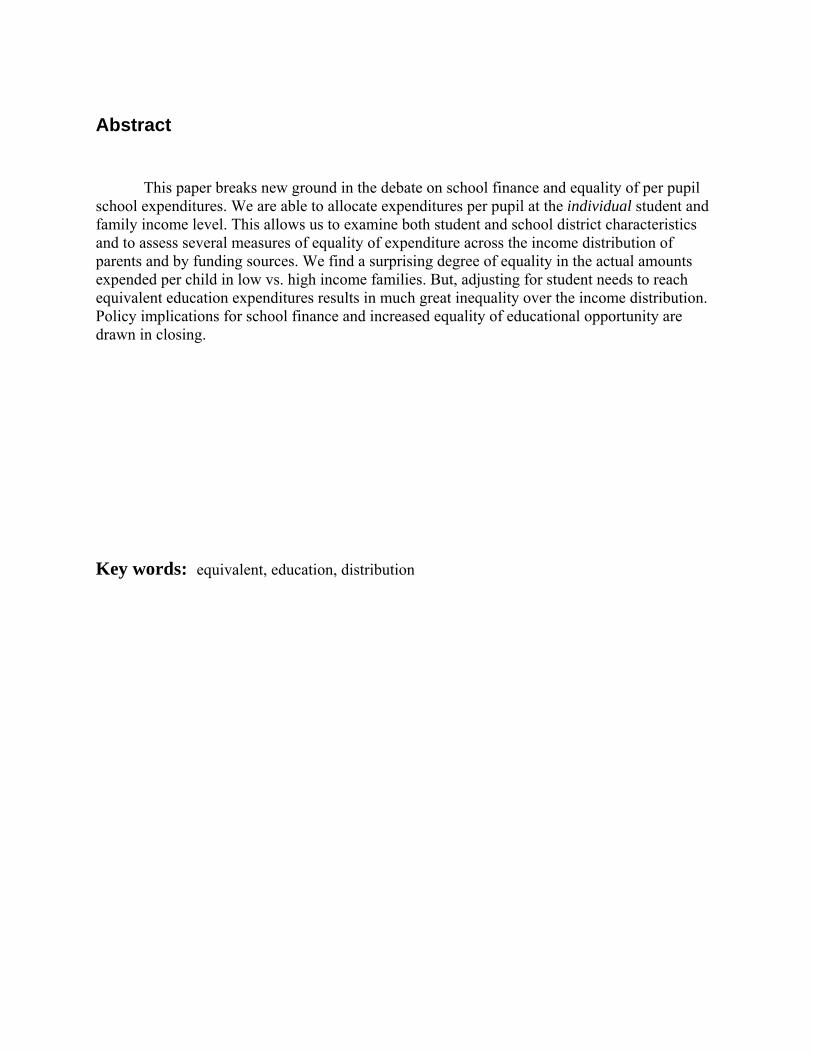
Abstract
This paper breaks new ground in the debate on school finance and equality of per pupil school expenditures. We are able to allocate expenditures per pupil at the individual student and family income level. This allows us to examine both student and school district characteristics and to assess several measures of equality of expenditure across the income distribution of parents and by funding sources. We find a surprising degree of equality in the actual amounts expended per child in low vs. high income families. But, adjusting for student needs to reach equivalent education expenditures results in much great inequality over the income distribution. Policy implications for school finance and increased equality of educational opportunity are drawn in closing.
Key words: equivalent, education, distribution
I. Introduction1
Debates about school finance and its effect on children’s educational performance have a
long and distinguished history in both economics and education policy. The 1983 National
Commission on Excellence in Education report “A Nation at Risk” which called for renewed
attention to the nation’s efforts to improve both schools and learning and Jonathan Kozol’s 1991
account of vast school inequities were amongst the first to attract popular attention to this cause.
In fact, this attention was warranted. Following legal and public action, a radical equalization of
school finances across districts within states was achieved in the 1990’s according to many
analysts (e.g., Corcoran, et al. 2002; Murray, Evans, and Schwab 1998; Evans, Murray, and
Schwab 1997).
The active debate about whether and how “input” based polices such as school
expenditures, class size, neighborhood influences, teacher quality, and parental inputs have
affected educational outcomes has not been resolved. Classic papers (e.g., Hanushek 1986; Card
and Kreuger 1992; Hanushek, Rivkin, and Taylor 1996) mix with newer findings and arguments
(e.g., Hanushek 2003; Houtenville and Conway 2003; Yinger 2004) to make the case that equal
spending does not produce equal outcomes. There is a multitude of evidence on both sides of the
debate over school inputs that finances do or do not matter (e.g., see Duncombe and Yinger
1997; Duncombe, Lukemeyer, and Yinger 2003 compared to Hanushek 2003). But we still do
not know how school finances interact with parental resources at the individual student level. Do
1 We thank the MacArthur Research Network on Families and the Economy, especially Nancy Folbre, for their support of this research. The authors are also in debt to William Duncombe, William Evans, Jay Chambers, Christopher Jencks, John Yinger, the members of the MacArthur Network on the Family, and the Center for Policy Research Seminar Series participants for helpful feedback on the first draft of the paper. Direct correspondence to Kathy Wilson at [email protected]. The authors assume full responsibility for all errors of omission and commission.
1
the children of poor adults attend under funded schools while the children of the upper class in
suburban districts attend schools with extraordinarily high expenditures per pupil? What does
and what doesn’t money buy in schooling once we control for student needs? And how do local,
state and federal funds intermingle to produce these outlays? This paper fills these gaps.
We believe that equality of opportunity in education, access to health care, income
poverty, and a range of other areas of social concern suggest that we need to do a better job of
equalizing “fiscal effort” in school finance (e.g., expenditure per unit of need) if we hope to have
equally productive or effective school spending. Other things may and do matter as well, but we
cannot afford to ignore the distribution of resources across students of differing needs and
backgrounds if we want to achieve equal chances for student success in terms of expected
student performance per dollar expended.2
Despite the growth of school spending, even with some large degree of equalization of
spending across school districts, the result has not always meant equalization of performance for
students. While spending has increased greatly in per student terms, it has only grown about 6
percent per decade faster than GDP (Gross Domestic Product) per capita since 1960. Given the
changing nature of rewards to greater educational performance over the past decades, this growth
in spending is modest.
But regardless of the level of spend and its adequacy, if the issue we are interested in is
equality of inputs per expected unit of output, then the measure of monetary input should be not
just equal fiscal effort (money expenditures per pupil), but equal effort relative to the measurable
heterogeneous needs of students (differences in what it takes to provide more equal productivity
of these expenditures across all children). 2. See Jencks (1988) for an unusually clear discussion of the vexing issue of equal educational opportunity.
2

The ‘public benefit’ case for equal funding per unit of need ― what we later call
“equivalent expenditures” ― has been forcefully made using recent evidence on educational
attainment and its relation to civic engagement, subsequent voter participation, support for free
speech and a host of other “civic capital” and “public benefit” measures (Dee 2002; Milligan,
Moretti, and Oreopoulos 2003; Lochner and Moretti 2001). Thus, on both equity and efficiency
grounds, it behooves us to see if in fact “equivalent expenditures per pupil” are equally
distributed across students in public schools.
In this paper, we begin not with the distribution of expenditures across school districts,
but rather with the distribution of expenditures per pupil across actual students according to their
family economic and social circumstances. We accomplish this by matching school expenditures
per pupil with children and their families using the Panel Study of Income Dynamics geo-coded
file and the Department of Education’s Common Core of Data school database (see also Wilson
2000). This allows us to not only look at school finance and its pattern by economic status of
parents, and demographics of the household, but to also look at the way that education
expenditures compare to family finances and the distribution of economic and social resources
across households. While studies at the school district level often can only use crude measures of
income, such as the percent of children in poverty or receiving free or reduced lunch, by using
the nationally-representative individual level data set of the PSID (Panel Study of Income
Dynamics), we are able to examine the inequality of school spending across the entire economic
spectrum as well as examining inequality for racial and other groupings across the entire income
spectrum.3
3 At the same time we are unable to measure differences in expenditures within school districts. For more on this topic see Corcoran and Evans 2004.
3

The paper, thus, provides three important contributions. First, it examines equivalent
expenditures that control for supply and demand factors affecting the productivity of school
spending. Second, it examines economic inequality and differences in inequality across
individuals using an individual-level data set that allows for comparisons across all income
levels and from specific locational and other perspectives. And finally it measures the effects of
various funding streams on equalization of spending—local revenue, state revenue and federal
revenue.
The paper begins with a brief literature review on school finance, output measures and
input measures adjusted for both costs and needs, to arrive at a measure of “equivalent
expenditures.” Next we explain the data and methodology for merging datasets in section III, and
our results are presented in the following sections. These are followed by a brief set of
conclusions and policy implications.
II. The Relevant Literature
The literature on school finance and its distribution has been recently surveyed by Corcoran
et al. (2004). Indeed, they find that after the early 1990s inequality in educational spending fell
by 20-30 percent measured nationally across school districts. Much of this reduction was the
result of legal actions by which court decisions mandated greater equality of expenditures and
more equalizing school revenue formulae (Lukemeyer 1999; Evans, Murray, and Schwab 1997;
Ladd, Chalk, and Hansen 1999). As Corcoran et al. (2004) and Yinger (2004), mention,
important differences still persist, but greater equality of public effort per pupil has been
achieved at the school district level.
4

Of course other types of influences on fiscal effort are also important, including fiscal
effort by local parent groups and by the federal government. The first of these takes the form of
school specific “foundations” by which parents add to school resources by donating tax
deductible funds to be used to complement what they see as inadequate school expenditures.
Until recently, very little was known about these funds and their distribution across schools or
pupils (Hoxby 1998). However, two recent papers conclude that the extent of voluntary fiscal
federalism via foundation spending in California is both small and limited to a few school
districts which are relatively smaller in size and therefore does not greatly reduce expenditure
equality (Brunner and Sonstelie 2003; Brunner and Imazeki 2003). Rather differences in outputs
of California schools can be traced to other factors such as teacher qualifications, neighborhood
effects and other education inputs (Phillips and Chen 2004).
A second type of effort is made by the federal government by means of special “Title I”
outlays which are designed to help school districts who have larger than average shares of low-
income students. These funds, while only about 2 percent of total spending nationwide, are
already reflected in the common core data we have, but they suggest that even when dollars are
equalized, needs of students may be unequal and that they ought to be accounted for.
The idea of adjusting expenditures or incomes for the needs of the recipients in order to
arrive at a measure of “equivalent income” or “effective spending” is not new in the public
finance literature. In fact, money measures of income and economic well-being are often
adjusted by measures of need. Examples of measures of need include the number of persons who
are to have their needs met by income, by age, region, or cost of living indexes. (e.g., see
Atkinson, Rainwater, and Smeeding 1995). These measures are called ‘equivalent income’
because they employ ‘equivalence scales’ which adjust money measures for economies of scale
5

and scope in household living arrangements, to arrive at a better measure of well-being than that
which are conveyed by unadjusted income alone. Further, the value of public expenditures for
health care is often separated by the age of the recipient, because the health care needs of persons
vary systematically by their age. For instance, health expenditures for elderly persons may vary
by a factor of four or more times compared to those for a young adult population due to the
greater health care needs of the aged or disabled (Smeeding and Freund 2002; Garfinkel,
Rainwater, and Smeeding 2004).
It follows that education expenditures also need to be adjusted for the student need and
for school heterogeneity if we are to assess the productivity of these expenditures (see Jencks
1988). The literature we follow takes two approaches to the issue of heterogeneous student
“needs”. First, one must account for environmental or "ecological" differences in spending as
they reflect differences in school characteristics such as size of school (economies of scale) and
prevailing patterns of school teacher wages and related costs. Following Chambers (1996) and
others (Rubenstein 2002), one needs to adjust school outlays for these differences in order to
reflect differential economic costs of providing education. Even then like others, we are unable
to adjust for such elements as school safety, quality of school capital, and other environmental
factors that are liable to affect school performance (Phillips and Chen 2004). And the actual
differences in parental resources per child: money, time and parenting skill, are also not reflected
in these expenditures.
A second more important issue is related to the individual needs of students of different
types. These include the special needs of disabled students, those who have English as a second
language, and those who come from low income families. Studies of this type often ask the
following question: is education funding adequate to achieve equal opportunities for
6
advancement for all students (Rubenstein 2002)? The finding in Rubenstein, and in many similar
studies, is that urban school districts need greater expenditure per pupil to make up for the
compound disadvantages that their students face (United States Government Accounting Office
2003; Duncombe 2002). The adjustors from these and many other studies that preceded them
(e.g., Duncombe and Yinger 1997; Yinger 2004; Downes and Pogue 1994; Reschovsky and
Imazeki 1998) are used later in the paper to adjust school spending for the needs of students.
Finally, one should be aware that while inputs are important, the drive to measure and
reward good educational outcomes, via the 2001 No Child Left Behind Act, and its state by state
equivalents may be independently affecting the educational results we observe. For instance,
high stakes testing may produce perverse results if, as Figlio and Getzler (2002) have found,
these systems lead schools and teachers to systematically exclude the poorest performing
students from the tests that measure such progress. Here low achieving students may be
systematically excluded from not only the tests, but also deemed unworthy of academic
progression to the next grade level and effectively left in the educational backwaters. If we are to
avoid such outcomes, both national and international evidence suggests that adequate financing
for good teachers can improve both school performance and equality of productive inputs (Fertig
and Schmidt 2002; Darling-Hammond and Sykes 2003; Jencks 1988).
III. Data and Methods
Studies examining the equality of school expenditures generally use school district-level
data (e.g., Murray, Evans, and Schwab 1998). This is driven by the fact that there is no nationally
representative individual level data set that includes adequate information about school
characteristics. However, we merge data from two separate sources, the PSID and the Common
Core of Data, in building a rich data set of individual, family, and school district measures.
7
The Merge
The PSID is a nationally representative longitudinal data set that began interviewing
families annually in 1967. For this paper, we use data from the 1998 wave of the PSID. The
PSID has a supplemental Geo-code file that allows census data to be merged with the family
information. While we do not use the census data explicitly, the location indicators in the Geo-
code file (zip code, FIPS county code, and census place) are used to merge the data with the
Common Core of Data. The sample includes all individuals ages 6 to 18, resulting in a sample
size of 4,831.
The Common Core of Data, published by the National Center for Education Statistics,
contains information on every school and school district in the United States. The financial
information on school districts includes the source of all revenues and expenditures, poverty
rates, the percent of limited English proficiency students, and the percent of students with
disability.
Because the Common Core of Data includes all schools in the United States, it is possible
to merge the school data with the PSID using the location information in the Geo-code file.
There are three possible ways for a match to be made. If there is only one school in the
individual’s zip code, then the district associated with that school is used. If there is no school in
the individual’s zip code, but there is only one school district in the individual’s county, then that
school district is used. If the student does not have a match based on these first two criteria, the
National Center for Education Statistics web site was used to make a match. The web site allows
searching for schools based on zip code and provides a list of the schools in or near that zip code,
the city the school is located in, and the number of miles the school is located from the zip code.
Using census place (city name) in the PSID Geo-code file, we were able to use this information
8

to identify the school district for the individual. In a minority of individuals in the sample, 1.5
percent, it was not possible to identify a single school district. For these individuals, the school
data is the average of the potential districts.
Adjusting for Needs to Reach “Equivalent Expenditures”
The methodology to be used involves adjusting district expenditures for factors that
impact the effectiveness of school spending, in essence creating an equivalence scale for
spending across districts in terms of cost differences and student need differences. Within the
context of an education production function, a dollar of spending in an urban school district with
many high need students and a high cost of living would be expected to be less productive in
producing education than a dollar of spending in a rural setting with few high need students and
a low cost of living. This difference in effectiveness reflects both the differences in costs (supply
side factors) and the differences in needs (demand side factors). These adjustments can be
interpreted as measuring how much would be spent per student (on average) if schools all faced
the same costs and had the same student body composition. The adjusted expenditures are
referred to as “equivalent education expenditures”, or (EEE).
Our purpose is to examine the equality of EEE on individual students as ranked by their
parental income. Differences in regional costs of providing education and differences in the
characteristics of the student body will result in the same level of resources in different districts
purchasing different amounts of educational input—or having differential productivity per dollar
spent. What we are measuring is the average expenditure per student adjusting for these different
costs and needs factors. For example, we adjust for the percent of high need students in the
district using estimates from the literature on how much extra actually is spent to educate high
need students. Therefore, the EEE numbers presented can be interpreted as how much is spent on
9

the average student in a school district given the amount of extra resources the district must
spend on high need students given its student body composition. However, EEE should not be
interpreted as “sufficient” expenditures, as our adjustments are for how much extra is actually
spent on high need students, rather than how much would have to be spent in order to give a high
need student the same opportunity to succeed as the average student.
In order to adjust for cost differences of various school inputs in different school districts,
we first adjust school spending using Chamber’s 1993-1994 geographic cost-of-education index
(GCEI) developed for the National Center on Educational Statistics (see Chambers 1996; 1997).
The purpose of the GCEI is to adjust for cost-of-living differences among different school
districts and variations in the desirability of different regions and school districts as places to
work and live. Chamber’s index is based on a hedonic wage model that captures the effect of
cost factors that local school district officials can control as well as cost factors that are beyond
the control of local school district officials. The advantage of Chamber’s index is that it is the
only comprehensive, national index of its kind. However, the index is not without problems.
Specifically, criticisms include that: (1) the data that this index is based on is out of date; (2) the
regression does not directly control for private wages, hence producing bias results; and (3) since
the regression only includes two variables that attempt to measure a district’s classroom
environment, most across-district variation in classroom environment is omitted from the model
(Yinger 2001).
We next adjust district spending based on student needs, using two different sets of
weights. Low weights are 1.2 for low-income students, 1.9 for special education students, and
1.1 for students with limited English proficiency; high weights are 2.0 for low-income students,
2.3 for special education students, and 1.9 for students with limited English proficiency. Each
10

weight represents the percentage increase in spending needed to educate children with these
extra needs. For example, a weight of 1.2 for low-income students means that per pupil spending
of $10,000 on low-income students is equivalent to per pupil spending of $8,333 ($10,000 ÷ 1.2)
on non low-income students. The range of weights we use are the same range of weights the
General Accounting Office has employed to adjust for student needs in a report on variations in
per-pupil spending between inner-city and suburban schools in seven different metropolitan
areas (United States General Accounting Office 2002). These weights are drawn from a review
of several studies on this phenomena (see Chaikind, Danielson, Brauen 1993; American
Institutes Research 2002; United States General Accounting Office 1998; Parrish 1994).
IV. Basic Results: Unadjusted Expenditures and EEE by Student
and Parental Characteristics School Expenditures by Family Income Level
Table 1 contains mean school district spending in 1998 by income to need level for the
student’s family for each of the expenditure measures.4 The first row presents unadjusted
expenditures, the actual dollars spent per student of $7,206. Although spending increases
monotonically across the income to needs ratio, the differences across income levels are within
10 percent. Those with income more than five times the poverty line have the highest school
spending ($7,636) and those with income below the poverty line have the lowest expenditures
($6,953). Unadjusted expenditures are virtually identical for those near poverty (income to needs
ratio of one to two) as those in poverty, and two to three percent higher for those with income to
4 All means are calculated using the PSID sample weights to correct for an oversampling of racial minority groups
and low-income whites. The weighted means are nationally representative.
11

needs of two to five. This equality is truly surprising for those whose priors suggest that “savage
inequalities” (Kozol 1991) manifest themselves in higher per pupil spending for “rich” children
as compared to those not so well off. The unadjusted numbers suggest that theses differences are
not very large.
The expenditure figures reflected in the unadjusted numbers of row 1 (Table 1) do not
take into consideration the fact that cost-of-living differences result in simple expenditures not
being comparable across locations. Row 2 presents school expenditures adjusting for Chamber’s
geographic cost-of-education index. These cost adjustments result in education expenditures
being even more equally distributed, implying students in higher income families live in higher
cost-of-education areas. For example, those with income to needs greater than five have
expenditures that are only 4.9 percent higher than those in poverty, compared to almost 10
percent unadjusted.
The final set of adjustments to school expenditures take into consideration the fact that
some students have higher needs and thus require more expenditures to provide an equivalent
level of education input in terms of the measured productivity of those expenses. As was
discussed earlier in the paper, prior studies have shown that low-income students, students with
disabilities, and students with limited English proficiency require more inputs.5 Rows 3 and 4 of
5 Appendix 1 shows the mean percent of students in the school district with these characteristics for each income to
needs category. Not surprisingly, individuals who are in low-income families have a higher percent of children in the district who are in poverty. However, even among individuals with income to needs greater than five, 11.6 percent of children in their district were living in poverty in 1998. Thus, equivalency expenditures will be lower for all income quintiles when high need students are taken into consideration, but the effect will be greatest for individuals in the lower income quintiles. The percent of children with special needs in the district (indicating they are on a IEP program), is fairly constant across income quintiles. Finally, the percent of limited English proficiency students is much higher in school districts attended by the lowest income quintile (14.1 percent) compared to those in the highest income quintile (5.8 percent). The difference in student body characteristics of poverty and limited English proficiency suggest that adjusting for student needs is important in getting an accurate picture of inequality in education spending.
12

Table 1 show expenditures that are adjusted for the percent of the school district that is in
poverty, the percent with special needs (on an IEP – Individual Education Plans – program), and
the percent with limited English proficiency to produce our measure of EEE. Inequality is much
larger once student needs are taken into account. Using the low range of student need weights,
students from the highest income to needs range attended schools with expenditures that are 10.3
percent higher than students living in poverty. Using the high range adjustment, the numbers rise
to 27.4 percent, or $1,213 more per student. The difference is not just between the highest
income and the lowest income; those with income to needs of two to three and three to five
spend 14 percent to 19 percent more than those in poverty, respectively. Calculating EEE for the
lowest income group shows that those in poverty receive 5.4 to 15.3 percent less than the average
student, rather than the 3.6 percent implied by the unadjusted expenditures.
We find that the effects for poverty and ESL (English as a Second Language) are much
larger than for disability. These results are consistent with recent findings that disability ratings
are somewhat subjective and therefore all school districts seem to have a quota of “disabled”
students. For instance, Cullen (2003) finds that fiscal incentives for state and federal funds for
disabled students can explain nearly 40 percent of the growth in student disability rates in the
state of Texas alone. In fact, there has been a recent increase in national school related disability
rates due to chronic limitations, despite a continued decline in disability rates by any other
measure in recent years (Federal Interagency Forum on Child and Family Statistics 2003).
School Expenditures by Race and Income Level
Table 2 disaggregates school expenditures by race with the third panel comparing
expenditures for whites to those for nonwhites of the same income level. While the unadjusted
mean expenditures for whites are very similar to non-whites, both in aggregate ($7,235
13

compared to $7,150) and across the income levels, the EEE measures are much higher for
whites. White children attend districts that spend 8 percent more per student than nonwhite
children when the low student need adjustments are made and 22 percent more when the high
need adjustments are made. The unadjusted expenditure numbers do not capture the true
difference in average expenditure by race.
The differences in race are seen across the income spectrum but nonwhite children in
low-income families particularly hard hit. For those children in poverty, white children attend
schools that spend 13 percent to 26 percent ($745 to $1,088) more per student than nonwhite
children. In contrast, nonwhite children with the greatest family income resources are able to
attend school districts with expenditures closer to, but still not equal, their white counterparts.
White children living in families with income greater than five times the poverty line spend 5
percent to 11 percent ($289 to $552) more than nonwhite children in the same income category.
The equivalent expenditures show that spending is not equal across racial groups, even when
income is controlled for. Thus, the effects of race are to compound the effects noted by income
differences alone (Table 1).
School Expenditures by Urbanization and Income Level
Students living in an urban area may attend schools with different cost of living and
different student body composition than students in the suburbs or rural areas. Expenditures in
cities or suburbs may be higher (or lower) for a number of cost and labor market related factors
(Darling-Hammond and Sykes 2003). Table 3 presents school expenditures by income needs and
by urban location. As with race, there is a large difference between the equity of expenditures
across urban areas using both unadjusted numbers and EEE.
14
Using unadjusted expenditures, it appears that wealthier individuals in the suburbs attend
schools with 8 to 11 percent higher expenditures than those in the city, while lower-income
suburban children attend schools with about 6 percent lower expenditures. The cost adjustments
have a rather small effect on the distribution, but the needs adjustments have a quite large effect.
EEE with the high student need adjustment are 18 percent more on average for students in the
suburbs than those in the city (the number is 6 percent using the low need adjustment). These
increased expenditures are experienced for individuals with higher family income while
suburban children in poverty attend schools with expenditure roughly equal to their city
counterparts. The pattern is different for individuals living in a small town or rural area.
Unadjusted expenditures are about 10 percent lower than for individuals in the city, and this
holds across the income distribution. However, much of this funding is the result of lower cost of
living in these rural areas. Controlling for cost of living, spending is actually slightly higher in
the rural areas. When cost adjustments are combined with the needs adjustments reflecting the
fact that urban schools are more likely to have high need students, the equivalent expenditure
premium experienced by rural children is 5 to 15 percent for low and high needs adjustment,
respectively. While suburban children in poverty had comparable expenditures to their urban
counterparts, low-income rural children fare much better than poor city children with
expenditures that are 9 to 23 percent higher.
In summary, while unadjusted education spending per student varies little by income
level, adjustments for costs, for student needs, and for race and location each produce larger
differences when viewed alone. These differences both compound (e.g., race and income) and
counteract (e.g., needs and rural area) one another to produce patterns of “equivalent”
15

educational expenditure (EEE) which differ by selected student and school district
characteristics.
V. Initial Results: Multivariate Analysis of Expenditure
The descriptive statistics presented indicate that school expenditures vary based on
income, race, and urbanization. The regression analysis presented in Table 4 allows all of these
factors to be examined jointly. The purpose is to isolate how the equality of school spending
varies by these major demographic characteristics.6 One of the contributions of the paper is to be
able to examine the entire income spectrum. Therefore, we first present the basic regression
results (Panel A) and then present a set of regressions that include interaction variables that allow
the coefficient estimates to vary by parental incomes (Panel B).
Basic Regression Results
Income is a statistically significant predictor of school expenditures across all the
specifications except the cost adjustment, but is rather small in magnitude. The income elasticity
of education is .009 using the low needs adjustment and .022 using the high needs adjustment.
This means that a 10 percent change in income is associated with a .09 to .22 percent change in
expenditures per pupil (or EEE).
For the regression analysis, race/ethnicity is broken down into black, Hispanic/Latino,
and other, with white as the reference category. The racial differences for Hispanic/Latino
individuals are striking in the regression results. Controlling for income and urbanization of
location the coefficient estimate for the Hispanic/Latino indicates equivalency spending of 19 6 This is in contrast to studies that are estimating the demand for education expenditures. While demand studies are interested in what factors affect a community’s demand for the public good, this study is interested in the distributional effects of these education choices made by local, state, and the federal government.
16

percent less than whites using the low estimate of student needs and 34 percent less using the
high estimate.7 Blacks also are in districts with lower EEE, even controlling for income, with a
coefficient estimate indicating spending of 6.6 percent (2.1 percent) less for the high (low) need
adjustments.
Finally, the basic regression results indicate that there are differences in expenditures,
even controlling for cost-of-education differences, student needs, and income based on the
location of the school district. With no adjustments, those living in the suburbs have virtually the
same spending as those in the city (the omitted category). However, once equivalent cost and
needs adjustments have been made, between 1.9 percent and 10.7 percent greater is spent per
student depending on whether the low or high weights for student needs are used. Conversely,
those in a town/rural area have a coefficient estimate of –0.132 when no adjustments are made,
but once cost and needs are adjusted for using the high need standard, have equivalent
expenditures that are 5.9 percent more than city schools. In other words, when cost and needs are
not adjusted for, the amount of expenditures for city schools is overstated compared to rural
schools and small towns.
Interaction Effects
In order to determine how the effects of race and urbanization vary across the income
distribution, several interaction variables are included in the basic regression. The coefficient
estimates on black and Latino remain very similar to the base regression, and the interaction term
7 A majority of the Hispanic/Latino individuals in the sample live in California so the regressions were also run with a dummy variable for California. The coefficient estimate on the Hispanic/Latino variable remains statistically significant, but is smaller in magnitude (17.9 percent and 4.7 percent for the high and low needs adjustment, respectively). From a policy perspective, it is not clear that the regression with the California variable is preferred. If we are trying to examine inequality as a nation, the fact that a large percent of a minority group live in a low spending state does not reduce the amount of inequality. This would be similar to saying there hasn’t been a historic difference in expenditures for blacks because blacks were more likely to live in the south where spending is lower. In both specifications, Latino students receive considerably less effective expenditures than whites or blacks.
17

is not significant. While children in these racial groups face lower equivalent expenditures per
student, the effect is the same for all income levels. The interaction term for other race/ethnicity
indicates that low-income “other” races are particularly hard hit with lower expenditures per
student relative to low-income whites.
The positive and significant coefficient estimate on the urbanization/income interaction
terms indicate that higher income individuals in the suburbs and rural areas have a greater level
of expenditures relative to high-income individuals in the city. In other words, low-income city
children have expenditures closer to low-income suburban/rural children compared to high-
income city children and high-income suburban/rural children. While low-income city children
are not as hard hit as one might expect, the coefficient estimate on the urbanization variables still
indicate that the city children have lower expenditure per student than those children in the
suburbs/rural area; it is just that the reduction in expenditures is larger for higher income city
children than for lower income city kids.
VI. Sources of Equalization
Our analyses suggest that unadjusted spending is fairly equal across income levels and
racial groups but EEE are not so equally distributed. In this section, we examine the sources of
revenue, whether local, state, or federal, to try to better understand what role both level and type
of government revenue has on the degree of inequality evident across the income distribution.
Table 5 presents the revenue per student from the various revenue sources. For ease in
exposition, the table is constructed using the average of the low and high needs adjustments for
each district. Thus, the base revenue values in the top row of Panel A are comparable to the
average of the third and fourth rows of EEE from Table 1. The pattern for total revenue follows
18

very closely that found for total expenditures in Table 1, both in terms of revenue per student by
family income and by race.
Local revenue is the primary source of variation in revenue. The average local revenue
per student is 47 percent higher than the revenue for students living in poverty, and students in
families with income more than five times the needs standard receive almost 88 percent more
local revenue per student than those in poverty. State revenue is comparable in size to local
revenue, but does very little to redistribute educational effort. The average state revenue is only
7.2 percent less than revenue for those in poverty, and those with income more than five times
the poverty line only receive 16 percent less state revenue than do children in poverty. While
state revenue does result in more equal revenue per student, it is a result of providing a virtual
lump-sum transfer to all students, which thus results in local revenue differences becoming
relatively smaller. Federal revenue is more progressive, with individuals in poverty receiving 28
percent more federal revenue than the average, but since federal revenue is so small relative to
total revenue (only 9 percent of revenue is from federal sources), it does little to affect the
distribution of revenue.
Panel B of Table 5 breaks the revenue data down by race. Whites receive more local
revenue than nonwhite children across the income spectrum, with the difference particularly well
pronounced between those with low income. Whites with income below the poverty line (or
incomes between one to two times the poverty line) have public schools that receive 32.4 percent
(and 56 percent) more local revenue, (respectively), than do low-income non-whites. In contrast,
federal revenue is greater for non-whites than for whites, both for the sample as a whole and
across the income spectrum. However, again, the dollar amounts for federal revenue are so much
19

smaller that it is not enough to offset local revenue differences. These findings are consistent
with those of Yinger (2004).
The lesson here is that while school finance equalization has had some effect on expenditure
patterns by student income level, these effects have not been strong enough to offset the
inequities inherent in local educational finance patterns.
VII. Conclusions, Research and Policy Issues
Many studies have examined the degree of inequality in school expenditures by school
district. This study is unique because it adjusts those expenditures for differences in costs of
education and student needs and it is done using a data set for individuals and families rather
than comparing school districts. Unadjusted school spending clearly understates the degree of
inequality in school spending effort, and the understatement comes more from student needs
factors than from district cost factors. In addition, there are large racial inequalities in school
spending that persist across the entire income spectrum. Both low-income and high-income
blacks and Hispanic/Latino individuals have lower EEE in their school districts than whites of
comparable income, although the differences are much higher for Hispanic/Latino students.
While state and federal revenues offset huge local revenue disparities and reduce the amount of
inequality, state funds are not progressive enough and federal funds are not large enough to
completely compensate for the local inequalities in which they face.
Policy implications of our findings are that equal dollars do not buy equally productive
inputs or equally effective educational expenditures. In fact, the extraordinary needs of children
less prepared for school or more difficult to educate need to be taken into greater account by
school funding formulae. Policies that incur higher costs to attract better teachers (pay
20

incentives, loan forgiveness) and to pay for better-prepared students (pre-schools, etc.) are a key
to reaching equality of academic opportunity for students who otherwise might struggle.
Spending proportionately higher local education dollars per student in low-income
districts vs. high income ones is probably not feasible. “Teibout” neighborhood selection
mechanisms, private parental spending, and other factors make this an impossible policy to
enforce or pursue.
These findings suggest that policies aimed at reducing the difference in student needs
such as school readiness preparation, early English as a Second Language (ELS) instruction, and
efforts to improve teacher quality in schools serving at-risk populations may be truly needed. For
instance, the Bush administration has proposed loan forgiveness up to $20,900 for teaching in
school districts with large numbers of poorly performing students or in schools with high teacher
turnover. However, the number of these loans is too low to make a real difference in outcome. A
similarly targeted effort of a larger scale is outlined in Darling-Hammond and Sykes (2003).
However, other federal efforts are less than helpful. The 2004 Federal Budget contains a
number of provisions to reduce pre-school spending and childcare assistance. When coupled
with the poor fiscal status of the states due to the recent recession, these cutbacks will produce
even larger gaps in school readiness across the income spectrum and thus produce an even larger
need gap for public school funding to fill.
Policies aimed at high stakes testing alone, such as the No Child Left Behind Act, are
liable to have perverse outcomes (e.g., Figlio and Getzler 2002) if students who are excluded
from tests as poor performers, are then labeled as “learning disabled” which means tracking them
into cycles of repeated grades and poor future academic performance.
21

In closing we argue that analysts need to place school spending data – equivalent
expenditures and unadjusted expenditures―into perspective. American children living in the
lowest quintile belong to families that had median resources in cash and near cash (e.g., food
stamps) of about $9,800 per child in 1997. In contrast, the median parent of children living in the
highest quintile had on average $50,100 per child to spend after taxes and government benefits
(Smeeding 2002). In the face of daunting differences such as these, the modest amounts we
spend on school finance (roughly $7,000 per pupil in 1997) cannot be expected to bring about
equality of opportunity in educational attainment for American children. Stronger measures are
needed.
22
References
American Institutes Research. 2002. “What Are We Spending on Special Education Services in the United States, 1999-2000?” Advance Report No. 1. (Updated 2004).
Atkinson, Anthony B., Lee Rainwater, and Timothy M. Smeeding. 1995. “Income Distribution
in OECD Countries: The Evidence from the Luxembourg Income Study (LIS). Social Policy Studies No.18. Paris: Organization for Economic Co-Operation and Development (OECD). October.
Brunner, Eric J., and Jennifer Imazeki. 2003. “Private Contributions and Public School
Resources.” Center for Public Economics Discussion Paper 07-03. San Diego, CA: San Diego State University.
Brunner, Eric J., and Jon Sonstelie. 2003. “School Finance Reform and Voluntary Fiscal
Federalism.” Journal of Public Economics 87(9-10) (September):2157-2185. Card, David, and Alan Krueger. 1992. “Does School Quality Matter? Returns to Education and
the Characteristics of Public Schools in the United States.” Journal of Political Economy 100(1):1-40.
Chaikind, Stephen, Louis C. Danielson, and Marsha L. Brauen. 1993. “What Do We Know
About the Costs of Special Education? A Selected Review.” The Journal of Special Education 26(4):344-370.
Chambers, Jay G. 1997. “A Technical Report on the Measurement of Geographic and
Inflationary Differences in Public School Costs.” Technical Report, Education and Public Finance Center, John C. Flanagan Research Center, American Institutes for Research.
Chambers, Jay G. 1996. “Public School Teacher Cost Differences across the United States:
Introduction to a Teacher Cost Index (TCI).” In William J. Fowler, Jr. (ed.), Developments in School Finance. Washington, DC: National Center for Education Statistics.
Corcoran, Sean, and William N. Evans. 2004. “Income Inequality, the Median Voter, and the
Support for Public Education.” Unpublished manuscript. Department of Economics. College Park, MD: University of Maryland. March.
Corcoran, Sean, William N. Evans, Jennifer Godwin, Sheila E. Murray, and Robert Schwab.
2004. “The Changing Distribution of Education Finance: 1972-1997.” Russell Sage Foundation. Project Reviews.
Cullen, Julie Berry. 2003. “The Impact of Fiscal Incentives on Student Disability Rates.”
Journal of Public Economics 87(7-8) (August):1557-1589.
23

Darling-Hammond, Linda, and Gary Sykes. 2003. “Wanted: A National Teacher Supply Policy for Education: The Right Way to Meet The “Highly Qualified Teacher” Challenge.” Education Policy Analysis Archives 11(33) (September).
Dee, Thomas S. 2002. “Are There Civic Returns to Education?” Unpublished manuscript.
Swarthmore College. Downes, Thomas A., and Thomas F. Pogue. 1994. “Adjusting School Aid Formulas for the
Higher Cost of Educating Disadvantaged Students.” National Tax Journal XLVII:89-110.
Duncombe, William. 2002. “Estimating the Cost of an Adequate Education in New York.”
Center for Policy Research Working Paper No. 44. The Maxwell School. Syracuse, NY: Syracuse University. http://cpr.maxwell.syr.edu/efap.
Duncombe, William and John Yinger. 1997. “Why Is It So Hard to Help Central City
Schools.” Journal of Policy Analysis and Management 16(1) (Winter):85-113. Duncombe, William, Anna Lukemeyer, and John Yinger. 2003. “Financing an Adequate
Education: A Case Study of New York.” In William J. Fowler, Jr. (ed.), Developments in School Finance: 2001-2002, Fiscal Proceedings from the Annual State Data Conferences of July 2001 and July 2002. Washington, DC: National Center for Education Statistics.
Evans, William N., Sheila E. Murray, and Robert Schwab. 1997. “School Houses, Court
Houses, and States Houses after Serrano.” Journal of Policy Analysis and Management 16 (January):10-31.
Federal Interagency Forum on Child and Family Statistics. 2003. “America’s Children: Key
National Indicators of Well-Being 2003. Washington, DC: Forum on Child and Family Statistics. (Figure H2, Page 27; and Table H2, page 99).
Fertig, Michael, and Christoph M. Schmidt. 2002. “The Role of Background Factors for
Reading Literacy: Straight National Scores in the PISA 2000 Study.” IZA Discussion Paper No. 545. Bonn, Germany: The Institute of Study and Labor.
Figlio, David N., and Lawrence S. Getzler. 2002. “Accountability and Disability: Gaming the System. NBER Working Paper No. 9307. Cambridge, MA: National Bureau of Economic Research. November.
Garfinkel, Irwin, Lee Rainwater, and Timothy M. Smeeding. 2004. “Welfare State
Expenditures and the Distribution of Child Opportunities.” Unpublished manuscript. Center for Policy Research. Syracuse, NY: Syracuse University. June
Hanushek, Eric A. 2003. “The Failure of Input-Based Schooling Policies.” Economic Journal
113(485)(February):F64-F98.
24

Hanushek, Eric A. 1986. “The Economics of Schooling: Production and Efficiency in Public Schools.” Journal of Economic Literature 49(3)(September):1141-77.
Hanushek, Eric A., Steven G. Rivkin, and Lori L. Taylor. 1996. “Aggregation and the
Estimated Effects of School Resources.” The Review of Economics and Statistics 78(4):611-627.
Houtenville, Andrew J., and Karen Smith Conway. 2003. “Parental Effort, School Resources,
and Student Achievement: Why Money May Not ‘Matter’.” Unpublished manuscript. School of Industrial and Labor Relations. Ithaca, NY: Cornell University. June.
Hoxby, Caroline M. 1998. “How Much Does School Spending Depend on Family Income? The
Historical Origins of the Current School Finance Dilemma.” The American Economic Review 88(2) (May):309-314.
Jencks, Christopher. 1988. “Whom Must We Treat Equally for Educational Opportunity to Be
Equal?” Ethics 98(April):518-533. Kozol, Jonathan. 1991. Savage Inequalities. New York, NY: Crown Publishing Group. Ladd, Helen F., Rosemary Chalk, and Janet S. Hansen. 1999. Equity and Adequacy in
Education Finance: Issues and Perspectives. Washington, DC: National Academy Press. Lochner, Lance, and Enrico Moretti. 2001. “The Effect of Education on Crime: Evidence from
Prison Inmates, Arrests and Self-Reports.” NBER Working Paper No. 8605. Cambridge, MA: National Bureau Economic Research. November.
Lukemeyer, Anna. 1999. “Education Finance Equity: Judicial Treatment of Key Issues and
Impact of That Treatment Reform.” Ph.D. dissertation. Syracuse, NY: Syracuse University.
Milligan, Kevin, Enrico Moretti, and Philip Oreopoulos. 2003. “Does Education Improve
Citizenship? Evidence from the U.S. and the U.K.” NBER Working Paper No. 9584. Cambridge, MA: National Bureau of Economic Research. March.
Murray, Sheila E., William N. Evans, and Robert M. Schwab. 1998. “Education-Finance
Reform and the Distribution of Education Resources.” American Economic Review 88(4):789-812.
National Commission on Excellence in Education. 1983. “‘A Nation at Risk’ A Report to the
Nation and the Secretary of Education.” Washington, DC: United States Department of Education.
Parrish, Thomas B. 1994. “A Cost Analysis of Alternative Instructional Models for Limited
English Proficient Students in California.” Journal of Education Finance 19(3) (Winter):256-278.
25

26
Phillips, Meredith and Tiffany Chen 2004. “School Inequality: What Do We Know?”
Unpublished manuscript. School of Public Policy and Social Research. Los Angeles, CA: UCLA.
Reschovsky, Andrew, and Jennifer Imazeki. 1998. “The Development of School Finance
Formulas to Guarantee the Provision of Adequate Education to Low-Income Students.” In William J. Fowler, Jr., (ed.), Developments in School Finance, 1997 (NCES 98-212). Washington, DC: U.S. Department of Education, National Center for Education Statistics.
Rubenstein, Ross. 2002. “Providing Adequate Educational Funding: A State by-State Analysis
of Expenditure Needs.” Public Budgeting and Finance (Winter):73-98. Smeeding, Timothy M. 2002. “No Child Left Behind?” Indicators 1(3):6-30. Smeeding, Timothy M., and Debbie Freund. 2002. “The Future Costs of Health Care in Aging
Societies: Is the Glass Half Full or Half Empty?” Unpublished manuscript, March. United States General Accounting Office. 2002. “School Finance: Per-pupil spending
Differences Between Selected Inner City and Suburban Schools varied by Metropolitan Area (GA)-03-234).” Washington, DC. Retrieved December 12, 2002, from the United States General Accounting Office website: http://www.gao.gov/new.items/d03234.pdf.
United States General Accounting Office. 1998. “School Finance: State and Federal Efforts to
Target Poor Students (GAO Report HEHS-98-36).” Washington, DC. http://www.gao.gov/archive/1998/he98036.pdf.
Wilson, Kathryn. 2000. “Using the PSID to Study the Effects of School Spending.”
Public Finance Review 28(5) (September):428-451. Yinger, John. 2004. Helping Children Left Behind: State Aid and the Pursuit of Education
Equity. Cambridge, MA: MIT Press. Yinger, John. 2001. “Fixing New York’s State Education Aid Dinosaur: A Proposal.” Center
for Policy Research Policy Brief No. 21. Syracuse, NY: Syracuse University.

Table 1: Measures of Educational Expenditure per Pupil by Income/Needs Ratios
Sample Income to Needs Ratio Expenditure Measure A Mean In poverty 1 to 2 2 to 3 3 to 5 >=5
Unadjusted per pupil district expenditures $7,206 $6,953 $6,969 $7,093 $7,187 $7,636Cost-adjusted per pupil district expenditures
$7,132 $6,966 $6,994 $7,178 $7,119 $7,308Low needs, cost adjusted equivalent expenditures (EEE) $6,197 $5,882 $5,992 $6,196 $6,234 $6,489High needs, cost adjusted equivalent expenditures (EEE)
$5,111 $4,432 $4,713
$5,056 $5,280 $5,645
Income to Needs Ratio (percent)
Expenditures as Percent of Expenditures for Those in Poverty Total In poverty 1 to 2 2 to 3 3 to 5 >=5 Unadjusted per pupil district expenditures 103.6 100.0 100.2 102.0 103.4 109.8
Cost-adjusted per pupil district expenditures 102.4 100.0 100.4 103.0 102.2 104.9Low needs, cost adjusted equivalent expenditures (EEE) 105.4 100.0 101.9 105.3 106.0 110.3 High needs, cost adjusted equivalent expenditures (EEE) 115.3 100.0 106.3 114.1 119.1 127.4
Source: Authors calculations for the Panel Study of Income Dynamics. A See text for definitions of expenditures
27

Table 2: Measures of Educational Expenditure per Pupil by Income/Needs Ratios and by Race
Sample Income to Needs Ratio Child is Not White Mean In poverty 1 to 2 2 to 3 3 to 5 >=5 Unadjusted per pupil district expenditures $7,150 $6,895 $7,115 $7,336 $7,285 $7,619Cost-adjusted per pupil district expenditures
$6,932 $6,888$6,807 $7,085 $7,034 $7,049Low needs, cost adjusted equivalent expenditures $5,890 $5,714 $5,804 $5,999 $6,104 $6,229High needs, cost adjusted equivalent expenditures $4,468 $4,186
$4,273 $4,513 $4,972 $5,148
Sample Income to Needs Ratio Child is White Mean In poverty 1 to 2 2 to 3 3 to 5 >=5 Unadjusted per pupil district expenditures $7,235 $7,151 $6,786 $6,993 $7,160 $7,638Cost-adjusted per pupil district expenditures
$7,235 $7,129$7,511 $7,216 $7,143 $7,337Low needs, cost adjusted equivalent expenditures $6,355 $6,459 $6,228 $6,277 $6,272 $6,518High needs, cost adjusted equivalent expenditures $5,441 $5,274
$5,268 $5,280 $5,368 $5,700
Sample Income to Needs Ratio (percent) White as Percent of those Nonwhite of Same Income Level Mean In poverty 1 to 2 2 to 3 3 to 5 >=5 Unadjusted per pupil district expenditures 101.2 103.7 95.4 95.3 98.3 100.2 Cost-adjusted per pupil district expenditures 104.4 110.3 103.5 101.9 101.6 104.1Low needs, cost adjusted equivalent expenditures 107.9 113.0 107.3 104.6 102.8 104.6 High needs, cost adjusted equivalent expenditures 121.8 126.0 123.3 117.0 108.0 110.7
28

Table 3: Measures of Educational Expenditure per Pupil by Income/Needs Ratios and by Location
Sample Income to Needs Ratio Lives in City Mean In poverty 1 to 2 2 to 3 3 to 5 >=5 Unadjusted per pupil district expenditures $7,244 $7,175 $7,316$7,438$7,058$7,235Cost-adjusted per pupil district expenditures $7,047 $6,969 $7,079$7,178$6,999$6,997Low needs, cost adjusted equivalent expenditures $5,988 $5,824 $5,985$6,115$5,965$6,085High needs, cost adjusted equivalent expenditures $4,628 $4,251 $4,504$4,754$4,757$4,986
Sample Income to Needs Ratio Lives in Suburb Mean In poverty 1 to 2 2 to 3 3 to 5 >=5 Unadjusted per pupil district expenditures $7,519 $6,691 $6,816$7,015$7,608$8,048Cost-adjusted per pupil district expenditures $7,126 $6,572 $6,652$6,805$7,191$7,472Low needs, cost adjusted equivalent expenditures $6,338 $5,658 $5,811$6,011$6,434$6,702High needs, cost adjusted equivalent expenditures $5,481 $4,278 $4,688$5,195$5,657$5,964
Sample Income to Needs Ratio Lives in Town or Rural Area Mean In poverty 1 to 2 2 to 3 3 to 5 >=5 Unadjusted per pupil district expenditures $6,564 $6,501 $6,377$6,682$6,496$6,721Cost-adjusted per pupil district expenditures $7,294 $7,407 $7,285$7,507$7,137$7,167Low needs, cost adjusted equivalent expenditures $6,314 $6,336 $6,267$6,472$6,197$6,302High needs, cost adjusted equivalent expenditures $5,301 $5,221 $5,237$5,352$5,228$5,449 Sample Income to Needs Ratio (percent) Suburb as Percent of City of Same Income Level Mean In poverty 1 to 2 2 to 3 3 to 5 >=5 Unadjusted per pupil district expenditures 103.8 93.3 93.2 94.3 107.8 111.2Cost-adjusted per pupil district expenditures 101.1 94.3 102.794.0 94.8 106.8Low needs, cost adjusted equivalent expenditures 105.8 97.2 97.1 98.3 107.9 110.1High needs, cost adjusted equivalent expenditures 118.4 100.6 104.1 109.3 118.9 119.6 Sample Income to Needs Ratio (percent) Town/Rural as Percent of City of Same Income Level Mean In poverty 1 to 2 2 to 3 3 to 5 >=5 Unadjusted per pupil district expenditures 90.6 90.6 87.2 89.8 92.0 92.9 Cost-adjusted per pupil district expenditures 103.5 106.3 102.0102.9 104.6 102.4Low needs, cost adjusted equivalency expenditures 105.4 108.8 104.7 105.8 103.9 103.6High needs, cost adjusted equivalency expenditures 114.5 122.8 116.3 112.6 109.9 109.3
29

30
Table 4: Multivariate Estimates of Various Measure of School Expenditures 1
Panel A: Base Expenditure Regression Results 2 Unadjusted Cost Adjustment Cost and Low Needs Cost and High Needs Coef. Est St. Err. Coef. Est St. Err. Coef. Est St. Err. Coef. Est St. Err. Intercept 1.959 0.008 1.955 0.007 1.800 0.007 1.570 0.008 Ln of Income/Needs 0.014 0.004
0.003 0.003 0.009 0.003 0.022 0.004 Dummy for Whether Child is black -0.013 0.008 -0.008 0.007 -0.021 0.007 -0.066 0.008 Dummy for Whether Child is latino -0.113 0.013 -0.157 0.012 -0.188 0.012 -0.340 0.013 Dummy for whether child is other race/ethnicity 0.015 0.016 -0.022 0.014 -0.034 0.014 -0.108 0.016 Dummy for whether child lives in suburb 0.001 0.008 -0.015 0.007 0.019 0.007 0.107 0.008 Dummy for whether child lives in town/rural
-0.132
0.008
0.002
0.007
0.009
0.007
0.059
0.008
Panel B: Interaction Expenditure Regression Results 2 Unadjusted Cost Adjustment Cost and Low Needs Cost and High Needs Coef. Est St. Err. Coef. Est St. Err. Coef. Est St. Err. Coef. Est St. Err. Intercept 1.971 0.011 1.970 0.010 1.816 0.010 1.594 0.011 Ln of Income/Needs -0.010 0.008 -0.019 0.007 -0.015 0.007
-0.007 0.008Dummy for Whether Child is black -0.003 0.011 -0.011 0.010 -0.023 0.010 -0.071 0.011 Dummy for Whether Child is latino -0.105 0.015 -0.153 0.014 -0.186 0.014 -0.379 0.015 Dummy for whether child is other race/ethnicity -0.033 0.024 -0.068 0.021 -0.094 0.022 -0.214 0.024 Dummy for whether child lives in suburb -0.056 0.011 -0.059 0.010 -0.026 0.010 0.056 0.011 Dummy for whether child lives in town/rural -0.163 0.011 -0.017 0.010 -0.013 0.010 0.031 0.011 Income * Dummy for Whether Child is black -0.012 0.009 0.002 0.008 0.001 0.008 0.000 0.009 Income * Dummy for Whether Child is latino 0.006 0.017 -0.005 0.016 0.002 0.016 0.031 0.017 Income * Dummy for whether child is other race/ethnicity 0.052 0.019 0.038 0.017 0.064 0.017 0.115 0.019 Income * Dummy for whether child lives in suburb 0.060 0.009 0.045 0.008 0.047 0.008 0.052 0.009 Income * Dummy for whether child lives in town/rural 0.045 0.010 0.027 0.009 0.031 0.009 0.035 0.010 Source: Authors calculations for the Panel Study of Income Dynamics. 1Note: Bold values are significant is sign. at 5 percent level; italicized values are sign. at 10 percent level 2Variables are as explained in text

31
Table 5: Measure of Revenue per Pupil by Source of Revenue, Income Level, and Race
Panel A: By Income to Needs Ratio Sample Income to Needs Ratio Source of Revenue Mean In poverty 1 to 2 2 to 3 3 to 5 >=5 total revenue $5,549 $5,061 $5,269 $5,492 $5,711 $5,893 local revenue $2,576 $1,752 $2,060 $2,447 $2,783 $3,292 state revenue $2,635 $2,838 $2,799 $2,671 $2,628 $2,374 federal revenue $339 $471 $410 $374 $300 $227 Percent Change from those In Poverty Total In poverty 1 to 2 2 to 3 3 to 5 >=5 total revenue 109.6 100.0 104.1 108.5 112.8 116.4 local revenue 147.0 100.0 117.6 139.7 158.8 187.9 state revenue 92.8 100.0 98.6 94.1 92.6 83.7 federal revenue 72.0 100.0 87.0 79.4 63.7 48.2 Panel B: By Race Sample Income to Needs Ratio Child is Not White Mean In poverty 1 to 2 2 to 3 3 to 5 >=5 total revenue $5,069 $4,863 $4,924 $5,148 $5,430 $5,491 local revenue $1,966 $1,633 $1,651 $2,121 $2,604 $2,791 state revenue $2,648 $2,744 $2,795 $2,508 $2,454 $2,403 federal revenue $456 $487 $477 $519 $371 $297 Sample Income to Needs Ratio Child is White Mean In poverty 1 to 2 2 to 3 3 to 5 >=5 total revenue $5,795 $5,739 $5,705 $5,634 $5,791 $5,938 local revenue $2,889 $2,162 $2,575 $2,582 $2,834 $3,348 state revenue $2,628 $3,162 $2,804 $2,738 $2,678 $2,371 federal revenue $278 $415 $326 $314 $279 $219 Sample Income to Needs Ratio White as Percent of those Nonwhite of Same Income Level Mean In poverty 1 to 2 2 to 3 3 to 5 >=5 total revenue 114.3 118.0 115.9 109.4 106.6 108.1 local revenue 146.9 132.4 156.0 121.7 108.8 120.0 state revenue 99.2 115.2 100.3 109.2 109.1 98.7 federal revenue 61.0 85.2 68.3 60.5 75.2 73.7 Source: Authors calculations Note: See text for explanation

Table 6: School Mean District Characteristics by Income/Needs Ratio
Sample Income to Needs Ratio Mean In Poverty 1 to 2 2 to 3 3 to 5 >= 5 Percent of District in Poverty 19.2 31.7 24.5 19.9 15.9 11.6 Percent of District Special Education 11.7 11.8 11.7 12.2 11.7 11.2 Percent of District Limited English Proficiency 9.4 15.3 13.9 9.7 6.4 5.8
32