SCHOOL FACTORS EXPLAINING STUDENT ACHIEVEMENT
33
1 SCHOOL FACTORS EXPLAINING STUDENT ACHIEVEMENT: TESTING THE DYNAMIC MODEL OF EDUCATIONAL EFFECTIVENESS B.P.M. CREEMERS 1 & L. KYRIAKIDES 2 Faculty of Behavioural and Social Sciences, University of Groningen, The Netherlands 1 Department of Education, University of Cyprus, Cyprus 2 ABSTRACT This paper presents results of a longitudinal study in which 50 schools, 108 classes and 2369 Cypriot pupils participated. The study provides evidence about the validity of the dynamic model which: a) is multilevel in nature, b) is based on the assumption that the relation of some factors with achievement may be curvilinear, and c) defines relations among the effectiveness factors. Each factor is measured by taking into account five dimensions: frequency, focus, stage, quality and differentiation. The paper refers to the methods used to test the model at the school level by measuring school effectiveness in mathematics, language, and religious education. The findings of the study are presented. Implications for the development of the dynamic model are drawn. INTRODUCTION The most important criticism of Educational Effectiveness Research (EER) is that there is a shortage of rational models from which researchers can build theory. The problem is aggravated by infrequent use of whatever models exist (Bosker & Scheerens, 1994). In this context, a dynamic model of EER has recently been developed (Creemers & Kyriakides, 2007). The essential characteristics of the proposed dynamic model are as follows. First, the model belongs to the integrated approach to educational effectiveness modeling (Scheerens & Bosker, 1997) since it refers to multiple factors of effectiveness which operate at different levels. It is, therefore, multi-level in nature. Second, it is expected that some factors at the same level are related to each other. It is, therefore, considered important to specify groupings of factors. Third, although there are different factors and grouping of factors, it is assumed that each factor can be defined and measured using five dimensions: frequency, focus, stage, quality, and differentiation. This is a way to consider each factor as a multidimensional construct and at the same time to be in line with the parsimonious nature of the model. Finally, the
Transcript of SCHOOL FACTORS EXPLAINING STUDENT ACHIEVEMENT
1
SCHOOL FACTORS EXPLAINING STUDENT ACHIEVEMENT: TESTING THE DYNAMIC MODEL OF EDUCATIONAL EFFECTIVENESS
B.P.M. CREEMERS 1 & L. KYRIAKIDES 2 Faculty of Behavioural and Social Sciences, University of Groningen, The Netherlands 1
Department of Education, University of Cyprus, Cyprus 2
ABSTRACT
This paper presents results of a longitudinal study in which 50 schools, 108 classes and 2369 Cypriot
pupils participated. The study provides evidence about the validity of the dynamic model which: a) is
multilevel in nature, b) is based on the assumption that the relation of some factors with achievement
may be curvilinear, and c) defines relations among the effectiveness factors. Each factor is measured
by taking into account five dimensions: frequency, focus, stage, quality and differentiation. The paper
refers to the methods used to test the model at the school level by measuring school effectiveness in
mathematics, language, and religious education. The findings of the study are presented. Implications
for the development of the dynamic model are drawn.
INTRODUCTION
The most important criticism of Educational Effectiveness Research (EER) is that there is a shortage
of rational models from which researchers can build theory. The problem is aggravated by infrequent
use of whatever models exist (Bosker & Scheerens, 1994). In this context, a dynamic model of EER
has recently been developed (Creemers & Kyriakides, 2007). The essential characteristics of the
proposed dynamic model are as follows. First, the model belongs to the integrated approach to
educational effectiveness modeling (Scheerens & Bosker, 1997) since it refers to multiple factors of
effectiveness which operate at different levels. It is, therefore, multi-level in nature. Second, it is
expected that some factors at the same level are related to each other. It is, therefore, considered
important to specify groupings of factors. Third, although there are different factors and grouping of
factors, it is assumed that each factor can be defined and measured using five dimensions: frequency,
focus, stage, quality, and differentiation. This is a way to consider each factor as a multidimensional
construct and at the same time to be in line with the parsimonious nature of the model. Finally, the
2
model is designed in a way that takes into account the possibility that a non-linear relationship
between some factors and the outcomes may exist. This refers to the possibility of searching for
optimal values of the various dimensions of the factors and optimal combinations between factors.
A criticism that may arise from the theoretical background and the outline of the dynamic
model concerns the complexity of the model and the difficulties of testing the model empirically. For
example, it can be claimed that the model is not parsimonious since it contains more factors and more
dimensions than previous models and it is therefore not possible to illustrate priorities for educational
improvement. Moreover, the inclusion of different dimensions for measuring each factor complicates
the data collection and the analysis. However, the results of the first phase of a longitudinal study
investigating the validity of the model at the classroom level reveal that the dynamic model is a
theoretical model that can be put into testing (Kyriakides & Creemers, 2006). Moreover, the results of
this study provided support for the construct validity of the five measurement dimensions of most
effectiveness factors at the classroom level. This might reveal a weakness of previous effectiveness
studies focused on classroom level which usually treated frequency as the only measurement
dimension of effectiveness factors. Furthermore, this study revealed the added value of using five
dimensions to measure the classroom level factors for explaining variation of student achievement
gains in different outcomes. Testing the validity of the model at the classroom level can be seen as the
starting point for the development and the testing of the dynamic model at the school and the system
levels. The second phase of this longitudinal study attempts to provide empirical evidence of the
model at the school level. Thus, this paper refers to the school level factors of the dynamic model and
presents the main results of the second phase of the longitudinal study investigating the validity of the
dynamic model.
THE DYNAMIC MODEL: FACTORS OPERATING AT THE SCHOOL LEVEL
The definition of the school level is based on the assumption that factors at the school level are
expected to have not only direct effects on student achievement but also mainly indirect effects.
School factors are expected to influence classroom-level factors, especially the teaching practice. This
assumption is based on the fact that EER studies show that the classroom level is more significant
3
than the school and the system level (e.g., Kyriakides et al., 2000; Teddlie & Reynolds, 2000; Yair,
1997) and that defining factors at the classroom level is seen as a prerequisite for defining the school
and the system level (Creemers, 1994). Therefore, the dynamic model refers to factors at the school
level which are related to the same key concepts of quantity of teaching, provision of learning
opportunities, and quality of teaching which were used to define classroom-level factors (see
Creemers & Kyriakides, 2006). Specifically, emphasis is given to the following two main aspects of
the school policy which affect learning at both the level of teachers and students: a) school policy for
teaching and b) school policy for creating a learning environment at school. Guidelines are seen as
one of the main indications of school policy and this is reflected in the way each school level factor is
defined (see Creemers & Kyriakides, 2007). However, in using the term guidelines we refer to a range
of documents, such as staff meeting minutes, announcements, and action plans, which make the
policy of the school more concrete to the teachers and other stakeholders. It should also be
acknowledged that this factor does not imply that each school should simply develop formal
documents to install the policy. The factors concerned with the school policy mainly refer to the
actions taken by the school to help teachers and other stakeholders have a clear understanding of what
is expected from them to do. Support offered to teachers and other stakeholders to implement the
school policy is also an aspect of these two overarching factors. The term policy is also used in a
same way to describe a relevant overarching factor at the context level concerned with the
national/regional educational policy (see Creemers & Kyriakides, 2007).
Based on the assumption that the essence of a successful organization in the modern world is the
search for improvement (Barber, 1986; Kyriakides & Campbell, 2004), we also examine the
processes and the activities which take place in the school in order to improve the teaching practice
and its learning environment. For this reason, the processes which are used to evaluate the school
policy for teaching and the learning environment of the school are investigated. Thus, the following
four overarching factors at the school level are included in the model:
a. school policy for teaching and actions taken for improving teaching practice,
b. evaluation of school policy for teaching and of actions taken to improve teaching,
4
c. policy for creating a school learning environment and actions taken for improving the school
learning environment, and
d. evaluation of the school learning environment
It is important to note that leadership is not considered as a school-level factor. This can be attributed
to the fact that three current meta-analyses of studies investigating the impact of the principal’s
leadership on student achievement confirm earlier research findings on the limitations of the direct
effects approach to linking leadership with student achievement (Creemers, Kyriakides, Antoniou, &
Demetriou, 2007; Scheerens, Seidel, Witziers, Hendriks, & Doornekamp, 2005?; Witziers, Bosker, &
Kruger, 2003). Similar results are obtained from the few studies which were conducted in order to
measure indirect effects of leadership on student achievement (Leithwood & Jantzi, 2006). Therefore,
the model is not concerned with who is in charge of designing and/or implementing the school policy
but with the content of the school policy and the type of activities that take place in school. This
reveals one of the major assumptions of the model which is not focused on individuals as such but on
the effects of the actions which take place at classroom/school/context levels. This holds for the
students, teachers, principals and policy makers. Our decision is also consistent with the way
classroom level factors are measured since instead of measuring the teaching style of the teacher, we
are focused on the actual behavior of teacher in the classroom. Similarly, instead of measuring the
leadership style of a principle we look at the impact of the end result of leadership (e.g., the
development of school policy on teaching or the evaluation of school policy). As far as the context
level factors are concerned, the dynamic model does not refer to the leadership style of policy makers
or to the use of specific approaches in administering the system but it refers to the content of the
national policy which reveals the end result of the activities that policy makers undertake. A brief
description of each overarching school factor of the dynamic model is provided below.
A) School policy for teaching and actions taken for improving teaching
Since the definition of the dynamic model at the classroom level refers to factors related to the key
concepts of quality, time on task, and opportunity to learn, the proposed model attempts to investigate

5
aspects of school policy for teaching associated with quantity of teaching, provision of learning
opportunities, and quality of teaching (Creemers & Kyriakides, 2007). Actions taken for improving
the above three aspects of teaching practice, such as the provision of support to teachers for
improving their generic teaching sills, are also taken into account. More specifically, the following
aspects of school policy on quantity of teaching are taken into account:
• school policy on the management of teaching time (e.g., lessons start on time and finish on
time; there are no interruptions of lessons for staff meetings and/or for preparation of school
festivals and other events),
• policy on student and teacher absenteeism,
• policy on homework, and
• policy on lesson schedule and timetable.
School policy on provision of learning opportunities is measured by looking at the extent to which the
school has a mission concerning the provision of learning opportunities which is reflected in its policy
on curriculum. We also examine school policy on long-term and short-term planning and school
policy on providing support to students with special needs. Furthermore, the extent to which the
school attempts to make good use of school trips and other extra-curricular activities for
teaching/learning purposes is investigated. Finally, school policy on the quality of teaching is seen as
closely related to the eight classroom-level factors of the dynamic model, which refer to the
instructional role of teachers.
Therefore, the way school policy for teaching is examined reveals that effective schools are
expected to make decisions on maximizing the use of teaching time and the learning opportunities
offered to their students. In addition, effective schools are expected to support their teachers in their
attempt to help students learn by using effective teaching practices, as these are defined by the
classroom-level factors of the model. In this context, the definition of the first overarching school-
level factor is such that we can identify the extent to which: a) the school makes sure that teaching
time is offered to students, b) learning opportunities beyond those offered by the official curricula are
6
offered to the students, and c) the school attempts to improve the quality of teaching practice.
Therefore, we measure the impact of the school on the three major constructs of effectiveness
research concerned with time on task, opportunity to learn, and quality of teaching.
B) Evaluation of school policy for teaching and of actions taken to improve teaching
Creemers (1994) claims that control is one of the major principles operating in generating educational
effectiveness. This implies that goal attainment and the school climate should be evaluated. Since
studies investigating the validity of the model provided empirical support for the importance of this
principle (e.g., de Jong et al., 2004; Kyriakides et al., 2000; Kyriakides, 2005), it was decided to treat
evaluation of policy for teaching and of other actions taken to improve teaching practice as an
overarching factor operating at school level. Thus, the measurement dimensions of this factor are
briefly described below.
Frequency: First, frequency is measured by investigating how many times during the school
year the school collects evaluation data concerning its own policy for teaching and the actions taken
for improving teaching. Emphasis is also given to the sources of evaluation data which are used. This
is attributed to the fact that studies on school evaluation reveal that evaluators should employ a
multidimensional approach in collecting data on school and teacher effectiveness (e.g., Danielson &
McGreal, 2000; Johnson, 1997; Kyriakides & Campbell, 2004; Nevo, 1995), as comparisons of
various sources might increase the internal validity of the evaluation system (Cronbach, 1990).
Moreover, the involvement of all constituencies in the evaluation process may foster participatory
policies that result in less stakeholder criticism of the evaluation system (Patton, 1991; van den Berg,
& Ros, 1999). This argument is also in line with the fact that EER revealed that multisource
assessments that tap the collective wisdom of supervisors, peers, students, parents, and others provide
the opportunity to more effectively improve teaching and document its quality (Wilkerson, Manatt,
Rogers, & Maughan, 2000). Thus, these two indicators of the frequency dimension help us identify
the extent to which a systematic evaluation of school policy for teaching and of actions taken to
improve teaching takes place.

7
Focus: The focus dimension refers to the aspects of the school policy for teaching which are
evaluated. Evaluation of school policy for teaching could refer to the properties of the school policy
(e.g., clear, concrete, in line with the literature), its relevance to the problems which teachers and
students have to face, and its impact on school practice and student outcomes (Kyriakides et al.,
2006). It also is examined whether each school evaluates not only the content of the policy for
teaching and of the actions taken to improve teaching practice but also the abilities of people who are
expected to implement the policy. Moreover, the specificity aspect of the focus dimension is
measured by looking at the extent to which information gathered from the evaluation is too specific
(e.g., teacher X cannot do this) or too general (teachers are not able to teach effectively). The relation
between student outcomes and specificity of evaluation is expected to be curvilinear. Research on
school self-evaluation reveals that data collected should not be too specific and apportion blame to
any individual for the fact that the school is not particularly effective; such an approach serves the
summative purpose of evaluation and does not help the schools to take decisions on how to improve
their policy (e.g., Fitz-Gibbon, 1996; Hopkins, 1989; Patton, 1991; Visscher & Coe, 2002). At the
same time, information gathered from evaluation should not be too general but should be focused on
how to influence decision-making, especially the process of allocating responsibilities to school
partners in order to introduce a plan for improving the effectiveness of their school (Kyriakides &
Campbell, 2004; Macbeath, 1999; Meuret & Morlaix, 2003). Finally, focus is examined by
investigating the purposes for which the evaluation data are collected, especially whether evaluation
is conducted for formative or summative reasons (Black & Wiliam, 1998). Studies on EER reveal that
effective schools are those which use evaluation data for formative reasons (e.g., Harlen & James,
1997; Kyriakides, 2005; Scheerens & Bosker, 1997; Teddlie & Reynolds, 2000; Worthen, Sanders, &
Fitzpatrick, 1997).
Stage: The stage dimension of this factor is examined by looking at the period in which
evaluation data are collected. Schools could either conduct evaluation at the end of certain periods
(e.g., end of semester) or establish evaluation mechanisms which operate on a continuous basis during
the whole school year. The dynamic model is based on the assumption that a continuous model of
school evaluation is needed in order to allow schools to adopt their policy decisions on the needs of
8
different groups of school stakeholders (Hopkins, 2001; Jordan, 1977; Kyriakides, 2004). This
assumption is also in line with the main principles upon which the comprehensive model of
educational effectiveness is based (Creemers, 1994). We also expect the schools to review their own
evaluation mechanisms and adapt them in order to collect appropriate and useful data (see also
Cousins & Earl, 1992; Torres & Preskill, 2001; Preskill et al., 2003; Thomas, 2001).
Quality: Quality is measured by looking at the psychometric properties of the instruments
(i.e., reliable, valid, useful) used to collect data on school policy of teaching and actions taken to
improve teaching (Cronbach, 1990; Kane, 2001). We emphasize here that validity is a critically
important issue, and for this reason, we discuss below how schools could deal with this important
element of their evaluation policy in order to increase their effectiveness. The term “validity” denotes
the scientific utility of a measuring instrument, broadly statable in terms of how well it measures what
it purports to measure (Nunnally & Bernstein, 1994). Therefore, the quality of the evaluation factor is
measured by specifying how well each evaluation instrument meets the standards by which it is
judged. However, contemporary discussion of validity emphasizes two important precepts that are
relatively recent in the evolution of validity theory. First, Madaus and Pullin (1991) argue that
evaluation instruments do not have universal validity; they are valid only for specific purposes.
Moreover, Sax (1997) claims that validity is defined as the extent to which measurements are useful
in making decisions and providing explanations relevant to a given purpose. To the extent that
measurements fail to improve effective decision-making by providing misleading or irrelevant
information, they are invalid. No matter how reliable they are, measurements lack utility if they are
not valid for some desired purpose. In this context, we argue that more emphasis should be given to
the interpretive validity of the instruments rather than to their traditional forms of validity, such as the
construct and content validity of the instruments. The interpretation should be validated and not the
test or the test score. Thus, the measurement of the quality of this factor is expected to include an
evaluation of the consequences of test uses, and proposed uses should be justified by illustrating that
the positive consequences outweigh the anticipated negative consequences (AERA, APA, & NCME,
1999, 1.19-1.25). This implies that the measure of the quality of the evaluation of school policy on

9
teaching is seen as an integrated evaluation of the interpretation of the school evaluation mechanisms
rather than as a collection of techniques.
Differentiation: Finally, the differentiation dimension is measured by looking at the extent to
which the school gives more emphasis on conducting evaluation for specific aspects/reasons of policy
for teaching which refer to the major weaknesses of the school. For example, if policy on homework
is considered problematic, the school may decide to collect data for homework more often and in
greater depth rather than collecting data for any other aspect of school policy for teaching.
C) School Policy for creating a School Learning Environment (SLE) and actions taken for
improving the SLE
School climate factors have been incorporated in effectiveness models in different ways. Stringfield
(1994) defines the school climate very broadly as the total environment of the school. This makes it
difficult to study specific factors of the school climate and examine their impact on student
achievement (Creemers & Reezigt, 1999b). On the other hand, Creemers (1994) defines climate
factors more narrowly and expects them to exert influence on student outcomes in the same way as
the effectiveness factors do. The proposed dynamic model refers to the extent to which a learning
environment has been created in the school. This element of school climate is seen as the most
important predictor of school effectiveness since learning is the key function of a school. Moreover,
EER has shown that effective schools are able to respond to the learning needs of both teachers and
students and to be involved in systematic changes of the school’s internal processes in order to
achieve educational goals more effectively in conditions of uncertainty (Harris, 2001). In this context,
the following five aspects which define the learning environment of the school are taken into account:
a) student behavior outside the classroom,
b) collaboration and interaction between teachers,
c) partnership policy (i.e., the relations of school with community, parents, and
advisors),
d) provision of sufficient learning resources to students and teachers, and
e) values in favor of learning.
10
The first three aspects refer to the rules which the school has developed for establishing a learning
environment inside and outside the classrooms. Here the term learning does not refer exclusively to
the student learning. For example, collaboration and interaction between teachers may contribute in
their professional development (i.e., learning of teachers) but may also have an effect on teaching
practice and thereby improve student learning. The fourth one refers to the policy on providing
resources for learning. The availability of learning resources in schools may not have only an effect
on student learning but may also encourage the learning of teachers. For example, the availability of
computers and software for teaching Geometry may contribute to teacher professional development
since it encourages teachers to find ways to make good use of the software in their teaching practice
and thereby to become more effective. The last aspect of this overarching factor is concerned with the
strategies which the school has developed in order to encourage teachers and students to develop
positive attitudes towards learning. The fact that the importance of the school climate is only seen in
relation to the extent to which there is a learning environment within the school implies that values of
the people not related with learning are not seen as effectiveness factors but may be related with the
outcomes of schooling.
Following a similar approach as the one concerned with school policy on teaching, the proposed
dynamic model attempts to measure the school policy for creating a School Learning Environment
(SLE). Actions taken for improving the SLE beyond the establishment of policy guidelines are also
taken into account. More specifically, actions taken for improving the SLE can either be directed at:
a) changing the rules in relation to the first three aspects of the SLE factor mentioned above, b)
providing educational resources (e.g., teaching aids, educational assistance, new posts), or c) helping
students/teachers to develop positive attitudes towards learning. For example, a school may have a
policy promoting teacher professional development, but this might not be enough, especially if some
teachers do not consider professional development as an important issue. In this case, actions should
be taken to help teachers develop positive attitudes towards learning, which may help them become
more effective.
11
D) Evaluation of the school learning environment
Since school climate is expected to be evaluated (Creemers, 1994), the dynamic model also refers to
the extent to which a school attempts to evaluate its learning environment. A similar approach to the
one used to measure the school-level factor concerning the evaluation of school policy of teaching is
used in order to measure the factor focused on the evaluation of the school learning environment (see
Creemers & Kyriakides, 2007).
Beyond presenting the proposed model at the school level some supportive material for the
validity of the dynamic model is provided in this paper. Our attempt to do this is due to the fact that
many theories die, not because of any demonstrated lack of merit, but because even their creators
failed to provide any evidence at all supporting even some of the ideas included in their theory. Thus,
the next section refers to the methods used to test the validity of the dynamic model whereas the
fourth part of the paper illustrates the results of the second phase of a study conducted in Cyprus in
order to test the validity of the model at the school level. Finally, implications of findings for the
development of educational effectiveness research are drawn in the last section of this paper.
METHODS
The studies which have been used in order to test the validity of Creemers’ model (de Jong et al.,
2004; Kyriakides, 2005; Kyriakides et al., 2000; Kyriakides & Tsangaridou, 2004) reveal the
importance of using multiple measures of effectiveness factors and of conducting longitudinal studies
rather than case studies in order to identify the relations which exist between the various measures of
each factor and student achievement gains. Thus, the longitudinal study which is undertaken in
Cyprus does not only attempt to investigate educational effectiveness in mathematics and language
but measures concerning with the main aims of religious education are also taken into account. As a
consequence, the extent to which the dynamic model can be considered as a generic model can be
tested. Specifically, the second phase of the study attempts to identify:
a) the extent to which each of the school level factors can be defined by reference to the
five dimensions of the model, and

12
b) the type(s) of relations that each factor and its dimensions have with student learning
outcomes in mathematics, language and religious education.
A) Participants
Stratified sampling (Cohen, Manion, & Morrison, 2000) was used to select 52 out of 191 Cypriot
primary schools but only 50 schools participated in the study. All the year 5 pupils (n=2503) from
each class (n=108) of the school sample were chosen. The chi-square test did not reveal any
statistically significant difference between the research sample and the population in terms of pupils’
sex. Moreover, the t-test did not reveal any statistically significant difference between the research
sample and the population in terms of the size of class and of the length of teaching experience of the
teacher sample. It may be claimed that a nationally representative sample of Cypriot year 5 pupils was
drawn.
As far as the dependent variables of this study are concerned, data on pupils’ achievement in
mathematics, Greek language and religious education were collected by using external forms of
assessment. Written tests were administered to our student sample when they were at the beginning of
year 5 (i.e., October 2004), at the end of year 5 (i.e., May 2005), and at the end of year 6 (i.e., May
2006). Since this paper investigates the extent to which school level factors explain variation on
student achievement gains during the second year of this longitudinal study, information on the
relevant dependent and explanatory variables are provided below. It is however important to note
here that data on achievement both at the end of year 5 and at the end of year 6 were available for
2369 out of the 2503 students. This means that our missing cases were less than 7% of the whole
sample of students.
B) Dependent Variables: Student achievement in mathematics, Greek language and religious
education
As far as the dependent variables of this study are concerned, data on student achievement in
mathematics, Greek language and religious education were collected by using external forms of
assessment designed to assess knowledge and skills in mathematics, Greek language and religious
13
education which are identified in the Cyprus Curriculum for year 6 students (Ministry of Education,
1994). Student achievement in relation to the affective aims included in the Cyprus curriculum for
religious education was also measured. Criterion-reference tests are more appropriate than norm-
referenced tests for relating achievement to what a pupil should know and for testing competence
rather than general ability. Thus, criterion-reference tests were constructed and pupils were asked to
answer at least two different tasks related to each objective in the teaching program of mathematics,
Greek language, and religious education for year 6 pupils. Scoring rubrics, used to differentiate
among four levels of task proficiency (0-3) on each task, were also constructed. Thus, ordinal data
about the extent to which each child had acquired each skill included in the year 6 curriculum of
mathematics, Greek language, and religious education were collected. The three written tests in
mathematics, Greek language and religious education were administered to the students of our sample
at the end of school year 2005-2006. The construction of the tests was subject to controls for
reliability and validity. Specifically, the Extended Logistic Model of Rasch (Andrich, 1988) was used
to analyze the emerging data in each subject separately. Four scales, which refer to student knowledge
in mathematics, Greek language and religious education and to student attitudes towards religious
education were created and analyzed for reliability, fit to the model, meaning and validity. Analysis of
the data revealed that each scale had relatively satisfactory psychometric properties. Specifically, for
each scale the indices of cases (i.e., students) and item separation were higher than 0.84 indicating
that the separability of each scale was satisfactory (Wright, 1985). Moreover, the infit mean squares
and the outfit mean squares of each scale were near one and the values of the infit t-scores and the
outfit t-scores were approximately zero. Furthermore, each analysis revealed that all items had item
infit with the range 0.83 to 1.20. It can therefore be claimed that each analysis revealed that there was
a good fit to the model (Keeves & Alagumalai, 1999). Thus, for each student four different scores for
his/her achievement at the end of year 6 were generated, by calculating the relevant Rasch person
estimate in each scale.
C) Explanatory variables at student level
14
Aptitude
Aptitude refers to the degree in which a student is able to perform the next learning task. For the
purpose of this study, it consists of prior knowledge of each subject (i.e. mathematics, Greek language
and religious education) and prior attitudes towards religious education emerged from student
responses to the external forms of assessment administered to students when they were at the end of
year 5. As it has been mentioned above, external forms of assessment were used to measure the
achievement of our sample when they were at the end of year 5. The Extended Logistic Model of
Rasch was used to analyze the emerging data in each subject separately and four scales, which refer to
student knowledge in mathematics, Greek language and religious education and to student attitudes
towards religious education at the end of year 5 were created. The psychometric properties of these
scales were satisfactory (see Kyriakides & Creemers, 2006). Thus, for each student four different
scores for his/her achievement at the end of year 5 were generated, by calculating the relevant Rasch
person estimate in each scale and these were treated as measures of prior knowledge for each of our
dependent variable.
Student Background Factors
Information was collected on two student background factors: sex (0=boys, 1=girls), and socio-
economic status (SES). Five SES variables were available: father’s and mother’s education level (i.e.,
graduate of a primary school, graduate of secondary school or graduate of a college/university), the
social status of father’s job, the social status of mother’s job and the economical situation of the
family. Following the classification of occupations used by the Ministry of Finance, it was possible to
classify parents’ occupation into three groups which have relatively similar sizes: occupations held by
working class (33%), occupations held by middle class (37%) and occupations held by upper-middle
class (30%). Representative parental occupations for the working class are: farmer, truck driver,
machine operator in a factory; for the middle class are: police officer, teacher, bank officer; and for
the upper-middle class are: doctor, lawyer, business executive. Relevant information for each child
was taken from the school records. Then standardized values of the above five variables were
calculated, resulting in the SES indicator.
15
D) Explanatory variables at school level: the construct validity of the measurement framework
The explanatory variables of the second phase of this longitudinal study, which refer to the four
school level factors of the dynamic model, were measured by asking all the teachers of the school
sample to complete a questionnaire. The questionnaire was designed in such a way that information
about the five dimensions of the four school-level overarching factors of the dynamic model could be
collected. A Likert scale was used to collect data on teachers’ perceptions of the school level factors.
Of the 364 teachers approached 313 responded, a response rate of 86%. The chi-square test did not
reveal any statistically significant difference between the distribution of the teacher sample which
indicates at which school each teacher works and the relevant distribution of the whole population of
the teachers of the 50 schools of our sample (X2=57.12, d.f.=49, p<.38). It can therefore be claimed
that our sample is representative to the whole population in terms of how the teachers are distributed
in each of these 50 schools. Moreover, the missing responses to each questionnaire item were very
small (i.e., less than 5%).
Since it is expected that teachers within a school view the policy of their school and the
evaluation mechanisms of their school similarly but differently from teachers in other schools, a
Generalisability study was initially conducted. It was found that for 102 out of the 110 questionnaire
items the object of measurement was the school. It is important to note that 6 out of the 8 items for
which the generalisability of the data at the level of the school is questionable had very small variance
and refer to the school policy in relation to the development of positive values towards learning. Since
only 8 items were used to collect data on teacher views about this factor it was decided to drop all the
items which refer to this factor. We also drop the data emerged from the two items which were found
not to be generalisable at the level of school and which were concerned with the focus dimension of
two other overarching factors (i.e., school policy for teaching, and evaluation of the learning
environment of the school).
Since the use of multilevel modeling techniques to investigate the relationship between
student achievement and each school level factor is largely dependent on the quality of the data
arising from the research instruments (Marcoulides & Schumacker, 1996), it was decided to examine
16
not only the generalisability but also the construct validity of the teacher questionnaire. Thus, using a
unified approach to test validation (AERA, APA and NCME, 1999; Messick, 1989), this study
provides construct related evidence of the measures of the teacher questionnaire concerned with the
four school level factors which are briefly presented below. Thus, answers to the first question of this
study are given in this section.
School policy for teaching
For each measurement dimension, exploratory factor analysis of the items of the questionnaire which
refer to the school policy of teaching was conducted. These items were expected to belong to three
different factors concerned with school policy on: a) quantity of teaching, b) provision of learning
opportunities and c) quality of teaching. However, the first eigenvalue of each analysis was at least
three times bigger than the second one. Therefore, we decided to treat items concerned with the same
dimension of school policy on teaching as items which refer to a single scale (Kline, 1994). To test
this assumption, the Extended Logistic Model of Rasch was used. It was found that each scale had
relatively good psychometric properties. Therefore, for each school, five different scores for its policy
on teaching in relation to the five measurement dimensions were generated. The scores were based on
aggregating the Rasch person (i.e., teacher) estimates of each scale at the school level. Calculating the
correlation coefficients of these five scores, it was also found that they were statistically significant at
level .001 but their values were lower than 0.40. This finding provides support to our decision to treat
each measurement dimension of school policy on teaching as separate construct (see also Cronbach,
1990).
Evaluation of school policy on teaching
The first order factor structure of the 15 items concerned with the evaluation of the school policy for
teaching was investigated to determine whether the five proposed measurement dimensions of the
dynamic model explain the variability in the items that are logically tied to each other, or whether
there is a single latent factor that can explain better the variability in the 15 items. Specifically, the
model hypothesized that: (a) the 15 item scores could be explained by five factors; (b) each would
17
have a nonzero loading on the factor (i.e., measurement dimension) it was designed to measure, and
zero loadings on all other factors; (c) the five factors would be correlated, and (d) measurement errors
would be uncorrelated. The findings of the first order factor SEM analysis generally affirmed the
assumption of the dynamic model that this school level factor could be measured in relation to each of
the five measurement dimensions. Although the scaled chi-square for the five factor structure
(X2=164.4, d.f.=80, p<.05) as expected was statistically significant, the RMSEA was 0.032 and the
CFI was 0.968 and both of them met the criteria for acceptable level of fit. Kline (1998, p. 212)
argues that “even when the theory is precise about the number of factors of a first-order model, the
researcher should determine whether the fit of a simpler, one-factor model is comparable”. Criteria fit
for a one factor model (X2=1405.4, d.f.=89, p<.001; RMSEA=0.152 and CFI=0.408) provided values
that fell outside generally accepted guidelines for model fit. Thus, a decision was made to consider
the five-factor structure as reasonable and the analysis proceeded and the parameter estimates were
calculated. Figure 1 depicts the five-factors model and presents the factor parameters estimates. All
parameter estimates were statistically significant (p<.001). The following observations arise form
figure 1.
________________________
Insert Figure 1 about here
________________________
First, the standardized factor loadings were all positive and moderately high. Their standardized
values ranged from 0.59 to 0.72 and six of them were higher than 0.70. Second, the correlations
among the five factors were positive but very low since all of them were smaller than 0.20. The low
values of the factor intercorrelations provided support for arguing the separation of the five factors in
the part of the teacher questionnaire concerned with the measurement of the evaluation of school
policy for teaching. Therefore, validation of the five-order factor structure of this part of the
questionnaire provided support to the use of item scores for making inferences about five different
measurement dimensions of this factor rather than treating it as a unidimensional construct. Thus, for
18
each school, five scores of its evaluation of the school policy of teaching were generated by
aggregating at the school level the factor scores emerged from teacher responses to the questionnaire.
School policy on the learning environment of the school
The same approach as the one used to examine teachers’ perceptions of school policy for teaching
was used to validate the factor structure of the questionnaire items concerned with the school policy
of the learning environment of the school. Specifically, for each measurement dimension, exploratory
factor analysis of the items concerned with this overarching factor was conducted. The results of these
analyses are as follows. First, in the case of the frequency dimension, a five-factor model (explaining
54% of the total variance) was derived. The five factors consisted of items which refer to the
following aspects of the learning environment of the school: 1) student behavior outside the
classroom, 2) collaboration and interaction between teachers, 3) relation of the school with parents
and the wider community, 4) relation of the school with the employers/ministry of education (e.g.,
inspectorate, pedagogical institute, advisory bodies) and 5) provision of learning resources. This
implies that the items of the factor of the dynamic model concerned with the partnership policy were
found to belong to two separate factors whereas the other three factors are identical to those included
in the dynamic model. Empirical support to the conceptualization of SLE by the dynamic model was
also provided by the analyses concerned with the quality and stage dimensions of this overarching
factor since four factors similar to those described in the dynamic model were identified (more than
52% of the total variance was explained by each of these two four-factor models). However, the
analysis of the items concerned with the focus dimension revealed that the first eigenvalue was almost
three times as big as the second eigenvalue. A similar result emerged from the factor analysis of the
items of the differentiation dimension. It was therefore decided to use the Extended Logistic Model of
Rasch and find out whether the scales of each of these two dimensions can be treated as
unidimensional. Analysis of the data revealed that each scale had relatively satisfactory psychometric
properties. However, in the case of the scale concerned with the focus dimension of this factor, we
decided to repeat the analysis without taking into account the responses of two teachers (of different
schools) who did not fit the model well since their person fit indices were very high. This decision is

19
justified by the fact that the psychometric properties of the new scale which emerged were
significantly improved. Thus, for each school, two scores concerned with the focus and the
differentiation of its policy for creating a learning environment were generated by calculating the
relevant mean scores of the Rasch person (teacher) estimate in each scale.
Evaluation of the learning environment of the school
The same procedure as the one used to analyze the data emerged from the teacher questionnaire about
the evaluation factor concerned with the school policy of teaching was also used to analyze the data
on the evaluation of the learning environment of the school. Specifically, the first order factor
structure of the 14 items concerned with the evaluation of the school learning environment was
investigated to determine whether the five proposed measurement dimensions of the dynamic model
explain the variability in the items that are logically tied to each other (i.e., refer to the same
measurement dimension), or whether there is a single latent factor that can explain better the
variability in the 14 items. Thus, this section presents results concerned with the testing of various
types of CFA models that can be used to analyze data emerged from teacher responses to the 14 items
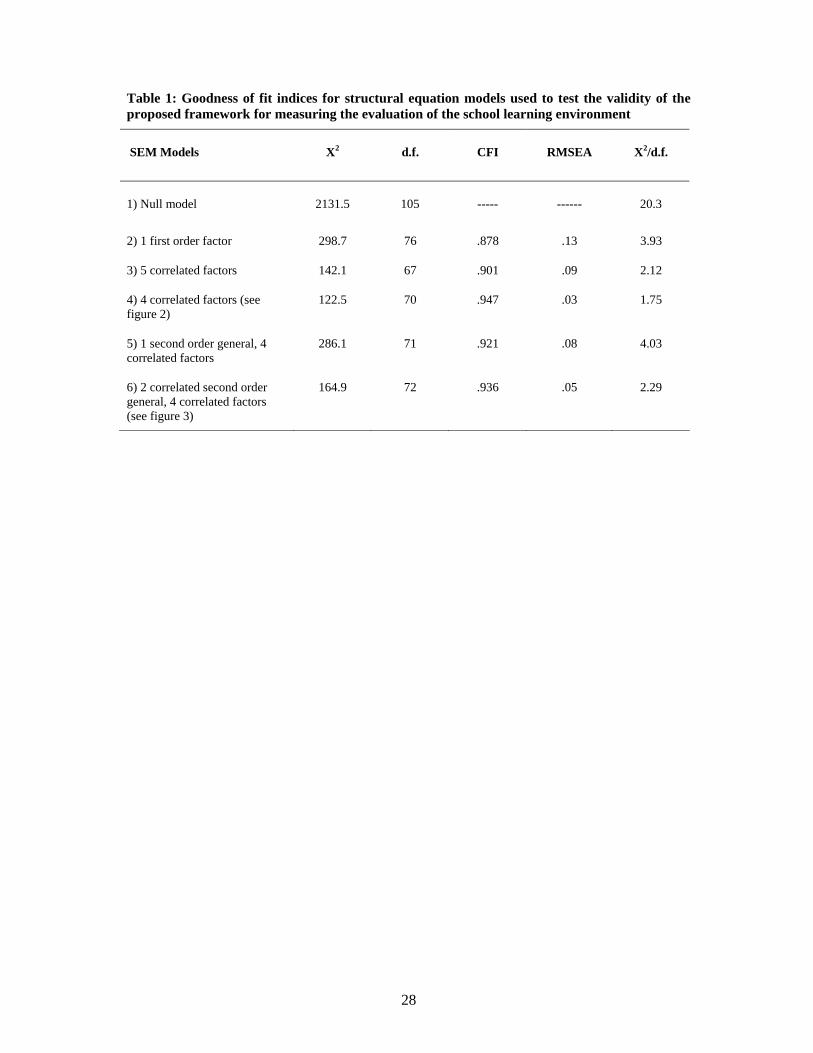
concerned with the evaluation of the learning environment of the school. Specifically, the null model
and the five nested models are presented in Table 1. The null model (Model 1) represents the most
restrictive model, with 14 uncorrelated variables measuring the perceptions of teachers about the
evaluation of the learning environment of their school. Models 2 through 4 are first-order models, and
comparisons between the chi-squares of these models helped us evaluate the construct validity of the
part of teacher questionnaire concerned with this school-level factor. Models 5 and 6 were higher
order models tested and compared to account for the lower order baseline model.
______________________________
Insert Table 1 about here
_____________________________
The following observations arise from table 1. First, comparing the null model with model 2, we can
observe that although the overall fit of model 2 was not acceptable, it was a significant improvement
20
in chi-square compared to the null model. This result can be seen as an indication of the importance of
searching for the factor structure of the data emerged from the teacher questionnaire. Second, model 2
can be compared with models 3 and 4 to determine the best trait structure of this overarching factor
which is able to explain better the variability in the 14 questionnaire items. Model 3 represents the
five factor model which investigates whether each of the 14 items has a nonzero loading on the factor
(i.e., measurement dimension) it was designed to measure, and zero loadings on all other factors. The
five factors are also correlated but the measurement errors of these items are uncorrelated. The chi-
square difference between models 2 and 3 showed a significant decrease in chi-square and a
significant improvement over the one factor only model. Clearly, the use of different dimensions to
measure this factor is supported since their treatment as separate factors help us increase the amount
of covariation explained. On the other hand, model 4 was found to fit reasonably well and was a
significant improvement over both model 2 and model 3. This model hypothesized a structure of four
factors which refer to all but the focus dimension of the evaluation of SLE (see figure 2). Moreover,
the two items concerned with the measurement of the focus dimension were found to belong to two
other dimensions (i.e., one item is correlated with the factor representing the frequency dimension
whereas the other is associated with the quality dimension). Furthermore, one of the three items
expected to measure the stage dimension was not only found to be correlated with the stage
dimension but also with the factor measuring the quality dimension.
______________________________
Insert Figure 2 about Here
_____________________________
Third, models 5 and 6 were examined to determine if a second-order structure would explain the
lower order trait factors, as these are described in model 4, more parsimoniously. Specifically, model
5 hypothesized that the scores emerged from the 14 items could be explained by the four first-order
factors (as these appear in model 4) and one second-order factor (i.e. evaluation of SLE in general).
On the other hand, model 6 was a model with one second-order trait which refers to all dimensions
but the frequency. Moreover, the second order factor is allowed to be correlated with the frequency

21
factor. Figure 3 illustrates the structure of this model. We also tested three additional second order
models with varying factor structures, but none of them was significantly better than either model 5 or
model 6. In comparing first and second order models, a second-order model rarely fits better than a
lower order model. Because there are fewer parameters estimated in higher order models compared to
lower order models of the same measures, the degrees of freedom increase, as does the chi-square. In
this study, for each subject the fit indices of models 5 and 6 as well as a chi-square difference test
between the two models reveal that model 6 fits better than model 5. Moreover, the fit values of
model 5 do not meet the criteria for acceptable level of fit. This finding provides support for arguing
the importance of measuring each of the five dimensions of effectiveness factors separately rather
than treating them as unidimensional. Finally, the fit of the data emerged from measuring teachers’
perceptions of the evaluation of the SLE to model 6 could be treated as adequate. But although model
6 could be considered more parsimonious in explaining the interrelations among the five factors
rather than model 4, the latter model fits better to the data.
______________________________
Insert Figure 3 about Here
_____________________________
Having established the reliability and the construct validity of the data, analysis of the data was
undertaken in order to provide answers to the second question of the study. Due to the hierarchical
structure of data (i.e., students within classes, within schools), separate multilevel analyses of data
were conducted in order to examine the extent to which the variables in the dynamic model show the
expected effects upon each dependent variable (i.e., student achievement in mathematics, language
and religious education). The results of these analyses are presented in the next section.
RESULTS
Having established the construct validity of the framework used to measure the dimensions of the four
overarching school-level factors of the dynamic model, it was decided to examine the extent to which
the relevant factor scores show the expected effects upon each of the four dependent variables and
22
thereby the analyses were performed separately for each variable. Specifically, the dynamic model of
EER was tested using “MLwiN” (Goldstein et al., 1998) because the observations are interdependent
and because of multi-stage sampling since students are nested within classes and classes within
schools. The dependency has an important consequence. If students’ achievement within a class or a
school has a small range, institutional factors at class or school level may have contributed to it
(Snijders & Bosker, 1999). Thus, the first step in the analysis was to determine the variance at
individual, class and school level without explanatory variables (empty model). In subsequent steps
explanatory variables at different levels were added. Explanatory variables, except grouping
variables, were entered as Z-scores with a mean of 0 and a standard deviation of 1. This is a way of
centering around the grand mean (Bryk & Raudenbush, 1992) and yields effects that are comparable.
Thus, each effect expresses how much the dependent variable increases (or decreases in case of a
negative sign) by each additional deviation on the independent variable (Snijders & Bosker, 1999).
Grouping variables were entered as dummies with one of the groups as baseline (e.g., boys=0). The
models presented in Tables 2 and 3 were estimated without the variables that did not have a
statistically significant effect at .05 level.
______________________________
Insert Tables 2 and 3 About Here
_____________________________
A comparison of the empty models of the four outcome measures reveals that the effect of the school
and classroom was more pronounced on achievement in mathematics and Greek language rather than
in Religious Education. Moreover, the school and the teacher (classroom) effects were found to be
higher on achievement of cognitive rather than affective aims of religious education. These finding
are in line with the results of the first phase of this longitudinal study concerned with teacher and
school effects on student achievement at the end of year 5 (see Kyriakides & Creemers, 2006). It is
finally important to note that in each analysis the variance at each level reaches statistical significance
(p<.05) and this implies that MLwiN can be used to identify the explanatory variables which are
associated with achievement in each outcome of schooling (Goldstein, 2003).
23
In model 1 the context variables at student, classroom and school levels were added to the
empty model. The following observations arise from the figures of the four columns illustrating the
results of model 1 for each analysis. First, model 1 explains approximately 50% of the total variance
of student achievement in each outcome and most of the explained variance is at the student level.
However, more than 30% of the total variance remained unexplained at the student level. Second, the
likelihood statistic (X2) shows a significant change between the empty model and model 1 (p<.001)
which justifies the selection of model 1. Second, the effects of all contextual factors at student level
(i.e., SES, prior knowledge, sex) are significant but the SES was not found to be associated with
achievement of affective aims in religious education. Moreover, gender was not found to be
consistently associated with student achievement in each outcome. Girls were found to have better
results than boys in relation to each outcome but mathematics. The results concerning gender
differences in Greek language and mathematics are in line with findings of effectiveness studies
conducted in Cyprus (Kyriakides et al., 2000; Kyriakides, 2005) as well as with the results of the first
phase of this longitudinal study (see Kyriakides & Creemers, 2006). Third, prior knowledge (i.e.,
aptitude) has the strongest effect in predicting student achievement at the end of year 6. Moreover,
aptitude is the only contextual variable which had a consistent effect on student achievement when
was aggregated either at the classroom or the school level. Finally, the standard errors show that the
effect sizes of the context variables are significant and stable.
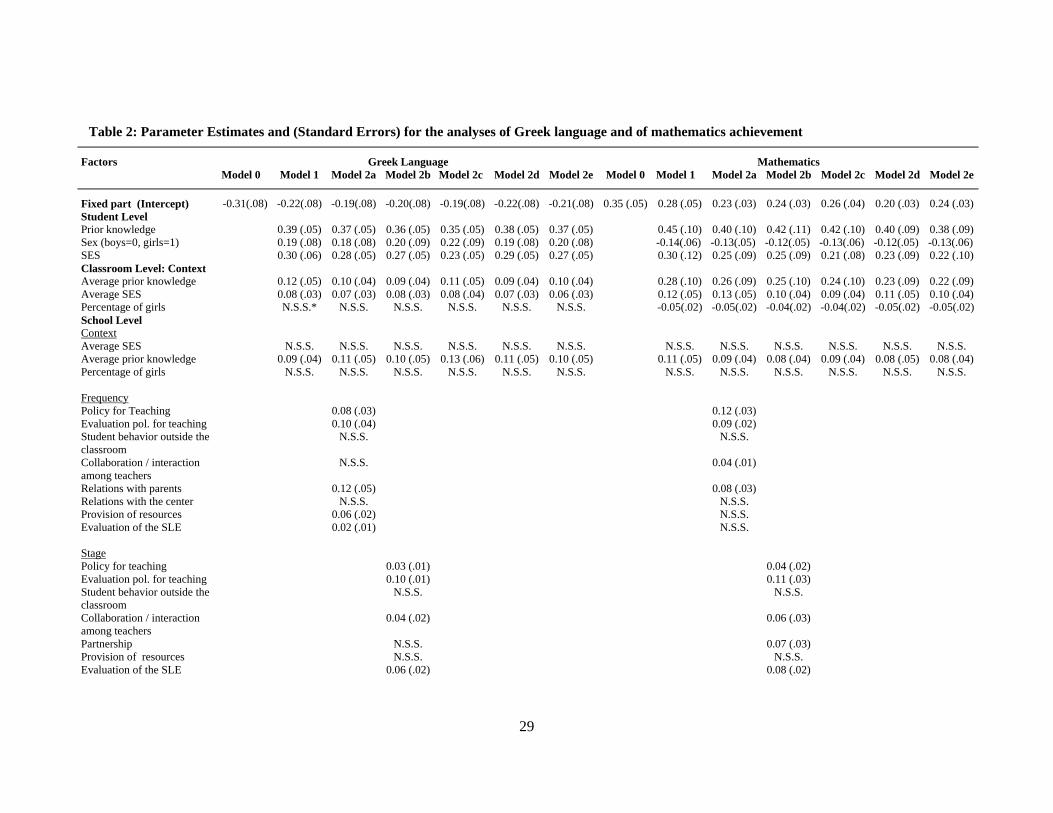
At the next step of the analysis, for each dependent variable, five different versions of model
2 were established. In each version of model 2, the scores of the school level factors which refer to the
same measurement dimension and emerged through our attempt to test the construct validity of the
teacher questionnaire were added to model 1. The fitting of these five models was tested against
model 1. The likelihood statistic (X2) reveals a significant change (p<.001) between the model 1 and
almost each version of model 2. Significant changes were not identified in only two models which
were concerned with the effect of the focus dimension of school level factors upon achievement in
religious education. This implies that variables measuring four out of the five dimensions of the
school effectiveness factors have significant effects on student achievement in all four outcomes of
schooling taken into account by this study. This approach was deliberately chosen since the
24
dimensions of the same factor are interrelated. Therefore, adding all dimensions into a single model
causes difficulties of identifying which variables have effects on student achievement. Specifically,
some variables may correlate with achievement when they are studied in isolation, but because of
multicollinearity their effects may disappear when they are studied together. It was, therefore,
considered appropriate to study the effect of each dimension of the school level factors in isolation.
The following observations arise from the figures of model 2a which refer to the impact of
the frequency dimension of the effectiveness factors on each of the four dependent variables. First, the
only factor which did not have any statistically significant effect is concerned with student behavior
outside the classroom. According to the dynamic model, student behavior outside the classroom is an
important aspect of the learning environment but no empirical support to the impact of the frequency
dimension of this factor has been provided. On the other hand, the evaluation of school policy for
teaching and the school relations with parents were found to be associated with student achievement
in each of the four dependent variables. Second, although curvilinear relations were assumed to exist
between most of the frequency factors and student achievement no such relation was identified. As far
as the figures of the models which refer to the impact of the stage dimension of the school level
factors are concerned, we can observe that the stage dimension of the two overarching factors
concerned with school evaluation are associated with each outcome measure whereas the stage
dimension of only one factor (i.e., student behavior outside the classroom) does not have any
statistically significant effect on student achievement. Moreover, the effects of the stage dimension of
the two evaluation factors were found to be stronger than the effect of any other factor. The figures of
the models 2c reveal that the focus dimension of the school level factors is very rarely associated with
achievement in any of the four dependent variables of this study. The only exception is the impact of
the focus dimension of policy for teaching upon mathematics achievement. Moreover, the focus
dimension of the two overarching factors of evaluation were expected to have a curvilinear relation
with student achievement but only the focus dimension of the evaluation of the school policy for
teaching was found to have a curvilinear relation with achievement in language. Furthermore, in the
case of religion education the two models of 2c were not found to fit better to the data than model 1.
The figures of model 2d refer to the impact of the quality dimension of each effectiveness factor upon
25
student achievement. We can observe that there is no quality measure of a school level factor which
does not have any statistically significant effect upon at least one of our school outcome measure.
Moreover, for each outcome measure, the model 2d explains more variance than any other alternative
model 2 and this reveals the importance of using this dimension to measure the impact of
effectiveness factors on student achievement. Furthermore, almost all the effect sizes of the quality
measures upon student achievement are higher than .05. Finally, the figures of the four models of 2e
reveal that the differentiation dimension of the overarching factor concerned with the school policy
for creating a learning environment is not only consistently related with student achievement but its
effect size is stronger than the effect of any other differentiation dimension of school level factors. On
the other hand, the differentiation dimension of the evaluation of school policy for teaching is not
associated with student achievement in any outcome measure.
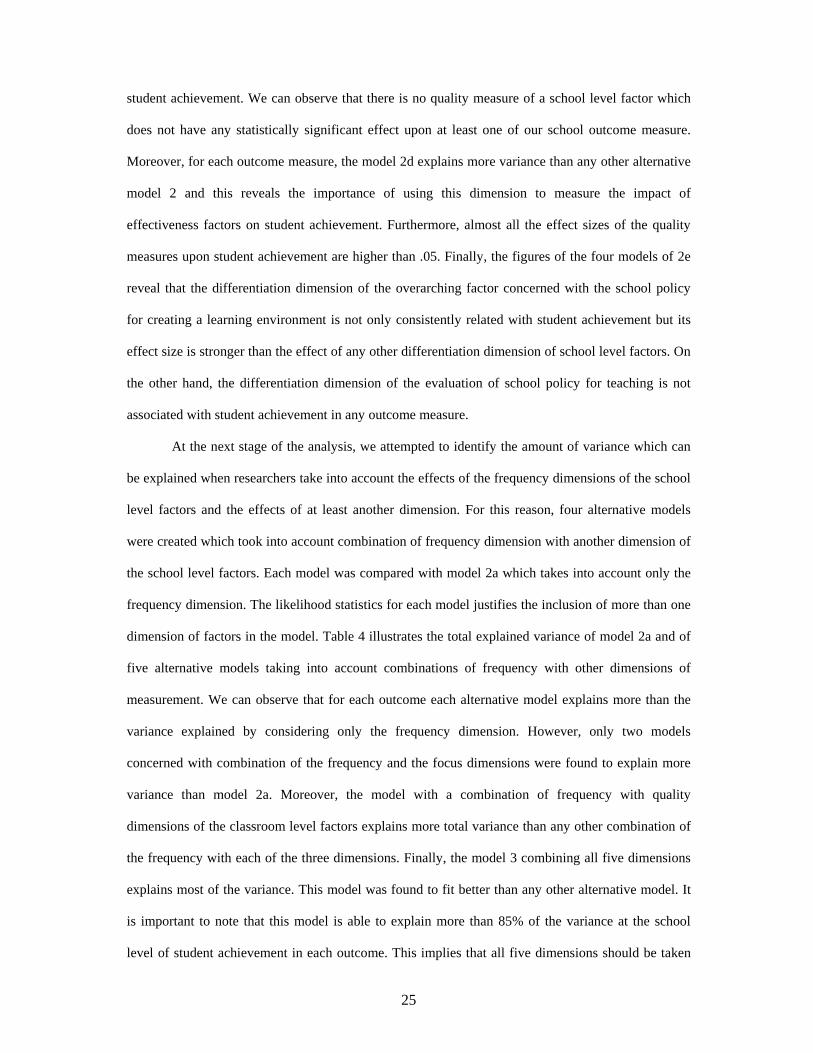
At the next stage of the analysis, we attempted to identify the amount of variance which can
be explained when researchers take into account the effects of the frequency dimensions of the school
level factors and the effects of at least another dimension. For this reason, four alternative models
were created which took into account combination of frequency dimension with another dimension of
the school level factors. Each model was compared with model 2a which takes into account only the
frequency dimension. The likelihood statistics for each model justifies the inclusion of more than one
dimension of factors in the model. Table 4 illustrates the total explained variance of model 2a and of
five alternative models taking into account combinations of frequency with other dimensions of
measurement. We can observe that for each outcome each alternative model explains more than the
variance explained by considering only the frequency dimension. However, only two models
concerned with combination of the frequency and the focus dimensions were found to explain more
variance than model 2a. Moreover, the model with a combination of frequency with quality
dimensions of the classroom level factors explains more total variance than any other combination of
the frequency with each of the three dimensions. Finally, the model 3 combining all five dimensions
explains most of the variance. This model was found to fit better than any other alternative model. It
is important to note that this model is able to explain more than 85% of the variance at the school
level of student achievement in each outcome. This implies that all five dimensions should be taken

26
into account in order to explain as much variance as possible at the school level. However, none of
these models explains more than about 60% of the total variance. Nevertheless, this can be attributed
to the fact that only some contextual factors at the student and classroom level were taken into
account. It is therefore important to examine whether including the five dimensions of the classroom
level factors could help us explain most of the unexplained variance of model 3 for each outcome.
______________________________
Insert Table 4 About Here
_____________________________
DISCUSSION
Implications of findings for the development of the dynamic model are drawn. First,
References
Barber, M. (1996). The learning game: Arguments for an Education Revolution. London: Victor Gollanz.
Bosker, R. J. & Scheerens, J (1994). Alternative models of school effectiveness put to test. International Journal of Educational Research, 21 (2), 159-180.
Campbell, R.J., Kyriakides, L., Muijs, R.D., & Robinson, W. (2003). Differential teacher effectiveness: towards a model for research and teacher appraisal. Oxford Review of Education, 29 (3), 347-362.
Creemers, B.P.M. (1994). The effective classroom. London: Cassell.
Creemers, B.P.M. & Kyriakides, L. (2006). Critical analysis of the current approaches to modelling educational effectiveness: The importance of establishing a dynamic model School Effectiveness and School Improvement.
de Jong, R., Westerhof, K. J., & Kruiter, J.H. (2004). Empirical evidence of a comprehensive model of school effectiveness: a multilevel study in Mathematics in the first year of junior general education in the Netherlands. School effectiveness and school improvement, 15 (1), 3-31.
Heck, R.H. & Thomas, S. L. (2000). An introduction to multilevel modeling techniques. Mahwah, NJ: Lawrence Erlbaum Associates.
Kline, P. (1994). An Easy Guide to Factor Analysis. London: Routledge.
Kline, R.H. (1998). Principles and Practice of Structural Equation Modeling. London: Gilford Press.
Kyriakides, L. (2005). Extending the Comprehensive Model of Educational Effectiveness by an Empirical Investigation. School Effectiveness and School Improvement, 16.
27
Kyriakides, L. & Campbell, R.J. (2004). School self-evaluation and school improvement: a critique of values and procedures. Studies in educational evaluation, 30 (1), 23-36.
Kyriakides, L., Campbell, R.J., & Gagatsis, A. (2000). The significance of the classroom effect in primary schools: An application of Creemers comprehensive model of educational effectiveness. School Effectiveness and School Improvement, 11 (4), 501-529.
Kyriakides, L. & Creemers, B.P.M. (2006). Testing the Dynamic Model of Educational Effectiveness: Teacher Effects on Cognitive and Affective Outcomes. Paper presented at the 87th Annual Meeting of the American Educational Research Association. San Francisco, USA
Kyriakides, L. & Tsangaridou, N. (2004). School Effectiveness and Teacher Effectiveness in Physical Education. Paper presented at the 85th Annual Meeting of the American Educational Research Association. Chicago, USA.
Muthén, L. K., & Muthén, B. O. (1999). Mplus user's guide. Los Angeles, CA: Muthén & Muthén.
Scheerens, J. & Bosker, R (1997). The Foundations of Educational Effectiveness. Oxford: Pergamon
Snijders, T. & Bosker, R. (1999). Multilevel Analysis: An Introduction to Basic and Advanced Multilevel Modeling. London: Sage.
Teddlie, C. & Reynolds, D. (2000). The International Handbook of School Effectiveness Research. London: Falmer Press.
Witziers, B., Bosker, R.J., & Kruger, M.L. (2003). Educational Leadership and Student Achievement: The Elusive Search for an Association. Educational Administration Quarterly, 39 ( 3), 398-425.
Yair, G. (1997). When classrooms matter: Implications of between-classroom variability for educational policy in Israel. Assessment in Education, 4 (2), 225-248.
28
Table 1: Goodness of fit indices for structural equation models used to test the validity of the proposed framework for measuring the evaluation of the school learning environment
SEM Models X2 d.f. CFI RMSEA X2/d.f.
1) Null model 2131.5 105 ----- ------ 20.3
2) 1 first order factor 298.7 76 .878 .13 3.93
3) 5 correlated factors 142.1 67 .901 .09 2.12
4) 4 correlated factors (see figure 2)
122.5 70 .947 .03 1.75
5) 1 second order general, 4 correlated factors
286.1 71 .921 .08 4.03
6) 2 correlated second order general, 4 correlated factors (see figure 3)
164.9 72 .936 .05 2.29
29
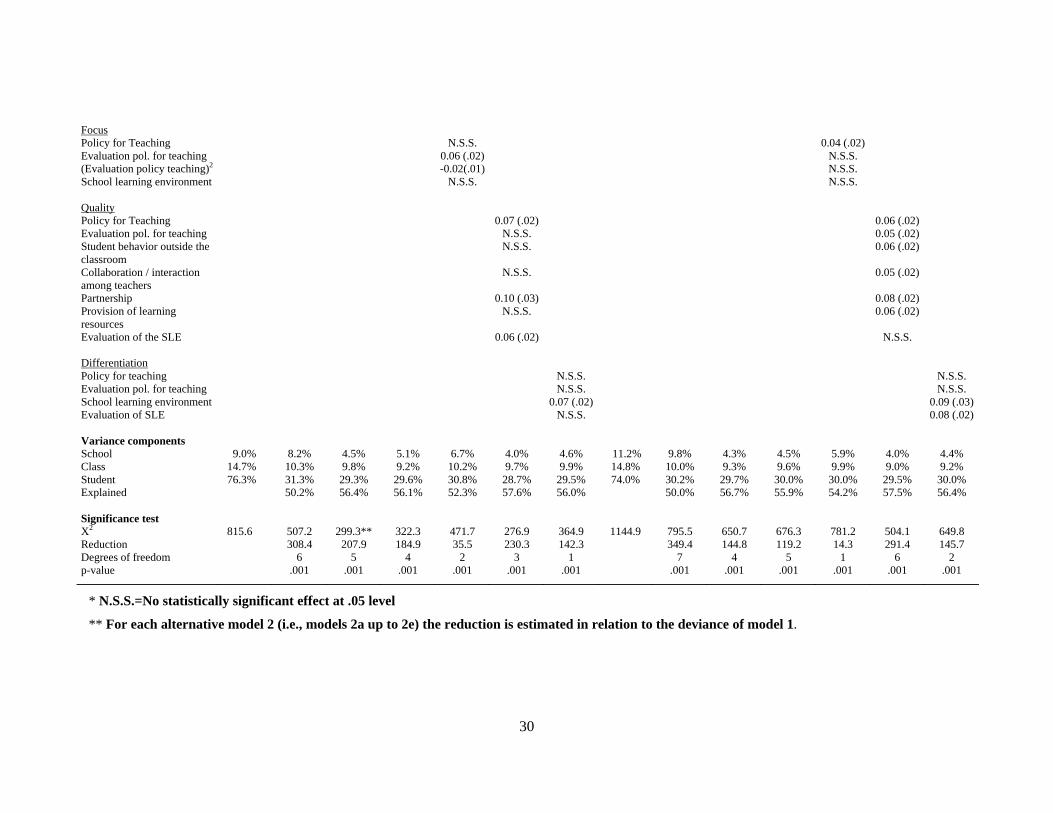
Table 2: Parameter Estimates and (Standard Errors) for the analyses of Greek language and of mathematics achievement
Factors Greek Language Mathematics Model 0 Model 1 Model 2a Model 2b Model 2c Model 2d Model 2e Model 0 Model 1 Model 2a Model 2b Model 2c Model 2d Model 2e
Fixed part (Intercept) -0.31(.08) -0.22(.08) -0.19(.08) -0.20(.08) -0.19(.08) -0.22(.08) -0.21(.08) 0.35 (.05) 0.28 (.05) 0.23 (.03) 0.24 (.03) 0.26 (.04) 0.20 (.03) 0.24 (.03)Student Level Prior knowledge 0.39 (.05) 0.37 (.05) 0.36 (.05) 0.35 (.05) 0.38 (.05) 0.37 (.05) 0.45 (.10) 0.40 (.10) 0.42 (.11) 0.42 (.10) 0.40 (.09) 0.38 (.09)Sex (boys=0, girls=1) 0.19 (.08) 0.18 (.08) 0.20 (.09) 0.22 (.09) 0.19 (.08) 0.20 (.08) -0.14(.06) -0.13(.05) -0.12(.05) -0.13(.06) -0.12(.05) -0.13(.06) SES 0.30 (.06) 0.28 (.05) 0.27 (.05) 0.23 (.05) 0.29 (.05) 0.27 (.05) 0.30 (.12) 0.25 (.09) 0.25 (.09) 0.21 (.08) 0.23 (.09) 0.22 (.10)Classroom Level: Context Average prior knowledge 0.12 (.05) 0.10 (.04) 0.09 (.04) 0.11 (.05) 0.09 (.04) 0.10 (.04) 0.28 (.10) 0.26 (.09) 0.25 (.10) 0.24 (.10) 0.23 (.09) 0.22 (.09)Average SES 0.08 (.03) 0.07 (.03) 0.08 (.03) 0.08 (.04) 0.07 (.03) 0.06 (.03) 0.12 (.05) 0.13 (.05) 0.10 (.04) 0.09 (.04) 0.11 (.05) 0.10 (.04)Percentage of girls N.S.S.* N.S.S. N.S.S. N.S.S. N.S.S. N.S.S. -0.05(.02) -0.05(.02) -0.04(.02) -0.04(.02) -0.05(.02) -0.05(.02)School Level Context Average SES N.S.S. N.S.S. N.S.S. N.S.S. N.S.S. N.S.S. N.S.S. N.S.S. N.S.S. N.S.S. N.S.S. N.S.S. Average prior knowledge 0.09 (.04) 0.11 (.05) 0.10 (.05) 0.13 (.06) 0.11 (.05) 0.10 (.05) 0.11 (.05) 0.09 (.04) 0.08 (.04) 0.09 (.04) 0.08 (.05) 0.08 (.04)Percentage of girls N.S.S. N.S.S. N.S.S. N.S.S. N.S.S. N.S.S. N.S.S. N.S.S. N.S.S. N.S.S. N.S.S. N.S.S. Frequency Policy for Teaching 0.08 (.03) 0.12 (.03) Evaluation pol. for teaching 0.10 (.04) 0.09 (.02) Student behavior outside the classroom
N.S.S. N.S.S.
Collaboration / interaction among teachers
N.S.S. 0.04 (.01)
Relations with parents 0.12 (.05) 0.08 (.03) Relations with the center N.S.S. N.S.S. Provision of resources 0.06 (.02) N.S.S. Evaluation of the SLE 0.02 (.01) N.S.S. Stage Policy for teaching 0.03 (.01) 0.04 (.02) Evaluation pol. for teaching 0.10 (.01) 0.11 (.03) Student behavior outside the classroom
N.S.S. N.S.S.
Collaboration / interaction among teachers
0.04 (.02) 0.06 (.03)
Partnership N.S.S. 0.07 (.03) Provision of resources N.S.S. N.S.S. Evaluation of the SLE 0.06 (.02) 0.08 (.02)
30
Focus Policy for Teaching N.S.S. 0.04 (.02) Evaluation pol. for teaching 0.06 (.02) N.S.S. (Evaluation policy teaching)2 -0.02(.01) N.S.S. School learning environment N.S.S. N.S.S. Quality Policy for Teaching 0.07 (.02) 0.06 (.02) Evaluation pol. for teaching N.S.S. 0.05 (.02) Student behavior outside the classroom
N.S.S. 0.06 (.02)
Collaboration / interaction among teachers
N.S.S. 0.05 (.02)
Partnership 0.10 (.03) 0.08 (.02) Provision of learning resources
N.S.S. 0.06 (.02)
Evaluation of the SLE 0.06 (.02) N.S.S. Differentiation Policy for teaching
N.S.S.
N.S.S.
Evaluation pol. for teaching N.S.S. N.S.S. School learning environment 0.07 (.02) 0.09 (.03) Evaluation of SLE N.S.S. 0.08 (.02) Variance components School 9.0% 8.2% 4.5% 5.1% 6.7% 4.0% 4.6% 11.2% 9.8% 4.3% 4.5% 5.9% 4.0% 4.4% Class 14.7% 10.3% 9.8% 9.2% 10.2% 9.7% 9.9% 14.8% 10.0% 9.3% 9.6% 9.9% 9.0% 9.2% Student 76.3% 31.3% 29.3% 29.6% 30.8% 28.7% 29.5% 74.0% 30.2% 29.7% 30.0% 30.0% 29.5% 30.0% Explained 50.2% 56.4% 56.1% 52.3% 57.6% 56.0% 50.0% 56.7% 55.9% 54.2% 57.5% 56.4% Significance test X2 815.6 507.2 299.3** 322.3 471.7 276.9 364.9 1144.9 795.5 650.7 676.3 781.2 504.1 649.8 Reduction 308.4 207.9 184.9 35.5 230.3 142.3 349.4 144.8 119.2 14.3 291.4 145.7 Degrees of freedom 6 5 4 2 3 1 7 4 5 1 6 2 p-value .001 .001 .001 .001 .001 .001 .001 .001 .001 .001 .001 .001
* N.S.S.=No statistically significant effect at .05 level
** For each alternative model 2 (i.e., models 2a up to 2e) the reduction is estimated in relation to the deviance of model 1.

31
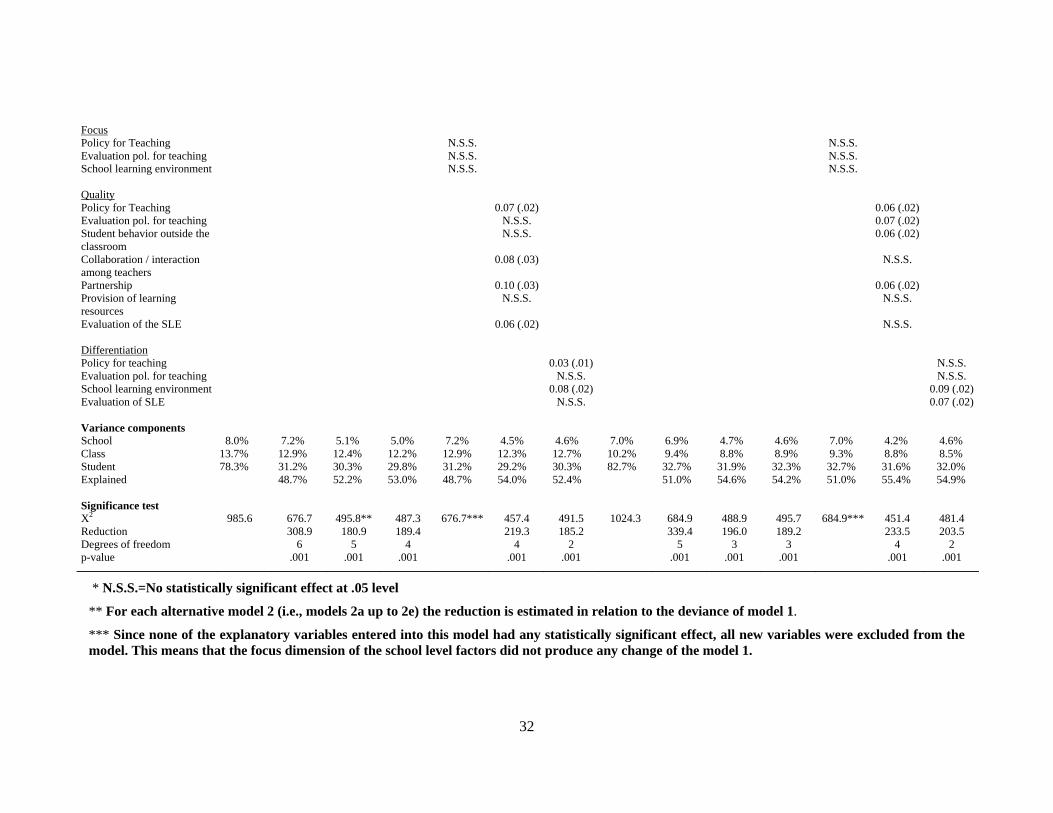
Table 3: Parameter Estimates and (Standard Errors) for the analyses of achievement in Religious Education (cognitive and affective outcomes)
Factors Religious Education (Cognitive aims) Religious Education (Affective aims) Model 0 Model 1 Model 2a Model 2b Model 2c Model 2d Model 2e Model 0 Model 1 Model 2a Model 2b Model 2c Model 2d Model 2e
Fixed part (Intercept) -0.59(.11) -0.43(.09) -0.41(.08) -0.40(.08) -0.43(.09) -0.34(.08) -0.40(.08) 0.41 (.08) 0.40 (.07) 0.30 (.07) 0.31 (.07) 0.40 (.07) 0.30 (.07) 0.34 (.07)Student Level Prior knowledge 0.41 (.05) 0.39 (.05) 0.38 (.05) 0.41 (.05) 0.42 (.05) 0.40 (.05) 0.36 (.10) 0.35 (.10) 0.34 (.10) 0.36 (.10) 0.35 (.10) 0.38 (.10)Sex (boys=0, girls=1) 0.13 (.06) 0.12 (.05) 0.10 (.04) 0.13 (.06) 0.11 (.04) 0.10 (.05) 0.16 (.06) 0.15 (.06) 0.15 (.06) 0.16 (.06) 0.17 (.06) 0.15 (.06)SES 0.12 (.05) 0.10 (.05) 0.09 (.04) 0.12 (.05) 0.10 (.05) 0.08 (.04) N.S.S. N.S.S. N.S.S. N.S.S. N.S.S. N.S.S. Classroom Level: Context Average prior knowledge 0.15 (.06) 0.14 (.06) 0.13 (.06) 0.15 (.06) 0.12 (.05) 0.13 (.06) 0.19 (.08) 0.17 (.07) 0.16 (.07) 0.19 (.08) 0.18 (.07) 0.19 (.18)Average SES 0.09 (.04) 0.08 (.04) 0.09 (.04) 0.09 (.04) 0.07 (.03) 0.06 (.03) N.S.S. N.S.S. N.S.S. N.S.S. N.S.S. N.S.S. Percentage of girls N.S.S. N.S.S. N.S.S. N.S.S. N.S.S. N.S.S. 0.05 (.02) 0.04 (.02) 0.04 (.02) 0.05 (.02) 0.04 (.02) 0.03 (.01)School Level Context Average SES N.S.S. N.S.S. N.S.S. N.S.S. N.S.S. N.S.S. N.S.S. N.S.S. N.S.S. N.S.S. N.S.S. N.S.S. Average prior knowledge 0.13 (.05) 0.13 (.05) 0.12 (.05) 0.13 (.05) 0.12 (.05) 0.13 (.05) 0.07 (.02) 0.06 (.02) 0.06 (.02) 0.07 (.02) 0.07 (.02) 0.06 (.02)Percentage of girls N.S.S. N.S.S. N.S.S. N.S.S. N.S.S. N.S.S. N.S.S. N.S.S. N.S.S. N.S.S. N.S.S. N.S.S. Frequency Policy for Teaching 0.09 (.04) N.S.S. Evaluation pol. for teaching 0.09 (.04) 0.11 (.02) Student behavior outside the classroom
N.S.S. N.S.S.
Collaboration / interaction among teachers
N.S.S. N.S.S.
Relations with parents 0.12 (.05) 0.09 (.03) Relations with the center N.S.S. 0.04 (.02) Provision of resources 0.05 (.02) N.S.S. Evaluation of the SLE 0.05 (.02) N.S.S. Stage Policy for teaching N.S.S. N.S.S. Evaluation pol. for teaching 0.09 (.02) 0.10 (.03) Student behavior outside the classroom
N.S.S. N.S.S.
Collaboration / interaction among teachers
0.06 (.02) N.S.S.
Partnership N.S.S. 0.08 (.03) Provision of resources 0.05 (.02) N.S.S. Evaluation of the SLE 0.08 (.02) 0.09 (.03)
32
Focus Policy for Teaching N.S.S. N.S.S. Evaluation pol. for teaching N.S.S. N.S.S. School learning environment N.S.S. N.S.S. Quality Policy for Teaching 0.07 (.02) 0.06 (.02) Evaluation pol. for teaching N.S.S. 0.07 (.02) Student behavior outside the classroom
N.S.S. 0.06 (.02)
Collaboration / interaction among teachers
0.08 (.03) N.S.S.
Partnership 0.10 (.03) 0.06 (.02) Provision of learning resources
N.S.S. N.S.S.
Evaluation of the SLE 0.06 (.02) N.S.S. Differentiation Policy for teaching
0.03 (.01)
N.S.S.
Evaluation pol. for teaching N.S.S. N.S.S. School learning environment 0.08 (.02) 0.09 (.02) Evaluation of SLE N.S.S. 0.07 (.02) Variance components School 8.0% 7.2% 5.1% 5.0% 7.2% 4.5% 4.6% 7.0% 6.9% 4.7% 4.6% 7.0% 4.2% 4.6% Class 13.7% 12.9% 12.4% 12.2% 12.9% 12.3% 12.7% 10.2% 9.4% 8.8% 8.9% 9.3% 8.8% 8.5% Student 78.3% 31.2% 30.3% 29.8% 31.2% 29.2% 30.3% 82.7% 32.7% 31.9% 32.3% 32.7% 31.6% 32.0% Explained 48.7% 52.2% 53.0% 48.7% 54.0% 52.4% 51.0% 54.6% 54.2% 51.0% 55.4% 54.9% Significance test X2 985.6 676.7 495.8** 487.3 676.7*** 457.4 491.5 1024.3 684.9 488.9 495.7 684.9*** 451.4 481.4 Reduction 308.9 180.9 189.4 219.3 185.2 339.4 196.0 189.2 233.5 203.5 Degrees of freedom 6 5 4 4 2 5 3 3 4 2 p-value .001 .001 .001 .001 .001 .001 .001 .001 .001 .001
* N.S.S.=No statistically significant effect at .05 level
** For each alternative model 2 (i.e., models 2a up to 2e) the reduction is estimated in relation to the deviance of model 1.
*** Since none of the explanatory variables entered into this model had any statistically significant effect, all new variables were excluded from the model. This means that the focus dimension of the school level factors did not produce any change of the model 1.
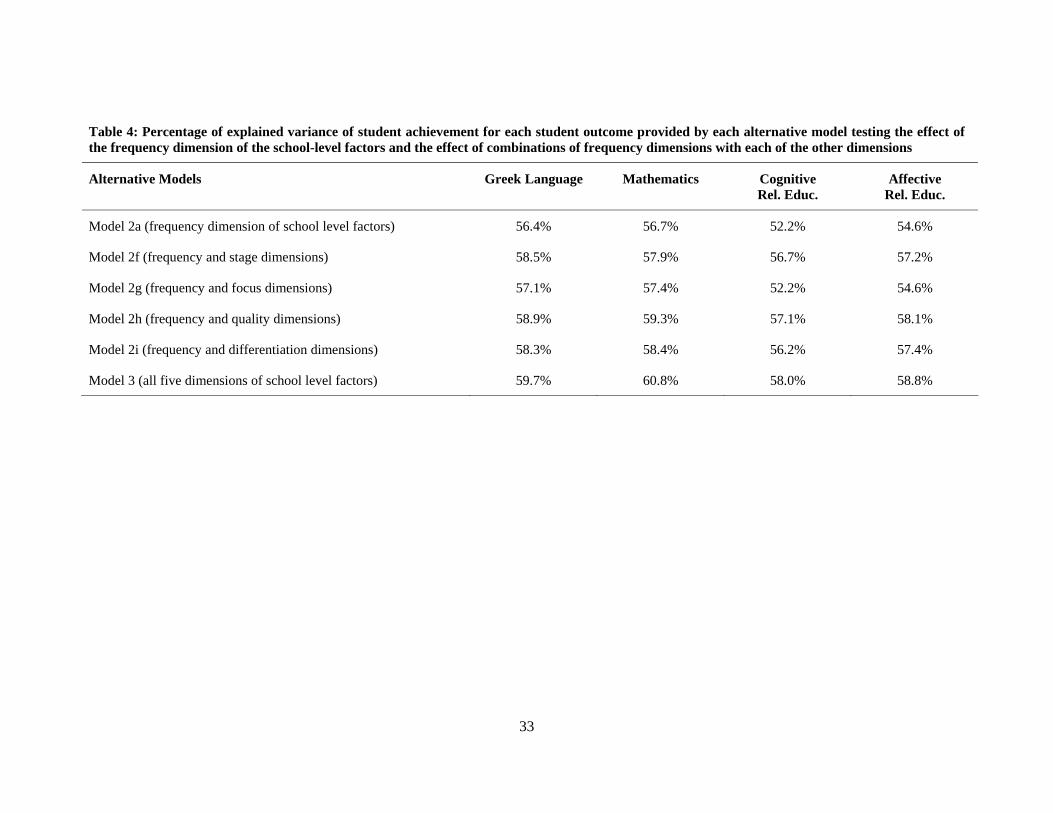
33
Table 4: Percentage of explained variance of student achievement for each student outcome provided by each alternative model testing the effect of the frequency dimension of the school-level factors and the effect of combinations of frequency dimensions with each of the other dimensions
Alternative Models Greek Language Mathematics Cognitive Rel. Educ.
Affective Rel. Educ.
Model 2a (frequency dimension of school level factors) 56.4% 56.7% 52.2% 54.6%
Model 2f (frequency and stage dimensions) 58.5% 57.9% 56.7% 57.2%
Model 2g (frequency and focus dimensions) 57.1% 57.4% 52.2% 54.6%
Model 2h (frequency and quality dimensions) 58.9% 59.3% 57.1% 58.1%
Model 2i (frequency and differentiation dimensions) 58.3% 58.4% 56.2% 57.4%
Model 3 (all five dimensions of school level factors) 59.7% 60.8% 58.0% 58.8%