School Board’s Approved Educational Plan & Budget · The School Board of the City of Norfolk 800...
274
School Board’s Approved Educational Plan & Budget Fiscal Year 2012-2013
Transcript of School Board’s Approved Educational Plan & Budget · The School Board of the City of Norfolk 800...

School Board’s Approved Educational Plan & Budget
Fiscal Year 2012-2013

The School Board of the City of Norfolk 800 East City Hall Avenue
Norfolk, VA 23510 (757) 628-3994 office
(757) 628-3444 fax
[email protected] email www.npsk12.com/schoolboard website
SCHOOL BOARD MEMBERS Dr. Kirk T. Houston, Sr. Chair
Mrs. Suzan M. Kaufman Vice Chair
Dr. Linda Horsey Member
Dr. Linda B. McCluney Member
Dr. Bradbury N. Robinson Member
Dr. Warren A. Stewart Member
Dr. Stephen W. Tonelson Member
June 29, 2012 The Citizens of the City of Norfolk The Honorable Paul D. Fraim The Honorable Anthony L. Burfoot The Honorable Andrew A. Protogyrou The Honorable Paul R. Riddick The Honorable Thomas R. Smigiel The Honorable Theresa W. Whibley The Honorable Angelia M. Williams The Honorable Barclay C. Winn 810 Union Street Norfolk, VA 23510-8035 To the Citizens of the City of Norfolk, Mayor Fraim and Norfolk City Council Members:
On behalf of the School Board of the City of Norfolk, I submit our approved Norfolk Public Schools Operating Budget for the 2012-2013 fiscal year. In developing this spending plan, it was most important to align our resources toward progress on NPS’ Achievable Results, which are:
Achievable Result 1: Norfolk Public Schools will implement, annually monitor, and refine the comprehensive plan for improving on-time graduation for all students.
Achievable Result 2: Norfolk Public Schools will implement, annually monitor, and refine a system of support so that all schools are fully accredited as defined by the Virginia Department of Education.
Achievable Result 3: Norfolk Public Schools will improve the climate of support for the achievement of all students through staff, family, and community engagement.
This has been another challenging budget year. Over the past three years, we have been required to negotiate a nearly $60 million deficit in resources due to reductions in revenue and increases in expenditures. The School Board has expressed grave concerns about the Virginia General Assembly’s strategies and plans for preserving the quality of public education in the Commonwealth.
However, the Board has worked diligently and collaboratively with the Norfolk Public Schools Administration and the City of Norfolk to make the best use of the resources we have in responsible, creative and innovative ways. The city provided additional support, particularly in the form of a commitment to replace a large portion of the school bus fleet in the near future.

Letter from the School Board Chair Page 2 June 29, 2012
[email protected] email www.npsk12.com/schoolboard website
The Board also solicited community input, and focused on the following School Board goals:
Goal #1: Protect Core Instruction, our primary mission.
Goal #2: Attract and retain highly qualified staff to promote the best and the brightest.
Goal #3: Look for efficiencies to create capacity.
Goal #4: Improve the quality of education in an equitable manner.
We believe this budget accomplishes those goals, and we are pleased that we were able to provide a salary increase to our hard-working employees.
This proposed budget also protects:
• Specialty programs at our elementary, middle and high schools.
• Existing transportation for most specialty programs.
• A full-day preschool program.
• Existing athletics at the middle and high schools.
• Advanced Placement, honors and foreign language offerings.
• Class sizes at their current levels.
• Excellent music and art programs.
• The Sixth-Grade Transition program and its transportation.
• Employees’ pay from higher health insurance premiums and state-mandated increases in retirement contributions.
Going forward, the Board has committed to a continuous process of analyzing programs and resources for effectiveness and efficiency. This process begins immediately. As we finalize this plan for fiscal year 2013 funding, we will begin looking ahead to fiscal year 2014 and beyond.
We believe in the power of our school division to contribute to a superior quality of life in this city. In our hands, we hold the futures of thousands of children and their families. We must join together as a community, plan carefully and invest in them.
Sincerely,
Dr. Kirk T. Houston, Sr. School Board Chair

i
TABLE OF CONTENTS
Section PDF Page
City of Norfolk Ordinance No. 44,695…………………………………………………………………….vii
INTRODUCTION
Mission .………………………………………………………………….………………………………….……..… 12 Operating Statement ……………………………………………………………………………………….…. 12 Our Schools …………………………………………………………………………………………………….….. 12 School Board and Superintendent of the City of Norfolk ……………………………….….. 13 Norfolk School Board’s Achievable Results (GOALS) …....................…………………….. 14 Norfolk Public Schools’ Organizational Chart ………………………………………..……………. 15 Superintendent’s Strategic Leadership Team (SLT)………..…...…….…........................ 16 Norfolk Public Schools’ Pathway to Global Competitiveness ……………………………… 17 Accountability ……………………………………………………………………………………………………. 18 Measures of Our Success ……………………………………………………………………………….….. 21 Summary of Standards of Learning Test Pass Rates 2006‐2007 thru 2010‐2011…. 22 Focus: State Accreditation ………………………………………………………………………………….. 23 School Accreditation Ratings for 2010‐2011 ………………………………………………………. 25 Focus: Adequate Yearly Progress ……………………………………………………………………….. 26 Focus: High School Graduates & Graduation Rates ……………………………………..…….. 28 On‐Time Graduation ………………………………………………………………………………………….. 29 Focus: Reading on Grade Level …………………………………………………………………………… 31 Focus: Closing the Achievement Gap ………………………………………………………………….. 32 Achievement Gap Trends in NPS 2006‐2007 thru 2010‐2011 ……………………………... 33 Awards and Recognitions …………………………………………………………………………………… 34 Map of Norfolk Schools ……………………………………………………………………..……………….. 35 Key to Map of Norfolk Schools ……………………………………………………………………………. 36
High School Specialty Programs ………………………………………………………………………….. 37 Middle School Programs …………………………………………………………………………………….. 42 Elementary Schools…….….…………………………………………………………………….……………….43 Early Childhood Center Programs ……………………………………………………………………….. 51 Norfolk Public Schools’ Policy – DB. Annual Budget ……………………………………..……… 52 Code of Virginia, 1950 …………………………………………………………………………………………. 53 Reader’s Guide to the Budget ……………………………………………………………………………… 58
EXECUTIVE SUMMARY
Budget Development Overview ……………………………………………………………………….…. 63 Budget Cycle …………………….………………………………………………………………………………… 65 Budget Development Calendar …………………………………………………………………….…….. 66 Accountability ……………………………………………………………………………………………….……. 67

ii
TABLE OF CONTENTS Section PDF Page EXECUTIVE SUMMARY (Continued)
Budget Components – Funds ………………………………………………………………………….…... 68 All Sources of Revenue Fiscal 2012‐2013 ……………………………………………………….…… 68 FY 2012‐2013 School Board’s Proposed Budget Highlights ……………………...…….…... 69 Full Time Equivalent Operating Budget History ………..……………………………………..….. 70 Summary of Full Time Equivalent by Object ............................................................ 74 Summary of Full Time Equivalents by Program ……………………………..……………………. 75 Revenues Overview …………………………………………………………………………………………..… 76
State Funds ……………………………………………………………………………………………… 77 Federal Funds ……………………………………………………………………………………..…… 78 City Appropriations ……………………………………………………………………………….… 79 Re‐Appropriated Carry Forward Funds…………………………………………………….. 79 Miscellaneous Revenue …………………………………………………………………………… 79 Other Federal, State and Other Grants ………………………………………….………… 80
Expenditures Overview ……………………………………………………………………………………….. 81 Fiscal 2013 Proposed Expenditures by Group ………………………………………… 81 Programs Supported ……………………………………………………………………………….. 82 Fiscal 2012‐2013 Budget by Major Program …………………………………………… 82 Operating Budget – Program Detail ……………………………………………………….… 83 Operating Budget – Object Detail ……………………………………………………………. 84 Per Pupil Expenditures …………………………………………………………………………….. 86 Student Enrollment Projections through Fiscal 2017 ……………………………….. 86
Acknowledgments ………………………………………………………………………………………………. 87 Requests for Information ……………………………………………………………………………………. 87
REVENUE
Revenue Overview ………………………………………………………………………………………………. 88 State Educational Funding Overview …………………………………………………………………… 92 School Operating Budget Revenue History ………………………………………….………………. 92 Composite Index …………………………………………………………………………………………………. 93 Composite Index History …………………………………………………………………………............. 93 Direct Aid to Public Education …………………………………………………………………………….. 94 Standards of Quality .................................................................................................94 Data Requirements for Funding Instructional Costs.……………………………………………..95 Support Positions Funded in the Standards of Quality …………………………..……………. 96 SOQ Model Summary ………………………………………………………………………………………….. 97 State Standards of Quality Budget Detail ……………..……………………………………………… 97

iii
TABLE OF CONTENTS Section PDF Page REVENUE (Continued)
Sales Tax ……………………………………………………………………….…………………….……………... 98 Non‐SOQ State Funding ………………………………………………………………………………………. 99 Categorical Programs …..……………………………………………………………………………..………. 99 Incentive Based Programs ….……………………………………………………………………………….. 100 Other (Incentive and Categorical) State Revenue …………………………………….............. 100 Lottery Funded Programs ……………………………………………………………………………………. 101 Federal Revenue …………………………………………………………………………………………………. 102 City Appropriations …………………………………………………………………………………………….. 103 Re‐Appropriated Carry Forward Funds………………………………………………………………… 104 Miscellaneous Revenue ………………………………………………………………………………………. 105 Other Local Funds Detail ….........………………………………………………………………………….. 105 Operating Revenue All Sources …………………………………………………………………………… 106 Glossary of Terms – Revenue ………………………………………………………………………………. 107
OPERATING EXPENDITURES Operating Expenses……………………………………………………………………………………………… 114
Operating Budget – Program Detail …………………………………………………………………….. 118 Program 110 – Classroom Instruction – Regular ………………………………………………….. 119 Program 121 – Guidance Services ……………………………………………………………………….. 121 Program 122 – Visiting Teachers and School Social Workers ……………………………….. 123 Program 131 – Instructional Support …………………………………………………………………… 125 Program 132 – Media Services ……………………………………………………………………………. 127 Program 141 – Office of the Principal ………………………………………………………………….. 129 Program 170 – Alternative Education ………………………………………………………………….. 131 Program 200 – Special Education ………………………………………………………………………… 133 Program 300 – Career and Technical Education ………………………………………………….. 135 Program 400 – Gifted and Talented …………………………………………………………………….. 137 Program 500 – Athletics and Virginia High School League Activities ……………………. 139 Program 510 – Other Extra Curricular ……………………………………………………………….... 141 Program 600 – Summer School …………………………………………………………………………... 143 Program 700 – Adult Education ………………………………………………………………….……….. 145 Program 800 – Non‐Regular Day School (Pre‐School) ………………………………………..… 147 Program D21 – Central Administration.……………………………………………………………..….149 Program D22 – Student Attendance and Health ………………………………………………..… 151 Program D30 – Pupil Transportation …………………………………………………………………... 153 Program D40 – Operations and Maintenance ……………………………………………………... 155

iv
TABLE OF CONTENTS Section PDF Page OPERATING EXPENDITURES (Continued)
Program D66 – Facility Improvements ………………………………………………………………… 157 Program D80 – Information Technology ……………………………………………………………… 159
GRANTS AND OTHER FUNDS
Grants and Other Funds………………………………………………………………………………………. 162 School Nutrition Program Summary …………………………………………………............……... 163 Summary of School Nutrition Program Funds……….................................................. 164 Summary of American Recovery and Reinvestment Act (ARRA) Funds ………………… 165 Summary of Grants and Special Programs ………………………………………………...………… 166 Federal Grants
Title I, Part A – Improving Basic Skills ………………………………………………………. 169 Title I, Part A – Improving Basic Skills ARRA Funds …………………………………… 170 Title I, School Improvement 1003(a) …...........................…………………………… 171 Title I, School Improvement ARRA 1003(g) .................................................. 172 Title I, Part D – Prevention and Intervention Program …………...................… 173 Title II, Part A – Teacher and Principal Training ………………………………………… 174 Even Start Program at Berkley/Campostella ……………………………………….…… 175 Even Start Program at Ingleside Center …………………………………………….………176 Title VI, Part B – IDEA, Flow‐Through Grant ……………………………………………… 177 Title VI, Part B – IDEA, Flow‐Through ARRA Funds …………………………………… 178 IDEA, Section 619 Pre‐School Incentive ……………………………………………….…… 179 IDEA, Section 619 Pre‐School ARRA Funds …………………………………………….… 180 Adult Literacy and Basic Education ………………………………………………………….. 181 Carl Perkins, Title I …………………………………………………………………………………… 182 Safe and Drug‐Free Schools and Communities Act Grant ……………….………… 183 Early Reading First …………………………………………………………………………………… 184 Enhancing Education Through Technology ………………………………………….…… 185 Enhancing Education Through Technology ARRA Funds …………………………… 187 Fresh Fruit and Vegetable Program ……………………………………………………….… 188 Statewide Longitudinal Data Systems Grant ARRA Funds ………………………… 189 Striving Readers Intervention Initiative ........................................................ 190
State Grants
Children’s Hospital of the King’s Daughters ……………………………………………… 191 Norfolk Juvenile Detention Center School (Net Academy) ……………..………… 192 Tidewater Development Center …………………………………………………….………… 193 Special Education in Jail Program ………………………………………………………..…… 194 Virginia Technology Initiative …………………………………………………………………… 195
v
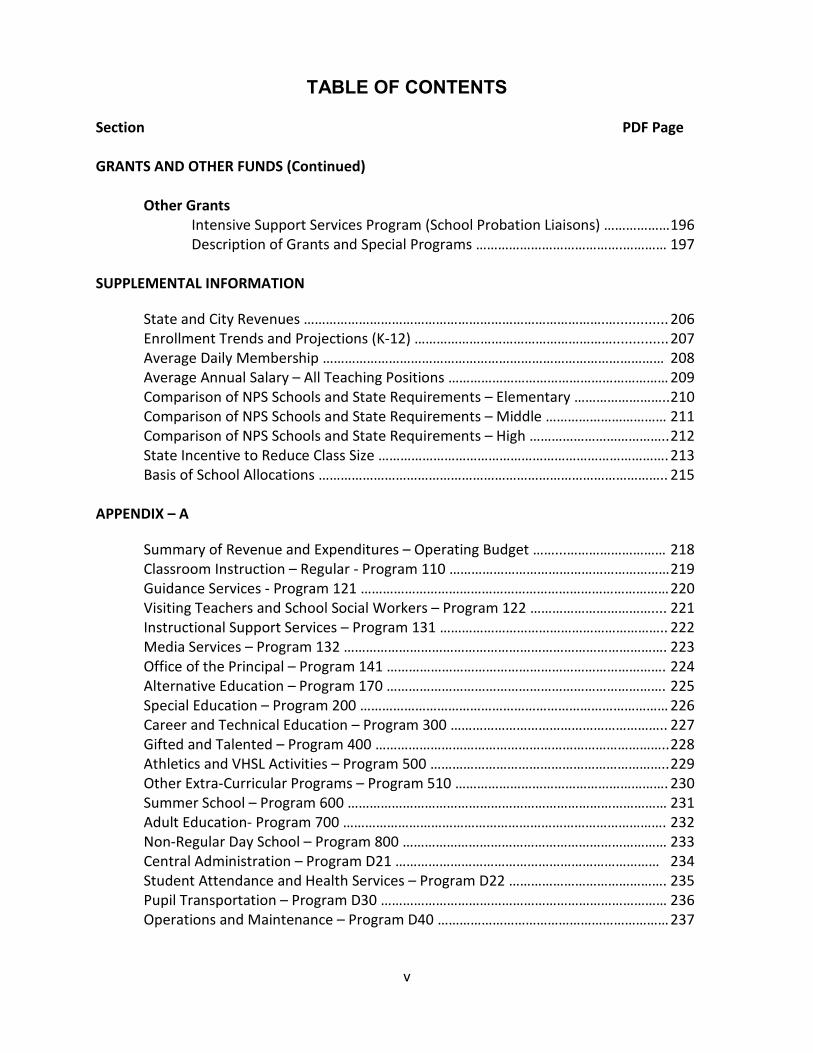
TABLE OF CONTENTS Section PDF Page GRANTS AND OTHER FUNDS (Continued)
Other Grants
Intensive Support Services Program (School Probation Liaisons) ……………… 196 Description of Grants and Special Programs ………………………………….………… 197
SUPPLEMENTAL INFORMATION State and City Revenues ……………………………………………………………………….…............. 206 Enrollment Trends and Projections (K‐12) ……………………………………………….............. 207 Average Daily Membership ………………………………………………………………………………… 208 Average Annual Salary – All Teaching Positions …………………………………………………… 209 Comparison of NPS Schools and State Requirements – Elementary …………………….. 210 Comparison of NPS Schools and State Requirements – Middle …………………………… 211 Comparison of NPS Schools and State Requirements – High ……………………………….. 212 State Incentive to Reduce Class Size ……………………………………………………………………. 213 Basis of School Allocations ………………………………………………………………………………….. 215
APPENDIX – A Summary of Revenue and Expenditures – Operating Budget ……...……………………… 218 Classroom Instruction – Regular ‐ Program 110 …………………………………………………… 219 Guidance Services ‐ Program 121 ………………………………………………………………………… 220 Visiting Teachers and School Social Workers – Program 122 …………………………….... 221 Instructional Support Services – Program 131 …………………………………………………….. 222 Media Services – Program 132 ……………………………………………………………………………. 223 Office of the Principal – Program 141 …………………………………………………………………. 224 Alternative Education – Program 170 …………………………………………………………………. 225 Special Education – Program 200 ………………………………………………………………………… 226 Career and Technical Education – Program 300 ………………………………………………….. 227 Gifted and Talented – Program 400 …………………………………………………………………….. 228 Athletics and VHSL Activities – Program 500 ……………………………………………………….. 229 Other Extra‐Curricular Programs – Program 510 …………………………………………………. 230 Summer School – Program 600 …………………………………………………………………………… 231 Adult Education‐ Program 700 ……………………………………………………………………………. 232 Non‐Regular Day School – Program 800 ……………………………………………………………… 233 Central Administration – Program D21 ……………………………………………………………… 234 Student Attendance and Health Services – Program D22 ……………………………………. 235 Pupil Transportation – Program D30 …………………………………………………………………… 236 Operations and Maintenance – Program D40 ……………………………………………………… 237
vi
TABLE OF CONTENTS
Section PDF Page APPENDIX – A (Continued)
Child Nutrition Services – Program D51 ………………………………………………………………. 239 Community Services – Program D53 ……………………………………………………………………. 239 Facility Improvements – Program D66 ………………………………………………………………… 240 Information Technology – Program D80 ……………………………………………………………… 241
APPENDIX – B
Title I, Part A – Improving Basic Programs …………………………………………………………… 242 Title I, Part A – School Improvement Funds 1003(a) ................................................ 243 Title I, Part A – School Improvement ARRA Funds 1003(g) ...................................... 244 Title I, Part D – Prevention and Intervention Program …………………………………………. 245 Title II, Part A – Teacher and Principal Training ……………………………………………………. 246 Title III, Part A – Limited English Proficient and Immigrant Youth……………………….. 247 Title X, Part C – Stuart McKinney Homeless Assistance Grant………………………………. 248 Even Start Program at Berkley/Campostella ………………………………………………………… 249 Even Start Program at Ingleside ……………………………………………………………………………250 Title VI, Part B – IDEA, Flow‐Through Grant …………………………………………………………. 251 IDEA, Section 619 Pre‐School Incentive A & B ……………………………………………………... 252 Adult Literacy and Basic Education Grant ……………………………………………………………. 253 Carl Perkins Vocational and Applied Tech Act ……………………………………………………... 254 Safe and Drug‐Free Schools and Communities Act Grant ..…………………………………… 255 Early Reading First ………………………………………………………………………………………………. 256 Enhancing Education Through Technology ………………………………………………………….. 257 Enhancing Educational Technology………………………………………………………………………. 258 Statewide Longitudinal Data Systems Grant – ARRA Funds………………………………… 259 Striving Readers Intervention Initiative ................................................................... 260 General Adult Education ……………………………………………………………………………………… 261 Industry Credential Test ………………………………………………………………………….…………… 262 State Categorical Equipment ………………………………………………………………………………. 263 Race to GED ………………………………………………………………………………………………………… 264 Children’s Hospital of the King’s Daughters …………………………………………………………. 265 Norfolk Detention Center School ………………………………………………………………………… 266 Tidewater Development Center ………………………………………………………………………….. 267 Special Education in Jail Program ……………………………………………………………….……….. 268 Virginia Technology Initiative ………………………………………………………………………………. 269 ISAEP‐GED …………………………………………………………………………………………………………… 270 School Probation Liaisons …………………………………………………………………………………… 271 Teacher Mentor Program ……………………………………………………………………………………. 272
vii
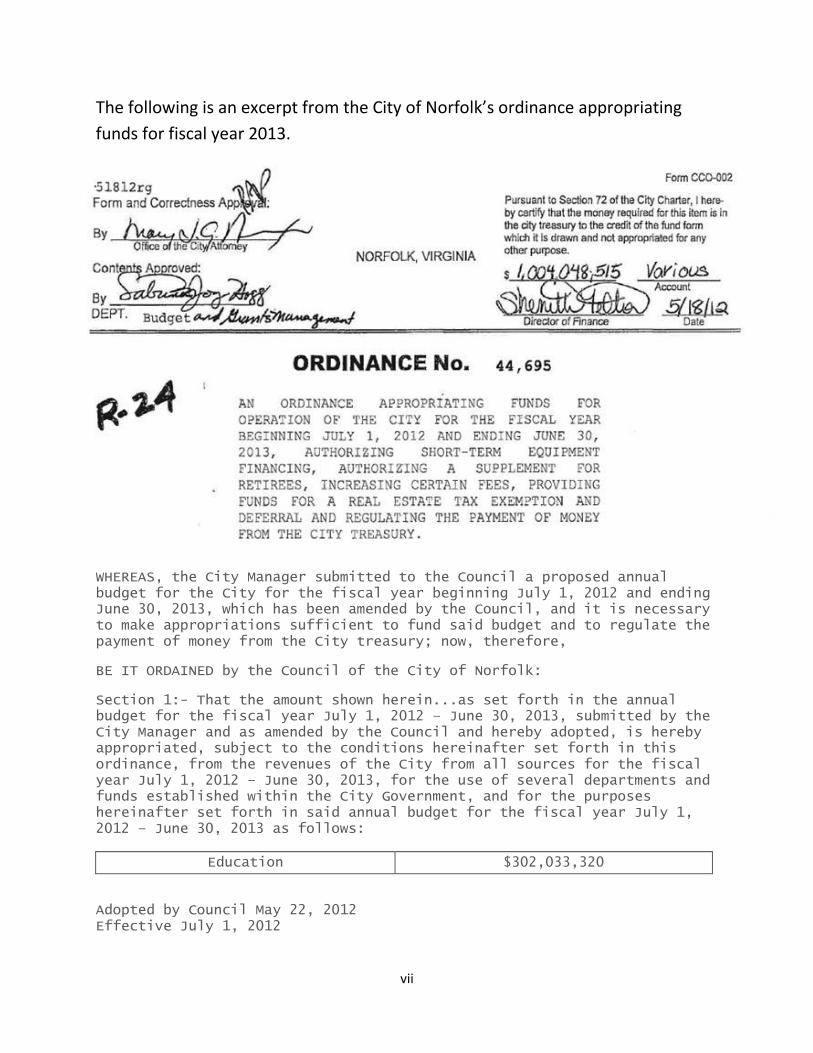
The following is an excerpt from the City of Norfolk’s ordinance appropriating funds for fiscal year 2013.
WHEREAS, the City Manager submitted to the Council a proposed annual budget for the City for the fiscal year beginning July 1, 2012 and ending June 30, 2013, which has been amended by the Council, and it is necessary to make appropriations sufficient to fund said budget and to regulate the payment of money from the City treasury; now, therefore,
BE IT ORDAINED by the Council of the City of Norfolk:
Section 1:- That the amount shown herein...as set forth in the annual budget for the fiscal year July 1, 2012 – June 30, 2013, submitted by the City Manager and as amended by the Council and hereby adopted, is hereby appropriated, subject to the conditions hereinafter set forth in this ordinance, from the revenues of the City from all sources for the fiscal year July 1, 2012 – June 30, 2013, for the use of several departments and funds established within the City Government, and for the purposes hereinafter set forth in said annual budget for the fiscal year July 1, 2012 – June 30, 2013 as follows:
Education $302,033,320
Adopted by Council May 22, 2012 Effective July 1, 2012

viii
This page intentionally left blank.

12
NORFOLK PUBLIC SCHOOLS – Nationally Recognized. Globally Competitive.
Norfolk Public Schools Mission To educate each student to be a successful, productive contributor to society by providing powerful teaching and learning opportunities.
Quality Teaching and Learning for ALL…ALL Means ALL
Operating Statement Norfolk Public Schools will become a “world class” educational system. In a world class school district:
• All students possess the habits of powerful literacy • All achievement gaps are closed • All schools exceed state and national performance standards • All students access exciting options and opportunities upon graduation
Our Schools Norfolk Public Schools (NPS) is the largest urban school division in the Commonwealth of Virginia and the seventh largest division overall. The division enrolls a racially and economically diverse population of approximately 33,000 total students supported by a staff of more than 4,600 employees in 55 facilities. The educational philosophy of the division is based on the belief that all children can achieve at high levels and that it is the responsibility of the staff and community to ensure that each child reaches his/her highest potential. Norfolk Public Schools has a variety of programs to meet the needs of students. Programs within the regular schools include those for students with special needs, English as a Second Language, Title I, and Gifted Education. Auxiliary facilities house alternative programs for students who have not succeeded in the regular education setting as well as opportunities for trade and technical education. There are full-day kindergarten programs in all elementary schools. There are two early childhood centers for three and four year old children and pre-kindergarten programs in most elementary schools. K-12 Average Daily Membership (ADM) numbers (ADM = days membership divided by days taught) is projected to decrease in FY 2012-2013 from projected FY 2011-2012. ADM is what the State uses for revenue calculations. The projected ADM for FY 2012-2013 is 30,200, a decrease of 249 students.

13
NORFOLK PUBLIC SCHOOLS – Nationally Recognized. Globally Competitive.
School Board and Superintendent of the City of Norfolk
REV. DR. KIRK T. HOUSTON, SR.
Chair (2010)
Appointed to the Board: July 1, 2009
MRS. SUZAN M. KAUFMAN
Vice Chair (2011) Appointed to the Board: July 1, 2010
DR. STEPHEN W. TONELSON
Board Member Appointed to the Board: July 1, 2006
DR. LINDA B. McCLUNEY
Board Member Appointed to the Board: July 1, 2006
DR. LINDA HORSEY
Board Member Appointed to the Board: July 1, 2010
DR. BRAD N. ROBINSON
Board Member Appointed to the Board: July 1, 2011
DR. WARREN A. STEWART
Board Member Appointed to the Board: July 1, 2011
MR. MICHAEL SPENCER
Interim Superintendent Effective: January 1, 2012
Seven school board members are appointed by the City Council. Board members elect the chairperson. A public hearing is required at least seven days prior to the appointment of any member and public notice must be given at least ten days prior to the public hearing. School Board members serve under oath of office and must reside in the City of Norfolk as they serve their two- year terms.
The School Board sets policies and approves the operating budget for Norfolk Public Schools. The group is responsible for setting guidelines that assure the proper administration of the educational programs of Norfolk Public Schools and for reporting a statement of finances to the City Council, the Director of Finance and to the City Manager. The Board approves the hiring of a staff to administer and carry out the Board’s current policies and also approves the budget that is necessary to implement educational programs.

14
NORFOLK PUBLIC SCHOOLS – Nationally Recognized. Globally Competitive.
NNoorrffoollkk PPuubblliicc SScchhoooollss
22001122--22001133 AAcchhiieevvaabbllee RReessuullttss ((GGOOAALLSS))
Achievable Result #1: Norfolk Public Schools (NPS) will implement, annually monitor, and refine the comprehensive plan for improving on-time graduation for all students. Achievable Result #2: Norfolk Public Schools (NPS) will implement, annually monitor, and refine a system of support so that all schools are fully accredited as defined by VDOE. Achievable Result #3: Norfolk Public Schools (NPS) will improve the climate of support for the achievement of all students through staff, family, and community engagement.
Action Steps Taken to Reach Achievable Results
• A review of all programs to ensure that staff members are focused on preventing students from failing, intervening when children get off track, and recovering students who have failed or dropped out
• Re-training district administrators and teachers on using student achievement data to target instruction and on best practices for reading and math instruction
• Hiring additional staff to support on-time graduation, including five graduation coaches - one at each high school
• Increased communication with parents regarding how to help their children succeed
• A district-wide and community-wide focus on improved attendance because poor attendance is a top risk factor for dropping out
• An instructional audit in all kindergarten through third grade classrooms, focusing on reading instruction
• Expansion of the data system used to locate students who have dropped out
• A pilot of positive student behavior program with a goal of having positive behavior models in place at schools by next year
• Additional support from Norfolk administration and the Virginia Department of Education at schools not making accreditation
15
NORFOLK PUBLIC SCHOOLS – Nationally Recognized. Globally Competitive.
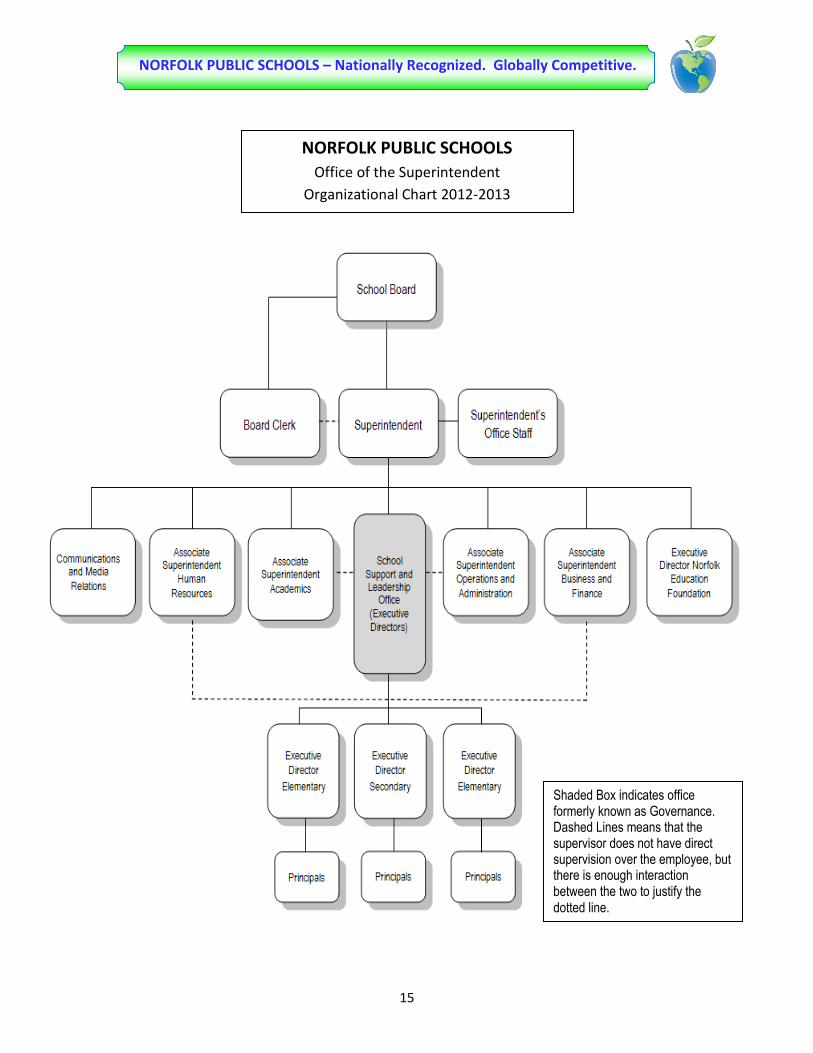
NORFOLK PUBLIC SCHOOLS Office of the Superintendent
Organizational Chart 2012-2013
Shaded Box indicates office formerly known as Governance. Dashed Lines means that the supervisor does not have direct supervision over the employee, but there is enough interaction between the two to justify the dotted line.

16
NORFOLK PUBLIC SCHOOLS – Nationally Recognized. Globally Competitive.
Strategic Leadership Team
Mr. Michael Spencer Interim Superintendent of Schools
Dr. Patricia Dillard Interim Executive Director, Human Resources
Dr. Christine Harris Associate Superintendent Academics
Mr. John Maniscalco Associate Superintendent Business and Finance
Mr. John Hazelette Interim Associate Superintendent Operations and Administration
Other Members
Mrs. Karren Bailey Executive Director, Strategic Evaluation, Assessment, Support Ms. Junelle Banks Clerk of the School Board Dr. Sharon Byrdsong Executive Director, Secondary Schools Mr. Robert Clinebell Director, Transportation Dr. Lisa Corbin Senior Director, Curriculum & Professional Development Mrs. Wendy Dingle 2011 Teacher of the Year, Maury High School Mr. Thomas Calhoun American Federation of Teachers Mrs. Rhonda R. Ingram Senior Director, Budget Mrs. Shirley George Education Association of Norfolk Dr. Lynnell Gibson Secondary Principals Association Dr. Gale Lee Senior Director, Compensatory Programs Mrs. Elizabeth Mather Senior Director, Communications and Media Relations Mrs. Cheryl Jordan Elementary Principals Association Dr. Carolyn Taylor Executive Director, Elementary Schools Mrs. Lillian Thomas Executive Director, Elementary Schools Dr. Sandra Witcher Senior Director, Special Education

17
NORFOLK PUBLIC SCHOOLS – Nationally Recognized. Globally Competitive.

18
NORFOLK PUBLIC SCHOOLS – Nationally Recognized. Globally Competitive.
Accountability
In 2000-01, NPS began an ambitious journey of developing a comprehensive accountability system. A stakeholder-driven Quality Improvement Council was charged with creating the accountability plan. The system was under development and dissemination for a year prior to full implementation during the 2001-02 academic years. The annual cycle begins with the review of past performance, moves to the development of school and department accountability plans, and ends with school, departmental, and division performance reports that summarize progress made during the past year. The NPS accountability system is based on a three-tiered approach. Tier 1 includes state and division-level indicators, which serve as performance measures for actions required by federal and state mandates and local School Board regulations. Examples of Tier 1 indicators include results from the SOL tests, SAT and Advanced Placement Test results, attendance, graduation and dropout rates, and student discipline data, among others. Tier 2 indicators allow schools and central office departments to set goals for continuous improvement and to measure and report progress. Schools and offices have the latitude to choose seven Tier 2 indicators. Tier 3 is the narrative portion of the accountability system. Narratives provided by schools and departments provide contextual information that complements the numerical indicators and afford schools and departments the opportunity to report on special programs, projects, or strategies that may be unique. Norfolk Public Schools entered into a partnership with the Panasonic Foundation (PF) in 2001 to facilitate our journey. The Foundation partners with a small number of districts nationally that have a commitment to “breaking the links between race, poverty, and barriers to improving student achievement”. Panasonic Foundation’s assistance comes in the form of consultants who work with districts continuously to build capacity at the system level. Consultants work with boards, senior leadership, professional associations and the community. In addition to providing regular support in the district, PF sponsors the Leadership Associates Program (LAP) to further develop the leadership capacity of district teams. LAP Institutes are held three times during the school year and provide opportunities for intensive learning and charting partnership progress. Since its inception, the focus of the NPS/PF partnership has been the development of systems to raise the achievement of all students in a nationally recognized school division. The value-

19
NORFOLK PUBLIC SCHOOLS – Nationally Recognized. Globally Competitive.
Accountability - Continued
added to the division’s efforts by the partnership were measured by annual “achievable results” that are agreed upon jointly by division leaders and PF consultants. In May 2005, with the arrival of Superintendent, Dr. Stephen Jones, the partnership focus evolved by establishing the four targets to better define the meaning of a world-class school division. Today, progress toward achieving these targets has become the metric for assessing growth. The targets were the first step in the NPS strategic-planning process. In a world-class school district:
● All students possess the habits of powerful literacy
● All achievement gaps are eliminated while increasing achievement for all
● All schools meet and exceed local, state, national, and international benchmarks
● All students are prepared to access productive options and opportunities upon graduation
Benchmarks were created to help gauge progress toward accomplishing the NPS mission and these benchmarks guide the Strategic Leadership Team (SLT), a committee of central office leaders, who monitors progress. Further work with the Panasonic Foundation has resulted in the development of achievable results (AR). The achievable results will serve as the focus of future accountability efforts and are as follows:
• AR 1: Norfolk Public Schools (NPS) will implement, annually monitor, and refine the comprehensive plan for improving on-time graduation for all students.
• AR 2: Norfolk Public Schools(NPS) will implement, annually monitor, and refine a system of support so that all schools are fully accredited as defined by the Virginia Department of Education (VDOE)
• AR 3: Norfolk Public Schools (NPS) will improve the climate of support for the achievement of all students though staff, family, and community engagement.

20
NORFOLK PUBLIC SCHOOLS – Nationally Recognized. Globally Competitive.
Accountability - Continued
These achievable results are monitored on a monthly basis during the Panasonic partnership team site visits along with the district’s Strategic Leadership Team (SLT). The district also participates in the Leadership Associates Program offered by the Foundation in the fall and spring as an opportunity to bring together all partnership districts to engage in learning opportunities among each other and from leading educational experts. Norfolk Public Schools and the Panasonic Foundation have enjoyed a partnership that has supported the district’s work in improving student achievement for “All Means All” students.
21
NORFOLK PUBLIC SCHOOLS – Nationally Recognized. Globally Competitive.
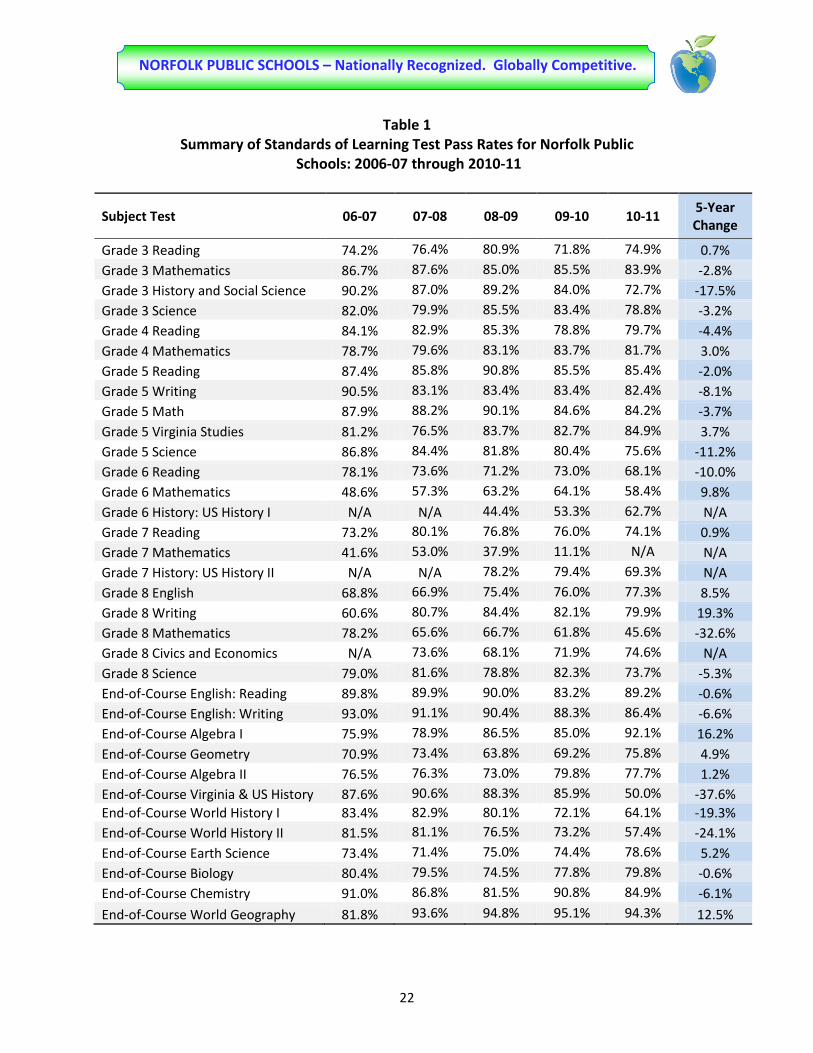
Measures of Our Success
Standards of Learning Test Results The scores presented in Table 1 are the results from first-time test-takers. As a result, the figures reported in Table 1 will differ slightly from overall scores used for the determination of state accreditation and Annual Yearly Progress (AYP) under the No Child Left Behind Act (NCLB). The largest improvements were in grade Eight Writing, Algebra I and World Geography, while the largest declines were for Grade 8 Mathematics, Virginia and US History and World Geography. The results in Table 1 illustrate a five-year pass rate improvement for 14 of 31 subjects tested during the past five years. The largest improvements have been in Grade 6 Mathematics, World Geography and Grade 4 Mathematics. Double digit pass rate declines took place in Grade 7 Mathematics, Grade 8 Mathematics, and World History II.
22
NORFOLK PUBLIC SCHOOLS – Nationally Recognized. Globally Competitive.
Table 1 Summary of Standards of Learning Test Pass Rates for Norfolk Public
Schools: 2006-07 through 2010-11
Subject Test 06-07 07-08 08-09 09-10 10-11 5-Year Change
Grade 3 Reading 74.2% 76.4% 80.9% 71.8% 74.9% 0.7% Grade 3 Mathematics 86.7% 87.6% 85.0% 85.5% 83.9% -2.8% Grade 3 History and Social Science 90.2% 87.0% 89.2% 84.0% 72.7% -17.5% Grade 3 Science 82.0% 79.9% 85.5% 83.4% 78.8% -3.2% Grade 4 Reading 84.1% 82.9% 85.3% 78.8% 79.7% -4.4% Grade 4 Mathematics 78.7% 79.6% 83.1% 83.7% 81.7% 3.0% Grade 5 Reading 87.4% 85.8% 90.8% 85.5% 85.4% -2.0% Grade 5 Writing 90.5% 83.1% 83.4% 83.4% 82.4% -8.1% Grade 5 Math 87.9% 88.2% 90.1% 84.6% 84.2% -3.7% Grade 5 Virginia Studies 81.2% 76.5% 83.7% 82.7% 84.9% 3.7% Grade 5 Science 86.8% 84.4% 81.8% 80.4% 75.6% -11.2% Grade 6 Reading 78.1% 73.6% 71.2% 73.0% 68.1% -10.0% Grade 6 Mathematics 48.6% 57.3% 63.2% 64.1% 58.4% 9.8% Grade 6 History: US History I N/A N/A 44.4% 53.3% 62.7% N/A Grade 7 Reading 73.2% 80.1% 76.8% 76.0% 74.1% 0.9% Grade 7 Mathematics 41.6% 53.0% 37.9% 11.1% N/A N/A Grade 7 History: US History II N/A N/A 78.2% 79.4% 69.3% N/A Grade 8 English 68.8% 66.9% 75.4% 76.0% 77.3% 8.5% Grade 8 Writing 60.6% 80.7% 84.4% 82.1% 79.9% 19.3% Grade 8 Mathematics 78.2% 65.6% 66.7% 61.8% 45.6% -32.6% Grade 8 Civics and Economics N/A 73.6% 68.1% 71.9% 74.6% N/A Grade 8 Science 79.0% 81.6% 78.8% 82.3% 73.7% -5.3% End-of-Course English: Reading 89.8% 89.9% 90.0% 83.2% 89.2% -0.6% End-of-Course English: Writing 93.0% 91.1% 90.4% 88.3% 86.4% -6.6% End-of-Course Algebra I 75.9% 78.9% 86.5% 85.0% 92.1% 16.2% End-of-Course Geometry 70.9% 73.4% 63.8% 69.2% 75.8% 4.9% End-of-Course Algebra II 76.5% 76.3% 73.0% 79.8% 77.7% 1.2% End-of-Course Virginia & US History 87.6% 90.6% 88.3% 85.9% 50.0% -37.6% End-of-Course World History I 83.4% 82.9% 80.1% 72.1% 64.1% -19.3% End-of-Course World History II 81.5% 81.1% 76.5% 73.2% 57.4% -24.1% End-of-Course Earth Science 73.4% 71.4% 75.0% 74.4% 78.6% 5.2% End-of-Course Biology 80.4% 79.5% 74.5% 77.8% 79.8% -0.6% End-of-Course Chemistry 91.0% 86.8% 81.5% 90.8% 84.9% -6.1%
End-of-Course World Geography 81.8% 93.6% 94.8% 95.1% 94.3% 12.5%

23
NORFOLK PUBLIC SCHOOLS – Nationally Recognized. Globally Competitive.
Focus: State Accreditation The Commonwealth of Virginia has two accountability systems that support teaching and learning using the SOL test and assessing student achievement annually. Virginia schools receive two annual accountability ratings based on student performance on the SOL tests and other statewide assessments. Individual schools receive a state accreditation rating reflecting achievement in English, history/social science, mathematics, and science. Individual schools and school districts also receive a rating based on progress made toward the goals of the No Child Left Behind Act of 2001 (NCLB).
Accreditation ratings are based on student achievement in the tested subject areas during the previous academic year and may also reflect a three-year average of achievement. Adjustments are made for limited English proficiency students, transferred students, and students who are successful in re-taking an SOL test. Each year, schools can achieve one of four ratings:
Fully Accredited - High schools and schools with a graduating class are Fully Accredited if students achieve pass rates of 70 percent or more in all four content areas and attain a point value of 85 or greater based on the Graduation and Completion Index (GCI). Middle schools are Fully Accredited if students achieve adjusted pass rates of 70 percent or above in all four content areas.
A combined pass rate of at least 75 percent on English tests in grades 3 - 5 is required for full accreditation at the elementary school level, and for other schools with students in these grades. Elementary schools also must achieve a pass rate of at least 70 percent in mathematics and in Grade 5 Science and Grade 5 History, and pass rates of at least 50 percent in Grade 3 Science and Grade 3 History.
Accredited with Warning - A school receives this rating if pass rates are below the achievement levels required for full accreditation.
Accreditation Denied - A school is denied accreditation if it fails to meet the requirements to be rated fully accredited for three consecutive years. Conditionally Accredited - New schools that are comprised of students from one or more existing schools will be awarded this status for one year pending an evaluation of the performance of students on SOL tests and other statewide assessments. This rating may also be awarded to a school that is being reconstituted.

24
NORFOLK PUBLIC SCHOOLS – Nationally Recognized. Globally Competitive.
Focus: State Accreditation - Continued The accreditation status for all Norfolk schools is summarized below. For the 2011-12 school year 78% of the schools were fully accredited (35/45). With the addition of a graduation index this year, two high schools were slightly below the state’s standard for on-time-graduation, and hence missed accreditation due to this measure.
16%
29%
55%
73%
96%
86% 86%90% 90%
94%
78%
0%
10%
20%
30%
40%
50%
60%
70%
80%
90%
100%
Perc
ent o
f Sch
ools

25
NORFOLK PUBLIC SCHOOLS – Nationally Recognized. Globally Competitive.
NOTE: Red Highlights indicate non-accredited areas; blue highlights indicate provisional accreditation due to school’s graduation rate.
School Accreditation Ratings for 2010-2011 Accreditation ratings are based on the achievement of students on tests taken during the previous academic year and may also reflect a three year average of achievement. Adjustments also may be made for students with limited English proficiency and for students who have recently transferred into a Virginia public school. Accreditation ratings also reflect the success of a school in preparing students for retakes of Standards of Learning (SOL) tests.
School Name School Accreditation
Rating 2011-12 Pass Rate for English
Pass Rate for Math
Pass Rate for History Pass Rate for Science
Grade 3 Grade
6,8,EOC Grade 3 Grade
6,8,EOC Graduatio
n Index
B.T. Washington High Accredited w/Warning 89 73
73
75 76
Granby High Accredited w/Warning 88 84
70
83 75 Lake Taylor High Provisionally Accredited 88 87
70
81 82
Maury High Provisionally Accredited 90 88
70
84 84
Norview High Fully Accredited 94 92
80
88 86
Azalea Gardens Middle Fully Accredited 79 70
74
87
Blair Middle Fully Accredited 80 74
76
90
Lafayette-Winona Middle Accreditation Denied 74 72
60
79
Lake Taylor Middle Accredited w/Warning 73 63
73
82
Northside Middle Fully Accredited 84 79
76
90
Norview Middle Fully Accredited 78 73
71
89
W.H. Ruffner Middle Accredited w/Warning 71 65
61
84
Bay View Elem Fully Accredited 89 89 81 96 84 93
Camp Allen Elem Fully Accredited 81 81 80 78 79 78
Campostella Elem Accredited w/Warning 62 72 68 75 57 42
Chesterfield Academy Elem Fully Accredited 79 86 75 84 82 75
Coleman Place Elem Fully Accredited 87 86 67 83 81 77
Crossroads Elem Fully Accredited 87 85 73 96 87 83
Fairlawn Elem Fully Accredited 82 83 90 89 85 80
Ghent Elem Fully Accredited 94 93 81 91 87 94
Granby Elem Fully Accredited 86 81 75 96 73 84
Ingleside Elem Fully Accredited 89 86 74 86 84 76
Jacox Elementary Fully Accredited 77 75 55 77 69 74
James Monroe Elem Fully Accredited 84 82 88 92 86 78
Larchmont Elem Fully Accredited 96 96 96 97 96 92
Larrymore Elem Fully Accredited 89 92 82 92 84 84
Lindenwood Elem Conditionally Accredited 73 70 81 79 81 70
Little Creek Elem Fully Accredited 82 82 74 77 76 76
Mary Calcott Elem Fully Accredited 93 96 87 99 93 92
Norview Elem Fully Accredited 83 83 67 82 81 81
Ocean View Elem Fully Accredited 93 93 87 98 92 90
Oceanair Elem Fully Accredited 84 82 76 90 85 87
P.B. Young, Sr. Elem Fully Accredited 76 77 64 77 72 75
Poplar Halls Elem Fully Accredited 82 82 63 86 83 84
Richard Bowling Elem Fully Accredited 80 81 56 79 70 73
Sewells Point Elem Fully Accredited 87 93 86 97 92 92
Sherwood Forest Elem Fully Accredited 82 88 69 93 86 75
St. Helena Elem Fully Accredited 84 84 82 83 94 77
Suburban Park Elem Fully Accredited 78 80 69 81 78 72
Tanners Creek Elem Fully Accredited 81 83 74 82 78 72
Tarrallton Elem Fully Accredited 85 90 79 96 89 94
Tidewater Park Elem Accredited w/Warning 59 62 66 55 70 50
W.H. Taylor Elem Fully Accredited 88 87 82 91 85 90
Willard Model Elem Fully Accredited 86 84 78 91 75 88
Willoughby Elem Fully Accredited 90 95 89 96 85 100

26
NORFOLK PUBLIC SCHOOLS – Nationally Recognized. Globally Competitive.
Focus: Adequate Yearly Progress
Adequate Yearly Progress (AYP) can be achieved by meeting or exceeding the pre-set benchmarks in reading and mathematics. These benchmarks are known as Annual Measurable Objectives (AMOs) (Table 2). There are a total of 29 benchmarks that a school, division, and the state need to meet or exceed in order to achieve AYP status. Missing just one benchmark will result in not making AYP. Adequate Yearly Progress applies to all students, including those with disabilities, students who are limited-English proficient, students who are economically disadvantaged, as well as Caucasian, African-American, and Hispanic students. The following is a brief summary of NCLB requirements:
• NCLB requires annual testing in grades 3-8 and at least once in high school to measure student progress in reading and mathematics. The law also requires states to test all students in science at least once in elementary school, once in middle school and once in high school.
• NCLB requires all students to be proficient in reading and mathematics by 2013-2014.
• NCLB requires schools, school divisions and states to meet annual objectives for AYP for student performance on statewide tests in reading and mathematics.
• NCLB requires the identification of states, schools and school divisions making and not making AYP.
The Norfolk Public Schools’ AYP targets for the 2011-2012 school year found in Table 2 are based on achievement test results of students on tests taken during the previous academic year or may reflect a three-year average of achievement. Achievement must equal or exceed the AMO. The Virginia Department of Education provides additional information on accreditation and AYP at http://www.doe.virginia.gov/VDOE/scr/vps-accountability.pdf . Norfolk Public Schools had 9 schools meet all 29 benchmarks for AYP in the 2011-2012 school year. At the district level, NPS met 17 out of 29 benchmarks and, therefore, did not make AYP. While NPS has made great progress in reaching accreditation standards, the ever-increasing benchmarks for AYP remain a challenge.

27
NORFOLK PUBLIC SCHOOLS – Nationally Recognized. Globally Competitive.
37%
73%
86% 88%
78%
63%67%
42%
0%
10%
20%
30%
40%
50%
60%
70%
80%
90%
100%
2003-04 2004-05 2005-06 2006-07 2007-08 2008-09 2009-10 2010-2011
NCLB - Adequate Yearly Progress
Made AYP
Table 2
Virginia Annual Measurable Objectives Used to Determine Adequate Yearly Progress for Reading & Language Arts and Mathematics: 2005-06 through 2013-14
Subject 2005-
06 2006-
07 2007-
08 2008-
09 2009-
10 2010-
11 2011-
12 2012-
13 2013-
14
Reading 69.0 73.0 77.0 81.0 > 81 85.0 TBD TBD TBD
Mathematics 67.0 71.0 75.0 79.0 >79 85.0 TBD TBD TBD
28
NORFOLK PUBLIC SCHOOLS – Nationally Recognized. Globally Competitive.
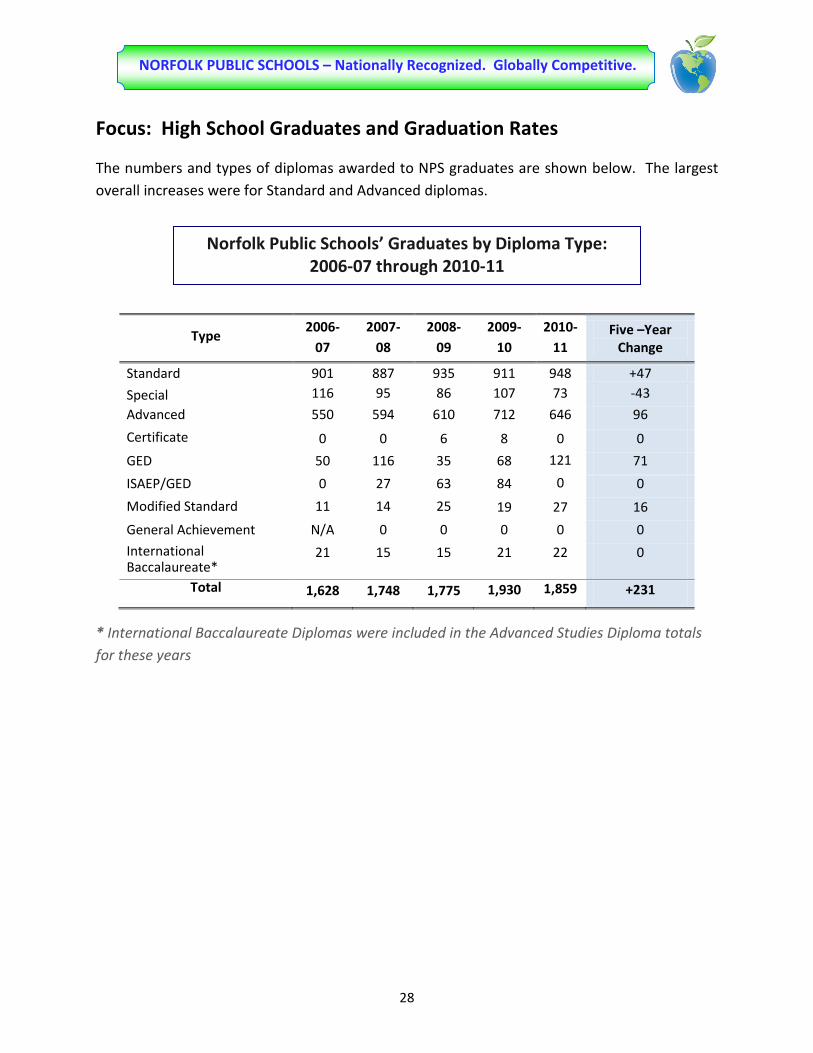
Focus: High School Graduates and Graduation Rates
The numbers and types of diplomas awarded to NPS graduates are shown below. The largest overall increases were for Standard and Advanced diplomas.
Type 2006-
07 2007-
08 2008-
09 2009-
10 2010-
11 Five –Year
Change
Standard 901 887 935 911 948 +47
Special 116 95 86 107 73 -43
Advanced 550 594 610 712 646 96
Certificate 0 0 6 8 0 0
GED 50 116 35 68 121 71
ISAEP/GED 0 27 63 84 0 0
Modified Standard 11 14 25 19 27 16
General Achievement N/A 0 0 0 0 0
International Baccalaureate*
21 15 15 21 22 0
Total 1,628 1,748 1,775 1,930 1,859 +231
* International Baccalaureate Diplomas were included in the Advanced Studies Diploma totals for these years
Norfolk Public Schools’ Graduates by Diploma Type: 2006-07 through 2010-11
29
NORFOLK PUBLIC SCHOOLS – Nationally Recognized. Globally Competitive.
72.1 73.8 73.683.2 85.5 86.6
0102030405060708090
100
2008-09 2009-10 2010-11
Gra
duat
ion
Perc
ent
Norfolk On-Time Graduation Rate Virginia On-Time Graduation Rate
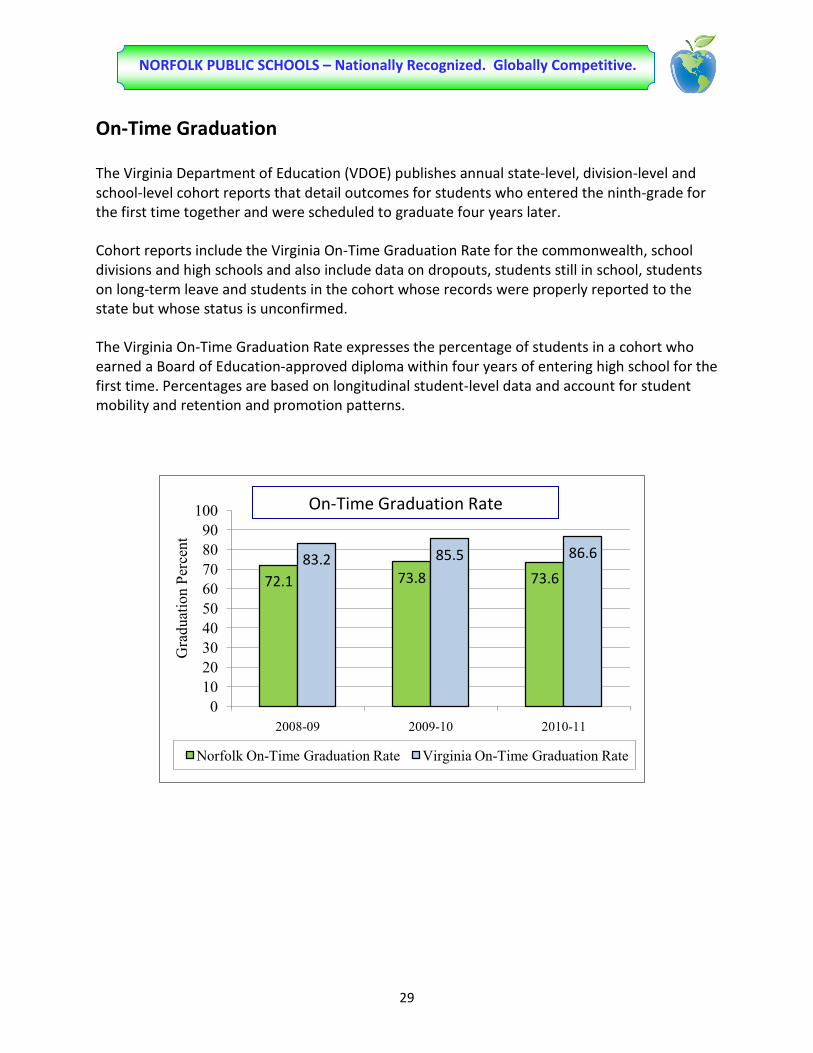
On-Time Graduation
The Virginia Department of Education (VDOE) publishes annual state-level, division-level and school-level cohort reports that detail outcomes for students who entered the ninth-grade for the first time together and were scheduled to graduate four years later.
Cohort reports include the Virginia On-Time Graduation Rate for the commonwealth, school divisions and high schools and also include data on dropouts, students still in school, students on long-term leave and students in the cohort whose records were properly reported to the state but whose status is unconfirmed.
The Virginia On-Time Graduation Rate expresses the percentage of students in a cohort who earned a Board of Education-approved diploma within four years of entering high school for the first time. Percentages are based on longitudinal student-level data and account for student mobility and retention and promotion patterns.
On-Time Graduation Rate
30
NORFOLK PUBLIC SCHOOLS – Nationally Recognized. Globally Competitive.
Focus: High School Graduates and Graduation Rates - Continued
The specific diploma types awarded to NPS graduates are defined as follows:
Standard - This program, which combines high level academic courses with elective courses, requires 22 credits and 6 verified credits for high school graduation. It satisfies the requirements for many four-year universities, community colleges, and other post-secondary educational institutions.
Special - A Special Diploma shall be awarded to each student with a disability who successfully completes the requirements set forth in his/her Individualized Educational Program (IEP), but does not meet the requirements for other diploma seals.
Advanced - This program is for college-bound students and requires 24 standard units of credits and 9 verified credits for high school graduation. It provides the requirements that most four-year colleges look for in their applicants.
Certificate - A Certificate shall be awarded to any student who completes a prescribed program of studies defined by the local school board but does not qualify for any diploma.
GED - The General Equivalency Diploma test include a battery of examinations that measure the skills and knowledge equivalent to the high school course of study. Graduates of this program receive the GED credential which documents that the recipient has high-school level academic skills.
ISAEP/GED - The Individual Student Alternative Education Plan program is an alternative program, which operates under guidelines outlined by the Virginia Board of Education. Success includes passing the GED exam and completing an occupational/career and technical training component at the end of the term.
Modified Standard - The Modified Standard Diploma is a 20 credit diploma intended for certain students who have a disability and are unlikely to meet the credit requirements for a Standard Diploma. Eligibility and participation in the Modified Standard Diploma program shall be determined by the student’s Individual Education Program (IEP) team and the student, where appropriate.
General Achievement - The General Achievement Diploma is intended to provide a diploma option for high school dropouts and individuals who exit high school without a diploma, are 18 years or older and meet the criteria set by the Board of Education.
International Baccalaureate - This Diploma Program (DP) is a two-year, academically rigorous curriculum that combines requirements of a mixture of different national education systems. Programs are offered in English, French, and Spanish and allow students moving around the country or from one country to another to transfer between DP schools. Colleges from around the world accept students who participate in DP.

31
NORFOLK PUBLIC SCHOOLS – Nationally Recognized. Globally Competitive.
Focus: Reading on Grade Level
Student reading achievement is a major focus of Norfolk Public Schools. To monitor how well students are learning to read, second through ninth graders are assessed annually using the Gates-MacGinitie Reading Tests (GMRT).
428453 469 486
509 522 535 548436
459482
500522
531541
549
250270290310330350370390410430450470490510530550570590
2 3 4 5 6 7 8 9
Exte
nded
Sca
le S
core
s
2009-10 Score 2009-10 Benchmark
Gates-MacGinitie 2009-10 Reading Comprehension Extended Scale Scores and Benchmarks

32
NORFOLK PUBLIC SCHOOLS – Nationally Recognized. Globally Competitive.
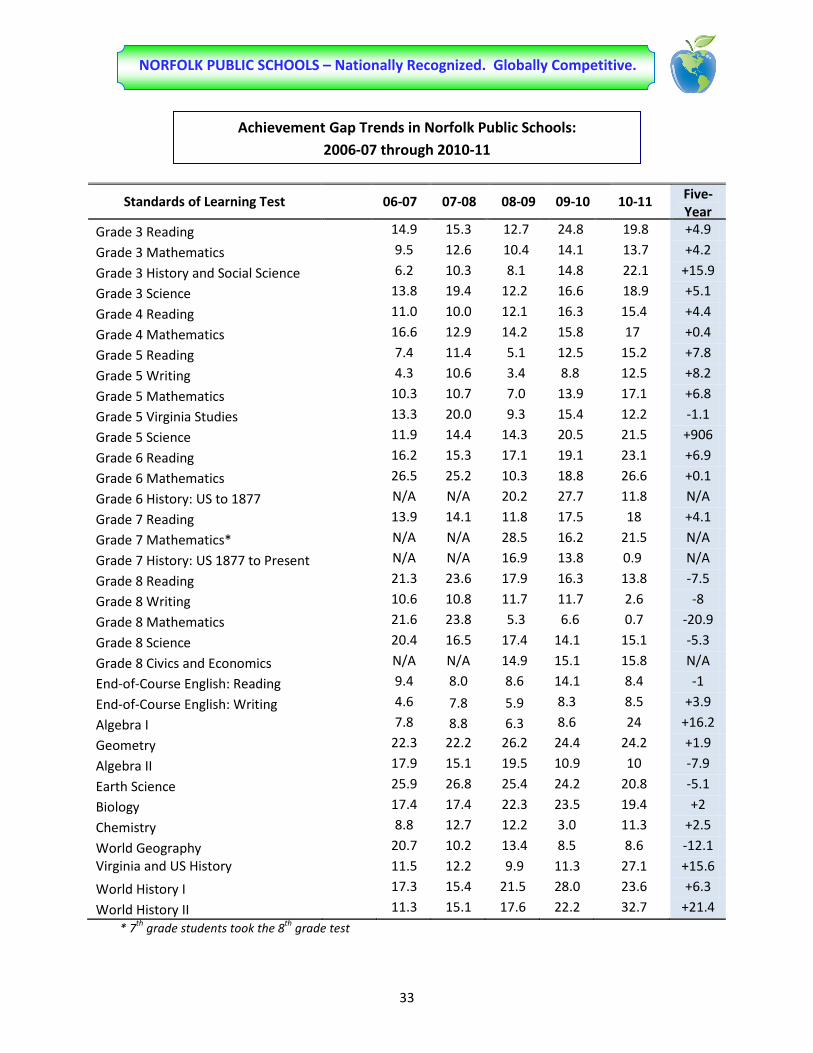
Focus: Closing the Achievement Gap
Norfolk Public Schools has embarked on a journey to be a nationally recognized school system that produces students who are globally competitive. Over an extended period of time, NPS has worked diligently in all subject areas to narrow the gap in achievement between African American and Caucasian students. To this end, and with the assistance of the Panasonic Foundation, four targets of a world-class system were established. The purpose of defining the four targets was to refine the work of the district to focus on high-leverage areas that could have a positive impact on student achievement. This endeavor includes a district-wide effort to establish and then use a detailed accountability system for all schools, which focuses on student achievement. With the requirements to meet state accreditation and NCLB’s Adequate Yearly Progress, the district has improved overall performance on benchmark tests and has seen progress in all subgroups over the last five years. A publication by the National Study Group for the Affirmative Development of Academic Ability (2004) argues that academic ability is developed, and as such influenced by schools. Furthermore, the report notes that the affirmative development of academic ability is nurtured and developed through (1) high-quality teaching and instruction in the classroom, (2) trusting relationships in school, and (3) supports for pro-academic behavior in the school and community. All of these are critical components in NPS efforts to reduce the achievement gap.
33
NORFOLK PUBLIC SCHOOLS – Nationally Recognized. Globally Competitive.
Standards of Learning Test 06-07 07-08 08-09 09-10 10-11 Five-Year
Grade 3 Reading 14.9 15.3 12.7 24.8 19.8 +4.9
Grade 3 Mathematics 9.5 12.6 10.4 14.1 13.7 +4.2
Grade 3 History and Social Science 6.2 10.3 8.1 14.8 22.1 +15.9
Grade 3 Science 13.8 19.4 12.2 16.6 18.9 +5.1
Grade 4 Reading 11.0 10.0 12.1 16.3 15.4 +4.4
Grade 4 Mathematics 16.6 12.9 14.2 15.8 17 +0.4
Grade 5 Reading 7.4 11.4 5.1 12.5 15.2 +7.8
Grade 5 Writing 4.3 10.6 3.4 8.8 12.5 +8.2
Grade 5 Mathematics 10.3 10.7 7.0 13.9 17.1 +6.8
Grade 5 Virginia Studies 13.3 20.0 9.3 15.4 12.2 -1.1
Grade 5 Science 11.9 14.4 14.3 20.5 21.5 +906
Grade 6 Reading 16.2 15.3 17.1 19.1 23.1 +6.9
Grade 6 Mathematics 26.5 25.2 10.3 18.8 26.6 +0.1
Grade 6 History: US to 1877 N/A N/A 20.2 27.7 11.8 N/A
Grade 7 Reading 13.9 14.1 11.8 17.5 18 +4.1
Grade 7 Mathematics* N/A N/A 28.5 16.2 21.5 N/A
Grade 7 History: US 1877 to Present N/A N/A 16.9 13.8 0.9 N/A
Grade 8 Reading 21.3 23.6 17.9 16.3 13.8 -7.5
Grade 8 Writing 10.6 10.8 11.7 11.7 2.6 -8
Grade 8 Mathematics 21.6 23.8 5.3 6.6 0.7 -20.9
Grade 8 Science 20.4 16.5 17.4 14.1 15.1 -5.3
Grade 8 Civics and Economics N/A N/A 14.9 15.1 15.8 N/A
End-of-Course English: Reading 9.4 8.0 8.6 14.1 8.4 -1
End-of-Course English: Writing 4.6 7.8 5.9 8.3 8.5 +3.9
Algebra I 7.8 8.8 6.3 8.6 24 +16.2
Geometry 22.3 22.2 26.2 24.4 24.2 +1.9
Algebra II 17.9 15.1 19.5 10.9 10 -7.9
Earth Science 25.9 26.8 25.4 24.2 20.8 -5.1
Biology 17.4 17.4 22.3 23.5 19.4 +2
Chemistry 8.8 12.7 12.2 3.0 11.3 +2.5
World Geography 20.7 10.2 13.4 8.5 8.6 -12.1 Virginia and US History 11.5 12.2 9.9 11.3 27.1 +15.6
World History I 17.3 15.4 21.5 28.0 23.6 +6.3
World History II 11.3 15.1 17.6 22.2 32.7 +21.4 * 7th grade students took the 8th grade test
Achievement Gap Trends in Norfolk Public Schools: 2006-07 through 2010-11
34
NORFOLK PUBLIC SCHOOLS – Nationally Recognized. Globally Competitive.
Awards and Recognitions
• Six Norfolk schools won excellence awards from the Virginia Board of Education. Larchmont, Mary Calcott and Ocean View elementary schools earned 2012 Board of Education Excellence Awards. Ghent School and Sewells Point and Willoughby elementary schools won 2012 Board of Education Competence to Excellence Awards.
• Norfolk Public Schools staff members participated in the Giving Inspiration to Families in Transition (G.I.F.T.) tree at the holidays, assisting more than 100 families with clothing and toys for the children.
• The Norfolk Education Foundation awarded Seeds for Success grants totaling nearly $20,000 to 11 Norfolk Public Schools staff members. The Foundation’s mission is to provide resources to Norfolk Public Schools for the achievement of excellence.
• Cadets from all five Norfolk High School NJROTC units were honoured for their dedication to academics, military study and community service. Awards were presented to students by members of various veterans and service organizations including The Veterans of Foreign Wars and the Daughters of the American Revolution.
• The Strolling Silver Strings were selected to entertain guests in Richmond at a “Laughter is the best Medicine” roast of Senator Mark Warner. Guests included actor Tim Reid, novelist John Grisham and musician Bruce Hornsby. Students had an opportunity to meet Senator Warner, Governor Bob McDonnell and Former Governor Tim Kaine.
• Coleman Place Elementary School won a $3,000 first-place prize from Dominion Power as part of a CFL (Compact Fluorescent Light) bulb contest. Ingleside Elementary School came in second place and received $1,500, and Richard Bowling Elementary School was third for a $500 award. Fairlawn and Poplar Halls elementary schools tied for fourth place and received certificates.
• Sally Legg, School Counselor at Larrymore Elementary, Dr. Susan Sigler, School Counselor at Maury High, and Felecia Oliver, School Counselor at Ruffner Middle School, were selected by their peers to receive Exemplary Professional School Counselor of Hampton Roads awards.
• Dr. Patricia Dillard, Executive Director of Human Resources, was chosen as 2011 AEOPN Administrator of the Year, and Shannon Freeman, an Administrative Secretary in Compensatory Education, was chosen to be the 2011 Educational Office Professional of the Year.

35
NORFOLK PUBLIC SCHOOLS – Nationally Recognized. Globally Competitive.
Please see map key on following page.

36
NORFOLK PUBLIC SCHOOLS – Nationally Recognized. Globally Competitive.
CITY OF NORFOLK PUBLIC SCHOOLS
ID NAME ADDRESS ID NAME ADDRESS
Elementary Schools
48 Bay View ES 1434 Bay View Avenue 46 Calcott ES 137 Westmont Avenue 7 Camp Allen ES 501 “C” Street 43 Campostella ES 1106 Campostella Road
17 Chesterfield Academy 2915 Westminster Avenue 10 Coleman Place ES 2445 Palmyra Street 24 Crossroads ES 8021 Old Ocean View Road 44 Ghent ES 200 Shirley Avenue 18 Fairlawn ES 1132 Wade Street 40 Ingleside ES 976 Ingleside Road 22 Granby ES 7101 Newport Avenue 34 Larchmont ES 1145 Bolling Avenue 37 Jacox ES 1300 Marshall Avenue 11 Lindenwood ES 2700 Ludlow Street 8 Larrymore ES 7600 Halprin Drive 29 Norview ES 6401 Chesapeake Boulevard 3 Little Creek ES 7900 Tarpon Place 20 Ocean View ES 9501 Mason Creek Road
12 Monroe ES 520 W. 29th Street 14 PB Young, Sr. ES 543 E. Olney Road 47 Oceanair ES 600 Dudley Avenue 16 Richard Bowling ES 2861 E. Princess Anne Road 41 Poplar Halls ES 5523 Pebble Lane 33 Sherwood Forest ES 3035 Sherwood Forest Lane 50 Sewells Point ES 7928 Hampton Boulevard 5 Suburban Park ES 310 Thole Street 42 St. Helena ES 903 S. Main Street 25 Tarrallton ES 2080 Tarrallton Drive 9 Tanners Creek ES 1335 Longdale Drive 15 Tidewater Park ES 1045 E. Brambleton Avenue
13 W. H. Taylor ES 1122 W. Princess Anne Road 19 Willoughby ES 9500 Fourth View Street 52 Willard Model School 1511 Willow Wood Drive
Middle Schools
26 Azalea Gardens MS 7721 Azalea Garden Road 35 Blair MS 730 Spotswood Avenue 1 Lafayette-Winona MS 1701 Alsace Avenue 32 Lake Taylor MS 1380 Kempsville Road
21 Northside MS 8720 Granby Street 30 Norview MS 6325 Sewells Point Road
27 Acad. of International Studies at Rosemont 1330 Branch Road 45 Ruffner Academy 610 May Avenue
High Schools
38 Booker T. Washington HS 1111 Park Avenue 23 Granby HS 7101 Granby Street 31 Lake Taylor HS 1384 Kempsville Road 36 Maury HS 322 Shirley Avenue 28 Norview HS 6501 Chesapeake Boulevard
Preschools
55 Berkley/Campostella ECC 1530 Cypress Street 53 Easton Preschool 6045 Curlew Drive
Special Purpose Schools
2 Madison Career Alternative 3700 Bowden Ferry Road 49 Norfolk Technical Center 1330 N. Military Highway 56 St. Mary’s School 6171 Kempsville Circle
37
NORFOLK PUBLIC SCHOOLS – Nationally Recognized. Globally Competitive.
Granby High School International Baccalaureate (IB) Diploma Program Granby High School is a member of the International Baccalaureate Organization (IBO) and is authorized to offer the International Baccalaureate Diploma Program. The program is a two-year academically rigorous curriculum intended for college-bound juniors and seniors who desire in-depth scholastic preparation. The IBO mission is to “develop inquiring, knowledgeable, and caring young people who help to create a better and more peaceful world through intercultural understanding and respect” (IBO Mission Statement). Students study courses from the IB subject groups of English, Foreign Language, Individuals and Their Societies (History), Experimental Sciences, Mathematics, and Fine Arts. In addition, the students must complete three unique elements of the IB Diploma Program: write a 4000-word Extended Essay, complete the IB CAS (Creativity/Action/Service) component, and take a unique Theory of Knowledge course. Integrating elements of curriculums and standards from various nations, this program culminates in the International Baccalaureate Diploma upon successful completion of assessments in the six subject groups and completion of the three unique program elements. Students who earn the IB Diploma or an IB Certificate are often awarded college credits and advanced standing at colleges and universities throughout the world. To prepare students for the rigor of the IB Diploma Program, Granby High School has specially designed preparation courses, which begin in the ninth grade. Application to the NPS Pre-IB Program is open to all rising ninth grade students who reside in Norfolk and meet the academic criteria. However, the application process is competitive as the freshmen class is limited to seventy students. Transportation will be provided for out-of-district students who are accepted into the program.
HHIIGGHH SSCCHHOOOOLL SSPPEECCIIAALLTTYY PPRROOGGRRAAMMSS

38
NORFOLK PUBLIC SCHOOLS – Nationally Recognized. Globally Competitive.
Lake Taylor High School Academy of Leadership and Military Science The Academy of Leadership and Military Science is a specialty program designed to elevate students’ GPA and SAT scores by developing their critical, analytical, and strategic thinking skills through a multitude of intervention strategies. The academy prepares students whose futures include meeting the requirements of becoming leaders in the private sector, as military officers through participation in college Reserve Officer Training Corps (ROTC) or Military Academies, or through career enlisted pursuits which provide for relationships and roles that connect them and teachers.
Awards & Recognitions at Lake Taylor High School
Senior, Lynn Watson was one of 105 high school students in the country named National Horatio Alger Scholars. A $20,000 scholarship accompanied the award. Lake Taylor High School also recently won first place in the “Get It Together High School Seat Belt Challenge,” a program led by Drive Safe Hampton Roads. The Titans led all participating schools with the highest number of educational activities conducted.
Booker T. Washington High School Academy of the Arts The balance between artistic development and academic preparation is at the heart of the Academy of the Arts at Booker T. Washington High School. Students are exposed to the humanities and have the opportunity to select a course of study that will best meet their needs and interests. The Academy is organized into five strands: art, instrumental music, vocal music, dance, and theatre. Students will view each strand through the lens of four components: aesthetic perspectives, creative expression, culture and history, and analysis and criticism.
Awards & Recognitions at Booker T. Washington High School
Omar Tariq, a Booker T. Washington High School senior, won first place in a school spelling bee, earning him a grand prize of $1,000 and a trip to Atlanta to compete for a national title at the Exodus National Spelling Bee competition. Booker T. Washington High School has also forged a partnership with Norfolk State University to encourage students to participate in innovative science, technology, engineering and mathematics (STEM) programs.
HHIIGGHH SSCCHHOOOOLL SSPPEECCIIAALLTTYY PPRROOGGRRAAMMSS

39
NORFOLK PUBLIC SCHOOLS – Nationally Recognized. Globally Competitive.
Maury High School The Medical and Health Studies Program During the 1980’s, the Norfolk Public Schools and the Eastern Virginia Medical School (EVMS) recognized that women and minorities were under represented in the medical and health science professions (with the exception of nursing, which was almost entirely comprised of females). In a special collaboration, the NPS/EVMS Magnet School for the Science and Health Professions was formed in 1986 to initiate early preparation of junior and senior level students, particularly minorities and females, for careers in the health professions through academic coursework and motivational counseling.
Over the past 25 years, the program has grown with ongoing support from the Norfolk Public Schools School Board and the faculty of the Eastern Virginia Medical School. Starting with a first class of approximately 20 students in grades 11 and 12, the program now serves almost 168 students in grades 9-12. Curriculum includes five specially designed courses: Biology with Medical Applications; Chemistry with Medical Applications; Anatomy/Physiology, which is taught in the Anatomy labs at EVMS; Accelerated Health and Physical Education, and the new senior level, Bio Ethics course.
Awards & Recognitions at Maury High School
The Maury High School Chamber orchestra was also recognized amongst the top high school orchestras across the country and was invited to perform at the National School Boards Association's annual conference in San Francisco.
Maury High School has celebrated 100 years of education in Norfolk.
HHIIGGHH SSCCHHOOOOLL SSPPEECCIIAALLTTYY PPRROOGGRRAAMMSS
40
NORFOLK PUBLIC SCHOOLS – Nationally Recognized. Globally Competitive.
Norview High School
The Leadership Center for the Sciences and Engineering The Leadership Center for the Sciences and Engineering is a smaller learning community within Norview High School, which consists of high performing students who, for four years, are enrolled in rigorous honors, Advanced Placement, and Dual Enrollment College courses with considerable emphasis in math and science content. In addition, students receive four years of formal instruction and training in leadership development. It is the goal of this specialty program to graduate students who are prepared to enter college and the career world equipped with the knowledge and skills to be in leadership roles in their communities as well as in a global marketplace.
Awards & Recognitions at Norview High School
Jonathan Guthrie and Gliezelle Bertulf, students in Norview High School's Leadership Center for the Sciences and Engineering, were selected to participate in a NASA-based program. The Virginia Aerospace Science and Technology Scholars program is a science, technology, engineering and mathematics (STEM) educational program for high school juniors.
Jake Fultz, a Norview High School junior and Governor’s School for the Arts student, was selected to represent Norfolk Public Schools on a goodwill trip to Japan in October, 2012. The trip is sponsored and coordinated by the Japan Education Culture Center, Inc. and Sister Cities of Virginia Beach, Norfolk Sister Cities Association, City of Miyazaki, City of Kitakyushu, Nippon Sport Science University and Volunteer Organizations in the United States and Japan.
Art teacher Jennifer McDuffie of Norview High School was selected as the Virginia Art Education Association's Art Educator of the Year.
HHIIGGHH SSCCHHOOOOLL SSPPEECCIIAALLTTYY PPRROOGGRRAAMMSS

41
NORFOLK PUBLIC SCHOOLS – Nationally Recognized. Globally Competitive.
Norfolk Technical Center The mission of Norfolk Technical Center is to ensure that its students are prepared to move immediately into post-secondary education and/or the work force in the following careers:
• Business and Marketing
• Engineering and Technical
• Fine Arts Careers
• Health and Human Services
In these programs, which are operated like actual businesses, students learn both theory and practical skills necessary to be successful in the global marketplace.
Awards & Recognitions at Norfolk Technical Center
Norfolk Technical Center’s Health Occupations Students of America (HOSA) program brought home state and national honors from the HOSA Virginia Conference. The awards included eight first-place awards, four second-place awards, eight third-place awards and four fifth-place awards. In addition, HOSA received three National Recognition Program Awards for healthcare accomplishment portfolios, and four Barbara James Awards for individual community service.
HHIIGGHH SSCCHHOOOOLL SSPPEECCIIAALLTTYY PPRROOGGRRAAMMSS

42
NORFOLK PUBLIC SCHOOLS – Nationally Recognized. Globally Competitive.
Azalea Gardens Middle Blair Middle Lafayette-Winona Middle Lake Taylor Middle
Northside Middle Norview Middle Ruffner Academy Academy of International Studies at Rosemont
All of Norfolk’s middle schools offer a quality education designed to engage students in rigorous units of study to prepare them for high school. Students follow a block schedule, which allows for 90 minutes of mathematics and language arts instruction every day for 6th and 7th graders. In 8th grade, students follow a traditional A/B block schedule similar to the high schools. Pre-algebra students will have math daily for 90 minutes. All middle schools offer high school credit-bearing courses, which include Algebra I, Geometry, Earth Science or Biology, Spanish I, French I, Latin I and World Geography. Students may also elect to take courses in the arts such as Band, Chorus, Orchestra and Art. Middle schools also offer high school credit bearing courses in electives. Career and technical offerings are available to students, as well as a full program in health and physical education. Honors courses in mathematics, reading and English are offered to students in the 6th - 8th grades and honors courses in science, social science, English, reading and mathematics are available to 7th and 8th grades. Several middle schools have course offerings unique to their schools. The Pre-medical, Health, and Engineering Program at Blair Middle School, the Young Scholars Program and Model Magnet for Math & Science at Ruffner Academy, and The Academy of International Studies at Rosemont are district-wide programs that require applications and follow an established selection process. Awards & Recognitions at NPS Middle Schools Lafayette-Winona Middle School won the annual Norfolk/Portsmouth Middle School Football Classic at ODU’s Powhatan Field. Lafayette-Winona was the Norfolk middle school football champion.
Students Kenan Love from Norview Middle School and Jared Draper from Ruffner Middle School were selected to compete in The Virginian-Pilot Spelling Bee contest.
Ruffner Middle School 8th grader Jager Parks received first place in the national Earth Day Photo and Essay Contest sponsored by the Institute for Global Environmental Strategies. The National Park Service selected Shelby Strickland, a 7th grade Ruffner Middle School Young Scholar, was the second-place winner of the National Fossil Day Art and Photo Contest. Eighth grader, Kameon Payne, received a trophy, a certificate and a $100 savings bond for a community service award from the NAACP.
MMIIDDDDLLEE SSCCHHOOOOLL PPRROOGGRRAAMMSS

43
NORFOLK PUBLIC SCHOOLS – Nationally Recognized. Globally Competitive.
Bay View Elementary School (K-5) Bay View enjoys a long history of serving the families on the Northside area maintaining strong ties with the community and environmentally focused organizations such as Save the Bay. Bay View offers outstanding instructional programs in First in Math, Future Problem Solvers, and Word Masters that contribute to increased student achievement. Mary Calcott Elementary School (K-5) Calcott offers a wide variety of programs, initiatives and recognitions that highlight excellence in instructional practices and student achievement. Calcott is the proud recipient of the 2010 Governor’s Award for Educational Excellence. Camp Allen Elementary School (PreK-5) Camp Allen provides students with opportunities to participate in several school-wide learning activities, such as Battle of the Books and 24 Math Challenge. The Academic Scholar Club assists males with achieving academic and behavioral goals. Campostella Elementary School (K-5)
Campostella Elementary has many programs, initiatives and recognitions. It was the first school in the Commonwealth to initiate the Science, Technology, Engineering and Mathematics Program (STEM). World Ark magazine's Fall 2011 edition featured an article on Campostella Elementary School’s kindergartners, who participated in the Heifer Project to aid struggling families in Rwanda. Approximately 140 five and six year old students raised over $782 by saving coins and foregoing snacks in an effort to donate to the Rwandans a heifer, trees, seeds, bees, rabbits and poultry.
NASA selected Kristal Moses, a fifth-grade teacher at Campostella Elementary School, as a NASA Endeavor Science Teaching Certificate Fellow. As an Endeavor Fellow, Kristal will receive training to effectively teach science, technology, engineering and mathematics (STEM) content and integrate strategies within the core curriculum.
Chesterfield Academy School (K-5) Chesterfield Academy offers unique learning experiences in the areas of Math, Science and Technology. Chesterfield Academy is a NASA Explorer school.
EELLEEMMEENNTTAARRYY SSCCHHOOOOLLSS

44
NORFOLK PUBLIC SCHOOLS – Nationally Recognized. Globally Competitive.
Coleman Place Elementary School (K-5)
Coleman Place, in partnership with Southeastern Virginia Arts Association (SEVAA), under the direction of Mrs. Donna Smith and her “Stay Focused” program (in partnership with Canon Camera) reinforces reading and writing skills with the aid of the digital camera.
Crossroads Elementary School (PreK-6) The new Crossroads PreK-8 school is slated to open in September 2012. Upon opening, students through grade six will attend. A grade will be added each of the next two years. There will be approximately 660 elementary students and 225 middle school students attending Crossroads by September 2014. Crossroads is a certified Leadership in Energy and Environmental Design (LEED®) school where students will use the building to learn about the environment. Fairlawn Elementary School (K-5) Fairlawn Elementary School, with one of only a few elementary Steel Drum Teams in the area, participated in several stellar performances before various audiences. The School is extremely proud of its Steel Drum Rhythm Project, Young Men's Ensemble, and its chapter of the National Elementary Honor Society. Ghent Elementary School (K-8) Ghent is a K-8 School. Students chosen in the lottery for kindergarten are able to stay at the school through 8th grade. Ghent also received over $1,000 from Norfolk Education Foundation for students to explore careers in science. Granby Elementary School (PreK-5) Granby Elementary School has several programs of which the school is extremely proud. The Listening Ears Program is one where students read to the certified dogs that parents and members of the community bring in. Unique to Granby is the Autism Program. The goal of this program is to build the independence of the students. Granby also has one of the finest elementary music programs in the city.
EELLEEMMEENNTTAARRYY SSCCHHOOOOLLSS

45
NORFOLK PUBLIC SCHOOLS – Nationally Recognized. Globally Competitive.
Ingleside Elementary School (PreK-5) Ingleside Elementary School has achieved a 90 percent pass rate in the areas of English and Mathematics for the past five years. Ingleside offers the Even Start Program which teaches parenting skills to young parents and enables them to earn their General Equivalency Diploma (GED) by overseeing their educational training and prepares them for Adult Basic Education (ABE) and GED final testing. Jacox Elementary School (K-5) Jacox continues to have supportive partners. This year, the Life Enrichment Center funded a new computer lab with 20 new Dell computers. The Better Parents Foundation recognizes students and parents who continue to meet the Virginia proficiency standards. Larchmont Elementary School (K-5) Larchmont Elementary School is the recipient of the 2011 Governor’s Award for Educational Excellence, the highest honor in the Governor’s VIP Program and Norfolk’s first Blue Summit School of Excellence. Larchmont Elementary School is also part of the Confucius Classroom and offers Chinese Language instruction. Beginning with the 2010-2011 school year, and for the next two years, Larchmont will automatically receive accreditation based on recent SOL test scores.
Larchmont Elementary School joined more than 300,265 people from around the world to break the National Geographic Kids' Guinness World Record attempt for the Most People Doing Jumping Jacks in a 24-hour period. More than 637 students from Larchmont participated.
Larchmont Elementary School won Norfolk Public Schools’ annual food drive. Larchmont families donated 1,278 pounds of food, averaging 2.21 pounds of food per student.
Larrymore Elementary School (PreK-5) Larrymore has been recognized formally by the Governor’s VIP Excellence Award program for the last three years. The school maintains effective long-term partnerships with communities and families to provide students with quality assistance and instructional support.
EELLEEMMEENNTTAARRYY SSCCHHOOOOLLSS

46
NORFOLK PUBLIC SCHOOLS – Nationally Recognized. Globally Competitive.
Lindenwood Elementary School (PreK-5) Lindenwood prepares students to contribute to a technological society and a global economy. We help them communicate effectively through the mastery of problem solving, critical thinking, life management, and communication skills in a non-threatening, safe and supportive environment with Smartboards and computers in every classroom. Little Creek Elementary School (K-5) Little Creek Elementary School is fully equipped with the finest technological upgrades in each classroom, and has a fully equipped Science Lab to keep up in this globally competitive society. In addition, teachers engage in Professional Learning Communities on a continual basis. James Monroe Elementary School (PreK-5) James Monroe Elementary School's goal is to meet the learning needs of all students, their families and community. Progress is monitored on a continuous basis to provide a laser-like focus of greater understanding as to how children learn, and to provide data needed for a continuous cycle of programmatic examination, development and change. The school’s goal is to meet the needs of ALL students in an effective and timely manner.
James Monroe Elementary school art teacher Angela Winters and her 5th grade students were chosen to design and create the ornaments for Virginia’s tree for the 2011 National Christmas Tree display in President’s Park in Washington, D.C.
Norview Elementary School (K-5) Norview Elementary School has established strong partnerships with their neighbors at Norview High School. Dodson Scholars and Leadership Students mentor and work with students on learning activities. The U.S.S. Ross and the U.S. Navy Brig support the Honor Student of the Month program. Norview Elementary is also the recipient of two Norfolk Education Foundation (NEF) Seeds for Success Grants: Call Me a Reader and Reading In the Middle.
EELLEEMMEENNTTAARRYY SSCCHHOOOOLLSS

47
NORFOLK PUBLIC SCHOOLS – Nationally Recognized. Globally Competitive.
Ocean View Elementary School (K-5)
Ocean View Elementary School features a Maritime Studies program with a focus on maritime and environmental learning projects. Ocean View Elementary School was the recipient of a $500 Books for Schools Award gift card from the Norfolk Target store to assist with purchasing library books for the school. Working with the Chesapeake Bay Foundation and the Elizabeth River Project, Ocean View students participate in service learning activities centered on restoration of the Chesapeake Bay. Ocean View has earned recognition by the Elizabeth River Project as a River Star School every year since 2005. In addition, based on the continuous high academic achievement of Ocean View students, the school has been named a 2008 National No Child left Behind Blue Ribbon School and a Virginia Distinguished Title I School for the past three years.
Oceanair Elementary School (PreK-5) Oceanair Elementary, a NASA Explorer School, has a positive impact on student literacy. Dominion Virginia Power and Norfolk Environmental Storm Water, through partnerships, instill a sense of community in our students. Poplar Halls Elementary School (K-5) Poplar Halls Elementary continues to utilize research in the area of Brain-Based Learning to enhance our pedagogical skills. This assists us in compelling our students to strive toward academic progress. Our school has won the 2009 Governor’s VIP Award for Educational Excellence, the 2010 Board of Education Competence to Education Award for having met all state and federal benchmarks for at least two consecutive years, and has been highlighted in the Sentara Healthcare Newsletter for taking strides to meet the needs of the whole child. Richard Bowling Elementary School (PreK-5) Richard Bowling Elementary has ranked in the top 10 of the district’s elementary schools in the state SOL Writing Assessment. Scholars thrive daily in an environment where teaching and learning are first. All stakeholders share a personal accountability and responsibility to help each scholar meet with academic success and develop skills that will enable them to become productive citizens.
EELLEEMMEENNTTAARRYY SSCCHHOOOOLLSS

48
NORFOLK PUBLIC SCHOOLS – Nationally Recognized. Globally Competitive.
St. Helena Elementary School (K-5) The majority of students who attend St. Helena live in the Berkley neighborhood and walk to school. The Cooperating Hampton Roads Organizations for Minorities in Engineering, Inc., (CHROME) Program works with students who have a high interest in science and math and literacy lessons for identified students. All students and teachers participate in the Community of Caring Program which is designed to promote positive citizenship. Sewells Point Elementary School (K-5) Sewells Point Elementary School serves military families from Joint Forces Staff College and Ben Morrell Housing. Sewells Point has received the Board of Education's Competence to Excellence Award for the past three years. Sherwood Forest Elementary School (PreK-5) Sherwood Forest has a state-of-the-art computer lab, as well as seven mobile Smartboards, which help prepare students for academic, social and emotional success. At Sherwood Forest, everybody is somebody! The school’s open-door policy has proven to be the link to building a bridge between the school, the home and the community. A team of 5th grade Sherwood Forest Elementary School students won a championship trophy at the Woman’s Club of Norfolk Bridge tournament. The school competed against other schools from Virginia Beach and Norfolk. Suburban Park Elementary School (K-5) Suburban Park’s Student Mentorship Program, along with its growing partnerships with both Norfolk State and Old Dominion Universities, Suburban Park Civic League, Naval Submarine Support Center, United States Joint Forces Command (USJFCOM) and Tabernacle Church serves as the cornerstone in the success of the school’s programs. Tanners Creek Elementary School (PreK-5) Tanners Creek Elementary is a fully accredited Title I school. Learning with technology is evident throughout Tanners Creek School with Smartboards in all pre-kindergarten through 5th grade classrooms as well as art, music, and the media center. In addition to a computer lab, there are at least three computer work stations in each classroom.
EELLEEMMEENNTTAARRYY SSCCHHOOOOLLSS

49
NORFOLK PUBLIC SCHOOLS – Nationally Recognized. Globally Competitive.
Tarrallton Elementary School (K-5) Tarrallton Elementary received the 2010 Board of Education Competence to Excellence Award for having met all state and federal benchmarks for at least two consecutive years. The “Character Counts” program at Tarrallton is credited with motivating students to always do their homework, to have good attitudes, and to be responsible, hard-working and caring. Tidewater Park Elementary School (K-5) Tidewater Park Elementary School has a variety of partners and community stakeholders such as BB&T, The Promise Neighborhood Coalition, Gethsemane Community Church, Calvary Revival Church, Norfolk State University, Agape Counseling & Therapeutic Services, YCAPP Counseling and Therapeutic Services, V-ABODE Services, William A. Hunton YMCA, Fresh Fruit and Vegetable Program, and support from the Norfolk Sheriff’s Department. In addition, students and teachers participate in the Spanish Club, the Math club, and the Mentorship Program where each student has the benefit of having three mentors. Additional programs at Tidewater Park include School Nutrition Services, Project Hope (McKinney-Vento Act) for homeless children, and the Virginia Preschool Initiative (VPI) which allows four year old students who lack necessary academic components to start school. Math teacher, Jeanina Harris, was selected by Office Max for the “Day Made Better” award. Ms. Harris received classroom supplies including a desktop printer, pens, pencils, folders, calculators and a new desk chair. Office Max officials also gave Principal Dr. Dawn Lawrence two more boxes of supplies to share with all of the teachers in the school. W.H. Taylor Elementary School (PreK-5)
W. H. Taylor Elementary has a strong history as a nationally recognized Blue Ribbon School and PTA National School of Excellence. Taylor’s success has come from the teamwork of dedicated families collaborating with highly trained educators to offer the best to students. The school constantly seeks opportunities to provide an excellent school experience for all families. Taylor Elementary School’s “Green Team,” parents and students dedicated to recycling, were recognized by Norfolk Mayor Paul Fraim for their efforts to recycle nearly three tons of materials in a three month period.
EELLEEMMEENNTTAARRYY SSCCHHOOOOLLSS

50
NORFOLK PUBLIC SCHOOLS – Nationally Recognized. Globally Competitive.
Willard Model Elementary School (K-5)
Willard Model Elementary School is a current recipient of the 2010 Board of Education Competence to Excellence Award. Willard's students are challenged to think critically through questioning, feedback and goal setting. The school’s goal is to provide a cutting-edge education in an environment that fosters self-directed learning for the 21st century.
Willard Model Elementary School won the state and national Recycle Bowl competition sponsored by Keep America Beautiful and Nestle Waters. Willard collected 32,879 pounds of recyclable material during the four week competition.
Willoughby Elementary School (PreK-5) Willoughby Elementary received commendation in 2009 from the General Assembly of the Commonwealth of Virginia for achieving 100 percent pass rates in five accreditation benchmarks of the Virginia Standards of Learning. Willoughby also received the 2010 Competence to Excellence Award. The school serves its community of learners in a number of creative ways, including the Bunny Morning Character Education Program, the After-Breakfast Buddy Reading Club and the Whales of Honor Program. P.B. Young, Sr. Elementary School (K-5) P.B. Young, Sr. uses research-based strategies, which increase student achievement. Activities are child centered and designed to accommodate individual learning styles so that all may experience success.
EELLEEMMEENNTTAARRYY SSCCHHOOOOLLSS

51
NORFOLK PUBLIC SCHOOLS – Nationally Recognized. Globally Competitive.
Berkley/ Campostella Early Childhood Education Center (PreK) The center was developed to provide young children with the skills and experiences necessary to prepare them to be successful in school by extending and enriching the learning experiences provided by parents. Easton PreSchool (PreK) Easton Preschool serves students ages two through five years of age. The Early Childhood Special Education (ECSE) Program provides home and school-based services to eligible students with an identified disability, which may include: Developmentally Delayed, Deaf/Hearing Impaired, Autistic, Emotionally Disturbed and Visually Impaired.
EEAARRLLYY CCHHIILLDDHHOOOODD CCEENNTTEERRSS
52
NORFOLK PUBLIC SCHOOLS – Nationally Recognized. Globally Competitive.
Norfolk Public Schools’ Policy
DB. ANNUAL BUDGET
The annual school budget is the financial outline of the division's education program. It presents a proposed plan of expenditures and the expected means of financing those expenditures. After adoption, it provides the primary means of managing expenditures. The fiscal year is defined as beginning on the first day of July and ending on the thirtieth day of the following June. The superintendent shall prepare, with the approval of the school board, and submit to the appropriating body, an estimate of the amount of money needed during the next fiscal year for the support of the public schools of the school division. The estimate shall set up the amount of money needed for each major classification prescribed by the Board of Education and such other headings or items as may be necessary. The superintendent or his/her designee shall prepare a budget calendar identifying all deadlines for the annual budgetary process. The calendar shall include at least one work session for reviewing the budget and at least one public hearing on the budget. Notice of the time and place for the public hearing must be published at least ten days in advance, in a newspaper having general circulation within the school division. ________________ Legal Refs: Code of Virginia, 1950, as amended, §§ 15.2-2503, 15.2-2504, 15.2-2506, 22.1-
90, 22.1-91, 22.1-92, 22.1. Replaced Norfolk Public Schools Blue Book Policy 4-11. Adopted by the Norfolk School Board: February 25, 1999; revised September 17, 2008.

53
NORFOLK PUBLIC SCHOOLS – Nationally Recognized. Globally Competitive.
Code of Virginia, 1950
A county school board is vested with the use and control of all school funds, whether derived from state appropriations, local taxation, or other sources, and has exclusive authority to expend the funds set apart by law for school purposes.
15.2-2503. Time for Preparation and Approval of Budget; Contents. All officers and heads of departments, offices, divisions, boards, commissions, and agencies of every locality shall, on or before the first day of April of each year, prepare and submit to the governing body an estimate of the amount of money needed during the ensuing fiscal year for his department, office, division, board, commission or agency. If such person does not submit an estimate in accordance with this section, the clerk of the governing body or other designated person or persons shall prepare and submit an estimate for that department, office, division, board, commission or agency.
The governing body shall prepare and approve a budget for informative and fiscal planning purposes only, containing a complete itemized and classified plan of all contemplated expenditures and all estimated revenues and borrowings for the locality for the ensuing fiscal year. The governing body shall approve the budget and fix a tax rate for the budget year no later than the date on which the fiscal year begins. The governing body shall annually publish the approved budget on the locality's website, if any, or shall otherwise make the approved budget available in hard copy as needed to citizens for inspection.
15.2-2504. What budget to show. Opposite each item of the contemplated expenditures the budget shall show in separate parallel columns the aggregate amount appropriated during the preceding fiscal year, the amount expended during that year, the aggregate amount appropriated and expected to be appropriated during the current fiscal year, and the increases or decreases in the contemplated expenditures for the ensuing year as compared with the aggregate amount appropriated or expected to be appropriated for the current year. This budget shall be accompanied by:
1. A statement of the contemplated revenue and disbursements, liabilities, reserves and surplus or deficit of the locality as of the date of the preparation of the budget; and

54
NORFOLK PUBLIC SCHOOLS – Nationally Recognized. Globally Competitive.
Code of Virginia, 1950 Continued
2. An itemized and complete financial balance sheet for the locality at the close of the last preceding fiscal year.
15.2-2506. Publication and notice; public hearing; adjournment; moneys not to be paid out until appropriated. A brief synopsis of the budget which, except in the case of the school division budget, shall be for informative and fiscal planning purposes only, shall be published once in a newspaper having general circulation in the locality affected, and notice given of one or more public hearings, at least seven days prior to the date set for hearing, at which any citizen of the locality shall have the right to attend and state his views thereon. Any locality not having a newspaper of general circulation may in lieu of the foregoing notice provide for notice by written or printed handbills, posted at such places as it may direct. The hearing shall be held at least seven days prior to the approval of the budget as prescribed in § 15.2-2503. With respect to the school division budget, which shall include the estimated required local match, such hearing shall be held at least seven days prior to the approval of that budget as prescribed in § 22.1-93. The governing body may adjourn such hearing from time to time. The fact of such notice and hearing shall be entered of record in the minute book.
In no event, including school division budgets, shall such preparation, publication and approval be deemed to be an appropriation. No money shall be paid out or become available to be paid out for any contemplated expenditure unless and until there has first been made an annual, semiannual, quarterly or monthly appropriation for such contemplated expenditure by the governing body, except funds appropriated in a county having adopted the county executive form of government, outstanding grants may be carried over for one year without being re-appropriated.
22.1-88. Of What School Funds To Consist. The funds available to the school board of a school division for the establishment, support and maintenance of the public schools in the school division shall consist of state funds appropriated for public school purposes and apportioned to the school board, federal funds appropriated for educational purposes and apportioned to the school board, local funds appropriated to the school board by a local governing body or such funds as shall be raised by local levy as authorized by law, donations or the income arising there from, and any other funds that may be set apart for public school purposes.

55
NORFOLK PUBLIC SCHOOLS – Nationally Recognized. Globally Competitive.
Code of Virginia, 1950 Continued
22.1-89. Management of Funds. Each school board shall manage and control the funds made available to the school board for public schools and may incur costs and expenses. If funds are appropriated to the school board by major classification as provided in § 22.1-94, no funds shall be expended by the school board except in accordance with such classifications without the consent of the governing body appropriating the funds. 22.1-90. Annual Report of Expenditures. Every school board shall submit at least once each year to the governing body or bodies appropriating funds to the school board a report of all its expenditures. Such report shall also be made available to the public either on the official school division website, if any, or in hard copy at the central school division office, on a template prescribed by the Board of Education.
22.1-91. Limitation on Expenditures; Penalty. No school board shall expend or contract to expend, in any fiscal year, any sum of money in excess of the funds available for school purposes for that fiscal year without the consent of the governing body or bodies appropriating funds to the school board. Any member of a school board or any division superintendent or other school officer violating, causing to be violated or voting to violate any provision of this section shall be guilty of malfeasance in office.
22.1-92. Estimate of moneys needed for public schools; notice of costs to be distributed. A. It shall be the duty of each division superintendent to prepare, with the approval of the school board, and submit to the governing body or bodies appropriating funds for the school division, by the date specified in § 15.2-2503, the estimate of the amount of money deemed to be needed during the next fiscal year for the support of the public schools of the school division. The estimate shall set up the amount of money deemed to be needed for each major classification prescribed by the Board of Education and such other headings or items as may be necessary.
Upon preparing the estimate of the amount of money deemed to be needed during the next fiscal year for the support of the public schools of the school division, each division superintendent shall also prepare and distribute, within a reasonable time as prescribed by the Board of Education, notification of the estimated average per pupil cost for public education in the school division for the coming school year to each parent, guardian, or other person having control or charge of a child enrolled in the relevant school division, in accordance with the

56
NORFOLK PUBLIC SCHOOLS – Nationally Recognized. Globally Competitive.
Code of Virginia, 1950 Continued
budget estimates provided to the local governing body or bodies. Such notification shall also include actual per pupil state and local education expenditures for the previous school year. The notice may also include federal funds expended for public education in the school division.
The notice shall be printed on a form prescribed by the Board of Education and shall be distributed separately or with any other materials being currently transmitted to the parents, guardians or other persons having control or charge of students. To promote uniformity and allow for comparisons, the Board of Education shall develop a one-page form for this notice and distribute such form to the school superintendents for duplication and distribution.
B. Before any school board gives final approval to its budget for submission to the governing body, the school board shall hold at least one public hearing to receive the views of citizens within the school division. A school board shall cause public notice to be given at least ten days prior to any hearing by publication in a newspaper having a general circulation within the school division. The passage of the budget by the local government shall be conclusive evidence of compliance with the requirements of this section.
22.1-93. Approval of Annual Budget for School Purposes. Notwithstanding any other provision of law, including but not limited to Chapter 25 (§ 15.2-2500 et seq.) of Title 15.2, the governing body of a county shall prepare and approve an annual budget for educational purposes by May first or within thirty days of the receipt by the county of the estimates of state funds, whichever shall later occur, and the governing body of a municipality shall prepare and approve an annual budget for educational purposes by May fifteen or within thirty days of the receipt by the municipality of the estimates of state funds, whichever shall later occur. Upon approval, each local school division shall publish the approved annual budget, including the estimated required local match, on the division's website, if any, or if there is no division website, the document shall otherwise be made available in hard copy as needed to citizens for inspection.
The Superintendent of Public Instruction shall, no later than the fifteenth day following final adjournment of the Virginia General Assembly in each session, submit estimates to be used for budgetary purposes relative to the Basic School Aid Formula to each school division and to the local governing body of each county, city and town that operates a separate school division. Such estimates shall be for each year of the next biennium or for the then next fiscal year.

57
NORFOLK PUBLIC SCHOOLS – Nationally Recognized. Globally Competitive.
22.1-94. Appropriations by County, City or Town Governing Body for Public Schools. A governing body may make appropriations to a school board from the funds derived from local levies and from any other funds available, for operation, capital outlay and debt service in the public schools. Such appropriations shall be not less than the cost apportioned to the governing body for maintaining an educational program meeting the standards of quality for the several school divisions prescribed as provided by law. The amount appropriated by the governing body for public schools shall relate to its total only or to such major classifications prescribed by the Board of Education pursuant to § 22.1-115. The appropriations may be made on the same periodic basis as the governing body makes appropriations to other departments and agencies.
Code of Virginia, 1950 Continued

58
NORFOLK PUBLIC SCHOOLS – Nationally Recognized. Globally Competitive.
Reader’s Guide to the Budget The Educational Plan and Budget document summarizes the educational programs provided by Norfolk Public School Board to approximately 33,000 students.
Section Explanation Introduction - section of the budget document includes information about the district – its organizational and management structure and the district’s mission and how it is achieved. Executive Summary - section provides a summary overview of the Educational Plan and Budget for Fiscal Year 2012-2013. Revenue Sources - section presents an overview of revenue sources for the district’s operating budget. Operating Expenditures - section presents an overview of expenditures by program and expenditure category for the district’s operating budget. To give a better understanding of how division funds are spent, supplemental information is provided for each program as to how it connects to the division four target areas, its goals and changes for fiscal year 2012-2013. Grants and Other Funds - section provides an overview of all federal, state and local grants administered by the School Board. School Nutrition Services is included in this section. Supplemental Information - section provides historical, statistical, comparative and other supplemental information about the division. Appendix A - contains the same information as the Operating Expenditures section; however, it is by line item object code. Appendix B - contains the same information as the Grants and Other Funds section; however, the information is by line item object code.
59
NORFOLK PUBLIC SCHOOLS – Nationally Recognized. Globally Competitive.
Reader’s Guide to the Budget - Continued
Accounting for School Board Funds The accounts of the School Board are organized on the basis of funds and account groups, each of which are considered as a separate accounting entity with a separate set of self-balancing accounts. The funds of the School Board consist of the General Fund (the Operating Fund), the Child Nutrition Services Fund and various Categorical Grant Funds. The School Board is also responsible for planning, developing and executing the Capital Improvement Program (CIP). Operating Fund - is the basic funding plan for the schools. It includes funds for the fiscal operation of the school system. School Nutrition Services Fund - is a special revenue fund that supports cafeteria and food services operations and is separate from the basic Operating Fund. Categorical Grant Funds - are special revenue funds that track the revenue and expenditures of the state, federal and local categorical grants. Capital Improvement Program Fund - is the basic financing plan for capital needs.
Sources of Revenue Norfolk Public Schools receives operating revenue from three major sources – state (including State Sales Tax), the local governing body and the federal government. State Funds - consists of four basic types of direct aid funding for public education – Standards of Quality (SOQ), Incentive-based funding, Categorical funding and Lottery funded programs. SOQ payments are determined by multiplying per-pupil amounts determined by the General Assembly by the projected March 31 Average Daily Membership. They are shared by the state and the locality based upon a ratio called the Composite Index. The state also funds a number of programs that address specific needs of students and the school division via Incentive-based funding, Categorical funding and Lottery funded programs. Federal Funds - consist of U.S. Department of Education, Impact Aid, Telephone Discounts/Rebates, Medicaid reimbursements and Naval ROTC reimbursements.

60
NORFOLK PUBLIC SCHOOLS – Nationally Recognized. Globally Competitive.
Reader’s Guide to the Budget - Continued
State Sales Tax - also a component of state funds, is shown as a separate source or revenue. One and one-eighth percent of sales tax collected is returned by the state to the localities for public education and is based on the number of school-aged children residing in the locality. A census is conducted every three years by each locality to determine the number of school-aged children who resides within the locality. Local Funds - consists of the appropriation by the City of Norfolk to the School Board. The city is required to contribute a minimum level of funding called the required “local effort” which is determined by the Local Composite Index. The Composite Index, determined by the state, is an indicator of the locality’s ability to fund public education. The City of Norfolk provides an appropriation in excess of the required local effort. Miscellaneous Funds - another source of revenue generated at the local level, consists of numerous miscellaneous revenues such as tuitions, fees, rental of school facilities, credit card reimbursements, interest, etc.
Expenditure Category Explanation Projected expenditures are grouped into the following categories. Salaries provides for all payroll costs for full-time and part-time employees and substitutes, as well as overtime expenses, supplements and other allowances, stipends for attending and conducting workshops and other personnel service expenses. Fringe Benefits provides for all fringe benefits including Social Security, life insurance, retirement, medical insurance and unemployment, workers’ compensation expenses and tuition reimbursement expenses. Contract Services provides for all external contractual services required by the School Board; i.e., printing, maintenance agreements, repair services, professional services and other contracted services. These services are usually on a fee basis or fixed time contract. Travel/Staff Development provides for all staff travel, both within the city and outside of the city, for mileage reimbursement and attendance at conferences.

61
NORFOLK PUBLIC SCHOOLS – Nationally Recognized. Globally Competitive.
Reader’s Guide to the Budget - Continued
Postage, Leases & Rentals provides for leased office and other school facility space as well as non-capitalized equipment rentals. Utilities/Communications provides for costs of electricity, natural gas, fuel oil, phone service, water, sewer, and other utilities or communication services. Supplies provide for materials and supplies, which are consumed or materially altered when used, and minor capital outlay items that have a unit cost of less than $5,000. Regional Tuition provides payments to Regional Joint Operations in support of vocational, special education and talented and gifted programs and to Southeastern Cooperative Educational Programs (SECEP). Equipment provides for expenditures that result in the acquisition of or additions to, capital assets with a unit cost of $5,000 or more. Transfer to Schools provides for transfers to schools to support the Athletics programs.
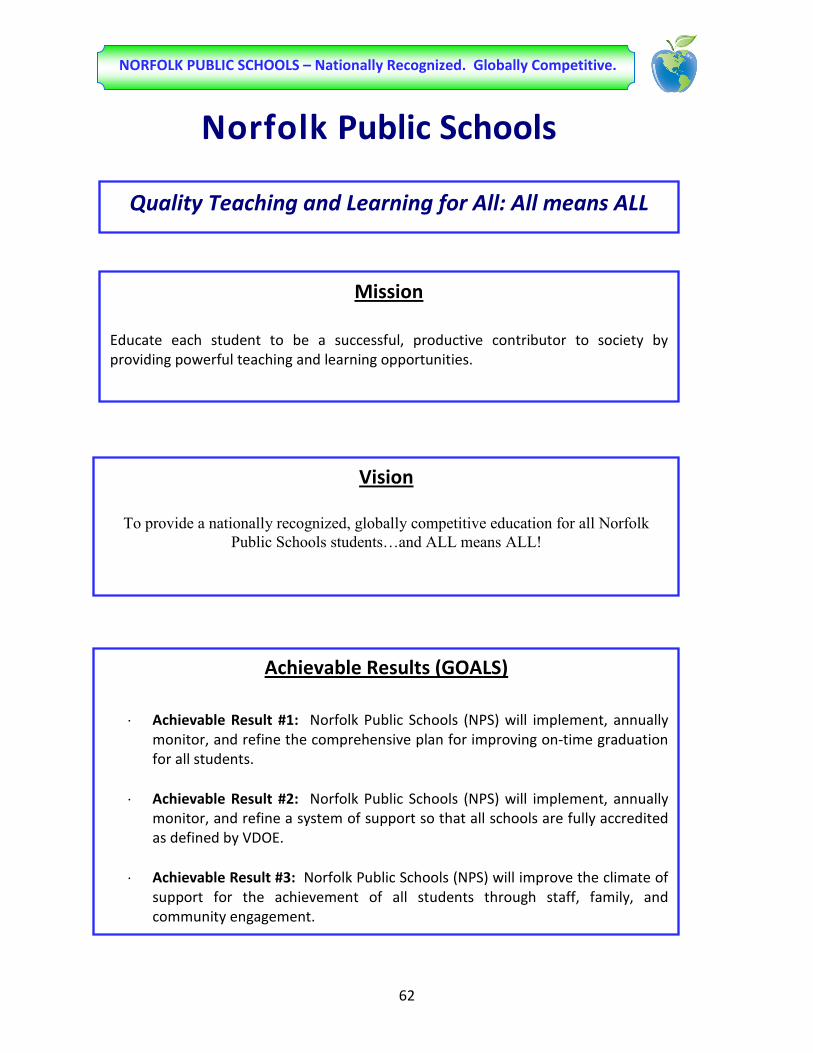
62
NORFOLK PUBLIC SCHOOLS – Nationally Recognized. Globally Competitive.
Norfolk Public Schools
Quality Teaching and Learning for All: All means ALL
Mission
Educate each student to be a successful, productive contributor to society by providing powerful teaching and learning opportunities.
Vision
To provide a nationally recognized, globally competitive education for all Norfolk Public Schools students…and ALL means ALL!
Achievable Results (GOALS)
⋅ Achievable Result #1: Norfolk Public Schools (NPS) will implement, annually monitor, and refine the comprehensive plan for improving on-time graduation for all students.
⋅ Achievable Result #2: Norfolk Public Schools (NPS) will implement, annually monitor, and refine a system of support so that all schools are fully accredited as defined by VDOE.
⋅ Achievable Result #3: Norfolk Public Schools (NPS) will improve the climate of support for the achievement of all students through staff, family, and community engagement.

63
NORFOLK PUBLIC SCHOOLS – Nationally Recognized. Globally Competitive.
Budget Development Overview The development of the budget that funds all educational programs and related services that serve the 33,000 students of Norfolk Public Schools is a 12-month process that involves the collaborative effort of the Superintendent, Associate Superintendents, Principals, Executive Directors, Senior Directors, other administrators, teacher associations, elementary and secondary principal’s associations, the budget department, the School Board, and the public. As a prelude to developing the Proposed Budget, a public hearing was conducted to gather community input. The annual budget process begins in October, when Associate Superintendents and Directors are sent the results of the previous year, along with instructions and projections of funding levels for the next fiscal year. Associate Superintendents and departments enter their requests into the system with detail at this time. A review of each program is begun at this same time using the NPS Accountability system and Board defined budgetary goals developed in the fall of the year. In November and December, the Budget department meets with various Associate Superintendents and Directors to discuss requests and changes to budget. Norfolk Public Schools personnel complete their program/department review and forward their review and recommendations to the Strategic Leadership Team (SLT). As part of each year’s budget process, each Associate Superintendent completes a cost-benefit review of programs/departments. This group then prioritizes requests and compiles additional information where needed. The overriding principle being that all resources will directly support teaching and learning in the classroom. The SLT membership includes associate superintendents, executive directors, select senior directors, teacher and principal association members, citizens, and teacher of the year. Over the past several years, Norfolk Public Schools has moved the budget process away from an incremental budget approach to an approach that emphasizes resource reallocation (i.e., using existing resources more effectively) linked to our accountability system (i.e., funds must support established goals and objectives). Program evaluation is a main component of our budget development process. Each year a process-driven decision-making model is used to determine the areas of reduction needed in a strategic, systematic manner. As part of this process, the cost-benefit, direct or indirect support of teaching and learning analysis is performed for every program and department to ensure that the resources are properly aligned and the benefit measurement aligns with the priorities and mission of NPS. The School Board has taken an active role this year in developing the fiscal 2013 budget. A public hearings and a Town Hall meeting have been held to receive input from the public. There are three phases in the budget development process: 1) Superintendent’s Proposed Budget (Superintendent’s recommendation presented to the School Board); 2) School Board’s Proposed Budget (School Board’s recommendation to the City Council); and 3) School Board’s Approved Budget (School Board’s approved budget based on funding authorization/appropriation by the City).

64
NORFOLK PUBLIC SCHOOLS – Nationally Recognized. Globally Competitive.
Each February, the Proposed Budget is presented to the School Board. In addition, Public Hearings and Town Hall meetings on the operating budget are held. In March, the School Board’s Proposed Budget is approved and presented to the City of Norfolk on April 1st. The state code requires that the School Board presents a balanced budget, in which revenues equal expenditures, on or before April 1st. Changes are made throughout each phase and opportunities for public input are provided throughout the budget process, which generally runs from September to June. The budget is amended by authorization of the School Board and by City appropriation if revenues exceed budgetary estimates. Transfers within the adopted budget are approved administratively through the budget office with the approval of the Associate Superintendent, Business & Finance.
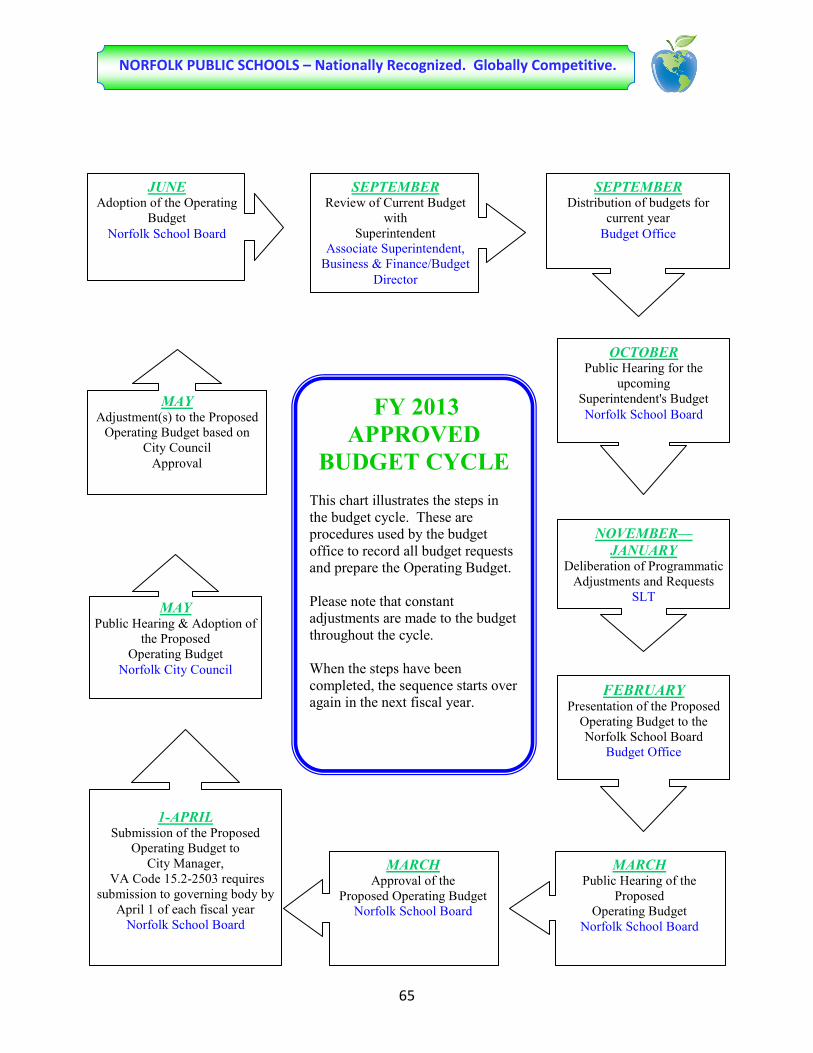
65
NORFOLK PUBLIC SCHOOLS – Nationally Recognized. Globally Competitive.
JUNE Adoption of the Operating
Budget Norfolk School Board
SEPTEMBER Review of Current Budget
with Superintendent
Associate Superintendent, Business & Finance/Budget
Director
SEPTEMBER Distribution of budgets for
current year Budget Office
MAY Adjustment(s) to the Proposed
Operating Budget based on City Council
Approval
MAY Public Hearing & Adoption of
the Proposed Operating Budget
Norfolk City Council
1-APRIL
Submission of the Proposed Operating Budget to
City Manager, VA Code 15.2-2503 requires
submission to governing body by April 1 of each fiscal year
Norfolk School Board
MARCH Approval of the
Proposed Operating Budget Norfolk School Board
MARCH Public Hearing of the
Proposed Operating Budget
Norfolk School Board
NOVEMBER—JANUARY
Deliberation of Programmatic Adjustments and Requests
SLT
FEBRUARY Presentation of the Proposed
Operating Budget to the Norfolk School Board
Budget Office
FY 2013 APPROVED
BUDGET CYCLE This chart illustrates the steps in the budget cycle. These are procedures used by the budget office to record all budget requests and prepare the Operating Budget. Please note that constant adjustments are made to the budget throughout the cycle. When the steps have been completed, the sequence starts over again in the next fiscal year.
OCTOBER Public Hearing for the
upcoming Superintendent's Budget Norfolk School Board

66
NORFOLK PUBLIC SCHOOLS – Nationally Recognized. Globally Competitive.
October/November 2011
Identification of programs and various costs
7-Oct-11 Public Hearing to hear citizens input for the FY 2013 Budget
19-Dec-11 Governor’s Budget Proposal for 2012-2014 Biennial Budget and Caboose Bill for 2011-2012
1-Feb-12 District Town Hall Meeting to hear citizens input for the FY 2013 Budget
15-Feb-12 Superintendent’s Recommended Budget presented to School Board
6-Mar-12 Public Hearing of Proposed Operating Budget
21-Mar-12 Adoption of the Proposed Operating Budget by School Board
1-Apr-12
Submission of School Board’s Proposed Operating Budget to Norfolk City Manager
April, 2012
City of Norfolk’s Proposed Operating and CIP Budgets to City Council
May, 2012
Public Hearing on City of Norfolk’s FY 2013 Proposed Operating and CIP Budgets
May, 2012
Adoption of City of Norfolk Annual Appropriation Ordinances for 2013 Operating and CIP Budgets
June, 2012 Submission of Approved Operating Budget to School Board
Fiscal Year 2013 Budget Development Calendar

67
NORFOLK PUBLIC SCHOOLS – Nationally Recognized. Globally Competitive.
Accountability In 2000-01, NPS began an ambitious journey of developing a Comprehensive Accountability System (CAS). A stakeholder-driven Quality Improvement Council (now known as the Norfolk Public Schools Guiding Coalition) was charged with creating the accountability plan. The system was under development and dissemination for a year prior to full implementation during the 2001-02 academic year. The annual cycle begins with the review of past performance, moves to the development of school and department accountability plans, and ends with school, department, and the division performance reports that summarize progress made during the past year. The system is data-driven and research-based. The framework of CAS provides three vantage points from which to gauge progress toward meeting the School Board goals. These views are called “tiers”. Tier I includes expectations on the state and division level, examples include the Standards of Learning-SOLs (Virginia’s standardized tests), Scholastic Aptitude Tests-SATs, dropout rates; Tier II includes school/department-based indicators that support Tier I results. Tier III includes the narrative part of the accountability system that “tells the story behind the numbers.” In 2010-2011, concentric circles were established to better indicate where a program/department falls in relation to directly or indirectly supporting instruction.
The Division Performance Report Executive Summary is available at www.npsk12.com and portions of the indicators are cited in this document in the Introduction Section and in part throughout this document.
Tier 1: A federal, state and/or local requirement Tier 2: Adds to the support of the federal, state and/or local requirements as defined in Tier 1 and directly supports the Achievable Results Tier 3: Adds to the support of federal, state and/or local requirements as defined in Tier 1, supports the Achievable Results and may duplicate services Tier 4: No federal, state and/or local requirement and would not diminish the progress toward meeting Achievable Results

68
NORFOLK PUBLIC SCHOOLS – Nationally Recognized. Globally Competitive.
Budget Components – Funds Norfolk Public School’s total resources are made up of several component funds: the Operating Fund, Child Nutrition Service Fund, Special Revenue Fund, and State, Federal, and other supplemental grant funds. The operating fund is the largest and most widely discussed since it supports the daily operational expenses of the school district. The Child Nutrition Services fund supports the food service program that serves breakfast and lunch to our students. Special Revenue funds are generally funds that have been re-appropriated by the City Council to the School Board for limited purposes. Supplemental grant funds are funds that are provided for very specific purposes, e.g. Title I funds, which must only be spent on improving student achievement for disadvantaged students. Details and comparison of several years by program and fund is available in APPENDIX A for the Operating Fund and APPENDIX B for Other Funds of this document.
All Sources of Revenue Fiscal 2012-2013 Proposed Budgets
Fund Actual Approved Approved2011 2012 2013
Operating Fund 292,334,365$ 290,550,439$ 302,033,320$
Child Nutrition Fund 15,243,448 15,259,500 16,704,000
Grant Funds* 33,246,433 45,312,873 33,648,098
Capital Improvement 3,000,000 3,000,000 3,000,000
Total All Funds 343,824,246$ 354,122,812$ 355,385,418$
* See Grants and Other Funds Section for deta i l s
69
NORFOLK PUBLIC SCHOOLS – Nationally Recognized. Globally Competitive.
Fiscal Year 2012-2013 School Board’s Budget Highlights Operating Budget Overview The FY 2012-13 Operating Budget revenues are expected to be $302,033,320, an increase of 4.0% over FY 2011-12 funding. This budget is based on the 2012 Special Session I of the General Assembly adopted amendments to the 2012-2014 Biennial Budget. The Commonwealth of Virginia’s revenue increased $8.4 million which includes $4.2 million in additional funding for the Virginia Retirement System due to increases in the contribution rates, $2.7 million increase in Sales Tax with the offsetting reduction of $1.5 million in Basic Aid, $1.0 million in additional Textbook funds and $1.6 million in grant funds that were reclassified to the Operating Fund. Federal Impact Aid funds are anticipated to decrease by $1.5 million and a reduction of $4.2 million of one-time 2010 Federal Jobs Bill funds is also eliminated. Also included in this budget is a re-appropriation $6.1 million in carry forward funds from prior fiscal years. The City’s regular appropriation increased by $1.1 million and due to an accounting change, the City’s appropriation also increased $1.5 million for school nursing services that is provided by Norfolk’s Public Health Department. Expenses for fiscal 2013 have been decreased by a total budget gap of $16.3 million. This includes the reductions in revenue and increases in expenses such as employer retirement contributions, health insurance, textbook purchases, school nurses and the reclassification of grant funds. Also included is a $1.5 million reduction in compensation due to savings anticipated from an Early Retirement Incentive Program and $2.3 million for attrition. The School Board’s Proposed Fiscal 2012-2013 Budget includes, for the first time in over four years, a wage increase for employees. The 7.0% wage increase included in this budget is in two components – a 2.0% general wage increase for all employees and a 5.0% mandated increase from the Virginia Retirement System legislative action approved by the House and Senate on March 10, 2012. This legislation drastically changes the Virginia Retirement System (VRS). One of those changes is who must pay the employee’s share of contribution to VRS. Most school divisions currently pay the 5.0% employee’s share. The legislation mandates that school divisions are required to pass the employee share of contribution on to the employee (the employees must pay their share). It also mandates that the school division gives the employee a 5.0% wage increase to offset the contribution they now must make. This legislation is not budget neutral. The budget impact is a $1.8 million increase in fringe benefits – the social security/medicare payroll taxes on the salary increase. This budget request does not include a request from the City to fund the Other Post Employment Benefit Liability that both the schools and the city have jointly. Norfolk Public Schools has worked to bring its liability down by approving specific policy changes to benefits. Norfolk Public Schools recognizes this liability and will continue to work towards reducing it. As a dependent school district, funding of the liability will be a joint decision between the city and Norfolk Public Schools and will be dealt with as a separate process from the budget request.

70
NORFOLK PUBLIC SCHOOLS – Nationally Recognized. Globally Competitive.
The Commonwealth of Virginia is still struggling with the economy as tax revenues are increasing slowly. The City of Norfolk is also struggling with reduced revenue again for fiscal 2013. The city and the state are working to cover existing obligations. This includes requesting that departments cut portions of current and planned expenses necessary to balance the budget. As shown in the School Operating Budget Revenue History graph below, NPS’ operating budget has been on a steady decline from $324.0 million in fiscal year 2009 to $302.0 million proposed for fiscal year 2013. Eighty percent ($9.2 million) of the $11.5 million net increase in fiscal year 2013 is due to the re-appropriation of unspent funds ($6.1 million) from prior fiscal years, an increase in appropriation ($1.5 million) due to an accounting change for the funding of school health services and an increase due to the reclassification of grant funds ($1.6 million) to the Operating Fund, with a corresponding expenditure offset.
Revenue Assumptions for Fiscal Year 2013: (Projected ADM 30,200 Students, K-12)
• Increase in State revenues as approved in the 2012 Special Session I of the General Assembly
- $6.7 million
• Reclassification of Commonwealth of Virginia grant funds to the Operating Fund - $1.6 million
• Carry Forward Funds from prior fiscal years - $6.1 million
• Increase in Regular City Appropriation - $1.1 million
• City Appropriation for School Nursing Services - $1.5 million
• Reduction in 2010 Federal Jobs Bill Funds - $4.2 million
• Reduction in Federal Impact Aid - $1.5 million

71
NORFOLK PUBLIC SCHOOLS – Nationally Recognized. Globally Competitive.
Major Expenditure Assumptions for Fiscal Year 2013:
• All existing programs and departments have been evaluated for efficiency, cost, and direct support of mission
• Standards of Quality (SOQ) funded positions were more closely aligned with state funding resulting in a total decrease of 135 positions, of which 10 are Central Office positions; the following positions are being eliminated:
o Reduction of 53 teacher contract positions o Reduction of 55 teacher assistant positions o Reduction of 3 administrator positions o Reduction of 6 other professional positions o Reduction of 5 clerical positions o Reduction of 4 trades positions o Reduction of 3 bus driver positions o Reduction of 6 custodial
• An increase of 12 classroom teacher positions:
o 8 positions moved from Title II Grant to be in compliance with the grant o 3 positions to add Grade 6 at Crossroads o 1 position for the ISAEP grant that was reclassified to the Operating Fund
• A general wage increase of 2.0% for all employees
• A 5.0% wage increase for full-time employees in VRS to implement March 10th legislation to
offset passing the 5.0% employee share contribution to VRS to the employee
• Virginia Retirement System (VRS) rates: o Professional – 11.66% o Non-professional – 10.23%
• Other VRS rates changes are:
o Group Life Insurance from 0.28% to 1.19% o Retiree Health Care Credit from 0.60% to 1.11%
• Health insurance is estimated to increase by 7.84% and not be passed on to the employees
• Includes tuition reimbursement benefit of 3 credit hours annually
• Teacher Shopping card reduced by one-half to $50 per teacher

72
NORFOLK PUBLIC SCHOOLS – Nationally Recognized. Globally Competitive.
Staffing Overview: The Fiscal Year 2012-2013 Operating Budget includes a staffing compliment of 4,088.6 full time equivalent positions to carry out the mission of education the children of the City of Norfolk. The majority of these positions are in Instructional Support, 78.6%.

73
NORFOLK PUBLIC SCHOOLS – Nationally Recognized. Globally Competitive.
Norfolk Public Schools has reduced full-time equivalent staff by 548 positions over the past two years with a recommendation for a net reduction of an additional 123 positions in fiscal year 2013. As much as possible, NPS will strive to accomplish this through vacancies and attrition.

74
NORFOLK PUBLIC SCHOOLS – Nationally Recognized. Globally Competitive.
The following two charts show the breakdown of Norfolk Public Schools employees by major classifications (Object Codes) and major programs. This reflects a net reduction of 123 positions – the elimination of 135 positions and the addition of 12 classroom teacher positions.
Approved Approved Approved
Object DESCRIPTION 2011 2012 2013
111000/111300 Administrators 57.25 56.25 53.25 111200 Superintendent 1.00 1.00 1.00
112000 Teachers (contract) 2,640.68 2,554.60 2,513.60 112600 Principals 51.00 50.00 50.00 112700 Assistant Principals 50.00 53.00 53.00
113000 Other Professionals 86.00 88.00 85.00 113100 Nurse 1.00 - - 113200 Psychologist 21.00 25.00 23.00 113400 Physical Therapists 8.00 8.00 8.00 113500 Occupational Therapists 2.00 2.00 2.00 114000 Paraprofessionals 58.00 57.00 57.00 114200 Security Officers 47.00 47.00 47.00 115000 Clerical 245.70 228.70 222.70 115100 Teacher Assistants 480.00 432.50 377.50 116000 Trades Persons 95.00 93.00 89.00 117000 Bus and Truck Drivers 252.00 251.50 248.50 118000 Laborers - - -
119000 Custodians and Service Persons 270.00 264.00 258.00 Total FTEs 4,365.63 4,211.55 4,088.55 Increase (decrease) over previous year (386.57) (154.08) (123.00)
Summary of FTEs by Object - Operating Budget
Note: The Approved 2012 column reflects adjustments made to FTE positions during this fiscal year.

75
NORFOLK PUBLIC SCHOOLS – Nationally Recognized. Globally Competitive.
Approved Approved
Prog Description 2011 2012 2013
Instructional Services110 Classroom Instruction 1,835.60 1,775.60 1,739.60 121 Guidance Services 141.00 132.00 132.00 122 Visiting Teachers and School Social Workers 21.00 23.00 23.00 131 Instructional Support Services 47.25 42.25 41.25 132 Media Services 102.00 81.50 81.50 141 Office of the Principal 233.00 214.00 214.00 171 Alternative Education 23.00 19.00 19.00 200 Special Education 639.08 639.00 602.00 300 Career and Technical Education 128.70 104.70 104.70 400 Gifted and Talented Program 40.00 35.00 30.00 500 Athletics and Virginia High School League Activities 6.00 6.00 6.00 510 Other Extra-Curricular Programs - - - 600 Summer School Program - - - 700 Adult Education Program 4.00 4.00 4.00 800 Non-Regular Day School Program 239.00 239.00 216.00
Total Instructional Services FTEs 3,459.63 3,315.05 3,213.05
Support Activities and FacilitiesD21 Central Administration 96.00 95.00 90.00 D22 Student Attendance and Health Services 48.00 50.00 48.00 D30 Pupil Transportation 284.00 281.00 278.00 D40 Operations and Maintenance 415.00 409.50 398.50 D53 Community Services - - - D66 Facility Improvements - - - D80 Informational Technology 63.00 61.00 61.00
Total Support Activities and Facilities FTEs 906.00 896.50 875.50 Total FTEs by Program - Operating Budget 4,365.63 4,211.55 4,088.55 Increase (decrease) over previous year (381.57) (154.08) (123.00)
Summary of FTEs by Program - Operating Budget
Note: The Approved 2012 column reflects adjustments made to FTE positions during this fiscal year.

76
NORFOLK PUBLIC SCHOOLS – Nationally Recognized. Globally Competitive.
Revenues Overview of Funding As a public school system in the Commonwealth of Virginia, our funding is from two main sources: the Commonwealth and the City, with an additional small percentage from the federal government and other local sources.
Sources of Operating Fund Revenue
Current year state revenue is linked directly to the current year student enrollment. For computation purposes, Average Daily Membership (ADM) is used. The projected ADM is multiplied by the SOQ funding amounts, subject to the composite index, to arrive at a figure for projected state revenue. Sales tax revenue is projected separately by the State Department of Education. Since all school divisions in Virginia are fiscally dependent, local revenues are projected based on budget negotiations

77
NORFOLK PUBLIC SCHOOLS – Nationally Recognized. Globally Competitive.
and discussions between the Norfolk School Board and Norfolk City Council. Included in fiscal year 2013 budget are carry forward funds from prior years that were re-appropriated for use in fiscal year 2013. Federal revenue consists primarily of Federal Impact Aid, which is based on the number of children in Norfolk that are associated with or impacted by federal programs. Impact Aid is supposed to mitigate the loss of tax dollars due to income and property connected with the federal government that is not taxed. Children living in government supplied housing on a military base are examples. State Funds Overview In fulfilling its constitutional mandate, the State Board of Education establishes the educational objectives for public education in Virginia. These objectives are known as the Standards of Quality (SOQ). These standards are subject to revision only by the General Assembly. The SOQ represent the minimum requirements for school divisions in Virginia to provide a program of high quality education for public elementary and secondary level. The Constitution of Virginia also requires the General Assembly to determine the manner in which funds are provided to meet the SOQ, including the apportionment of costs between the state and local governments. All basic aid and most categorical funding established within the SOQ funding formula are apportioned between the state and local governments according to a “composite index.” The composite index, also referred to as “estimated required local match”, is the state’s measure of the local ability to pay for education. In Norfolk, the composite index or estimated required local match for the FY 2012-13 budget year is 31.02%, up from 30.04% in 2010-12. This means that for every dollar of support called for by the SOQ, the City of Norfolk is required to locally match (provide appropriation to the school board) of an estimated 31 cents and the state about 69 cents. While the locality is free to exceed the minimum funding, it is rare that the state would provide funding beyond the minimum called for in the SOQ. The estimated required local match is included in the City Appropriation line of the revenue section of this document. The Fiscal Year 2013 budget numbers are based on the 2012 Special Session I of the General Assembly approved amendments to the 2012-2014 Biennial Budget. State funds, which account for $179.7 million of 59.6% of the total budget, are made up of:
• Standards of Quality (SOQ) funds ($117.3 million) include: Basic Aid, Fringe Benefit funds, Special Education, etc.
• Lottery Funded Programs ($26.9 million) • State Sales Taxes ($31.6 million) • Other State Funds ($3.9 million)
The SOQ funding level is determined by two major variables:
• Average Daily Membership (ADM) – the number of students in our district estimated at 30,200 for fiscal 2013
• Composite Index – a sliding scale from 0 to .8. The higher the number the higher the local share. Norfolk’s composite index for FY 2013 is 31.02%, which means that for every one dollar ($1.00) spent in a given state-supported area, the city must spend about 31 cents in what is called “local share.” (The City exceeds this minimum requirement.)
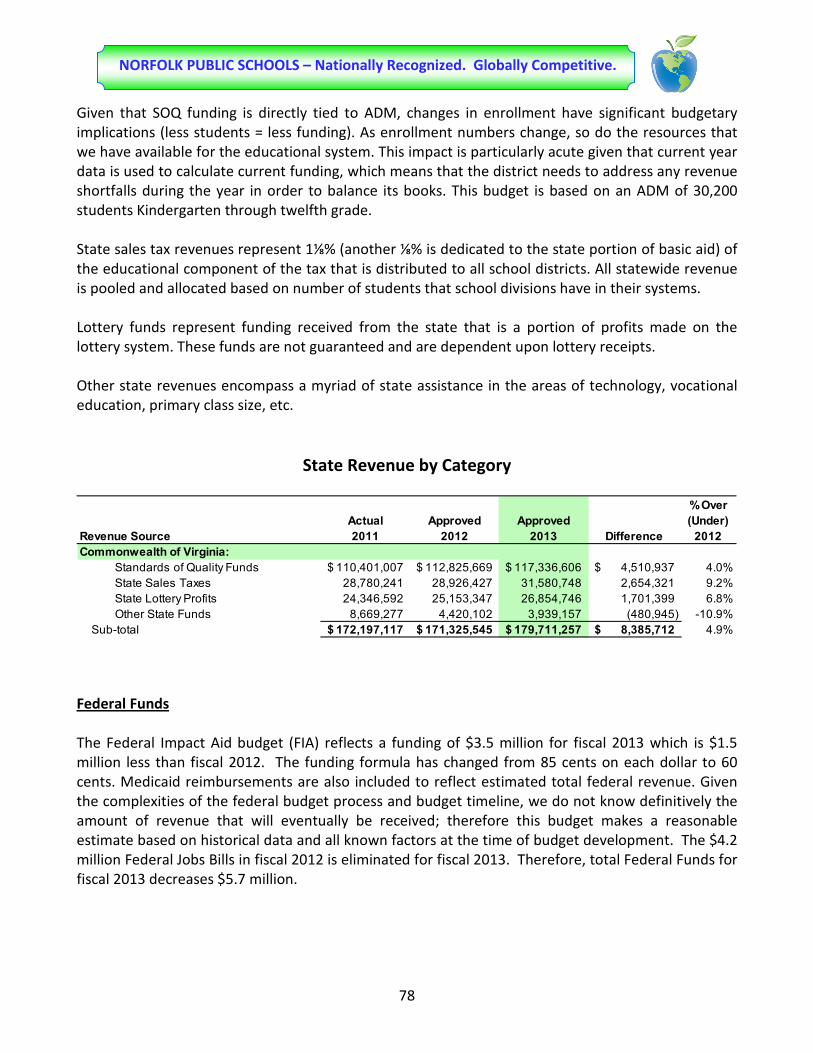
78
NORFOLK PUBLIC SCHOOLS – Nationally Recognized. Globally Competitive.
Given that SOQ funding is directly tied to ADM, changes in enrollment have significant budgetary implications (less students = less funding). As enrollment numbers change, so do the resources that we have available for the educational system. This impact is particularly acute given that current year data is used to calculate current funding, which means that the district needs to address any revenue shortfalls during the year in order to balance its books. This budget is based on an ADM of 30,200 students Kindergarten through twelfth grade.
State sales tax revenues represent 1⅛% (another ⅛% is dedicated to the state portion of basic aid) of the educational component of the tax that is distributed to all school districts. All statewide revenue is pooled and allocated based on number of students that school divisions have in their systems.
Lottery funds represent funding received from the state that is a portion of profits made on the lottery system. These funds are not guaranteed and are dependent upon lottery receipts. Other state revenues encompass a myriad of state assistance in the areas of technology, vocational education, primary class size, etc.
State Revenue by Category
Revenue SourceActual 2011
Approved 2012
Approved 2013 Difference
% Over (Under)
2012Commonwealth of Virginia:
Standards of Quality Funds 110,401,007$ 112,825,669$ 117,336,606$ 4,510,937$ 4.0%State Sales Taxes 28,780,241 28,926,427 31,580,748 2,654,321 9.2%State Lottery Profits 24,346,592 25,153,347 26,854,746 1,701,399 6.8%Other State Funds 8,669,277 4,420,102 3,939,157 (480,945) -10.9%
Sub-total 172,197,117$ 171,325,545$ 179,711,257$ 8,385,712$ 4.9% Federal Funds
The Federal Impact Aid budget (FIA) reflects a funding of $3.5 million for fiscal 2013 which is $1.5 million less than fiscal 2012. The funding formula has changed from 85 cents on each dollar to 60 cents. Medicaid reimbursements are also included to reflect estimated total federal revenue. Given the complexities of the federal budget process and budget timeline, we do not know definitively the amount of revenue that will eventually be received; therefore this budget makes a reasonable estimate based on historical data and all known factors at the time of budget development. The $4.2 million Federal Jobs Bills in fiscal 2012 is eliminated for fiscal 2013. Therefore, total Federal Funds for fiscal 2013 decreases $5.7 million.

79
NORFOLK PUBLIC SCHOOLS – Nationally Recognized. Globally Competitive.
City Appropriations The City of Norfolk negotiates appropriation for education of its students each year. The source of this revenue comes from local tax resources and accounts for 35.5% of the fiscal year 2013 budget. In addition to a $1.1 million increase in the regular appropriation, the City appropriated $1.5 million for school nursing services to be paid to the Norfolk Public Health Department (a change in accounting method). Re-Appropriated Carry Forward Funds Unexpended school and education funds in a fiscal year must be re-appropriated for use in a forthcoming fiscal year. Due to significant staff reductions, NPS set aside funds in a 2010 year-end encumbrance to cover the cost of unemployment. Fortunately, NPS was able to make significant staff reductions through attrition and retirements thereby lowering the cost of unemployment claims. As a result of this, the City re-appropriated $1.0 million from the 2010 year-end encumbrance to fiscal year 2013. Unexpended funds from prior fiscal years were set aside in a Bus Reserve Fund for the replacement of over-aged buses. The City re-appropriated these funds ($2.1 million) for general operating fund use of fiscal year 2013 and made a commitment to fund school bus replacement with other City funds. Re-appropriation and Carry Forward Authority language was included in the 2011 General Assembly Session and extended carry forward authority to FY 2012 into FY 2013. NPS will institute a hiring and spending freeze to save funds in the 2012 fiscal year to carry forward to fiscal year 2013 to assist with its funding challenge. As a result of this, the City re-appropriated $2.0 million in 2012 fiscal year state funds to carry forward into fiscal year 2013. Also, Sales Tax revenue for fiscal year 2012 was higher than anticipated and the City appropriated these additional funds ($1.0 million) for fiscal year 2013. Miscellaneous Revenue Other local funds include revenue received from tuitions, fees, building rentals, etc. Interest income is decreased due to much lower interest rates in the slowing economy. It also includes miscellaneous revenue for surplus sales, insurance reimbursements, and other small revenue items received on a one-time basis as an average of $4.2 million annually.

80
NORFOLK PUBLIC SCHOOLS – Nationally Recognized. Globally Competitive.
The following is a summary of non-state revenues:
Actual 2011
Approved 2012
Approved 2013 Difference
% Over (Under)
2012Norfolk Support 104,511,131$ 104,511,131$ 107,186,600$ 2,675,469$ 2.6%Federal 12,867,316 10,536,537 4,836,537 (5,700,000) -54.1%Re-Appropriated Carry Forward Funds - - 6,121,700 6,121,700 100.0%Other Local Sources 2,758,801 4,177,226 4,177,226 - 0.0%Total Non-State Revenues 120,137,248$ 119,224,894$ 122,322,063$ 3,097,169$ 2.6%
Other Federal, State, & Other Grants In addition to the operating budget, which represents the “nuts and bolts” of the system, the district receives significant (approximately $33.4 million in federal, state, and corporate/other grants) supplemental funding, particularly from the federal government, in the form of specific-purpose grants including Class Size Reduction Initiative, Title 1 (No Child Left Behind Act-NCLB), IDEA (Individuals with Disabilities Education Act), etc. These funds allow the district to offer services that would, otherwise, not be able to be offered within the confines of the operating budget. Funding from three Commonwealth of Virginia revenue sources were re-classified from the Grants and Other Funds Section to the Operating Fund. They are:
• VPSA Technology Funds - $1.6 million • ISAEP (Individualized Student Alternative Ed Program - $62,869 • Teacher Mentor Program - $31,242
The challenges and current initiatives, in regard to these funds, are to ensure that programs are integrated and aligned with the overall mission, goals and objectives of the district as a whole.

81
NORFOLK PUBLIC SCHOOLS – Nationally Recognized. Globally Competitive.
EXPENDITURES Expenditures Overview The largest single component of our budget is staffing, which represents 84.14% (wages and fringe benefits) as the chart indicates.
Fiscal 2013 Expenditures by Group
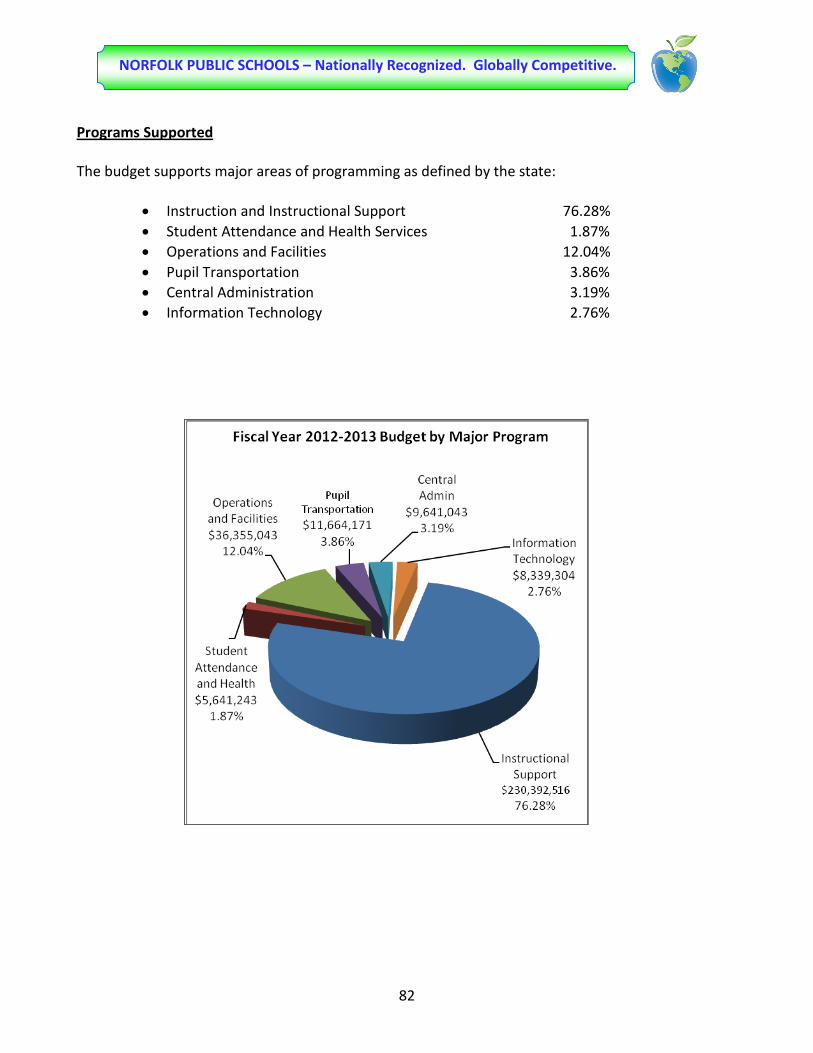
82
NORFOLK PUBLIC SCHOOLS – Nationally Recognized. Globally Competitive.
Programs Supported The budget supports major areas of programming as defined by the state:
• Instruction and Instructional Support 76.28% • Student Attendance and Health Services 1.87% • Operations and Facilities 12.04% • Pupil Transportation 3.86% • Central Administration 3.19% • Information Technology 2.76%

83
NORFOLK PUBLIC SCHOOLS – Nationally Recognized. Globally Competitive.
Operating Budget - Program Detail
DESCRIPTION
Positions Approved
20123
Positions Approved
2013Actual 2011
Approved 2012
Approved 2013
% of Budget
Instructional Services110 Classroom Instruction 1,775.60 1,739.60 115,430,986$ 114,725,317$ 119,596,875$ 39.60%121 Guidance Services 132.00 132.00 8,956,272 8,735,074 9,135,996 3.02%122 School Social Workers 23.00 23.00 1,562,040 1,518,160 1,776,550 0.59%131 Instructional Support Services 42.25 41.25 5,641,823 5,776,648 5,696,613 1.89%132 Media Services 81.50 81.50 6,250,396 5,764,991 6,057,550 2.01%141 Office of the Principal 214.00 214.00 16,088,845 15,754,126 16,884,567 5.59%170 Alternative Education 19.00 19.00 1,193,971 1,420,025 1,485,918 0.49%200 Special Education 639.00 602.00 42,315,095 43,003,242 43,014,329 14.24%300 Career and Technical Education 104.70 104.70 8,179,106 7,769,736 7,848,584 2.60%400 Gifted and Talented Program 35.00 30.00 2,818,304 2,807,930 2,657,506 0.88%500 Athletics and Virginia High School League 6.00 6.00 1,760,086 1,798,243 1,796,050 0.59%510 Other Extra-Curricular Programs - - 1,127,642 1,380,782 1,149,083 0.38%600 Summer School Program - - 1,114,307 1,293,191 1,331,137 0.44%700 Adult Education Program 4.00 4.00 588,241 674,417 715,194 0.24%800 Non-Regular Day School Program 239.00 216.00 11,125,168 11,006,024 11,246,564 3.72%
Total Instructional Services 3,315.05 3,213.05 224,152,280$ 223,427,908$ 230,392,516$ 76.28%
Support Activities and FacilitiesD21 Central Administration 95.00 90.00 8,793,728$ 9,387,282$ 9,641,043$ 3.19%D22 Student Attendance and Health Services 50.00 48.00 3,591,762 3,779,750 5,641,243 1.87%D30 Pupil Transportation 281.00 278.00 10,779,295 11,603,631 11,664,171 3.86%D40 Operations and Maintenance 409.50 398.50 35,188,292 33,880,937 34,710,178 11.49%D51 Child Nutrition Services (Jobs Bil l) 0.00 0.00 112,494 - - 0.00%D53 Community Services (Jobs Bil l) 0.00 0.00 7,751 - - 0.00%D66 Facil ity Improvements 0.00 0.00 1,612,951 1,644,865 1,644,865 0.54%D80 Informational Technology 61.00 61.00 7,308,652 6,857,086 8,339,304 2.76%
Total Support Activities and Facilities 896.50 875.50 67,394,924$ 67,153,551$ 71,640,803$ 23.72%Total Operating Budget 4,211.55 4,088.55 291,547,205$ 290,581,459$ 302,033,320$ 100.00%
See APPENDIX A for more detailed information by program and multi-year comparison.

84
NORFOLK PUBLIC SCHOOLS – Nationally Recognized. Globally Competitive.
Operating Budget - Object Detail
Positions Positions Actual Approved Approved
% Increase/Decrease
OBJECT DESCRIPTION 2012 2013 2011 2012 2013 over 2012Wages and Employee Benefits
111000 Administrators 52.25 49.25 4,571,436$ 4,265,081$ 4,264,964$ 0.0%111100 Board Members - 22,769 23,000 23,460 2.0%111200 Superintendent 1.00 1.00 189,933 200,000 214,000 7.0%111300 Associate Superintendent 4.00 4.00 493,109 478,079 511,544 7.0%112000 Teachers (Contract) 2,554.60 2,513.60 124,230,245 120,450,139 123,318,349 2.4%112100 Teachers (Hourly/Extra Pay) 2,892,366 3,085,959 2,852,700 -7.6%112600 Principals 50.00 50.00 4,519,386 4,411,636 4,628,837 4.9%112700 Assistant Principals 53.00 53.00 3,492,526 3,576,622 3,769,099 5.4%113000 Other Professionals 98.00 85.00 5,673,707 5,607,824 5,217,577 -7.0%113100 Nurse - - 58,132 - - 0.0%113200 Psychologist 25.00 23.00 1,341,243 1,288,205 1,457,670 13.2%113400 Physical Therapist (Reclass from Other Prof) - 8.00 - - 516,833 0.0%113500 Occupational Therapists (Reclass from Oth Prof) - 2.00 - - 131,616 0.0%113600 Other Professionals (Hourly) - - 53,979 40,000 - -100.0%114000 Paraprofessionals 57.00 57.00 2,414,044 2,390,232 2,508,431 4.9%114100 Paraprofessionals (Part-time) 181,848 261,287 337,016 29.0%114200 Security Officers 47.00 47.00 1,073,451 1,060,379 1,127,061 6.3%114300 Security Officers (Part-time) 96,860 159,291 141,656 -11.1%115000 Clerical 228.70 222.70 7,828,153 7,284,254 7,567,732 3.9%115100 Teacher Assistants 432.50 377.50 8,441,242 7,409,015 6,967,859 -6.0%115200 Teacher Assistants (Part-time) 191,931 484,888 429,282 -11.5%115600 Clerical (Hourly) 393,545 427,090 429,792 0.6%115800 Staff Overtime 1,884 100,000 118,432 18.4%116000 Trades Persons 93.00 89.00 4,161,544 4,131,351 4,202,741 1.7%116100 Trades Persons (Part-time) 141,638 119,880 117,333 -2.1%117000 Bus and Truck Drivers 251.50 248.50 3,111,641 3,120,967 3,271,840 4.8%117100 Bus and Truck Drivers (Part-time) 1,489,225 1,558,466 1,388,766 -10.9%118100 Laborers (Part-time) - - - 100.0%119000 Custodians and Service Persons 264.00 258.00 6,843,703 6,842,915 7,217,022 5.5%119100 Custodians and Service Persons (Part-time) 686,538 395,653 401,531 1.5%119200 Bus Attendants (Part-time) 616,528 643,365 622,200 -3.3%119400 Child Nutritioni Staff (Jobs Bill) 104,500 - - 0.0%152000 Substitute Teachers (Daily) 1,303,457 1,387,457 1,196,488 -13.8%152100 Substitute Teachers (Long-term) 1,231,744 1,665,083 1,596,384 -4.1%162100 Stipends 2,019,844 2,170,307 2,117,608 -2.4%
Total Wages 4,211.55 4,088.55 189,872,150$ 185,038,425$ 188,665,823$ 2.0%
Employee Benefits (Health, FICA, VRS, Life)210000 Social Security and Medicare 14,071,472$ 14,512,561$ 14,432,936$ -0.5%221000 Virginia Retirement System 17,065,941 20,915,333 22,187,153 6.1%230000 Medical Insurance 21,546,148 21,565,867 23,865,106 10.7%240000 Group Life Insurance 467,649 482,887 2,105,000 335.9%260000/270000 Workers Compensation/Unemployment 1,306,225 2,731,774 2,178,597 -20.2%285000 Sick Leave Benefits 440,603 401,621 401,622 0.0%290000 Tuition Assistance - 291,955 291,955 0.0%
Total Employee Benefits 54,898,037 60,901,998 65,462,369 7.5%Total Wages and Employee Benefits 244,770,187$ 245,940,423$ 254,128,192$ 3.3%
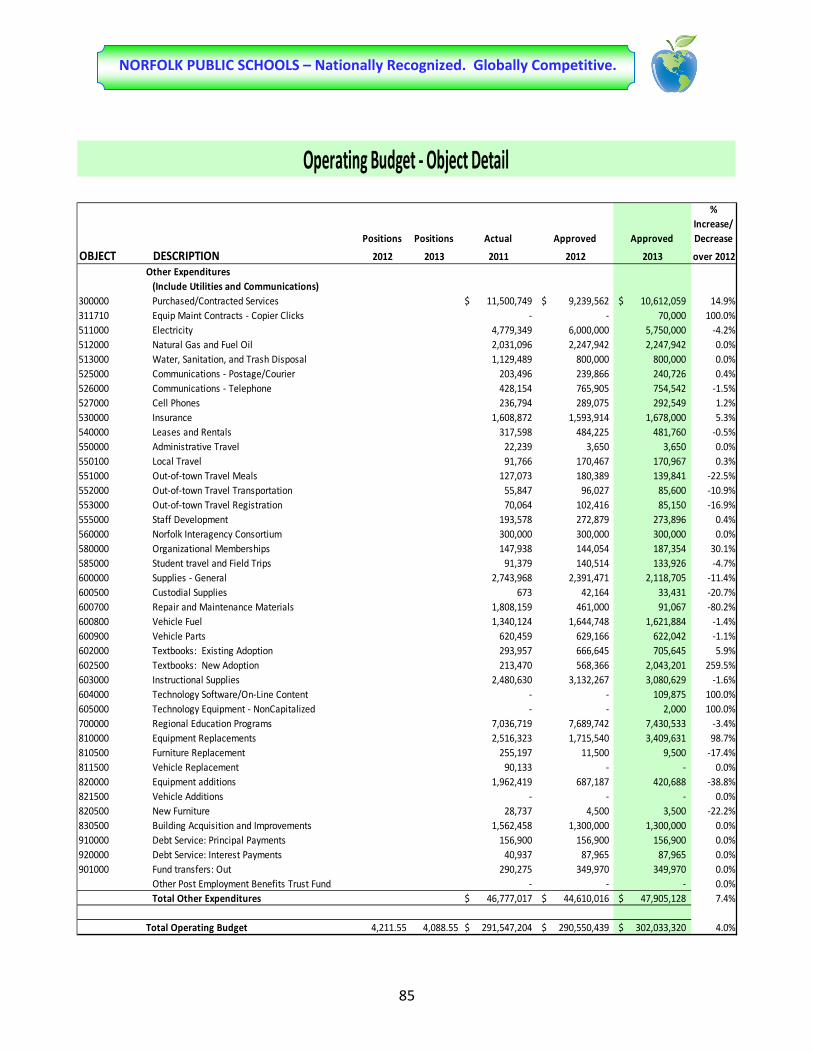
85
NORFOLK PUBLIC SCHOOLS – Nationally Recognized. Globally Competitive.
Operating Budget - Object Detail
Positions Positions Actual Approved Approved
% Increase/Decrease
OBJECT DESCRIPTION 2012 2013 2011 2012 2013 over 2012Other Expenditures
(Include Utilities and Communications)300000 Purchased/Contracted Services 11,500,749$ 9,239,562$ 10,612,059$ 14.9%311710 Equip Maint Contracts - Copier Clicks - - 70,000 100.0%511000 Electricity 4,779,349 6,000,000 5,750,000 -4.2%512000 Natural Gas and Fuel Oil 2,031,096 2,247,942 2,247,942 0.0%513000 Water, Sanitation, and Trash Disposal 1,129,489 800,000 800,000 0.0%525000 Communications - Postage/Courier 203,496 239,866 240,726 0.4%526000 Communications - Telephone 428,154 765,905 754,542 -1.5%527000 Cell Phones 236,794 289,075 292,549 1.2%530000 Insurance 1,608,872 1,593,914 1,678,000 5.3%540000 Leases and Rentals 317,598 484,225 481,760 -0.5%550000 Administrative Travel 22,239 3,650 3,650 0.0%550100 Local Travel 91,766 170,467 170,967 0.3%551000 Out-of-town Travel Meals 127,073 180,389 139,841 -22.5%552000 Out-of-town Travel Transportation 55,847 96,027 85,600 -10.9%553000 Out-of-town Travel Registration 70,064 102,416 85,150 -16.9%555000 Staff Development 193,578 272,879 273,896 0.4%560000 Norfolk Interagency Consortium 300,000 300,000 300,000 0.0%580000 Organizational Memberships 147,938 144,054 187,354 30.1%585000 Student travel and Field Trips 91,379 140,514 133,926 -4.7%600000 Supplies - General 2,743,968 2,391,471 2,118,705 -11.4%600500 Custodial Supplies 673 42,164 33,431 -20.7%600700 Repair and Maintenance Materials 1,808,159 461,000 91,067 -80.2%600800 Vehicle Fuel 1,340,124 1,644,748 1,621,884 -1.4%600900 Vehicle Parts 620,459 629,166 622,042 -1.1%602000 Textbooks: Existing Adoption 293,957 666,645 705,645 5.9%602500 Textbooks: New Adoption 213,470 568,366 2,043,201 259.5%603000 Instructional Supplies 2,480,630 3,132,267 3,080,629 -1.6%604000 Technology Software/On-Line Content - - 109,875 100.0%605000 Technology Equipment - NonCapitalized - - 2,000 100.0%700000 Regional Education Programs 7,036,719 7,689,742 7,430,533 -3.4%810000 Equipment Replacements 2,516,323 1,715,540 3,409,631 98.7%810500 Furniture Replacement 255,197 11,500 9,500 -17.4%811500 Vehicle Replacement 90,133 - - 0.0%820000 Equipment additions 1,962,419 687,187 420,688 -38.8%821500 Vehicle Additions - - - 0.0%820500 New Furniture 28,737 4,500 3,500 -22.2%830500 Building Acquisition and Improvements 1,562,458 1,300,000 1,300,000 0.0%910000 Debt Service: Principal Payments 156,900 156,900 156,900 0.0%920000 Debt Service: Interest Payments 40,937 87,965 87,965 0.0%901000 Fund transfers: Out 290,275 349,970 349,970 0.0%
Other Post Employment Benefits Trust Fund - - - 0.0%Total Other Expenditures 46,777,017$ 44,610,016$ 47,905,128$ 7.4%
Total Operating Budget 4,211.55 4,088.55 291,547,204$ 290,550,439$ 302,033,320$ 4.0%

86
NORFOLK PUBLIC SCHOOLS – Nationally Recognized. Globally Competitive.
Per Pupil Expenditures
Student Enrollment Projections through Fiscal 2017
16408 16222 16139 15964 15984 15920 15865 15721 15618 15494 15369
7900 7320 6774 6675 6616 6736 6810 6634 6512 6381 6344
9044 9132 9100 8872 8652 8237 7971 7927 7787 7868 7858
2062 2173 2210 2302 2344 2380 2380 2380 2380 2380 2380
0
5,000
10,000
15,000
20,000
25,000
30,000
35,000
06-07 07-08 08-09 09-10 10-11 11-12 12-13 13-14 14-15 15-16 16-17
Elementary Middle High Pre-K

87
NORFOLK PUBLIC SCHOOLS – Nationally Recognized. Globally Competitive.
Acknowledgments: Special thanks to the Budget department, Department of Strategic Evaluation, Assessment and Support and to the Communications Department for their hard work and dedication on compiling data need for the budget book. Requests for Information This executive summary and introduction are designed to provide citizens, taxpayers, customers, and other interested parties with a general overview of the School Board’s budget/finances. Additional information is provided in the budget document and other Norfolk Public Schools support documents. We would be happy to provide any information you may need. Questions concerning any of the information provided in this report or requests for additional financial information should be addressed to Mr. John Maniscalco, CPA Associate Superintendent, Business & Finance at (757) 628-3482 or Mrs. Rhonda R. Ingram, CPA Senior Director of Budget, at (757) 628-3456.
88
NORFOLK PUBLIC SCHOOLS – Nationally Recognized. Globally Competitive.
Revenue
In fulfilling its constitutional mandate, the State Board of Education establishes the educational objectives for public education in Virginia. These objectives are known as the Standards of Quality (SOQ). The Constitution of Virginia also requires the General Assembly to determine the manner in which funds are provided to meet the SOQ, including apportionment of costs between the state and local governments. All basic aid and most categorical funding established within the SOQ funding formula are apportioned between the state and local government according to the composite index. In Norfolk, the composite index for fiscal years 2012-2014 is 31.02%. This means for every dollar of support called for by the SOQ, the City of Norfolk is required to pay about 31 cents under the state’s formula. While the locality is free to exceed the minimum funding, it is rare that the state would provide funding beyond the minimum called for in the SOQ.
The 2012-2014 Biennial Budget as Introduced by Governor McDonnell on December 19, 2011 includes increases in state funding for technical updates to the Standards of Quality, incentive, categorical, supplemental education, and Lottery-funded accounts as part of the biennial re-benchmarking process. In addition to the technical updates and new composite index, key recommendations in Governor McDonnell’s 2012-2014 Introduced Budget impacting public education funding include (Source: State Superintendent of Public Instruction Superintendent’s Memo #332-11):
• New sales tax and Lottery revenue estimates;
• Revisions to the employer rates for fringe benefit contributions paid to the Virginia Retirement System (VRS);
• Removal of funding for non-personal inflation;
• Removal of funding for the Cost of Competing Adjustment for support positions;
• Includes a portion of the American Recovery and Reinvestment Act (ARRA) State Fiscal Stabilization Fund (SFSF) revenues from fiscal year 2010 in calculating the SOQ federal revenue deduct for the 2012-2014 biennium; and
• New program initiatives proposed by the Governor.
State revenue under the Governor’s Introduced Biennial Budget for fiscal year 2013 with an estimated March Average Daily Membership (ADM) projection of 30,200 students is projected to increase 1.6% or $2.7 million over the current fiscal year. This includes a $1.7 million increase in sales tax based on the state’s projection, adjusted for historical trend analysis.
89
NORFOLK PUBLIC SCHOOLS – Nationally Recognized. Globally Competitive.
On January 13, 2012, Governor McDonnell proposed several executive amendments to the 2012-2014 Biennial Budget introduced in December. The executive amendments which impact public education are:
• An amendment to update the free lunch eligibility percentages used in the calculation of state funding for the K-3 Primary Class Size Reduction Program to reflect October 2010 free lunch percentages which results in an increase in state funding.
• An amendment to fund 100 percent versus 25 percent of eligible third graders for the Early Reading Intervention Program.
Norfolk Public Schools state revenue under these two amendments increases $1.1 million: $0.9 million for the K-3 Primary Class Size Reduction Program and $0.2 million for the Early Reading Intervention Program.
On April 18, 2012, the 2012 Special Session I of the General Assembly adopted amendments to the 2012-2014 biennial budget. These amendments changed the 2012-2014 biennial budget as introduced by the Governor at the regular session on December 19, 2011 and reintroduced for the Special Session. The adopted amendments by the General Assembly increased total state funding by $6.7 million or 3.9% over fiscal year 2012.
In addition to the $6.7 million increase in revenue, total revenue from the Commonwealth of Virginia includes a reclassification of $1.7 million for certain state funding streams – VPSA Technology Funds, Teacher Mentor Funds and ISAEP Funds – from our Grant Funds to the Operating Fund.
School divisions in Virginia are fiscally dependent; therefore, local revenues for NPS are based on budget negotiations and discussions between the Norfolk School Board and Norfolk City Council.
In the past, the City of Norfolk supported Norfolk Public School Nurses via a $1.5 million appropriation to the Norfolk Public Health Department. While the City will continue to fund school nurses, the accounting for this will change in fiscal year 2013 wherein the appropriation will be shown in the schools’ budget. The City will make the $1.5 million appropriation to Norfolk Public Schools’ and the schools will have an offsetting expenditure to the Norfolk Public Health Department.
Norfolk Public School requested that the City of Norfolk re-appropriate a total of $3.0 million of carry forward funds from prior fiscal years. The City of Norfolk approved and re-appropriated a total of $6.1 million of carry forward funds from prior fiscal years. Due to significant staff reductions, NPS set aside funds in 2010 year-end encumbrances to cover the cost of

90
NORFOLK PUBLIC SCHOOLS – Nationally Recognized. Globally Competitive.
unemployment. Fortunately, NPS was able to make significant staff reductions through attrition and retirements thereby lowering the cost of unemployment claims. As a result of this, NPS requested the City to re-appropriate $1.0 million from the 2010 year-end encumbrance. Also from prior years, a total of $2.1 million had been set aside in a Bus Reserve Fund for the replacement of our aging bus fleet. In lieu of re-appropriating these funds in fiscal year 2012 for the purchase of buses, the City re-appropriated these funds to NPS as a measure to close the funding gap for fiscal year 2013. Along with appropriating these funds for general operating use, the City agreed to assume the responsibility to fund bus replacement with other City funds. Re-appropriation and Carry Forward Authority language included in the 2011 General Assembly Budget Session “1) clarifies that local governments must re-appropriate any FY 2011 qualifying state funds carried forwarded into FY 2012 solely for school division purposes and 2) extends the carry forward authority to FY 2012 into FY 2013”. NPS instituted a hiring and spending freeze to save funds in fiscal year 2012 to carry forward into fiscal year 2013 to assist with the funding challenge. NPS requested that the City re-appropriate $2.0 million of state funds carry forward from the 2012 fiscal year into the 2013 fiscal year. Also, sales tax revenue in fiscal year 2012 was higher than anticipated and $1.0 million are being appropriated in fiscal year 2013. On March 10, 2012, the House and Senate approved legislation that mandated changes in the Virginia Retirement System effective July 1, 2012. One of these changes requires school divisions to pass the employee contribution on to their employees (currently, school divisions can opt to pay the employee contribution and NPS currently pays the employee share of contribution). The mandate also states that when this is passed on to the employees, the employer must give the employees a 5.0% salary increase to offset the contribution. To implement this mandate and to give our employees a 2.0% general wage increase, required an additional $6.6 million. This mandate has been funded with state, carry forward and local funding. The City increased its regular appropriation to NPS by $1.1 million.
The carry forward portion of the 2010 Jobs Bill expires in fiscal year 2012, which is a reduction of $4.2 million.
Federal revenue consists primarily of Federal Impact Aid, based on the number of children in Norfolk who are associated with or impacted by federal programs. Impact Aid is supposed to mitigate the loss of tax dollars due to income and property connected with the federal government that is not subject to local property tax. Children living in government supplied housing on a military base are examples. The Federal government has indicated that it will fund Impact Aid at 60 cents on the dollar versus 85 cents. This equates to a reduction in Impact Aid funding of $1.5 million.

91
NORFOLK PUBLIC SCHOOLS – Nationally Recognized. Globally Competitive.
Total Operating Fund revenue for fiscal year 2013 is projected to be $302,033,320 which is an increase of $11.4 million or 4.0%.
A summary of all Operating Fund revenue and multi-year comparisons can be found in APPENDIX A of this document.
Federal Grants are legislated by the federal government based on specific populations or classes of children to be served. Federal and state grants are kept in separate funds and are shown in the Grants and Other Funds Section of this document and APPENDIX B.

92
NORFOLK PUBLIC SCHOOLS – Nationally Recognized. Globally Competitive.
State Educational Funding Overview
The Commonwealth of Virginia funds the Standards of Quality outlined in Virginia’s Constitution and codified in the Code of Virginia. State revenue is linked directly to the current year student enrollment. For computation purposes, Average Daily Membership (ADM) is used. The projected ADM is multiplied by the SOQ funding amounts, subject to the composite index, to arrive at a figure for projected state revenue.
The chart below shows the trend of state funding since the 2007 fiscal year.
$270.0 $290.0 $310.0 $330.0
Actual 2007
Actual 2008
Actual 2009
Actual 2010
Actual 2011
Approved 2011-2012
Approved 2012-2013
In Million Dollars
Fisca
l
Year
s
School Operating Budget Revenue History
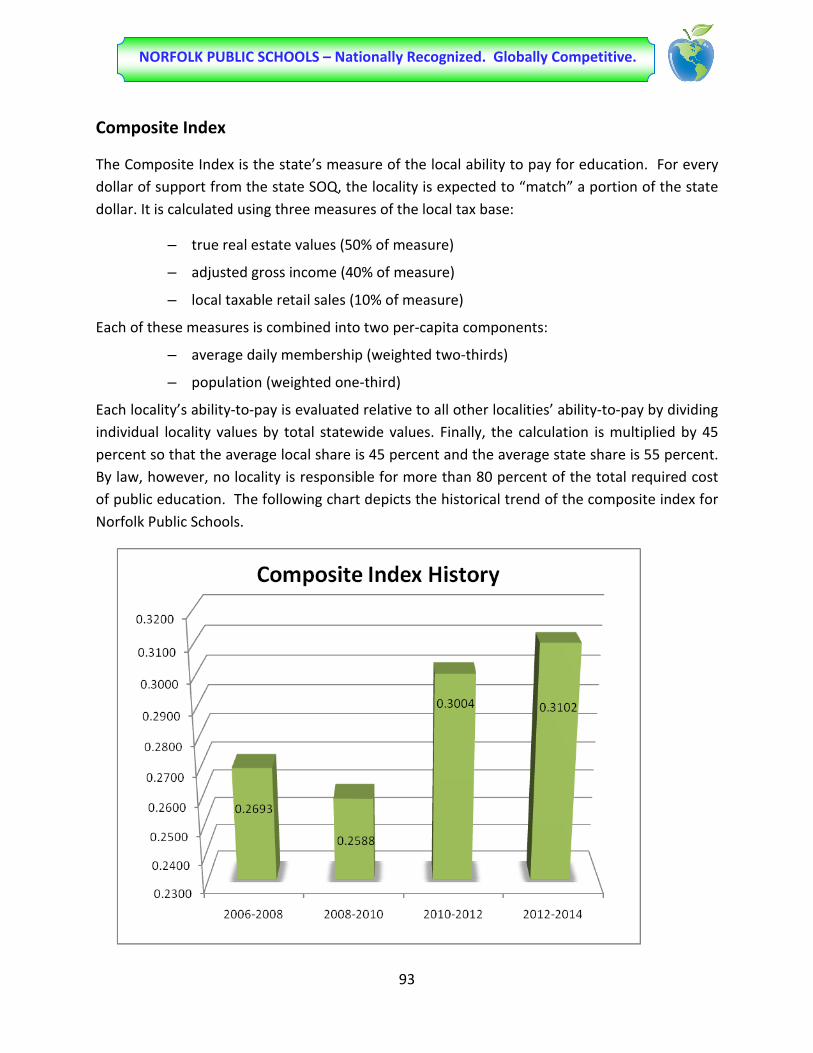
93
NORFOLK PUBLIC SCHOOLS – Nationally Recognized. Globally Competitive.
Composite Index
The Composite Index is the state’s measure of the local ability to pay for education. For every dollar of support from the state SOQ, the locality is expected to “match” a portion of the state dollar. It is calculated using three measures of the local tax base:
– true real estate values (50% of measure)
– adjusted gross income (40% of measure)
– local taxable retail sales (10% of measure)
Each of these measures is combined into two per-capita components:
– average daily membership (weighted two-thirds)
– population (weighted one-third)
Each locality’s ability-to-pay is evaluated relative to all other localities’ ability-to-pay by dividing individual locality values by total statewide values. Finally, the calculation is multiplied by 45 percent so that the average local share is 45 percent and the average state share is 55 percent. By law, however, no locality is responsible for more than 80 percent of the total required cost of public education. The following chart depicts the historical trend of the composite index for Norfolk Public Schools.

94
NORFOLK PUBLIC SCHOOLS – Nationally Recognized. Globally Competitive.
Direct Aid to Public Education
There are four basic types of Direct Aid funding for public education in Virginia:
• Standards of Quality (SOQ)
• Categorical (Mandated Programs)
• Incentive-Based Funds
• Lottery Funded Programs
The funding stream provided for the Standards of Quality is not meant to reimburse school divisions for all actual educational expenditures. Therefore, not all of the expenditures incurred by school divisions, and reported on the Annual School Report (ASR), are included in the SOQ cost calculations. In addition, funding provided for the cost areas recognized by the SOQ is provided based on statewide prevailing averages, not based on divisions’ actual expenditures.
Further, the following educational programs reported on the Annual State Report are not funded through the SOQ:
• summer school
• adult education
• non-regular day education (such as Head Start)
• non-LEA programs (such as Hospitals, Clinics, and Detention Homes program)
• school food services
Standards of Quality (SOQ)
The Standards of Quality (SOQ) prescribe the minimum foundation program that all public schools in Virginia must meet. The standards are established in the Constitution of Virginia and are defined in the Code of Virginia. The standards can only be altered by the Board of Education and the General Assembly.
The prevailing cost method is used to determine funding levels for SOQs. There are two funding categories for the accounts listed below – funding for instructional standards and funding for support costs.
Direct Aid to Public Education includes the following accounts:
• Basic Aid • Gifted Education • Remedial Education

95
NORFOLK PUBLIC SCHOOLS – Nationally Recognized. Globally Competitive.
• Vocational Education • Special Education • Fringe Benefits – Retirement / Social Security / Group Life • Retiree Health Care Credit • Textbooks • Remedial Summer School • Sales Tax
Data Requirements for Funding of Instructional Costs:
• Instructional Position Standards
• Annual School Report (ASR) Financial Data (for funded instructional salaries)
• Salary Inflation Factor
• Fall Membership by School
• Fall Membership Projections
• ASR Average Daily Membership (ADM)
• March 31 ADM (Actual and Projected)
• Special Education Child Count
• Required Vocational Education Positions
• Virginia State Assessment Program (VSAP) Lower Quartile Data (Remedial)
• Social Security Rate and Cap
• Group Life Rate
• Health Care Premium Amount
• Instructional Virginia Retirement System (VRS) Rate (Employer Share)
• Cost of Competing Factors
The SOQ funds functions that support instructional activities including non-instructional support staff and day to day school operations. These support functions include areas such as:
• instructional support
• pupil transportation
• attendance and health
• substitute teachers
• professional development
• operations and maintenance of school facilities

96
NORFOLK PUBLIC SCHOOLS – Nationally Recognized. Globally Competitive.
Support Positions Funded in the Standards of Quality:
In order to calculate support costs, the SOQ funding model uses actual expenditure data from a previous fiscal year to determine a weighted average of what it costs to operate a school division - this is called the “prevailing cost.”
SUPPORT POSITIONS FUNDED IN STANDARDS OF QUALITY BASIC AID
Professional Support Positions
Professional Support Positions Cont. Assistant Superintendent Attendance and Health Administrative
Attendance and Health Administrative
Instructional Professional
Attendance and Health Other Professional
Guidance Administrative Social Worker Administrative Attendance and Health Technical/Clerical Social Worker Instructional Attend & Health Clerical
Social Worker Other Attend & Health Technical
Homebound Administrative Improvement Administrative Operation & Maintenance Professional Improvement Instructional Op & Maint. Administrative Media Administrative Op & Maint. Other Professional Media Instructional
Non-Professional Support
Instructional Technical/Clerical
Operation & Maintenance Tech. & Clerical
Guidance Technical
Op & Maint. Technical
Guidance Clerical Op & Maint. Clerical
Social Worker Clerical
Op & Maint. Trades
Homebound Clerical
Op & Maint. Laborer
Improvement Technical
Op & Maint. Service
Improvement Clerical Media Technical
Media Clerical
Principal Technical
Pupil Transportation Principal Clerical
Superintendent
School Board Members Funded instructional salaries and support costs associated with the Standards of Quality are based on past expenditure data, which is compiled from the Annual School Report (ASR).
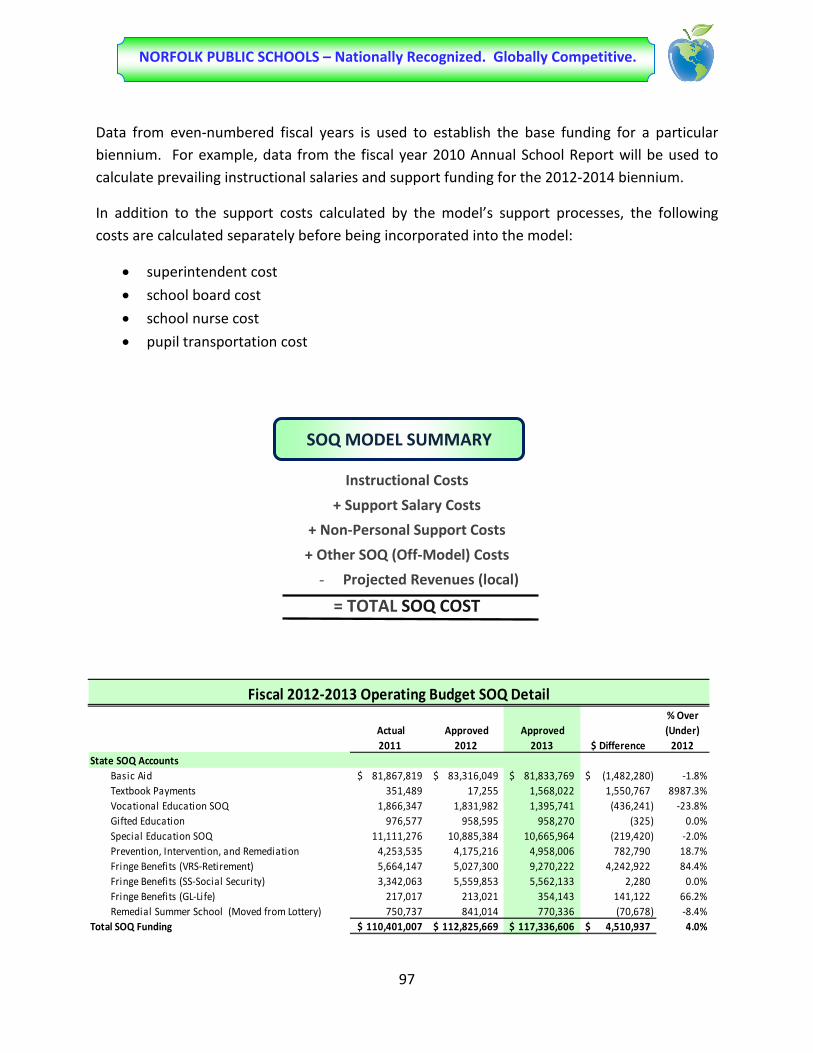
97
NORFOLK PUBLIC SCHOOLS – Nationally Recognized. Globally Competitive.
Data from even-numbered fiscal years is used to establish the base funding for a particular biennium. For example, data from the fiscal year 2010 Annual School Report will be used to calculate prevailing instructional salaries and support funding for the 2012-2014 biennium.
In addition to the support costs calculated by the model’s support processes, the following costs are calculated separately before being incorporated into the model:
• superintendent cost
• school board cost
• school nurse cost
• pupil transportation cost
Instructional Costs
+ Support Salary Costs
+ Non-Personal Support Costs
+ Other SOQ (Off-Model) Costs
- Projected Revenues (local)
= TOTAL SOQ COST
Actual 2011
Approved 2012
Approved 2013 $ Difference
% Over (Under)
2012State SOQ Accounts
Basic Aid 81,867,819$ 83,316,049$ 81,833,769$ (1,482,280)$ -1.8%Textbook Payments 351,489 17,255 1,568,022 1,550,767 8987.3%Vocational Education SOQ 1,866,347 1,831,982 1,395,741 (436,241) -23.8%Gifted Education 976,577 958,595 958,270 (325) 0.0%Special Education SOQ 11,111,276 10,885,384 10,665,964 (219,420) -2.0%Prevention, Intervention, and Remediation 4,253,535 4,175,216 4,958,006 782,790 18.7%Fringe Benefits (VRS-Retirement) 5,664,147 5,027,300 9,270,222 4,242,922 84.4%Fringe Benefits (SS-Social Security) 3,342,063 5,559,853 5,562,133 2,280 0.0%Fringe Benefits (GL-Life) 217,017 213,021 354,143 141,122 66.2%Remedial Summer School (Moved from Lottery) 750,737 841,014 770,336 (70,678) -8.4%
Total SOQ Funding 110,401,007$ 112,825,669$ 117,336,606$ 4,510,937$ 4.0%
Fiscal 2012-2013 Operating Budget SOQ Detail
SOQ MODEL SUMMARY

98
NORFOLK PUBLIC SCHOOLS – Nationally Recognized. Globally Competitive.
Sales Tax
Article VIII, Section 2 of the Constitution of Virginia authorizes the General Assembly to determine the cost of education as prescribed by the Standards of Quality and to apportion those costs between the state and the local governments. By law, 1 and 1/8 percent of state sales tax revenue is dedicated to public education.
Projected sales tax revenue (provided by the Department of Taxation) is distributed among localities based on the triennial school-age population census.
This distribution of sales tax revenue is subtracted from the total cost of Basic Aid for each division before Basic Aid is split into state and local shares based on the composite index.
Distribution of sales tax as adjusted by Basic Aid and split into state and local shares based on the composite index. An inverse relationship exists between sales tax and basic aid. If sales tax revenue is less than expected, basic aid may be increased to cover the state’s share of funding. Sales tax projections are higher for fiscal year 2013.
The General Assembly’s projection increases sales tax by $2,654,321.
Act
Actual 2011
Approved 2012
Approved 2013 $ Difference
% Over (Under)
2012State Sales Tax 28,780,241$ 28,926,427$ 31,580,748$ 2,654,321$ 9.2%
State Sales Tax

99
NORFOLK PUBLIC SCHOOLS – Nationally Recognized. Globally Competitive.
Non-SOQ State Funding
In addition to the programs funded through the Standards of Quality, the state funds a number of programs that address specific needs of students and school divisions. These are funded as direct funds or as grant funds.
These programs are broken into three groups:
• Categorical Programs
• Incentive-Based Programs
• Lottery Funded Programs (legislated and not guaranteed funding)
Categorical and Incentive-Based Programs are funded through formulas which are usually based on:
• Calculated per pupil amounts
• The number of students eligible to participate in the program or a proxy for estimating this number (For example, the percent of students eligible for the federal free lunch program is often used as a proxy for the number of students at risk of educational failure.)
An example of a formula driven program is Early Reading Intervention (Incentive-Based Program).
Categorical Programs
Categorical Programs focus on particular needs of special student populations or fulfill particular state obligations. These programs are typically required by state or federal law and/or regulation.
Examples of Categorical Programs include:
• Various special education programs targeted toward children who, for medical or behavioral reasons, cannot enroll in public schools
• Adult education
• Special Education - Homebound
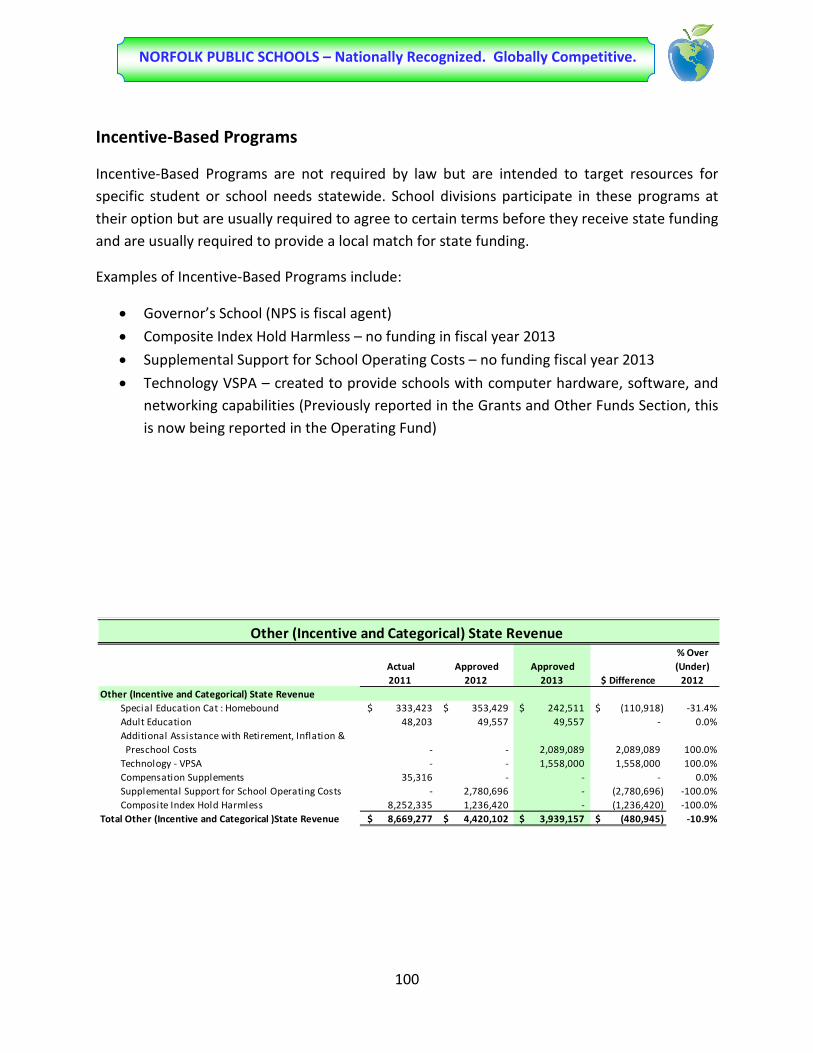
100
NORFOLK PUBLIC SCHOOLS – Nationally Recognized. Globally Competitive.
Incentive-Based Programs
Incentive-Based Programs are not required by law but are intended to target resources for specific student or school needs statewide. School divisions participate in these programs at their option but are usually required to agree to certain terms before they receive state funding and are usually required to provide a local match for state funding.
Examples of Incentive-Based Programs include:
• Governor’s School (NPS is fiscal agent)
• Composite Index Hold Harmless – no funding in fiscal year 2013
• Supplemental Support for School Operating Costs – no funding fiscal year 2013
• Technology VSPA – created to provide schools with computer hardware, software, and networking capabilities (Previously reported in the Grants and Other Funds Section, this is now being reported in the Operating Fund)
Act
Actual 2011
Approved 2012
Approved 2013 $ Difference
% Over (Under)
2012Other (Incentive and Categorical) State Revenue
Special Education Cat : Homebound 333,423$ 353,429$ 242,511$ (110,918)$ -31.4%Adult Education 48,203 49,557 49,557 - 0.0%Additional Assistance with Retirement, Inflation & Preschool Costs - - 2,089,089 2,089,089 100.0%Technology - VPSA - - 1,558,000 1,558,000 100.0%Compensation Supplements 35,316 - - - 0.0%Supplemental Support for School Operating Costs - 2,780,696 - (2,780,696) -100.0%Composite Index Hold Harmless 8,252,335 1,236,420 - (1,236,420) -100.0%
Total Other (Incentive and Categorical )State Revenue 8,669,277$ 4,420,102$ 3,939,157$ (480,945)$ -10.9%
Other (Incentive and Categorical) State Revenue
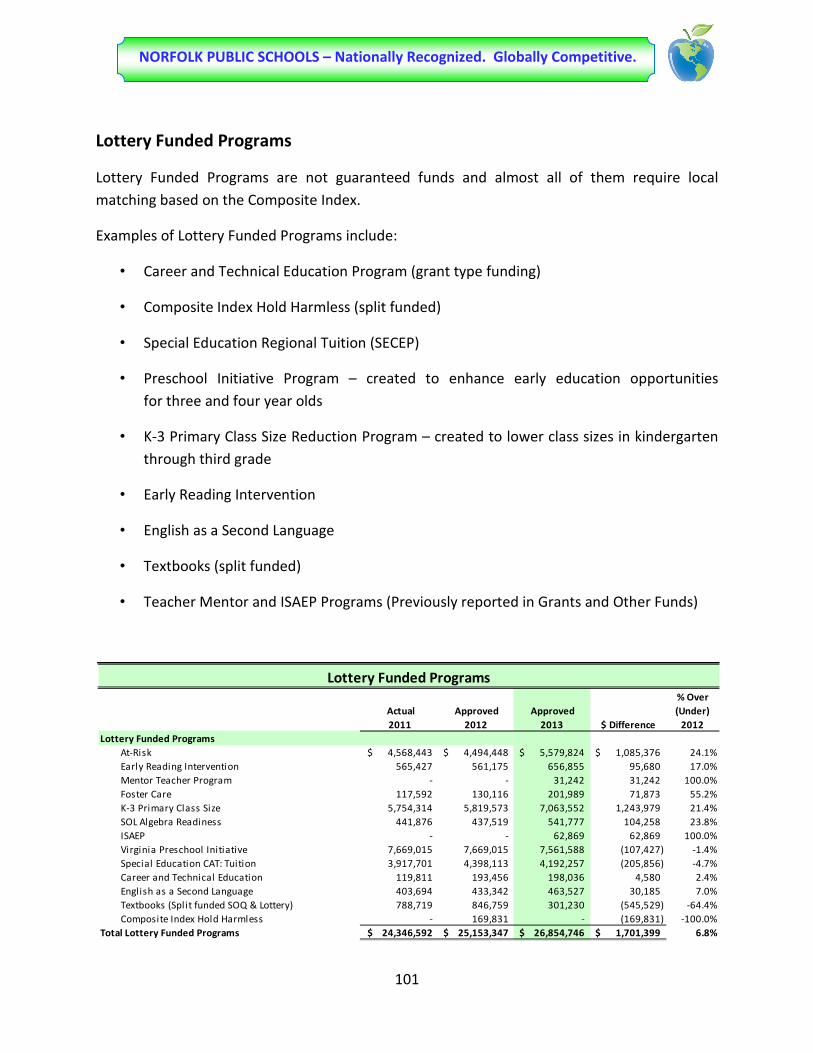
101
NORFOLK PUBLIC SCHOOLS – Nationally Recognized. Globally Competitive.
Lottery Funded Programs
Lottery Funded Programs are not guaranteed funds and almost all of them require local matching based on the Composite Index.
Examples of Lottery Funded Programs include:
• Career and Technical Education Program (grant type funding)
• Composite Index Hold Harmless (split funded)
• Special Education Regional Tuition (SECEP)
• Preschool Initiative Program – created to enhance early education opportunities for three and four year olds
• K-3 Primary Class Size Reduction Program – created to lower class sizes in kindergarten through third grade
• Early Reading Intervention
• English as a Second Language
• Textbooks (split funded)
• Teacher Mentor and ISAEP Programs (Previously reported in Grants and Other Funds)
Act
Actual 2011
Approved 2012
Approved 2013 $ Difference
% Over (Under)
2012Lottery Funded Programs
At-Risk 4,568,443$ 4,494,448$ 5,579,824$ 1,085,376$ 24.1%Early Reading Intervention 565,427 561,175 656,855 95,680 17.0%Mentor Teacher Program - - 31,242 31,242 100.0%Foster Care 117,592 130,116 201,989 71,873 55.2%K-3 Primary Class Size 5,754,314 5,819,573 7,063,552 1,243,979 21.4%SOL Algebra Readiness 441,876 437,519 541,777 104,258 23.8%ISAEP - - 62,869 62,869 100.0%Virginia Preschool Initiative 7,669,015 7,669,015 7,561,588 (107,427) -1.4%Special Education CAT: Tuition 3,917,701 4,398,113 4,192,257 (205,856) -4.7%Career and Technical Education 119,811 193,456 198,036 4,580 2.4%English as a Second Language 403,694 433,342 463,527 30,185 7.0%Textbooks (Split funded SOQ & Lottery) 788,719 846,759 301,230 (545,529) -64.4%Composite Index Hold Harmless - 169,831 - (169,831) -100.0%
Total Lottery Funded Programs 24,346,592$ 25,153,347$ 26,854,746$ 1,701,399$ 6.8%
Lottery Funded Programs
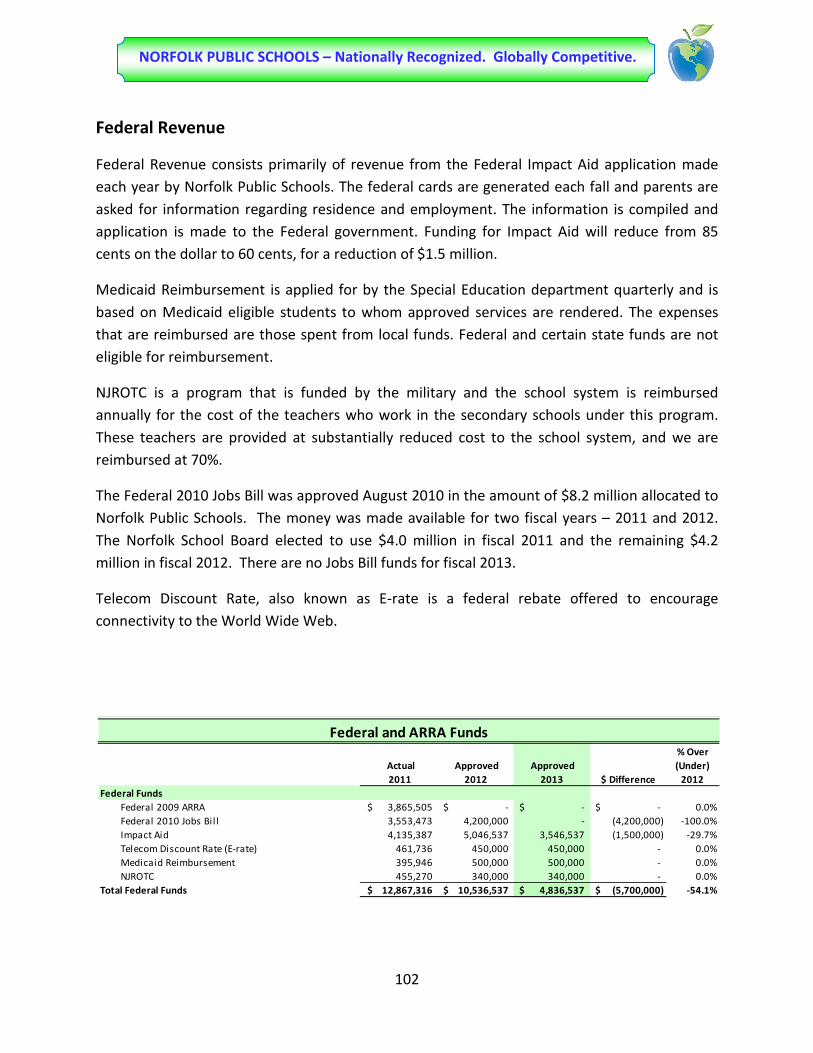
102
NORFOLK PUBLIC SCHOOLS – Nationally Recognized. Globally Competitive.
Federal Revenue
Federal Revenue consists primarily of revenue from the Federal Impact Aid application made each year by Norfolk Public Schools. The federal cards are generated each fall and parents are asked for information regarding residence and employment. The information is compiled and application is made to the Federal government. Funding for Impact Aid will reduce from 85 cents on the dollar to 60 cents, for a reduction of $1.5 million.
Medicaid Reimbursement is applied for by the Special Education department quarterly and is based on Medicaid eligible students to whom approved services are rendered. The expenses that are reimbursed are those spent from local funds. Federal and certain state funds are not eligible for reimbursement.
NJROTC is a program that is funded by the military and the school system is reimbursed annually for the cost of the teachers who work in the secondary schools under this program. These teachers are provided at substantially reduced cost to the school system, and we are reimbursed at 70%.
The Federal 2010 Jobs Bill was approved August 2010 in the amount of $8.2 million allocated to Norfolk Public Schools. The money was made available for two fiscal years – 2011 and 2012. The Norfolk School Board elected to use $4.0 million in fiscal 2011 and the remaining $4.2 million in fiscal 2012. There are no Jobs Bill funds for fiscal 2013.
Telecom Discount Rate, also known as E-rate is a federal rebate offered to encourage connectivity to the World Wide Web.
Act
Actual 2011
Approved 2012
Approved 2013 $ Difference
% Over (Under)
2012Federal Funds
Federal 2009 ARRA 3,865,505$ -$ -$ -$ 0.0%Federal 2010 Jobs Bil l 3,553,473 4,200,000 - (4,200,000) -100.0%Impact Aid 4,135,387 5,046,537 3,546,537 (1,500,000) -29.7%Telecom Discount Rate (E-rate) 461,736 450,000 450,000 - 0.0%Medicaid Reimbursement 395,946 500,000 500,000 - 0.0%NJROTC 455,270 340,000 340,000 - 0.0%
Total Federal Funds 12,867,316$ 10,536,537$ 4,836,537$ (5,700,000)$ -54.1%
Federal and ARRA Funds

103
NORFOLK PUBLIC SCHOOLS – Nationally Recognized. Globally Competitive.
City Appropriations
City Appropriations are negotiated yearly between the Norfolk School Board and the Norfolk City Council. The City funds the schools above the minimum required by the state. An historical detail of the City, its economic conditions and revenue under local control can be found in the Supplemental Section of this document.
A change in the funding of school nurses will be reflected in fiscal year 2013. The City had been appropriating funds to the Norfolk Public Health Department to provide school nurses in our schools. Effective in 2013, this appropriation, $1.5 million, will be reflected in the schools budget with an off-setting expenditure to the Norfolk Public Health Department.
The City increased its regular appropriation by $1.1 million.
Act
Actual 2011
Approved 2012
Approved 2013 $ Difference
% Over (Under)
2012City Funds
Regular Appropriation -$ 104,511,131$ 105,651,200$ 1,140,069$ 1.1%School Nurses Appropriation - - 1,535,400 1,535,400 100%
Total City Funds -$ 104,511,131$ 107,186,600$ 2,675,469$ 2.6%
City Funds

104
NORFOLK PUBLIC SCHOOLS – Nationally Recognized. Globally Competitive.
Re-Appropriated Carry Forward Funds
Unexpended school and education funds in a fiscal year must be re-appropriated for use in a forthcoming fiscal year. Norfolk Public Schools requested the City of Norfolk to re-appropriate a total $3.0 million of carry forward funds from prior fiscal years - $1.0 million from a 2010 prior year encumbrance and $2.0 million in 2012 state funds carry forward. Due to significant staff reductions, NPS set aside funds in a 2010 year-end encumbrance to cover the cost of unemployment. Fortunately, NPS was able to make significant staff reductions through attrition and retirements thereby lowering the cost of unemployment claims. As a result of this, the City re-appropriated $1.0 million from the 2010 year-end encumbrance to fiscal year 2013. Additionally, NPS had $2.1 million from prior years in a Bus Reserve Fund. In lieu of appropriating these funds in fiscal year 2012 for the purchase of buses, the City re-appropriated those funds to fiscal year 2013 for general operating use. Along with that re-appropriation, the city agreed to fund the replacement of buses with other City funds. Re-appropriation and Carry Forward Authority language included in the 2011 General Assembly Budget Session “1) clarifies that local governments must re-appropriate any FY 2011 qualifying state funds carried forwarded into FY 2012 solely for school division purposes and 2) extends the carry forward authority to FY 2012 into FY 2013”. NPS instituted a hiring and spending freeze to save funds in this fiscal year to carry forward funds to fiscal year 2013 to assist with its funding challenge. NPS requested the City to re-appropriate $2.0 million in 2012 fiscal year state funds to carry forward into fiscal year 2013. In addition to that, the City also appropriated $1.0 million in unanticipated sales tax receipts in 2012 to fiscal year 2013.
Act
Actual 2011
Approved 2012
Approved 2013 $ Difference
% Over (Under)
2012Re-Appropriated Carry Forward Funds:
Re-Appropriated 2010 Encumbrance Carryforward -$ -$ 1,000,000$ 1,000,000$ 100.0%Re-Appropriated Prior Years Bus Reserve Funds 2,121,700 2,121,700 100.0%Re-Appropriated 2012 Carry Forward State Funds - - 3,000,000 3,000,000 100.0%
Total Re-Appropriated Carry Forward Funds -$ -$ 6,121,700$ 6,121,700$ 100.0%
Re-Appropriated Carry Forward Funds
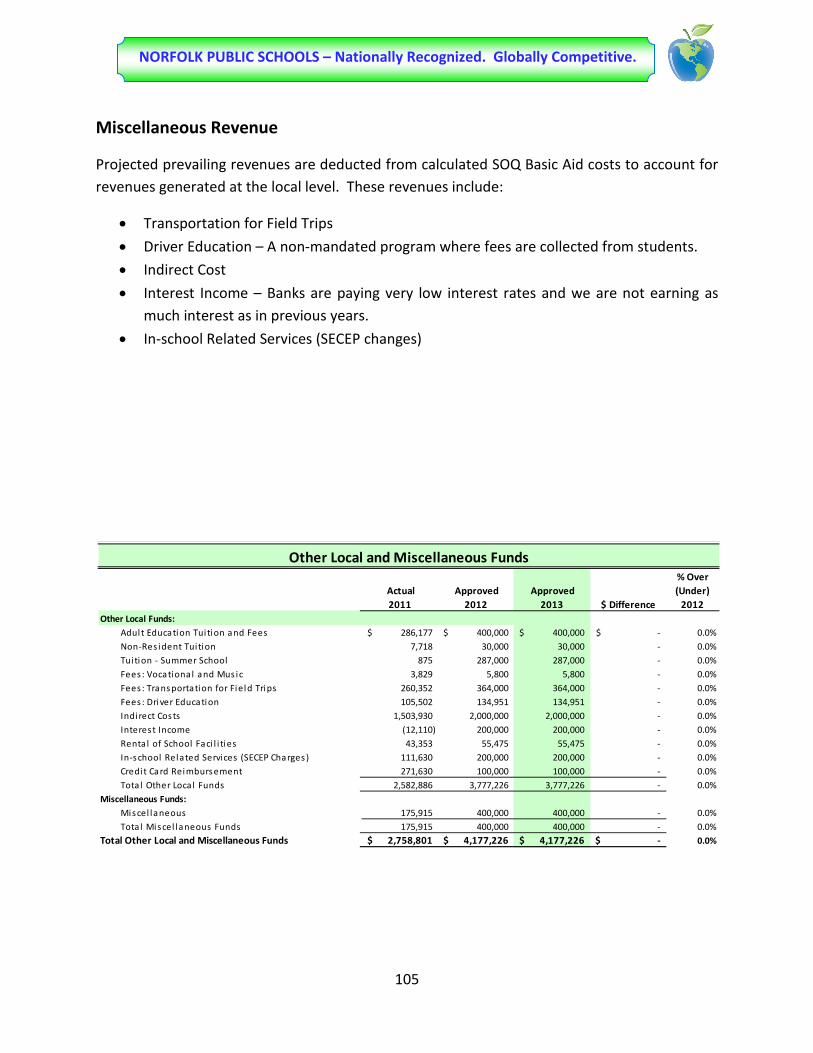
105
NORFOLK PUBLIC SCHOOLS – Nationally Recognized. Globally Competitive.
Miscellaneous Revenue
Projected prevailing revenues are deducted from calculated SOQ Basic Aid costs to account for revenues generated at the local level. These revenues include:
• Transportation for Field Trips
• Driver Education – A non-mandated program where fees are collected from students.
• Indirect Cost
• Interest Income – Banks are paying very low interest rates and we are not earning as much interest as in previous years.
• In-school Related Services (SECEP changes)
Act
Actual 2011
Approved 2012
Approved 2013 $ Difference
% Over (Under)
2012Other Local Funds:
Adult Education Tui tion and Fees 286,177$ 400,000$ 400,000$ -$ 0.0%Non-Res ident Tui tion 7,718 30,000 30,000 - 0.0%Tuition - Summer School 875 287,000 287,000 - 0.0%Fees : Vocational and Mus ic 3,829 5,800 5,800 - 0.0%Fees : Transportation for Field Trips 260,352 364,000 364,000 - 0.0%Fees : Driver Education 105,502 134,951 134,951 - 0.0%Indirect Costs 1,503,930 2,000,000 2,000,000 - 0.0%Interest Income (12,110) 200,000 200,000 - 0.0%Renta l of School Faci l i ties 43,353 55,475 55,475 - 0.0%In-school Related Services (SECEP Charges) 111,630 200,000 200,000 - 0.0%Credit Card Reimbursement 271,630 100,000 100,000 - 0.0%Tota l Other Loca l Funds 2,582,886 3,777,226 3,777,226 - 0.0%
Miscellaneous Funds:Miscel laneous 175,915 400,000 400,000 - 0.0%Tota l Miscel laneous Funds 175,915 400,000 400,000 - 0.0%
Total Other Local and Miscellaneous Funds 2,758,801$ 4,177,226$ 4,177,226$ -$ 0.0%
Other Local and Miscellaneous Funds
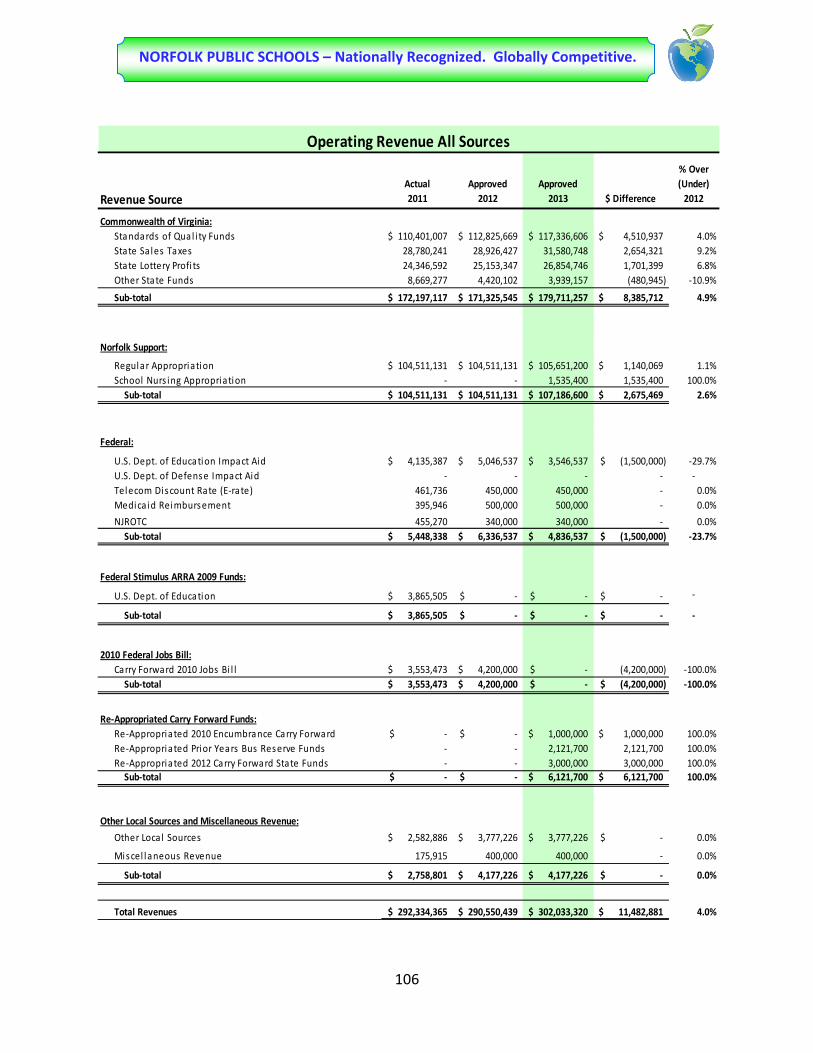
106
NORFOLK PUBLIC SCHOOLS – Nationally Recognized. Globally Competitive.
Revenue SourceActual 2011
Approved 2012
Approved 2013 $ Difference
% Over (Under)
2012
Commonwealth of Virginia:Standards of Qual i ty Funds 110,401,007$ 112,825,669$ 117,336,606$ 4,510,937$ 4.0%State Sa les Taxes 28,780,241 28,926,427 31,580,748 2,654,321 9.2%State Lottery Profi ts 24,346,592 25,153,347 26,854,746 1,701,399 6.8%Other State Funds 8,669,277 4,420,102 3,939,157 (480,945) -10.9%
Sub-total 172,197,117$ 171,325,545$ 179,711,257$ 8,385,712$ 4.9%
Regular Appropriation 104,511,131$ 104,511,131$ 105,651,200$ 1,140,069$ 1.1%School Nurs ing Appropriation - - 1,535,400 1,535,400 100.0% Sub-total 104,511,131$ 104,511,131$ 107,186,600$ 2,675,469$ 2.6%
U.S. Dept. of Education Impact Aid 4,135,387$ 5,046,537$ 3,546,537$ (1,500,000)$ -29.7%U.S. Dept. of Defense Impact Aid - - - - -Telecom Discount Rate (E-rate) 461,736 450,000 450,000 - 0.0%Medica id Reimbursement 395,946 500,000 500,000 - 0.0%
NJROTC 455,270 340,000 340,000 - 0.0% Sub-total 5,448,338$ 6,336,537$ 4,836,537$ (1,500,000)$ -23.7%
U.S. Dept. of Education 3,865,505$ -$ -$ -$ -
Sub-total 3,865,505$ -$ -$ -$ -
Carry Forward 2010 Jobs Bi l l 3,553,473$ 4,200,000$ -$ (4,200,000) -100.0% Sub-total 3,553,473$ 4,200,000$ -$ (4,200,000)$ -100.0%
Re-Appropriated Carry Forward Funds:Re-Appropriated 2010 Encumbrance Carry Forward -$ -$ 1,000,000$ 1,000,000$ 100.0%Re-Appropriated Prior Years Bus Reserve Funds - - 2,121,700 2,121,700 100.0%Re-Appropriated 2012 Carry Forward State Funds - - 3,000,000 3,000,000 100.0% Sub-total -$ -$ 6,121,700$ 6,121,700$ 100.0%
Other Loca l Sources 2,582,886$ 3,777,226$ 3,777,226$ -$ 0.0%
Miscel laneous Revenue 175,915 400,000 400,000 - 0.0%
Sub-total 2,758,801$ 4,177,226$ 4,177,226$ -$ 0.0%
Total Revenues 292,334,365$ 290,550,439$ 302,033,320$ 11,482,881$ 4.0%
Operating Revenue All Sources
Other Local Sources and Miscellaneous Revenue:
Federal Stimulus ARRA 2009 Funds:
Norfolk Support:
Federal:
2010 Federal Jobs Bill:
107
NORFOLK PUBLIC SCHOOLS – Nationally Recognized. Globally Competitive.
GGLLOOSSSSAA RRYY OOFF RR EEVVEENNUU EE AA CCCCOOUU NNTTSS
STATE:
Adult Education Reimburses general adult education programs on a fixed cost per pupil or cost per class basis.
At-Risk Four-Year-Olds Provides quality preschool programs for at risk four-year-olds unserved by another program.
At-Risk Supports approved programs for students who are educationally at risk.
Average Daily Membership (ADM) The average daily membership (ADM) for grades K-12 including handicapped students ages 5-21 and students for whom English is a second language who entered school for the first time after reaching their 12th birthday, and who have not reached twenty-two years of age on or before August 1st of the school year, for the first seven (7) months (or equivalent period) of the school year in which state funds are distributed. Preschool and postgraduate students are not included in ADM.
Basic Operation Cost The cost per pupil, including provision for the number of instructional personnel required by the Standards of Quality for each school division.
Composite Index of Local Ability to Pay An index figure computed for each locality. The composite index is the sum of the index of wealth per pupil in ADM (unadjusted for half-day kindergarten programs) and the index of wealth per capita multiplied by the local nominal share of the costs of the Standards of Quality.

108
NORFOLK PUBLIC SCHOOLS – Nationally Recognized. Globally Competitive.
GGLLOOSSSSAA RRYY OOFF RR EEVVEENNUU EE AA CCCCOOUU NNTTSS –– CCoonntt ii nnuuee dd
Early Reading Intervention Provides early reading intervention services to students in grades kindergarten through third grade who demonstrate deficiencies based on their individual performance on diagnostic tests.
Fiscal Year (FY) A twelve month period, beginning July 1 and ending June 30, this is the operating year for accounting and budgeting purposes.
Foster Care Supports handicapped children attending public school who have been placed in foster care or other such custodial care across jurisdictional lines.
Hold Harmless In this document Hold Harmless refers to the composite index change. Schools that were adversely affected by the change were allocated revenue to soften the revenue change.
K-3 Primary Class Size An incentive payment for reducing class sizes in the primary grades (kindergarten through third grade).
Lottery Funded State mandated funds for education funded through the retail sale of lottery tickets
Required Local Expenditure The locality's share based on the composite index for the Standards of Quality of local ability-to-pay of the cost required by all the Standards of Quality minus its estimated revenues from the state sales and use tax (returned on the basis of school age population) in the fiscal year in which the school year begins.
Sales Tax The 1 and 1/8 percent of state sales tax revenue is earmarked for education and distributed to localities on the basis of the latest triennial count of school age population.

109
NORFOLK PUBLIC SCHOOLS – Nationally Recognized. Globally Competitive.
GGLLOOSSSSAA RRYY OOFF RR EEVVEENNUU EE AA CCCCOOUU NNTTSS –– CCoonntt ii nnuuee dd
SOL Algebra Readiness Provides math intervention services to students in grades 6, 7, 8 and 9 who are at-risk of failing the Algebra 1 end-of-course test, as demonstrated by their individual performance on diagnostic tests.
SOQ: Basic Aid A state share of the Basic Operation Cost, which cost per pupil in ADM is established individually for each local school division based on the number of instructional personnel required by the Standards of Quality and the statewide prevailing salary levels.
SOQ: Enrollment Loss An additional state payment in each year equal to the state share per pupil of Basic Aid for each locality, for a percentage of the enrollment loss in ADM from the prior year.
SOQ: State Adjustments to Basic Aid The amount deducted from Basic Aid for the education of students with disabilities.
SOQ: Textbook Payments State's distributions for textbooks based on adjusted ADM.
SOQ: Retirement Contributions Provides funds to each local school board for the state share of the employer's retirement cost incurred by it, on behalf of instructional personnel.
SOQ: Remedial Summer School Funds available to school divisions for the operation of programs designed to remediate students who are required to attend such programs during a summer school session or during an intersession in the case of year-round schools.
110
NORFOLK PUBLIC SCHOOLS – Nationally Recognized. Globally Competitive.
GGLLOOSSSSAA RRYY OOFF RR EEVVEENNUU EE AA CCCCOOUU NNTTSS –– CCoonntt ii nnuuee dd
SOQ: Remedial Education Supports the state share of instructional positions for students who score in the bottom national quartile on Virginia State Assessment Program Tests.
SOQ: Vocational Education Supports the state share of the number of Vocational Education instructors required by the Standards of Quality.
SOQ: Salary Supplements Payments Provides the state share of salary increases along with the related fringe benefit costs to public school instructional and supports staff positions funded through the Standards of Quality and other state funded accounts.
SOQ: Gifted Education Supports the state share of instructional position on approved programs for the gifted.
SOQ: Life Insurance Contributions Provides funds to each local school board for the state share of the employer's Group Life Insurance cost incurred by it on behalf of instructional personnel who participate in group insurance.
SOQ: Social Security Contributions Provides funds to each local school board for the state share of the employer's Social Security cost incurred by it, on behalf of the instructional personnel.
SOQ: Special Education Supports the state share of the number of Special Education instructors required by the Standards of Quality.
Special Education: Tuition The state's share of the tuition rates for approved public school regional programs based on the composite index of local ability-to-pay.

111
NORFOLK PUBLIC SCHOOLS – Nationally Recognized. Globally Competitive.
GGLLOOSSSSAA RRYY OOFF RR EEVVEENNUU EE AA CCCCOOUU NNTTSS –– CCoonntt ii nnuuee dd
Standards of Quality Operations standards for grades kindergarten through 12.
State Share for the Standards of Quality The state share for a locality equal to the cost for that locality less the locality's estimated revenues from the state sales and use tax (returned on the basis of school age population), in the fiscal year in which the school year begins and less the required local expenditure.
Student Achievement Grants Eliminates dropout prevention, health incentive, and technology assistants programs and enables school divisions to use this funding for existing early reading, at-risk four-year-olds (including programs previously using federal Title I funds), K-3 class size reduction, or additional remediation activities.
Vocational Education Promotes and administers the provision of agriculture, business, marketing, home economics, health, technology education, trade and industrial education in the public middle and high schools.
FEDERAL:
American Recovery and Reinvestment Funds were made available by the federal government to stimulate the economy in the short-term and invest in education to strengthen education, drive reforms and improve results for students from early learning through post-secondary education.

112
NORFOLK PUBLIC SCHOOLS – Nationally Recognized. Globally Competitive.
GGLLOOSSSSAA RRYY OOFF RR EEVVEENNUU EE AA CCCCOOUU NNTTSS –– CCoonntt ii nnuuee dd
Federal 2009 Education Jobs Bill The Federal Education Jobs Fund (Jobs Bill) legislation was signed into Law on August 2010. The primary purpose of the Jobs Bill is to provide additional funding to states for the support of local teacher and other school-level personnel salary and related costs to early childhood, elementary, and secondary school levels. These funds are available on a one-time basis only.
Impact Aid Funding from the United States Government for the loss of tax revenue given that federal property is not subject to local and State taxes.
NORFOLK SUPPORT: Support from the City for education
LOCAL SOURCES:
Adult Education Tuition and Fees Tuition and fees paid by participants of the Adult Education Program.
Non-Resident Tuition Tuition paid by non-resident parent/guardians for children that attend Norfolk Public Schools.
Tuition – Summer School Tuition paid for Summer School participation

113
NORFOLK PUBLIC SCHOOLS – Nationally Recognized. Globally Competitive.
GGLLOOSSSSAA RRYY OOFF RR EEVVEENNUU EE AA CCCCOOUU NNTTSS –– CCoonntt ii nnuuee dd
Fees Include fees for equipment usage, field trip transportation fees, and fees charged for driver education provided by NPS
Indirect Costs Include payments by supplemental grants for administrative and other support
Rental of School Facilities Fees paid by organizations/groups/individuals that use Norfolk Public Schools buildings for non-school sponsored activities.
Virginia Commission for the Payments NPS receives due to the fact that we Visually Handicapped have visually impaired students that require assistance. Miscellaneous Revenue from a myriad of sources that is not
defined above; example, used textbook sales, surplus equipment, insurance loss proceeds and other small sources that differ year to year.
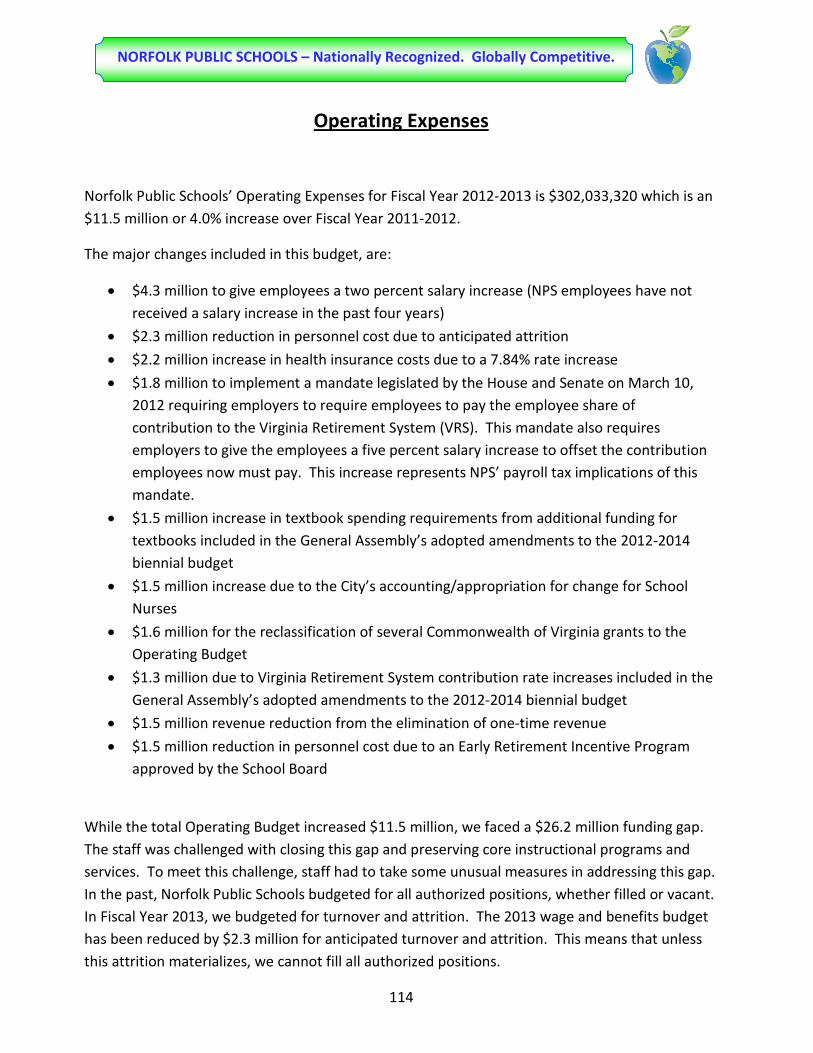
114
NORFOLK PUBLIC SCHOOLS – Nationally Recognized. Globally Competitive.
Operating Expenses
Norfolk Public Schools’ Operating Expenses for Fiscal Year 2012-2013 is $302,033,320 which is an $11.5 million or 4.0% increase over Fiscal Year 2011-2012.
The major changes included in this budget, are:
• $4.3 million to give employees a two percent salary increase (NPS employees have not received a salary increase in the past four years)
• $2.3 million reduction in personnel cost due to anticipated attrition
• $2.2 million increase in health insurance costs due to a 7.84% rate increase
• $1.8 million to implement a mandate legislated by the House and Senate on March 10, 2012 requiring employers to require employees to pay the employee share of contribution to the Virginia Retirement System (VRS). This mandate also requires employers to give the employees a five percent salary increase to offset the contribution employees now must pay. This increase represents NPS’ payroll tax implications of this mandate.
• $1.5 million increase in textbook spending requirements from additional funding for textbooks included in the General Assembly’s adopted amendments to the 2012-2014 biennial budget
• $1.5 million increase due to the City’s accounting/appropriation for change for School Nurses
• $1.6 million for the reclassification of several Commonwealth of Virginia grants to the Operating Budget
• $1.3 million due to Virginia Retirement System contribution rate increases included in the General Assembly’s adopted amendments to the 2012-2014 biennial budget
• $1.5 million revenue reduction from the elimination of one-time revenue
• $1.5 million reduction in personnel cost due to an Early Retirement Incentive Program approved by the School Board
While the total Operating Budget increased $11.5 million, we faced a $26.2 million funding gap. The staff was challenged with closing this gap and preserving core instructional programs and services. To meet this challenge, staff had to take some unusual measures in addressing this gap. In the past, Norfolk Public Schools budgeted for all authorized positions, whether filled or vacant. In Fiscal Year 2013, we budgeted for turnover and attrition. The 2013 wage and benefits budget has been reduced by $2.3 million for anticipated turnover and attrition. This means that unless this attrition materializes, we cannot fill all authorized positions.

115
NORFOLK PUBLIC SCHOOLS – Nationally Recognized. Globally Competitive.
To create capacity to give employees a two percent general wage increase, the School Board approved an Early Retirement Incentive Program for those employees who met the program’s criteria and submit early retirement papers by March 31, 2012 to retire June 30, 2012. This program created an estimated compensation savings of $1.5 million.
Included in this budget for the first time is a $1.5 million expense for payment to the Norfolk Department of Public Health for school nursing services. In the past, the City had made an appropriation directly to the Norfolk Department of Public Health for school nurses. This year, the appropriation will be made to Norfolk Public Schools and Norfolk Public Schools will make the payment to the Health Department. This is a cost neutral accounting change for the schools’ as revenue increased by the $1.5 million appropriation and the off-setting expense has been included.
Another measure utilized to close the gap presented is the re-appropriation of unexpended funds from prior fiscal years – a total of $6.1 million. A re-appropriation of $3.0 million in carry forward funds from prior fiscal years - $1.0 from a 2010 year-end encumbrance that was not spent on unemployment claims and $2.0 million from fiscal year 2012 resulting from savings related to turnover and attrition – was granted. School Bus Fund Reserves from prior fiscal years in the amount of $2.1 million was re-appropriated for general fund use. (The City agreed to fund school bus replacements with other City funding sources.) Also, sales tax receipts for fiscal year 2012 were $1.0 million higher than budgeted; the City appropriated those funds for fiscal year 2013
This budget includes a reduction in staff of 123 full-time equivalent positions; ten (10) are Central Office positions. Central Office positions and functions are being consolidated/re-organized and service delivery models are being redesigned.
The expenditures outlined in the following pages in this section are our effort to balance the budget and to preserve core instruction and specialty programs for the students of Norfolk Public Schools.

116
NORFOLK PUBLIC SCHOOLS – Nationally Recognized. Globally Competitive.
This page intentionally left blank.

117
NORFOLK PUBLIC SCHOOLS – Nationally Recognized. Globally Competitive.
The chart below shows how the $302,033,320 Operating Budget is allocated by the following major programs:
• Instructional Support
• Pupil Transportation
• Student Attendance and Health
• Operations and Facilities
• Central Administration
• Information Technology

118
NORFOLK PUBLIC SCHOOLS – Nationally Recognized. Globally Competitive.
Operating Budget - Program Detail
See APPENDIX A for more detailed information by program and multi-year comparison
Positions Approved
Positions Proposed Actual Approved Approved % of
DESCRIPTION 2012 2013 2011 2012 2013 Budget
Instructional Services110 Classroom Instruction 1,775.60 1,739.60 115,430,986$ 114,725,317$ 119,596,875$ 39.60%121 Guidance Services 132.00 132.00 8,956,272 8,735,074 9,135,996 3.02%122 School Social Workers 23.00 23.00 1,562,040 1,518,160 1,776,550 0.59%131 Instructional Support Services 42.25 41.25 5,641,823 5,776,648 5,696,613 1.89%132 Media Services 81.50 81.50 6,250,396 5,764,991 6,057,550 2.01%141 Office of the Principal 214.00 214.00 16,088,845 15,754,126 16,884,567 5.59%170 Alternative Education 19.00 19.00 1,193,971 1,420,025 1,485,918 0.49%200 Special Education 639.00 602.00 42,315,095 43,003,242 43,014,329 14.24%300 Career and Technical Education 104.70 104.70 8,179,106 7,769,736 7,848,584 2.60%400 Gifted and Talented Program 35.00 30.00 2,818,304 2,807,930 2,657,506 0.88%500 Athletics and Virginia High School League 6.00 6.00 1,760,086 1,798,243 1,796,050 0.59%510 Other Extra-Curricular Programs - - 1,127,642 1,380,782 1,149,083 0.38%600 Summer School Program - - 1,114,307 1,293,191 1,331,137 0.44%700 Adult Education Program 4.00 4.00 588,241 674,417 715,194 0.24%800 Non-Regular Day School Program 239.00 216.00 11,125,168 11,006,024 11,246,564 3.72%
Total Instructional Services 3,315.05 3,213.05 224,152,280$ 223,427,908$ 230,392,516$ 76.28%
Support Activities and FacilitiesD21 Central Administration 95.00 90.00 8,793,728$ 9,387,282$ 9,641,043$ 3.19%D22 Student Attendance and Health Services 50.00 48.00 3,591,762 3,779,750 5,641,243 1.87%D30 Pupil Transportation 281.00 278.00 10,779,295 11,603,631 11,664,171 3.86%D40 Operations and Maintenance 409.50 398.50 35,188,292 33,880,937 34,710,178 11.49%D51 Child Nutrition Services (Jobs Bil l) 0.00 0.00 112,494 - - 0.00%D53 Community Services (Jobs Bil l) 0.00 0.00 7,751 - - 0.00%D66 Facil ity Improvements 0.00 0.00 1,612,951 1,644,865 1,644,865 0.54%D80 Informational Technology 61.00 61.00 7,308,652 6,857,086 8,339,304 2.76%
Total Support Activities and Facilities 896.50 875.50 67,394,924$ 67,153,551$ 71,640,803$ 23.72%Total Operating Budget 4,211.55 4,088.55 291,547,205$ 290,581,459$ 302,033,320$ 100.00%

119
NORFOLK PUBLIC SCHOOLS – Nationally Recognized. Globally Competitive.
Program 110 - Classroom Instruction - Regular
Classroom Instruction includes all regular educational activities dealing directly with interaction between teachers and students. Books, supplies, equipment, and compensation of all instructional staff including teachers, aides, and classroom assistants for the regular school program are included here. This program includes Literacy, Math, Science, Communications and Reading Coaches who work with Elementary students who are struggling in these areas. It also includes NJROTC program at the High Schools whose teachers are paid by the Federal Government. The Middle School Quality Education (MSQE), Algebra Readiness, Continuous High School Improvement programs (CHSI) that supplement education and provide a rigorous learning environment are all funded in this program. Highlights of this program can be found in the INTRODUCTION SECTION of this document.
Goals:
• To ensure compliance with the federal regulations in the No Child Left Behind legislation
• To provide equitable instructional services to children with strategic staffing and resource allocation
• To provide small learning environments in the primary grades in compliance with the K-3 Class Size Reduction Initiative as outlined by the State Board of Education
• To ensure that all schools have the necessary materials, supplies and resources to fully implement the Norfolk Public Schools curriculum
• To create learning environments where all students can develop the habits and skills for powerful literacy
• To adhere to the Standards of Accreditation
The Proposed 2012-2013 Budget for the Classroom Instruction Program is a net increase of $4.9 million or 4.3% over Fiscal Year 2012. The increase is due primarily to a 7.0% wage increase for employees (a 2.0% general wage increase for all employees and a mandated 5.0% wage increase for full-time employees in VRS to offset the legislative mandate that employees contribute their share to VRS), the increase in state funds for textbooks, the increase in the Virginia Retirement System contribution rates and an increase in health insurance costs.
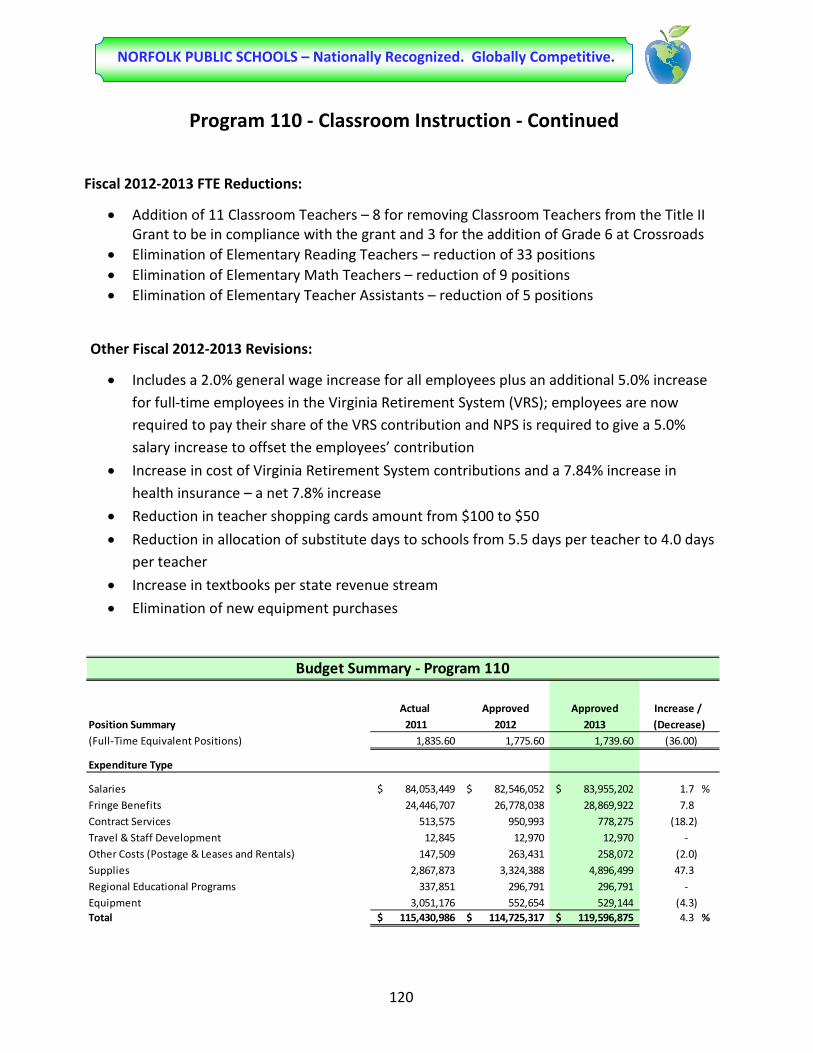
120
NORFOLK PUBLIC SCHOOLS – Nationally Recognized. Globally Competitive.
Program 110 - Classroom Instruction - Continued
Fiscal 2012-2013 FTE Reductions:
• Addition of 11 Classroom Teachers – 8 for removing Classroom Teachers from the Title II Grant to be in compliance with the grant and 3 for the addition of Grade 6 at Crossroads
• Elimination of Elementary Reading Teachers – reduction of 33 positions • Elimination of Elementary Math Teachers – reduction of 9 positions • Elimination of Elementary Teacher Assistants – reduction of 5 positions
Other Fiscal 2012-2013 Revisions:
• Includes a 2.0% general wage increase for all employees plus an additional 5.0% increase for full-time employees in the Virginia Retirement System (VRS); employees are now required to pay their share of the VRS contribution and NPS is required to give a 5.0% salary increase to offset the employees’ contribution
• Increase in cost of Virginia Retirement System contributions and a 7.84% increase in health insurance – a net 7.8% increase
• Reduction in teacher shopping cards amount from $100 to $50
• Reduction in allocation of substitute days to schools from 5.5 days per teacher to 4.0 days per teacher
• Increase in textbooks per state revenue stream
• Elimination of new equipment purchases
Actual Approved Approved Increase / Position Summary 2011 2012 2013 (Decrease)(Full-Time Equivalent Positions) 1,835.60 1,775.60 1,739.60 (36.00)
Expenditure Type
Salaries 84,053,449$ 82,546,052$ 83,955,202$ 1.7 %Fringe Benefits 24,446,707 26,778,038 28,869,922 7.8 Contract Services 513,575 950,993 778,275 (18.2) Travel & Staff Development 12,845 12,970 12,970 - Other Costs (Postage & Leases and Rentals) 147,509 263,431 258,072 (2.0) Supplies 2,867,873 3,324,388 4,896,499 47.3 Regional Educational Programs 337,851 296,791 296,791 - Equipment 3,051,176 552,654 529,144 (4.3) Total 115,430,986$ 114,725,317$ 119,596,875$ 4.3 %
Budget Summary - Program 110

121
NORFOLK PUBLIC SCHOOLS – Nationally Recognized. Globally Competitive.
Program 121 - Guidance Services
Full-time guidance services are available in all schools. Counselors regularly counsel students and parents, consult with other staff members on learning problems, and evaluate the abilities of students. They also assist students in educational and career plans and in personal and social development, as well as providing referral assistance. This category includes the costs of all guidance counselors and deans of students. Deans of students are in the middle schools to address student behavioral issues. This includes the program expansion of additional guidance clerical. Goals:
• To ensure achievement on the Virginia Standards of Learning
• To provide all students with the academic, career, and personal/social development needed to acquire the attitudes, knowledge, and skills for success in school and after they graduate
• To provide all students in grades K through 12 with a planned, developmentally age-appropriate, and sequential school counseling program that is accountable and based on the Virginia Standards for School Counseling Programs
• To provide a program that will prepare students to become effective learners, achieve success in school, live successful and rewarding lives, and develop into contributing members of our society
Fiscal 2011-2012 FTE Revision:
• 1 Clerical position was re-coded to Guidance from the Office of the Principal Program 141 to correct state approved codes
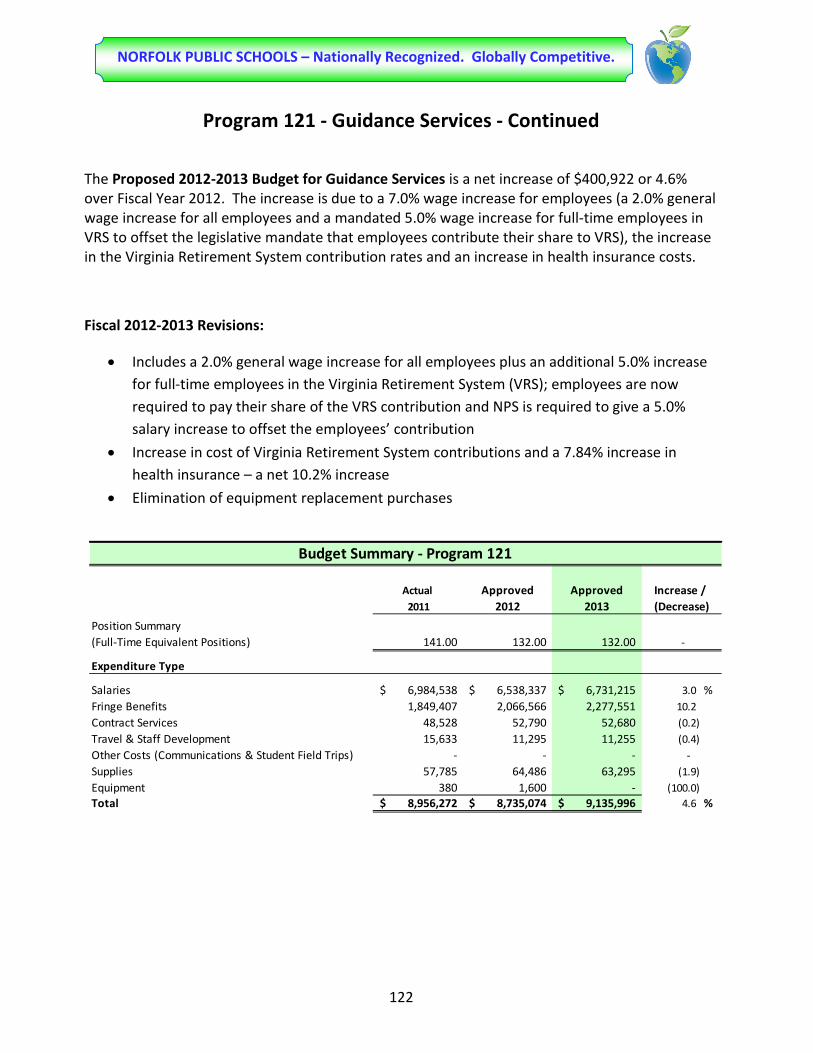
122
NORFOLK PUBLIC SCHOOLS – Nationally Recognized. Globally Competitive.
Program 121 - Guidance Services - Continued
The Proposed 2012-2013 Budget for Guidance Services is a net increase of $400,922 or 4.6% over Fiscal Year 2012. The increase is due to a 7.0% wage increase for employees (a 2.0% general wage increase for all employees and a mandated 5.0% wage increase for full-time employees in VRS to offset the legislative mandate that employees contribute their share to VRS), the increase in the Virginia Retirement System contribution rates and an increase in health insurance costs.
Fiscal 2012-2013 Revisions:
• Includes a 2.0% general wage increase for all employees plus an additional 5.0% increase for full-time employees in the Virginia Retirement System (VRS); employees are now required to pay their share of the VRS contribution and NPS is required to give a 5.0% salary increase to offset the employees’ contribution
• Increase in cost of Virginia Retirement System contributions and a 7.84% increase in health insurance – a net 10.2% increase
• Elimination of equipment replacement purchases
Actual Approved Approved Increase / 2011 2012 2013 (Decrease)
Position Summary(Full-Time Equivalent Positions) 141.00 132.00 132.00 -
Expenditure Type
Salaries 6,984,538$ 6,538,337$ 6,731,215$ 3.0 %Fringe Benefits 1,849,407 2,066,566 2,277,551 10.2 Contract Services 48,528 52,790 52,680 (0.2) Travel & Staff Development 15,633 11,295 11,255 (0.4) Other Costs (Communications & Student Field Trips) - - - - Supplies 57,785 64,486 63,295 (1.9) Equipment 380 1,600 - (100.0) Total 8,956,272$ 8,735,074$ 9,135,996$ 4.6 %
Budget Summary - Program 121

123
NORFOLK PUBLIC SCHOOLS – Nationally Recognized. Globally Competitive.
Program 122 - Visiting Teachers and School Social Workers
Services for visiting teachers and social workers include activities to improve student attendance at school and attempt to prevent or solve student problems. Examples of activities included in this program are: investigating student problems arising out of the home, school, or community; casework and group work services; interpreting the problems of students for other staff members; promoting modification of the circumstances surrounding the individual student which are related to his/her problem; and diagnosing students for participation in the special education program. Each visiting teacher or school social worker is a member of school child student teams. Typically, each position is responsible for at least two schools.
Goals:
• To ensure compliance with federal, state and local special education policies and procedures
• To ensure that parents and students have access to community resources for enhancing learning skills
• To establish partnerships with the home, school and community for benefit of student academic achievement
• To provide and interpret procedural safeguards and parental rights to parents/legal guardians throughout the special education process
Fiscal 2011-2012 FTE Revision:
• 4 Social Worker positions recoded from Title VI-B Flow Through Funds to augment Medicaid billings; positions were funded with Special Ed teacher positions

124
NORFOLK PUBLIC SCHOOLS – Nationally Recognized. Globally Competitive.
Program 122 - Visiting Teachers and School Social Workers - Continued
The Proposed 2012-2013 Budget for the Visiting Teachers and Social Workers is a net increase of $258,390 or 17.0% over Fiscal Year 2012. The increase is due to a 7.0% wage increase for employees (a 2.0% general wage increase for all employees and a mandated 5.0% wage increase for full-time employees in VRS to offset the legislative mandate that employees contribute their share to VRS), the increase in the Virginia Retirement System contribution rates, an increase in health insurance costs and compensation adjustments for the positions re-coded from grant funds.
Fiscal 2012-2013 Revisions:
• Includes a 2.0% general wage increase for all employees plus an additional 5.0% increase for full-time employees in the Virginia Retirement System (VRS); employees are now required to pay their share of the VRS contribution and NPS is required to give a 5.0% salary increase to offset the employees’ contribution
• Increase in cost of Virginia Retirement System contributions and a 7.84% increase in health insurance – a net 19.5% increase
Actual Approved Approved Increase / 2011 2012 2013 (Decrease)
Position Summary (Full-Time Equivalent Positions) 21.00 23.00 23.00 -
Expenditure Type
Salaries 1,223,690$ 1,138,620$ 1,325,137$ 16.4 %Fringe Benefits 335,202 368,550 440,423 19.5 Contract Services - - - - Travel & Staff Development 318 8,140 8,140 - Other Costs (Postage & Leases and Rentals) - - - - Supplies 2,829 2,850 2,850 - Equipment - - - -
Total 1,562,040$ 1,518,160$ 1,776,550$ 17.0 %
Budget Summary - Program 122

125
NORFOLK PUBLIC SCHOOLS – Nationally Recognized. Globally Competitive.
Program 131 - Instructional Support
Instructional Support Services include activities that assist the instructional staff with the content and process of providing learning experiences for students. This program involves activities associated with directing, managing, and supervising the improvement of instructional services and activities that aid teachers in developing the curriculum; preparing and utilizing special curriculum materials; and understanding and appreciating various techniques which motivate students. It includes the offices of the Associate Superintendent of Academics, Curriculum and Professional Development, administrators responsible for the supervision of schools, and other instructional support services. Excluded from this program are support activities of Special Education, Career and Technical Education, Summer School, Gifted and Talented, Adult Education, and Early Childhood Education. Goals:
• Quality, consistent staff development for teachers and administrators in best instructional practices
• Current resources and materials to implement the Norfolk Public Schools’ curriculum and instructional best practices
• Support for teachers to effectively analyze and utilize student achievement data for effective planning and delivery of instruction
• Support innovative instructional programs and specialty programs in elementary, middle and high schools
• Provide quality quarterly assessments aligned with the Norfolk Public Schools’ curriculum and the state standards in grades 2-8

126
NORFOLK PUBLIC SCHOOLS – Nationally Recognized. Globally Competitive.
Program 131 - Instructional Support - Continued
The Proposed 2012-2013 Budget for Instructional Support is a net decrease of $80,035 or 1.4% from Fiscal Year 2012. Fiscal 2012-2013 FTE Reductions:
• Elimination of 1 Central Office Administrator position
Other 2012-2013 Other Revisions:
• Includes a 2.0% general wage increase for all employees plus an additional 5.0% increase for full-time employees in the Virginia Retirement System (VRS); employees are now required to pay their share of the VRS contribution and NPS is required to give a 5.0% salary increase to offset the employees’ contribution
• Increase in cost of Virginia Retirement System contributions and a 7.84% increase in health insurance – a net 8.5% increase
• Reduction supplies by 22.1% and equipment by 13.7%
Actual Approved Approved Increase / 2011 2012 2013 (Decrease)
Position Summary (Full-Time Equivalent Positions) 47.25 42.25 41.25 (1.00)
Expenditure Type
Salaries 3,231,433$ 3,072,950$ 3,055,376$ (0.6) %Fringe Benefits 758,229 811,655 880,263 8.5 Contract Services 948,766 918,230 912,201 (0.7) Travel & Staff Development 254,751 352,045 355,129 0.9 Other Costs (Communications & Leases and Rentals) 14,998 23,800 24,800 4.2 Supplies 401,982 559,887 435,963 (22.1) Equipment 31,664 38,081 32,881 (13.7)
Total 5,641,823$ 5,776,648$ 5,696,613$ (1.4) %
Budget Summary - Program 131

127
NORFOLK PUBLIC SCHOOLS – Nationally Recognized. Globally Competitive.
Program 132 - Media Services Media Services encompass all activities and resources through which students and teachers access ideas and information. The program provides activities that serve to incorporate and integrate a range of materials (printed, electronic, video, audio, etc.) into the instructional program. Included are the costs of operating library-media centers at each school.
Goals:
• Work with other educators to design learning strategies to meet the needs of students
• Provide instruction in the essential skills and habits to ensure that students and staff are effective users of ideas and information
• Provide equitable access to resources and information
• Provide learning experiences that encourage users to be discriminating consumers and
skilled creators of information
The Proposed 2012-2013 Budget for Media Services is a net increase of $292,559 or 5.1% over Fiscal Year 2012. The increase is due to a 7.0% wage increase for employees (a 2.0% general wage increase for all employees and a mandated 5.0% wage increase for full-time employees in VRS to offset the legislative mandate that employees contribute their share to VRS), the increase in the Virginia Retirement System contribution rates and an increase in health insurance.
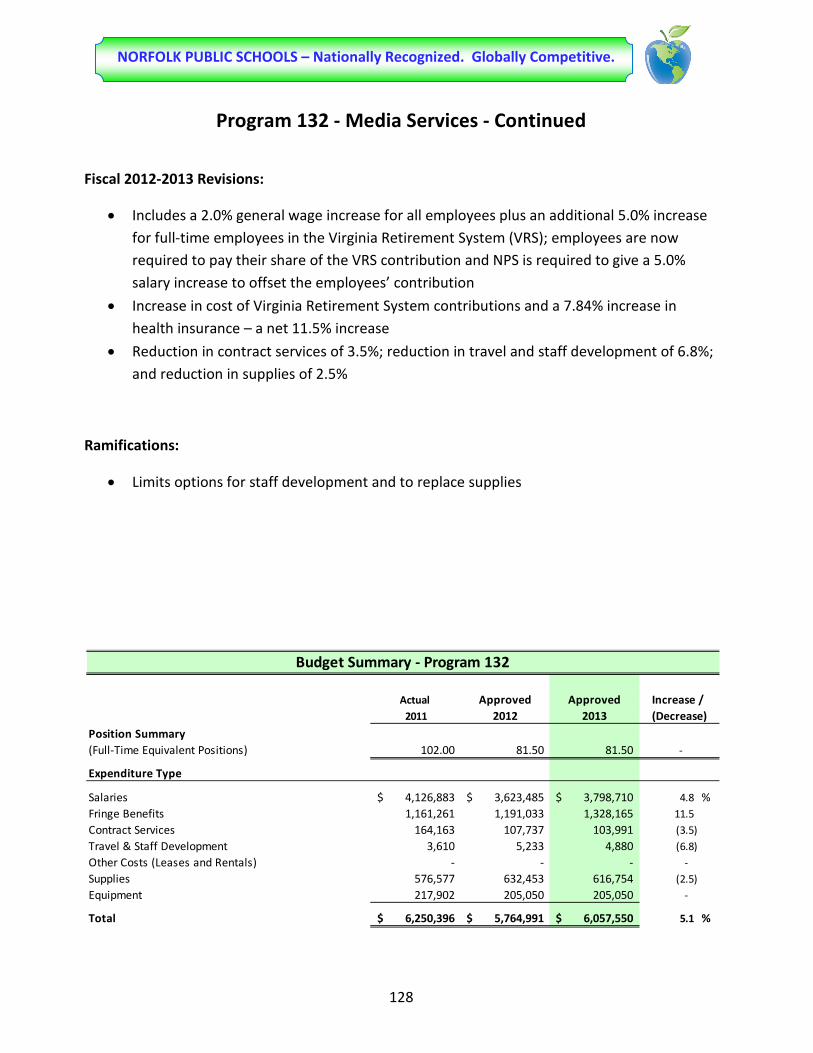
128
NORFOLK PUBLIC SCHOOLS – Nationally Recognized. Globally Competitive.
Program 132 - Media Services - Continued
Fiscal 2012-2013 Revisions:
• Includes a 2.0% general wage increase for all employees plus an additional 5.0% increase for full-time employees in the Virginia Retirement System (VRS); employees are now required to pay their share of the VRS contribution and NPS is required to give a 5.0% salary increase to offset the employees’ contribution
• Increase in cost of Virginia Retirement System contributions and a 7.84% increase in health insurance – a net 11.5% increase
• Reduction in contract services of 3.5%; reduction in travel and staff development of 6.8%; and reduction in supplies of 2.5%
Ramifications:
• Limits options for staff development and to replace supplies
Actual Approved Approved Increase / 2011 2012 2013 (Decrease)
Position Summary (Full-Time Equivalent Positions) 102.00 81.50 81.50 -
Expenditure Type
Salaries 4,126,883$ 3,623,485$ 3,798,710$ 4.8 %Fringe Benefits 1,161,261 1,191,033 1,328,165 11.5 Contract Services 164,163 107,737 103,991 (3.5) Travel & Staff Development 3,610 5,233 4,880 (6.8) Other Costs (Leases and Rentals) - - - - Supplies 576,577 632,453 616,754 (2.5) Equipment 217,902 205,050 205,050 -
Total 6,250,396$ 5,764,991$ 6,057,550$ 5.1 %
Budget Summary - Program 132

129
NORFOLK PUBLIC SCHOOLS – Nationally Recognized. Globally Competitive.
Program 141 - Office of the Principal
Activities of the Office of the Principal provide the overall management and direction of a particular school. Included are activities performed by the school principal and assistant principals while they:
• Supervise operations and provide instructional leadership of the school • Evaluate the staff members • Assign duties to staff members • Supervise and maintain the school records • Coordinate school instructional activities
The activities of the clerical staff in the office in support of teaching and administrative duties are also included in this program.
Fiscal 2011-2012 FTE Revisions:
• Re-coded 1 Clerical position as per state requirements in fiscal 2012 to Guidance Services
The Proposed 2012-2013 Budget for the Office of the Principal is a net increase of $1.1 million or 7.2% over Fiscal Year 2012. The increase is due to a 7.0% wage increase for employees (a 2.0% general wage increase for all employees and a mandated 5.0% wage increase for full-time employees in VRS to offset the legislative mandate that employees contribute their share to VRS), the increase in the Virginia Retirement System contribution rates and an increase in health insurance.

130
NORFOLK PUBLIC SCHOOLS – Nationally Recognized. Globally Competitive.
Program 141 - Office of the Principal - Continued
Fiscal 2012-2013 Revisions:
• Includes a 2.0% general wage increase for all employees plus an additional 5.0% increase for full-time employees in the Virginia Retirement System (VRS); employees are now required to pay their share of the VRS contribution and NPS is required to give a 5.0% salary increase to offset the employees’ contribution
• Increase in cost of Virginia Retirement System contributions and a 7.84% increase in health insurance – a net 12.4% increase
• Reduction in Contract Services – a decrease of 1.7%
• Reduction in Supplies – a decrease of 17.1%
Ramifications:
• Limits supplies available to staff
Actual Approved Approved Increase / 2011 2012 2013 (Decrease)
Position Summary (Full-Time Equivalent Positions) 233.00 214.00 214.00 -
Expenditure Type
Salaries 12,222,056$ 11,666,717$ 12,384,839$ 6.2 %Fringe Benefits 3,365,193 3,568,887 4,012,764 12.4 Contract Services 120,491 138,475 136,075 (1.7) Travel & Staff Development 3,237 7,208 7,208 - Other Costs (Leases and Rentals) 71,023 184,500 184,500 - Supplies 152,583 170,239 141,081 (17.1) Equipment 154,262 18,100 18,100 -
Total 16,088,845$ 15,754,126$ 16,884,567$ 7.2 %
Budget Summary - Program 141

131
NORFOLK PUBLIC SCHOOLS – Nationally Recognized. Globally Competitive.
Program 170 - Alternative Education
The Alternative Education Program serves students who have been unable to stay in regular settings and the Madison location offers them the opportunity to continue their education. Goals:
• To ensure that students who are in need of supportive services in settings other than their traditional comprehensive schools are afforded a full continuum of services which provide for opportunities for continuous learning
• Funding is focused upon creating consistent high quality learning experiences and pertinent services that effectively meet the needs of students.
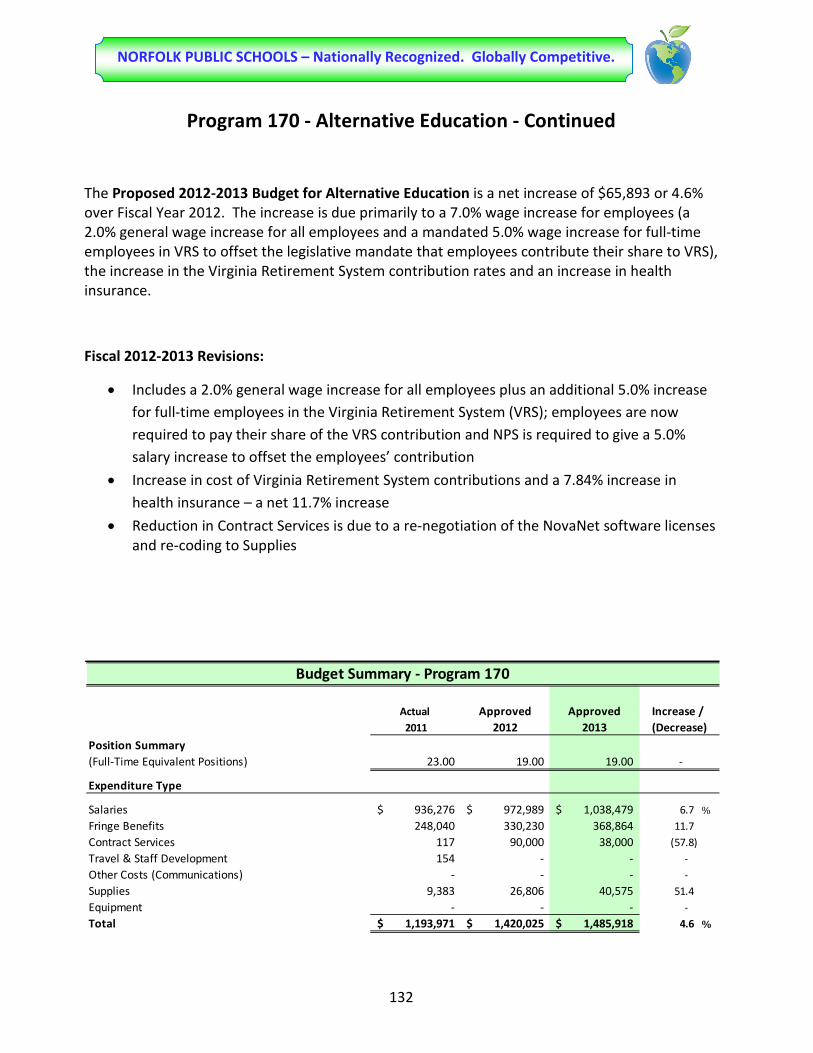
132
NORFOLK PUBLIC SCHOOLS – Nationally Recognized. Globally Competitive.
Program 170 - Alternative Education - Continued
The Proposed 2012-2013 Budget for Alternative Education is a net increase of $65,893 or 4.6% over Fiscal Year 2012. The increase is due primarily to a 7.0% wage increase for employees (a 2.0% general wage increase for all employees and a mandated 5.0% wage increase for full-time employees in VRS to offset the legislative mandate that employees contribute their share to VRS), the increase in the Virginia Retirement System contribution rates and an increase in health insurance.
Fiscal 2012-2013 Revisions:
• Includes a 2.0% general wage increase for all employees plus an additional 5.0% increase for full-time employees in the Virginia Retirement System (VRS); employees are now required to pay their share of the VRS contribution and NPS is required to give a 5.0% salary increase to offset the employees’ contribution
• Increase in cost of Virginia Retirement System contributions and a 7.84% increase in health insurance – a net 11.7% increase
• Reduction in Contract Services is due to a re-negotiation of the NovaNet software licenses and re-coding to Supplies
Actual Approved Approved Increase / 2011 2012 2013 (Decrease)
Position Summary (Full-Time Equivalent Positions) 23.00 19.00 19.00 -
Expenditure Type
Salaries 936,276$ 972,989$ 1,038,479$ 6.7 %Fringe Benefits 248,040 330,230 368,864 11.7 Contract Services 117 90,000 38,000 (57.8) Travel & Staff Development 154 - - - Other Costs (Communications) - - - - Supplies 9,383 26,806 40,575 51.4 Equipment - - - - Total 1,193,971$ 1,420,025$ 1,485,918$ 4.6 %
Budget Summary - Program 170

133
NORFOLK PUBLIC SCHOOLS – Nationally Recognized. Globally Competitive.
Program 200 - Special Education
Special Education includes programs and activities designed to meet the special needs of students with disabilities and encompasses both classroom and direct support activities. Examples of disabilities include: specific learning disabilities, emotional disabilities, cognitive impairments, and physical disabilities. Special education programs are designed to foster, academic achievement including powerful literacy, and to decrease gaps between students with disabilities and their non-disabled peers. In addition, special education programs are designed to support access to the general education curriculum and to promote successful post-secondary options and opportunities for students with disabilities. Early childhood special education services for pre-schoolers identified as developmentally delayed are available at Easton Pre-School and several elementary schools. NOTE: The Special Education Department also has access to funds from Medicaid reimbursements received from the federal government for services to Medicaid eligible children and Individuals with Disabilities Education Act (IDEA Title VI-B) funding (See the Grants and Other Funds section of this document for details).
Fiscal 2011-2012 FTE Revisions:
• 8 Teacher contract positions were reclassified to School Social Worker and Psychologist positions to augment Medicaid billings
• 5 Speech Language Pathologists positions were added; funded from Contracted Services
• 1 Other Professional position was converted to a teacher position
The Proposed 2012-2013 Budget for Special Education is basically level funded with a modest net increase of $11,087 over Fiscal Year 2012. The increase is due primarily to a 7.0% wage increase for employees (a 2.0% general wage increase for all employees and a mandated 5.0% wage increase for full-time employees in VRS to offset the legislative mandate that employees contribute their share to VRS), the increase in the Virginia Retirement System contribution rates and an increase in health insurance offset by the elimination of positions.
Fiscal 2012-2013 FTE Revisions:
• 1 Central Office Administrator position is eliminated
• 1 Central Office Teacher Specialist position is eliminated
• 33 Special Ed Teacher Assistants positions are eliminated to right-size to SOQ funded positions
• 2 Central Office Clerical positions are eliminated

134
NORFOLK PUBLIC SCHOOLS – Nationally Recognized. Globally Competitive.
Program 200 - Special Education - Continued Fiscal 2012-2013 Other Revisions:
• Includes a 2.0% general wage increase for all employees plus an additional 5.0% increase for full-time employees in the Virginia Retirement System (VRS); employees are now required to pay their share of the VRS contribution and NPS is required to give a 5.0% salary increase to offset the employees’ contribution
• Increase in cost of Virginia Retirement System contributions and a 7.84% increase in health insurance – a net 5.0% increase
• Decrease in Stipends – Difficult duty stipends are being restructured
• Realignment of travel lines to more accurately reflect budget needs
• Reduction in Regional Educational Programs due to negotiations with SECEP (Southeast Cooperative Educational Programs)
• Elimination of funds for new equipment purchases
Ramifications:
• Reduce support related to teacher assistants
Actual Approved Approved Increase / 2011 2012 2013 (Decrease)
Position Summary (Full-Time Equivalent Positions) 639.08 639.00 602.00 (37.00)
Expenditure Type
Salaries 26,183,187$ 25,291,364$ 25,323,612$ 0.1 %Fringe Benefits 7,632,028 8,913,657 9,360,154 5.0 Contract Services 876,538 961,650 895,217 (6.9) Travel & Staff Development 112,412 141,570 147,395 4.1 Other Costs (Student Field Trips & Leases and Rentals) 5,060 21,400 25,900 21.0 Supplies 338,783 262,091 261,991 (0.0) Regional Educational Programs 6,588,522 7,270,486 6,970,486 (4.1) Equipment 578,566 141,024 29,574 (79.0)
Total 42,315,095$ 43,003,242$ 43,014,329$ 0.0 %
Budget Summary - Program 200

135
NORFOLK PUBLIC SCHOOLS – Nationally Recognized. Globally Competitive.
Program 300 - Career and Technical Education
Career and Technical Education includes classroom and direct support activities designed to provide students with knowledge, skills, and abilities to successfully enter the work force or a post-secondary technical training program. These programs are offered at each high school and at Norfolk Technical Center. Exploratory classes are also offered at middle schools.
Goals: • To prepare students for particular fields of study that include rigorous mastery of
both academic and technical skills which will equip them for immediate entry into the work force, further education, military and post-secondary education
• To ensure that programs/courses offered are consistent with industry standards,
employment demands and opportunities, requirements and certifications The Proposed 2012-2013 Budget for Career and Technical Education is a net increase of $78,848 or 1.0% over Fiscal Year 2012. The net increase is due to a 7.0% wage increase for employees (a 2.0% general wage increase for all employees and a mandated 5.0% wage increase for full-time employees in VRS to offset the legislative mandate that employees contribute their share to VRS), the increase in the Virginia Retirement System contribution rates and an increase in health insurance offset by reductions in this program in an effort to bring the expenses in alignment with SOQ funding.
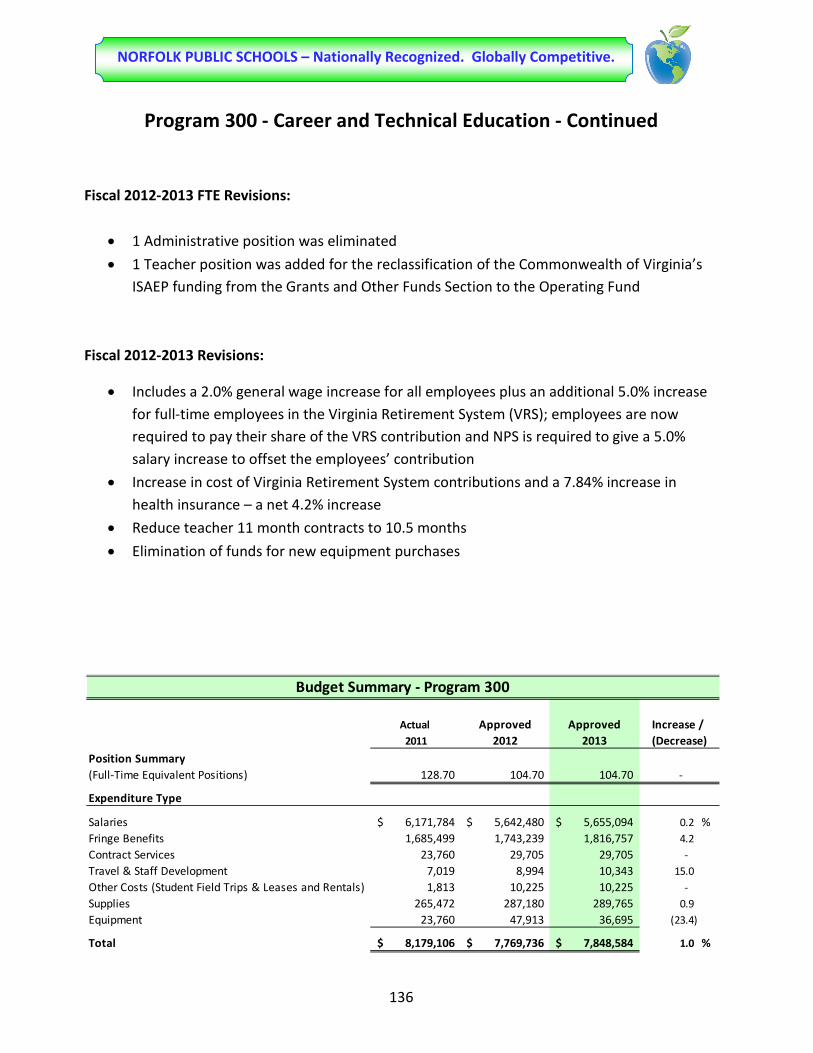
136
NORFOLK PUBLIC SCHOOLS – Nationally Recognized. Globally Competitive.
Program 300 - Career and Technical Education - Continued
Fiscal 2012-2013 FTE Revisions:
• 1 Administrative position was eliminated
• 1 Teacher position was added for the reclassification of the Commonwealth of Virginia’s ISAEP funding from the Grants and Other Funds Section to the Operating Fund
Fiscal 2012-2013 Revisions:
• Includes a 2.0% general wage increase for all employees plus an additional 5.0% increase for full-time employees in the Virginia Retirement System (VRS); employees are now required to pay their share of the VRS contribution and NPS is required to give a 5.0% salary increase to offset the employees’ contribution
• Increase in cost of Virginia Retirement System contributions and a 7.84% increase in health insurance – a net 4.2% increase
• Reduce teacher 11 month contracts to 10.5 months
• Elimination of funds for new equipment purchases
Actual Approved Approved Increase / 2011 2012 2013 (Decrease)
Position Summary (Full-Time Equivalent Positions) 128.70 104.70 104.70 -
Expenditure Type
Salaries 6,171,784$ 5,642,480$ 5,655,094$ 0.2 %Fringe Benefits 1,685,499 1,743,239 1,816,757 4.2 Contract Services 23,760 29,705 29,705 - Travel & Staff Development 7,019 8,994 10,343 15.0 Other Costs (Student Field Trips & Leases and Rentals) 1,813 10,225 10,225 - Supplies 265,472 287,180 289,765 0.9 Equipment 23,760 47,913 36,695 (23.4)
Total 8,179,106$ 7,769,736$ 7,848,584$ 1.0 %
Budget Summary - Program 300

137
NORFOLK PUBLIC SCHOOLS – Nationally Recognized. Globally Competitive.
Program 400 - Gifted and Talented
The Gifted and Talented Program includes activities for students whose abilities and potential for accomplishments are so outstanding that they require special programs to meet their educational needs. These students have been identified as having high performance capabilities in the academic, vocational, and/or visual and performing arts areas. Costs of the secondary advanced preparation courses are included with regular classroom instruction.
Goals:
• To effectively identify all students who are gifted • To ensure that identified students receive the services needed to reach their
full potential
The Proposed 2012-2013 Budget for the Gifted and Talented Program is a net decrease of $150,424 or 5.4% from Fiscal Year 2012. The net decrease is due primarily to a 7.0% wage increase for employees (a 2.0% general wage increase for all employees and a mandated 5.0% wage increase for full-time employees in VRS to offset the legislative mandate that employees contribute their share to VRS), the increase in the Virginia Retirement System contribution rates and an increase in health insurance offset by reductions in this program in an effort to bring the expenses in alignment with SOQ funding.
Fiscal 2012-2013 FTE Reductions:
• Reduction of 5 teacher positions

138
NORFOLK PUBLIC SCHOOLS – Nationally Recognized. Globally Competitive.
Program 400 - Gifted and Talented - Continued
Other Fiscal 2012-2013 Revisions:
• Includes a 2.0% general wage increase for all employees plus an additional 5.0% increase for full-time employees in the Virginia Retirement System (VRS); employees are now required to pay their share of the VRS contribution and NPS is required to give a 5.0% salary increase to offset the employees’ contribution
• Increase in cost of Virginia Retirement System contributions and a 7.84% increase in health insurance – a net 1.8% increase
• Reduction in the Arts and Sciences Extended Day, Summer Enrichment and Strolling Strings programs
• Reduction in travel, staff development and student field trips
• Increase in costs for 54 students attending the Governor’s School for the Arts • Reduction in supplies and equipment replacements
Ramifications:
• Redesign of Gifted Program to more closely align with SOQ funding
Actual Approved Approved Increase / 2011 2012 2013 (Decrease)
Position Summary (Full-Time Equivalent Positions) 40.00 35.00 30.00 (5.00)
Expenditure Type
Salaries 2,027,915$ 1,916,867$ 1,744,809$ (9.0) %Fringe Benefits 525,068 575,408 585,551 1.8 Contract Services 11,835 14,876 14,876 - Travel & Staff Development 18,707 30,075 21,075 (29.9) Other Costs (Student Field Trips & Leases and Rentals) 17,035 18,739 15,989 (14.7) Supplies 41,491 57,000 49,200 (13.7) Regional Educational Programs 173,423 182,175 222,966 22.4 Equipment 2,830 12,790 3,040 (76.2) Total 2,818,304$ 2,807,930$ 2,657,506$ (5.4) %
Budget Summary - Program 400

139
NORFOLK PUBLIC SCHOOLS – Nationally Recognized. Globally Competitive.
Program 500 - Athletics and Virginia High School League Activities
Included here are athletics and other competitive after-school programs. This program includes all high school sports, drama, and forensics. Also included here are middle school sports and intramurals.
Goals:
• To assist middle and high schools in the monitoring, promoting, and execution of programs to provide opportunities for students to achieve educational, team, and personal standards that are consistent with their needs, interests, and abilities
• Present numerous workshops for athletic directors and coaches
• Coordinate provision of academic and training support for student athletes
• Promote the Athletic Advisory Committee and provide guidance to the athletic programs
• Monitor departmental accountability plan for athletics
Fiscal 2011-2012 Revisions:
• 1 Teacher contract position was converted to an Administrator position

140
NORFOLK PUBLIC SCHOOLS – Nationally Recognized. Globally Competitive.
Program 500 - Athletics and Virginia High School League Activities - Continued
The Proposed 2012-2013 Budget for Athletics and Virginia High School League Activities is a basically level funded with a modest net increase of $2,193 or 0.1% over Fiscal Year 2012. The increase in personnel cost is due to a 7.0% wage increase for employees (a 2.0% general wage increase for all employees and a mandated 5.0% wage increase for full-time employees in VRS to offset the legislative mandate that employees contribute their share to VRS), the increase in the Virginia Retirement System contribution rates and an increase in health insurance. These increases are offset by reductions in non-personnel costs.
Fiscal 2012-2013 Revisions:
• Decrease in Fringe Benefits net of requiring employees to pay their share of VRS contributions, an increase in cost of Virginia Retirement System contributions and a 7.84% increase in health insurance – a net 4.6% decrease
• Increase in Contract Services to pay for officials for the Middle School Sports Program
• Increase in Supplies for Middle School Club Sports
• Elimination of equipment replacement funds
Actual Approved Approved Increase / 2011 2012 2013 (Decrease)
Position Summary (Full-Time Equivalent Positions) 6.00 6.00 6.00 -
Expenditure Type
Salaries 1,054,509$ 1,017,188$ 1,027,015$ 1.0 %Fringe Benefits 157,227 178,592 170,390 (4.6) Contract Services 197,563 186,219 206,209 10.7 Travel & Staff Development 11,030 15,110 13,610 (9.9) Other Costs (Leases and Rentals) 10,147 8,709 11,996 37.7 Supplies 16,079 6,192 9,860 59.2 Equipment 23,256 36,263 7,000 (80.7) Transfer to Schools 290,275 349,970 349,970 -
Total 1,760,086$ 1,798,243$ 1,796,050$ (0.1) %
Budget Summary - Program 500
141
NORFOLK PUBLIC SCHOOLS – Nationally Recognized. Globally Competitive.
Program 510 - Other Extra-Curricular
Extra-Curricular Programs are those which are not held during the regular school day. Examples include student SOL remediation, commencement activities, Saturday detention, music (band, choral, strings), and student clubs. Athletics, intramural, and other activities sponsored under the Virginia High School League are excluded here. These costs are stated separately in order to facilitate controls within the district's financial system.
Goals:
• Remediate students to ensure success on SOL tests
• Allow students to make up work and time missed from school
• Offer activities that will enrich the educational experience for all students

142
NORFOLK PUBLIC SCHOOLS – Nationally Recognized. Globally Competitive.
Program 510 - Other Extra-Curricular - Continued
The Proposed 2012-2013 Budget for Other Extra-Curricular Programs is a net decrease of $231,699 or 16.8% from Fiscal Year 2012 due to a reduction in part-time salaries, contract services and supplies.
Actual Approved Approved Increase / 2011 2012 2013 (Decrease)
Position Summary (Full-Time Equivalent Positions) - - - -
Expenditure Type
Salaries 830,987$ 1,045,461$ 840,742$ (19.6) %Fringe Benefits 62,690 79,978 64,317 (19.6) Contract Services 125,365 5,333 333 (93.8) Travel & Staff Development 2,111 - - - Other Costs (Leases and Rentals) 25,000 25,000 25,000 - Supplies 81,489 225,010 218,691 (2.8) Equipment - - - -
Total 1,127,642$ 1,380,782$ 1,149,083$ (16.8) %
Budget Summary - Program 510

143
NORFOLK PUBLIC SCHOOLS – Nationally Recognized. Globally Competitive.
Program 600 - Summer School The Summer School Program includes all instructional activities taking place during the period between the end of the regular school year and the beginning of the next regular school term. These include:
• A free summer remedial program for students who have not met promotion standards, who are not reading at grade level, or who failed Virginia's Standards of Learning (SOL) tests
• Tuition-supported summer school for high school students. This program provides credit to students successfully completing the courses
• Summer Leadership Camp - a free camp experience which seeks to instill positive leadership traits and skills for selected high school students. Classes are held at Virginia Wesleyan College
Goals:
• To provide experiences for students that will help prevent regressions of skills and reinforce previously acquired skills
• To provide opportunities for students to audit and/or retake previously failed high school courses

144
NORFOLK PUBLIC SCHOOLS – Nationally Recognized. Globally Competitive.
Program 600 - Summer School - Continued
The Proposed 2012-2013 Budget for Summer School is a net increase of $37,946 or 2.9% over Fiscal Year 2012 due primarily to a 2.0% wage increase and an increase in Contract Services to fund crossing guards for the summer Sixth Grade Transition Program.
Actual Approved Approved Increase / 2011 2012 2013 (Decrease)
Position Summary (Full-Time Equivalent Positions) - - - -
Expenditure Type
Salaries 852,452$ 984,797$ 998,281$ 1.4 %Fringe Benefits 64,952 75,337 76,368 1.4 Contract Services 2,193 - 25,500 100.0 Travel & Staff Development - - - - Other Costs (Leases and Rentals) 1,564 1,546 - (100.0) Supplies 18,574 53,571 53,048 (1.0) Regional Educational Programs 174,573 177,940 177,940 - Equipment - - - -
Total 1,114,307$ 1,293,191$ 1,331,137$ 2.9 %
Budget Summary - Program 600

145
NORFOLK PUBLIC SCHOOLS – Nationally Recognized. Globally Competitive.
Program 700 - Adult Education The Adult Education Program provides instructional courses for the community in an adult setting. These services are typically provided during evening hours or at facilities separate from regular elementary and high schools. Specific classes are offered in various subject areas, General Equivalency Diploma (GED), English as a Second Language (ESL), and special interest areas such as marketing, nursing, etc. Tuition is charged and the program remits the tuition to the School Board to mitigate the cost of the program.
Goals:
• An instructional program designed to provide our diverse population with an opportunity to reach their full potential in a supportive and caring environment
• Adult Education includes challenging and rigorous credit bearing high school completion courses; Adult Basic Education; GED Prep and Race to GED, and Apprenticeship Accomplishments

146
NORFOLK PUBLIC SCHOOLS – Nationally Recognized. Globally Competitive.
Program 700 - Adult Education - Continued
The Proposed 2012-2013 Budget for Adult Education increased $40,777 or 6.1% over Fiscal Year 2012 due to a 7.0% wage increase for employees (a 2.0% general wage increase for all employees and a mandated 5.0% wage increase for full-time employees in VRS to offset the legislative mandate that employees contribute their share to VRS), an increase in the Virginia Retirement System contribution rates and an anticipated increase in health insurance cost.
Actual Approved Approved Increase / 2011 2012 2013 (Decrease)
Position Summary (Full-Time Equivalent Positions) 4.00 4.00 4.00 -
Expenditure Type
Salaries 484,676$ 542,599$ 572,453$ 5.5 %Fringe Benefits 74,608 92,488 103,411 11.8 Contract Services 13,703 15,750 15,750 - Travel & Staff Development 430 - - - Other Costs (Leases and Rentals) - - - - Supplies 9,825 15,430 15,430 - Equipment 5,000 8,150 8,150 - Total 588,241$ 674,417$ 715,194$ 6.1 %
Budget Summary - Program 700

147
NORFOLK PUBLIC SCHOOLS – Nationally Recognized. Globally Competitive.
Program 800 - Non-Regular Day School (Pre-School) This program includes costs of the early childhood education. Included are the instructional and administrative costs of programs at Berkley/Campostella, Easton, and Oceanair Elementary School. The costs of numerous pre-kindergarten classrooms in other elementary schools are also included. These programs serve four-year old students who are at risk for failure. The pre-school program for three-year olds is not included here since it is funded by Title I.
Goals:
• The pre-kindergarten program for 3 and 4 year olds has been in existence in Norfolk Public Schools for 30 years. It was originally funded solely through Title I and the local budget. In 1995, the Virginia Pre-school Initiative grant began partial funding of the 4-Year-Old Program for children at risk.
• The programs we have are high-quality and they are rigorous
• We have 20 classes that serve three-year-olds. These are all federally funded and primarily are housed at our two early childhood centers.
• Pre-kindergarten in Norfolk capitalizes on the nationally acclaimed High/Scope curriculum - a model that has been adopted by the majority of school districts in Virginia. It is research-based and has been used successfully for nearly four decades.
• Provide professional development in classroom management for all pre-k teachers in partnership with Old Dominion University.
The Proposed 2012-2013 Budget for the Non-Regular Day School (Pre-School) Program is a net increase of $240,540 or 2.2% over Fiscal Year 2012 due to a 7.0% wage increase for employees (a 2.0% general wage increase for all employees and a mandated 5.0% wage increase for full-time employees in VRS to offset the legislative mandate that employees contribute their share to VRS), the increase in the Virginia Retirement System contribution rates, an anticipated increase in health insurance cost offset by a reduction in staff to right-size to state funded positions.
Fiscal 2012-2013 FTE Reductions:
• Elimination of 5 Teacher positions to right-size to State funded positions • Elimination of 5 Teacher Assistant positions • Elimination of 12 Parent Liaison positions • Elimination of 1 Clerical position

148
NORFOLK PUBLIC SCHOOLS – Nationally Recognized. Globally Competitive.
Program 800 - Non-Regular Day School (Pre-School) - Continued
Fiscal 2012-2013 Other Revisions:
• Includes a 2.0% general wage increase for all employees plus an additional 5.0% increase for full-time employees in the Virginia Retirement System (VRS); employees are now required to pay their share of the VRS contribution and NPS is required to give a 5.0% salary increase to offset the employees’ contribution
• Increase in cost of Virginia Retirement System contributions and a 7.84% increase in health insurance – a net 8.3% increase
• Increase in Pre-K staff development
• Reduction in equipment purchases
Actual Approved Approved Increase / 2011 2012 2013 (Decrease)
Position Summary (Full-Time Equivalent Positions) 239.00 239.00 216.00 (23.00)
Expenditure Type
Salaries 8,002,958$ 7,956,922$ 7,944,440$ (0.2) %Fringe Benefits 2,898,165 2,918,673 3,161,969 8.3 Contract Services 14,648 9,652 4,227 (56.2) Travel & Staff Development 14,816 1,000 15,600 1,460.0 Other Costs (Student Field Trips & Leases and Rentals) 40,786 47,566 49,314 3.7 Supplies 151,849 63,575 66,747 5.0 Equipment 1,944 8,636 4,267 (50.6) Total 11,125,168$ 11,006,024$ 11,246,564$ 2.2 %
Budget Summary - Program 800

149
NORFOLK PUBLIC SCHOOLS – Nationally Recognized. Globally Competitive.
Program D21 - Central Administration
This program includes centrally administered services that are not directly related to managing the overall instructional program of the school system. Included in this category are board services, information services, human resources, financial services, purchasing services, and printing services. This section includes the offices of the Superintendent, Associate Superintendent of Chief Operations, Associate Superintendent of Business & Finance and Associate Superintendent of Human Resources. The district technology and management information systems are not included here. Goals:
• To support and assist the School Board in the execution of their work
• To oversee the Comprehensive Accountability System
• To monitor building utilization, class size ratios, and ensure adequate staffing to meet state requirements
• To operate in a fiscally conservative and efficient manner, holding all schools, departments, and offices in the school division to the same
• To ensure that schools have adequate fiscal resources and the necessary materials and equipment to promote student achievement
• To communicate state and school division goals, objectives, and indicators to all stakeholder groups (students, teachers, parents, and the community)
• To develop the annual operating budget • To develop the budget for the various operations within the central administration • To complete Annual School Report, the basis of State funding for NPS
• To complete Audited Financial Statements
Fiscal 2011-2012 FTE Revision:
• 1 Other Professional and 1 Technical position transferred from Technology Program 800
The Proposed 2012-2013 Budget for Central Administration is a net increase of $253,761 or 2.7% over Fiscal Year 2012 due to a 7.0% wage increase for employees (a 2.0% general wage increase for all employees and a mandated 5.0% wage increase for full-time employees in VRS to offset the legislative mandate that employees contribute their share to VRS), the increase in the Virginia Retirement System contribution rates and an anticipated increase in health insurance cost.

150
NORFOLK PUBLIC SCHOOLS – Nationally Recognized. Globally Competitive.
Program D21 - Central Administration - Continued
Fiscal 2012-2013 FTE Reductions:
• Reduction of Central Office positions – 1 Administrator, 2 Professional, and 2 Clerical
Other Fiscal 2011-2012 Revisions:
• Includes a 2.0% general wage increase for all employees plus an additional 5.0% increase for full-time employees in the Virginia Retirement System (VRS); employees are now required to pay their share of the VRS contribution and NPS is required to give a 5.0% salary increase to offset the employees’ contribution
• Increase in cost of Virginia Retirement System contributions and a 7.84% increase in health insurance – a net 9.6% increase
• Increase in Organizational Memberships for the Panasonic Foundation offset by a reduction in the Council of Urban Boards of Education membership
• Reduction in supplies
• Reduction in equipment replacements
Ramifications:
• Reduction in staff in Business and Finance will consolidate audit services and redesign of the model of service delivery and the reduction in staff in Human Resources will require a reorganization of the department as it relates to benefit services
• Business and Finance will no longer provide grant writing services
Actual Approved Approved Increase / 2011 2012 2013 (Decrease)
Position Summary (Full-Time Equivalent Positions) 96.00 95.00 90.00 (5.00)
Expenditure Type
Salaries 5,270,330$ 5,129,073$ 5,370,416$ 4.7 %Fringe Benefits 1,318,431 1,892,642 2,073,891 9.6 Contract Services 1,471,318 968,201 963,754 (0.5) Travel & Staff Development 209,405 261,935 272,641 4.1 Other Costs (Postage & Leases and Rentals, Etc.) 154,753 243,716 244,576 0.4 Supplies 316,655 376,325 354,875 (5.7) Equipment 52,836 515,390 360,890 (30.0) Fund Balance Transfer - - - - Total 8,793,728$ 9,387,282$ 9,641,043$ 2.7 %
Budget Summary - Program D21
151
NORFOLK PUBLIC SCHOOLS – Nationally Recognized. Globally Competitive.
Program D22 - Student Attendance and Health
Student Attendance and Health Services include activities in four areas: attendance services, health services, psychological services, and audiology services. Attendance Services are activities which have as their primary purpose the promotion and improvement of children's attendance at school. These activities include:
• Identifying non-attendance patterns
• Improving student attitudes regarding school attendance
• Acting early on non-attendance problems; enforcing compulsory attendance laws Health Services are activities that provide students with appropriate medical, dental, or
nursing needs. Psychological services are activities concerned with psychological testing, counseling, and psychotherapy services. School psychologists also participate on school child student teams which are responsible for diagnosing students for inclusion in special education. Audiology services are activities which identify, assess, and treat children with hearing and language impairments.
Goals:
• Collaborative efforts between the Department of Pupil Personnel Services, the Juvenile Domestic Relations Courts, and various social service agencies continue to assist students and families overcome barriers that limit their educational opportunities.
• Because research has shown that addressing attendance problems as early as possible results in increased academic achievement, efforts have been increased to ensure that elementary schools are being more proactive in their attempt to address truant students.
Fiscal 2011-2012 FTE Revision:
• 4 Psychologists positions transferred from Federal Flow Through Funds to augment with Medicaid billings; Special Education Teacher positions from Program 200 funded these positions

152
NORFOLK PUBLIC SCHOOLS – Nationally Recognized. Globally Competitive.
Program D22 - Student Attendance and Health - Continued
The Proposed 2012-2013 Budget for Student Attendance and Health increased $1.9 million or 49.3% over Fiscal Year 2012 due to a 7.0% wage increase for employees (a 2.0% general wage increase for all employees and a mandated 5.0% wage increase for full-time employees in VRS to offset the legislative mandate that employees contribute their share to VRS), the inclusion of the City’s appropriation for School Nurses provided by the Norfolk Public Health Department in NPS’s budget, the increase in the Virginia Retirement System contribution rates and an anticipated increase in health insurance cost.
Fiscal 2012-2013 FTE Revisions:
• Elimination of 2 Psychologist positions
Other Fiscal 2012-2013 Revisions:
• Includes a 2.0% general wage increase for all employees plus an additional 5.0% increase for full-time employees in the Virginia Retirement System (VRS); employees are now required to pay their share of the VRS contribution and NPS is required to give a 5.0% salary increase to offset the employees’ contribution
• Increase in cost of Virginia Retirement System contributions and a 7.84% increase in health insurance – a net 13.8% increase
• Payment to Norfolk Public Health Department for school nursing services - $1.5 million
• Increase of $8,320 or 69.9% in Staff Development for district wide staff development efforts in security and discipline (Nonviolent Crisis Intervention Program)
Actual Approved Approved Increase / 2011 2012 2013 (Decrease)
Position Summary (Full-Time Equivalent Positions) 48.00 50.00 48.00 (2.00)
Expenditure Type
Salaries 2,777,002$ 2,764,257$ 2,991,658$ 8.2 %Fringe Benefits 687,637 833,702 949,074 13.8 Contract Services 82,169 116,856 1,627,256 1,292.5 Travel & Staff Development 4,470 11,908 20,228 69.9 Other Costs (Communications) - - - - Supplies 33,187 40,605 40,605 - Equipment 7,297 12,422 12,422 - Total 3,591,762$ 3,779,750$ 5,641,243$ 49.3 %
Budget Summary - Program D22
153
NORFOLK PUBLIC SCHOOLS – Nationally Recognized. Globally Competitive.
Program D30 - Pupil Transportation
Pupil Transportation includes the home-to-school transportation of students and all related field trips and shuttles between schools and for special events. This service is provided using over 300 school buses that travel 3.5 million miles per year. Home-to-school transportation service is provided for approximately 18,500 eligible students. The remaining students reside within the non-transportation zone of their assigned school. Of that number, approximately 1,400 special needs students are transported to/from school daily for all related special trips. In spite of the fact that the department still faces a driver shortage, the percentage of on-time bus arrivals at our schools remained high...99.5% for the 2009/10 school year. All expenditures related to the operation, maintenance, and management of pupil transportation are included in this program. Also, included is transportation for specialty programs, Saturday events, and athletics.
The Proposed 2012-2013 Budget for Pupil Transportation is an overall increase of $60,540 or 0.5% over Fiscal Year 2012.
Fiscal 2012-2013 FTE Reductions:
• Reduction of 3 Bus Driver positions
Fiscal 2012-2013 Other Revisions:
• Includes a 2.0% general wage increase for all employees plus an additional 5.0% increase for full-time employees in the Virginia Retirement System (VRS); employees are now required to pay their share of the VRS contribution and NPS is required to give a 5.0% salary increase to offset the employees’ contribution
• Increase in cost of Virginia Retirement System contributions and a 7.84% increase in health insurance – a net 5.5% increase
• Eliminate transportation services for Berkley-Campostella ECC, Norfolk Marine Program (AMI), Norstar, Starbase and summer programs Breakthrough, Horizons and Camp Horizons
• Eliminate the purchase of HRT tickets
• Reduction in all travel and staff development budget to support 278 employees
• Reduction in equipment replacements – a decrease of 72.8%

154
NORFOLK PUBLIC SCHOOLS – Nationally Recognized. Globally Competitive.
Program D30 - Pupil Transportation - Continued
Ramifications:
The major impact of the budget reductions for Transportation will be the delay in upgrading the current two-way radios to digital systems and the upgrade of the current video surveillance systems (cameras) on buses from VHS to digital format. Both systems are necessary for optimal safety and security of the children riding school buses.
The proposed reductions will also eliminate transportation services for several programs such as home-to-school service for the Berkley-Campostella ECC , Norfolk Marine Program (AMI) and Norstar (limited school-to-home) as well as mid-day shuttles for Starbase and Norstar. It will also eliminate service for summer programs such as Breakthrough, Horizons and Camp Horizons. Finally, it will eliminate funds used to purchase HRT passes used by students when yellow bus service is not available.
Actual Approved Approved Increase / 2011 2012 2013 (Decrease)
Position Summary (Full-Time Equivalent Positions) 284.00 281.00 278.00 (3.00)
Expenditure Type
Salaries 6,548,882$ 6,663,502$ 6,755,734$ 1.4 %Fringe Benefits 2,163,496 2,590,943 2,732,993 5.5 Contract Services 126,321 158,181 134,116 (15.2) Travel & Staff Development 8,846 26,404 9,620 (63.6) Other Costs (Insurance) 32,671 - - - Supplies 1,846,977 2,033,284 1,996,008 (1.8) Equipment 52,103 131,317 35,700 (72.8) Total 10,779,295$ 11,603,631$ 11,664,171$ 0.5 %
Budget Summary - Program D30
155
NORFOLK PUBLIC SCHOOLS – Nationally Recognized. Globally Competitive.
Program D40 - Operations and Maintenance
Operations and Maintenance Services are those which keep school buildings open, comfortable, and safe for use, and which keep the grounds, buildings, and equipment in effective working condition. It includes management of school facilities, risk management, building services, equipment services, vehicle services, security services, warehouse services, and planning activities. Fiscal 2011-2012 FTE Revision:
• 1 Lobby Admin Assistant for Security funded with part-time funds
The Proposed 2012-2013 Budget for Operations and Maintenance increased $829,241 or 2.5% over Fiscal Year 2012 due primarily to a 7.0% wage increase for employees (a 2.0% general wage increase for all employees and a mandated 5.0% wage increase for full-time employees in VRS to offset the legislative mandate that employees contribute their share to VRS), an increase in the Virginia Retirement System contribution rates and an anticipated increase in health insurance cost.
Fiscal 2012-2013 FTE Reductions:
• 1 Administrator position • 6 Custodians positions • 4 Trade positions
Other Fiscal 2012-2013 Revisions:
• Includes a 2.0% general wage increase for all employees plus an additional 5.0% increase for full-time employees in the Virginia Retirement System (VRS); employees are now required to pay their share of the VRS contribution and NPS is required to give a 5.0% salary increase to offset the employees’ contribution
• Increase in cost of Virginia Retirement System contributions and a 7.84% increase in health insurance – a net 3.5% increase
• Elimination of overtime and part-time summer help • Reduction in all travel and staff development accounts • Reduction of 30.4% in supplies due to the elimination of new carpet installation, the
elimination of alterations and modification requested by principals and schools and a reduction in parking lot repair and grounds maintenance
• Equipment additions increased for the purchase of Automated External Defibrillators (AEDs) for all elementary and auxiliary schools and for the upgrade of security equipment

156
NORFOLK PUBLIC SCHOOLS – Nationally Recognized. Globally Competitive.
Program D40 - Operations and Maintenance - Continued Ramifications: The proposed reductions to the Facilities Management budget will impact our ability to maintain an aging inventory of facilities in the following ways:
• loss of summer part-time workers will reduce our ability to paint schools during the summer months when children are not present
• reduction in overtime will impact our ability to respond to emergencies and inclement weather conditions
• loss of trades positions will impact our ability to maintain a high standard of facility maintenance
• the loss of 6 custodial positions will result in a rescheduling of staff at affected schools
• reduction in contract services will significantly reduce/eliminate our ability to replace carpeting, repair parking lots and handle grounds maintenance such as fence/playground equipment repair
Actual Approved Approved Increase / 2011 2012 2013 (Decrease)
Position Summary (Full-Time Equivalent Positions) 415.00 409.50 398.50 (11.00)
Expenditure Type
Salaries 13,471,478$ 13,193,218$ 13,713,290$ 3.9 %Fringe Benefits 4,595,051 4,920,029 5,091,621 3.5 Contract Services 4,461,087 2,883,065 3,227,295 11.9 Utilities & Communications 8,531,885 9,899,378 9,641,489 (2.6) Travel & Staff Development 6,473 20,884 18,678 (10.6) Other Costs (Insurance & Leases and Rentals) 1,578,266 1,606,854 1,681,440 4.6 Supplies 2,181,123 1,100,780 766,567 (30.4) Equipment 362,929 256,729 569,798 122.0 Total 35,188,292$ 33,880,937$ 34,710,178$ 2.5 %
Budget Summary - Program D40

157
NORFOLK PUBLIC SCHOOLS – Nationally Recognized. Globally Competitive.
Program D66 - Facility Improvements Facility Improvements are activities concerned with remodeling buildings, constructing additions to buildings, installing or extending heating or air-conditioning systems, replacing roofs, and improving sites. Also included, are the purchase or replacement of portable classrooms. Capital funding comes from a number of sources: Special Revenue Funds, City of Norfolk Capital Improvements Plan budget and the Operating budget.
Please note: Each year (during December) the School Board holds a public hearing for capital concerns. Requests are made of the City of Norfolk for funding in the form of operational budget support.
The Proposed 2012-2013 Budget for Facility Improvements is at the Fiscal 2012 level.
Ramifications:
The Facilities division continues to struggle with maintaining our aging buildings with an ever decreasing budget. Continued underfunding of this program means carpets, tile, sidewalks, gym floor refinishing, roof repair and many other routine maintenance items will only be scheduled on an emergency basis. Principals will not have options to move or change classrooms or laboratories within their buildings to meet changes in students’ needs. Existing classrooms and laboratories will be maintained as they currently exist.

158
NORFOLK PUBLIC SCHOOLS – Nationally Recognized. Globally Competitive.
Program D66 - Facility Improvements - Continued
Actual Approved Approved Increase / 2011 2012 2013 (Decrease)
Position Summary (Full-Time Equivalent Positions) - - - -
Expenditure Type
Salaries -$ -$ -$ - %Fringe Benefits - - - - Contract Services 52,306 100,000 100,000 - Building Acquisitions & Improvements 1,362,808 1,300,000 1,300,000 - Transfer to City of Norfolk - - - - Debt Service: Principal Payments 156,900 156,900 156,900 - Debt Service: Interest Payments 40,937 87,965 87,965 - Total 1,612,951$ 1,644,865$ 1,644,865$ - %
Budget Summary - Program D66

159
NORFOLK PUBLIC SCHOOLS – Nationally Recognized. Globally Competitive.
Program D80 - Information Technology
The Information Technology department is responsible for all the computer technology and web communications for the school district.
Goals:
• Provide a highly reliable network where all authorized staff and students can securely access shared network resources when needed
• Support district technology in an efficient and effective manner • Increase the availability of student data from all sources in an electronic format
(using the Data Warehouse) to support improved planning for student needs • Communicate effectively with students, teachers and parents through the use of
various media to include, but not limited to NPS web sites, Student Information System, and EduLink
• Emphasize and promote the integration of technology into daily instruction • Automate the collection of attendance, grades and test data
The Proposed 2012-2013 Budget for Information Technology is a net decrease of $1.5 million or 21.6% from Fiscal Year 2012.
Fiscal 2011-2012 FTE Revision:
• 1 Other Professional and 1 Technical position transferred to Communications Department in Program D21
Fiscal 2012-2013 Revisions:
• Includes a 2.0% general wage increase for all employees plus an additional 5.0% increase for full-time employees in the Virginia Retirement System (VRS); employees are now required to pay their share of the VRS contribution and NPS is required to give a 5.0% salary increase to offset the employees’ contribution
• Increase in cost of Virginia Retirement System contributions and a 7.84% increase in health insurance – a net 9.4% increase
• Reduction in travel and staff development – a 67.9% decrease • Reduction in supplies – a 53.5% decrease • Increase in equipment due to the reclassification of VPSA Technology funds ($1.6
million) from the Grants Section to the Operating Fund

160
NORFOLK PUBLIC SCHOOLS – Nationally Recognized. Globally Competitive.
Program D80 - Information Technology - Continued
Fiscal 2012-2013 Reductions and Ramifications:
Budget reductions for the Information Technology Division for 2013 will significantly affect flexibility in support of contract support increases, professional development, and supplies. Of the $278,108 being cut, $115,200 of that is within Contract Services. This reduction will all but eliminate the ability to support any increase in current contracts and/or request for new services.
The reduction within Travel will leave only minimal funding for local travel (school engineers) and limited amounts for out-of-town travel.
The last significant reduction is $125,000 from Supplies. This reduction will leave only minimal support for the district with no leeway for new product research, printing supplies, critical part replacements, etc.
The continued reduction in technology funding for our district is reaching critical levels. As more dependency is put upon the technology to support teaching and testing, the ability to maintain those critical systems becomes a major concern. We are no longer dealing with only aged equipment, but also aged network software and systems that face immediate upgrades and/or replacement. Failure to adequately fund the technology needs of the district will have both immediate and far reaching effects going forward. Immediate needs which would have the largest impact moving forward for the district would include the conversion to a Windows network from a Novell environment, the replacement of the Boarder Manager Internet system (which is at end of life), and the tablet device project.
Actual Approved Approved Increase / 2011 2012 2013 (Decrease)
Position Summary (Full-Time Equivalent Positions) 63.00 61.00 61.00 -
Expenditure Type
Salaries 3,305,965$ 3,331,547$ 3,439,321$ 3.2 %Fringe Benefits 860,599 1,003,369 1,097,921 9.4 Contract Services 2,246,302 1,531,849 1,416,599 (7.5) Travel & Staff Development 22,617 55,794 17,936 (67.9) Other Costs (Communications & Leases and Rentals) 193,338 205,894 205,894 - Supplies 130,925 233,675 108,675 (53.5) Regional Education Program (WHRO) 62,350 62,350 62,350 - Equipment & Building Improvements 486,555 432,608 1,990,608 360.1 Total 7,308,652$ 6,857,086$ 8,339,304$ 21.6 %
Budget Summary - Program D80

161
NORFOLK PUBLIC SCHOOLS – Nationally Recognized. Globally Competitive.
This page intentionally left blank.

162
NORFOLK PUBLIC SCHOOLS – Nationally Recognized. Globally Competitive.
This section of the budget document provides information on the various sources and uses of funds available to and managed by Norfolk Public Schools in addition to the Operating Fund. The major funds included are:
• School Nutrition Services – This fund includes all sources and uses of funding pertaining to the operation of school cafeterias. The major funding sources include federal grant revenue (USDA National School Breakfast and Lunch Program) and charges to users.
• American Recovery and Reinvestment Act (ARRA) Funds – Funding made available by the federal government to stimulate the economy in the short-term and invest in education – to strengthen education, drive reforms and improve results for students from early learning through post-secondary education.
• State Operated Programs – These are programs funded by the Commonwealth of Virginia and run by Norfolk Public Schools under a Memorandum of Understanding Agreement.
• Grants and Other Funds – Norfolk Public Schools receive numerous grants and special donations from various federal, state and local resources for specific educational purposes. For grants greater than $100 thousand, a brief description of the grant along with a summary budget are outlined in this section. More detailed expenditures are shown in Appendix B.
Grants and Other Funds

163
NORFOLK PUBLIC SCHOOLS – Nationally Recognized. Globally Competitive.
“Serving high quality nutritious meals to support academic achievement and promote life-long healthy
food choices.”
Operational Description & Fiscal Responsibility Norfolk Public Schools School Nutrition is a self-funded operation supported through cafeteria sales and federal and state reimbursements. School Nutrition does not utilize school board or city monies. The program operates under strict observation of the state and federal regulations and laws governing the use of public monies as well as the reimbursement afforded by the federal programs.
School Nutrition Operational Summary 2011-2012
Meal Eligibility: Free: 56.22% Reduced: 8.94% Paid: 34.84% Meals are provided free of charge to all reduced price students.
Average Number of Meals Served Per Day: Lunch: 23,000 Breakfast: 12,500 After-school Snack: 1,000
Percent of Students Eating Meals: Lunch: 71.46% Breakfast: 38.49%
Meal Cost: Breakfast: 90¢ Elementary Lunch: $1.65; Secondary Lunch $1.85
Employees: Full-time: 157 Part-time: 243 Plus 103 elementary cafeteria monitors
Nutrition Integrity School Nutrition manages the development of its menus in accordance with federal and state nutrition standards ensuring that students are provided with nutritionally balanced high quality meals. School Nutrition is a leader in its field. Whole grains and fresh fruits and vegetables are offered daily. All foods are baked or steamed; there are no fryers in any of our schools.
School Nutrition Program Summary

164
NORFOLK PUBLIC SCHOOLS – Nationally Recognized. Globally Competitive.
Actual Budget Approved % IncreaseAccount Description 2012 2013 2011 2012 2013 Over 2012
RevenueSales 2,603,674$ 2,545,000$ 2,664,000$ 4.68%Federal and State Food Program Reimbursements 11,632,694 11,770,000 13,025,000 10.66%Federal Commodities Donated 1,013,773 830,000 900,000 8.43%Interest Earnings 41,612 10,000 15,000 50.00%Other 84,227 104,500 100,000 -4.31%
Total Revenue 15,375,979$ 15,259,500$ 16,704,000$ 9.47%
ExpendituresCost of Goods Sold 7,495,857 7,116,000$ 8,321,000$ 16.93%Employee Compensation 160.50 157.50 6,550,205 6,944,000 7,123,500 2.58%Maintenance Costs 314,378 415,000 390,000 -6.02%Supplies and Materials 144,760 135,000 125,000 -7.41%Cafeteria and Other Equipment 447,509 440,000 513,000 16.59%Other Costs 290,739 209,500 231,500 10.50%
Total Expenditures 160.50 157.50 15,243,448$ 15,259,500$ 16,704,000$ 9.47%
Excess of Revenues over Expenditures 132,531$ -$ -$
Fund Balance - Beginning of Year 5,628,058 5,760,589 5,760,589
Fund Balance - End of Year 5,760,589$ 5,760,589$ 5,760,589$ 0.00%
Currently, Norfolk serves an average of 35,500 meals and 1000 after-school snacks each day. Child Nutrition Services provides breakfasts,lunches, and snacks which meet the nutritional requirements of the U.S. Department of Agriculture. Meals are provided free of charge tostudents who are eligible for free or reduced meals. Norfolk operates the program as a non-profit organization and utilizes commoditiesprovided by USDA as well as those provided by private vendors.
Summary of School Nutrition Program Funds
Positions
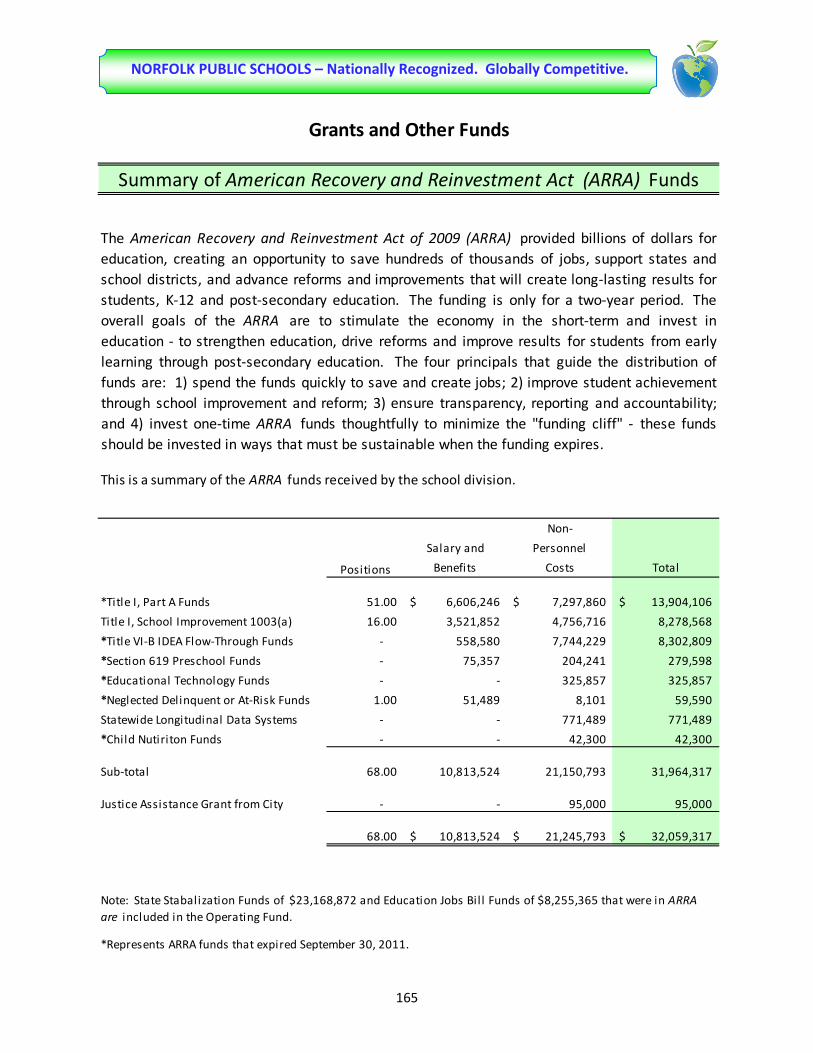
165
NORFOLK PUBLIC SCHOOLS – Nationally Recognized. Globally Competitive.
Grants and Other Funds
Summary of American Recovery and Reinvestment Act (ARRA) Funds
This is a summary of the ARRA funds received by the school division.
Non-
Salary and Personnel
Positions Benefits Costs Total
*Title I, Part A Funds 51.00 6,606,246$ 7,297,860$ 13,904,106$
Title I, School Improvement 1003(a) 16.00 3,521,852 4,756,716 8,278,568
*Title VI-B IDEA Flow-Through Funds - 558,580 7,744,229 8,302,809
*Section 619 Preschool Funds - 75,357 204,241 279,598
*Educational Technology Funds - - 325,857 325,857
*Neglected Delinquent or At-Risk Funds 1.00 51,489 8,101 59,590
Statewide Longitudinal Data Systems - - 771,489 771,489
*Child Nutiriton Funds - - 42,300 42,300
Sub-total 68.00 10,813,524 21,150,793 31,964,317
Justice Assistance Grant from City - - 95,000 95,000
68.00 10,813,524$ 21,245,793$ 32,059,317$
The American Recovery and Reinvestment Act of 2009 (ARRA) provided billions of dollars foreducation, creating an opportunity to save hundreds of thousands of jobs, support states andschool districts, and advance reforms and improvements that will create long-lasting results forstudents, K-12 and post-secondary education. The funding is only for a two-year period. Theoverall goals of the ARRA are to stimulate the economy in the short-term and invest ineducation - to strengthen education, drive reforms and improve results for students from earlylearning through post-secondary education. The four principals that guide the distribution offunds are: 1) spend the funds quickly to save and create jobs; 2) improve student achievementthrough school improvement and reform; 3) ensure transparency, reporting and accountability;and 4) invest one-time ARRA funds thoughtfully to minimize the "funding cliff" - these fundsshould be invested in ways that must be sustainable when the funding expires.
Note: State Stabalization Funds of $23,168,872 and Education Jobs Bil l Funds of $8,255,365 that were in ARRA are included in the Operating Fund.
*Represents ARRA funds that expired September 30, 2011.

166
NORFOLK PUBLIC SCHOOLS – Nationally Recognized. Globally Competitive.
Positions Positions Actual Approved Proposed Incr / (Decr)
GRANT DESCRIPTION 2012 2013 2011 2012 2013 2012
Federal Grants: Compensatory Programs:
Title I, Part A - Improving Basic Programs 175.00 175.00 6,256,707$ 17,000,071$ 17,000,071$ Title I, Part A - Improving Basic Programs ARRA Funds - - 9,940,991 - - Title I, Part A - 1003(a) School Improvement 3.00 - 241,794 351,216 - Title I, Part A - 1003(g) ARRA School Improvement 16.00 16.00 1,624,428 8,640,998 - Title I, Part A - Neglected, Delinquent or At-Risk ARRA Funds - - 49,155 - - Title I, Part D - Prevention and Intervention Program 2.00 2.00 138,492 121,600 121,600 Title I, Part E - Striving Readers Intervention Initiative - - 328,873 - - Title I, - Distinguished School - - 5,465 - - Title II, Part A - Teacher and Principal Training 17.00 17.00 909,381 2,242,227 2,242,227 Title III, Part A - Limited English Proficient - - 55,103 70,396 70,396 Title III, Part A - Immigrant and Youth - - - 45,908 45,908 Title X, Part C - Stuart McKinney Homeless Assistance - - 23,031 50,000 50,000 Even Start Program at Berkley/Compostella Center 4.50 - 175,704 247,869 - Even Start Program at Ingleside Center 4.45 - 177,853 247,869 - Sub-total 221.95 210.00 19,926,978 29,018,154 19,530,202 -32.7%
Special Education:Title VI, Part B - IDEA, Flow-Through Grant 186.50 186.50 284,110 7,244,010 7,244,010 Title VI, Part B - IDEA, Flow-Through ARRA Funds - - 2,657,428 - - IDEA, Section 619 Pre-School Incentive 4.00 4.00 145,559 250,124 250,124 IDEA, Section 619 Pre-School ARRA Funds - - 127,106 - - Sub-total 190.50 190.50 3,214,203 7,494,134 7,494,134 -
Career, Technical and Adult Education:Adult Literacy and Basic Education - - 289,875 333,989 333,989 Carl Perkins Vocational and Applied Tech Act - - 934,852 829,782 829,782 Sub-total - - 1,224,727 1,163,771 1,163,771 -
Other Projects:Drug Free Schools and Communities Act - - 48,353 - - Early Reading First 8.10 - 1,685,565 - - Enhancing Education Thru Technology, Title II, Part D - - 330,971 - - Enhancing Education Thru Technology ARRA Funds - - 321,889 - - Enhancing Education Thru Technology, Title II, Part D (Formula) - - 2,720 102,927 102,927 Fresh Fruit and Vegetable Program - - 169,310 170,724 170,724 Math Solutions Study Project 1.00 1.00 45,047 67,486 68,021 Neglected, Delinquent or At-Risk (SOP), Title I 1.00 1.00 70,620 79,795 79,795 Shoreline Restoration Project - - 51,831 - - State Council of Higher Education - - 38,914 60,440 60,440 Statewide Longitudinal Data Systems - - - 771,489 - Virginia Department of Education Mini Grants - - 1,200 - - Virginia Incentive Program for Speech-Language Pathologists - - 33,000 9,000 9,000 Adjustments and Additional Grants - - - 850,000 850,000 Sub-total 10.10 2.00 2,799,419 2,111,861 1,340,907 -36.5%
Total Federal Grant Assistance 422.55 402.50 27,165,326$ 39,787,920$ 29,529,014$ -25.8%
Note: Proposed 2013 Adjustments and Additional Grants are for final award adjustments and potential additional grant awards.
Summary of Grants and Special Programs

167
NORFOLK PUBLIC SCHOOLS – Nationally Recognized. Globally Competitive.
Positions Positions Actual Approved Proposed
Incr / (Decr) over
GRANT DESCRIPTION 2012 2013 2011 2012 2013 2012
Commonwealth of VirginiaCareer, Technical and Adult Education:
Expanded GED - - 8,190$ 6,732$ 6,732$ General Adult Education - - 18,994 37,229 37,229 Industry Credential Test - - 19,552 20,140 20,140 State Categorical Equipment - - 30,022 33,219 33,219 Race to GED - - 17,199 20,228 20,228 Sub-total - - 93,957 117,548 117,548 -
State Operated Facilities:Children's Hospital of the King's Daughters 20.00 20.00 1,401,315 1,452,107 1,452,107 Norfolk Detention Center School 12.00 12.00 768,809 963,321 963,321 Tidewater Development Center 8.00 8.00 674,708 638,304 638,304 Sub-total 40.00 40.00 2,844,832 3,053,732 3,053,732 -
Special Education:Special Education in Jail Program 2.00 2.00 187,672 197,946 197,946 Sub-total 2.00 2.00 187,672 197,946 197,946 -
Virginia Technology Initiative: - Virginia Technology Initiative - - 1,378,418 - - Virginia State Technology Supplement - - - 78,000 - Sub-total - - 1,378,418 78,000 - -100.0%
Other Grants:Individual Alternative Education Program-ISAEP 1.00 1.00 58,109 - - National Board Certification - - - 55,000 55,000 Istation Pilot Program - - - - - Project Graduation Academic Year Academy - - 12,527 19,404 19,404 Project Graduation Summer - - 399 11,030 11,030 Teacher Mentor Programs - - 41,950 17,000 - Adjustments and Additional Grants - - - 100,000 100,000 Sub-total 1.00 1.00 112,985 202,434 185,434 -8.4%
Total Commonwealth of Virginia 43.00 43.00 4,617,863$ 3,649,660$ 3,554,660$ -2.6%
Corporate and Foundation Awards:BAE Systems FIRST Robotics Grant - - 6,911$ 5,000$ 5,000$ Changchun Foreign Language Grant - - 246 - - Fath Wesleyan Church - - - 10,000 10,000 Hampton Roads Community Foundation - - 7,748 - - JC Penney First Robotics Grant - - 106 - - Japanese Foundation Grant 1.33 1.33 69,072 80,355 80,355 Jordan Fundamental Program Grant - - 24,294 - - Lowe's Toolbox for Education Grant - - 4,784 - -
Sertoma Grant - - 450 - - State Farm Services Grant - - 5,000 - - Tidewater Post-Secondary College Fair - - 8,659 20,069 20,069 Adjustments and Additional Grants - - - 100,000 100,000
Total Corporate and Foundation Awards 1.33 1.33 127,269$ 215,424$ 215,424$ -
Summary of Grants and Special Programs "Continued"
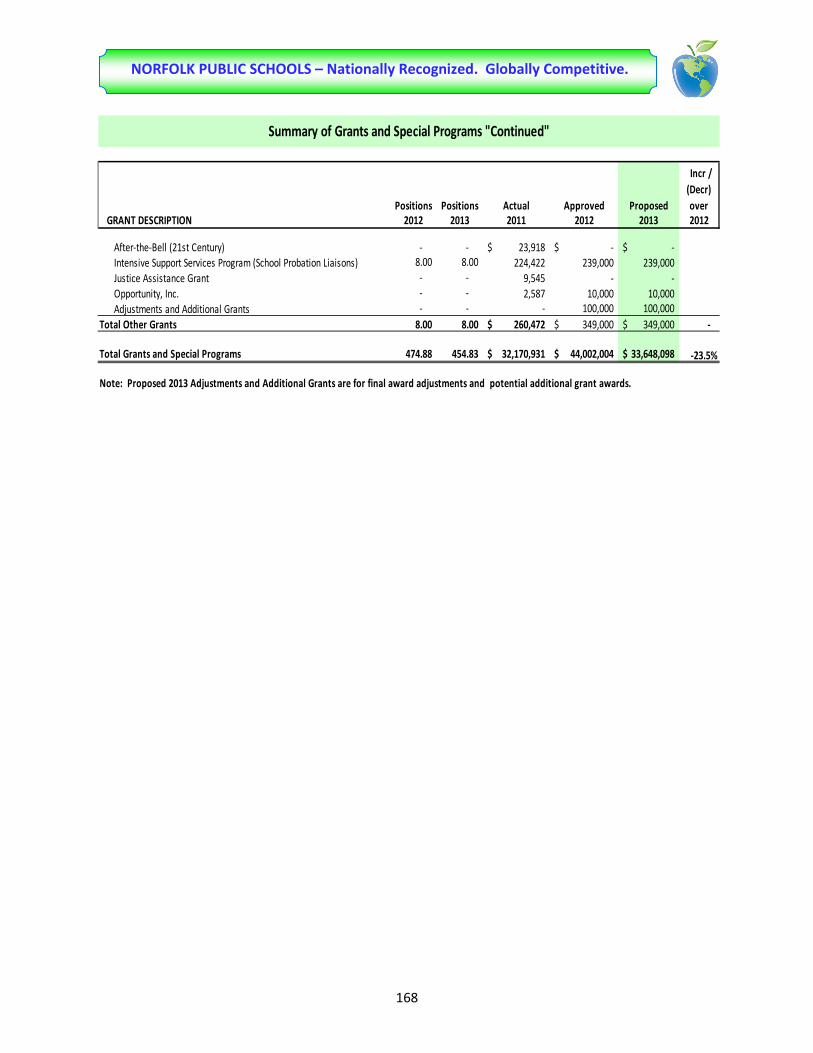
168
NORFOLK PUBLIC SCHOOLS – Nationally Recognized. Globally Competitive.
Positions Positions Actual Approved Proposed
Incr / (Decr) over
GRANT DESCRIPTION 2012 2013 2011 2012 2013 2012
After-the-Bell (21st Century) - - 23,918$ -$ -$ Intensive Support Services Program (School Probation Liaisons) 8.00 8.00 224,422 239,000 239,000 Justice Assistance Grant - - 9,545 - - Opportunity, Inc. - - 2,587 10,000 10,000 Adjustments and Additional Grants - - - 100,000 100,000
Total Other Grants 8.00 8.00 260,472$ 349,000$ 349,000$ -
Total Grants and Special Programs 474.88 454.83 32,170,931$ 44,002,004$ 33,648,098$ -23.5%
Note: Proposed 2013 Adjustments and Additional Grants are for final award adjustments and potential additional grant awards.
Summary of Grants and Special Programs "Continued"

169
NORFOLK PUBLIC SCHOOLS – Nationally Recognized. Globally Competitive.
Grant: Title I, Part A - Improving Basic Programs Fund: 3CH1
Budget Summary
Actual Approved Proposed2011 2012 2013
Position Summary (Full-Time Equivalent Positions) 172.80 175.00 175.00
Expenditure Type
Salaries 3,513,289$ 5,609,670$ 5,609,670$ Fringe Benefits 1,319,988 1,738,403 1,738,403 Contract Services 1,069,602 3,517,091 3,517,091 Travel & Staff Development 151,882 1,753,204 1,753,204 Other Costs (Utilities, Communications, Leases,etc) 36,640 118,489 118,489 Supplies 159,339 3,766,686 3,766,686 Equipment 5,967 - - Indirect Costs - 496,528 496,528 Total 6,256,707$ 17,000,071$ 17,000,071$
Grant Description: Title I, Part A – Improving Basic Programs – It is the largest source of federal assistance to localschool divisions and is authorized by the Improving America's School Act of 1994 . The No Child Left Behind (NCLB) Actof 2001 reauthorized the Elementary and Secondary Education Act of 1965 . Title I funds are allocated to schooldistricts according to the district's concentrations of children from low income families (free and reduced lunch count).Funds are used to supplement regular instructional activities and make available services designed to enrich andaccelerate the core curriculum in eligible schools in order to help all children move toward achieving high state
In Norfolk, Title I funding is currently allocated to 20 elementary schools having poverty levels below the districtaverage. All of the 20 schools have schoolwide programs which allow the use of Title I funds to benefit all students inthe school. The 20 elementary schools are: Richard Bowling, Campostella, Chesterfield, Coleman Place, Crossroads,Ingleside, Jacox, Lindenwood, Little Creek, Monroe, Norview, Oceanair, St. Helena, Tidewater Park, P.B. Young, OceanView, Suburban Park, Tanners Creek , Granby and Fairlawn. Each of these schools have students enrolled in pre-kindergarten through grade five. Title I funds also support preschool programs for three-year-olds, Grandy Village atChesterfield Academy, environmental science-based instructional enrichment programs at Camp Young, and summerschool opportunities. In addition, Title I funding is allocated to 3 targeted assistance schools, where a need foradditional assistance to a targeted group of students have been identified. The 3 targeted assistance schools areSherwood Forest, Willard Model, and Willoughby elementary.

170
NORFOLK PUBLIC SCHOOLS – Nationally Recognized. Globally Competitive.
Grant: Title I, Part A - Improving Basic Programs ARRA Funds Fund: 3CHS
Budget SummaryActuals
Oct 2009 thru Approved ProposedJune 30, 2011 2012 2013
Position Summary (Full-Time Equivalent Positions) 51.00 - -
Expenditure Type
Salaries 5,801,317$ -$ -$ Fringe Benefits 1,411,425 - - Contract Services 1,469,489 - - Travel & Staff Development 122,692 - - Supplies 263,376 - - Equipment 603,615 - - Indirect Costs 269,077 - - Total 9,940,991$ -$ -$
Grant Description: Title I, Part A funds made available under the ARRA provide educators the opportunity to implement innovative strategies to improve education for academically at-risk students and to close the achievement gap in Title Ischools. The additional resources for Title I, Part A will enable school divisions not only to serve more students but alsoto help boost the quality of the services provided. This is a two-year grant ending September 30, 2011.
The approved two-year grant was in the amount of $13,904,106. A tydings extention was approved thru December 29,2011. The grant is now closed.
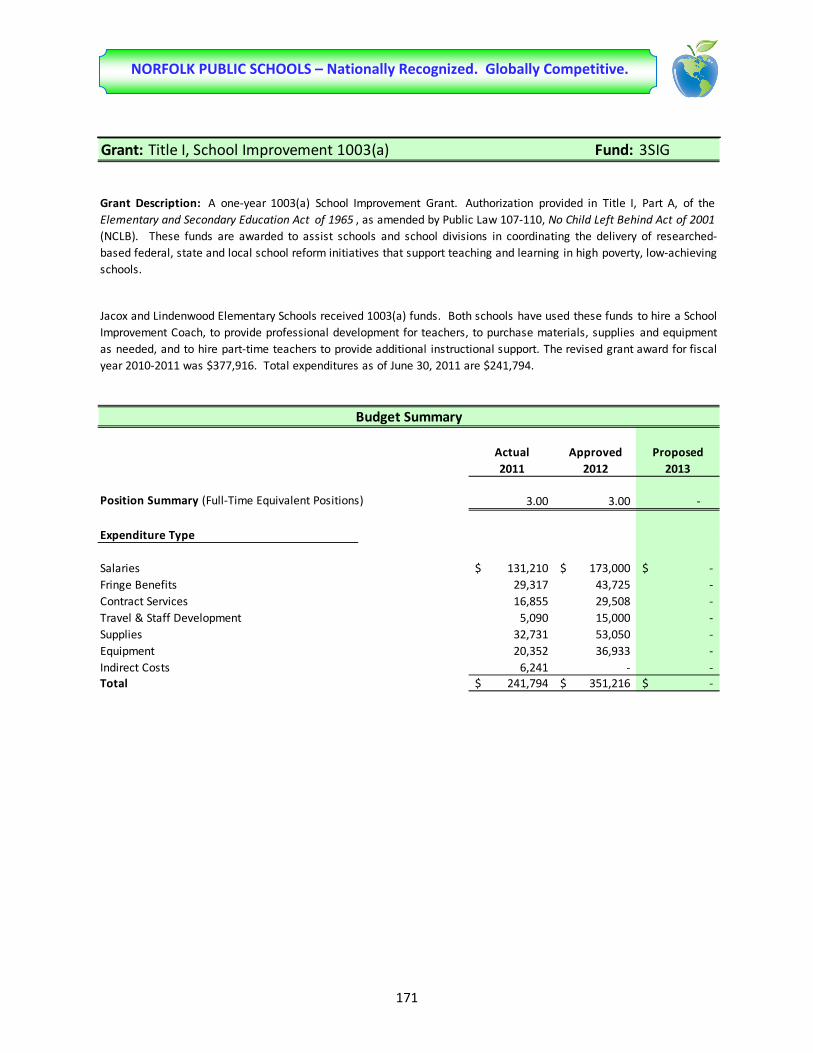
171
NORFOLK PUBLIC SCHOOLS – Nationally Recognized. Globally Competitive.
Grant: Title I, School Improvement 1003(a) Fund: 3SIG
Budget Summary
Actual Approved Proposed2011 2012 2013
Position Summary (Full-Time Equivalent Positions) 3.00 3.00 -
Expenditure Type
Salaries 131,210$ 173,000$ -$ Fringe Benefits 29,317 43,725 - Contract Services 16,855 29,508 - Travel & Staff Development 5,090 15,000 - Supplies 32,731 53,050 - Equipment 20,352 36,933 - Indirect Costs 6,241 - - Total 241,794$ 351,216$ -$
Grant Description: A one-year 1003(a) School Improvement Grant. Authorization provided in Title I, Part A, of theElementary and Secondary Education Act of 1965 , as amended by Public Law 107-110, No Child Left Behind Act of 2001(NCLB). These funds are awarded to assist schools and school divisions in coordinating the delivery of researched-based federal, state and local school reform initiatives that support teaching and learning in high poverty, low-achievingschools.
Jacox and Lindenwood Elementary Schools received 1003(a) funds. Both schools have used these funds to hire a SchoolImprovement Coach, to provide professional development for teachers, to purchase materials, supplies and equipmentas needed, and to hire part-time teachers to provide additional instructional support. The revised grant award for fiscalyear 2010-2011 was $377,916. Total expenditures as of June 30, 2011 are $241,794.

172
NORFOLK PUBLIC SCHOOLS – Nationally Recognized. Globally Competitive.
Grant: Title I, School Improvement ARRA 1003(g) Fund: 3SIF
Budget SummaryRevised AvailableBudget Budget
2012 2013
Position Summary (Full-Time Equivalent Positions) - 16.00 16.00
Expenditure Type
Salaries 742,026$ 3,103,402$ 2,361,376$ Fringe Benefits 197,508 874,310 676,802 Contract Services 253,177 1,894,068 1,640,891 Communications 583 3,000 2,417 Travel & Staff Development 118,426 593,973 475,547 Supplies 157,038 1,559,575 1,402,537 Equipment 113,948 366,131 252,183 Indirect Costs 41,721 246,539 204,818 Transfer to Schools (Mini Grants) - - - Total 1,624,428$ 8,640,998$ 7,016,570$
Grant Description: A three-year School Improvement 1003(g) ARRA Grant. Authorization provided in Title I, Part A, ofthe Elementary and Secondary Education Act of 1965 , as amended by Public Law 107-110, No Child Left Behind Act of2001 (NCLB). Three-year grant period from July 1, 2010 through September 30, 2013.
Norfolk received 1003(g) funds for Lake Taylor Middle School and Ruffner Academy. This grant funds the three-yearSchool Improvement Transformation Model selected from the four available United States Department of Education(USDOE). The Transformation Model is designed to develop and increase teacher and school leader effectivenessthrough a program of job-embedded professional development created and implemented in cooperation with a selectedLead Turnaround partner. Norfolk Public Schools has selected Johns Hopkins University's (JHU) Talent Developmentmodel as the basis for the Transformation programs for the identified schools. Ruffner Academy received an additionalaward of $362,430 to meet the 300 hours of service targeted goal. The reivised grant award is $8,640,998 and now inyear two.
Actuals October 2009
thru June 2011

173
NORFOLK PUBLIC SCHOOLS – Nationally Recognized. Globally Competitive.
Grant: Title I, Part D - Prevention and Intervention Program Fund: 3CH4
Budget Summary
Actual Approved Proposed2011 2012 2013
Position Summary (Full-Time Equivalent Positions) 2.00 2.00 2.00
Expenditure Type
Salaries 70,426$ 83,440$ 83,440$ Fringe Benefits 15,415 34,634 34,634 Contract Services 500 - - Travel & Staff Development 2,996 - - Supplies - - - Indirect Costs - 3,526 3,526
ARRA Funds 49,155 - - Total 138,492$ 121,600$ 121,600$
Grant Description: A federal formula grant that provides funding to support school districts' programs involvingcollaboration with locally operated correctional facilities. Monies allocated to the division are authorized by Title I, PartD of the Elementary and Secondary Education Act of 1965 (ESEA) , as amended by the No Child Left Behind Act of 2001 . No local match is required. Funds are spent at the Norfolk Detention Center. Federal Stimulus ARRA award periodended September 30, 2011.

174
NORFOLK PUBLIC SCHOOLS – Nationally Recognized. Globally Competitive.
Grant: Title II, Part A - Teacher and Principal Training Fund: 3TPT
Budget Summary
Actual Approved Proposed2011 2012 2013
Position Summary (Full-Time Equivalent Positions) 38.00 17.00 17.00
Expenditure Type
Salaries 654,850$ 1,059,955$ 1,059,955$ Fringe Benefits 214,399 370,984 370,984 Contract Services 18,386 438,197 438,197 Travel & Staff Development 21,746 273,434 273,434 Supplies - 59,700 59,700 Indirect Costs - 39,957 39,957 Total 909,381$ 2,242,227$ 2,242,227$
Grant Description: This federal program of the No Child Left Behind Act of 2001 is to increase student academicachievement by improving teacher and principal quality and by increasing the number of highly qualified teachers andadministrators. Title II, Part A incorporates the funding formerly allocated through the Class Size Reduction Grant andthe Dwight D. Eisenhower Professional Development Program.
In Norfolk, in addition to professional development, Title II funds are used to support instructional coaches in the corecontent areas at the middle and district level, and graduation coaches at the high school level who work with teachers,students, and parents to promote on-time graduation. The funds are also used to decrease class size in the primarygrades at three schools- Chesterield, St. Helena and Tidewater Park that have the highest concentration of children onfree and reduced lunch, by adding teachers in kindergarten through grade 3.

175
NORFOLK PUBLIC SCHOOLS – Nationally Recognized. Globally Competitive.
Grant: Even Start Program at Berkley/Compostella Center Fund: 3ESP
Budget Summary
Actual Approved Proposed2011 2012 2013
Position Summary (Full-Time Equivalent Positions) 4.50 4.50 -
Expenditure Type
Salaries 95,268$ 103,569$ -$ Fringe Benefits 33,275 46,159 - Contract Services 8,000 16,556 - Travel & Staff Development 12,703 22,269 - Supplies 26,458 49,316 - Equipment - 10,000 - Total 175,704$ 247,869$ -$
Grant Description: A federal funded program authorized by Title I, Part B of the Elementary and Secondary EducationAct of 1965 as amended by Public Law 103-382 to help break the cycle of poverty and illiteracy by improving theeducational opportunities of low income families. This competitive grant is awarded for a period of four years andrequires a local match. This program is located at the Berkley/Campostella Early Childhood Center and will endSeptember 30, 2012.
The Even Start Program at Berkley/Campostella provides adult education, parenting education and high quality earlychildhood education to participating families in an integrated family literacy program. Additionally, a full range ofservices that include health and social services, career training and job placement are extended to eligible families withchildren from birth to three years of age.

176
NORFOLK PUBLIC SCHOOLS – Nationally Recognized. Globally Competitive.
Grant: Even Start Program at Ingleside Center Fund: 3ESK
Budget Summary
Actual Approved Proposed2011 2012 2013
Position Summary (Full-Time Equivalent Positions) 4.45 4.45 -
Expenditure Type
Salaries 120,018$ 157,660$ -$ Fringe Benefits 27,006 51,306 - Contract Services 8,500 6,000 - Travel & Staff Development 4,333 9,500 - Supplies 17,996 15,403 - Equipment - 8,000 Total 177,853$ 247,869$ -$
Grant Description: The Even Start Program-Ingleside, formerly known as the Stuart Even Start Program, is the second oftwo Even Start grants awarded to Norfolk Public Schools under the William F. Goodling Even Start Family LiteracyProgram of Title I, Part B, Subpart 3, reauthorized by the Literacy Involves Families Together (LIFT) Act of 2000 and theNo Child Left Behind Act of 2001 . The 2009-2010 school year marks the eighth year of this Even Start. The required localmatch is currently 50%.
Like the program at Berkley/Campostella Early Childhood Center, this program supports the philosophy that theeducational attainment of children and their parents is interrelated and that improving the parents' literacy skills resultsin a positive effect on the educational experiences of their children. The program seeks to improve the educationalopportunities of children and adults by integrating four components of family literacy into a unified program. To do this,the Ingleside Even Start Program builds on existing high quality community services to provide a cohesive programwhich includes adult basic education, parenting education, early childhood education and interactive parent and childliteracy activities. This competitive grant will end September 30, 2012.
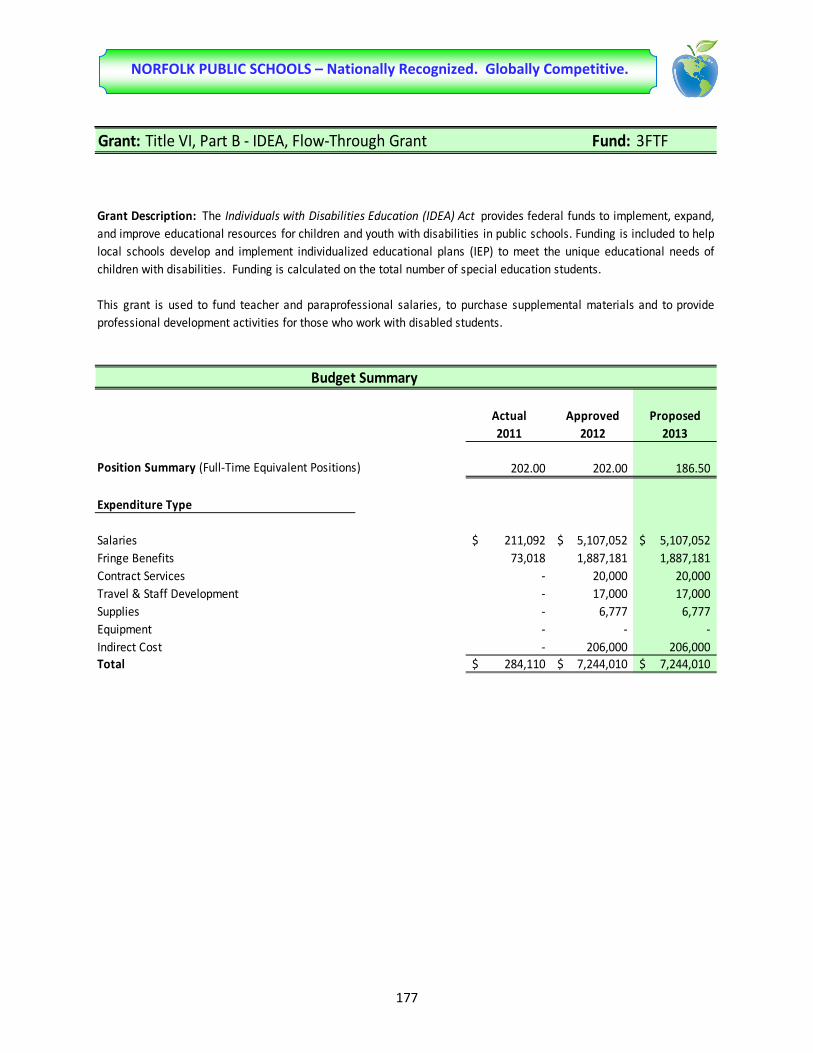
177
NORFOLK PUBLIC SCHOOLS – Nationally Recognized. Globally Competitive.
Grant: Title VI, Part B - IDEA, Flow-Through Grant Fund: 3FTF
Budget Summary
Actual Approved Proposed2011 2012 2013
Position Summary (Full-Time Equivalent Positions) 202.00 202.00 186.50
Expenditure Type
Salaries 211,092$ 5,107,052$ 5,107,052$ Fringe Benefits 73,018 1,887,181 1,887,181 Contract Services - 20,000 20,000 Travel & Staff Development - 17,000 17,000 Supplies - 6,777 6,777 Equipment - - - Indirect Cost - 206,000 206,000 Total 284,110$ 7,244,010$ 7,244,010$
Grant Description: The Individuals with Disabilities Education (IDEA) Act provides federal funds to implement, expand,and improve educational resources for children and youth with disabilities in public schools. Funding is included to helplocal schools develop and implement individualized educational plans (IEP) to meet the unique educational needs ofchildren with disabilities. Funding is calculated on the total number of special education students.
This grant is used to fund teacher and paraprofessional salaries, to purchase supplemental materials and to provideprofessional development activities for those who work with disabled students.
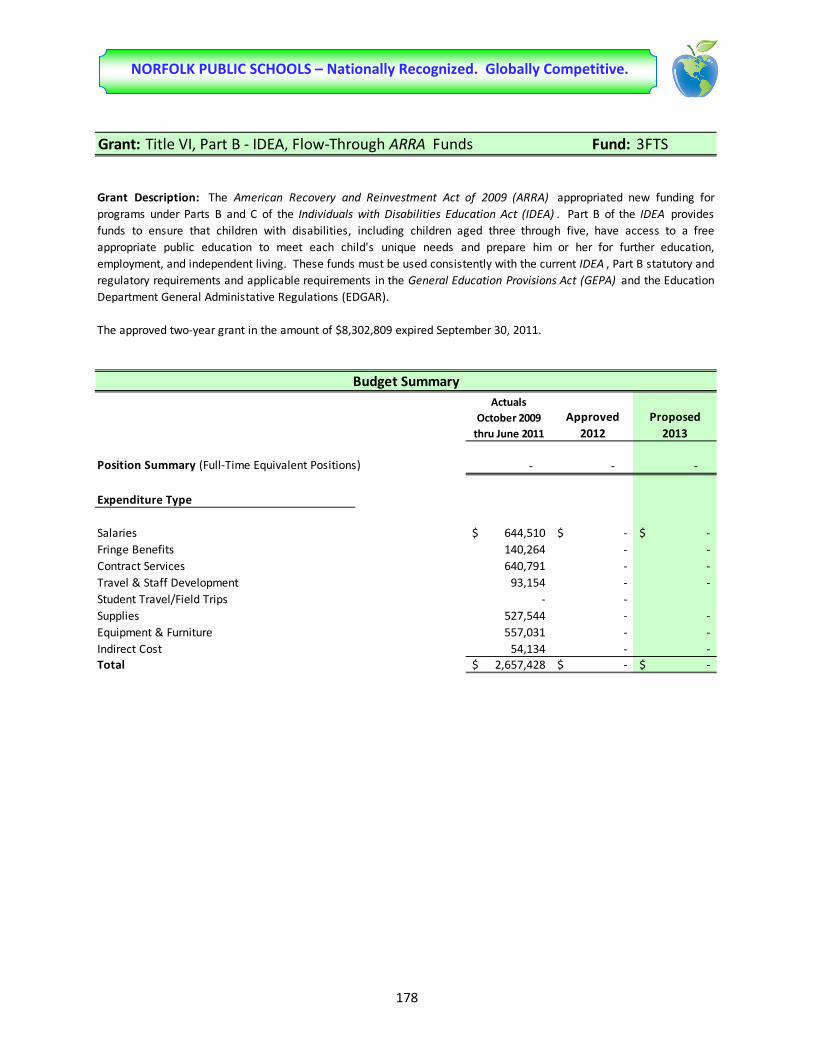
178
NORFOLK PUBLIC SCHOOLS – Nationally Recognized. Globally Competitive.
Grant: Title VI, Part B - IDEA, Flow-Through ARRA Funds Fund: 3FTS
Budget Summary
Approved Proposed2012 2013
Position Summary (Full-Time Equivalent Positions) - - -
Expenditure Type
Salaries 644,510$ -$ -$ Fringe Benefits 140,264 - - Contract Services 640,791 - - Travel & Staff Development 93,154 - - Student Travel/Field Trips - - Supplies 527,544 - - Equipment & Furniture 557,031 - - Indirect Cost 54,134 - - Total 2,657,428$ -$ -$
Grant Description: The American Recovery and Reinvestment Act of 2009 (ARRA) appropriated new funding forprograms under Parts B and C of the Individuals with Disabilities Education Act (IDEA) . Part B of the IDEA providesfunds to ensure that children with disabilities, including children aged three through five, have access to a freeappropriate public education to meet each child's unique needs and prepare him or her for further education,employment, and independent living. These funds must be used consistently with the current IDEA , Part B statutory and regulatory requirements and applicable requirements in the General Education Provisions Act (GEPA) and the EducationDepartment General Administative Regulations (EDGAR).
The approved two-year grant in the amount of $8,302,809 expired September 30, 2011.
Actuals October 2009
thru June 2011

179
NORFOLK PUBLIC SCHOOLS – Nationally Recognized. Globally Competitive.
Grant: IDEA, Section 619 Pre-School Incentive Fund: 3619
Budget Summary
Actual Approved Proposed2011 2012 2013
Position Summary (Full-Time Equivalent Positions) 4.00 4.00 4.00
Expenditure Type
Salaries 110,523$ 179,531$ 179,531$ Fringe Benefits 35,036 53,552 53,552 Contract Services - - - Travel & Staff Development - - - Supplies - 9,773 9,773 Equipment - - - Indirect Cost - 7,268 7,268 Total 145,559$ 250,124$ 250,124$
Grant Description: Section 619 of the Individuals with Disabilities Education (IDEA) Act provides federal funds to helplocal school divisions develop and implement individualized educational plans (IEP) to meet the unique educationalneeds of preschool children with disabilities, ages 2 through 5.
In Norfolk, these funds support the district's special education program. The grant is used to fund teacher andparaprofessional salaries, to purchase supplemental materials and equipment and to provide professional developmentactivities for those who come into contact with disabled students and to assist with the transition of preschool childreninto school-age programs.

180
NORFOLK PUBLIC SCHOOLS – Nationally Recognized. Globally Competitive.
Grant: IDEA, Section 619 Pre-School ARRA Funds Fund: 36PS
Budget Summary
Actual Approved Proposed2011 2012 2013
Position Summary (Full-Time Equivalent Positions) - - -
Expenditure Type
Salaries 52,818$ -$ -$ Fringe Benefits 3,889 - - Contract Services - - - Travel & Staff Development 28,749 - - Supplies 29,401 - - Equipment/Furniture 5,607 - - Indirect Cost 6,642 - - Total 127,106$ -$ -$
Grant Description: The American Recovery and Reinvestment Act of 2009 (ARRA) appropriated new funding forprograms under Parts B and C of the Individuals with Disabilities Education Act (IDEA) . Part B of the IDEA providesfunds to ensure that children with disabilities, including children aged three through five, have access to a freeappropriate public education to meet each child's unique needs and prepare him or her for further education.
The approved two-year grant in the amount of $279,598, expired September 30, 2011.

181
NORFOLK PUBLIC SCHOOLS – Nationally Recognized. Globally Competitive.
Grant: Adult Literacy and Basic Education Fund: 3ABE
Budget Summary
Actual Approved Proposed2011 2012 2013
Position Summary (Full-Time Equivalent Positions) - - -
Expenditure Type
Salaries 215,038$ 242,790$ 242,790$ Fringe Benefits 16,354 18,573 18,573 Contract Services - 3,500 3,500 Lease/Rentals - 631 631 Travel & Staff Development 625 3,411 3,411 Supplies 44,234 46,741 46,741 Equipment 5,488 5,500 5,500 Indirect Cost 8,136 12,843 12,843 Total 289,875$ 333,989$ 333,989$
Classes are free to all participants and are conducted in the following schools: Chesterfield Academy and NorfolkEvening School at Granby High. Adult basic education classes are also held at the following community locations: BayView Center, Berkley Neighborhood Center, Coleman Place Presbyterian Church, East Ocean View Community Center,Hospitality Center, Huntersville Multiservice Center, Merrimack Center, Mt. Lebanon Baptist Church, NorviewCommunity Center, Oakmont Community Development Cooperation Center, Oakmont Family Investment Center,Opportunity Inc. One Stop Center, Park Place Multiservice Center, Virginia Employment Commission and NorfolkWorkforce Development Center.
Grant Description: This federal grant provides educational opportunities to adults, 18 years of age and older, without a12th grade level of education. It also provides in-depth instruction in math, reading, and writing for passing the GEDtest.
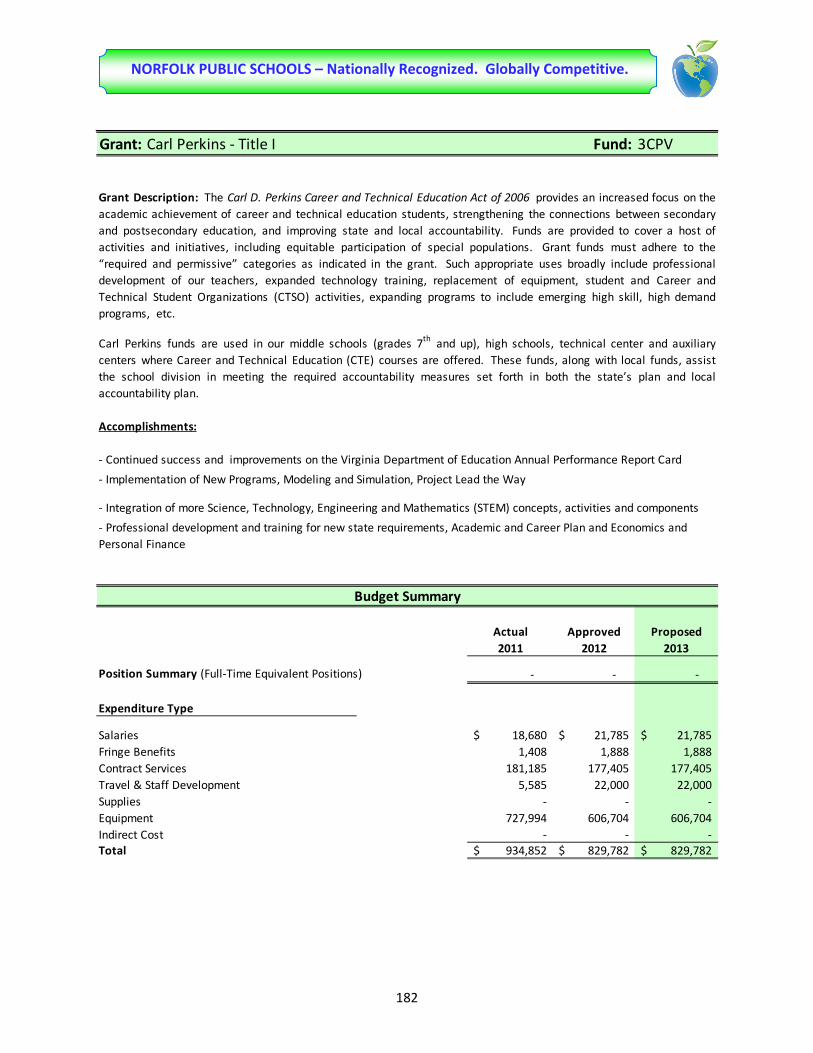
182
NORFOLK PUBLIC SCHOOLS – Nationally Recognized. Globally Competitive.
Grant: Carl Perkins - Title I Fund: 3CPV
Accomplishments:
- Implementation of New Programs, Modeling and Simulation, Project Lead the Way
Budget Summary
Actual Approved Proposed2011 2012 2013
Position Summary (Full-Time Equivalent Positions) - - -
Expenditure Type
Salaries 18,680$ 21,785$ 21,785$ Fringe Benefits 1,408 1,888 1,888 Contract Services 181,185 177,405 177,405 Travel & Staff Development 5,585 22,000 22,000 Supplies - - - Equipment 727,994 606,704 606,704 Indirect Cost - - - Total 934,852$ 829,782$ 829,782$
Grant Description: The Carl D. Perkins Career and Technical Education Act of 2006 provides an increased focus on theacademic achievement of career and technical education students, strengthening the connections between secondaryand postsecondary education, and improving state and local accountability. Funds are provided to cover a host ofactivities and initiatives, including equitable participation of special populations. Grant funds must adhere to the“required and permissive” categories as indicated in the grant. Such appropriate uses broadly include professionaldevelopment of our teachers, expanded technology training, replacement of equipment, student and Career andTechnical Student Organizations (CTSO) activities, expanding programs to include emerging high skill, high demandprograms, etc.
Carl Perkins funds are used in our middle schools (grades 7th and up), high schools, technical center and auxiliarycenters where Career and Technical Education (CTE) courses are offered. These funds, along with local funds, assistthe school division in meeting the required accountability measures set forth in both the state’s plan and localaccountability plan.
- Continued success and improvements on the Virginia Department of Education Annual Performance Report Card
- Integration of more Science, Technology, Engineering and Mathematics (STEM) concepts, activities and components
- Professional development and training for new state requirements, Academic and Career Plan and Economics and Personal Finance

183
NORFOLK PUBLIC SCHOOLS – Nationally Recognized. Globally Competitive.
Grant: Safe and Drug-Free Schools and Communities Act Grant - Fund: 3DFSTitle IV, Part A
Budget Summary
Actual Approved Proposed2011 2012 2013
Position Summary (Full-Time Equivalent Positions) - - -
Expenditure Type
Salaries -$ -$ -$ Fringe Benefits - - - Contract Services 47,572 - - Travel & Staff Development - - - Supplies - - - Equipment - - - Indirect Cost 781 - - Total 48,353$ -$ -$
Grant Description: In accordance with the No Child Left Behind Act of 2001 (NCLB) , this federal grant is awarded bythe U.S. Department of Education, administered by state education agencies, and made available to local schooldistricts. Grant funds support programs that prevent violence in and around schools, that prevent the illegal use ofalcohol, tobacco, and drugs, that involve parents and communities; and support community efforts and resources tofoster a safe and drug-free learning environment that supports student academic achievement, through the provision offederal assistance. The NCLB Act will allow LEAs to transfer up to 50% of the funding to Title I or any of the programs.The grant expired September 30, 2011.

184
NORFOLK PUBLIC SCHOOLS – Nationally Recognized. Globally Competitive.
Grant: Early Reading First Fund: 3ERF
Budget SummaryAvailable
Approved Actuals thru Budget thru2010 June 30, 2011 Sept. 30, 2012
Position Summary (Full-Time Equivalent Positions) 8.10 8.10 -
Expenditure Type
Salaries 1,550,571$ 596,163$ 954,408$ Fringe Benefits 400,211 152,086 248,125 Contract Services 1,343,277 430,535 912,742 Travel & Staff Development 262,924 93,305 169,619 Other Costs (Communications, Leases, Etc.) 64,478 4,500 59,978 Supplies 517,473 337,558 179,915 Equipment 187,989 23,330 164,659 Indirect Cost 173,077 48,088 124,989 Total 4,500,000$ 1,685,565$ 2,814,435$
The approved three-year grant is in the amount of $4,500,000. There is an available balance of $2,814,435 to be spentthrough September 30, 2012. The grant will end September 30, 2012.
Grant Description: This U.S. Department of Education competitive grant is to help build early childhood educationcenters of excellence that can serve as examples of effective early learning practices throughout the Nation. This grantwas funded under Project PURPLE (Preschoolers Up on Readiness, Pre-Reading and Literacy Enrichment) of the No Child Left Behind Act of 2001 as single three-year grants.
Norfolk Public Schools (NPS) proposes a community collaborative plan to address the early literacy needs and prevailingreadiness gap facing at-risk students - children of low-income, homeless, disadvantaged, and highly mobile militaryfamilies of the city. The program will serve 270 children - 162 from NPS, 90 children from the Head Start of Southeastern Tidewater Opportunity Project and 18 from Children's Harbor, a non-profit early childhood center - and prepare themwith the predictive skills necessary as they begin to develop the habits of powerful literacy. Monroe Elementary willhave six pre-k classes and Sewells Point Elementary will have three pre-k classes.

185
NORFOLK PUBLIC SCHOOLS – Nationally Recognized. Globally Competitive.
Grant: Enhancing Education Through Technology, Title II, Part D Fund: 3ED2
Budget Summary
Actual Approved Proposed
2011 2012 2013
Position Summary (Full-Time Equivalent Positions) - - -
Expenditure Type
Salaries -$ -$ -$
Fringe Benefits - - -
Contract Services 320,042 - -
Travel & Staff Development - - -
Supplies - - -
Equipment - - -
Indirect Cost 10,929 - -
Total 330,971$ -$ -$
Grant Description: Title II, Part D, Enhancing Education Through Technology - Regional subgrant is authorized underthe No Child Left Behind Act of 2001 (NCLB) . The funds available through this grant will be a major support forincreasing the effective utilization of educational technology for teaching and learning. These funds will enableconsortium members to better provide outstanding professional development and support to teachers andadministrators. The funds will assist consortium members to effectively integrate technology-based instructionalstrategies into the classroom. The grant includes regional and district funds. The enhancing Education throughTechnology Competitive Grant award is 734,633. of which $330, 971 was spent thru June 30, 2011. The grant closedSeptember 30, 2011.
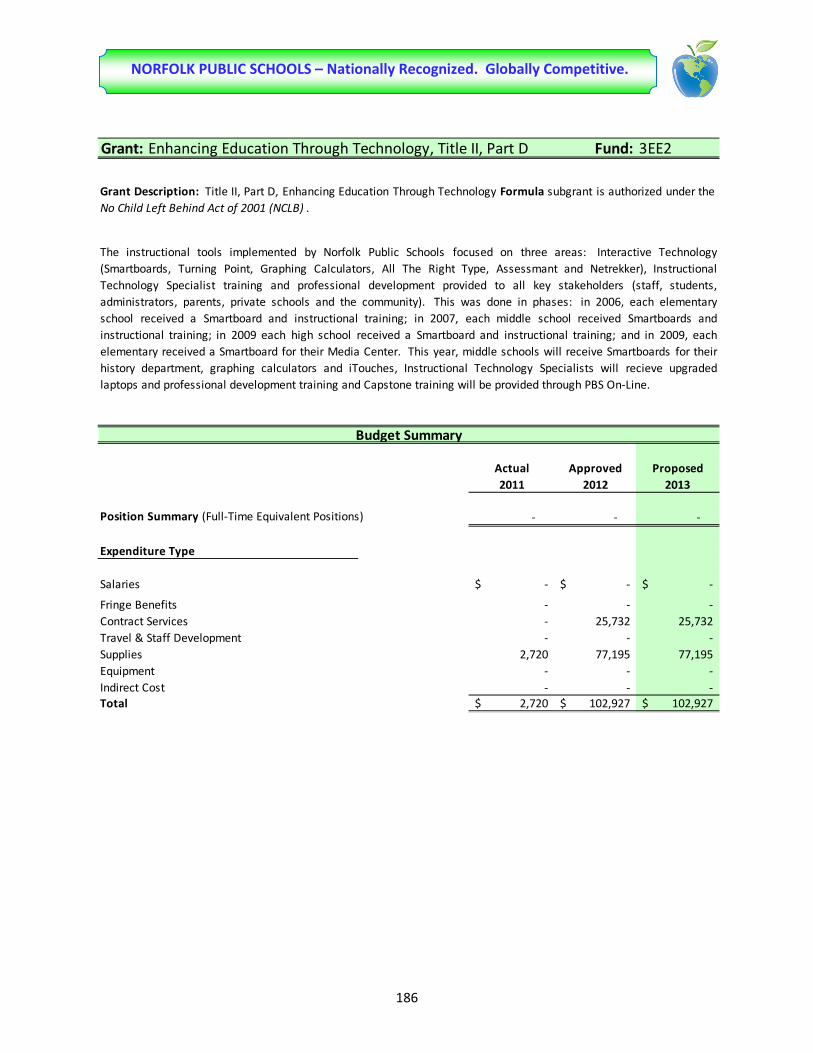
186
NORFOLK PUBLIC SCHOOLS – Nationally Recognized. Globally Competitive.
Grant: Enhancing Education Through Technology, Title II, Part D Fund: 3EE2
Budget Summary
Actual Approved Proposed2011 2012 2013
Position Summary (Full-Time Equivalent Positions) - - -
Expenditure Type
Salaries -$ -$ -$
Fringe Benefits - - - Contract Services - 25,732 25,732 Travel & Staff Development - - - Supplies 2,720 77,195 77,195 Equipment - - - Indirect Cost - - - Total 2,720$ 102,927$ 102,927$
The instructional tools implemented by Norfolk Public Schools focused on three areas: Interactive Technology(Smartboards, Turning Point, Graphing Calculators, All The Right Type, Assessmant and Netrekker), InstructionalTechnology Specialist training and professional development provided to all key stakeholders (staff, students,administrators, parents, private schools and the community). This was done in phases: in 2006, each elementaryschool received a Smartboard and instructional training; in 2007, each middle school received Smartboards andinstructional training; in 2009 each high school received a Smartboard and instructional training; and in 2009, eachelementary received a Smartboard for their Media Center. This year, middle schools will receive Smartboards for theirhistory department, graphing calculators and iTouches, Instructional Technology Specialists will recieve upgradedlaptops and professional development training and Capstone training will be provided through PBS On-Line.
Grant Description: Title II, Part D, Enhancing Education Through Technology Formula subgrant is authorized under theNo Child Left Behind Act of 2001 (NCLB) .

187
NORFOLK PUBLIC SCHOOLS – Nationally Recognized. Globally Competitive.
Grant: Enhancing Education Through Technology ARRA Funds Fund: 3ETS
Budget Summary
Actual Approved Proposed2011 2012 2013
Position Summary (Full-Time Equivalent Positions) - - -
Expenditure Type
Salaries -$ -$ -$
Fringe Benefits - - - Contract Services 79,684 - - Travel & Staff Development - - - Supplies 242,205 - - Equipment - - - Indirect Cost - - - Total 321,889$ -$ -$
Grant Description: Funding were made available under ARRA for Educational Technology State Grants. To receive thisfunding, the locality had to undergo a competitive grant process.
These funds will be used to support the efforts of providing middle shools with Smartboards for their history department, graphing calculators and iTouches.
The approved two-year grant in the amount of $325,857, expired September 30, 2011.
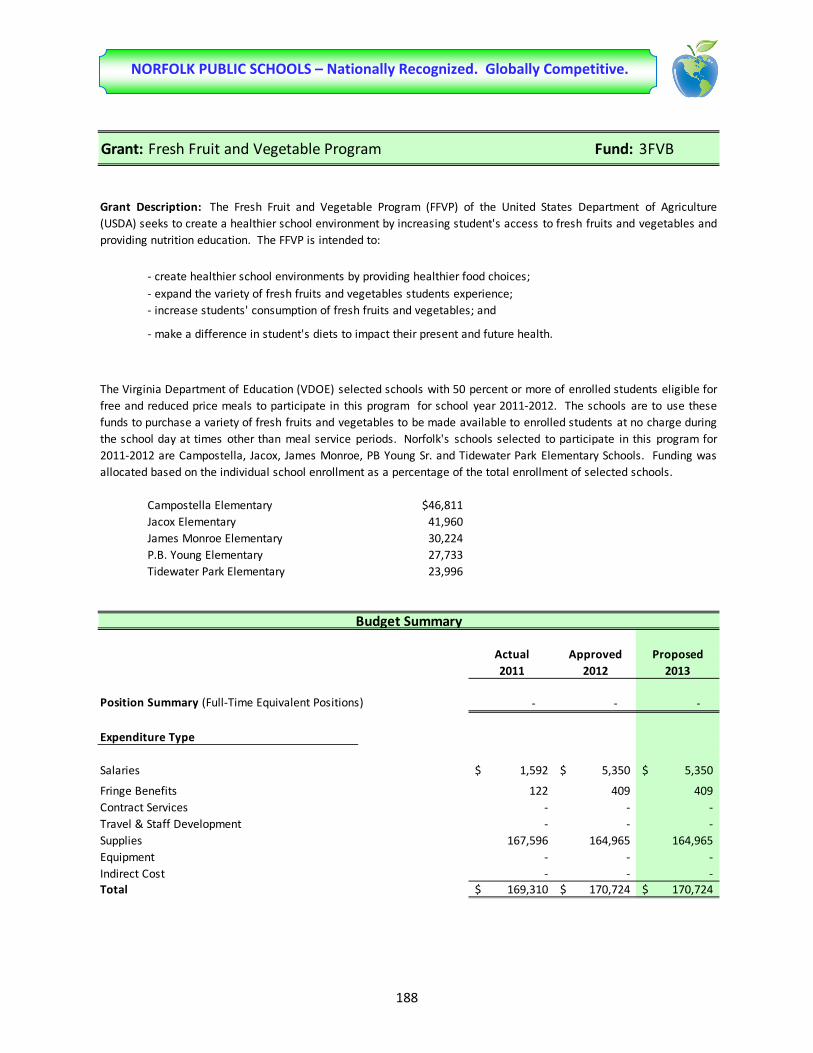
188
NORFOLK PUBLIC SCHOOLS – Nationally Recognized. Globally Competitive.
Grant: Fresh Fruit and Vegetable Program Fund: 3FVB
- create healthier school environments by providing healthier food choices;- expand the variety of fresh fruits and vegetables students experience;- increase students' consumption of fresh fruits and vegetables; and
- make a difference in student's diets to impact their present and future health.
Campostella Elementary $46,811Jacox Elementary 41,960 James Monroe Elementary 30,224 P.B. Young Elementary 27,733 Tidewater Park Elementary 23,996
Budget Summary
Actual Approved Proposed2011 2012 2013
Position Summary (Full-Time Equivalent Positions) - - -
Expenditure Type
Salaries 1,592$ 5,350$ 5,350$
Fringe Benefits 122 409 409 Contract Services - - - Travel & Staff Development - - - Supplies 167,596 164,965 164,965 Equipment - - - Indirect Cost - - - Total 169,310$ 170,724$ 170,724$
Grant Description: The Fresh Fruit and Vegetable Program (FFVP) of the United States Department of Agriculture(USDA) seeks to create a healthier school environment by increasing student's access to fresh fruits and vegetables andproviding nutrition education. The FFVP is intended to:
The Virginia Department of Education (VDOE) selected schools with 50 percent or more of enrolled students eligible forfree and reduced price meals to participate in this program for school year 2011-2012. The schools are to use thesefunds to purchase a variety of fresh fruits and vegetables to be made available to enrolled students at no charge duringthe school day at times other than meal service periods. Norfolk's schools selected to participate in this program for2011-2012 are Campostella, Jacox, James Monroe, PB Young Sr. and Tidewater Park Elementary Schools. Funding wasallocated based on the individual school enrollment as a percentage of the total enrollment of selected schools.
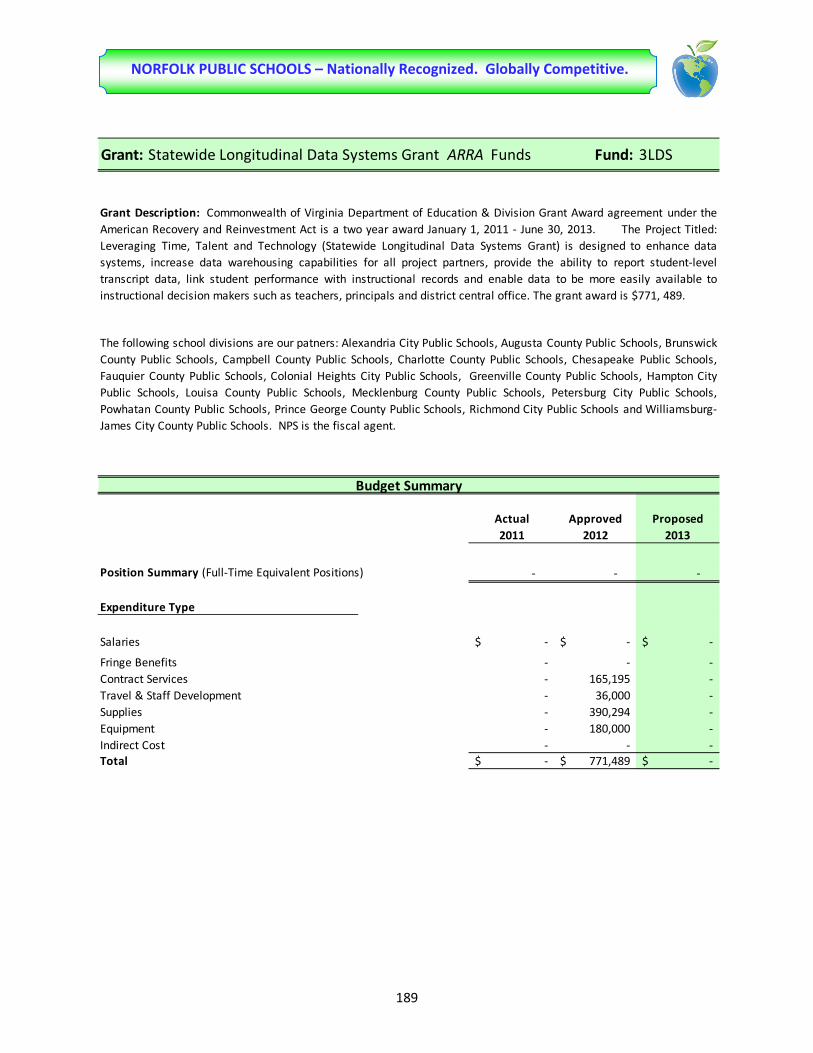
189
NORFOLK PUBLIC SCHOOLS – Nationally Recognized. Globally Competitive.
Grant: Statewide Longitudinal Data Systems Grant ARRA Funds Fund: 3LDS
Budget Summary
Actual Approved Proposed2011 2012 2013
Position Summary (Full-Time Equivalent Positions) - - -
Expenditure Type
Salaries -$ -$ -$
Fringe Benefits - - - Contract Services - 165,195 - Travel & Staff Development - 36,000 - Supplies - 390,294 - Equipment - 180,000 - Indirect Cost - - - Total -$ 771,489$ -$
Grant Description: Commonwealth of Virginia Department of Education & Division Grant Award agreement under theAmerican Recovery and Reinvestment Act is a two year award January 1, 2011 - June 30, 2013. The Project Titled:Leveraging Time, Talent and Technology (Statewide Longitudinal Data Systems Grant) is designed to enhance datasystems, increase data warehousing capabilities for all project partners, provide the ability to report student-leveltranscript data, link student performance with instructional records and enable data to be more easily available toinstructional decision makers such as teachers, principals and district central office. The grant award is $771, 489.
The following school divisions are our patners: Alexandria City Public Schools, Augusta County Public Schools, BrunswickCounty Public Schools, Campbell County Public Schools, Charlotte County Public Schools, Chesapeake Public Schools,Fauquier County Public Schools, Colonial Heights City Public Schools, Greenville County Public Schools, Hampton CityPublic Schools, Louisa County Public Schools, Mecklenburg County Public Schools, Petersburg City Public Schools,Powhatan County Public Schools, Prince George County Public Schools, Richmond City Public Schools and Williamsburg-James City County Public Schools. NPS is the fiscal agent.

190
NORFOLK PUBLIC SCHOOLS – Nationally Recognized. Globally Competitive.
Grant: Striving Readers Intervention Initiative Fund: 3SRI
Budget Summary
Actual Approved Proposed2011 2012 2013
Position Summary (Full-Time Equivalent Positions) - - -
Expenditure Type
Salaries 143,277$ -$ -$
Fringe Benefits 46,212 - - Contract Services 3,950 - - Travel & Staff Development 5,309 - - Supplies 58,884 - - Equipment 71,241 - - Indirect Cost - - - Total 328,873$ -$ -$
Grant Description: The Virginia Striving Readers Intervention Initiative, a federally funded supplemental readingprogram, supports initiatives to raise literacy levels in schools with high percentages of economically disadvantagedstudents while building a scientific research base for efforts to increase adolescent literacy.
In Norfolk, students who were identified as struggling readers in grades seven and eight at Azalea, Blair and NorviewMiddle Schools are enrolled with parental consent in an additional reading class. Interventionists at the three schoolsguide students through the Voyager Reading Program, "Passport Reading Journeys". The data is analyzed to trackstudent progress and district trends. The original award was $381,393. The grant closed December 16, 2011.
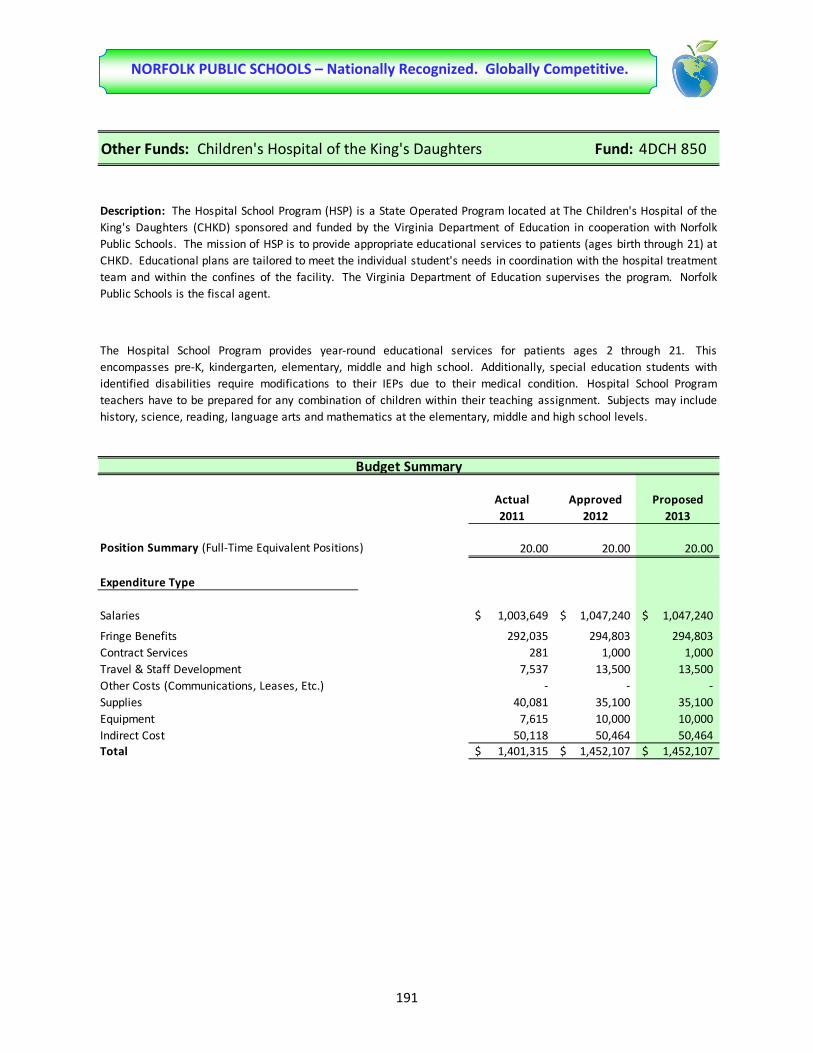
191
NORFOLK PUBLIC SCHOOLS – Nationally Recognized. Globally Competitive.
Other Funds: Children's Hospital of the King's Daughters Fund: 4DCH 850
Budget Summary
Actual Approved Proposed2011 2012 2013
Position Summary (Full-Time Equivalent Positions) 20.00 20.00 20.00
Expenditure Type
Salaries 1,003,649$ 1,047,240$ 1,047,240$
Fringe Benefits 292,035 294,803 294,803 Contract Services 281 1,000 1,000 Travel & Staff Development 7,537 13,500 13,500 Other Costs (Communications, Leases, Etc.) - - - Supplies 40,081 35,100 35,100 Equipment 7,615 10,000 10,000 Indirect Cost 50,118 50,464 50,464 Total 1,401,315$ 1,452,107$ 1,452,107$
Description: The Hospital School Program (HSP) is a State Operated Program located at The Children's Hospital of theKing's Daughters (CHKD) sponsored and funded by the Virginia Department of Education in cooperation with NorfolkPublic Schools. The mission of HSP is to provide appropriate educational services to patients (ages birth through 21) atCHKD. Educational plans are tailored to meet the individual student's needs in coordination with the hospital treatmentteam and within the confines of the facility. The Virginia Department of Education supervises the program. NorfolkPublic Schools is the fiscal agent.
The Hospital School Program provides year-round educational services for patients ages 2 through 21. Thisencompasses pre-K, kindergarten, elementary, middle and high school. Additionally, special education students withidentified disabilities require modifications to their IEPs due to their medical condition. Hospital School Programteachers have to be prepared for any combination of children within their teaching assignment. Subjects may includehistory, science, reading, language arts and mathematics at the elementary, middle and high school levels.
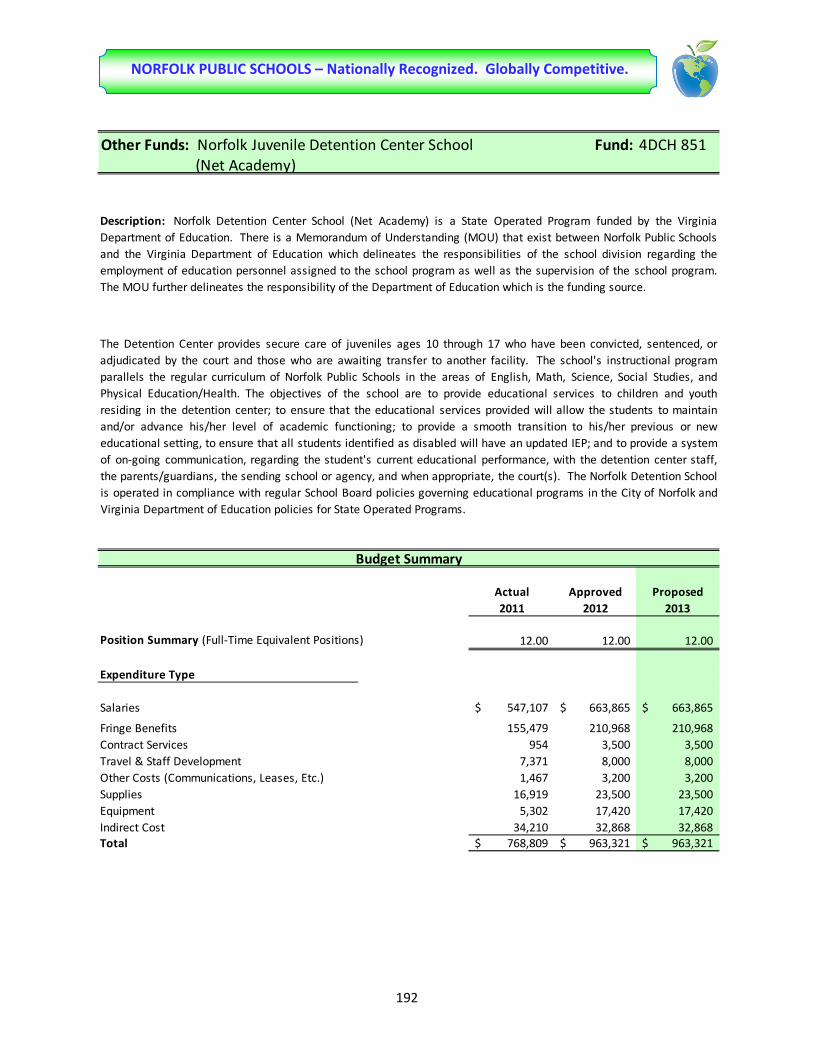
192
NORFOLK PUBLIC SCHOOLS – Nationally Recognized. Globally Competitive.
Other Funds: Norfolk Juvenile Detention Center School Fund: 4DCH 851 (Net Academy)
Budget Summary
Actual Approved Proposed2011 2012 2013
Position Summary (Full-Time Equivalent Positions) 12.00 12.00 12.00
Expenditure Type
Salaries 547,107$ 663,865$ 663,865$
Fringe Benefits 155,479 210,968 210,968 Contract Services 954 3,500 3,500 Travel & Staff Development 7,371 8,000 8,000 Other Costs (Communications, Leases, Etc.) 1,467 3,200 3,200 Supplies 16,919 23,500 23,500 Equipment 5,302 17,420 17,420 Indirect Cost 34,210 32,868 32,868 Total 768,809$ 963,321$ 963,321$
Description: Norfolk Detention Center School (Net Academy) is a State Operated Program funded by the VirginiaDepartment of Education. There is a Memorandum of Understanding (MOU) that exist between Norfolk Public Schoolsand the Virginia Department of Education which delineates the responsibilities of the school division regarding theemployment of education personnel assigned to the school program as well as the supervision of the school program.The MOU further delineates the responsibility of the Department of Education which is the funding source.
The Detention Center provides secure care of juveniles ages 10 through 17 who have been convicted, sentenced, oradjudicated by the court and those who are awaiting transfer to another facility. The school's instructional programparallels the regular curriculum of Norfolk Public Schools in the areas of English, Math, Science, Social Studies, andPhysical Education/Health. The objectives of the school are to provide educational services to children and youthresiding in the detention center; to ensure that the educational services provided will allow the students to maintainand/or advance his/her level of academic functioning; to provide a smooth transition to his/her previous or neweducational setting, to ensure that all students identified as disabled will have an updated IEP; and to provide a systemof on-going communication, regarding the student's current educational performance, with the detention center staff,the parents/guardians, the sending school or agency, and when appropriate, the court(s). The Norfolk Detention Schoolis operated in compliance with regular School Board policies governing educational programs in the City of Norfolk andVirginia Department of Education policies for State Operated Programs.

193
NORFOLK PUBLIC SCHOOLS – Nationally Recognized. Globally Competitive.
Other Funds: Tidewater Child Development Center Fund: 4DCH 852
Budget Summary
Actual Approved Proposed2011 2012 2013
Position Summary (Full-Time Equivalent Positions) 11.00 8.00 8.00
Expenditure Type
Salaries 512,343$ 468,079$ 468,079$
Fringe Benefits 118,937 126,629 126,629 Contract Services - 1,000 1,000 Travel & Staff Development 2,524 5,000 5,000 Supplies 13,743 11,000 11,000 Equipment 1,544 3,000 3,000 Indirect Cost 25,617 23,596 23,596 Total 674,708$ 638,304$ 638,304$
Description: The Tidewater Child Development Clinic Educational Consultants is a State Operated Program sponsoredand funded by the Virginia Department of Education in cooporation with Norfolk Public Schools. This program offers acontinuum of educational services that cover inpatient status, transition to home or school, maintenance and follow upcare through outpatient clinics. It provides educational consultants for Tidewater Development Services and OutpatientClinics of The Children's Hospital of the King's Daughters (CHKD). Educational Consultants are an extension of theHospital School Program located at CHKD. Educational consultants provide appropriate educational services to studentsunder medical care in the assigned clinics. Norfolk Public Schools is the fiscal agent for the program.
Educational Consultants are experienced teachers with specialized training in educational assessment and knowledgeof educational implications of medically disabling conditions. They facilitate educational services for children seen inthe clinic. The consultants are employees of Norfolk Public Schools and are supervised by the CHKD Hospital EducationProgram Director.

194
NORFOLK PUBLIC SCHOOLS – Nationally Recognized. Globally Competitive.
Grant: Special Education in Jail Program Fund: 4JAI
Budget Summary
Actual Approved Proposed
2011 2012 2013
Position Summary (Full-Time Equivalent Positions) 2.00 2.00 2.00
Expenditure Type
Salaries 150,950$ 151,838$ 151,838$
Fringe Benefits 35,725 42,108 42,108 Contract Services - - - Travel & Staff Development 215 3,200 3,200 Supplies 783 800 800 Equipment - - - Indirect Cost - - - Total 187,672$ 197,946$ 197,946$
Grant Description: This state funded program operates in conjunction with the General Education Diploma (GED)program which is housed in the Norfolk City Jail. It is designed to offer academic assistance and remediation as well astransitional planning to individuals within the correctional facility.
195
NORFOLK PUBLIC SCHOOLS – Nationally Recognized. Globally Competitive.
Grant: Virginia Technology Initiative Fund: 4STG
Budget Summary
Actual Approved Proposed2011 2012 2013
Position Summary (Full-Time Equivalent Positions) - - -
Expenditure Type
Salaries -$ -$ -$
Fringe Benefits - - - Contract Services - - - Travel & Staff Development - - - Supplies - - - Equipment 1,378,418 1,298,000 - Indirect Cost - - - Total 1,378,418$ 1,298,000$ -$
Grant Description: This state grant provides funding to school divisions to develop and implement the Standards ofLearning (SOL) Web-based Technology Initiative. Funding for this program is targeted to achieve the following fourgoals: 1) to provide student access to computers at a ratio of one computer to every five students; 2) to create internet-ready local area network capability in every school; 3) to assure adequate high-speed, high-bandwidth capability forinstructional, remedial, and testing needs; and 4) to establish a statewide Standards of Learning test delivery system.
Final General Assembly action April 2011 includes additional funding for each school that is not fully accredited.Eligible schools could receive this supplemental grant only once for a period of three years following the year theeligible schools fails to be fully accredited. The following schools received a supplement of $26,000 each Lafayette-Winona Middle School, Ruffner Academy and Lindenwood Elementary. The Virginia Technololgy Inititive has beenreclassified from the Commonwealth of Virginia grant funds to the Operating Fund.

196
NORFOLK PUBLIC SCHOOLS – Nationally Recognized. Globally Competitive.
Other Funds: Intensive Support Services Program Fund: 4SPL (School Probation Liaisons)
Budget Summary
Actual Approved Proposed2011 2012 2013
Position Summary (Full-Time Equivalent Positions) 8.00 8.00 8.00
Expenditure Type
Salaries 160,043$ 160,457$ 160,457$
Fringe Benefits 62,747 75,891 75,891 Contract Services - - - Travel & Staff Development 1,632 2,281 2,281 Other Costs (Communications, Leases, Etc.) - - - Supplies - 371 371 Equipment - - - Indirect Cost - - - Total 224,422$ 239,000$ 239,000$
The program is staffed with eight Intensive Support (Liaison) Counselors. The Liaison Counselors work directly withstudents enrolled in Norfolk Public Schools and alternative programs when the student is involved with the court. Theyprovide school information (attendance, behavior and achievement) to probation and parole officers. There areapproximately 500 students served by this program each school year.
Description: The Intensive Support Services Program is to provide support to all students in Norfolk Pubic Schools whoare on court-ordered supervision. It is funded under the Virginia Juvenile Community Crime Control Act (VJCCCA) toNorfolk Juvenile Court Services Unit, with a required local funding called the Maintenance of Effort (MOE) from the Cityof Norfolk. The City's Department of Human Services administers the local program with an Memorandum of Agreementbetween the City of Norfolk Department of Human Services, the School Board of the City of Norfolk and the Court ServiceUnit of the Norfolk Juvenile and Domestic Relations Court.

197
NORFOLK PUBLIC SCHOOLS – Nationally Recognized. Globally Competitive.
Description of Grants and Special Programs Adult Literacy and Basic Education –This federal grant provides educational opportunities to adults, 18 years of age and older, without a 12th grade level of education. It also provides in-depth instruction in math, reading, and writing for passing the GED test. After-the-Bell (21st Century) – Funds received from the City of Norfolk’s Youth Development Department from a grant they were awarded from the 21st Century Community Learning Centers Program to fund an after-school program that offers tutoring and recreational services to the students at Blair Middle School. Authorization for this grant is provided in Title IV, Part B, of the Elementary and Secondary Education Act of 1965 (ESEA), amended by Public Law 107-110, No Child Left Behind Act of 2001 (NCLB). BAE Systems FIRST Robotics Grant – Funds received from BAE Systems to support the FIRST Robotics Team at Norfolk Technical Center. The funds will be used to design and build a robot to compete in the regional robotics competition. Career Switcher Mentor Funds – The Career Switcher Mentor Program (a state program) allocates funds to provide support for new career switcher teachers as they transition into the teaching profession. Carl Perkins - Title I – Federal funds are provided to focus on preparing students for jobs by providing academic and workplace skills to ensure success. Funds are used to integrate academic and career and technical education programs to prepare students for high-skills careers in high job growth fields. The grant provides equitable participation by special populations including students with disabilities. Funds provide technology education, professional development of teachers, and supplemental services for special populations. Chanchum Foreign Language Grant – This is a grant from the Changchum Foreign Language School (China) to cover the setup costs for the establishment of the Confucious Classroom at the School of International Studies. Children's Hospital of the King's Daughters – The Hospital Education Program (HEP) is a State Operated Program located at The Children's Hospital of the King's Daughters (CHKD). The mission of HEP is to provide appropriate educational services to patients (ages birth through 21) at CHKD. Educational plans are tailored to meet the individual student's needs in coordination With the hospital treatment team and within the confines of the facility. The Virginia Department of Education supervises the program. Norfolk Public Schools is the fiscal agent.
198
NORFOLK PUBLIC SCHOOLS – Nationally Recognized. Globally Competitive.
Description of Grants and Special Programs - Continued Early Reading First – This U.S. Department of Education competitive grant is to help build early childhood education centers of excellence that can serve as examples of effective early learning practices throughout the Nation. This grant was funded under Project PURPLE (Preschoolers Up on Readiness, Pre-Reading and Literacy Enrichment) of the No Child Left Behind Act of 2001 as a single three-year grant. Enhancing Education Through Technology - Title II, Part D – The primary goal of the Ed Tech Program is to improve student academic achievement through the use of technology in schools. The second goal is to establish successful research-based instructional methods and effective integration to technology in the classroom through high quality professional development and curriculum development. And, the third goal is to ensure that every student is technologically literate by the end of the eighth grade. The American Recovery and Reinvestment Act of 2009 (ARRA) provided additional funding to support the technology program. Even Start Family Literacy Program – A federal funded program authorized by Title I, Part B of the Elementary and Secondary Education Act of 1965 as amended by Public Law 103-382 to help break the cycle of poverty and illiteracy by improving the educational opportunities of low income families. This competitive grant is awarded for a period of four years and requires a local match. This program is located at the Berkley/Campostella Early Childhood Center. Even Start Program at Ingleside Center – The Norfolk (Ingleside) Even Start Program, formerly known as the Stuart Even Start Program, is the second of two Even Start grants awarded to Norfolk Public Schools under the William F. Goodling Even Start Family Literacy Program of Title I, Part B, Subpart 3, reauthorized by the Literacy Involves Families Together (LIFT) Act of 2000 and the No Child Left Behind Act of 2001. The 2009-2010 school year marks the eighth year of this Even Start. The required local match is currently 50%. Expanded GED – This is funding from the Virginia Department of Education. These funds are utilized to increase the number of Norfolk Public Schools’ GED test given, as well as to pay the salaries of part-time employees (examiners, proctors, custodians and security). Faith Wesleyan Church – A donation to the Music Department to support the music program. Fresh Fruit and Vegetable Program – The purpose of the U.S. Department of Agriculture (USDA) Fresh Fruit and Vegetable Program is to create a healthier school environment by increasing students' access to fresh fruits and vegetables and providing nutrition education. Funds were awarded to Campostella, P.B. Young Sr. and Tidewater Park Elementary and Booker T. Washington High Schools.

199
NORFOLK PUBLIC SCHOOLS – Nationally Recognized. Globally Competitive.
Description of Grants and Special Programs - Continued General Adult Education Grant (GAE) – This state grant provides academic instruction for adults pursuing high school classes for credit leading to a high school diploma, classes for preparation for the General Educational Development (GED) test, and classes for adults who need preparation of English for Speakers of Other Languages (ESOL). These funds may only be used by persons 18 years of age and older who are not enrolled in a public high school. Hampton Roads Community Foundation – Funding received to purchase a baby grand piano with dolly and cover for Booker T. Washington High School. Improving Teacher Quality (Teacher and Principal Training and Recruiting Fund) - Title II, Part A – This federal program of the No Child Left Behind Act of 2001 is to increase student academic achievement by improving teacher and principal quality and by increasing the number of highly qualified teachers and administrators. Title II, Part A incorporates the funding formerly allocated through the Class Size Reduction Grant and the Dwight D. Eisenhower Professional Development Program. Individualized Student Alternative Education Plan (ISAEP) – The state provides funding for the ISAEP Program, one of the district's alternative programs for 16 -18 year old students two grade levels behind and who are experiencing difficulty with the traditional instructional program. Industry Credentials Test (ICT) – This state grant provides funding for students to take industry certification examinations, licensure tests, or National Occupational Competency Institute (NOCTI) assessments that have been approved by the Virginia State Board of Education. Intensive Probation and School Liaison Program – Funded under the Virginia Juvenile Community Crime Control Act, this grant is from the Norfolk Juvenile Court Services Unit, through the City of Norfolk. The liaisons work directly with students enrolled in NPS and alternative programs when the student is involved with the court. They provide school information (attendance, behavior, and achievement) to probation and parole officers. J.C. Penney First Robotics Grant – This grant provides funds to cover the costs for students to design and build a robot to compete in the Regional Robotics Competition at Virginia Commonwealth University. Japanese Foundation Grant – A “Special Salary Assistance Program for Japanese-Language Courses” grant to support the Japanese-language program at Rosemont, Maury and Booker T. Washington High Schools and Ghent Elementary. Additional support was provided to purchase teaching materials.

200
NORFOLK PUBLIC SCHOOLS – Nationally Recognized. Globally Competitive.
Description of Grants and Special Programs – Continued
Jordan Fundamental Program Grant – This grant is to support the Inspiring Geometry Connections with Technology and More project at Norview High School. This project follows contemporary research on Geometry and closing the achievement gap in both minority and special needs students. New classroom technology will be implemented to involve students in real-time learning opportunities and manipulatives will be used to increase their understanding of complex topics. Justice Assistance Grant – Edward Byrne Memorial Justice Assistance Grant (JAG) funds were made available under the American Recovery and Reinvestment Act of 2009. The City of Norfolk received a grant award from the US Department of Justice, Office of Justice Program for the purpose of hiring personnel and purchasing equipment in support of existing City programs of reducing youth gang involvement, increasing prosecution of serious youth offenses, decreasing “recidivism” for drugs and domestic crimes, and facilitating cost savings in the jail system, according to the terms and conditions of the JAG Program. Norfolk Public Schools received funds from the City to purchase student identification cards. Limited English Proficient and Immigrant and Youth - Title III, Part A – A federal sub-grant designed to fund activities to support increasing the English proficiency of Limited English Proficient (LEP) students by providing high-quality language instruction and high-quality professional development to classroom teachers. Lowe’s Toolbox for Education Grant – This grant from The Lowe’s Charitable and Educational Foundation is to support Ocean View (Maritime) Elementary School’s Safety Fence Project. Math Solutions Study Project – This is an extensive research study in mathematics involving Harvard College, the University of Michigan, Brigham Young University and Math Solutions. The project is to learn how the Math Solutions professional development program influences teachers’ mathematical knowledge, their instructional practice and the math achievement of their students. A federal grant has been secured to support the project. Norfolk Public Schools is the recipient of a sub-award from Harvard College. The funds are being used to hire an Elementary Science Coach who will work primarily with the 48 teachers in the control group. Mentor Teacher Program – The Education Accountability and Quality Enhancement Act of 1999 (Section 22.1-303 Code of Virginia) requires school boards to provide probationary teachers with a mentor teacher. The General Assembly through the Virginia Department of Education’s Division of Teacher Education and Licensure allocates funds to help new teachers transition into the teaching profession.
201
NORFOLK PUBLIC SCHOOLS – Nationally Recognized. Globally Competitive.
Description of Grants and Special Programs - Continued Mentor Teacher Programs for Hard-to-Staff Schools – This program for Hard-to-Staff Schools was created in response to Governor Warner's Education for a Lifetime program to provide probationary teachers with a mentor teacher. Metro Machine Corporation Grant – Two grants were received from Metro Machine Corporation in 2010 to support NPS’ instructional program. One is to support instruction in the areas of mathematics and reading at Lake Taylor Middle School and the second grant is to purchase smart tables for St. Helena Elementary School. National Board Certification – Virginia Department of Education provides an incentive payment to classroom teachers in Virginia Public Schools who hold certification from the National Board for Teaching Standards. Neglected, Delinquent or At-Risk – Title I (SOP) – The Division of Sate Operated Programs (SOP) within the Virginia Department of Education received funding under the Title I, Part D, Neglected, Delinquent, or At-Risk grant to employ a Title I teacher for the Norfolk Juvenile Detention Center. The American Recovery and Reinvestment Act of 2009 (ARRA) provided additional funding to support this program. Norfolk Detention Center School – This is a State Operated Program by the Virginia Department of Education (VADOE) through Norfolk Public Schools. It provides secure care of juveniles ages 10 through 17 who have been convicted, sentenced, or adjudicated by the court and those who are awaiting transfer to another facility. Instruction in the Detention School parallels the regular curriculum of public middle and secondary schools in the areas of English, Math, Science, Social Studies, and Physical Education/Health. The Norfolk Detention School is operated in compliance with regular school board policies governing educational programs in the City of Norfolk and VADOE policies. Opportunity Inc. of Hampton Roads - Opportunity Inc. of Hampton Roads has a contract with Norfolk Public Schools to provide practical employment oriented learning experiences through internship opportunities with employers in healthcare and technology occupational areas which promote Science, Technology, Engineering and Math (STEM) application. It is restricted to Workforce Investment Act (WIA) eligible public school divisions high school seniors and is intended to increase their knowledge of the work requirements and practices in certain demand occupational areas, as well as, facilitate and support entry into post secondary education after high school graduation.

202
NORFOLK PUBLIC SCHOOLS – Nationally Recognized. Globally Competitive.
Description of Grants and Special Programs – Continued
Prevention and Intervention Programs - Neglected, Delinquent, or At Risk - Title I, Part D, Subpart 2 – A federal formula grant that provides funding to support school districts' programs involving collaboration with locally operated correctional facilities. Monies allocated to the division are authorized by Title I, Part D of the Elementary and Secondary Education Act of 1965 (ESEA), as amended by the No Child Left Behind Act of 2001. No local match is required. Funds are spent at the Norfolk Detention Center. Project Graduation Academic Year Academy – Virginia Department of Education funds to implement the Project Graduation Academy model that provides remedial instruction for students (sophomores, juniors and seniors) who have passed the course, but have not passed the associated end-of-course (EOC) assessment (verified credits) in English: Reading, English: Writing, Algebra I, Geometry, History, and/or Science. Norfolk participates through a regional grant. Project Graduation Summer – Funded by the Virginia Department of Education (VDOE) to assist seniors who did not graduate with their class due to insufficient verified credits, who have passed the course but still need to pass the associated Standards of Learning Assessment in order to earn a verified credit to complete their diploma requirements. Race to GED – This state grant is used to provide GED Fast Track classes to adults (18 years of age and older) who have passed portions of the GED test and need more in-depth review in reading, writing, and mathematics to pass the remaining portion(s) of the test. Free GED testing is also provided to individuals who qualify by attending an adult education class for 15-60 hours and passing the Official Practice Test (OPT). Funds are also available to cover any re-testing in the GED subject areas. No local match is required. Safe and Drug-Free Schools and Communities Act Grant - Title IV, Part A – In accordance with the No Child Left Behind Act (NCLB) of 2001, this federal grant is awarded by the U.S. Department of Education, administered by state education agencies, and made available to local school districts. Grant funds support programs that prevent violence in and around schools, that prevent the illegal use of alcohol, tobacco, and drugs, that involve parents and communities; and support community efforts and resources to foster a safe and drug-free learning environment that supports student academic achievement, through the provision of federal assistance. The NCLB Act will allow LEAs to transfer up to 50% of the funding to Title I or any of the programs.

203
NORFOLK PUBLIC SCHOOLS – Nationally Recognized. Globally Competitive.
Description of Grants and Special Programs - Continued Section 619 Pre-School Incentive Grant – Section 619 of the Individuals with Disabilities Education Act (IDEA) provides federal funds to help local school divisions develop and implement individualized educational plans (IEP) to meet the unique educational needs of preschool children with disabilities, ages 2 through 5. The American Recovery and Reinvestment Act of 2009 (ARRA) provided additional funding to support IDEA programs. Sertoma Grant – Donations from the Sertoma Club of Norfolk are to be used for the Hearing Impaired Program at Norfolk Public Schools. Special Education in Jail Program – This state funded program operates in conjunction with the General Education Diploma (GED) program which is housed in the Norfolk City Jail. It is designed to offer academic assistance and remediation as well as transitional planning to individuals within the correctional facility. State Categorical Equipment (SCE) – This state grant provides funding for approved secondary career and technical education equipment. No local match is required. State Council of Higher Education for Virginia (SCHEV) – The State Council of Higher Education for Virginia awarded a grant to The Old Dominion University Research Foundation (The Foundation) to conduct a project entitled “Integrating Assessment and Literacy Instruction for Powerful Learning”. The Foundation has contracted with Norfolk Public Schools to perform work and services in connection with the project. State Farm Services Grant – This is a State Farm's Good Neighbor Citizenship Grant award to fund the Leaders for the Future program at Rosemont Middle School Academy of International Studies. Statewide Longitudinal Data Systems – Statewide Longitudinal Data Systems is a multi-year federal grant for the development, operation and enhancement of a Longitudinal Data System (LDS) to integrate student data between schools in the Commonwealth of Virginia. Striving Readers Intervention Initiative – The Virginia Striving Readers Intervention Initiative, a federally funded supplemental reading program, supports initiatives to raise literacy levels in schools with high percentages of economically disadvantaged students while building a scientific research base for efforts to increase adolescent literacy. Stuart McKinney-Vento Homeless Grant - Title X, Part C – Authorized by the McKinney-Vento Education Assistance Improvement Act of 2001, these federal funds are used to sustain and to enhance the academic achievement of homeless children and youth.

204
NORFOLK PUBLIC SCHOOLS – Nationally Recognized. Globally Competitive.
Description of Grants and Special Programs - Continued Tidewater Development Center – This State Operated Program provides educational consultants for the Tidewater Child Development Services and outpatient clinics of The Children's Hospital of the King's Daughters (CHKD). Educational Consultants are an extension of the Hospital Education Program located at CHKD. The staff of 14 consultants is employees of Norfolk Public Schools and is supervised by the CHKD Hospital Education Program Director. Educational consultants provide appropriate educational services to students under medical care in the assigned clinics. Norfolk Public Schools is the fiscal agent of the program and provides supervision for the staff. All funding is provided by the Commonwealth of Virginia. Tidewater Post-Secondary College Fair Fund – These funds are generated by fees assessed from universities, colleges and other educational programs for attending the Tidewater Post-Secondary College Fair. One scholarship of $1,000 will be awarded to a deserving student at each high school who will attend either Norfolk State or Old Dominion University and major in Counseling Psychology or Education. Title I - Distinguished School – Section 1117(b)(1) of the No Child Left Behind Act of 2001 allows states to financially reward Title I schools that significantly close the achievement gap or exceed adequate yearly progress targets for two or more consecutive years. Ocean View Elementary School earned this distinction for the 2008-2009 school year. Title I, Part A – Improving Basic Programs – It is the largest source of federal assistance to local school divisions and is authorized by the Improving America's School Act of 1994. The No Child Left Behind (NCLB) Act of 2001 reauthorized the Elementary and Secondary Education Act of 1965. Title I funds are allocated to school districts according to the district's concentrations of children from low income families (free and reduced lunch count). Funds are used to supplement regular instructional activities and make available services designed to enrich and accelerate the core curriculum in eligible schools in order to help all children move toward achieving high state performance standards. The American Recovery and Reinvestment Act of 2009 (ARRA) provided additional funding to support Title I, Part A programs. Title I School Improvement 1003(a) Grant – Under the No Child Left Behind Act of 2001 (NCLB) schools in Title I School Improvement may be awarded supplemental funds to support efforts to raise student achievement. These funds are awarded to assist schools and school divisions in coordinating the delivery of research-based federal, state, and local school reform initiatives that support teaching and learning in high poverty low-achieving schools. These funds were received for Jacox and Lindenwood Elementary Schools.

205
NORFOLK PUBLIC SCHOOLS – Nationally Recognized. Globally Competitive.
Description of Grants and Special Programs - Continued Title 1 School Improvement ARRA 1003(g) Grant – Under the No Child Left Behind Act of 2001 (NCLB) schools in Title I School Improvement are awarded grant funds to support the implementation of one of four United States Department of Education Transformation Models. The Transformation Model is designed to develop and increase teacher and school leader effectiveness through a program of job-embedded professional development created and implemented in cooperation with a selected Lead Turnaround partner. These funds were received for Lake Taylor Middle School and Ruffner Academy. Title VI-B (Flow-Through) – The Individuals with Disabilities Education Act (IDEA) provides federal funds to implement, expand, and improve educational resources for children and youth with disabilities in public schools. Funding is included to help local schools develop and implement individualized educational plans (IEP) to meet the unique educational needs of children with disabilities. Funding is calculated on the total number of special education students. The American Recovery and Reinvestment Act of 2009 (ARRA) provided additional funding to support IDEA programs. Virginia Incentive Program (for Speech-Language Pathologists) – To increase the pool of qualified speech-language pathologists in Virginia public schools, the Virginia Department of Education allocated funds to encourage professionals working in the private sector and recent graduates to accept positions in Virginia public schools. The incentive program pays up to $3,000 per year for speech-language pathologists employed full-time in a Virginia public school division and $1,500 per year for those who work part-time. Virginia State Technology Supplement – A supplemental grant of $26,000 per eligible school from the Virginia Public School Authority (VPSA) technology Notes Series XI to support schools that are not fully accredited, for the purpose of developing and maintaining capacity to support 100 percent online SOL testing of all students in the qualifying schools. Virginia Technology Initiative – This state grant provides funding to school divisions to develop and implement the Standards of Learning (SOL) Web-based Technology Initiative. Funding for this program is targeted to achieve the following four goals: 1) to provide student access to computers at a ratio of one computer for every five students; 2) to create internet-ready local area network capability in every school; 3) to assure adequate high-speed, high-bandwidth capability for instructional, remedial, and testing needs; and 4) to establish a statewide Standards of Learning test delivery system.

206
NORFOLK PUBLIC SCHOOLS – Nationally Recognized. Globally Competitive.
State and City Revenues
YEAR
STATE REVENUE CITY REVENUE
Total Percent Total Percent
FY 2003 $146,824,995 60.1% $88,853,663 36.4%
FY 2004 $148,829,050 59.4% $90,020,000 35.9%
FY 2005 $178,952,918 63.3% $91,864,910 32.5%
FY 2006 $181,620,367 63.5% $92,594,910 32.4%
FY 2007 $200,156,813 65.4% $97,594,910 31.9%
FY 2008 $202,080,910 64.9% $101,094,910 32.5%
FY 2009 $207,728,480 64.8% $104,511,132 32.6%
FY 2010 $188,706,933 63.3% $101,011,200 33.9%
FY 2011 $172,197,119 60.4% $104,511,200 36.7%
FY 2012
(Approved) $171,325,545 60.3% $104,511,131 36.8%
FY 2013
(Approved) $179,711,257 59.2% $107,186,600 38.0%
0.0%
10.0%
20.0%
30.0%
40.0%
50.0%
60.0%
70.0%
$0
$50,000,000
$100,000,000
$150,000,000
$200,000,000
$250,000,000
FY 2003FY 2004FY 2005FY 2006FY 2007FY 2008FY 2009FY 2010FY 2011FY 2012FY 2013
STATE $ CITY $ STATE % CITY %
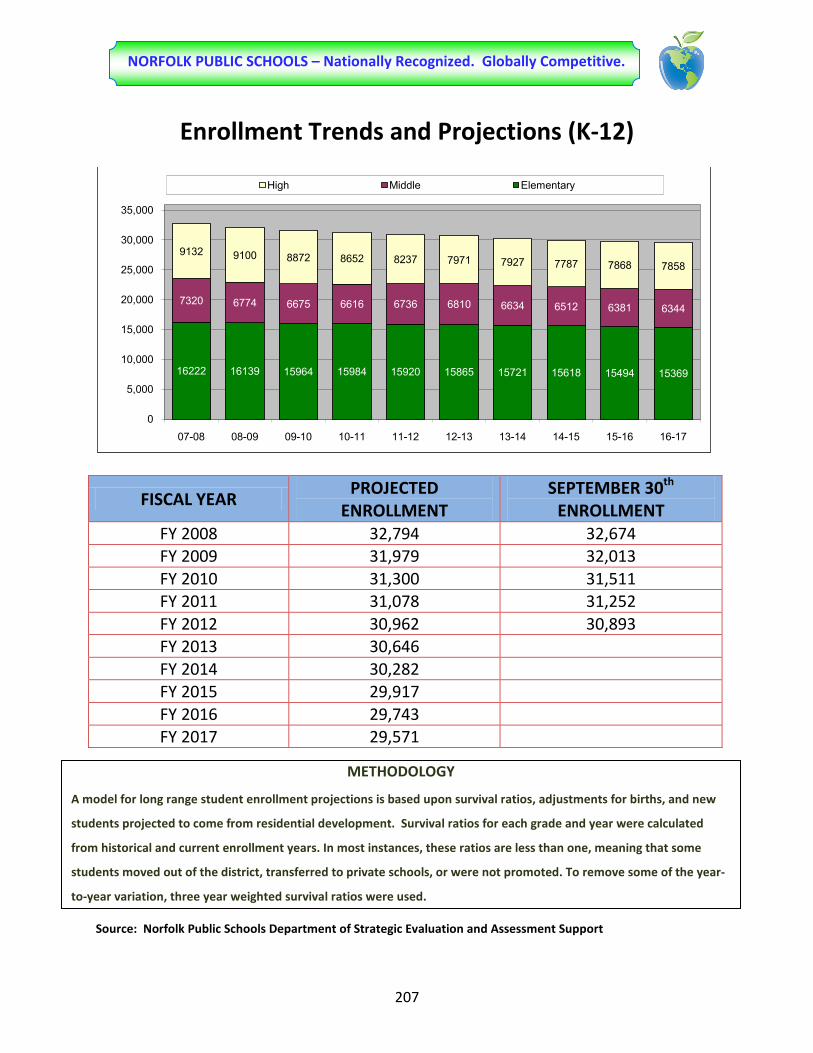
207
NORFOLK PUBLIC SCHOOLS – Nationally Recognized. Globally Competitive.
Enrollment Trends and Projections (K-12)
FISCAL YEAR PROJECTED
ENROLLMENT SEPTEMBER 30th
ENROLLMENT FY 2008 32,794 32,674 FY 2009 31,979 32,013 FY 2010 31,300 31,511 FY 2011 31,078 31,252 FY 2012 30,962 30,893 FY 2013 30,646 FY 2014 30,282 FY 2015 29,917 FY 2016 29,743 FY 2017 29,571
Source: Norfolk Public Schools Department of Strategic Evaluation and Assessment Support
16222 16139 15964 15984 15920 15865 15721 15618 15494 15369
7320 6774 6675 6616 6736 6810 6634 6512 6381 6344
9132 9100 8872 8652 8237 7971 7927 7787 7868 7858
0
5,000
10,000
15,000
20,000
25,000
30,000
35,000
07-08 08-09 09-10 10-11 11-12 12-13 13-14 14-15 15-16 16-17
High Middle Elementary
METHODOLOGY
A model for long range student enrollment projections is based upon survival ratios, adjustments for births, and new
students projected to come from residential development. Survival ratios for each grade and year were calculated
from historical and current enrollment years. In most instances, these ratios are less than one, meaning that some
students moved out of the district, transferred to private schools, or were not promoted. To remove some of the year-
to-year variation, three year weighted survival ratios were used.
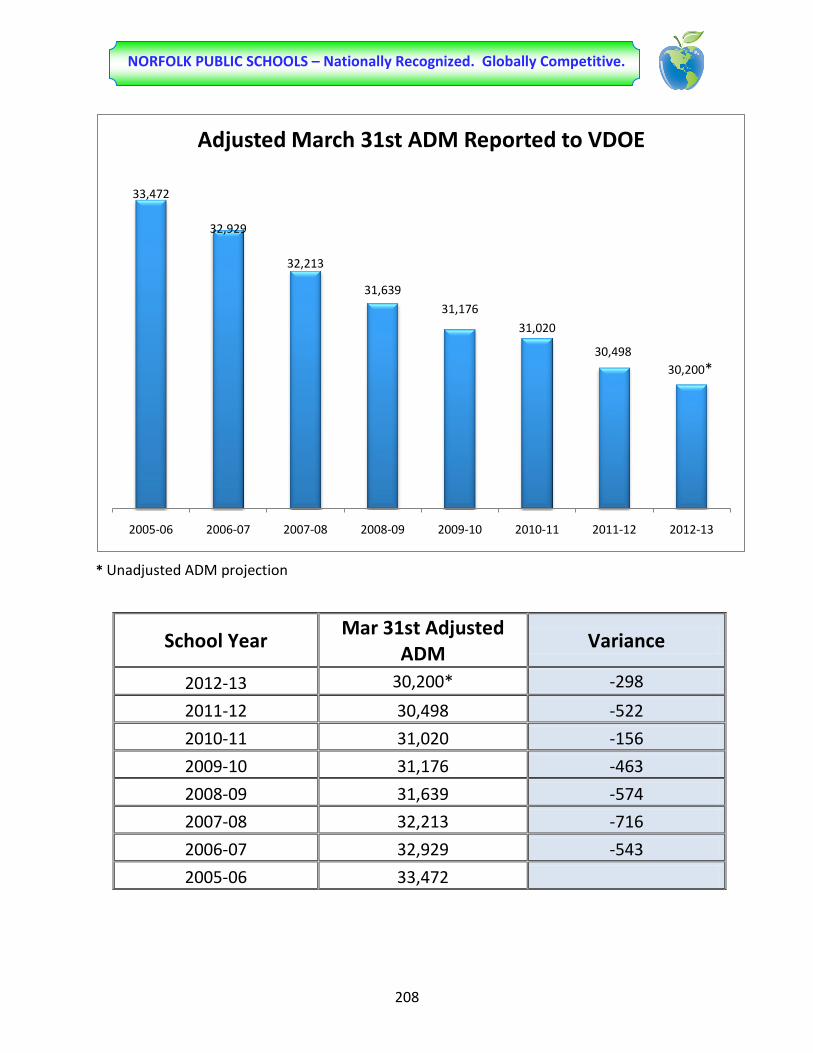
208
NORFOLK PUBLIC SCHOOLS – Nationally Recognized. Globally Competitive.
* Unadjusted ADM projection
School Year Mar 31st Adjusted
ADM Variance
2012-13 30,200* -298
2011-12 30,498 -522
2010-11 31,020 -156
2009-10 31,176 -463
2008-09 31,639 -574
2007-08 32,213 -716
2006-07 32,929 -543
2005-06 33,472
30,200*30,498
31,02031,176
31,639
32,213
32,929
33,472
2012-132011-122010-112009-102008-092007-082006-072005-06
Adjusted March 31st ADM Reported to VDOE

209
NORFOLK PUBLIC SCHOOLS – Nationally Recognized. Globally Competitive.
$0
$10,000
$20,000
$30,000
$40,000
$50,000
$60,000
FY 2006 FY 2007 FY 2008 FY 2009 FY 2010
NORFOLK NEWPORT NEWS VIRGINIA BEACH CHESAPEAKE PORSTMOUTH STATE
Average Annual Salary - All Teaching Positions
YEAR NORFOLK NEWPORT
NEWS VIRGINIA
BEACH CHESAPEAKE PORTSMOUTH STATE
FY 2006 $44,165 $43,812 $47,900 $49,005 $32,903 $47,248
FY 2007 $45,288 $44,735 $51,102 $51,348 $34,924 $49,164
FY 2008 $46,161 $45,510 $52,377 $52,885 $36,924 $50,511
FY 2009 $48,903 $48,938 $53,343 $54,385 $42,270 $52,309
FY 2010 $48,058 $45,842 $52,710 $52,514 $44,450 $51,894 Source: State Superintendent's Annual Report for Virginia

210
NORFOLK PUBLIC SCHOOLS – Nationally Recognized. Globally Competitive.
GRADE LEVEL: ELEMENTARY SCHOOLS (K-5)
Position Student Enrollment Norfolk StaffingPrincipal One half-time to 299 Full-time principal for each elementary
One full-time at 300Assistant Principal One half-time at 600 Full-time assistant at 600 students.
One full-time at 900Librarian One part-time to 299 Full-time librarian at each elementary school
One full-time at 300Guidance Counselor*
One hour per day per 100 students Full-time counselor for each elementary school. An additional half-time counselor is added for schools with more than 700 students.
or One full-time position at 500 students and one hour per day additional time per 100 students or major fraction thereof.
Reading Specialist* One full-time at the discretion of the local school board.
One full-time reading specialist at each elementary school
Clerical Part-time to 299 students Two clerical positions for each elementary One full-time at 300 students
Note: District may choose to provide reading specialist instead of counselor.
Comparison of Norfolk Public Schools and State Requirements: Elementary
Virginia regulations require that each school have required staff with proper licenses andendorsements. Below is a comparison of Norfolk Public Schools staffing standards withthose required by state regulations:

211
NORFOLK PUBLIC SCHOOLS – Nationally Recognized. Globally Competitive.
GRADE LEVEL: MIDDLE SCHOOLS (6-8)
Position Student Enrollment Norfolk StaffingPrincipal One half-time to 299 Full-time principal for each elementary school
One full-time at 300
Assistant Principal One half-time at 600 Full-time assistant at 600 students. One full-time at 900
Librarian One part-time to 299 Full-time librarian at each elementary schoolOne full-time at 300
Guidance Counselor*
One hour per day per 100 students
Full-time counselor for each elementary school. An additional half-time counselor is added for schools with more than 700 students.
or One full-time position at 500 students and one hour per day additional time per 100 students or major fraction thereof.
Reading Specialist* One full-time at the discretion of the local school board.
One full-time reading specialist at each elementary school
Clerical Part-time to 299 students Two clerical positions for each elementary One full-time at 300 students
One full-time for the library at 750 students
State standard
Comparison of Norfolk Public Schools and State Requirements: Middle School
Virginia regulations require that each school have required staff with proper licenses andendorsements. Below is a comparison of Norfolk Public Schools staffing standards with thoserequired by state regulations:

212
NORFOLK PUBLIC SCHOOLS – Nationally Recognized. Globally Competitive.
GRADE LEVEL: HIGH SCHOOLS (9-12)
Position Student Enrollment Norfolk StaffingPrincipal One full-time (12 month basis) State standard
Assistant Principal One full-time for each 600 students
State standard
Librarian One half-time to 299 students State standard
One full-time at 300 students
Two full-time at 1,000 students
Guidance Counselor
One period per 70 students State standard, except that head counselor has a lower case load because of administrative responsibilities.
One full-time counselor at 350 students plus
One additional period for each 70 students or major fraction thereof.
Clerical One full-time and an additional full-time for each 600 students beyond 200.
Six clerks at each school
One full-time for the library at 750 students
State standard
Comparison of Norfolk Public Schools and State Requirements: High School
Virginia regulations require that each school have required staff with proper licenses andendorsements. Below is a comparison of Norfolk Public Schools staffing standards with thoserequired by state regulations:

213
NORFOLK PUBLIC SCHOOLS – Nationally Recognized. Globally Competitive.
State Incentives to Reduce Class Size State regulations require licensed instructional personnel be assigned to each school and that the ratio of students to teachers does not exceed the following:
Kindergarten 25:1 with no class larger than 29 students (teacher assistant is
required if average daily membership exceeds 24 students) Grades 1 - 3 25:1 with no class larger than 30 students Grades 4 - 6 22:1 with no class larger than 35 students
Additionally, the state provides generous incentives to localities which reduce class sizes in kindergarten through grade three (K-3). The target class size set by the State varies with the concentration of at-risk students as determined by the number of free lunch students. The table below indicates the desired pupil-teacher ratio, the pupil-teacher ratio we expect to achieve, maximum applicable class size, and the October 2010 percentage of free lunch students. Also included are ratios and maximum class sizes for FY 2013. In determining average class size, personnel funded with the Federal Class Size Reduction Initiative were included. The 2012-2014 Biennial Budget Introduced by the Governor on December 19, 2011 limits participation in this program to schools with free lunch eligibility percentages (based on October 2010) greater than or equal to 30 percent, thereby eliminating the 20 to 1 K-3 Primary Class Size Ratio. For Norfolk, this eliminates Ghent, W.H. Taylor, Larchmont and Sewells Point Elementary schools from this funding source. Please see chart on next page.

214
NORFOLK PUBLIC SCHOOLS – Nationally Recognized. Globally Competitive.
State Incentive to Reduce Class Size
School Name October 2010 Free Lunch Eligibility
Rate
Required School-Wide
Pupil-Teacher Ratio
NPS Pupil-Teacher
Ratio Budgeted
Largest Permitted Individual
Class Size in the School
NPS Average Class Size Expected
BAY VIEW 36.42% 19:1 22:1 24 22
CAMP ALLEN 30.28% 19:1 20:1 24 20
CAMPOSTELLA 90.35% 14:1 18:1 19 16
CHESTERFIELD ACADEMY 70.61% 15:1 22:1 20 19
COLEMAN PLACE 63.11% 17:1 21:1 22 21
CROSSROADS 46.18% 18:1 20:1 23 20
FAIRLAWN 49.79% 18:1 20:1 23 20
GRANBY 50.24% 18:1 24:1 23 24
INGLESIDE 47.71% 18:1 19:1 23 19
JACOX 82.93% 14:1 17:1 19 15
JAMES MONROE 84.22% 14:1 18:1 19 15
LARRYMORE 40.84% 19:1 21:1 24 21
LINDENWOOD 80.10% 14:1 18:1 19 15
LITTLE CREEK 52.20% 18:1 20:1 23 20
MARY CALCOTT 32.31% 19:1 21:1 24 21
NORVIEW 67.96% 16:1 18:1 21 18
OCEAN VIEW 52.20% 18:1 20:1 23 20
OCEANAIR 49.23% 18:1 20:1 23 20
P.B. YOUNG SR. 91.44% 14:1 18:1 19 15
POPLAR HALLS 46.91% 18:1 18:1 23 18
RICHARD BOWLING 64.36% 17:1 23:1 22 19
SHERWOOD FOREST 46.67% 18:1 21:1 23 22
ST. HELENA 75.31% 14:1 22:1 19 17
SUBURBAN PARK 57.43% 17:1 20:1 22 20
TANNERS CREEK 53.35% 18:1 20:1 23 20
TARRALLTON 32.40% 19:1 21:1 24 21
TIDEWATER PARK 94.65% 14:1 19:1 19 15
WILLARD MODEL 46.87% 18:1 21:1 23 21
WILLOUGHBY 32.10% 19:1 19:1 24 19

215
NORFOLK PUBLIC SCHOOLS – Nationally Recognized. Globally Competitive.
Basis of School Allocations
Each school in the district is allocated funds for its operations. These allocations cover all expenses of the school except full-time employee compensation, maintenance of the building, and utility costs. Allocation rates and methods are explained below.
Part-time and extra wages
Included in each school’s allocation is an allowance for services provided by contract employees outside their regular day and for hourly wages of part-time employees.
The following part-time allocations are provided: • Saturday Detention Program - Middle schools and high schools are allocated
$3,983 and $5,180 respectively. • Marching Band Workshops - High schools are allocated $945 annually as part of
the after-school program. • Cafeteria Monitors - This account will be funded by Child Nutrition Services.
Substitute Teachers (other than long-term substitutes)
Substitute teachers are allocated to schools according to the number of teachers assigned to the school. Substitute allocations are as follows:
• Regular teacher substitutes ................................................. 4 days per teacher • Vocational teacher substitutes ............................................ 4 days per teacher • Special education teacher substitutes ................................. 4 days per teacher
Services contracted or purchased from outside vendors
• Classroom and Administrative Purchased Services - A small amount is included in each school allocation to cover the cost of purchased services. Generally, the amount allocated is intended to cover the cost of cleaning band uniforms, choral robes, physical education mats, and small equipment (e.g., typewriters, laminators, and fax machines) not maintained by school plant. The senior coordinators of science, art, and music have been allocated an allowance for repair of scientific equipment, art equipment, and musical instruments respectively. Practically all other repairs are budgeted under Facilities Management. The purchased services allocation is split between classroom and administrative functions.
• Student Planners - Secondary schools have received a supplemental allowance for printing of student planners. The allowance is $1,680 per high school and $1,440 per middle school.

216
NORFOLK PUBLIC SCHOOLS – Nationally Recognized. Globally Competitive.
Basis of School Allocations Continued
Copier Leases
Annual lease of school copiers will be funded centrally.
Postage
Postage allocation is budgeted based on:
• High schools ……………………………………………………………..…….. $8.00 per student • Middle schools ………………………………………………………………… $5.00 per student • Elementary schools …………………………………………………………. $2.00 per student
Staff Development
A staff development allocation is made to all schools. The allocation covers the cost of all staff development activities in which school staff participate. The allocation is $50 per staff member, including classroom, resource and special education teachers, media specialists, guidance counselors, deans of students, teacher assistants, and clerical staff. Excluded from the staff development allocation are principals, assistant principals, custodians, and positions funded by grants.
Instructional Supplies
Supplies are allocated to schools according to projected September membership. Below is a listing of per student for supplies: • Elementary school classroom supplies ........................... ……. $54.00 • Middle school classroom supplies .................................. ……. $46.00 • High school classroom supplies ....................................... ……. $47.00 • Guidance supplies ........................................................... ……. $1.00 • Art supplies .................................................................... ……. $2.00 • Music supplies ................................................................ ……. $2.00 • Media center – elementary ............................................. ……. $17.15 • Media center - middle school …………….. ......................... ……. $15.80
(Amount reflects $1.35 reduction for Gale software) • Media center - high school ............................................. ……. $15.15
(Amount reflects $2.00 reduction for Gale software)

217
NORFOLK PUBLIC SCHOOLS – Nationally Recognized. Globally Competitive.
Basis of School Allocations Continued
Instructional Supplies (continued)
• Office of the principal – elementary .............................. ……. $4.70 • Office of the principal – secondary ................................ ……. $4.05 • Special education supplemental .................................... ……. $2.45
Equipment (New and Replacement)
Equipment funds are allocated to each school based on projected student membership. The approved FY 2013 allocation is $17.00 per student and is assigned to individual school budget lines in accordance with school requests.
Pre-school Allocations
Pre-school allocations are as follows:
• Teacher substitutes ........................................................ ……. 4 days per teacher 4 days per teacher assistant
• Field Trips……………………………………………………………………………. $500 per classroom
• Supplies ……………………………………………………………………………… $600 per classroom
All Locations:
• Custodial Supplies ............................................................... $1.00 per student

218
Actual Approved Approved%
Incr/DecrDESCRIPTION 2011 2012 2013 over 2012
RevenuesCommonwealth of Virginia: Standards of Quality Funds 109,650,270$ 111,984,655$ 117,336,606$ 4.8% Sales Taxes 28,780,241 28,926,427 31,580,748 9.2% Lottery Profits 25,097,329 25,994,361 26,854,746 3.3% Other State Funds 8,669,277 4,420,102 3,939,157 -10.9%Total State Funds 172,197,117 171,325,545 179,711,257 4.9%Federal Stimulus Funds 3,865,505 - - 0.0%2010 Federal Jobs Bill 3,553,473 4,200,000 - -100.0%City Funds 104,511,131 104,511,131 107,186,600 2.6%Other Federal Funds 5,448,338 6,336,537 4,836,537 -23.7%Other Local Funds 2,758,801 4,177,226 4,177,226 0.0%Re-Appropriated Carry Forward Funds - - 6,121,700 100.0%
Total Revenues 292,334,365$ 290,550,439$ 302,033,320$ 4.0%
ExpendituresInstructional Support Services 224,152,280$ 223,427,908$ 230,392,516$ 3.1%Central Administration 8,793,728 9,387,282 9,641,043 2.7%Student Attendance and Health Services 3,591,762 3,779,750 5,641,243 49.2%Pupil Transportation 10,779,295 11,603,631 11,664,171 0.5%Operations and Maintenance 35,188,292 33,880,937 34,710,178 2.4%Child Nutrition Services 112,494 - - 0.0%Community Services 7,751 - - 0.0%Information Technology 7,308,652 6,857,086 8,339,304 21.6%Facility Improvement 1,612,951 1,644,865 1,644,865 0.0%Total Expenditures 291,547,205$ 290,581,459$ 302,033,320$ 4.0%
Summary of Revenue and Expenditures - Operating Budget

219
Actual Approved Approved% Increase/
DecreaseDESCRIPTION 2011 2012 2013 2011 2012 2013 over 2012Wages and Employee Benefits
112000 Teachers (Contract) 1,748.60 1,717.60 1,686.60 80,320,155$ 78,560,833$ 80,161,937$ 2.0%112100 Teachers (Hourly) 293,126 345,270 475,785 37.8%115100 Teacher Assistants 87.00 58.00 53.00 983,735 939,315 924,693 -1.6%115200 Teacher Assistants (Hourly) 128,789 233,308 190,117 -18.5%152000 Substitute Teachers (Daily) 1,041,477 1,014,391 830,679 -18.1%152100 Substitute Teachers (Long-Term) 783,169 1,052,814 971,870 -7.7%162100 Stipends 502,999 400,121 400,121 0.0%
Total Wages 1,835.60 1,775.60 1,739.60 84,053,449 82,546,052 83,955,202 1.7%Employee Benefits 24,446,707 26,778,038 28,869,922 7.8%Total Wages and Employee Benefits 108,500,157 109,324,090 112,825,124 3.2%
Other Expenditures300000 Purchased Services 513,575 950,993 778,275 -18.2%540000 Leases and Rentals 115,568 214,010 214,010 0.0%550100 Local Travel 6,255 8,220 8,220 0.0%551000 Out-of-Town Travel Meals Lodging 5,679 4,750 4,750 0.0%552000 Out-of-Town Travel Transportation - - - 0.0%553000 Out-of-Town Travel Registration 912 - - 0.0%585000 Student Travel and Field Trips 31,941 49,421 44,062 -10.8%600000 Supplies - General 758,336 147,027 134,184 -8.7%602000 Textbooks - Existing Adoption 271,776 627,645 666,645 6.2%602500 Textbooks - New Adoption 213,470 568,366 2,043,201 259.5%603000 Supplies -Instructional Materials 1,624,291 1,981,350 1,972,569 -0.4%604000 Technology Software/On-Line Content - - 79,900 100.0%700000 Regional Education Programs 337,851 296,791 296,791 0.0%810000 Equipment Replacements 1,927,808 533,324 529,144 -0.8%810500 Furniture Replacement 100,000 - - 0.0%820000 Equipment Additions 1,023,369 19,330 - -100.0%
Total Other Expenditures 6,930,829 5,401,227 6,771,751 25.4%
TOTAL 1,835.60 1,775.60 1,739.60 115,430,986$ 114,725,317$ 119,596,875$ 4.2%
PositionsClassroom Instruction - Regular Program 110
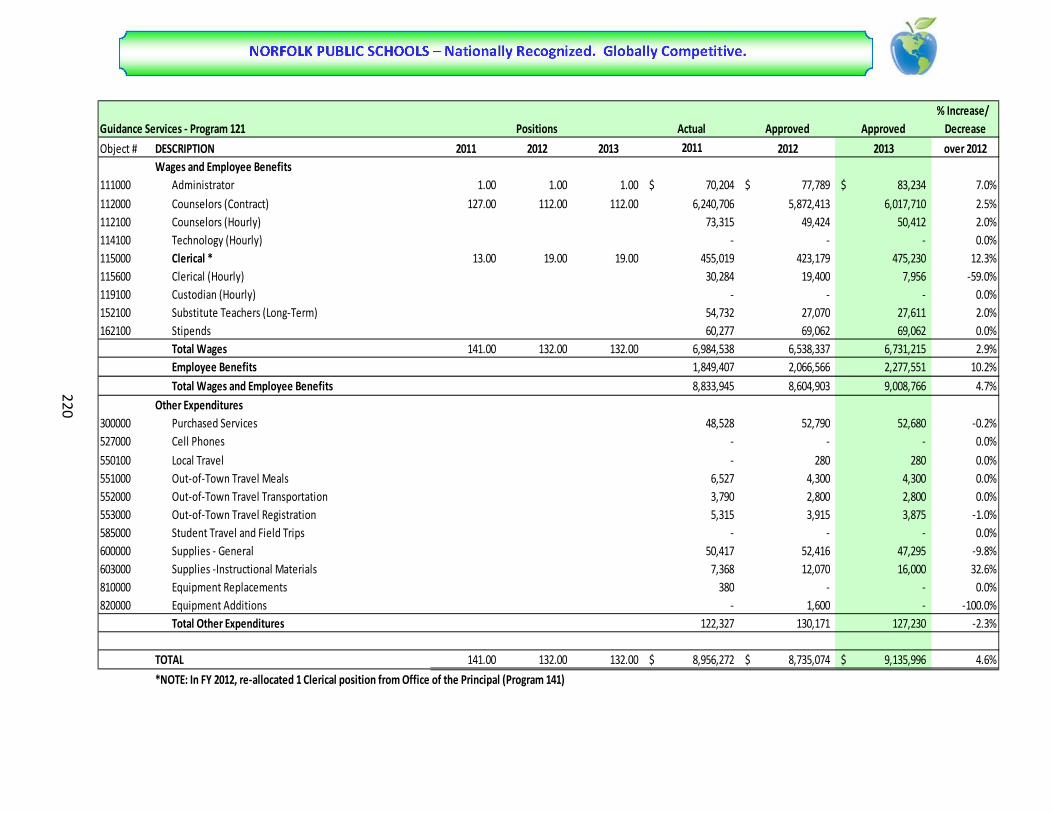
220
Guidance Services - Program 121 Actual Approved Approved% Increase/
Decrease
Object # DESCRIPTION 2011 2012 2013 2011 2012 2013 over 2012Wages and Employee Benefits
111000 Administrator 1.00 1.00 1.00 70,204$ 77,789$ 83,234$ 7.0%112000 Counselors (Contract) 127.00 112.00 112.00 6,240,706 5,872,413 6,017,710 2.5%112100 Counselors (Hourly) 73,315 49,424 50,412 2.0%114100 Technology (Hourly) - - - 0.0%115000 Clerical * 13.00 19.00 19.00 455,019 423,179 475,230 12.3%115600 Clerical (Hourly) 30,284 19,400 7,956 -59.0%119100 Custodian (Hourly) - - - 0.0%152100 Substitute Teachers (Long-Term) 54,732 27,070 27,611 2.0%162100 Stipends 60,277 69,062 69,062 0.0%
Total Wages 141.00 132.00 132.00 6,984,538 6,538,337 6,731,215 2.9%Employee Benefits 1,849,407 2,066,566 2,277,551 10.2%Total Wages and Employee Benefits 8,833,945 8,604,903 9,008,766 4.7%
Other Expenditures300000 Purchased Services 48,528 52,790 52,680 -0.2%527000 Cell Phones - - - 0.0%550100 Local Travel - 280 280 0.0%551000 Out-of-Town Travel Meals 6,527 4,300 4,300 0.0%552000 Out-of-Town Travel Transportation 3,790 2,800 2,800 0.0%553000 Out-of-Town Travel Registration 5,315 3,915 3,875 -1.0%585000 Student Travel and Field Trips - - - 0.0%600000 Supplies - General 50,417 52,416 47,295 -9.8%603000 Supplies -Instructional Materials 7,368 12,070 16,000 32.6%810000 Equipment Replacements 380 - - 0.0%820000 Equipment Additions - 1,600 - -100.0%
Total Other Expenditures 122,327 130,171 127,230 -2.3%
TOTAL 141.00 132.00 132.00 8,956,272$ 8,735,074$ 9,135,996$ 4.6%
*NOTE: In FY 2012, re-allocated 1 Clerical position from Office of the Principal (Program 141)
Positions

221
Actual Approved Approved% Increase/
DecreaseObject # DESCRIPTION 2011 2012 2013 2011 2012 2013 over 2012
Wages and Employee Benefits113000 Other Professionals (Include Visiting Teachers) * 21.00 23.00 23.00 1,195,135$ 1,103,112$ 1,289,629$ 16.9%
152100 Long-Term Substitutes - - - 0.0%
162100 Stipends 28,555 35,508 35,508 0.0%
Total Wages 21.00 23.00 23.00 1,223,690 1,138,620 1,325,137 16.4%
Employee Benefits 335,202 368,550 440,423 19.5%Total Wages and Employee Benefits 1,558,893 1,507,170 1,765,560 17.1%
Other Expenditures300000 Purchased Services - - - 0.0%
550100 Local Travel 318 8,140 8,140 0.0%600000 Supplies - General 2,829 2,850 2,850 0.0%
Total Other Expenditures $3,147 10,990 10,990 0.0%
Total 21.00 23.00 23.00 1,562,040$ 1,518,160$ 1,776,550$ 17.0%
*Note: In FY 2012, re-coded 4 School Social Worker positions from Flow Through Funds (Funded positions with Special Education teacher positions)
PositionsVisiting Teachers and School Social Workers Program 122

222
Actual Approved Approved% Increase/
DecreaseObject # DESCRIPTION 2011 2012 2013 2011 2012 2013 over 2012
Wages and Employee Benefits111000 Administrators * 17.25 17.25 16.25 1,531,682$ 1,300,940$ 1,322,456$ 1.7%111300 Associate Superintendents 1.00 1.00 1.00 121,297 120,401 128,829 7.0%112000 Teachers (Contracts) * 15.00 10.00 10.00 773,854 619,241 618,048 -0.2%112100 Teachers (Hourly) 217,509 257,661 228,926 -11.2%114100 Paraprofessionals (Hourly) - - - 0.0%113000 Other Professionals 3.00 4.00 4.00 181,236 199,899 213,892 7.0%113600 Other Professionals (Hourly) - 40,000 - -100.0%115000 Clerical 11.00 10.00 10.00 324,361 345,554 352,464 2.0%115200 Teachers Assistants (Part-Time) - - - 0.0%115600 Clerical (Hourly) 31,362 45,336 46,243 2.0%152000 Substitute Teachers (Daily) 4,364 29,980 30,580 2.0%162100 Stipends 45,768 113,938 113,938 0.0%
Total Wages 47.25 42.25 41.25 3,231,433 3,072,950 3,055,376 -0.6%Employee Benefits 758,229 811,655 880,263 8.5%Total Wages and Employee Benefits 3,989,662 3,884,605 3,935,639 1.3%
Other Expenditures300000 Purchased Services 948,766 918,230 912,201 -0.7%527000 Cell Phones 5 - - 0.0%540000 Leases and Rentals 14,992 23,800 24,800 4.2%550100 Local Travel 20,485 23,150 23,150 0.0%551000 Out-of-Town Travel Meals & Lodging 14,639 38,590 35,702 -7.5%552000 Out-of-Town Travel Transportation 12,267 30,841 31,341 1.6%553000 Out-of-Town Travel Registration 13,505 19,060 23,520 23.4%555000 Staff Development 143,004 199,550 182,962 -8.3%580000 Organizational Memberships 50,851 40,854 58,454 43.1%600000 Supplies - General 400,984 558,887 434,013 -22.3%603000 Supplies -Instructional Materials 998 1,000 1,950 95.0%810000 Equipment Replacements 25,266 34,881 32,881 -5.7%820000 Equipment Additions 6,397 3,200 - -100.0%
Total Other Expenditures 1,652,161 1,892,043 1,760,974 -6.9%
TOTAL 47.25 42.25 41.25 5,641,823$ 5,776,648$ 5,696,613$ -1.4%*Note: Re-classified a Teacher Specialist position to a Senior Teacher Specialist position
Instructional Support Services - Program 131 Positions

223
Media Services - Program 132 Actual Approved Approved% Increase/
Decrease
Object # DESCRIPTION 2011 2012 2013 2011 2012 2013 over 2012Wages and Employee Benefits
111000 Administrators 2.00 1.00 1.00 155,809$ 85,001$ 90,951$ 7.0%112000 Teachers (Contract) 54.00 52.00 52.00 2,923,450 2,863,685 2,976,665 3.9%112100 Teachers (Hourly) 14,638 400 4,249 962.3%113000 Other Professionals 1.00 - - 49,713 - - 0.0%115000 Clerical 3.00 3.00 3.00 75,892 94,334 100,937 7.0%115100 Teacher Assistants 42.00 25.50 25.50 842,561 512,210 556,970 8.7%152100 Substitute Teachers (Long-Term) 52,400 54,159 55,242 2.0%162100 Stipends 12,420 13,696 13,696 0.0%
Total Wages 102.00 81.50 81.50 4,126,883 3,623,485 3,798,710 4.8%Employee Benefits 1,161,261 1,191,033 1,328,165 11.5%Total Wages and Employee Benefits 5,288,144 4,814,518 5,126,875 6.5%
Other Expenditures300000 Purchased Services 164,163 107,737 103,991 -3.5%550100 Local Travel 1,461 1,930 1,930 0.0%551000 Out-of-Town Travel Meals & Lodging 549 1,000 700 -30.0%552000 Out-of-Town Travel Transportation 380 620 500 -19.4%553000 Out-of-Town Travel Registration 1,220 - 500 100.0%555000 Staff Development - 1,000 1,000 0.0%585000 Student Field Trips - 683 250 -63.4%600000 Supplies - General 59,624 79,783 64,081 -19.7%603000 Supplies -Instructional Materials 516,952 552,670 552,673 0.0%810000 Equipment Replacements 217,902 205,050 205,050 0.0%
Total Other Expenditures 962,252 950,473 930,675 -2.1%
TOTAL 102.00 81.50 81.50 6,250,396$ 5,764,991$ 6,057,550$ 5.1%
Positions

224
Office of the Principal - Program 141 Actual Approved Approved% Increase/
DecreaseObject # DESCRIPTION 2011 2012 2013 2011 2012 2013 over 2012
Wages and Employee Benefits112000 Center Leader 1.00 1.00 1.00 71,807$ 71,107$ 76,084$ 7.0%112600 Principals 50.00 49.00 49.00 4,517,671 4,338,138 4,626,398 6.6%112700 Assistant Principals 50.00 53.00 53.00 3,492,526 3,576,622 3,769,099 5.4%113600 Other Professionals (Hourly) 40,041 - - 0.0%115000 Clerical * 132.00 111.00 111.00 3,827,808 3,367,878 3,602,600 7.0%115600 Clerical (Hourly) 119,680 89,308 85,994 -3.7%115800 Staff Overtime 84 50,000 51,000 2.0%162100 Stipends 152,439 173,664 173,664 0.0%
Total Wages 233.00 214.00 214.00 12,222,056 11,666,717 12,384,839 6.2%Employee Benefits 3,365,193 3,568,887 4,012,764 12.4%
Total Wages and Employee Benefits 15,587,249 15,235,604 16,397,603 7.6%Other Expenditures
300000 Purchased Services 120,491 138,475 136,075 -1.7%540000 Leases and Rentals 71,023 184,500 184,500 0.0%550100 Local Travel 1,769 6,400 6,400 0.0%551000 Out-of-Town Travel Meals & Lodging 731 270 270 0.0%552000 Out-of-Town Travel Transportation 327 269 269 0.0%553000 Out-of-Town Travel Registration 410 269 269 0.0%600000 Supplies - General 152,583 170,239 141,081 -17.1%810000 Equipment Replacements 154,262 18,100 18,100 0.0%
Total Other Expenditures 501,596 518,522 486,964 -6.1%
TOTAL 233.00 214.00 214.00 16,088,845$ 15,754,126$ 16,884,567$ 7.2%*Note: Re-allocated 1 clerical position to Guidance (Program 121) in 2012
Positions

225
Alternative Education - Program 170 Actual Approved Approved% Increase/
DecreaseObject # DESCRIPTION 2011 2012 2013 2011 2012 2013 over 2012
Wages and Employee Benefits111000 Administrators - - - -$ -$ -$ 0.0%112000 Teachers (Contract) 21.00 19.00 19.00 918,122 897,752 961,737 7.1%112100 Teachers (Hourly) - - - 0.0%113000 Other Professionals - - - - - - 0.0%115000 Clerical - - - - - - 0.0%115600 Clerical (Hourly) 485 1,500 1,530 2.0%115100 Teacher Assistants 2.00 - - - - - 0.0%
152000 Substitute Teachers (Daily) 9,741 6,760 6,895 2.0%
152100 Substitute Teachers (Long-Term) 7,928 66,977 68,317 2.0%Total Wages 23.00 19.00 19.00 936,276 972,989 1,038,479 6.7%Employee Benefits 248,040 330,230 368,864 11.7%Total Wages and Employee Benefits 1,184,316 1,303,219 1,407,343 8.0%
Other Expenditures300000 Purchased Services 117 90,000 38,000 -57.8%527000 Cell Phones - - - 0.0%550100 Local Travel 154 - - 0.0%551000 Out-of-Town Travel Meals & Lodging - - - 0.0%552000 Out-of-Town Travel Transportation - - - 0.0%553000 Out-of-Town Travel Registration - - - 0.0%555000 Staff Development - - - 0.0%600000 Supplies - General 107 2,000 2,000 0.0%602000 Textbooks - 8,000 8,000 0.0%603000 Supplies -Instructional Materials 9,276 16,806 10,600 -36.9%604000 Technology Software/On-Line Content - - 19,975 100.0%810000 Equipment Replacement - - - 0.0%810500 Furniture Replacement - - - 0.0%
Total Other Expenditures 9,654 116,806 78,575 -32.7%TOTAL 23.00 19.00 19.00 1,193,971$ 1,420,025$ 1,485,918$ 4.6%
Positions

226
Special Education - Program 200 Actual Approved Approved% Increase/
DecreaseObject # DESCRIPTION 2011 2012 2013 2011 2012 2013 over 2012
Wages and Employee Benefits111000 Administrators 9.00 10.00 9.00 768,565$ 774,284$ 711,624$ -8.1%112000 Teachers (Contract) * 395.08 394.00 393.00 19,584,583 19,044,430 19,838,860 4.2%112100 Teachers (Hourly) 261,805 363,836 115,949 -68.1%113000 Other Professionals * - - - 149,343 54,348 - -100.0%115000 Clerical 8.00 8.00 6.00 263,019 279,049 224,043 -19.7%115100 Teacher Assistants 227.00 227.00 194.00 4,583,939 3,914,102 3,623,077 -7.4%115200 Teacher Assistants (Hourly) 1,766 1,445 1,020 -29.4%115600 Clerical (Hourly) 1,890 3,900 3,978 2.0%115800 Staff Over-Time 844 - - 0.0%152000 Substitute Teachers (Daily) 124,889 187,016 176,242 -5.8%152100 Substitute Teachers (Long-Term) 232,113 315,262 321,567 2.0%162100 Stipends 210,429 353,692 307,252 -13.1%
Total Wages 639.08 639.00 602.00 26,183,187 25,291,364 25,323,612 0.1%Employee Benefits 7,632,028 8,913,657 9,360,154 5.0%Total Wages and Employee Benefits 33,815,215 34,205,021 34,683,766 1.4%
Other Expenditures300000 Purchased Services^ 876,538 961,650 895,217 -6.9%540000 Leases and Rentals 4,999 5,000 5,000 0.0%550100 Local Travel 43,082 74,642 74,642 0.0%551000 Out-of-Town Travel Meals & Lodging 20,992 11,397 13,522 18.6%552000 Out-of-Town Travel Transportation 10,276 7,329 7,629 4.1%553000 Out-of-Town Travel Registration 13,423 14,188 14,888 4.9%555000 Staff Development 22,745 32,514 35,214 8.3%560000 Norfolk Interagency Consortium 300,000 300,000 300,000 0.0%580000 Organizational Membership 1,894 1,500 1,500 0.0%585000/485000 Student Travel and Field Trips 61 16,400 20,900 27.4%600000 Supplies - General 295,892 142,491 149,266 4.8%602000 Textbooks - Existing Adoption - - - 0.0%603000 Supplies -Instructional Materials 42,891 119,600 102,725 -14.1%604000 Technology Software/On-Line Content - - 10,000 100.0%700000 Regional Education Programs (SECEP) 6,288,522 6,970,486 6,670,486 -4.3%810000 Equipment Replacements^ 28,662 30,314 29,574 -2.4%820000 Equipment Additions^ 528,647 110,710 - -100.0%820500 New Furniture 21,257 - - 0.0%
Total Other Expenditures 8,499,880 8,798,221 8,330,563 -5.3%
TOTAL 639.08 639.00 602.00 42,315,095$ 43,003,242$ 43,014,329$ 0.0%*Note: In FY 2012, added 5 Speech Language Pathlogists positions; Re-coded 7 positions for Social Workers and Psychologists; Converted 1 position^Note: Additional dollars spent to ensure that district met Maintenance of Effort required by federal government to be in compliance with IDEA VI-B (2012)
Positions
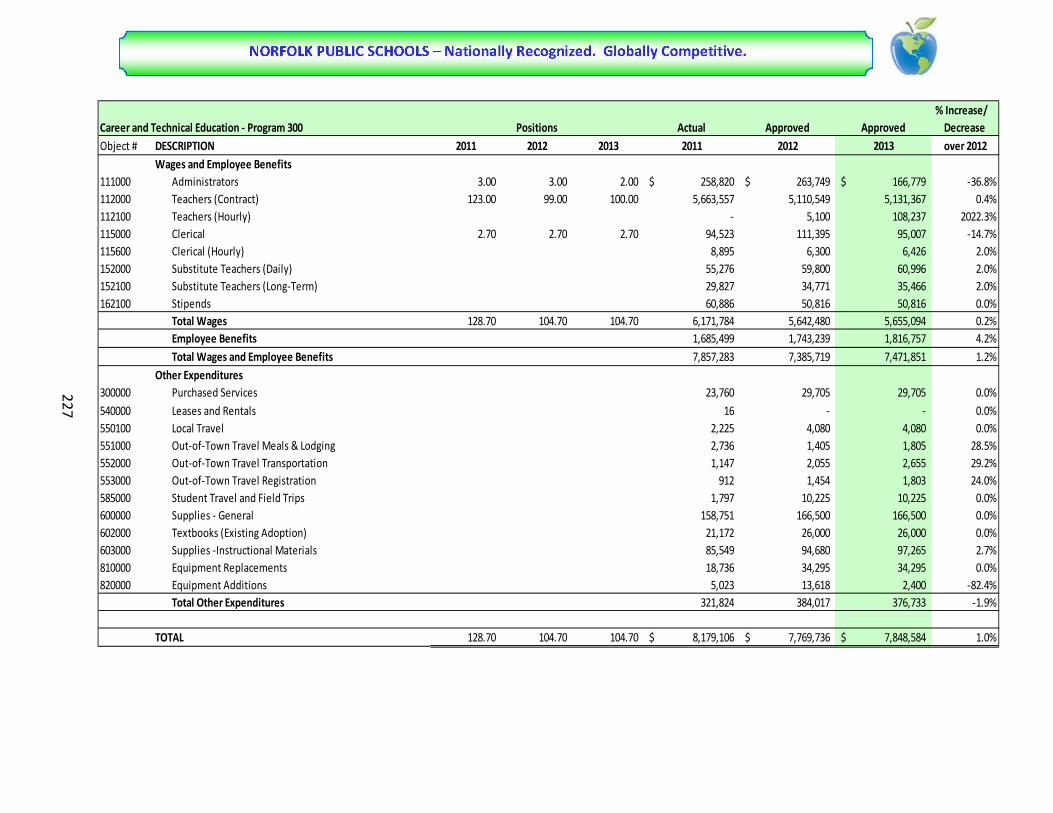
227
Actual Approved Approved% Increase/
DecreaseObject # DESCRIPTION 2011 2012 2013 2011 2012 2013 over 2012
Wages and Employee Benefits111000 Administrators 3.00 3.00 2.00 258,820$ 263,749$ 166,779$ -36.8%112000 Teachers (Contract) 123.00 99.00 100.00 5,663,557 5,110,549 5,131,367 0.4%112100 Teachers (Hourly) - 5,100 108,237 2022.3%115000 Clerical 2.70 2.70 2.70 94,523 111,395 95,007 -14.7%115600 Clerical (Hourly) 8,895 6,300 6,426 2.0%152000 Substitute Teachers (Daily) 55,276 59,800 60,996 2.0%152100 Substitute Teachers (Long-Term) 29,827 34,771 35,466 2.0%162100 Stipends 60,886 50,816 50,816 0.0%
Total Wages 128.70 104.70 104.70 6,171,784 5,642,480 5,655,094 0.2%Employee Benefits 1,685,499 1,743,239 1,816,757 4.2%Total Wages and Employee Benefits 7,857,283 7,385,719 7,471,851 1.2%
Other Expenditures300000 Purchased Services 23,760 29,705 29,705 0.0%540000 Leases and Rentals 16 - - 0.0%550100 Local Travel 2,225 4,080 4,080 0.0%551000 Out-of-Town Travel Meals & Lodging 2,736 1,405 1,805 28.5%552000 Out-of-Town Travel Transportation 1,147 2,055 2,655 29.2%553000 Out-of-Town Travel Registration 912 1,454 1,803 24.0%585000 Student Travel and Field Trips 1,797 10,225 10,225 0.0%600000 Supplies - General 158,751 166,500 166,500 0.0%602000 Textbooks (Existing Adoption) 21,172 26,000 26,000 0.0%603000 Supplies -Instructional Materials 85,549 94,680 97,265 2.7%810000 Equipment Replacements 18,736 34,295 34,295 0.0%820000 Equipment Additions 5,023 13,618 2,400 -82.4%
Total Other Expenditures 321,824 384,017 376,733 -1.9%
TOTAL 128.70 104.70 104.70 8,179,106$ 7,769,736$ 7,848,584$ 1.0%
PositionsCareer and Technical Education - Program 300
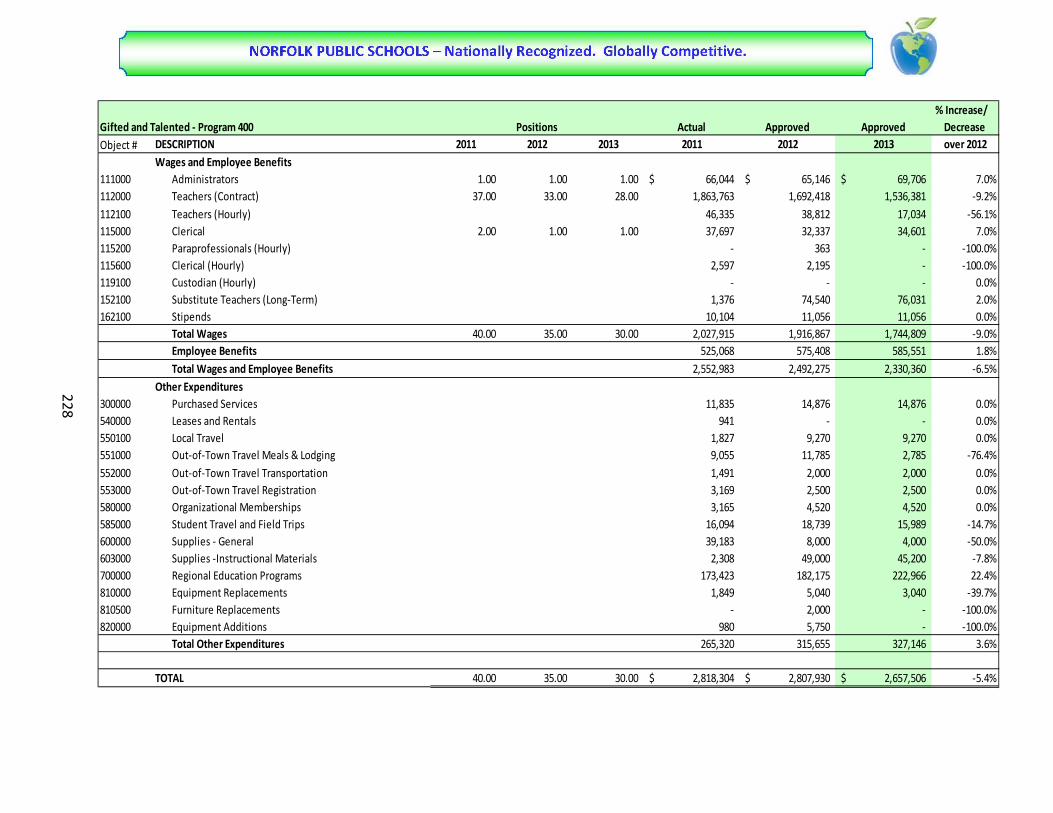
228
Gifted and Talented - Program 400 Actual Approved Approved% Increase/
DecreaseObject # DESCRIPTION 2011 2012 2013 2011 2012 2013 over 2012
Wages and Employee Benefits111000 Administrators 1.00 1.00 1.00 66,044$ 65,146$ 69,706$ 7.0%112000 Teachers (Contract) 37.00 33.00 28.00 1,863,763 1,692,418 1,536,381 -9.2%112100 Teachers (Hourly) 46,335 38,812 17,034 -56.1%115000 Clerical 2.00 1.00 1.00 37,697 32,337 34,601 7.0%115200 Paraprofessionals (Hourly) - 363 - -100.0%115600 Clerical (Hourly) 2,597 2,195 - -100.0%119100 Custodian (Hourly) - - - 0.0%152100 Substitute Teachers (Long-Term) 1,376 74,540 76,031 2.0%162100 Stipends 10,104 11,056 11,056 0.0%
Total Wages 40.00 35.00 30.00 2,027,915 1,916,867 1,744,809 -9.0%Employee Benefits 525,068 575,408 585,551 1.8%Total Wages and Employee Benefits 2,552,983 2,492,275 2,330,360 -6.5%
Other Expenditures300000 Purchased Services 11,835 14,876 14,876 0.0%540000 Leases and Rentals 941 - - 0.0%550100 Local Travel 1,827 9,270 9,270 0.0%551000 Out-of-Town Travel Meals & Lodging 9,055 11,785 2,785 -76.4%552000 Out-of-Town Travel Transportation 1,491 2,000 2,000 0.0%553000 Out-of-Town Travel Registration 3,169 2,500 2,500 0.0%580000 Organizational Memberships 3,165 4,520 4,520 0.0%585000 Student Travel and Field Trips 16,094 18,739 15,989 -14.7%600000 Supplies - General 39,183 8,000 4,000 -50.0%603000 Supplies -Instructional Materials 2,308 49,000 45,200 -7.8%700000 Regional Education Programs 173,423 182,175 222,966 22.4%810000 Equipment Replacements 1,849 5,040 3,040 -39.7%810500 Furniture Replacements - 2,000 - -100.0%820000 Equipment Additions 980 5,750 - -100.0%
Total Other Expenditures 265,320 315,655 327,146 3.6%
TOTAL 40.00 35.00 30.00 2,818,304$ 2,807,930$ 2,657,506$ -5.4%
Positions

229
Athletics and VHSL Activities - Program 500 Actual Approved Approved% Increase/
Decrease
Object # DESCRIPTION 2011 2012 2013 2011 2012 2013 over 2012Wages and Employee Benefits
111000 Administrators * - 1.00 1.00 -$ 75,523$ 80,810$ 7.0%112000 Teachers (Contract) * 6.00 5.00 5.00 372,089 288,198 297,616 3.3%112100 Teachers (Hourly) 16,792 34,968 30,090 -13.9%152000 Substitute Teachers (Daily) - - - 0.0%162100 Stipends-Athletics 665,627 618,499 618,499 0.0%
Total Wages 6.00 6.00 6.00 1,054,509 1,017,188 1,027,015 1.0%Employee Benefits 157,227 178,592 170,390 -4.6%Total Wages and Employee Benefits 1,211,736 1,195,780 1,197,405 0.1%
Other Expenditures300000 Purchased Services 197,563 186,219 206,209 10.7%540000 Leases and Rentals 10,147 8,709 11,996 37.7%550000 Administrative Travel - - - 0.0%550100 Local Travel 1,176 3,960 3,960 0.0%551000 Out-of-Town Travel Meals & Lodging 771 1,200 1,200 0.0%552000 Out-of-Town Travel Transportation 738 450 450 0.0%553000 Out-of-Town Travel Registration - - - 0.0%580000 Organizational Memberships 8,345 9,500 8,000 -15.8%600000 Supplies - General 16,079 6,192 9,860 59.2%810000 Equipment Replacements 7,063 10,263 7,000 -31.8%820000 Equipment Additions 16,193 26,000 - -100.0%821000 New Equipment - - - 0.0%901000 Fund Transfers to Schools 290,275 349,970 349,970 0.0%
Total Other Expenditures 548,350 602,463 598,645 -0.6%
TOTAL 6.00 6.00 6.00 1,760,086$ 1,798,243$ 1,796,050$ -0.1%*Note: Teacher Specialist position reclassified to Senior Coordinator position
Positions

230
Actual Approved Approved% Increase/
DecreaseObject # DESCRIPTION 2011 2012 2013 2011 2012 2013 over 2012
Wages and Employee Benefits112000 Teachers (Contract) 466$ -$ -$ 0.0%112100 Teachers (Hourly) 652,597 643,375 453,527 -29.5%114100 Technology (Hourly) - 100,771 102,786 2.0%114300 Security officers (Hourly) 11,336 45,460 25,548 -43.8%115200 Paraprofessionals (Hourly) 38,859 99,584 101,576 2.0%115600 Clerical (Hourly) 15,613 51,712 52,746 2.0%152000 Daily Substitutes 2,380 - - 0.0%162100 Non-Exempt Stipend 109,736 104,559 104,559 0.0%
Total Wages 830,987 1,045,461 840,742 -19.6%Employee Benefits 62,690 79,978 64,317 -19.6%Total Wages and Employee Benefits 893,677 1,125,439 905,059 -19.6%
Other Expenditures300000 Purchased Services 125,365 5,333 333 -93.8%540000 Leases and Rentals 25,000 25,000 25,000 0.0%552000 Travel-Transportation 2,111 - - 0.0%600000 Supplies - General 24,892 8,833 8,833 0.0%603000 Supplies -Instructional Materials 56,596 216,177 209,858 -2.9%
Total Other Expenditures 233,965 255,343 244,024 -4.4%
TOTAL 1,127,642$ 1,380,782$ 1,149,083$ -16.8%
Other Extra-Curricular - Program 510 Positions
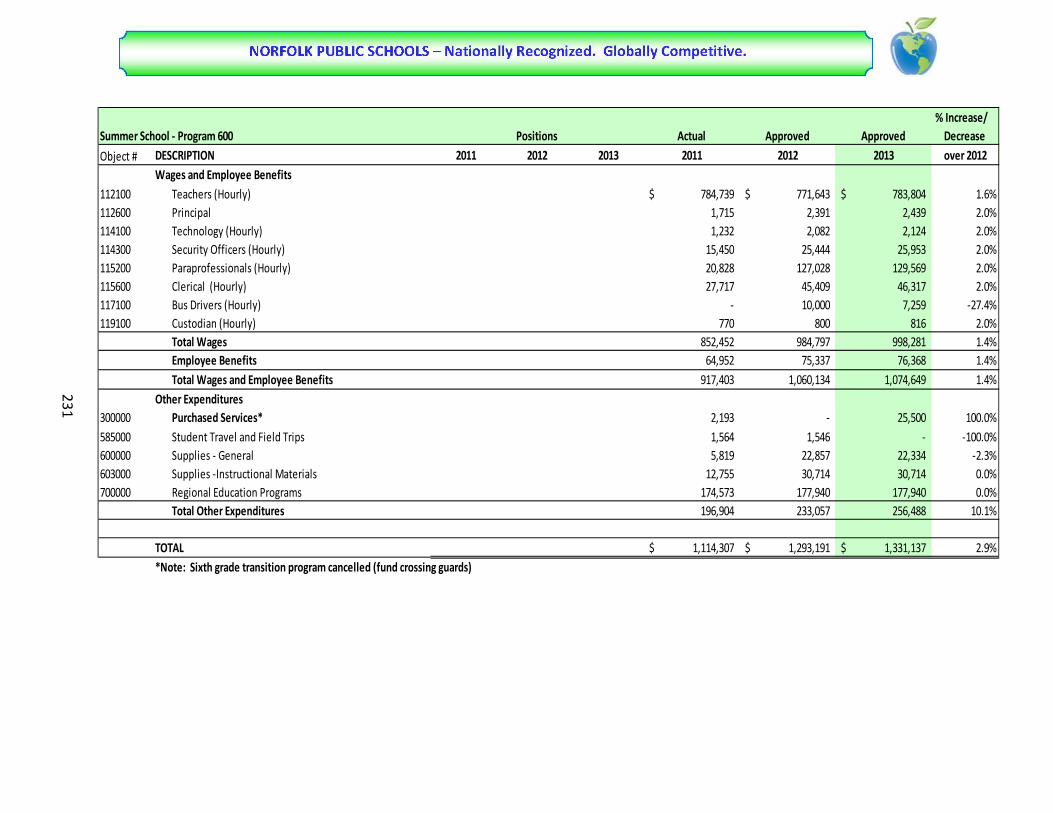
231
Summer School - Program 600 Actual Approved Approved% Increase/
Decrease
Object # DESCRIPTION 2011 2012 2013 2011 2012 2013 over 2012Wages and Employee Benefits
112100 Teachers (Hourly) 784,739$ 771,643$ 783,804$ 1.6%112600 Principal 1,715 2,391 2,439 2.0%114100 Technology (Hourly) 1,232 2,082 2,124 2.0%114300 Security Officers (Hourly) 15,450 25,444 25,953 2.0%115200 Paraprofessionals (Hourly) 20,828 127,028 129,569 2.0%115600 Clerical (Hourly) 27,717 45,409 46,317 2.0%117100 Bus Drivers (Hourly) - 10,000 7,259 -27.4%119100 Custodian (Hourly) 770 800 816 2.0%
Total Wages 852,452 984,797 998,281 1.4%Employee Benefits 64,952 75,337 76,368 1.4%Total Wages and Employee Benefits 917,403 1,060,134 1,074,649 1.4%
Other Expenditures300000 Purchased Services* 2,193 - 25,500 100.0%585000 Student Travel and Field Trips 1,564 1,546 - -100.0%600000 Supplies - General 5,819 22,857 22,334 -2.3%603000 Supplies -Instructional Materials 12,755 30,714 30,714 0.0%700000 Regional Education Programs 174,573 177,940 177,940 0.0%
Total Other Expenditures 196,904 233,057 256,488 10.1%
TOTAL 1,114,307$ 1,293,191$ 1,331,137$ 2.9%*Note: Sixth grade transition program cancelled (fund crossing guards)
Positions

232
Adult Education - Program 700 Actual Approved Approved% Increase/
Decrease
Object # DESCRIPTION 2011 2012 2013 2011 2012 2013 over 2012Wages and Employee Benefits
111000 Administrators 2.00 2.00 2.00 118,200$ 148,031$ 167,087$ 12.9%112000 Teachers (Contract) - - - 0.0%112100 Teachers (Hourly) 249,812 298,735 304,710 2.0%113000 Other Professionals 1.00 1.00 1.00 43,609 42,809 45,806 7.0%114100 Technology (Hourly) - - - 0.0%115000 Clerical 1.00 1.00 1.00 33,613 19,866 21,257 7.0%115100 Teacher Assistants 21,600 - - 0.0%115600 Clerical (Hourly) 16,850 21,728 22,163 2.0%162100 Stipends 993 11,430 11,430 0.0%
Total Wages 4.00 4.00 4.00 484,676 542,599 572,453 5.5%Employee Benefits 74,608 92,488 103,411 11.8%Total Wages and Employee Benefits 559,284 635,087 675,864 6.4%
Other Expenditures300000 Purchased Services 13,703 15,750 15,750 0.0%550100 Mileage 430 - - 0.0%600000 Supplies - General 8,815 10,430 10,430 0.0%602000 Textbooks - Existing Adoption 1,010 5,000 5,000 0.0%810000 Equipment Replacements 5,000 8,150 8,150 0.0%
Total Other Expenditures 28,957 39,330 39,330 0.0%
TOTAL 4.00 4.00 4.00 588,241$ 674,417$ 715,194$ 6.0%
Positions

233
Non-Regular Day School - Program 800 Actual Approved Approved% Increase/
Decrease
Object # DESCRIPTION 2011 2012 2013 2011 2012 2013 over 2012Wages and Employee Benefits
111000 Administrators 1.00 1.00 1.00 111,186$ 92,750$ 99,243$ 7.0%112000 Teachers (Contract) 113.00 113.00 108.00 5,497,692 5,500,620 5,701,944 3.7%112100 Teachers (Hourly) 4,490 19,440 17,026 -12.4%115000 Clerical 3.00 3.00 2.00 191,647 83,138 59,306 -28.7%115100 Teacher Assistants 122.00 122.00 105.00 2,012,907 2,043,388 1,863,119 -8.8%115200 Teachers Assistants (Hourly) 1,689 23,160 7,000 -69.8%115600 Clerical (Hourly) - - - 0.0%115800 Staff Overtime 957 - - 0.0%152000 Substitute Teachers (Daily) 65,329 89,510 91,096 1.8%152100 Substitute Teachers (Long-Term) 70,200 39,490 40,280 2.0%162100 Stipends 46,861 65,426 65,426 0.0%
Total Wages 239.00 239.00 216.00 8,002,958 7,956,922 7,944,440 -0.2%Employee Benefits 2,898,165 2,918,673 3,161,969 8.3%Total Wages and Employee Benefits 10,901,124 10,875,595 11,106,409 2.1%
Other Expenditures300000 Contract Services 14,648 9,652 4,227 -56.2%540000 Leases and Rentals 1,176 4,066 6,814 67.6%550100 Local Travel 2,105 - - 0.0%551000 Travel- Meals and Lodging - - - 0.0%552000 Travel- Transportation - - - 0.0%553000 Travel- Registration 90 - - 0.0%555000 Staff Development 12,621 1,000 15,600 1460.0%585000 Student Travel and Field Trips 39,611 43,500 42,500 -2.3%600000 Supplies - General 30,203 5,375 25,672 377.6%603000 Supplies -Instructional Materials 121,646 58,200 41,075 -29.4%810000 Equipment Replacements 1,944 4,318 4,267 -1.2%820000 Equipment Additions - 4,318 - -100.0%
Total Other Expenditures 224,044 130,429 140,155 7.5%
TOTAL 239.00 239.00 216.00 11,125,168$ 11,006,024$ 11,246,564$ 2.2%
Positions

234
Central Administration - Program D21 Actual Approved Approved% Increase/
DecreaseObject # DESCRIPTION 2011 2012 2013 2011 2012 2013 over 2012
Wages and Employee Benefits111000 Administrators 10.00 9.00 9.00 919,998$ 825,183$ 877,422$ 6.3%111100 Board Members 22,769 23,000 23,460 2.0%111200 Superintendent 1.00 1.00 1.00 189,933 200,000 214,000 7.0%111300 Associate Superintendents 3.00 3.00 3.00 371,812 357,678 382,715 7.0%113000 Other Professionals * 28.00 29.00 27.00 1,682,780 1,634,107 1,769,417 8.3%114000 Paraprofessionals 10.00 10.00 10.00 376,937 367,556 398,037 8.3%114100 Paraprofessionals (Hourly) 1,122 8,400 7,671 -8.7%114300 Security Officers (Part-Time) 2,374 3,940 4,019 2.0%115000 Clerical 44.00 43.00 40.00 1,586,782 1,580,664 1,581,170 0.0%115600 Clerical (Hourly) 86,493 92,591 76,551 -17.3%115800 Staff Overtime - - - 0.0%162100 Stipends 29,329 35,954 35,954 0.0%
Total Wages 96.00 95.00 90.00 5,270,330 5,129,073 5,370,416 4.7%Employee Benefits 1,318,431 1,892,642 2,073,891 9.6%Total Wages and Employee Benefits 6,588,761 7,021,715 7,444,307 6.0%
Other Expenditures300000 Purchased Services 1,471,318 968,201 893,754 -7.7%311710 Equipment Maintenance Contracts - Copier Clicks - - 70,000 100.0%525000 Postage 82,858 239,866 240,726 0.4%526000 Telephone - 1,500 1,500 0.0%527000 Cell Phones 684 - - 0.0%540000 Leases and Rentals 70,901 2,350 2,350 0.0%550000 Administrative Travel 20,791 3,650 3,650 0.0%550100 Local Travel 2,898 15,390 15,890 3.2%551000 Out-of-Town Travel Meals & Lodging 51,089 74,035 64,106 -13.4%552000 Out-of-Town Travel Transportation 20,345 40,490 31,815 -21.4%553000 Out-of-Town Travel Registration 26,397 27,350 28,800 5.3%555000 Staff Development 6,091 15,440 15,400 -0.3%580000 Organizational Memberships 81,794 85,580 112,980 32.0%585000 Student Travel and Field Trips 311 - - 0.0%600000 Supplies - General 316,655 376,325 352,875 -6.2%605000 Technology Equipment - NonCapitalized - - 2,000 100.0%810000 Equipment Replacements 21,788 494,390 340,890 -31.0%810500 Furniture Replacement 12,391 9,500 9,500 0.0%820000 Equipment Additions 18,657 7,000 7,000 0.0%820500 New Furniture - 4,500 3,500 -22.2%901100 Fund Balance Transfer - - - 0.0%
Total Other Expenditures 2,204,967 2,365,567 2,196,736 -7.1%
TOTAL 96.00 95.00 90.00 8,793,728$ 9,387,282$ 9,641,043$ 2.7%*NOTE: 1 Network Engineer and 1 Paraprofessional position moved from Program D80 in 2012
Positions

235
Actual Approved Approved% Increase/
DecreaseObject # DESCRIPTION 2011 2012 2013 2011 2012 2013 over 2012
Wages and Employee Benefits111000 Administrators 1.00 1.00 1.00 90,917$ 89,921$ 96,215$ 7.0%112100 Teachers (Hourly) 277,207 257,295 262,951 2.2%113000 Other Professionals* 13.00 12.00 2.00 665,635 755,798 164,903 -78.2%113100 Nurse 1.00 - - 58,132 - - 0.0%113200 Psychologist * 21.00 25.00 23.00 1,298,500 1,288,205 1,457,670 13.2%113400 Physical Therapists* - - 8.00 - - 516,833 100.0%113500 Occupational Therapists* - - 2.00 - - 131,616 100.0%114000 Paraprofessional 6.00 6.00 6.00 106,777 104,998 112,349 7.0%115000 Clerical * 6.00 6.00 6.00 220,108 208,574 189,686 -9.1%115600 Clerical (Hourly) 21,547 16,840 16,810 -0.2%162100 Stipends 38,180 42,626 42,625 0.0%
Total Wages 48.00 50.00 48.00 2,777,002 2,764,257 2,991,658 8.2%Employee Benefits 687,637 833,702 949,074 13.8%Total Wages and Employee Benefits 3,464,639 3,597,959 3,940,732 9.5%
Other Expenditures300000 Purchased Services 82,169 116,856 1,627,256 1292.5%527000 Cell Phones - - - 0.0%540000 Leases and Rentals 378 - - 0.0%550100 Local Travel 1,882 4,650 4,650 0.0%551000 Out-of-Town Travel Meals & Lodging 1,005 3,563 3,563 0.0%552000 Out-of-Town Travel Transportation 1,132 500 500 0.0%553000 Out-of-Town Travel Registration - 1,195 1,195 0.0%555000 Staff Development 72 2,000 10,320 416.0%600000 Supplies - General 33,187 40,605 40,605 0.0%810000 Equipment Replacements 7,297 - - 0.0%810500 Furniture Replacement - - - 0.0%820000 Equipment Additions - 12,422 12,422 0.0%820500 New Furniture - - - 0.0%
Total Other Expenditures 127,122 181,791 1,700,511 835.4%
TOTAL 48.00 50.00 48.00 3,591,762$ 3,779,750$ 5,641,243$ 49.2%*Note: 1 Lobby Admin Assistant funded with part-time positions in 2012; 4 Psychologists positions re-coded from Special Ed teacher positions; Created separate object code for Physical Therapists and Occupational Therapists - Recoded from Other Professional
Student Attendance and Health Services - Program D22 Positions
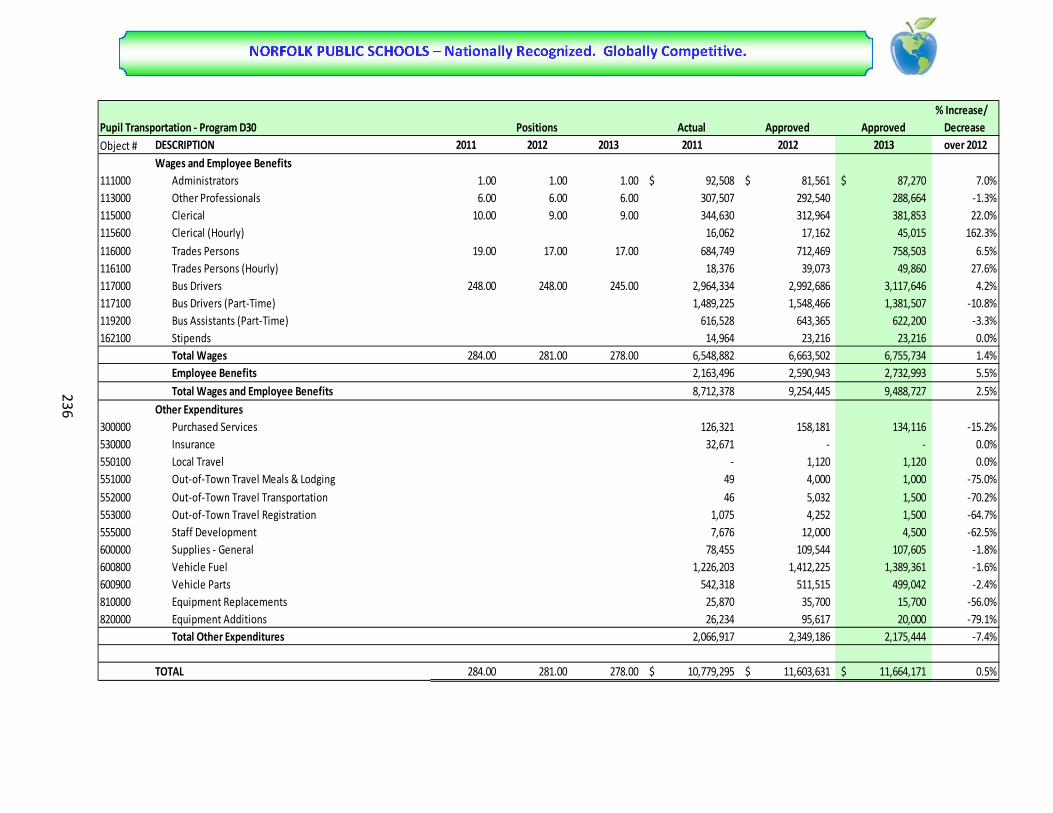
236
Pupil Transportation - Program D30 Actual Approved Approved% Increase/
DecreaseObject # DESCRIPTION 2011 2012 2013 2011 2012 2013 over 2012
Wages and Employee Benefits111000 Administrators 1.00 1.00 1.00 92,508$ 81,561$ 87,270$ 7.0%113000 Other Professionals 6.00 6.00 6.00 307,507 292,540 288,664 -1.3%115000 Clerical 10.00 9.00 9.00 344,630 312,964 381,853 22.0%115600 Clerical (Hourly) 16,062 17,162 45,015 162.3%116000 Trades Persons 19.00 17.00 17.00 684,749 712,469 758,503 6.5%116100 Trades Persons (Hourly) 18,376 39,073 49,860 27.6%117000 Bus Drivers 248.00 248.00 245.00 2,964,334 2,992,686 3,117,646 4.2%117100 Bus Drivers (Part-Time) 1,489,225 1,548,466 1,381,507 -10.8%119200 Bus Assistants (Part-Time) 616,528 643,365 622,200 -3.3%162100 Stipends 14,964 23,216 23,216 0.0%
Total Wages 284.00 281.00 278.00 6,548,882 6,663,502 6,755,734 1.4%Employee Benefits 2,163,496 2,590,943 2,732,993 5.5%Total Wages and Employee Benefits 8,712,378 9,254,445 9,488,727 2.5%
Other Expenditures300000 Purchased Services 126,321 158,181 134,116 -15.2%530000 Insurance 32,671 - - 0.0%550100 Local Travel - 1,120 1,120 0.0%551000 Out-of-Town Travel Meals & Lodging 49 4,000 1,000 -75.0%552000 Out-of-Town Travel Transportation 46 5,032 1,500 -70.2%553000 Out-of-Town Travel Registration 1,075 4,252 1,500 -64.7%555000 Staff Development 7,676 12,000 4,500 -62.5%600000 Supplies - General 78,455 109,544 107,605 -1.8%600800 Vehicle Fuel 1,226,203 1,412,225 1,389,361 -1.6%600900 Vehicle Parts 542,318 511,515 499,042 -2.4%810000 Equipment Replacements 25,870 35,700 15,700 -56.0%820000 Equipment Additions 26,234 95,617 20,000 -79.1%
Total Other Expenditures 2,066,917 2,349,186 2,175,444 -7.4%
TOTAL 284.00 281.00 278.00 10,779,295$ 11,603,631$ 11,664,171$ 0.5%
Positions
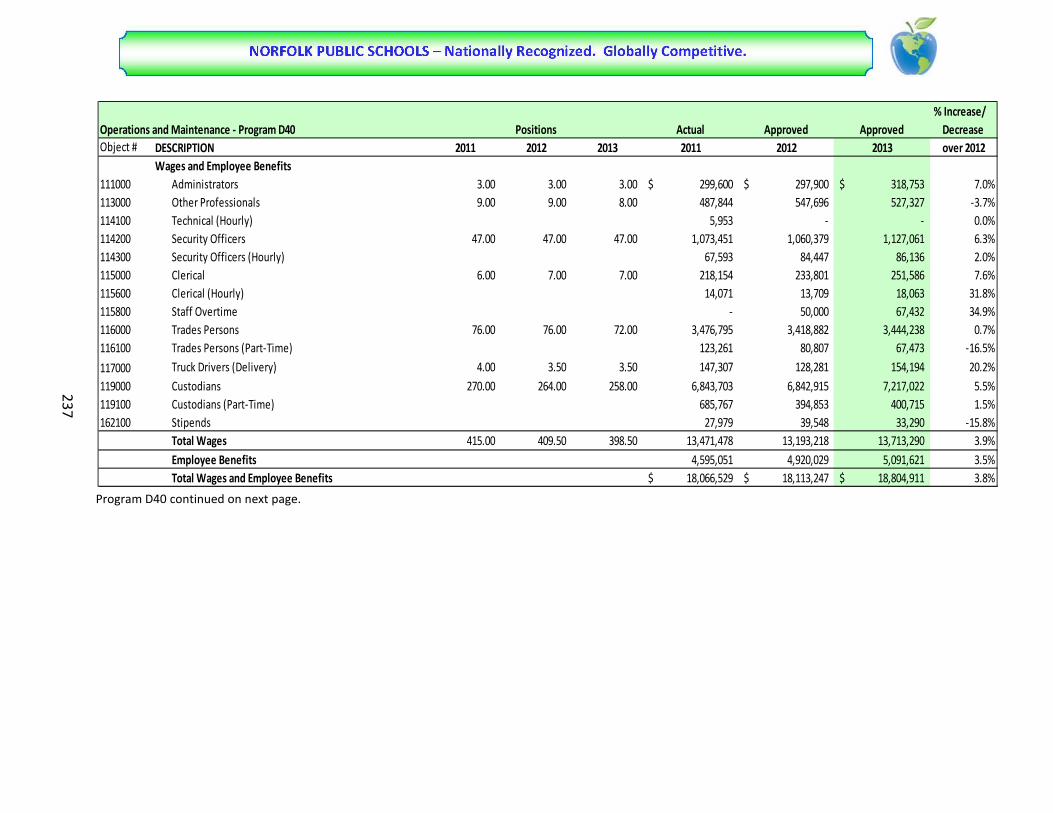
237
Program D40 continued on next page.
Operations and Maintenance - Program D40 Actual Approved Approved% Increase/
DecreaseObject # DESCRIPTION 2011 2012 2013 2011 2012 2013 over 2012
Wages and Employee Benefits111000 Administrators 3.00 3.00 3.00 299,600$ 297,900$ 318,753$ 7.0%113000 Other Professionals 9.00 9.00 8.00 487,844 547,696 527,327 -3.7%114100 Technical (Hourly) 5,953 - - 0.0%114200 Security Officers 47.00 47.00 47.00 1,073,451 1,060,379 1,127,061 6.3%114300 Security Officers (Hourly) 67,593 84,447 86,136 2.0%115000 Clerical 6.00 7.00 7.00 218,154 233,801 251,586 7.6%115600 Clerical (Hourly) 14,071 13,709 18,063 31.8%115800 Staff Overtime - 50,000 67,432 34.9%116000 Trades Persons 76.00 76.00 72.00 3,476,795 3,418,882 3,444,238 0.7%116100 Trades Persons (Part-Time) 123,261 80,807 67,473 -16.5%
117000 Truck Drivers (Delivery) 4.00 3.50 3.50 147,307 128,281 154,194 20.2%119000 Custodians 270.00 264.00 258.00 6,843,703 6,842,915 7,217,022 5.5%119100 Custodians (Part-Time) 685,767 394,853 400,715 1.5%162100 Stipends 27,979 39,548 33,290 -15.8%
Total Wages 415.00 409.50 398.50 13,471,478 13,193,218 13,713,290 3.9%Employee Benefits 4,595,051 4,920,029 5,091,621 3.5%Total Wages and Employee Benefits 18,066,529$ 18,113,247$ 18,804,911$ 3.8%
Positions

238
Operations and Maintenance - Program D40 (continued) Actual Approved Approved% Increase/
Decrease
Object # DESCRIPTION 2011 2012 2013 2011 2012 2012 over 2012
Other Expenditures300000 Purchased Services 4,461,087$ 2,883,065$ 3,227,295$ 11.9%511000 Electricity 4,779,349 6,000,000 5,750,000 -4.2%512000 Natural Gas and Fuel Oil 2,031,096 2,247,942 2,247,942 0.0%513000 Water, Sanitation, and Trash Disposal 1,129,489 800,000 800,000 0.0%525000 Communications - Postage/Courier 120,638 - - 0.0%526000 Communications - Telephone 235,245 562,361 550,998 -2.0%527000 Cell Phones 236,069 289,075 292,549 1.2%530000 Insurance 1,576,202 1,593,914 1,678,000 5.3%540000 Leases and Rentals 2,064 12,940 3,440 -73.4%550100 Local Travel 1,069 3,440 3,440 0.0%551000 Out-of-Town Travel Meals & Lodging 997 1,769 1,138 -35.7%552000 Out-of-Town Travel Transportation 358 1,500 2,000 33.3%553000 Out-of-Town Travel Registration 790 2,700 1,300 -51.9%555000 Staff Development 1,369 9,375 8,900 -5.1%580000 Organizational Memberships 1,889 2,100 1,900 -9.5%600000 Supplies - General 180,229 247,442 286,546 15.8%600500 Custodial Supplies 673 42,164 33,431 -20.7%600700 Building Materials and Supplies 1,808,159 461,000 91,067 -80.2%600800 Vehicle Fuel 113,921 232,523 232,523 0.0%600900 Vehicle Parts 78,141 117,651 123,000 4.5%810000 Equipment Replacements 19,683 230,446 552,271 139.7%811500 Vehicle Replacement 90,133 - - 0.0%820000 Equipment Additions 53,462 26,283 17,527 -33.3%821500 Vehicle Additions - - - 0.0%830500 Building Improvements/Acquisitions 199,650 - - 0.0%
Total Other Expenditures 17,121,763 15,767,690 15,905,267 0.9%TOTAL 415.00 409.50 398.50 35,188,292$ 33,880,937$ 34,710,178$ 2.4%
Positions
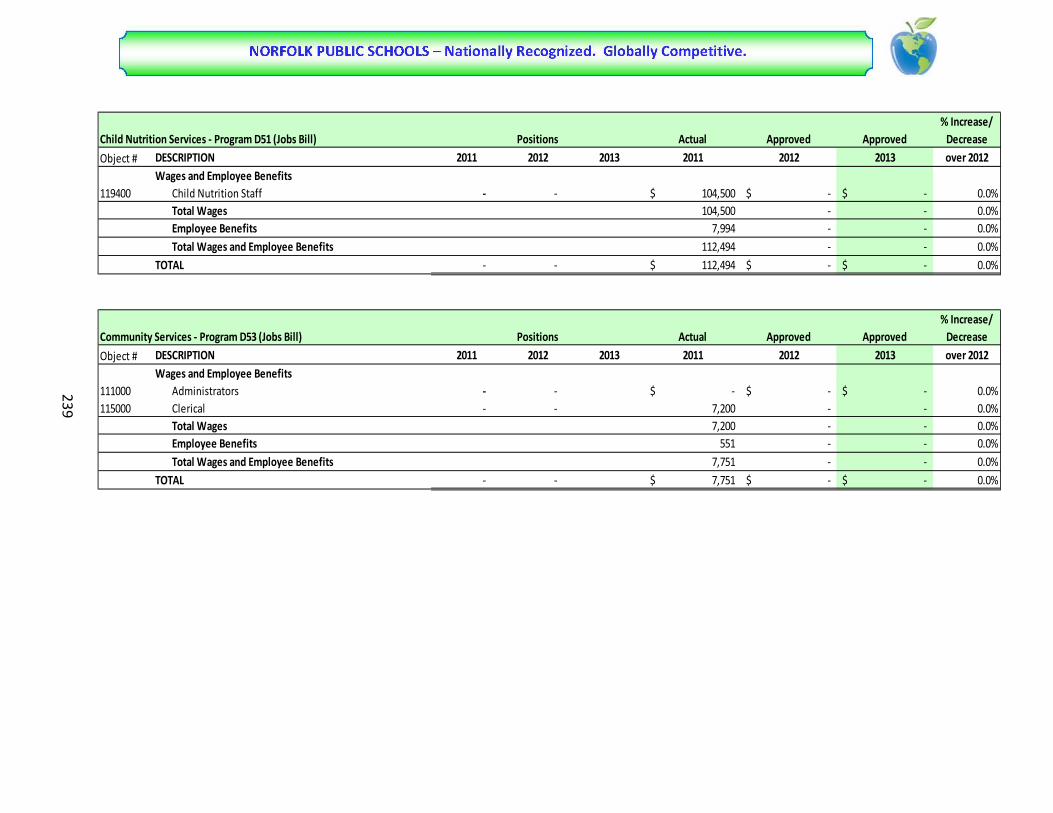
239
Child Nutrition Services - Program D51 (Jobs Bill) Actual Approved Approved% Increase/
Decrease
Object # DESCRIPTION 2011 2012 2013 2011 2012 2013 over 2012Wages and Employee Benefits
119400 Child Nutrition Staff - - 104,500$ -$ -$ 0.0%Total Wages 104,500 - - 0.0%Employee Benefits 7,994 - - 0.0%Total Wages and Employee Benefits 112,494 - - 0.0%
TOTAL - - 112,494$ -$ -$ 0.0%
Community Services - Program D53 (Jobs Bill) Actual Approved Approved% Increase/
Decrease
Object # DESCRIPTION 2011 2012 2013 2011 2012 2013 over 2012Wages and Employee Benefits
111000 Administrators - - -$ -$ -$ 0.0%115000 Clerical - - 7,200 - - 0.0%
Total Wages 7,200 - - 0.0%Employee Benefits 551 - - 0.0%Total Wages and Employee Benefits 7,751 - - 0.0%
TOTAL - - 7,751$ -$ -$ 0.0%
Positions
Positions

240
Facility Improvements - Program D66 Actual Approved Approved% Increase/
DecreaseObject # DESCRIPTION 2011 2012 2013 2011 2012 2013 over 2012
Other Expenditures300000 Purchased Services 52,306$ 100,000$ 100,000$ 0.0%830500 Building Acquisition and Improvements 1,362,808 1,300,000 1,300,000 0.0%901000 Transfer to: City of Norfolk - - - 0.0%910000 Debt Service: Principal Payments 156,900 156,900 156,900 0.0%920000 Debt Service: Interest Payments 40,937 87,965 87,965 0.0%
TOTAL 1,612,951$ 1,644,865$ 1,644,865$ 0.0%
Positions

241
Information Technology - Program D80 Actual Approved Approved% Increase/
Decrease
Object # DESCRIPTION 2011 2012 2013 2011 2012 2013 over 2012Wages and Employee Benefits
111000 Administrators 1.00 1.00 1.00 87,903$ 87,303$ 93,414$ 7.0%112000 Teachers (Contracts) - - - - - - 0.0%112100 Teachers (Hourly) - - - 0.0%113000 Other Professionals 15.00 14.00 14.00 967,586 977,515 917,939 -6.1%114000 Network Engineers/Paraprofessionals* 42.00 41.00 41.00 1,923,130 1,917,678 1,998,045 4.2%114100 Technicians (Hourly) 173,542 150,034 224,435 49.6%115000 Clerical 5.00 5.00 5.00 151,508 191,521 197,992 3.4%115600 Clerical (Hourly) - - - 0.0%162100 Stipends 2,297 7,496 7,496 0.0%
Total Wages 63.00 61.00 61.00 3,305,965 3,331,547 3,439,321 3.2%Employee Benefits 860,599 1,003,369 1,097,921 9.4%Total Wages and Employee Benefits 4,166,565 4,334,916 4,537,242 4.7%
Other Expenditures300000 Purchased Services 2,246,302 1,531,849 1,416,599 -7.5%526000 Telecommunications 192,910 202,044 202,044 0.0%527000 Cell Phones 35 - - 0.0%540000 Leases and Tentals 393 3,850 3,850 0.0%550000 Administrative - - - 0.0%550100 Local Travel 6,078 5,795 5,795 0.0%551000 Out-of-Town Travel Meals & Lodging 12,255 22,325 5,000 -77.6%552000 Out-of-Town Travel Transportation 1,438 2,141 2,141 0.0%553000 Out-of-Town Travel Registration 2,845 25,533 5,000 -80.4%555000 Staff Development - - - 0.0%600000 Supplies 130,925 233,675 108,675 -53.5%700000 Regional Education Programs (WHRO) 62,350 62,350 62,350 0.0%810000 Equipment Replacements 210,272 71,269 1,629,269 2186.1%820000 Equipment Additions 276,283 361,339 361,339 0.0%820500 New Furniture - - - 0.0%830500 Building Improvements - - - 0.0%
Total Other Expenditures 3,142,087 2,522,170 3,802,062 50.7%
TOTAL 63.00 61.00 61.00 7,308,652$ 6,857,086$ 8,339,304$ 21.6%*Note: 1 Network Engineer position and 1 Paraprofessional position transferred to Program D21 in 2012
Positions

242
FEDERAL GRANT FUNDTITLE I, PART A - IMPROVING BASIC PROGRAMS
FUND: 3CH1Positions Positions Actual Approved Proposed
ACCOUNT DESCRIPTION 2012 2013 2011 2012 2013Wages and Employee Benefits:
111000 Administrators 12.00 12.00 390,551$ 421,175$ 421,175$ 112000 Teachers 99.00 99.00 1,866,196 3,359,388 3,359,388 112100 Part-Time Teachers 319,165 662,173 662,173 113600 Part-Time Other Professionals - 4,000 4,000 114000 Technical - - - 114300 Part-Time Security Officers - - - 115000 Clerical 4.00 4.00 178,252 72,198 72,198 115100 Teachers Assistants 58.00 58.00 605,225 715,670 715,670 115200 Part-Time Teacher Assistants 27,441 129,829 129,829 115600 Part-Time Clerical 2,065 47,260 47,260 119000 Custodians 2.00 2.00 52,633 46,211 46,211 119100 Part-Time Service/Custodians 4,624 700 700 152000 Daily Substitutes 46,685 88,500 88,500 152100 Long-Term Substitutes 12,229 - - 162100 Stipends 8,223 62,566 62,566
Total Wages 175.00 175.00 3,513,289 5,609,670 5,609,670 200000 Employee Benefits 1,319,988 1,738,403 1,738,403
Total Wages and Employee Benefits 175.00 175.00 4,833,277 7,348,073 7,348,073 Other Expenditures:
300000 Contract Services 1,069,602 3,517,091 3,517,091 500000 Utilities 34,853 68,000 68,000 520000 Communications - 11,828 11,828 540000 Leases/Rents 1,787 14,364 14,364 550000 Out-of-Town Travel/Staff Development 42,389 747,897 747,897 485000 Student Travel/Field Trips 109,493 1,005,307 1,005,307 585100 Student Incentives 15,297 15,297 589000 Miscellaneous-Other 9,000 9,000 600000 Supplies 56,133 2,483,636 2,483,636 600200 Food - 10,000 10,000 600500 Custodial & Building Materials - 4,000 4,000 600700 Repair & Maintenance Materials - 5,000 5,000 603000 Instructional Supplies 103,206 719,598 719,598 604000 Technology Software - 130,752 130,752 605000 Technology Equipment Non-Capitalized - 413,700 413,700 800000 Equipment 5,967 - - 501000 Indirect Costs - 496,528 496,528
Total Other Expenditures 1,423,430 9,651,998 9,651,998 ARRA Funds - - 9,940,991 - -
TOTAL 175.00 175.00 6,256,707$ 17,000,071$ 17,000,071$
Note: Federal Stimulus Funds awarded for FY10 and FY11 period ended September 30, 2011.
Grant Description
Title I is the largest source of federal assistance to local school divisions and is authorized by the Improving America's School Act of 1994 . The No Child Left Behind (NCLB) Act of 2001reauthorized the Elementary and Secondary Education Act of 1965 . Title I funds are allocated to school districts according to the district's concentrations of children from low incomefamilies (free/reduced lunch count). Funds are used to supplement regular instructional activities and make available services designed to enrich and accelerate the core curriculum ineligible schools in order to help all children move toward achieving high state performance standards.

243
FUND: 3SIGPositions Positions Actual Approved Proposed
ACCOUNT DESCRIPTION 2012 2013 2011 2012 2013Wages and Employee Benefits:
112000 Teachers 2.00 - 81,778$ 116,676$ -$ 112100 Part-Time Teachers 33,182 34,160 - 115000 Secretaries and Clerks - - - 115100 Teacher Assistants 1.00 - 14,170 22,164 - 152000 Daily Substitutes 2,080 - -
Total Wages 3.00 - 131,210 173,000 - 200000 Employee Benefits 29,317 43,725 -
Total Wages and Employee Benefits 3.00 - 160,527 216,725 - Other Expenditures:
300000 Contract Services 16,855 29,508 - 550000 Out-of-Town Travel/Staff Development 5,090 15,000 - 600000 Supplies 32,731 53,050 - 800000 Equipment 20,352 36,933 - 501000 Indirect Costs 6,241 - -
Total Other Expenditures - - 81,268 134,491 -
TOTAL 3.00 - 241,794$ 351,216$ -$
Grant Description
TITLE I, PART A - SCHOOL IMPROVEMENT FUNDS 1003(a)FEDERAL GRANT FUND
A one-year 1003(a) School Improvement Grant (NCLB, Title I, Part A). Grant Authority: Public Law 107-110, Elementary and Secondary Education Act, As Amended. These funds are awarded to assist schools and school divisions in coordinating the delivery of research-based federal, state and local school reform initiatives that support teaching and learning in high poverty, low-achieving schools.
Jacox and Lindenwood Elementary Schools received 1003(a) funds. Both schools have used these funds to hire a School Improvement Coach, to provide professional development for teachers, to purchase materials, supplies and equipment as needed and to hire part-time teachers to provide additional instructional support. The revised grant award for fiscal year 2010-2011 was $377,916. Total expenditures as of June 30, 2011 are $241,794.
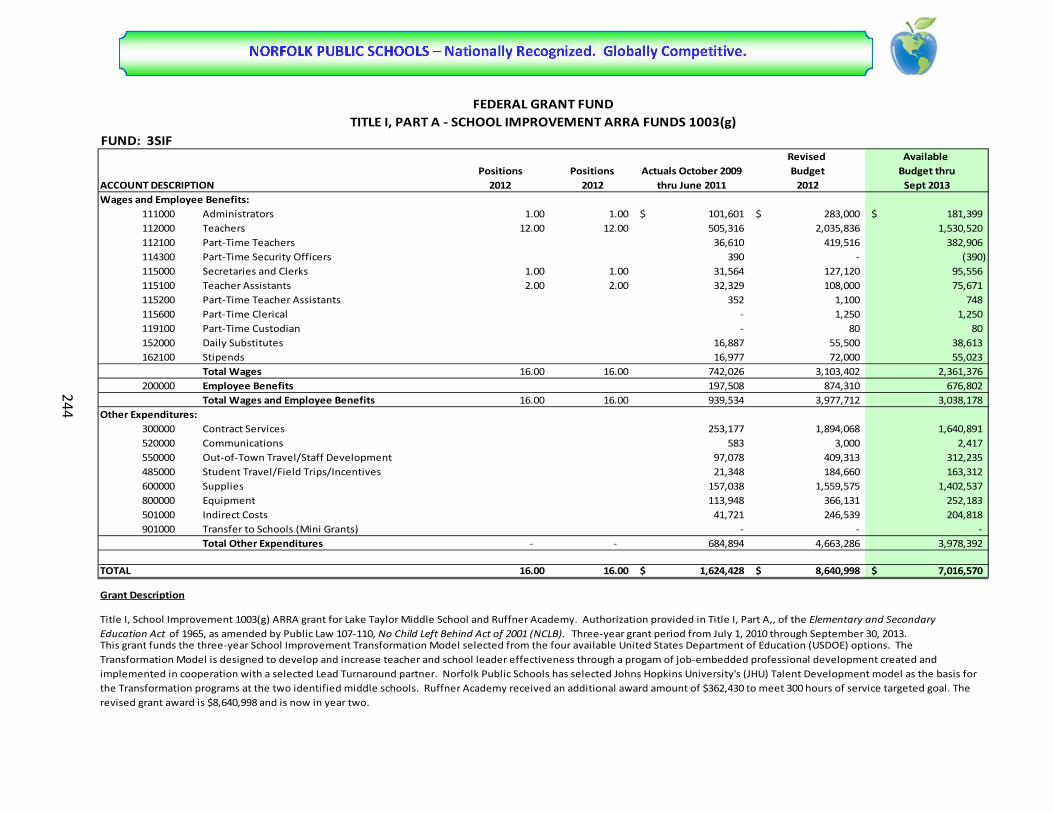
244
FUND: 3SIFRevised Available Budget Budget thru
ACCOUNT DESCRIPTION 2012 2012 2012 Sept 2013Wages and Employee Benefits:
111000 Administrators 1.00 1.00 101,601$ 283,000$ 181,399$ 112000 Teachers 12.00 12.00 505,316 2,035,836 1,530,520 112100 Part-Time Teachers 36,610 419,516 382,906 114300 Part-Time Security Officers 390 - (390) 115000 Secretaries and Clerks 1.00 1.00 31,564 127,120 95,556 115100 Teacher Assistants 2.00 2.00 32,329 108,000 75,671 115200 Part-Time Teacher Assistants 352 1,100 748 115600 Part-Time Clerical - 1,250 1,250 119100 Part-Time Custodian - 80 80 152000 Daily Substitutes 16,887 55,500 38,613 162100 Stipends 16,977 72,000 55,023
Total Wages 16.00 16.00 742,026 3,103,402 2,361,376 200000 Employee Benefits 197,508 874,310 676,802
Total Wages and Employee Benefits 16.00 16.00 939,534 3,977,712 3,038,178 Other Expenditures:
300000 Contract Services 253,177 1,894,068 1,640,891 520000 Communications 583 3,000 2,417 550000 Out-of-Town Travel/Staff Development 97,078 409,313 312,235 485000 Student Travel/Field Trips/Incentives 21,348 184,660 163,312 600000 Supplies 157,038 1,559,575 1,402,537 800000 Equipment 113,948 366,131 252,183 501000 Indirect Costs 41,721 246,539 204,818 901000 Transfer to Schools (Mini Grants) - - -
Total Other Expenditures - - 684,894 4,663,286 3,978,392
TOTAL 16.00 16.00 1,624,428$ 8,640,998$ 7,016,570$
Grant Description
This grant funds the three-year School Improvement Transformation Model selected from the four available United States Department of Education (USDOE) options. The Transformation Model is designed to develop and increase teacher and school leader effectiveness through a progam of job-embedded professional development created and implemented in cooperation with a selected Lead Turnaround partner. Norfolk Public Schools has selected Johns Hopkins University's (JHU) Talent Development model as the basis for the Transformation programs at the two identified middle schools. Ruffner Academy received an additional award amount of $362,430 to meet 300 hours of service targeted goal. The revised grant award is $8,640,998 and is now in year two.
FEDERAL GRANT FUNDTITLE I, PART A - SCHOOL IMPROVEMENT ARRA FUNDS 1003(g)
Title I, School Improvement 1003(g) ARRA grant for Lake Taylor Middle School and Ruffner Academy. Authorization provided in Title I, Part A,, of the Elementary and Secondary Education Act of 1965, as amended by Public Law 107-110, No Child Left Behind Act of 2001 (NCLB). Three-year grant period from July 1, 2010 through September 30, 2013.
Actuals October 2009 thru June 2011
Positions Positions

245
FEDERAL GRANT FUNDTITLE I, PART D, SUBPART 2 - PREVENTION AND INTERVENTION PROGRAM for CHILDREN
WHO ARE NEGLECTED , DELINQUENT, OR AT-RISK FUND: 3CH4
Positions Positions Actual Approved ProposedACCOUNT DESCRIPTION 2012 2013 2011 2012 2013Wages and Employee Benefits:
112000 Teachers 1.00 1.00 53,439$ 49,800$ 49,800$ 112100 Part-Time Teachers 13,793 8,640 8,640 115000 Secretaries and Clerks 1.00 1.00 - 25,000 25,000 115100 Teacher Assistants - - 2,465 - - 152000 Daily Substitutes - - - 162100 Stipends 729 - -
Total Wages 2.00 2.00 70,426 83,440 83,440 200000 Employee Benefits 15,415 34,634 34,634
Total Wages and Employee Benefits 2.00 2.00 85,841 118,074 118,074 Other Expenditures:
300000 Contract Services 500 - - 550000 Out-of-Town Travel/Staff Development 2,996 - - 600000 Supplies - - - 501000 Indirect Costs - 3,526 3,526
Total Other Expenditures - - 3,496 3,526 3,526 ARRA Funds - - 49,155 - -
TOTAL 2.00 2.00 138,492$ 121,600$ 121,600$
Note: Federal Stimulus ARRA award period ended September 30, 2011.
Grant Description
Prevention and Intervention Programs for Children and Youth Who are Neglected, Delinquent, or At-Risk is a formula grant that provides funding to support school districts' programsinvolving collaboration with locally operated correctional facilities. Monies allocated to the division are authorized by Title I, Part D of the Elementary and Secondary Education Act of1965 (ESEA) , as amended by the No Child Left Behind Act of 2001 . Funds are spent at the Norfolk Detention Center to provide a continuum of educational services for middle and highschool students at risk of dropping out of school. These services include basic and accelerated skill instruction, vocational training, character education, GED preparation and testing, anda support system to assist with successful transition back to the student's home school. Funds are employed to upgrade existing technology, expand the instructional program, andprovide the staff with research-based professional development opportunities. No local match is required.

246
FEDERAL GRANT FUNDTITLE II PART A - TEACHER AND PRINCIPAL TRAINING
FUND: 3TPTPositions Positions Actual Approved Proposed
ACCOUNT DESCRIPTION 2012 2013 2011 2012 2013Wages and Employee Benefits:
112000 Teachers 17.00 17.00 650,442$ 1,025,000$ 1,025,000$ 112100 Part-Time Teachers - - 115200 Part-Time Teacher Assistants - - 119100 Part-Time Service/Custodian - - 152000 Daily Substitutes 4,408 34,955 34,955 152100 Long-Term Substitutes - - 162100 Stipends - -
Total Wages 17.00 17.00 654,850 1,059,955 1,059,955 200000 Employee Benefits 214,399 370,984 370,984
Total Wages and Employee Benefits 17.00 17.00 869,249 1,430,939 1,430,939 Other Expenditures:
300000 Contract Services 18,386 438,197 438,197 550000 Out-of-Town Travel/Staff Development 21,746 273,434 273,434 600000 Supplies - 59,700 59,700 501000 Indirect Costs - 39,957 39,957
Total Other Expenditures 40,132 811,288 811,288
TOTAL 17.00 17.00 909,381$ 2,242,227$ 2,242,227$
Grant Description
The purpose of Title II, Part A of the No Child Left Behind Act of 2001 is to increase student academic achievement by improving teacher and principal quality and by increasing thenumber of highly qualified teachers and administrators. Title II, Part A incorporates the funding formerly allocated through the Class Size Reduction Grant and the Dwight D. EisenhowerProfessional Development Program. In Norfolk, Title ll, Part A funds will be used to staff Coaches to provide professional development, coaching and modeling of best practices andinstructional strategies for teachers and administrators.

247
FEDERAL GRANT FUNDTITLE III, PART A - LIMITED ENGLISH PROFICIENT and IMMIGRANT/YOUTH
FUND: 3LEP and 3IMGPositions Positions Actual Approved Proposed
ACCOUNT DESCRIPTION 2012 2013 2011 2012 2013Wages and Employee Benefits:
112000 Teachers - - -$ -$ -$ 112100 Part-Time Teachers 39,117 38,680 38,680 115600 Part-Time Clerical - 18,000 18,000
Total Wages - - 39,117 56,680 56,680 200000 Employee Benefits 2,578 4,337 4,337
Total Wages and Employee Benefits - - 41,695 61,017 61,017 Other Expenditures: -
300000 Contract Services 4,717 15,040 15,040 550000 Out-of-Town Travel/Staff Development 7,299 10,950 10,950 600000 Supplies 1,392 24,519 24,519 501000 Indirect Costs (based on salaries only) - 3,278 3,278 820000 New Equipment - Technology 1,500 1,500
Total Other Expenditures 13,408 55,287 55,287 -
TOTAL - - 55,103$ 116,304$ 116,304.00$
Grant Description
Title III is a sub grant designed to fund activities to support increasing the English proficiency of Limited English Proficient (LEP) students by providing high-quality language instructionand high-quality professional development to classroom teachers. As of June 30, 2011 total expenses for LEP is $55,103 and none for IMG. Fiscal year 2012 Limited English ProficientSubgrant is $70,396 and the Immigrant and Youth Subgrant is $45,908.
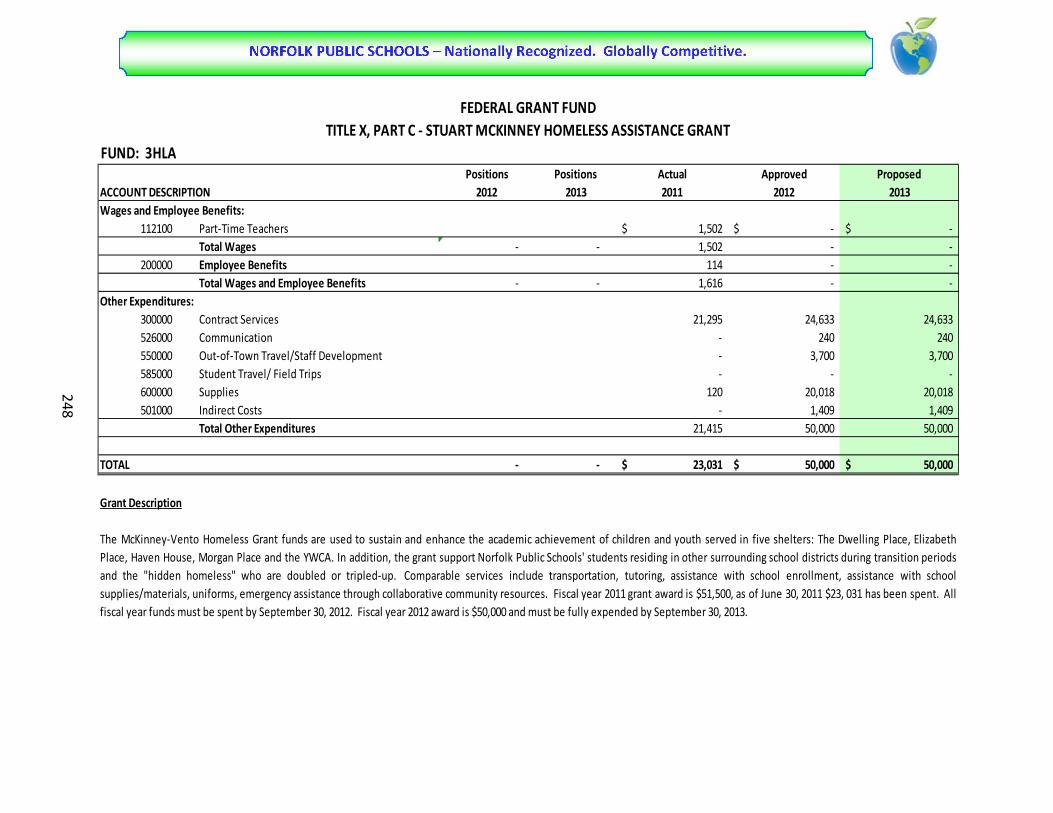
248
FEDERAL GRANT FUNDTITLE X, PART C - STUART MCKINNEY HOMELESS ASSISTANCE GRANT
FUND: 3HLAPositions Positions Actual Approved Proposed
ACCOUNT DESCRIPTION 2012 2013 2011 2012 2013Wages and Employee Benefits:
112100 Part-Time Teachers 1,502$ -$ -$ Total Wages - - 1,502 - -
200000 Employee Benefits 114 - - Total Wages and Employee Benefits - - 1,616 - -
Other Expenditures:300000 Contract Services 21,295 24,633 24,633 526000 Communication - 240 240 550000 Out-of-Town Travel/Staff Development - 3,700 3,700 585000 Student Travel/ Field Trips - - - 600000 Supplies 120 20,018 20,018 501000 Indirect Costs - 1,409 1,409
Total Other Expenditures 21,415 50,000 50,000
TOTAL - - 23,031$ 50,000$ 50,000$
Grant Description
The McKinney-Vento Homeless Grant funds are used to sustain and enhance the academic achievement of children and youth served in five shelters: The Dwelling Place, ElizabethPlace, Haven House, Morgan Place and the YWCA. In addition, the grant support Norfolk Public Schools' students residing in other surrounding school districts during transition periodsand the "hidden homeless" who are doubled or tripled-up. Comparable services include transportation, tutoring, assistance with school enrollment, assistance with schoolsupplies/materials, uniforms, emergency assistance through collaborative community resources. Fiscal year 2011 grant award is $51,500, as of June 30, 2011 $23, 031 has been spent. Allfiscal year funds must be spent by September 30, 2012. Fiscal year 2012 award is $50,000 and must be fully expended by September 30, 2013.

249
FEDERAL GRANT FUNDEVEN START PROGRAM at BERKLEY/CAMPOSTELLA EARLY CHILDHOOD CENTER
Positions Positions Actual Approved ProposedACCOUNT DESCRIPTION 2012 2013 2011 2012 2013Wages and Employee Benefits:
11100 Administrators 0.50 - 28,514$ 31,915$ -$ 112000 Teachers -$ -$ - 112100 Part-Time Teachers - 3,000 - 114000 Technical - - - 115100 Teacher Assistants 4.00 - 64,622 66,154 - 115200 Part-Time Teacher Assistant - - 1,500 - 152000 Daily Substitutes - - 2,131 1,000 -
Total Wages 4.50 - 95,268 103,569 - 200000 Employee Benefits 33,275 46,159 -
Total Wages and Employee Benefits 4.50 - 128,543 149,728 - Other Expenditures:
300000 Contract Services 8,000 16,556 - 550000 Out-of-Town Travel/Staff Development 7,210 14,769 - 485000 Student Travel/ Field Trips 5,493 7,500 - 600000 Supplies 26,458 49,316 - 820000 Equipment - 10,000 -
Total Other Expenditures 47,161 98,141 -
TOTAL 4.50 - 175,704$ 247,869$ -$
Grant Description
FUND: 3ESP
Title I, Part B of the Elementary and Secondary Education Act of 1965 as amended by Public Law 103-382 authorizes the Even Start Family Literacy Program, which was enacted to helpbreak the cycle of poverty and illiteracy by improving the educational opportunities of low income families. Norfolk's Even Start, located at the Berkley/Campostella Early ChildhoodCenter, provides adult education, parenting education, and high quality early childhood education to participating families in an integrated family literacy program. Additionally, a fullrange of services that include health and social services, career training, and job placement are extended to eligible families with children from birth to three years of age. Thiscompetitive grant is awarded for a period of four years and will end September 30, 2012.

250
FEDERAL GRANT FUNDEVEN START PROGRAM at INGLESIDE
Positions Positions Actual Approved Proposed
ACCOUNT DESCRIPTION 2012 2013 2011 2012 2013
Wages and Employee Benefits:111000 Administrators 0.20 - -$ 12,614$ -$ 112000 Teachers 0.25 - 26,183$ 15,515 - 112100 Part-Time Teachers - 29,453 55,648 - 114000 Technical - - - 115100 Teacher Assistants 4.00 - 62,781 62,779 - 115200 Part-Time Teacher Assistants - - 7,173 - 115600 Part-Time Clerical - 1,601 3,931 -
Total Wages 4.45 - 120,018 157,660 - 200000 Employee Benefits 27,006 51,306 -
Total Wages and Employee Benefits 4.45 - 147,024 208,966 - Other Expenditures:
300000 Contract Services 8,500 6,000 - 550000 Out-of-Town Travel/Staff Development 4,333 8,500 - 585000 Student Travel/ Field Trips - 1,000 - 600000 Supplies 17,996 15,403 - 800000 Equipment - 8,000 -
Total Other Expenditures 30,829 38,903 -
TOTAL 4.45 - 177,853$ 247,869$ -$
Grant Description
FUND: 3ESK
The Norfolk (Ingleside) Even Start Program, formerly known as the Stuart Even Start Program, is the second of two Even Start grants awarded to Norfolk Public Schools under the WilliamF. Goodling Even Start Family Literacy Program of Title I, Part B, Subpart 3, reauthorized by the Literacy Involves Families Together (LIFT) Act of 2000 and the No Child Left Behind Act of2001 . Like the program at Berkley/Campostella, it supports the philosophy that the educational attainment of children and their parents is interrelated, and that improving the parent'sliteracy skills results in a positive effect on the educational experiences of their children. The program seeks to improve the educational opportunities of children and adults byintegrating four components of family literacy into a unified program. To do this, the Norfolk (Ingleside) Even Start Program builds on existing high quality community services to provide a cohesive program which includes adult basic education, parenting education, early childhood education, and interactive parent and child literacy activities (PACT). The 2011-2012school year marks the tenth year of this Even Start program. The required local match is currently 50%. The Even Start Program will end September 30, 2012.

251
FEDERAL GRANT FUNDTITLE VI, PART B - INDIVIDUALS WITH DISABILITIES EDUCATION ACT (FLOW-THROUGH)
FUND: 3FTFPositions Positions Actual Approved Proposed
ACCOUNT DESCRIPTION 2012 2013 2011 2012 2013Wages and Employee Benefits:
111000 Administrators - - -$ -$ -$ 112000 Teachers 59.00 59.00 110,755 2,614,803 2,614,803 112100 Part-Time Teachers - - - 113000 Other Professionals - - - - - 113200 Psychologist - - 3,775 - - 114000 Technical - - - - - 115000 Secretaries and Clerks 4.50 4.50 5,113 113,000 113,000 115100 Teachers Assistants 123.00 123.00 75,530 2,226,749 2,226,749 115200 Part-Time Teacher Assistants - - - 115600 Part-Time Clerical - - - 152000 Daily Substitutes 886 17,500 17,500 152100 Long-Term Substitutes 11,565 70,000 70,000 162100 Stipends 3,468 65,000 65,000
Total Wages 186.50 186.50 211,092 5,107,052 5,107,052 200000 Employee Benefits 73,018 1,887,181 1,887,181
Total Wages and Employee Benefits 186.50 186.50 284,110 6,994,233 6,994,233 Other Expenditures:
300000 Contract Services - 20,000 20,000 550000 Out-of-Town Travel - 7,000 7,000 555000 Staff Development - - - 580000 Organizational Memberships - - - 485000 Student Travel/ Field Trips - 10,000 10,000 600000 Supplies - 6,777 6,777 800000 Equipment - - - 810000 Equipment Replacements - - - 820000 Equipment Technology - - - 501000 Indirect Costs - 206,000 206,000
Total Other Expenditures - 249,777 249,777 ARRA Funds 2,657,428 - -
TOTAL 186.50 186.50 2,941,538$ 7,244,010$ 7,244,010$
Grant Description
The Individuals with Disabilities Education Act (IDEA) was created to implement, expand, and improve educational resources for children and youth with disabilities in public schools.Funding is included to help local schools develop and implement individualized educational plans (IEP) to meet the unique educational needs of children with disabilities. In Norfolk,these funds support the district special education program. The grant is used to fund teacher and paraprofessional salaries, purchase supplemental materials and equipment, and toprovide professional development activities for those who come into contact with disabled students. In accordance with federal regulations, local support of the special educationprogram is not diminished. Increases in federal funding of special education cannot be used to reduce local funding of the program.
Funds are used to provide instructional and support services for students with disabilities between 3 and 21 years of age. Project activities include special education teachers andparaprofessionals, purchase of instructional materials and equipment, and operation of the Parent Resource Center.
Note: Federal Stimulus Part 1 and Part II Budget of $4.15 million each included in Budget for FY 2010. The award period end September 30, 2011.
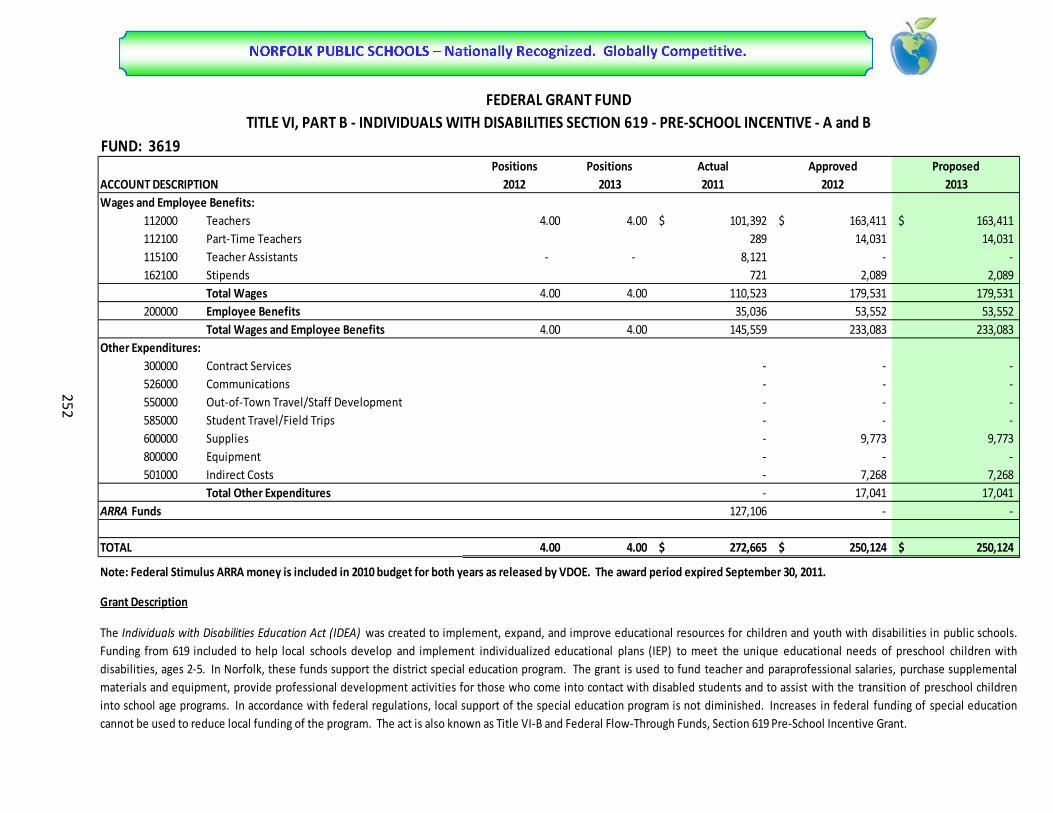
252
FEDERAL GRANT FUNDTITLE VI, PART B - INDIVIDUALS WITH DISABILITIES SECTION 619 - PRE-SCHOOL INCENTIVE - A and B
FUND: 3619Positions Positions Actual Approved Proposed
ACCOUNT DESCRIPTION 2012 2013 2011 2012 2013Wages and Employee Benefits:
112000 Teachers 4.00 4.00 101,392$ 163,411$ 163,411$ 112100 Part-Time Teachers 289 14,031 14,031 115100 Teacher Assistants - - 8,121 - - 162100 Stipends 721 2,089 2,089
Total Wages 4.00 4.00 110,523 179,531 179,531 200000 Employee Benefits 35,036 53,552 53,552
Total Wages and Employee Benefits 4.00 4.00 145,559 233,083 233,083 Other Expenditures:
300000 Contract Services - - - 526000 Communications - - - 550000 Out-of-Town Travel/Staff Development - - - 585000 Student Travel/Field Trips - - - 600000 Supplies - 9,773 9,773 800000 Equipment - - - 501000 Indirect Costs - 7,268 7,268
Total Other Expenditures - 17,041 17,041 ARRA Funds 127,106 - -
TOTAL 4.00 4.00 272,665$ 250,124$ 250,124$
Grant Description
Note: Federal Stimulus ARRA money is included in 2010 budget for both years as released by VDOE. The award period expired September 30, 2011.
The Individuals with Disabilities Education Act (IDEA) was created to implement, expand, and improve educational resources for children and youth with disabilities in public schools.Funding from 619 included to help local schools develop and implement individualized educational plans (IEP) to meet the unique educational needs of preschool children withdisabilities, ages 2-5. In Norfolk, these funds support the district special education program. The grant is used to fund teacher and paraprofessional salaries, purchase supplementalmaterials and equipment, provide professional development activities for those who come into contact with disabled students and to assist with the transition of preschool childreninto school age programs. In accordance with federal regulations, local support of the special education program is not diminished. Increases in federal funding of special educationcannot be used to reduce local funding of the program. The act is also known as Title VI-B and Federal Flow-Through Funds, Section 619 Pre-School Incentive Grant.
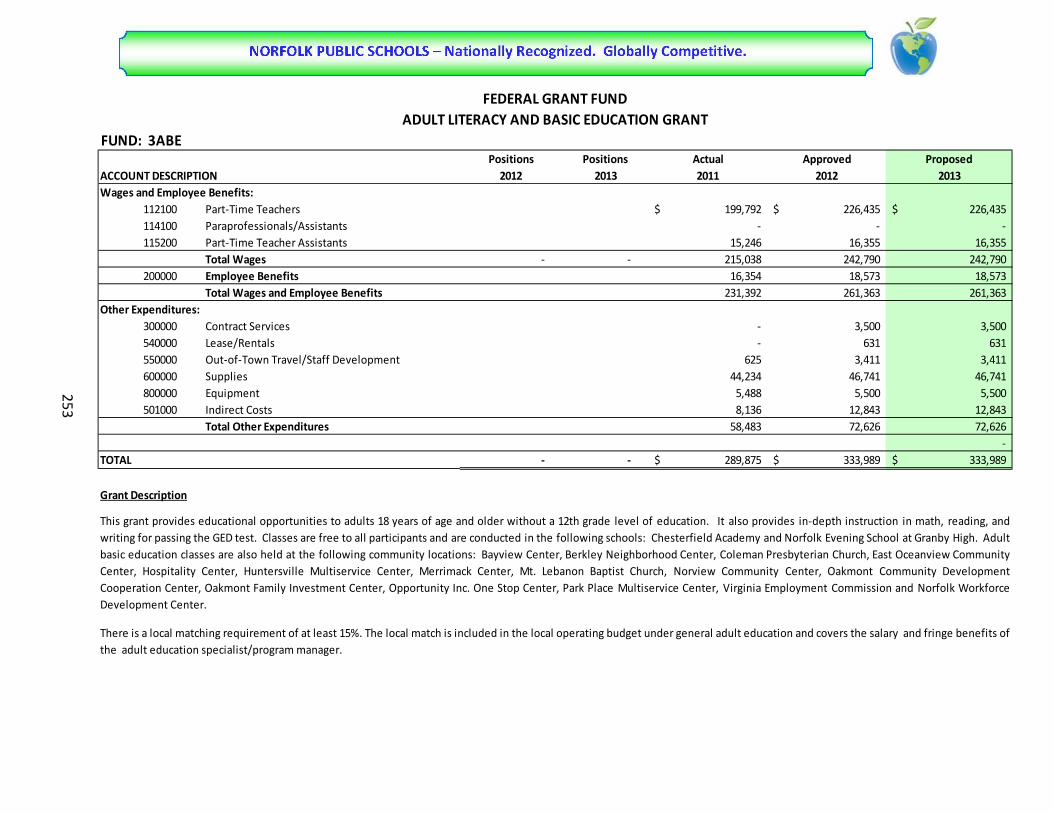
253
FEDERAL GRANT FUNDADULT LITERACY AND BASIC EDUCATION GRANT
FUND: 3ABEPositions Positions Actual Approved Proposed
ACCOUNT DESCRIPTION 2012 2013 2011 2012 2013Wages and Employee Benefits:
112100 Part-Time Teachers 199,792$ 226,435$ 226,435$ 114100 Paraprofessionals/Assistants - - - 115200 Part-Time Teacher Assistants 15,246 16,355 16,355
Total Wages - - 215,038 242,790 242,790 200000 Employee Benefits 16,354 18,573 18,573
Total Wages and Employee Benefits 231,392 261,363 261,363 Other Expenditures:
300000 Contract Services - 3,500 3,500 540000 Lease/Rentals - 631 631 550000 Out-of-Town Travel/Staff Development 625 3,411 3,411 600000 Supplies 44,234 46,741 46,741 800000 Equipment 5,488 5,500 5,500 501000 Indirect Costs 8,136 12,843 12,843
Total Other Expenditures 58,483 72,626 72,626 -
TOTAL - - 289,875$ 333,989$ 333,989$
Grant Description
This grant provides educational opportunities to adults 18 years of age and older without a 12th grade level of education. It also provides in-depth instruction in math, reading, andwriting for passing the GED test. Classes are free to all participants and are conducted in the following schools: Chesterfield Academy and Norfolk Evening School at Granby High. Adultbasic education classes are also held at the following community locations: Bayview Center, Berkley Neighborhood Center, Coleman Presbyterian Church, East Oceanview CommunityCenter, Hospitality Center, Huntersville Multiservice Center, Merrimack Center, Mt. Lebanon Baptist Church, Norview Community Center, Oakmont Community DevelopmentCooperation Center, Oakmont Family Investment Center, Opportunity Inc. One Stop Center, Park Place Multiservice Center, Virginia Employment Commission and Norfolk WorkforceDevelopment Center.
There is a local matching requirement of at least 15%. The local match is included in the local operating budget under general adult education and covers the salary and fringe benefits of the adult education specialist/program manager.

254
FEDERAL GRANT FUNDCARL PERKINS VOCATIONAL AND APPLIED TECH ACT
FUND: 3CPVPositions Positions Actual Approved Proposed
ACCOUNT DESCRIPTION 2012 2013 2011 2012 2013Wages and Employee Benefits:
112100 Part-Time Teachers -$ -$ -$ 162100 Stipends 18,680 21,785 21,785
Total Wages - - 18,680 21,785 21,785 200000 Employee Benefits 1,408 1,888 1,888
Total Wages and Employee Benefits - - 20,088 23,673 23,673 Other Expenditures:
300000 Contract Services 181,185 177,405 177,405 550000 Out-of-Town Travel/Staff Development 5,585 22,000 22,000 485000 Student Travel/Field trips - - - 800000 Equipment 727,994 606,704 606,704 501000 Indirect Costs - - -
Total Other Expenditures 914,764 806,109 806,109
TOTAL - - 934,852$ 829,782$ 829,782$
Grant Description
Carl Perkins Vocational funds are focused on preparing students for jobs by providing academic and workplace skills to ensure success. Funds are used to integrate academic andvocational education programs to prepare students for high-skills careers in high job growth fields. The grant provides equitable participation by special populations including studentswith disabilities. Funds provide technology education, professional development of teachers, and supplemental services for special populations. In Norfolk, grant funds have shiftedfrom funding teaching positions for disabled and disadvantaged students to the improvement of teacher training and the replacement of vocational and technology equipment. Fundssupport the Career and Technical Education Program, including the Tech Prep Program. Students are prepared for both entry-level jobs and for post-secondary technical education.

255
FEDERAL GRANT FUNDTITLE IV, PART A - DRUG-FREE SCHOOLS AND COMMUNITIES ACT GRANT
FUND: 3DFSPositions Positions Actual Approved Proposed
ACCOUNT DESCRIPTION 2012 2013 2011 2012 2013Wages and Employee Benefits:
112100 Part-Time Teachers -$ -$ -$ 115000 Clerical - - - - - 115600 Part-Time Clerical - - - 113600 Part-Time Other Professionals - - -
Total Wages - - - - - 200000 Employee Benefits - - -
Total Wages and Employee Benefits - - - - - Other Expenditures:
300000 Contract Services 47,572 - - 600000 Supplies - - - 501000 Indirect Costs 781 - -
Total Other Expenditures 48,353 - -
TOTAL - - 48,353$ -$ -$
Grant Description
Student Assistance Counselors (high schools) contracted through Norfolk Community dAlternatives to Violent Behavior (K-12 program) contracted with Barry Robinson Center.
Youth Alcohol and Other Drug Abuse Prevention Programs for high school students.
Mini-grants to schools for prevention materials
Supplemental health curriculum materials (K-10)
Safe and Drug-Free Schools and Communities Act of 1994 Grant, Title IV--21st Century Schools--Part A--Safe and Drug-Free Schools and Communities, No Child Left Behind Act (NCLB) of2001 , is a Federal grant awarded by the US Department of Education, administered by state education agencies, and made available to local school districts. Grant funds supportprograms that prevent violence in and around schools, prevent the illegal use of alcohol, tobacco, and drugs, involve parents and communities; and community efforts and resources tofoster a safe and drug-free learning environment that supports student academic achievement, through the provision of Federal assistance. The NCLB Act will allow LEAs to transfer upto 50% of the funding to Title I or any of the programs. The grant ended September 30, 2011.
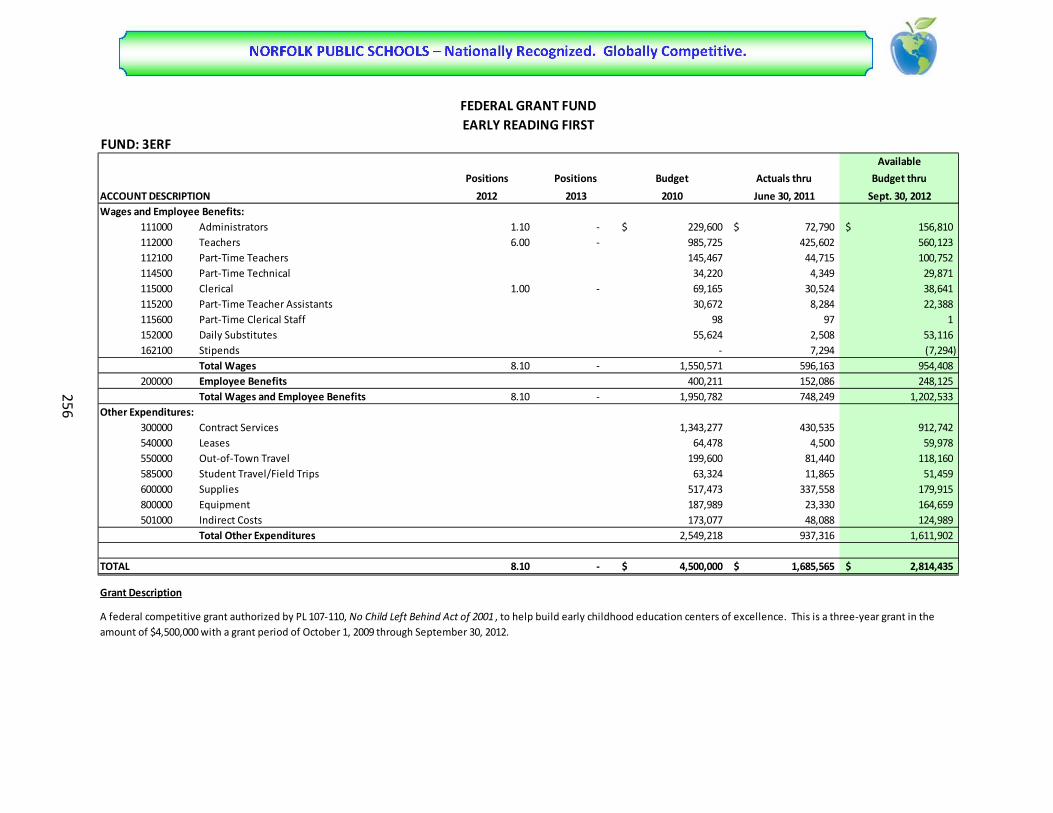
256
FEDERAL GRANT FUNDEARLY READING FIRST
FUND: 3ERFAvailable
Positions Positions Budget Actuals thru Budget thru
ACCOUNT DESCRIPTION 2012 2013 2010 June 30, 2011 Sept. 30, 2012Wages and Employee Benefits:
111000 Administrators 1.10 - 229,600$ 72,790$ 156,810$ 112000 Teachers 6.00 - 985,725 425,602 560,123 112100 Part-Time Teachers 145,467 44,715 100,752 114500 Part-Time Technical 34,220 4,349 29,871 115000 Clerical 1.00 - 69,165 30,524 38,641 115200 Part-Time Teacher Assistants 30,672 8,284 22,388 115600 Part-Time Clerical Staff 98 97 1 152000 Daily Substitutes 55,624 2,508 53,116 162100 Stipends - 7,294 (7,294)
Total Wages 8.10 - 1,550,571 596,163 954,408 200000 Employee Benefits 400,211 152,086 248,125
Total Wages and Employee Benefits 8.10 - 1,950,782 748,249 1,202,533 Other Expenditures:
300000 Contract Services 1,343,277 430,535 912,742 540000 Leases 64,478 4,500 59,978 550000 Out-of-Town Travel 199,600 81,440 118,160 585000 Student Travel/Field Trips 63,324 11,865 51,459 600000 Supplies 517,473 337,558 179,915 800000 Equipment 187,989 23,330 164,659 501000 Indirect Costs 173,077 48,088 124,989
Total Other Expenditures 2,549,218 937,316 1,611,902
TOTAL 8.10 - 4,500,000$ 1,685,565$ 2,814,435$
Grant Description
A federal competitive grant authorized by PL 107-110, No Child Left Behind Act of 2001 , to help build early childhood education centers of excellence. This is a three-year grant in the amount of $4,500,000 with a grant period of October 1, 2009 through September 30, 2012.

257
FUND: 3ED2Positions Positions Actual Approved Proposed
ACCOUNT DESCRIPTION 2012 2013 2011 2012 2013
Wages and Employee Benefits:112100 Part-Time Teachers -$ -$ -$
Total Wages - - - - 200000 Employee Benefits - -
Total Wages and Employee Benefits - - - - Other Expenditures:
300000 Contract Services 320,042 - - 550000 Out-of-Town Travel/Staff Development - - - 600000 Supplies - - - 800000 Equipment - - - 501000 Indirect Costs 10,929 - -
Total Other Expenditures 330,971 - - ARRA Funds 321,889 - -
TOTAL - - 652,860$ -$ -$
Grant Description
FEDERAL GRANT FUNDTITLE II - ENHANCING EDUCATION THROUGH TECHNOLOGY
The funds available through this grant will be a major support for increasing the effective utilization of educational technology for teaching and learning. These funds will enableconsortium members to better provide outstanding professional development and support to teachers and administrators. The funds will assist consortium members to effectivelyintegrate technology-based instructional strategies into the classroom. The grant includes regional and district funds. The enhancing Education through Technology Competitive Grantaward was 734,633.00. The Grant closed September 30, 2011.

258
FUND: 3EE2Positions Positions Actual Approved Proposed
ACCOUNT DESCRIPTION 2012 2013 2011 2012 2013
Wages and Employee Benefits:112100 Part-Time Teachers -$ -$ -$
Total Wages - - - - - 200000 Employee Benefits - - -
Total Wages and Employee Benefits - - - - - Other Expenditures:
300000 Contract Services - 25,732 25,732 605000 Supplies 2,720 77,195 77,195
Total Other Expenditures 2,720 102,927 102,927 - -
TOTAL - - 2,720$ 102,927$ 102,927$
Grant Description
The goal of the Educational Technology Program are: 1. To improve student academic achievement through the use of technology in elementary and secondary schools; 2. To encouragethe effective integration of technology resources and systems with teacher training and curriculum development to establish research-based instructional methods that can be widelyimplemented as best practices by state and local educational agencies. Academic achievement through the use of technology will be to procure computers, handheld technology, suchas tablets and e-readers, multimedia projectors, document cameras, and interactive board devices such as Smart boards and/or Promethian. High quality professional development willsupport on-line technology professional development courses via WHRO.
FEDERAL GRANT FUNDTITLE II - PART D, ENHANCING EDUCATIONAL TECHNOLOGY

259
FUND: 3LDSPositions Positions Actual Approved Proposed
ACCOUNT DESCRIPTION 2012 2013 2011 2012 2013Wages and Employee Benefits:
112100 Part-Time Teachers -$ -$ -$ Total Wages - - - - -
200000 Employee Benefits - - - Total Wages and Employee Benefits - - - - -
Other Expenditures:300000 Contract Services - 165,195 - 552000 Travel - Transportation - - - 36,000 - 604000 Technology Software - - - 390,294 - 822000 New Equipment - Tech Infrastructure - - - 180,000 -
Total Other Expenditures - 771,489 - - -
TOTAL - - -$ 771,489$ -$
Grant Description
STATEWIDE LONGITUDINAL DATA SYSTEMS GRANT - ARRA FUNDSFEDERAL GRANT FUND
Commonwealth of Virginia Department of Education & Division Grant Award agreement under the American Recovery and Reinvestment Act The Project Titled: Leveraging Time, Talent and Technology (Statewide Longitudinal Data Systems Grant) is designed to enhance data systems and increase data warehousing capabilities for all project partners. Provide the ability to report student-level transcript data, link student performance with instructional records and enable data to be more easily available to instructional decision makers such as teachers, principals and district central office. Grant Award Amount $771, 489. Period of Award January 1, 2011-June 30, 2013.
The following school divisions are our patners: Alexandria City Public Schools, Augusta County Public Schools, Brunswick County Public Schools, Campbell County Public Schools, Charlotte County Public Schools, Chesapeake Public Schools, Fauquier County Public Schools, Colonial Heights City Public Schools, Greenville County Public Schools, Hampton City Public Schools, Louisa County Public Schools, Mecklenburg County Public Schools, Petersburg City Public Schools, Powhatan County Public Schools, Prince George County Public Schools, Richmond City Public Schools and Williamsburg-James City County Public Schools.
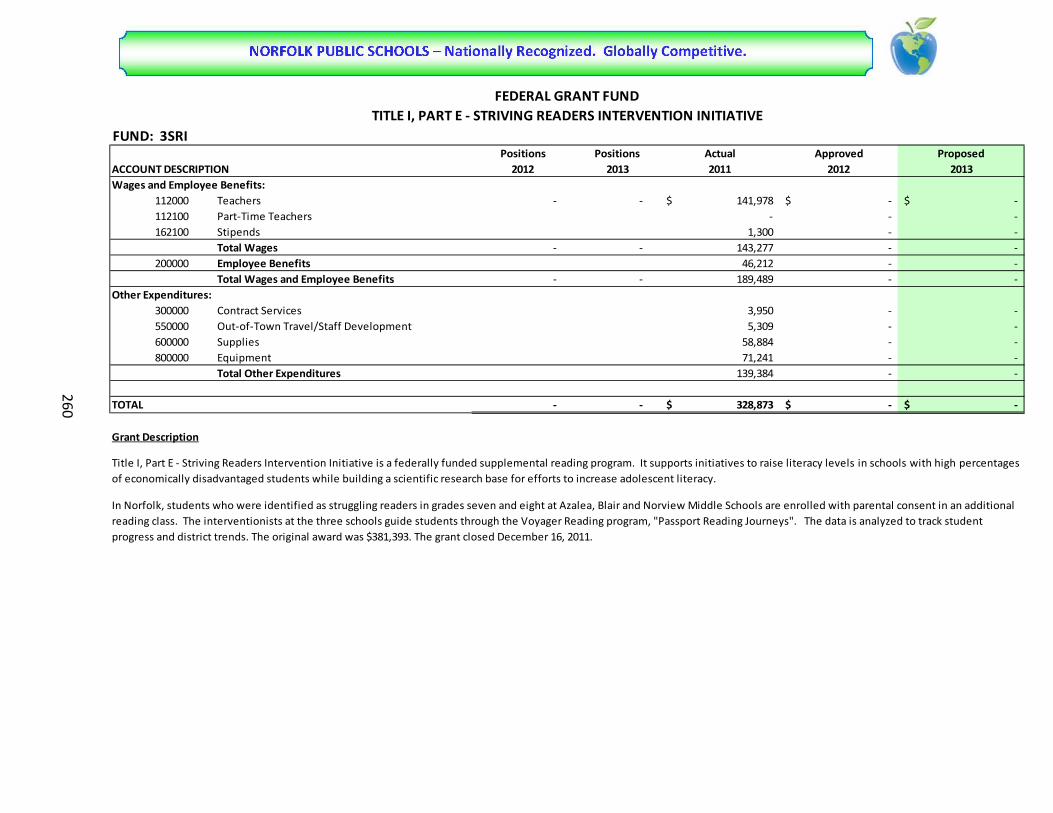
260
FUND: 3SRIPositions Positions Actual Approved Proposed
ACCOUNT DESCRIPTION 2012 2013 2011 2012 2013Wages and Employee Benefits:
112000 Teachers - - 141,978$ -$ -$ 112100 Part-Time Teachers - - - 162100 Stipends 1,300 - -
Total Wages - - 143,277 - - 200000 Employee Benefits 46,212 - -
Total Wages and Employee Benefits - - 189,489 - - Other Expenditures:
300000 Contract Services 3,950 - - 550000 Out-of-Town Travel/Staff Development 5,309 - - 600000 Supplies 58,884 - - 800000 Equipment 71,241 - -
Total Other Expenditures 139,384 - -
TOTAL - - 328,873$ -$ -$
Grant Description
FEDERAL GRANT FUNDTITLE I, PART E - STRIVING READERS INTERVENTION INITIATIVE
In Norfolk, students who were identified as struggling readers in grades seven and eight at Azalea, Blair and Norview Middle Schools are enrolled with parental consent in an additional reading class. The interventionists at the three schools guide students through the Voyager Reading program, "Passport Reading Journeys". The data is analyzed to track student progress and district trends. The original award was $381,393. The grant closed December 16, 2011.
Title I, Part E - Striving Readers Intervention Initiative is a federally funded supplemental reading program. It supports initiatives to raise literacy levels in schools with high percentagesof economically disadvantaged students while building a scientific research base for efforts to increase adolescent literacy.

261
FUND: 4GAEPositions Positions Actual Approved Proposed
ACCOUNT DESCRIPTION 2012 2013 2011 2012 2013Wages and Employee Benefits
112100 Part-Time Teachers 17,647$ 34,583$ 34,583$ Total Wages - - 17,647 34,583 34,583
200000 Employee Benefits 1,347 2,646 2,646 Total Wages and Employee Benefits - - 18,994 37,229 37,229
Other Expenditures300000 Contract Services - - - 600000 Supplies - - - 810000 Equipment Replacement - - - - -
Total Other Expenditures - - -
TOTAL - - 18,994$ 37,229$ 37,229$
Grant Description
STATE GRANT FUNDGENERAL ADULT EDUCATION
The General Adult Education Grant (GAE) provides academic instruction for adults pursuing high school classes for credit leading to a high school diploma, classes for preparation for theGeneral Educational Development (GED) test, and classes for adults who need preparation of English for Speakers of Other Languages (ESOL). These funds may only be used by persons18 years of age and older who are not enrolled in a public high school.

262
FUND: 4ICTPositions Positions Actual Approved Proposed
ACCOUNT DESCRIPTION 2012 2013 2011 2012 2013Wages and Employee Benefits:
112100 Part-Time Teachers -$ -$ -$ Total Wages - - - -
200000 Employee Benefits - - - Total Wages and Employee Benefits - - - - -
Other Expenditures:300000 Contract Services 19,552 20,140 20,140
Total Other Expenditures 19,552 20,140 20,140
TOTAL - - 19,552$ 20,140$ 20,140$
Grant Description
INDUSTRY CREDENTIAL TEST
The Industry Credentials Test (ICT) grant provide funding for students to take industry certification examinations, licensure tests, or National Occupational Competency Institute (NOCTI) assessments that have been approved by the Virginia State Board of Education.
STATE GRANT FUND

263
FUND: 4SCEPositions Positions Actual Approved Proposed
ACCOUNT DESCRIPTION 2012 2013 2011 2012 2013Wages and Employee Benefits:
112100 Part-Time Teachers - - -$ -$ -$ Total Wages - - - - -
200000 Employee Benefits - Total Wages and Employee Benefits - - - - -
Other Expenditures:800000 Equipment 30,022 33,219 33,219
Total Other Expenditures 30,022 33,219 33,219
TOTAL - - 30,022$ 33,219$ 33,219$
Grant Description
STATE GRANT FUNDSTATE CATEGORICAL EQUIPMENT
The State Categorical Equipment (SCE) grant provides funding for approved secondary career and technical education equipment. Grant does not require a local match.

264
FUND: 4RTGPositions Positions Actual Approved Proposed
ACCOUNT DESCRIPTION 2012 2013 2011 2012 2013Wages and Employee Benefits:
112100 Part-Time Teachers 11,444$ 12,317$ 12,317$ Total Wages - - 11,444 12,317 12,317
200000 Employee Benefits 876 942 942 Total Wages and Employee Benefits - - 12,320 13,259 13,259
Other Expenditures:300000 Contract Services 3,575 5,000 5,000 600000 Supplies and Materials - 1,969 1,969 603000 Instructional Materials 1,305 - - 604000 Software - - -
Total Other Expenditures 4,880 6,969 6,969
TOTAL - - 17,199$ 20,228$ 20,228$
Grant Description
STATE GRANT FUNDRACE TO GED
The Race to GED grant is used to provide GED Fast Track classes to adults (18 year of age and older) who have passed portions of the GED test and need more in-depth review in reading,writing, and mathematics to pass the remaining portion(s) of the test. Free GED testing is also provided to individuals who qualify by attending an adult education class for 15-60 hoursand passing the Official Practice Test (OPT). Funds are also available to cover any re-testing in the GED subject areas. Grant does not require a local match.

265
FUND: 4DCH (850)Positions Positions Actual Approved Proposed
ACCOUNT DESCRIPTION 2012 2013 2011 2012 2013Wages and Employee Benefits:
111000 Administrator 2.00 2.00 176,572$ 175,372$ 175,372$ 112000 Teachers 14.00 14.00 695,388 716,423 716,423 112100 Part-Time Teachers - - - 113000 Other Professionals - - - 114000 Technical - - - - - 115000 Clerical 3.00 3.00 98,207 95,683 95,683 115100 Teacher Assistants 1.00 1.00 17,557 22,666 22,666 115200 Part-Time Teacher Assistants 2,277 - - 115600 Part-Time Clerical - - - 152000 Daily Substitutes - 500 500 152100 Long-Term Substitutes 13,649 32,800 32,800 162100 Stipends 3,796 3,796
Total Wages 20.00 20.00 1,003,649 1,047,240 1,047,240 200000 Employee Benefits 292,035 294,803 294,803
Total Wages and Employee Benefits 20.00 20.00 1,295,684 1,342,043 1,342,043 Other Expenditures:
300000 Contract Services 281 1,000 1,000 540000 Leases and Rentals - - 550000 Out-of-Town Travel/Staff Development 7,537 13,500 13,500 600000 Supplies 32,802 27,100 27,100 603000 Instructional Materials 7,279 8,000 8,000 800000 Equipment 7,615 10,000 10,000 501000 Indirect Costs 50,118 50,464 50,464
Total Other Expenditures 105,631 110,064 110,064
TOTAL 20.00 20.00 1,401,315$ 1,452,107$ 1,452,107$
Grant Description
The Hospital Education Program (HEP) is a state-operated program located at Children's Hospital of the King's Daughters (CHKD). All staff members are employees of Norfolk PublicSchools. The mission of HEP is to provide appropriate educational services to patients (ages birth through 21) at CHKD. Educational plans are tailored to meet the individual student'sneeds in coordination with the hospital treatment team and within the confines of the facility. The Virginia Department of Education supervises the program. Norfolk Public Schoolssupervises the staff and is the fiscal agent.
STATE GRANT FUNDCHILDREN'S HOSPITAL OF THE KING'S DAUGHTERS

266
FUND: 4DCH (851)Positions Positions Actual Approved Proposed
ACCOUNT DESCRIPTION 2012 2013 2011 2012 2013Wages and Employee Benefits
111000 Administrator 1.00 1.00 60,321$ 81,723$ 81,723$ 112000 Teachers 10.00 10.00 444,725 551,410 551,410 112100 Part-Time Teachers 550 1,000 1,000 115000 Clerical 1.00 1.00 23,211 23,232 23,232 152000 Daily Substitutes 3,075 6,500 6,500 152100 Long-Term Substitutes 15,227 - -
Total Wages 12.00 12.00 547,107 663,865 663,865 200000 Employee Benefits 155,479 210,968 210,968
Total Wages and Employee Benefits 12.00 12.00 702,586 874,833 874,833 Other Expenditures
300000 Contract Services 954 3,500 3,500 550000 Out-of-Town Travel/Staff Development 7,371 8,000 8,000 600000 Supplies 16,919 23,500 23,500 525000 Postage 10 1,500 1,500 540000 Leases and Rentals 418 500 500 526000 Telephone 1,039 1,200 1,200 800000 Equipment 5,302 17,420 17,420 501000 Indirect Costs 34,210 32,868 32,868
Total Other Expenditures 66,222 88,488 88,488
TOTAL 12.00 12.00 768,809$ 963,321$ 963,321$
Grant Description
STATE GRANT FUNDNORFOLK DETENTION CENTER SCHOOL
The Norfolk Detention Center School provides secure care of juveniles ages 10 through 17 who have been convicted, sentenced, or adjudicated by the court and those who are awaitingtransfer to another facility. The school is operated by the Virginia Department of Education (VADOE) through Norfolk Public Schools. Instruction in the Detention School parallels theregular curriculum of public middle and secondary schools in the areas of English, Math, Science, Social Studies, and Physical Education/Health. The objective of the detention school isto provide educational services to children and youth residing in the detention center, ensure that the educational services provided will allow the students to maintain and/or advancehis/her level of academic functioning and provide a smooth transition to his/her previous or new educational setting, ensure that all students identified as disabled will have anupdated Individualized Education Plan, and provide a system of on-going communication, regarding the student's current educational performance, with the detention center staff, theparents/guardians, the sending school or agency, and when appropriate, the court(s). The Norfolk Detention School is operated in compliance with regular school board policiesgoverning educational programs in the City of Norfolk and VADOE policies.

267
FUND: 4DCH (852)Positions Positions Actual Approved Proposed
ACCOUNT DESCRIPTION 2012 2013 2011 2012 2013Wages and Employee Benefits:
112000 Teachers 8.00 8.00 512,343$ 466,623$ 466,623$ 152000 Daily Substitutes - - - 162100 Stipends - 1,456 1,456
Total Wages 8.00 8.00 512,343 468,079 468,079 200000 Employee Benefits 118,937 126,629 126,629
Total Wages and Employee Benefits 8.00 8.00 631,280 594,708 594,708 Other Expenditures:
300000 Contract Services - 1,000 1,000 550000 Out-of-TownTravel/Staff Development 2,524 5,000 5,000 600000 Supplies 13,743 11,000 11,000 800000 Equipment 1,544 3,000 3,000 501000 Indirect Costs 25,617 23,596 23,596
Total Other Expenditures 43,428 43,596 43,596
TOTAL 8.00 8.00 674,708$ 638,304$ 638,304$
Grant Description
STATE GRANT FUNDTIDEWATER DEVELOPMENT CENTER
This state operated program provides educational consultants for the Tidewater Child Development Services and outpatient clinics of Children's Hospital of the King's Daughters.Educational Consultants are an extension of the Hospital Education Program located at CHKD. The staff of 8 consultants are employees of Norfolk Public Schools and are supervised bythe CHKD Hospital Education Program Director. Educational consultants provide appropriate educational services to students under medical care in the assigned clinics. Norfolk PublicSchools is the fiscal agent of the program and provides supervision for the staff. All funding is provided by Commonwealth of Virginia.

268
FUND: 4JAIPositions Positions Actual Approved Proposed
ACCOUNT DESCRIPTION 2012 2013 2011 2012 2013Wages and Employee Benefits:
112000 Teachers 2.00 2.00 147,834$ 147,902$ 147,902$ 115100 Teacher Assistants - - - - - 162100 Stipends 3,116 3,936 3,936
Total Wages 2.00 2.00 150,950 151,838 151,838 200000 Employee Benefits 35,725 42,108 42,108
Total Wages and Employee Benefits 2.00 2.00 186,674 193,946 193,946 Other Expenditures:
550000 Out-of-Town Travel/Staff Development 215 3,200 3,200 600000 Supplies 783 800 800 800000 Equipment - - - 501000 Indirect Costs - - -
Total Other Expenditures 997 4,000 4,000
TOTAL 2.00 2.00 187,672$ 197,946$ 197,946$
Grant Description
STATE GRANT FUNDSPECIAL EDUCATION IN JAIL PROGRAM
This program operates in conjunction with the General Education Diploma (GED) program which is housed in the Norfolk City Jail. It is designed to offer academic assistance andremediation as well as transitional planning to students with disabilities within the correctional facility.
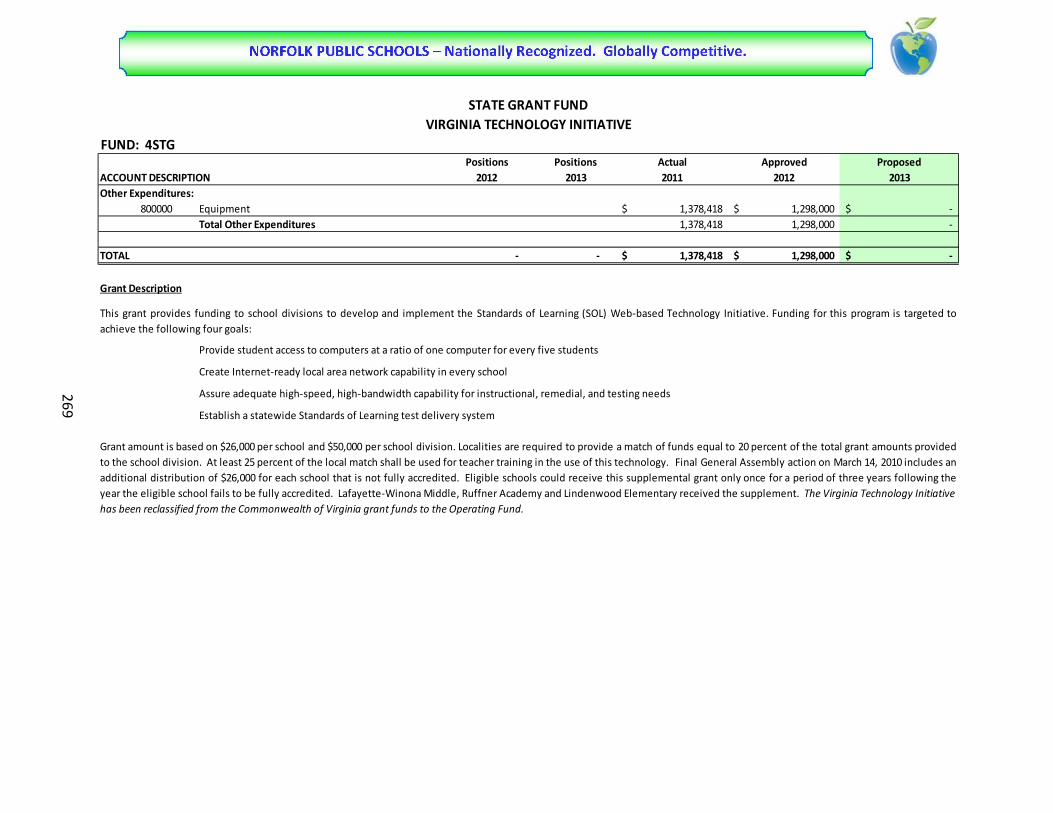
269
FUND: 4STGPositions Positions Actual Approved Proposed
ACCOUNT DESCRIPTION 2012 2013 2011 2012 2013Other Expenditures:
800000 Equipment 1,378,418$ 1,298,000$ -$ Total Other Expenditures 1,378,418 1,298,000 -
TOTAL - - 1,378,418$ 1,298,000$ -$
Grant Description
Provide student access to computers at a ratio of one computer for every five students
Assure adequate high-speed, high-bandwidth capability for instructional, remedial, and testing needs
This grant provides funding to school divisions to develop and implement the Standards of Learning (SOL) Web-based Technology Initiative. Funding for this program is targeted toachieve the following four goals:
Grant amount is based on $26,000 per school and $50,000 per school division. Localities are required to provide a match of funds equal to 20 percent of the total grant amounts providedto the school division. At least 25 percent of the local match shall be used for teacher training in the use of this technology. Final General Assembly action on March 14, 2010 includes anadditional distribution of $26,000 for each school that is not fully accredited. Eligible schools could receive this supplemental grant only once for a period of three years following theyear the eligible school fails to be fully accredited. Lafayette-Winona Middle, Ruffner Academy and Lindenwood Elementary received the supplement. The Virginia Technology Initiative has been reclassified from the Commonwealth of Virginia grant funds to the Operating Fund.
Establish a statewide Standards of Learning test delivery system
STATE GRANT FUNDVIRGINIA TECHNOLOGY INITIATIVE
Create Internet-ready local area network capability in every school

270
FUND: 4ISAPositions Positions Actual Approved Proposed
ACCOUNT DESCRIPTION 2012 2013 2011 2012 2013Wages and Employee Benefits:
112000 Teachers 1.00 1.00 41,874$ 43,374$ -$ 112100 Part-Time Teachers - - 115100 Teacher Assistant - -
Total Wages 1.00 1.00 41,874 43,374 - 200000 Employee Benefits 11,608 13,161 -
Total Wages and Employee Benefits 1.00 1.00 53,482 56,535 - Other Expenditures:
550000 Out-of-Town Travel/Staff Development - 1,349 - 585000 Student Travel/Field Trips - - - 600000 Supplies 2,197 - - 603000 Instructional Materials - 2,585 - 810000 Equipment Replacements 2,430 2,400 - 501000 Indirect Costs - - -
Total Other Expenditures 4,627 6,334 -
TOTAL 1.00 1.00 58,109$ 62,869$ -$
Grant Description
ISAEP-GEDSTATE GRANT FUND
The ISAEP Program is one of the district's alternative programs for 16 -18 year old students, two grade levels behind and who are experiencing difficulty with the traditional instructionalprogram. The ISAEP-GED Program funding has been reclassified from the Commonwealth of Virginia grant funds to the Operating Fund.

271
FUND: 4SPLPositions Positions Actual Approved Proposed
ACCOUNT DESCRIPTION 2012 2013 2011 2012 2013Wages and Employee Benefits:
112000 Teachers - - -$ -$ -$ 112100 Part-Time Teachers - - - 114000 Technical 8.00 8.00 160,043 160,457 160,457
Total Wages 8.00 8.00 160,043 160,457 160,457 200000 Employee Benefits 62,747 75,891 75,891
Total Wages and Employee Benefits 8.00 8.00 222,790 236,348 236,348 Other Expenditures:
526000 Telephone - - - 550000 Out-of-Town Travel/Staff Development 1,632 2,281 2,281 600000 Supplies - 371 371 800000 Equipment - - - 501000 Indirect Costs - - -
Total Other Expenditures 1,632 2,652 2,652
TOTAL 8.00 8.00 224,422$ 239,000$ 239,000$
Grant Description
STATE GRANT FUNDSCHOOL PROBATION LIAISONS
The Intensive Probation/School Liaison Program is funded through a grant from the Norfolk Juvenile Court Services Unit, through the City of Norfolk. This grant is provided through theVirginia Juvenile Community Crime Control Act. This grant funds eight full-time classified positions, benefits, supplies, and travel. The liaisons work directly with students enrolled inNPS and alternative programs when the student is involved with the court. They provide school information (attendance, behavior, and achievement) to probation/parole officers.There are approximately 500 students served through this program each school year.

272
FUND: 4TMP, 4TMH, 4CSPPositions Positions Actual Approved Proposed
ACCOUNT DESCRIPTION 2011 2013 2011 2012 2013Wages and Employee Benefits:
112100 Part-Time Teachers 13,600$ -$ 29,022$ 152000 Daily substitutes - - - 162100 Stipends - 15,792
Total Wages - - 13,600 15,792 29,022 200000 Employee Benefits 1,040 1,208 2,220
Total Wages and Employee Benefits - - 14,640 17,000 31,242 Other Expenditures:
300000 Contract Services 7,233 - - 550000 Out-of-Town Travel/Staff Development 2,950 - - 600000 Supplies 17,127 - - 501000 Indirect Cost - - -
Total Other Expenditures 27,310 - -
TOTAL - - 41,950$ 17,000$ 31,242$
Grant Description
STATE GRANT FUND
This is a summary of three grants that help new teachers transition into the teaching profession: The Mentor Teacher Program grant, the Mentor Teacher Programs for Hard-to-StaffSchools grant and the Career Switcher Mentor Program grant. The Mentor Teacher Program helps new teachers transition into the teaching profession to provide quality instructionthrough a structured program of support in accordance with the Education Accountability and Quality Enhancement Act of 1999 , which requires school boards to provide probationaryteachers with a mentor teacher. The Mentor Teacher Programs for Hard-to-Staff Schools was created in response to Governor Warner's Education for a Lifetime program. An effectivementoring program can help new teachers improve practice, learn professional responsibilities, and have a positive effect on student learning. The Career Switcher Mentor Programgrant provides funds to support the career switcher teacher's transition into the teaching profession while completing Level II of the Career Switcher Program. Funding for the CareerSwitcher Mentor Program grant received to date is $17,000. The Governor's proposed 2012-2013 Biennial Budget for Teacher Mentor Programs is estimated at $31,242. Teacher Mentor Programs have been reclassified from the Commonwealth of Virginia grant funds to the Operating Fund.
TEACHER MENTOR PROGRAMS

273
This page intentionally left blank.

Budget Office
Division of Business and Finance
P.O. Box 1357
Norfolk, VA 23501-1357