School Accountability Report Card, 2008–2009 Fremont ... you have any questions related ... port...
43
An annual report to the community about teaching, learning, test results, resources, and measures of progress in our school. » Thornton Junior High School School Accountability Report Card, 2008–2009 Fremont Unified School District
-
Upload
nguyenkiet -
Category
Documents
-
view
215 -
download
1
Transcript of School Accountability Report Card, 2008–2009 Fremont ... you have any questions related ... port...
Thornton Junior High SchoolSchool Accountability Report Card, 2008–2009Fremont Unified School District
An annual report to the
community about teaching,
learning, test results,
resources, and measures of
progress in our school.
»
Thornton Junior High School School Accountability Report Card, 2008–2009Fremont Unified School District
»Contents
ONLINE USERS: CLICK ON A TITLE TO JUMP TO THAT SECTION
This School Accountability Report Card (SARC) provides information that can be used to evaluate and compare schools. State and federal laws require all schools to publish a SARC each year.
The information in this report represents the 2008–2009 school year, not the current school year. In most cases, this is the most recent data available. We present our school’s results next to those of the average middle school in the county and state to provide the most meaningful and fair comparisons. To find additional facts about our school online, please use the DataQuest tool offered by the California Department of Education.
If you are reading a printed version of this report, note that words that appear in a smaller, bold typeface are links in the online version of this report to even more information. You can find a master list of those linked words, and the Web page addresses they are connected to, at:http://www.schoolwisepress.com/sarc/links_2009_en.html
Reports about other schools are available on the California Department of Education Web site. Internet access is available in local libraries.
If you have any questions related to this report, please contact the school office.
How to Contact Our School4357 Thornton Ave.Fremont, CA 94536Principal: Phyllis HamiltonPhone: (510) 793-9090
How to Contact Our District4210 Technology Dr.Fremont, CA 94537Phone: (510) 657-2350http://www.fremont.k12.ca.us/
Published by
SCHOOL WISE PRESS385 Ashton Ave., Ste. 200San Francisco, CA 94112Phone: (415) 337-7971www.schoolwisepress.com
©2009 Publishing 20/20
Principal’s Message
Measures of Progress
Student Achievement
Students
Climate for Learning
Leadership, Teachers, and Staff
Resources
School Expenditures
Adequacy of Key Resources
Data Almanac

»
Thornton Junior High SchoolSchool Accountability Report Card, 2008–2009Fremont Unified School District
Fremont Unified School District
Grade range and calendar
7–8TRADITIONAL
Academic Performance Index
868County Average: 742State Average: 760
Student enrollment
1,018County Average: 541State Average: 605
Teachers
41County Average: 26State Average: 28
Students per teacher
25County Average: 21State Average: 22
Principal�s MessageOur student population at Thornton represents heritages from five continents and island nations. The many cultures and languages at Thornton are a strong reflection of American multiculturalism.
Thornton is composed of dedicated professional educators who provide a demanding curriculum and challenging instructional strategies for students. Staff members continually broaden their knowledge and skills by attending conferences, workshops, and seminars, and by enrolling in higher education classes and programs.
Thornton offers a selection of academic programs to meet the needs of our broad range of students. The programs include English Learners, regular education, special education, and Gifted and Talented Education (GATE) in core subjects (language arts, science, math, and social studies). Students have access to computers in most classrooms. The library has a class set of computers that teachers and students use for class assignments, research, and other types of assignments.
A strong electives program includes classes in Leadership, Yearbook, Drama, French I and II, Spanish I and II, and Mandarin. Music electives include Chorus, Recorder, Beginning Band, Concert Band, Symphonic Band, and Jazz Band (after school). Art electives include ceramics, arts and crafts, and lettering/calligraphy. A comprehensive P.E. program for all students emphasizes lifetime fitness, which includes physical fitness, healthy eating, and positive social skills. The P.E. program is designed to focus on individual skills in seventh grade and team skills in eighth grade.
The WEB program (Where Everybody Belongs) is a program in which eighth grade students provide leadership support to help seventh graders transition to junior high school. Beginning with MAZE Day, eighth grade WEB leaders meet with the seventh graders and provide interactive games, tours of the campus, lunch together, and ongoing support. Eighth graders present interactive lessons during seventh grade science classes. The lessons provide social and leadership interactions for both grade levels of students. The WEB program is under the leadership of a team of teachers who annually attend workshops or conferences to keep the WEB program current at Thornton.
Thornton has a very active PTSA that meets monthly to plan and support programs and activities that help staff and students experience success. The PTSA raises funds, recruits volunteers, and organizes events and celebrations for the school and students. These functions do much to increase the sense of community and family at Thornton. The political arm of PTSA stays abreast of the pending and new legislations that affect schools and students.
Phyllis Hamilton, PRINCIPAL

Thornton Junior High School School Accountability Report Card for 2008–2009 Page 2
Major Achievements• Thornton’s Academic Performance Index (API) increased by 31 points to 868.
• All eighth grade students not in special education were enrolled in Algebra I and took the Algebra I state test. All seventh graders not in special education were enrolled in Pre-algebra.
• The Math Olympiad Team received the Highest Team Achievement Award.
• Thornton students received the third place Team Award in Math League Competition.
• One student was a National Spelling Bee Finalist.
• Fifteen African American students received awards for Academic Achievement, Leadership, and Artistic Creativity. The awards were presented by the African American Educators of Southern Alameda County.
• In the Music in the Park Competition (Disneyland), Symphonic Band received a Superior rating and Concert Band received an Excellent rating.
• In the CMEA Area 3 Festival, Symphonic Band received a rating of Superior and Concert Band received a rating of Excellence.
• Jazz Band received first place in the Centerville’s Got Talent competition.
• The Drama Club’s performance of Willy Wonka and the Chocolate Factory was well attended and received accolades from students and parents. Students enjoyed a preview of the performance, and the Thornton community enjoyed the evening performances.
• Multicultural Week was celebrated with extended noontime activities, which included games, sports, art displays, costumes, and dance that reflected the cultures of our diverse student population.
• Art students received recognition at the Alameda County Fair.
• During the awards assemblies at the end of each semester, students received certificates for achievement in all areas of the curriculum, leadership, and sports.
• The end-of-the-year eighth grade assembly recognized each eighth grade student with a minimum of two positive comments written by the teachers of the students. The students received the comments with their promotion certificates.
Focus for Improvement• During the current school year, the principal, vice-principal, and counselor will meet with the students
in specific subgroups to encourage students to work to improve grades and test scores. The English Sup-port classes in seventh and eighth grades will provide support in reading comprehension, writing skills, organization, and study skills. The Algebra I Support class will provide remediation in areas of need and tutorial support for eighth grade students. The Pre-algebra Support Class will provide remediation and tutorial support for seventh grade students. Progress of students is measured through continuous informal and formal assessments.
• The principal, vice-principal, and counselor will meet with the parents of the subgroup students to pro-vide data and information about the Achievement Gap. We will also listen to and discuss parent concerns. We will identify ways for students to improve academically. Parents are also invited to a different work-shop to receive information about how to assist their child with their studies and the completion of assignments at home.
• Information about the six-week Parenting Class, which is available through the city, will be given to par-ents by the counselor.
• Based on the data from test scores last spring, all departments have agreed to practice writing across the curriculum. The English department identified writing skills that should be used in curriculum areas.
• Awards assemblies will be held at the end of each semester. We will also recognize students for their achievements and successes in the school bulletins, newsletters, Good News cards, and announcements. Career Day will be held during the spring semester.
Fremont Unified School District

Thornton Junior High School School Accountability Report Card for 2008–2009 Page 3
Academic Performance IndexThe Academic Performance Index (API) is California’s way of comparing schools based on student test scores. The index was created in 1999 to help parents and educators recognize schools that show progress and identify schools that need help. A school’s API determines whether it receives recognition or sanctions. It is also used to compare schools in a statewide ranking system. The California Department of Education (CDE) calculates a school’s API using student test results from the California Standards Tests and, for high schools, the California High School Exit Exam (CAHSEE). APIs range from 200 to 1000. The CDE expects all schools to eventually obtain APIs of at least 800. Additional
information on the API can be found on the CDE Web site.
Thornton’s API was 868 (out of 1000). This is an increase of 31 points compared with last year’s API. All students took the test. You can find three years of detailed API results in the Data Almanac that accompanies this report.
API RANKINGS: Based on our 2007–2008 test results, we started the 2008–2009 school year with a base API of 837. The state ranks all schools according to this score on a scale from 1 to 10 (10 being highest). Compared with all middle schools in California, our school ranked 9 out of 10.
SIMILAR SCHOOL RANKINGS: We also received a second ranking that compared us with the 100 schools with the most similar students, teachers, and class sizes. Compared with these schools, our school ranked 3 out of 10. The CDE recalculates this factor every year. To read more about the specific elements included in this calculation, refer to the CDE Web site.
API GROWTH TARGETS: Each year the CDE sets specific API “growth targets” for every school. It assigns one growth target for the entire school, and it sets additional targets for ethnic groups, English Learners, special education students, or socioeconomic subgroups of students that make up a significant portion of the student body. Schools are required to meet all of their growth targets. If they do, they may be eligible to apply for awards through the California School Recognition Program and the Title I Achieving Schools Program.
We did not meet some or all of our assigned growth targets during the 2008–2009 school year. Just for reference, 50 percent of middle schools statewide met their growth targets.
MEASURES OF PROGRESS
CALIFORNIA
APIACADEMIC PERFORMANCE INDEX
Met schoolwide growth target YesMet growth target for prior school year Yes
API score 868Growth attained from prior year +31Met subgroup* growth targets No
SOURCE: API based on spring 2009 test cycle. Growth scores alone are displayed and are current as of December 2009.
*Ethnic groups, English Learners, special ed students, or socioeconomic groups of students that make up 15 percent or more of a school’s student body. These groups must meet AYP and API goals. R/P - Results pending due to challenge by school. N/A - Results not available.
200 300 400 500 600 700 800 900 1000
Low income
White/Other
Hispanic/Latino
Filipino
Asian American
STUDENT SUBGROUPS
STATE AVERAGE
ALL STUDENTS IN THIS SCHOOL
API, Spring 2009
868
760
952
833
742
822
766
SOURCE: API based on spring 2009 test cycle. State average represents middle schools only.NOTE: Only groups of students that represent at least 15 percent of total enrollment are calculated and displayed as student subgroups.
Fremont Unified School District

Thornton Junior High School School Accountability Report Card for 2008–2009 Page 4
Adequate Yearly ProgressIn addition to California’s accountability system, which measures student achievement using the API, schools must also meet requirements set by the federal education law known as No Child Left Behind (NCLB). This law requires all schools to meet a different goal: Adequate Yearly Progress (AYP).
We met 28 out of 29 criteria for yearly progress. Because we fell short in one area, we did not make AYP.
To meet AYP, middle schools must meet three criteria. First, a certain percentage of students must score at or above Proficient levels on the California Standards Tests (CST): 46 percent on the English/language arts test and 47.5 percent on the math test. All significant subgroups—English Learners, students with disabilities, ethnic groups, and socioeconomically disadvantaged—must also meet these goals. Second, the schools must achieve an API of at least 650 or increase the API by one point from the prior year. Third, 95 percent of the student body must take the required standardized tests.
If even one subgroup of students fails to meet just one of the criteria, the school fails to meet AYP. While all schools must report their progress toward meeting AYP, only schools that receive federal funding to help economically disadvantaged students are actually penalized if they fail to meet AYP goals. Schools that do not make AYP for two or more years in a row in the same subject enter Program Improvement (PI). They must offer students transfers to other schools in the district and, in their second year in PI, tutoring services as well.
The table at left shows our success or failure in meeting AYP goals in the 2008–2009 school year. The green dots represent goals we met; red dots indicate goals we missed. Just one red dot means that we failed to meet AYP.
Note: Dashes indicate that too few students were in the category to draw meaningful conclusions. Federal law requires valid test scores from at least 50 students for statistical significance.
FEDERAL
AYPADEQUATE YEARLY PROGRESS
Met AYP NoMet schoolwide participation rate YesMet schoolwide test score goals YesMet subgroup* participation rate YesMet subgroup* test score goals NoMet schoolwide API for AYP YesProgram Improvement school in 2009
No
SOURCE: AYP is based on the Accountability Progress Report of December 2009. A school can be in Program Improvement based on students’ test results in the 2008–2009 school year or earlier.
*Ethnic groups, English Learners, special ed students, or socioeconomic groups of students that make up 15 percent or more of a school’s student body. These groups must meet AYP and API goals. R/P - Results pending due to challenge by school. N/A - Results not available.
Adequate Yearly Progress, Detail by Subgroup
● MET GOAL ● DID NOT MEET GOAL � NOT ENOUGH STUDENTS
English/Language Arts Math
DID 95%OF STUDENTS
TAKE THE CST?
DID 46%OF STUDENTS
SCOREPROFICIENT OR ADVANCED ON
THE CST?
DID 95%OF STUDENTS
TAKE THE CST?
DID 47.5%OF STUDENTS
SCOREPROFICIENT OR ADVANCED ON
THE CST?
SCHOOLWIDE RESULTS ● ● ● ●
SUBGROUPS OF STUDENTS
Low income ● ● ● ●
Students learning English ● ● ● ●
STUDENTS BY ETHNICITY
Asian American ● ● ● ●
Filipino ● ● ● ●
Hispanic/Latino ● ● ● ●
White/Other ● ● ● ●SOURCE: AYP release of September 2009, CDE.
Fremont Unified School District

Thornton Junior High School School Accountability Report Card for 2008–2009 Page 5
Here you’ll find a three-year summary of our students’ scores on the California Standards Tests (CST) in selected subjects. We compare our students’ test scores with the results for students in the average middle school in California. On the following pages we provide more detail for each test, including the scores for different subgroups of students. In addition, we provide links to the California Content Standards on which these tests are based. If you’d like more information about the CST, please contact our principal or our teaching staff. To find grade-level-specific scores, you can refer to the Standardized Testing and Reporting (STAR) Web site. Other tests in the STAR program can be found on the California Department of Education (CDE) Web site.
STUDENT ACHIEVEMENT
BAR GRAPHS BELOW SHOW THESE PROFICIENCY GROUPS (LEFT TO RIGHT):FAR BELOW BASIC BELOW BASIC BASIC PROFICIENT ADVANCED
California Standards Tests
TESTED SUBJECT2008–2009
LOW SCORES HIGH SCORES
2007–2008 LOW SCORES HIGH SCORES
2006–2007 LOW SCORES HIGH SCORES
ENGLISH/LANGUAGE ARTS
Our schoolPercent Proficient or higher
72% 68% 63%
Average middle schoolPercent Proficient or higher
50% 46% 43%
MATH (excluding algebra)
Our schoolPercent Proficient or higher
68% 63% 46%
Average middle schoolPercent Proficient or higher
44% 42% 38%
ALGEBRA
Our schoolPercent Proficient or higher
58% 37% 74%
Average middle schoolPercent Proficient or higher
45% 42% 39%
HISTORY/SOCIAL SCIENCE
Our schoolPercent Proficient or higher
67% 59% 57%
Average middle schoolPercent Proficient or higher
42% 37% 35%
SCIENCE
Our schoolPercent Proficient or higher
74% 64% 61%
Average middle schoolPercent Proficient or higher
54% 50% 41%
SOURCE: The scores for the CST are from the spring 2009 test cycle. State average represents middle schools only. Whenever a school reports fewer than 11 scores for a particular subgroup at any grade level, the CDE suppresses the scores when it releases the data to the public. Missing data makes it impossible for us to compile complete schoolwide results. Therefore, the results published in this report may vary from other published CDE test scores.
Fremont Unified School District

Thornton Junior High School School Accountability Report Card for 2008–2009 Page 6
Frequently Asked Questions About Standardized TestsWHERE CAN I FIND GRADE-LEVEL REPORTS? Due to space constraints and concern for statistical reliability, we have omitted grade-level detail from these test results. Instead we present results at the schoolwide level. You can view the results of far more students than any one grade level would contain, which also improves their statistical reliability. Grade-level results are online on the STAR Web site. More information about student test scores is available in the Data Almanac that accompanies this report.
WHAT DO THE FIVE PROFICIENCY BANDS MEAN? Test experts assign students to one of these five proficiency levels, based on the number of questions they answer correctly. Our immediate goal is to help students move up one level. Our eventual goal is to enable all students to reach either of the top two bands, Advanced or Proficient. Those who score in the middle band, Basic, have come close to attaining the required knowledge and skills. Those who score in either of the bottom two bands, Below Basic or Far Below Basic, need more help to reach the Proficient level.
HOW HARD ARE THE CALIFORNIA STANDARDS TESTS? Experts consider California’s standards to be among the most clear and rigorous in the country. Just 53 percent of elementary school students scored Proficient or Advanced on the English/language arts test; 59 percent scored Proficient or Advanced in math. You can review the California Content Standards on the CDE Web site.
ARE ALL STUDENTS’ SCORES INCLUDED? No. Only students in grades two through eleven are required to take the CST. When fewer than 11 students in one grade or subgroup take a test, state officials remove their scores from the report. They omit them to protect students’ privacy, as called for by federal law.
CAN I REVIEW SAMPLE TEST QUESTIONS? Sample test questions for the CST are on the CDE’s Web site. These are actual questions used in previous years.
WHERE CAN I FIND ADDITIONAL INFORMATION? The CDE has a wealth of resources on its Web site. The STAR Web site publishes detailed reports for schools and districts, and assistance packets for parents and teachers. This site includes explanations of technical terms, scoring methods, and the subjects covered by the tests for each grade. You’ll also find a guide to navigating the STAR Web site as well as help for understanding how to compare test scores.
Fremont Unified School District

Thornton Junior High School School Accountability Report Card for 2008–2009 Page 7
The graph to the right shows how our students’ scores have changed over the years. We present each year’s results in a vertical bar, with students’ scores arrayed across five proficiency bands. When viewing schoolwide results over time, remember that progress can take many forms. It can be more students scoring in the top proficiency bands (blue); it can also be fewer students scoring in the lower two proficiency bands (brown and red).
You can read the California standards for English/language arts on the CDE’s Web site.
BAR GRAPHS BELOW SHOW THESE PROFICIENCY GROUPS (LEFT TO RIGHT):FAR BELOW BASIC BELOW BASIC BASIC PROFICIENT ADVANCED
English/Language Arts (Reading and Writing)
GROUP LOW SCORES HIGH SCORES PROFICIENT OR
ADVANCED
STUDENTS TESTED
COMMENTS
SCHOOLWIDE AVERAGE 72% 95% SCHOOLWIDE AVERAGE: About 22 percent more students at our school scored Proficient or Advanced than at the average middle school in California.
AVERAGE MIDDLE SCHOOL IN THE COUNTY
56% 95%
AVERAGE MIDDLE SCHOOL IN CALIFORNIA
50% 96%
BAR GRAPHS BELOW SHOW TWO PROFICIENCY GROUPS (LEFT TO RIGHT):
FAR BELOW BASIC, BELOW BASIC, AND BASIC PROFICIENT AND ADVANCED
Subgroup Test Scores
GROUP LOW SCORES HIGH SCORES PROFICIENT OR
ADVANCED
STUDENTS TESTED
COMMENTS
Boys 67% 513 GENDER: About 12 percent more girls than boys at our school scored Proficient or Advanced.
Girls 79% 445
English proficient 77% 878 ENGLISH PROFICIENCY: English Learners scored lower on the CST than students who are proficient in English. Because we give this test in English, English Learners tend to be at a disadvantage. English Learners 18% 79
Low income 54% 213 INCOME: About 24 percent fewer students from lower-income families scored Proficient or Advanced than our other students.
Not low income 78% 744
Learning disabled 34% 35 LEARNING DISABILITIES: Students classified as learning disabled scored lower than students without learning disabilities. The CST is not designed to test the progress of students with moderate to severe learning differences. Not learning disabled 74% 923
African American 54% 57 ETHNICITY: Test scores are likely to vary among students of different ethnic origins. The degree of variance will differ from school to school. Measures of the achievement gap are beyond the scope of this report.Asian American 86% 455
Filipino 65% 103
Hispanic/Latino 49% 121
White/Other 66% 212
SOURCE: The scores for the CST are from the spring 2009 test cycle. County and state averages represent middle schools only. Whenever a school reports fewer than 11 scores for a particular subgroup at any grade level, the CDE suppresses the scores when it releases the data to the public. Missing data makes it impossible for us to compile complete schoolwide results. Therefore, the results published in this report may vary from other published CDE test scores.N/A: Not applicable. Either no students took the test, or to safeguard student privacy the CDE withheld all results because very few students took the test in any grade.N/S: Not statistically significant. While we have some data to report, we are suppressing it because the number of valid test scores is not large enough to be meaningful.
100
80
60
40
20
0
20
40
60
80
100
2007 2008 2009
Three-Year Trend:English/Language Arts
Perc
enta
ge
of
studen
ts
SOURCE: CDE STAR research file: 2007, 2008, and 2009.
Percentage of studentswho took the test:
2007: 99%
2008: 100%
2009: 95%
Fremont Unified School District

Thornton Junior High School School Accountability Report Card for 2008–2009 Page 8
BAR GRAPHS BELOW SHOW THESE PROFICIENCY GROUPS (LEFT TO RIGHT):FAR BELOW BASIC BELOW BASIC BASIC PROFICIENT ADVANCED
Math (Excluding Algebra)
GROUP LOW SCORES HIGH SCORES PROFICIENT OR
ADVANCED
STUDENTS TESTED
COMMENTS
SCHOOLWIDE AVERAGE 68% 46% SCHOOLWIDE AVERAGE: About 24 percent more students at our school scored Proficient or Advanced than at the average middle school in California.
AVERAGE MIDDLE SCHOOL IN THE COUNTY
48% 68%
AVERAGE MIDDLE SCHOOL IN CALIFORNIA
44% 75%
BAR GRAPHS BELOW SHOW TWO PROFICIENCY GROUPS (LEFT TO RIGHT):
FAR BELOW BASIC, BELOW BASIC, AND BASIC PROFICIENT AND ADVANCED
Subgroup Test Scores
GROUP LOW SCORES HIGH SCORES PROFICIENT OR
ADVANCED
STUDENTS TESTED
COMMENTS
Boys 65% 251 GENDER: About four percent more girls than boys at our school scored Proficient or Advanced.
Girls 69% 218
English proficient 70% 432 ENGLISH PROFICIENCY: English Learners scored lower on the CST than students who are proficient in English. Because we give this test in English, English Learners tend to be at a disadvantage. English Learners 26% 37
Low income 42% 96 INCOME: About 31 percent fewer students from lower-income families scored Proficient or Advanced than our other students.
Not low income 73% 373
Learning disabled DATA STATISTICALLY UNRELIABLE N/S 21 LEARNING DISABILITIES: We cannot compare scores for these two subgroups because the number of students tested with learning disabilities was too small to be statistically significant. Not learning disabled 68% 448
African American DATA STATISTICALLY UNRELIABLE N/S 26 ETHNICITY: Test scores are likely to vary among students of different ethnic origins. The degree of variance will differ from school to school. Measures of the achievement gap are beyond the scope of this report.Asian American 91% 234
Filipino 59% 49
Hispanic/Latino 24% 51
White/Other 46% 103
SOURCE: The scores for the CST are from the spring 2009 test cycle. County and state averages represent middle schools only. Whenever a school reports fewer than 11 scores for a particular subgroup at any grade level, the CDE suppresses the scores when it releases the data to the public. Missing data makes it impossible for us to compile complete schoolwide results. Therefore, the results published in this report may vary from other published CDE test scores.N/A: Not applicable. Either no students took the test, or to safeguard student privacy the CDE withheld all results because very few students took the test in any grade.N/S: Not statistically significant. While we have some data to report, we are suppressing it because the number of valid test scores is not large enough to be meaningful.
Fremont Unified School District

Thornton Junior High School School Accountability Report Card for 2008–2009 Page 9
All sixth and most seventh graders take the same math courses. Starting as early as seventh grade, however, some students take algebra, while others take a general math course. We report algebra results separately. Here we present our students’ scores for all math courses except algebra.
The graph to the right shows how our students’ scores have changed over the years. We present each year’s results in a vertical bar, with students’ scores arrayed across five proficiency bands. When viewing schoolwide results over time, remember that progress can take many forms. It can be more students scoring in the top proficiency bands (blue); it can also be fewer students scoring in the lower two proficiency bands (brown and red).
You can read the math standards on the CDE’s Web site.
100
80
60
40
20
0
20
40
60
80
100
2007 2008 2009
Three-Year Trend: Math
Perc
enta
ge
of
studen
ts
SOURCE: CDE STAR research file: 2007, 2008, and 2009.
Percentage of studentswho took the test:
2007: 70%
2008: 94%
2009: 46%
Fremont Unified School District

Thornton Junior High School School Accountability Report Card for 2008–2009 Page 10
BAR GRAPHS BELOW SHOW THESE PROFICIENCY GROUPS (LEFT TO RIGHT):FAR BELOW BASIC BELOW BASIC BASIC PROFICIENT ADVANCED
Algebra I
GROUP LOW SCORES HIGH SCORES PROFICIENT OR
ADVANCED
STUDENTS TESTED
COMMENTS
SCHOOLWIDE AVERAGE 58% 50% SCHOOLWIDE AVERAGE: About 13 percent more students at our school scored Proficient or Advanced than at the average middle school in California. However, about 20 percent more students took algebra than did students in the average middle school in the state.
AVERAGE MIDDLE SCHOOL IN THE COUNTY
47% 39%
AVERAGE MIDDLE SCHOOL IN CALIFORNIA
45% 30%
BAR GRAPHS BELOW SHOW TWO PROFICIENCY GROUPS (LEFT TO RIGHT):
FAR BELOW BASIC, BELOW BASIC, AND BASIC PROFICIENT AND ADVANCED
Subgroup Test Scores
GROUP LOW SCORES HIGH SCORES PROFICIENT OR
ADVANCED
STUDENTS TESTED
COMMENTS
Boys 56% 276 GENDER: About four percent more girls than boys at our school scored Proficient or Advanced.
Girls 60% 229
English proficient 61% 456 ENGLISH PROFICIENCY: English Learners scored lower on the CST than students who are proficient in English. Because we give this test in English, English Learners tend to be at a disadvantage. English Learners 27% 48
Low income 41% 128 INCOME: About 23 percent fewer students from lower-income families scored Proficient or Advanced than our other students.
Not low income 64% 376
Learning disabled 12% 33 LEARNING DISABILITIES: Students classified as learning disabled scored lower than students without learning disabilities. The CST is not designed to test the progress of students with moderate to severe learning differences. Not learning disabled 61% 472
African American 35% 34 ETHNICITY: Test scores are likely to vary among students of different ethnic origins. The degree of variance will differ from school to school. Measures of the achievement gap are beyond the scope of this report.Asian American 80% 224
Filipino 53% 53
Hispanic/Latino 30% 79
White/Other 43% 110
SOURCE: The scores for the CST are from the spring 2009 test cycle. County and state averages represent middle schools only. Whenever a school reports fewer than 11 scores for a particular subgroup at any grade level, the CDE suppresses the scores when it releases the data to the public. Missing data makes it impossible for us to compile complete schoolwide results. Therefore, the results published in this report may vary from other published CDE test scores.N/A: Not applicable. Either no students took the test, or to safeguard student privacy the CDE withheld all results because very few students took the test in any grade.N/S: Not statistically significant. While we have some data to report, we are suppressing it because the number of valid test scores is not large enough to be meaningful.
Fremont Unified School District

Thornton Junior High School School Accountability Report Card for 2008–2009 Page 11
We report our students’ algebra results separately because of the central importance of algebra in the California math standards. It is also a gateway course for college-bound students, who should start high school ready for geometry.
The graph to the right shows how our students’ scores have changed over the years. We present each year’s results in a vertical bar, with students’ scores arrayed across five proficiency bands. When viewing schoolwide results over time, remember that progress can take many forms. It can be more students scoring in the top proficiency bands (blue); it can also be fewer students scoring in the lower two proficiency bands (brown and red).
About 50 percent of our seventh and eighth grade students took the algebra CST, compared with 30 percent of all middle school students statewide. You can review the math standards on the CDE’s Web site.
100
80
60
40
20
0
20
40
60
80
100
2007 2008 2009
Three-Year Trend: Algebra I
Perc
enta
ge
of
studen
ts
SOURCE: CDE STAR research file: 2007, 2008, and 2009.
Percentage of studentswho took the test:
2007: 28%
2008: 45%
2009: 50%
Fremont Unified School District

Thornton Junior High School School Accountability Report Card for 2008–2009 Page 12
The graph to the right shows how our eighth grade students’ scores have changed over the years. We present each year’s results in a vertical bar, with students’ scores arrayed across five proficiency bands. When viewing schoolwide results over time, remember that progress can take many forms. It can be more students scoring in the top proficiency bands (blue); it can also be fewer students scoring in the lower two proficiency bands (brown and red).
You can read the history/social science standards on the CDE’s Web site.
BAR GRAPHS BELOW SHOW THESE PROFICIENCY GROUPS (LEFT TO RIGHT):FAR BELOW BASIC BELOW BASIC BASIC PROFICIENT ADVANCED
History/Social Science
GROUP LOW SCORES HIGH SCORES PROFICIENT OR
ADVANCED
STUDENTS TESTED
COMMENTS
SCHOOLWIDE AVERAGE 67% 100% SCHOOLWIDE AVERAGE: About 25 percent more students at our school scored Proficient or Advanced than at the average middle school in California.
AVERAGE MIDDLE SCHOOL IN THE COUNTY
46% 98%
AVERAGE MIDDLE SCHOOL IN CALIFORNIA
42% 98%
BAR GRAPHS BELOW SHOW TWO PROFICIENCY GROUPS (LEFT TO RIGHT):
FAR BELOW BASIC, BELOW BASIC, AND BASIC PROFICIENT AND ADVANCED
Subgroup Test Scores
GROUP LOW SCORES HIGH SCORES PROFICIENT OR
ADVANCED
STUDENTS TESTED
COMMENTS
Boys 67% 284 GENDER: The same percentage of boys and girls at our school scored Proficient or Advanced.
Girls 67% 232
English proficient 72% 465 ENGLISH PROFICIENCY: English Learners scored lower on the CST than students who are proficient in English. Because we give this test in English, English Learners tend to be at a disadvantage. English Learners 20% 50
Low income 48% 134 INCOME: About 25 percent fewer students from lower-income families scored Proficient or Advanced than our other students.
Not low income 73% 381
Learning disabled 15% 40 LEARNING DISABILITIES: Students classified as learning disabled scored lower than students without learning disabilities. The CST is not designed to test the progress of students with moderate to severe learning differences. Not learning disabled 71% 476
African American 47% 36 ETHNICITY: Test scores are likely to vary among students of different ethnic origins. The degree of variance will differ from school to school. Measures of the achievement gap are beyond the scope of this report.Asian American 79% 228
Filipino 70% 54
Hispanic/Latino 44% 80
White/Other 64% 113
SOURCE: The scores for the CST are from the spring 2009 test cycle. County and state averages represent middle schools only. Whenever a school reports fewer than 11 scores for a particular subgroup at any grade level, the CDE suppresses the scores when it releases the data to the public. Missing data makes it impossible for us to compile complete schoolwide results. Therefore, the results published in this report may vary from other published CDE test scores.N/A: Not applicable. Either no students took the test, or to safeguard student privacy the CDE withheld all results because very few students took the test in any grade.N/S: Not statistically significant. While we have some data to report, we are suppressing it because the number of valid test scores is not large enough to be meaningful.
100
80
60
40
20
0
20
40
60
80
100
2007 2008 2009
Three-Year Trend: History/Social Science
Perc
enta
ge
of
studen
ts
SOURCE: CDE STAR research file: 2007, 2008, and 2009.
Percentage of studentswho took the test:
2007: 99%
2008: 99%
2009: 100%
Fremont Unified School District
Thornton Junior High School School Accountability Report Card for 2008–2009 Page 13
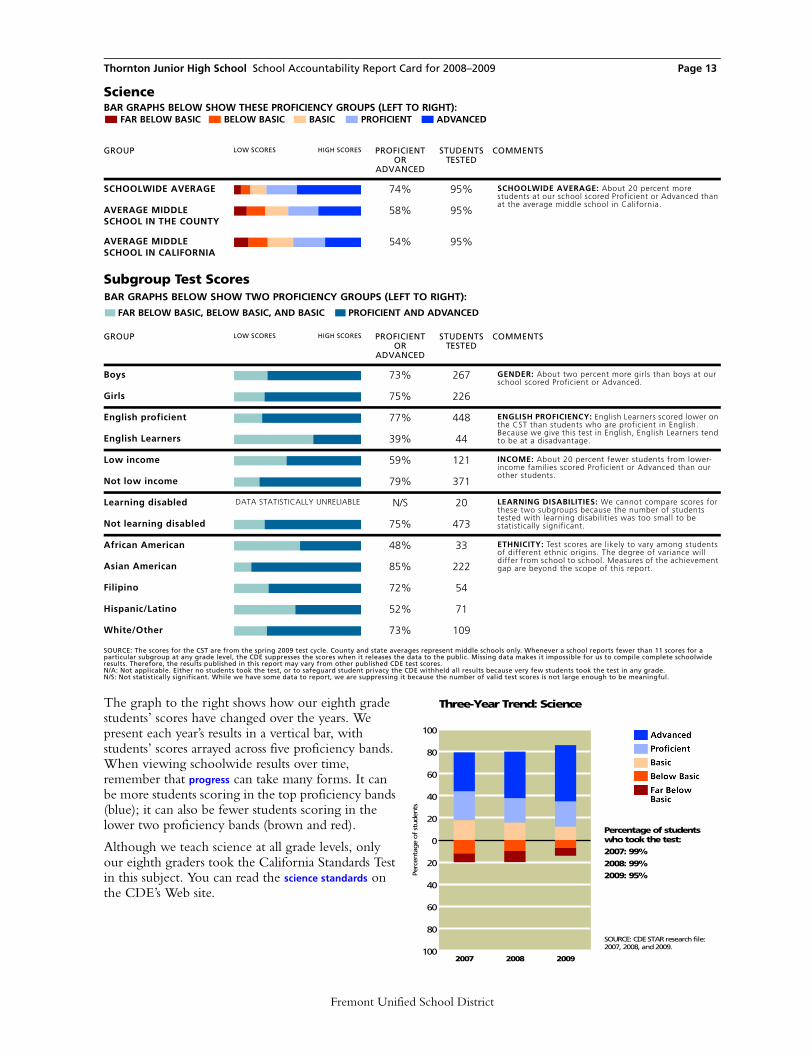
The graph to the right shows how our eighth grade students’ scores have changed over the years. We present each year’s results in a vertical bar, with students’ scores arrayed across five proficiency bands. When viewing schoolwide results over time, remember that progress can take many forms. It can be more students scoring in the top proficiency bands (blue); it can also be fewer students scoring in the lower two proficiency bands (brown and red).
Although we teach science at all grade levels, only our eighth graders took the California Standards Test in this subject. You can read the science standards on the CDE’s Web site.
BAR GRAPHS BELOW SHOW THESE PROFICIENCY GROUPS (LEFT TO RIGHT):FAR BELOW BASIC BELOW BASIC BASIC PROFICIENT ADVANCED
Science
GROUP LOW SCORES HIGH SCORES PROFICIENT OR
ADVANCED
STUDENTS TESTED
COMMENTS
SCHOOLWIDE AVERAGE 74% 95% SCHOOLWIDE AVERAGE: About 20 percent more students at our school scored Proficient or Advanced than at the average middle school in California.
AVERAGE MIDDLE SCHOOL IN THE COUNTY
58% 95%
AVERAGE MIDDLE SCHOOL IN CALIFORNIA
54% 95%
BAR GRAPHS BELOW SHOW TWO PROFICIENCY GROUPS (LEFT TO RIGHT):
FAR BELOW BASIC, BELOW BASIC, AND BASIC PROFICIENT AND ADVANCED
Subgroup Test Scores
GROUP LOW SCORES HIGH SCORES PROFICIENT OR
ADVANCED
STUDENTS TESTED
COMMENTS
Boys 73% 267 GENDER: About two percent more girls than boys at our school scored Proficient or Advanced.
Girls 75% 226
English proficient 77% 448 ENGLISH PROFICIENCY: English Learners scored lower on the CST than students who are proficient in English. Because we give this test in English, English Learners tend to be at a disadvantage. English Learners 39% 44
Low income 59% 121 INCOME: About 20 percent fewer students from lower-income families scored Proficient or Advanced than our other students.
Not low income 79% 371
Learning disabled DATA STATISTICALLY UNRELIABLE N/S 20 LEARNING DISABILITIES: We cannot compare scores for these two subgroups because the number of students tested with learning disabilities was too small to be statistically significant. Not learning disabled 75% 473
African American 48% 33 ETHNICITY: Test scores are likely to vary among students of different ethnic origins. The degree of variance will differ from school to school. Measures of the achievement gap are beyond the scope of this report.Asian American 85% 222
Filipino 72% 54
Hispanic/Latino 52% 71
White/Other 73% 109
SOURCE: The scores for the CST are from the spring 2009 test cycle. County and state averages represent middle schools only. Whenever a school reports fewer than 11 scores for a particular subgroup at any grade level, the CDE suppresses the scores when it releases the data to the public. Missing data makes it impossible for us to compile complete schoolwide results. Therefore, the results published in this report may vary from other published CDE test scores.N/A: Not applicable. Either no students took the test, or to safeguard student privacy the CDE withheld all results because very few students took the test in any grade.N/S: Not statistically significant. While we have some data to report, we are suppressing it because the number of valid test scores is not large enough to be meaningful.
100
80
60
40
20
0
20
40
60
80
100
2007 2008 2009
Three-Year Trend: Science
Perc
enta
ge
of
studen
ts
SOURCE: CDE STAR research file: 2007, 2008, and 2009.
Percentage of studentswho took the test:
2007: 99%
2008: 99%
2009: 95%
Fremont Unified School District

Thornton Junior High School School Accountability Report Card for 2008–2009 Page 14
Other Measures of Student AchievementIn addition to standardized test results, we use informal classroom observations, student’s oral presentations, homework, class work, quizzes, and end-of-unit tests.
Our English Learners take the California English Language Development Test every year. Some learning-disabled students take the alternative assessment, CMA.
We identify and intervene with students who have D and F grades. We plan and provide support services for these students, and we work with their parents to improve the students’ success.
Progress reports are mailed to the homes of students in the middle of each quarter. Report cards are given at the end of each quarter.
Fremont Unified School District

Thornton Junior High School School Accountability Report Card for 2008–2009 Page 15
Students’ English Language SkillsAt Thornton, 91 percent of students were considered to be proficient in English, compared with 81 percent of middle school students in California overall.
Languages Spoken atHome by English LearnersPlease note that this table describes the home languages of just the 93 students classified as English Learners. At Thornton, the language these students most often speak at home is Spanish. In California it’s common to find English Learners in classes with students who speak English well. When you visit our classrooms, ask our teachers how they work with language differences among their students.
EthnicityMost students at Thornton identify themselves as Asian/Pacific Islander. In fact, there are about two times as many Asian/Pacific Islander students as White/European American/Other students, the second-largest ethnic group at Thornton. The state of California allows citizens to choose more than one ethnic identity, or to select “multiethnic” or “decline to state.” As a consequence, the sum of all responses rarely equals 100 percent.
Family Income and EducationThe free or reduced-price meal subsidy goes to students whose families earned less than $39,220 a year (based on a family of four) in the 2008–2009 school year. At Thornton, 23 percent of the students qualified for this program, compared with 55 percent of students in California.
The parents of 79 percent of the students at Thornton have attended college and 60 percent have a college degree. This information can provide some clues to the level of literacy children bring to school. One precaution is that the students themselves provide this data when they take the battery of standardized tests each spring, so it may not be completely accurate. About 98 percent of our students provided this information.
STUDENTS
LANGUAGE SKILLSOUR
SCHOOLCOUNTYAVERAGE
STATEAVERAGE
English-proficient students 91% 84% 81%
English Learners 9% 16% 19%
SOURCE: Language Census for school year 2008–2009. County and state averages represent middle schools only.
LANGUAGEOUR
SCHOOLCOUNTYAVERAGE
STATEAVERAGE
Spanish 34% 66% 86%
Vietnamese 9% 3% 2%
Cantonese 3% 6% 1%
Hmong 0% 0% 1%
Filipino/Tagalog 11% 4% 1%
Korean 1% 1% 1%
Khmer/Cambodian 0% 1% 1%
All other 42% 19% 7%
SOURCE: Language Census for school year 2008–2009. County and state averages represent middle schools only.
ETHNICITYOUR
SCHOOLCOUNTYAVERAGE
STATEAVERAGE
African American 7% 17% 8%
Asian American/Pacific Islander
57% 26% 11%
Hispanic/Latino 13% 28% 48%
White/European American/Other
23% 29% 34%
SOURCE: CBEDS census of October 2008. County and state averages represent middle schools only.
FAMILY FACTORSOUR
SCHOOLCOUNTYAVERAGE
STATEAVERAGE
Low-income indicator 23% 44% 55%
Parents with some college 79% 66% 55%
Parents with college degree 60% 44% 31%
SOURCE: The free and reduced-price lunch information is gathered by most districts in October. This data is from the 2008–2009 school year. Parents’ education level is collected in the spring at the start of testing. Rarely do all students answer these questions. County and state averages represent middle schools only.
Fremont Unified School District

Thornton Junior High School School Accountability Report Card for 2008–2009 Page 16
Average Class SizesThe table at the right shows average class sizes for core courses. The average class size of all courses at Thornton varies from a low of 29 students to a high of 32. Our average class size schoolwide is 33 students. The average class size for middle schools in the state is 27 students.
SafetyOur administrators, teachers, and campus supervisor monitor the school grounds before and after school and during lunchtime. The vice-principal reviews the rules for safe, responsible behavior with all students at the beginning of the school year in P.E. classes. Administrators and teachers periodically hold discussions and remind students of these rules. The policies for rules, behavior, and safety are publicized for parents in newsletters and a district parent handbook.
Thornton has a closed campus. Visitors must enter the school through the main office and sign in. Students are not allowed off campus during the school day unless parents sign the students out through the Student Office.
The School Safety Plan was revised in 2008. The plan includes procedures for emergencies, locations of exit routes, and inventories of emergency supplies. We share and discuss the plan with all staff members at a staff meeting. Copies of the plan are available in the office for parents. We practice two fire drills and one earthquake/disaster drill per semester and hold trainings for staff on emergency preparedness each year. Our PTSA updated inventory and provided a storage container for the emergency disaster supplies and equipment.
DisciplineWe abide by the district policy and requirements that we publicize Thornton’s and the district’s behavior policy to parents and students. Parents receive the Fremont Unified School District Parent Handbook, and students receive Agendas with the school rules clearly written. Students also receive the information through assemblies in the P.E. classes, during their READ periods, and reminders in the daily bulletin. Students who cause problems in classrooms may be sent to our Responsibility Center during the periods four, five, and six to complete class assignments. If that fails to correct the problem, the students will be assigned a three-hour Thursday detention. Off-campus suspension is a final alternative.
Students who are defiant or chronically disruptive meet with the vice-principal, and they may also meet with the school counselor for guidance on their behavior and academics. Parents are contacted during our progressive discipline policy. A meeting is arranged if a phone call does not resolve the problem. We suspend students for blatant disrespect, bullying, and fighting. We will recommend expulsion for extreme violent behavior or possession of illegal substances or weapons.
Our staff makes a concerted effort to form personal connections with the students. We hold Student Study Team meetings with teachers, administrators, counselors, and parents to discuss students who may be struggling academically or behaviorally. We note positive behavior in comments on student report cards and progress reports. Teachers send Good News postcards home to acknowledge students for a variety of activities. We provide a variety of noontime activities during the school year. Our afterschool clubs and athletic programs in girls’ and boys’ basketball and volleyball take place during the year.
CLIMATE FOR LEARNING
AVERAGE CLASS SIZESOF CORE COURSES
OURSCHOOL
COUNTYAVERAGE
STATEAVERAGE
English 29 25 25
History 32 28 28
Math 32 26 27
Science 32 28 28
SOURCE: CBEDS census, October 2008. County and state averages represent middle schools only.
KEY FACTOROUR
SCHOOLDISTRICTAVERAGE
STATEAVERAGE
Suspensions per 100 students
2008–2009 21 12 19
2007–2008 17 11 20
2006–2007 16 12 19
Expulsions per 100 students
2008–2009 0 0 0
2007–2008 0 0 0
2006–2007 0 0 1
SOURCE: Data is from the California Department of Education, SARC research file. Data represents the number of incidents reported, not the number of students involved. District and state averages represent middle schools only.
Fremont Unified School District

Thornton Junior High School School Accountability Report Card for 2008–2009 Page 17
At times we find it necessary to suspend students who break school rules. We report only suspensions in which students are sent home for a day or longer. We do not report in-school suspensions, in which students are removed from one or more classes during a single school day. Expulsion is the most serious consequence we can impose. Expelled students are removed from the school permanently and denied the opportunity to continue learning here.
During the 2008–2009 school year, we had 209 suspension incidents. We had no incidents of expulsion. To make it easy to compare our suspensions and expulsions to those of other schools, we represent these events as a ratio (incidents per 100 students) in this report. Please note that multiple incidents may involve the same student.
ScheduleThe school year includes 180 days of instruction. Classes begin at 8:05 a.m. and end at 2:13 p.m., except on minimum days when classes end at 12:08 p.m. Afterschool clubs and sports begin soon after the school day ends. Girls’ volleyball and boys’ basketball takes place the first half of the school year, followed by girls’ basketball and boys’ volleyball in the second half. We offer students a breakfast program before school. We also serve a box lunch and a la carte food items during the 35-minute lunch period. Office hours are from 7:30 a.m. to 4 p.m.
Parent InvolvementParents are a valuable, critical part of our school, and their involvement at Thornton is welcome and important. Parents are part of our School Site Council (SSC), which approves our school’s goals and decides on funding priorities. Parents also serve on our ELAC and GATE committees. Our PTSA donates countless hours to volunteer activities to support the school, staff, and students in being successful. They help organize and staff our MAZE Days before school starts. They also recognize our staff by hosting luncheons and dinners for the staff during the school year. Parents plan lunchtime treats to recognize and reward students. The PTSA members also help chaperone the dances during the year.
A committee of parents plan and implement end-of-the-year eighth grade social activities.
During Back-to-School Night in September and Open House during the spring, parents are invited to visit with teachers and listen to presentations about curriculum and other activities.
We also hold parent conferences in November, where parents can meet individually with teachers to discuss their children’s work and performance. To find out how you can volunteer at our school, please contact the PTSA president through the school office.
Fremont Unified School District

Thornton Junior High School School Accountability Report Card for 2008–2009 Page 18
LeadershipI am Phyllis Hamilton, the principal of Thornton Junior High. I have been an administrator in Fremont Unified for 18 years. Before I became an administrator in Fremont, I taught U.S. History at Hopkins Junior High in Fremont. I have taught and served as an administrator in four states. I taught the social sciences during my years as a classroom teacher.
Thornton’s goals and plans are defined and implemented through a decision-making process that involves all staff under the guidance of the administration, department chairs, and the School Site Council (SSC). The administration and department chairs make budget recommendations, set priorities, and send them to the SSC for final approval. The SSC is composed of parents, teachers, classified representatives, the principal, and elected student officers. An English Language Advisory Committee (ELAC), made up of parents of English Learners, the principal, an English Language Development teacher, and a regular education teacher, decides on spending priorities for the English language arts and Economic Impact Aid budget as well as decides the plan for the English Learner program, and recommends them to the SSC.
The instructional program consists of honors and regular academic classes that are supported by integrated, coordinated English Learner and special education programs. The departments meet regularly under department chair leaders to plan and review goals and strategies for improving student success.
The school’s plans and goals are defined in the Single Plan for Pupil Achievement (SPPA) document. Each year staff members review school data and define objectives to improve student achievement.
About two percent of our teachers have fewer than three years of teaching experience, which is below the average for new teachers in other middle schools in California. Our teachers have, on average, 15 years of experience. About 51 percent of our teachers hold only a bachelor’s degree from a four-year college or university. About 49 percent have completed a master’s degree or higher.
LEADERSHIP, TEACHERS, AND STAFF
Teacher Experience and Education
KEY FACTOR DESCRIPTIONOUR
SCHOOLCOUNTYAVERAGE
STATEAVERAGE
Teaching experience Average years of teaching experience 15% 11% 12%
Newer teachers Percentage of teachers with one or two years of teaching experience
2% 20% 12%
Teachers holding an MA degree or higher
Percentage of teachers with an MA or higher from a graduate school
49% 28% 36%
Teachers holding a BA degree alone
Percentage of teachers whose highest degree is a BA degree from a four-year college
51% 72% 64%
SOURCE: Professional Assignment Information Form (PAIF), October 2008, completed by teachers during the CBEDS census. County and state averages represent middle schools only.
Fremont Unified School District

Thornton Junior High School School Accountability Report Card for 2008–2009 Page 19
About 98 percent of the faculty at Thornton hold a full credential. This number is close to the average for all middle schools in the state. About five percent of the faculty at Thornton hold a trainee credential, which is reserved for those teachers who are in the process of completing their teacher training. In comparison, four percent of middle school teachers throughout the state hold trainee credentials. About five percent of our faculty hold an emergency permit. Very few middle school teachers hold this authorization statewide (just two percent). All of the faculty at Thornton hold the secondary (single-subject) credential. This number is above the average for middle schools in California, which is 82 percent. You can find three years of data about teachers’ credentials in the Data Almanac that accompanies this report.
“HIGHLY QUALIFIED” TEACHERS: The federal law known as No Child Left Behind (NCLB) requires districts to report the number of teachers considered to be “highly qualified.” These “highly qualified” teachers must have a full credential, a bachelor’s degree, and, if they are teaching a core subject (such as reading, math, science, or social studies), they must also demonstrate expertise in that field. The table above shows the percentage of core courses taught by teachers who are considered to be less than “highly qualified.” There are exceptions, known as the High Objective Uniform State Standard of Evaluation (HOUSSE) rules, that allow some veteran teachers to meet the “highly qualified” test who wouldn’t otherwise do so.
TEACHING OUT OF FIELD: When a teacher lacks a subject area authorization for a course she is teaching, that course is counted as out-of-field. The students who take that course are also counted. For example, if an unexpected vacancy in a biology class occurs, and a teacher who normally teaches English literature (and who lacks a subject area authorization in science) fills in to teach for the rest of the year, that teacher would be teaching out of field. See the detail for algebra and science in the Out-of-Field Teaching table. None of our core courses was taught by teachers who were teaching out of their field of expertise, compared with 30 percent of core courses taught by such middle school teachers statewide.
CREDENTIAL STATUS OF TEACHERS: Teachers who lack full credentials are working under the terms of an emergency permit, an internship credential, or a waiver. They should be working toward their credential, and they are allowed to teach in the meantime only if the school board approves. About two percent of our teachers were working without full credentials, compared with five percent of teachers in middle schools statewide.
Credentials Held by Our Teachers
KEY FACTOR DESCRIPTIONOUR
SCHOOLCOUNTYAVERAGE
STATEAVERAGE
Fully credentialed teachers
Percentage of staff holding a full, clear authorization to teach at the elementary or secondary level
98% 89% 95%
Trainee credential holders
Percentage of staff holding an internship credential
5% 8% 4%
Emergency permit holders
Percentage of staff holding an emergency permit
5% 5% 2%
Teachers with waivers Lowest level of accreditation, used by districts when they have no other option
0% 1% 1%
SOURCE: PAIF, October 2008. This is completed by teachers during the CBEDS census. County and state averages represent middle schools only. A teacher may have earned more than one credential. For this reason, it is likely that the sum of all credentials will exceed 100 percent.
Indicators of Teachers Who May Be Underprepared
KEY FACTOR DESCRIPTIONOUR
SCHOOLCOUNTYAVERAGE
STATEAVERAGE
Core courses taught by a teacher not meeting NCLB standards
Percentage of core courses not taught by a “highly qualified” teacher according to federal standards in NCLB
0% N/A 0%
Out-of-field teaching Percentage of algebra and science courses taught by a teacher who lacks the appropriate credential for the course
0% 26% 30%
Teachers lacking a full credential
Percentage of teachers without a full, clear credential
2% 11% 5%
SOURCE: Professional Assignment Information Form (PAIF) of October 2008. Data on NCLB standards is from the California Department of Education, SARC research file.
Fremont Unified School District

Thornton Junior High School School Accountability Report Card for 2008–2009 Page 20
In this more detailed analysis, you’ll find the percentage of algebra courses taught by teachers who lack subject-area authorization in math. While algebra teachers in some middle schools might not formally be required to hold this math subject-area authorization, it is better if they do. We have applied the same criteria to science courses taught at all middle school grade levels. Note that school board policy determines which grade levels are secondary grade levels and require teachers to hold a secondary (single-subject) credential, and which are primary grade levels requiring an elementary (multiple-subject) credential.
More facts about our teachers, called for by the Williams legislation of 2004, are available on our Accountability Web page, which is accessible from our district Web site. You will find specific facts about misassigned teachers
and teacher vacancies in the 2009–2010 school year.
Districtwide Distribution of Teachers Who Are Not “Highly Qualified”Here, we report the percentage of core courses in our district whose teachers are considered to be less than “highly qualified” by NCLB’s standards. We show how these teachers are distributed among schools according to the percentage of low-income students enrolled.
The CDE has divided schools in the state into four groups (quartiles), based on the percentage of families who qualify and apply for free or reduced-price lunches. The one-fourth of schools with the most students receiving subsidized lunches are assigned to the first group. The one-fourth of schools with the fewest students receiving subsidized lunches are assigned to the fourth group. We compare the courses and teachers assigned to each of these groups of schools to see how they differ in “highly qualified” teacher assignments.
The average percentage of courses in our district not taught by a “highly qualified” teacher is one percent, compared with one percent statewide. For schools with the lowest percentage of low-income students, this factor is one percent, compared with zero percent statewide.
Out-of-Field Teaching, Detail by Selected Subject Areas
CORE COURSE DESCRIPTIONOUR
SCHOOLCOUNTYAVERAGE
STATEAVERAGE
Algebra Percentage of algebra courses taught by a teacher lacking the appropriate subject area authorization
0% 25% 25%
Science Percentage of science courses taught by a teacher lacking the appropriate subject area authorization
0% 27% 33%
SOURCE: PAIF, October 2008. This is completed by teachers during the CBEDS census. County and state averages represent middle schools only.
DISTRICT FACTOR DESCRIPTION
CORE COURSES
NOT TAUGHT BY
HQT IN DISTRICT
Districtwide Percentage of core courses not taught by “highly qualified” teachers (HQT)
1%
Schools with the most low-income students
First quartile of schools whose core courses are not taught by “highly qualified” teachers
N/A
Schools with the fewest low-income students
Fourth quartile of schools whose core courses are not taught by “highly qualified” teachers
1%
SOURCE: Data is from the California Department of Education, SARC research file.
Fremont Unified School District

Thornton Junior High School School Accountability Report Card for 2008–2009 Page 21
Staff DevelopmentOur teachers attended three days of staff development before school began. Those days were devoted to analyzing state standards test data and determining a focus curriculum area and instructional practices. One day of staff development is determined by the terms in the Fremont Unified School District contract. The topics for the other two days were voted on by staff, with input and suggestions from the principal.
A. Courageous Conversation: Impact of Race in the Classroom
B. Building positive relationships with students: understanding adolescence discipline.
C. Cycle of Inquiry: Working in seventh and eighth grade teams to deliver curriculum.
D. Technology In-service: Gradebook, iGrade.
Teachers use department meeting time to meet and discuss curriculum and instructional practices. During some staff meetings, time was allocated for revisiting 40 assets and the racial achievement gap.
A number of staff members have also received training in instructional strategies and in working with students through attendance at GATE certification, GLAD training, and in-service for the new math adoption.
Teachers also attended workshops in their curriculum areas, discipline, and diversity.
Evaluating and Improving TeachersAll certificated staff are regularly observed and evaluated by the school site administrators, who are continuously trained in improving instructional methods and delivery. A new state law allows teachers to be evaluated every five years if they have ten years of service with the district and have a history of completely satisfactory evaluations. All other certificated staff members are evaluated every year if a temporary or probationary teacher and every two years if a tenured teacher.
Every fall the administration meets with the certificated staff to agree upon observed teaching standards, and conducts several informal and formal observations during the school year. The overall evaluation is in accordance with the teacher’s contract and the guidelines of the California Standards for the Teaching Profession.
Beginning teachers receive assistance from an onsite support provider as part of a two-year Beginning Teacher Support Assistance (BTSA) program. Fremont Unified also has a Peer Assistance and Review (PAR) program that assists any teacher who requests support on curriculum delivery, classroom management, and/or additional teaching strategies that will improve instructional delivery.
Substitute TeachersThe Human Resources Department of Fremont Unified School District hires and trains our substitutes, all of whom have passed the California Basic Education Skills Test and a background check. When possible, each teacher from a school site requests a specific substitute when they will be away from school. Teachers leave detailed lesson plans for a substitute to follow to minimize loss of learning time.
The Human Resources Department makes every effort to accommodate substitute needs of certificated personnel daily. The district, as a whole, has had a 98 percent rate of filling all the certificated substitute positions requested for the school year. If there is no substitute available, another certificated staff member, from the school, will substitute. These teachers who would normally receive preparation time are compensated for their lost preparation time for subbing.
YEARPROFESSIONAL
DEVELOPMENT DAYS
2008–2009 3.0
2007–2008 3.0
2006–2007 3.0
SOURCE: This information is supplied by the school district.
Fremont Unified School District

Thornton Junior High School School Accountability Report Card for 2008–2009 Page 22
Specialized Resource StaffOur school may employ social workers, speech and hearing specialists, school psychologists, nurses, and technology specialists. These specialists often work part time at our school and some may work at more than one school in our district. Their schedules will change as our students’ needs change. For these reasons, the staffing counts you see here may differ from the staffing provided today in this school. For more details on statewide ratios of counselors, psychologists, or other pupil
services staff to students, see the California Department of Education (CDE) Web site. Library facts and frequently asked questions are also available there.
ACADEMIC GUIDANCE COUNSELORS: Our school has two full-time equivalent academic counselors, which is equivalent to one counselor for every 509 students. Just for reference, California districts employed about one academic counselor for every 608 middle school students in the state. More information about counseling and student support is available on the CDE Web site.
STAFF POSITIONSTAFF (FTE)
Counselors 2.0
Librarians 0.0
Psychologists 0.0
Social workers 0.0
Nurses 0.0
Speech/language/hearing specialists
0.0
Resource specialists 0.0
SOURCE: CBEDS census, October 2008.
Fremont Unified School District

Thornton Junior High School School Accountability Report Card for 2008–2009 Page 23
Specialized Programs and StaffThe enrichment programs at Thornton include GATE, Jazz Band, Math Olympiad, WEB, Leadership Class, Yearbook Class, Chorus, and Drama Club. Teachers support the enrichment programs.
Career Day and Multicultural Celebration are held in alternating years.
Our nurse conducts vision, hearing, and scoliosis screenings every year. The nurse and staff also provide support for students who have health plans.
Counselors meet with students who are having a problem with academics, social skills, homelessness, or a death in the family.
The school psychologist assesses students referred for low performance or possible learning disabilities.
GIFTED AND TALENTED EDUCATION (GATE): The curriculum in GATE classes is accelerated and enriched beyond the regular curriculum. Teachers of GATE students use strategies that are taken from research on curriculum and instructional practices of gifted education. They use district-approved enrichment materials.
Most GATE students come to Thornton from their elementary school already having been identified as a GATE student. Some GATE-identified students come to Thornton with GATE identification from another district. Thornton students may be placed in GATE classes if they scored 481 on their California Standards Tests in the previous spring
GATE students are placed in honors classes in English, science, history, or math, depending on their subject-area identification. Many students qualify in all subject areas. To teach GATE classes, a teacher must attend district-sponsored classes, workshops, and seminars. After completing the required coursework, teachers receive GATE certification.
SPECIAL EDUCATION PROGRAM: Our school has Resource Specialist Program (RSP) classes and Special Day Classes (SDCs). Both RSP and SDC classes provide services for students with mild to moderate disabilities. The student’s disabilities can include autism, behavior disorders, health impairments, and mental retardation.
RSP students are enrolled in the program for any combination of English, math, or study classes, according to their needs. They are in general education classes for the rest of the day. The teachers and para-educators monitor their progress in the general education classes. RSP and general education teachers plan appropriate accommodations for individual students as needed. Accommodations may include extra time for assignments and tests, re-teaching skills and concepts, or taking tests in an RSP classroom.
The two SDC/Mild-Moderate classes offer students English, math, history, science, and reading. The majority of SDC students take these classes with the SDC teachers. A few students are mainstreamed in general education for an academic class, some have a general education elective, and all have P.E. The SDC staff monitors the progress of SDC students in general education classes and provides accommodations to give students optimal opportunities to succeed.
A speech and language therapist is on campus two days a week. Speech and language services are provided to identified students in small groups or individually, depending on the need of each student.
A school psychologist is on campus two and a half days a week. She assesses students for possible learning disabilities or social disorders.
ENGLISH LEARNER PROGRAM: At the secondary level, beginning students are enrolled in self-contained ELD classes. English Learners at higher levels of English proficiency receive ELD in their regular English classes.
All of our certificated teachers hold one of the English Learner authorizations granted by the California Commission on Teacher Credentialing, such as the Cross-cultural Language and Academic Development (CLAD) certification, in addition to a valid California teaching credential. Instructional assistants who work with English Learners must meet all the prerequisite and testing requirements of the school district in order to hold that position. Bilingual instructional assistants must also meet additional language requirements.
Fremont Unified School District

Thornton Junior High School School Accountability Report Card for 2008–2009 Page 24
BuildingsMore facts about the condition of our school buildings are available in an online supplement to this report called for by the Williams legislation of 2004. What you will find is an assessment of more than a dozen aspects of our buildings: their structural integrity, electrical systems, heating and ventilation systems, and more. The important purpose of this assessment is to determine if our buildings and grounds are safe and in good repair. If anything needs to be repaired, this assessment identifies it and targets a date by which we commit to make those repairs. The guidelines for this assessment were written by the Office of Public School Construction (OPSC) and were brought about by the Williams legislation. You can look at the six-page Facilities Inspection Tool used for the assessment on the Web site of the OPSC.
LibraryThornton has a beautiful library that currently houses about 9,000 books and has 28 computers for student use. The computers also allow teachers access to tutorial programs in curriculum areas. We have a flexible schedule that allows teachers to sign up for library time during school hours. The library is open at 7 a.m., during lunch, and on most days after school until 3 p.m. We have a full-time library media technician who has student assistants to help keep the library ready for student and teacher use. Our collection is updated annually with donations and state and federal funds.
ComputersWe have computers in our library that students or classes can use to complete class assignments and research. Students have access to the Internet and software programs. We are looking to add additional computer stations to the library. Teachers bring classes to the library for students to complete assignments using the computers. The library technician also works individually with students before school, during school, during lunch, and after school to help them use the computers or complete other research assignments.
All classrooms have at least one networked computer and printer. Some classrooms have computers where students can do assignments, projects, and research online. Teachers use the iCue program to report attendance and record grades. Some teachers correspond via email with parents and staff. Some of our teachers also have online grade books and Web-based homework assignments that parents can access to see the grades and homework of their child. iParent gives parents access their student’s attendance, behavior, and grades.
TextbooksWe choose our textbooks from lists that have already been approved by state education officials. For a list of some of the textbooks we use at our school, see the Data Almanac that accompanies this report.
We have also reported additional facts about our textbooks called for by the Williams legislation of 2004. This online report shows whether we had a textbook for each student in each core course during the 2009–2010 school year and whether those textbooks covered the California Content Standards.
CurriculumFor more than six years, panels of scholars have decided what California students should learn and be able to do. Their decisions are known as the California Content Standards, and they apply to all public schools in the state. The textbooks we use and the tests we give are based on these content standards, and we expect our teachers to be firmly focused on them. Policy experts, researchers, and educators consider our state’s standards to be among the most rigorous and challenging in the nation.
You can find the content standards for each subject at each grade level on the Web site of the California Department of Education (CDE).
RESOURCES
Fremont Unified School District
Thornton Junior High School School Accountability Report Card for 2008–2009 Page 25
Categorical Funding for Supplemental Services:
Federal Title I funds support eligible students at Title I Targeted Assistance Schools.
Federal Title III funds are used to support Immigrant and English Learners at all schools, kindergarten through grade twelve.
State Economic Impact Aid (EIA) supports English Learners at all schools, kindergarten through grade twelve.
State English Language Acquisition Program (ELAP) supports English Learners in grades four through eight.
Examples of supplemental services include before- and afterschool intervention programs; instructional assistants; supplemental instructional materials; professional development for staff; and parent involvement activities.
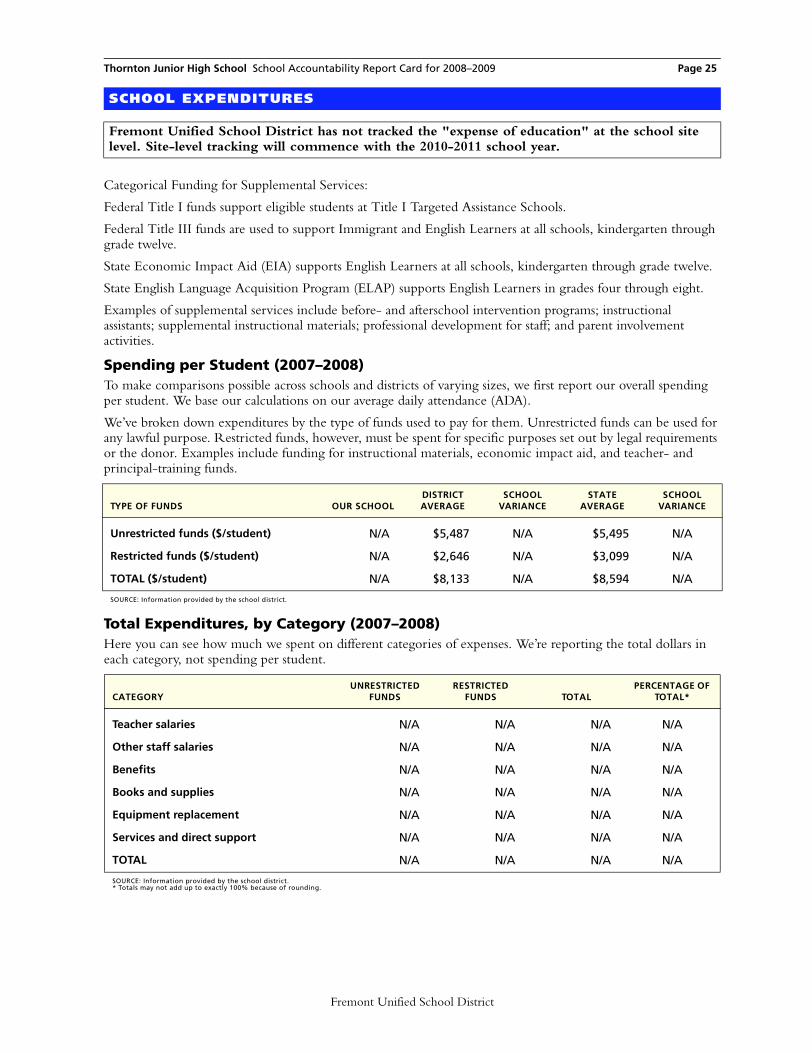
Spending per Student (2007–2008)To make comparisons possible across schools and districts of varying sizes, we first report our overall spending per student. We base our calculations on our average daily attendance (ADA).
We’ve broken down expenditures by the type of funds used to pay for them. Unrestricted funds can be used for any lawful purpose. Restricted funds, however, must be spent for specific purposes set out by legal requirements or the donor. Examples include funding for instructional materials, economic impact aid, and teacher- and principal-training funds.
Total Expenditures, by Category (2007–2008)Here you can see how much we spent on different categories of expenses. We’re reporting the total dollars in each category, not spending per student.
SCHOOL EXPENDITURES
Fremont Unified School District has not tracked the "expense of education" at the school site level. Site-level tracking will commence with the 2010-2011 school year.
TYPE OF FUNDS OUR SCHOOLDISTRICT AVERAGE
SCHOOL VARIANCE
STATE AVERAGE
SCHOOL VARIANCE
Unrestricted funds ($/student) N/A $5,487 N/A $5,495 N/A
Restricted funds ($/student) N/A $2,646 N/A $3,099 N/A
TOTAL ($/student) N/A $8,133 N/A $8,594 N/A
SOURCE: Information provided by the school district.
CATEGORYUNRESTRICTED
FUNDSRESTRICTED
FUNDS TOTALPERCENTAGE OF
TOTAL*
Teacher salaries N/A N/A N/A N/A
Other staff salaries N/A N/A N/A N/A
Benefits N/A N/A N/A N/A
Books and supplies N/A N/A N/A N/A
Equipment replacement N/A N/A N/A N/A
Services and direct support N/A N/A N/A N/A
TOTAL N/A N/A N/A N/A
SOURCE: Information provided by the school district. * Totals may not add up to exactly 100% because of rounding.
Fremont Unified School District
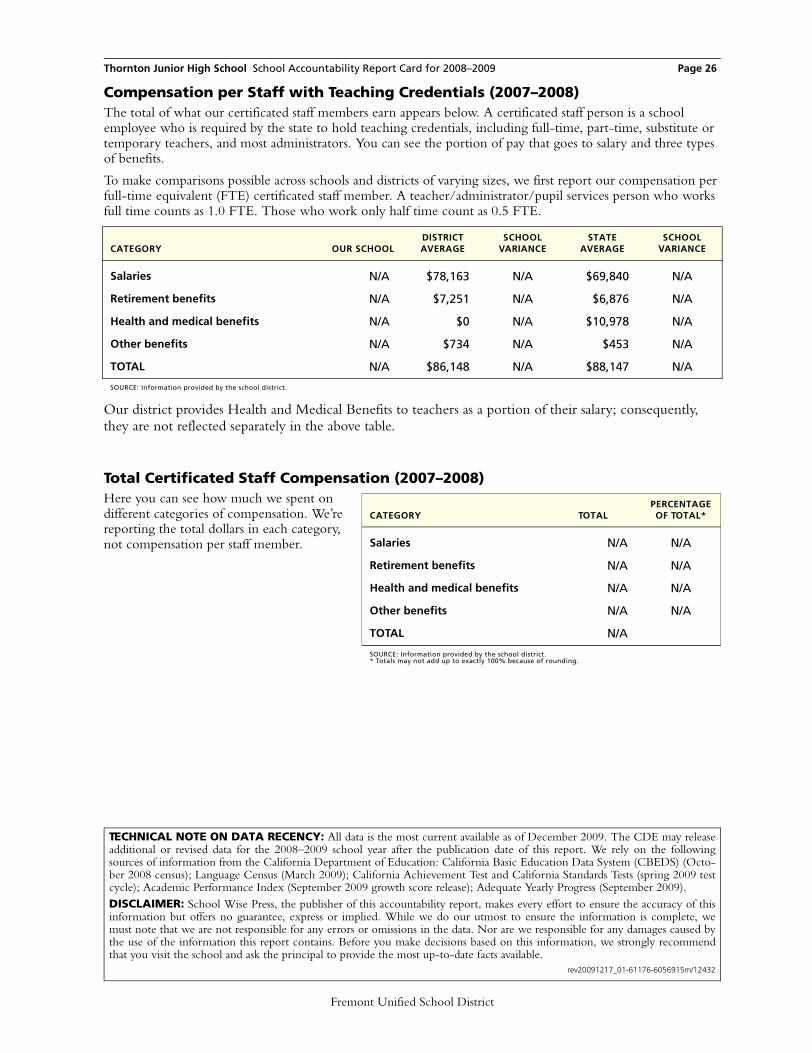
Thornton Junior High School School Accountability Report Card for 2008–2009 Page 26
Compensation per Staff with Teaching Credentials (2007–2008)The total of what our certificated staff members earn appears below. A certificated staff person is a school employee who is required by the state to hold teaching credentials, including full-time, part-time, substitute or temporary teachers, and most administrators. You can see the portion of pay that goes to salary and three types of benefits.
To make comparisons possible across schools and districts of varying sizes, we first report our compensation per full-time equivalent (FTE) certificated staff member. A teacher/administrator/pupil services person who works full time counts as 1.0 FTE. Those who work only half time count as 0.5 FTE.
Our district provides Health and Medical Benefits to teachers as a portion of their salary; consequently, they are not reflected separately in the above table.
Total Certificated Staff Compensation (2007–2008)Here you can see how much we spent on different categories of compensation. We’re reporting the total dollars in each category, not compensation per staff member.
CATEGORY OUR SCHOOLDISTRICT AVERAGE
SCHOOL VARIANCE
STATE AVERAGE
SCHOOL VARIANCE
Salaries N/A $78,163 N/A $69,840 N/A
Retirement benefits N/A $7,251 N/A $6,876 N/A
Health and medical benefits N/A $0 N/A $10,978 N/A
Other benefits N/A $734 N/A $453 N/A
TOTAL N/A $86,148 N/A $88,147 N/A
SOURCE: Information provided by the school district.
CATEGORY TOTALPERCENTAGE OF TOTAL*
Salaries N/A N/A
Retirement benefits N/A N/A
Health and medical benefits N/A N/A
Other benefits N/A N/A
TOTAL N/A
SOURCE: Information provided by the school district. * Totals may not add up to exactly 100% because of rounding.
TECHNICAL NOTE ON DATA RECENCY: All data is the most current available as of December 2009. The CDE may releaseadditional or revised data for the 2008–2009 school year after the publication date of this report. We rely on the followingsources of information from the California Department of Education: California Basic Education Data System (CBEDS) (Octo-ber 2008 census); Language Census (March 2009); California Achievement Test and California Standards Tests (spring 2009 testcycle); Academic Performance Index (September 2009 growth score release); Adequate Yearly Progress (September 2009). DISCLAIMER: School Wise Press, the publisher of this accountability report, makes every effort to ensure the accuracy of thisinformation but offers no guarantee, express or implied. While we do our utmost to ensure the information is complete, wemust note that we are not responsible for any errors or omissions in the data. Nor are we responsible for any damages caused bythe use of the information this report contains. Before you make decisions based on this information, we strongly recommendthat you visit the school and ask the principal to provide the most up-to-date facts available.
rev20091217_01-61176-6056915m/12432
Fremont Unified School District

Thornton Junior High School School Accountability Report Card for 2008–2009
»
Page 27
Adequacy of Key Resources
Here you’ll find key facts about our teachers, textbooks, and facilities during the school year in progress, 2009–2010. Please note that these facts are based on evaluations our staff conducted in accordance with the Williams legislation.
Fremont Unified School District

Thornton Junior High School School Accountability Report Card for 2008–2009
Fremont Unified School District
TEACHERS
Teacher Vacancies
The Williams legislation asked districts to disclose how frequently full-time teachers were not permanently assigned to a classroom. There are two general circumstances that can lead to the unfortunate case of a classroom without a full-time, permanently assigned teacher. Within the first 20 days of the start of school, we can be surprised by too many students showing up for school, or too few teachers showing up to teach. After school starts, however, teachers can also be surprised by sudden changes: family emergencies, injuries, accidents, etc. When that occurs, it is our school’s and our district’s responsibility to fill that teacher’s vacancy with a qualified, full-time and permanently assigned replacement. For that reason, we report teacher vacancies in two parts: at the start of school, and after the start of school.
KEY FACTOR 2007–2008 2008–2009 2009–2010
TEACHER VACANCIES OCCURRING AT THE BEGINNING OF THE SCHOOL YEAR
Total number of classes at the start of the year 210 211 197
Number of classes which lacked a permanently assigned teacher within the first 20 days of school
0 1 0
TEACHER VACANCIES OCCURRING DURING THE SCHOOL YEAR
Number of classes where the permanently assigned teacher left during the year
5 0 0
Number of those classes where you replaced the absent teacher with a single new teacher
5 0 0
NOTES: This report was completed on Tuesday, December 07, 2010.
Page 28

Thornton Junior High School School Accountability Report Card for 2008–2009
Fremont Unified School District
Teacher Misassignments
A “misassigned” teacher is one who lacks the appropriate subject-area authorization for a class she is teaching.
Under the terms of the Williams settlement, schools must inform the public of the number of their teachers who are misassigned. It is possible for a teacher who lacks the authorization for a subject to get special permission—in the form of an emergency permit, waiver, or internship authorization—from the school board or county office of education to teach the subject anyway. This permission prevents the teacher from being counted as misassigned.
KEY FACTOR DESCRIPTION 2007–2008 2008–2009 2009–2010
Teacher Misassignments
Total number of classes taught by teachers without a legally recognized certificate or credential
0 0 0
Teacher Misassignments in Classes that Include English Learners
Total number of classes that include English learners and are taught by teachers without CLAD/BCLAD authorization, ELD or SDAIE training, or equivalent authorization from the California Commission on Teacher Credentialing
0 0 0
Other Employee Misassignments
Total number of service area placements of employees without the required credentials
0 0 0
NOTES: This report was completed on Tuesday, December 07, 2010.
Page 29

Thornton Junior High School School Accountability Report Card for 2008–2009
Fremont Unified School District
TEXTBOOKS
The main fact about textbooks that the Williams legislation calls for described whether schools have enough books in core classes for all students. The law also asks districts to reveal whether those books are presenting what the California content standards calls for. This information is far more meaningful when viewed along with the more detailed description of textbooks contained in our School Accountability Report Card (SARC). There you’ll find the names of the textbooks used in our core classes, their dates of publication, the names of the firms that published them, and more.
ARE THERE TEXTBOOKS OR INSTRUCTIONAL MATERIALS IN USE?
ARE THERE ENOUGH BOOKS FOR EACH STUDENT?
SUBJECT STANDARDS ALIGNED?
OFFICIALLY ADOPTED? FOR USE IN CLASS?
PERCENTAGE OF STUDENTS HAVING
BOOKS TO TAKE HOME?
English Yes Yes Yes 100%
Math Yes Yes Yes 100%
Science Yes Yes Yes 100%
Social Studies Yes Yes Yes 100%
Foreign Languages Yes Yes Yes 100%
Health Sciences Yes Yes Yes 100%
Visual and Performing Arts
Yes Yes Yes 100%
NOTES: This report was completed on Tuesday, December 07, 2010.
Page 30
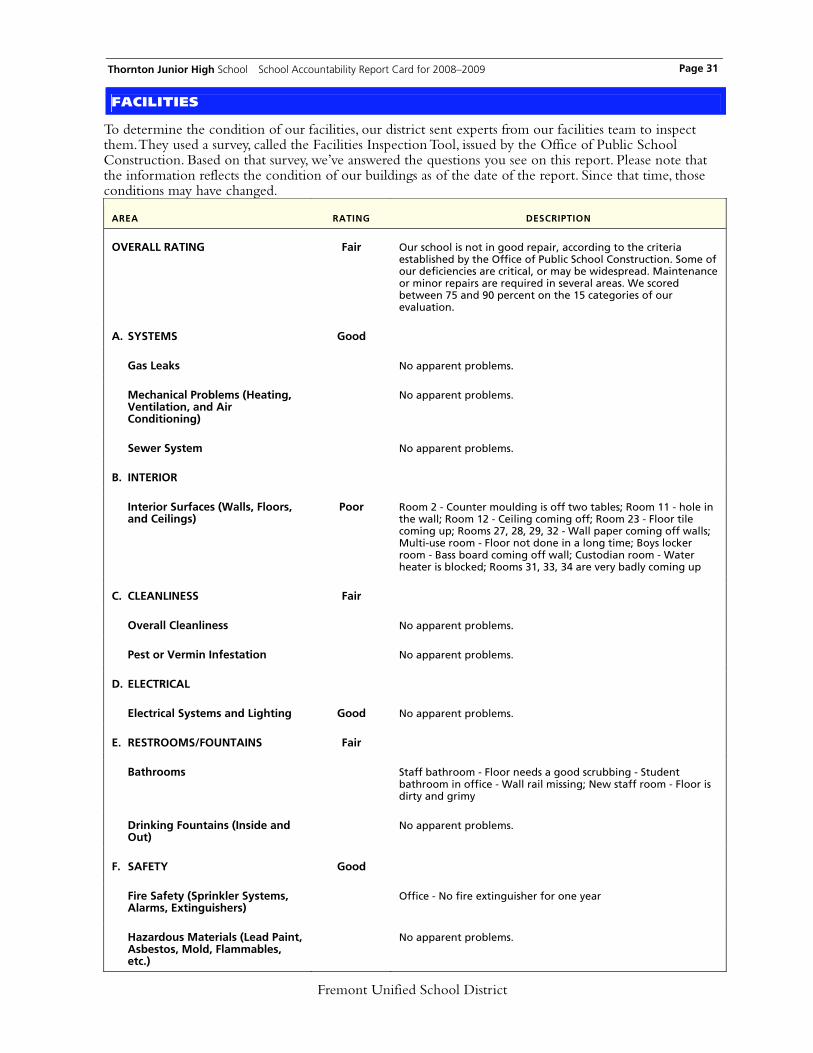
Thornton Junior High School School Accountability Report Card for 2008–2009
Fremont Unified School District
FACILITIES
To determine the condition of our facilities, our district sent experts from our facilities team to inspect them. They used a survey, called the Facilities Inspection Tool, issued by the Office of Public School Construction. Based on that survey, we’ve answered the questions you see on this report. Please note that the information reflects the condition of our buildings as of the date of the report. Since that time, those conditions may have changed.
AREA RATING DESCRIPTION
OVERALL RATING Fair Our school is not in good repair, according to the criteria established by the Office of Public School Construction. Some of our deficiencies are critical, or may be widespread. Maintenance or minor repairs are required in several areas. We scored between 75 and 90 percent on the 15 categories of our evaluation.
A. SYSTEMS Good
Gas Leaks No apparent problems.
Mechanical Problems (Heating, Ventilation, and Air Conditioning)
No apparent problems.
Sewer System No apparent problems.
B. INTERIOR
Interior Surfaces (Walls, Floors, and Ceilings)
Poor Room 2 - Counter moulding is off two tables; Room 11 - hole in the wall; Room 12 - Ceiling coming off; Room 23 - Floor tile coming up; Rooms 27, 28, 29, 32 - Wall paper coming off walls; Multi-use room - Floor not done in a long time; Boys locker room - Bass board coming off wall; Custodian room - Water heater is blocked; Rooms 31, 33, 34 are very badly coming up
C. CLEANLINESS Fair
Overall Cleanliness No apparent problems.
Pest or Vermin Infestation No apparent problems.
D. ELECTRICAL
Electrical Systems and Lighting Good No apparent problems.
E. RESTROOMS/FOUNTAINS Fair
Bathrooms Staff bathroom - Floor needs a good scrubbing - Student bathroom in office - Wall rail missing; New staff room - Floor is dirty and grimy
Drinking Fountains (Inside and Out)
No apparent problems.
F. SAFETY Good
Fire Safety (Sprinkler Systems, Alarms, Extinguishers)
Office - No fire extinguisher for one year
Hazardous Materials (Lead Paint, Asbestos, Mold, Flammables, etc.)
No apparent problems.
Page 31
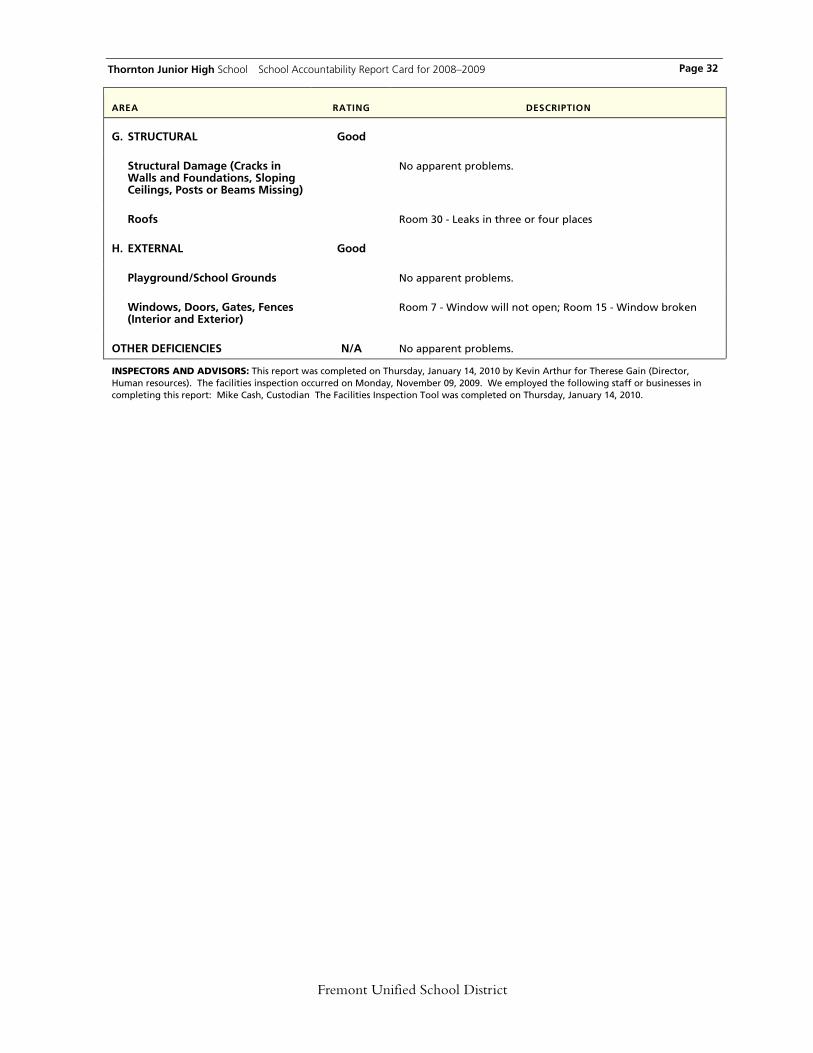
Thornton Junior High School School Accountability Report Card for 2008–2009
Fremont Unified School District
AREA RATING DESCRIPTION
G. STRUCTURAL Good
Structural Damage (Cracks in Walls and Foundations, Sloping Ceilings, Posts or Beams Missing)
No apparent problems.
Roofs Room 30 - Leaks in three or four places
H. EXTERNAL Good
Playground/School Grounds No apparent problems.
Windows, Doors, Gates, Fences (Interior and Exterior)
Room 7 - Window will not open; Room 15 - Window broken
OTHER DEFICIENCIES N/A No apparent problems.
INSPECTORS AND ADVISORS: This report was completed on Thursday, January 14, 2010 by Kevin Arthur for Therese Gain (Director, Human resources). The facilities inspection occurred on Monday, November 09, 2009. We employed the following staff or businesses in completing this report: Mike Cash, Custodian The Facilities Inspection Tool was completed on Thursday, January 14, 2010.
Page 32

Thornton Junior High School School Accountability Report Card for 2008–2009
»
Page 33
Data Almanac
This Data Almanac provides more-detailed information than the School Accountability Report Card as well as data that covers a period of more than one year. It presents the facts and statistics in tables without narrative text.
Fremont Unified School District

Thornton Junior High School School Accountability Report Card for 2008–2009 Page 34
Average Class Size by Core CourseThe average class size by core courses.
Average Class Size by Core Course, DetailThe number of classrooms that fall into each range of class sizes.
STUDENTS AND TEACHERS
Student Enrollment by Ethnicity and Other Characteristics
The ethnicity of our students, estimates of their family income and education level, their English fluency, and
their learning-related disabilities.
Student Enrollment by Grade Level
Number of students enrolled in each grade level at our school.
SUBJECT 2006–2007 2007–2008 2008–2009
English 27 27 29
History 30 31 32
Math 28 29 32
Science 31 32 32
SOURCE: CBEDS, October 2008.
2006–2007 2007–2008 2008–2009
SUBJECT 1–22 23–32 33+ 1–22 23–32 33+ 1–22 23–32 33+
English 5 26 4 6 22 5 5 19 10
History 0 28 3 0 16 14 0 18 13
Math 3 27 4 2 27 3 1 13 17
Science 0 25 6 0 16 14 0 15 16
SOURCE: CBEDS, October 2008.
GROUP ENROLLMENT
Number of students 1,018
African American 7%
American Indian or Alaska Native 0%
Asian 46%
Filipino 10%
Hispanic or Latino 13%
Pacific Islander 1%
White (not Hispanic) 22%
Multiple or no response 1%
Socioeconomically disadvantaged 22%
English Learners 10%
Students with disabilities 8%
SOURCE: All but the last three lines are from the annual census, CBEDS, October 2008. Data about students who are socioeconomically disadvantaged, English Learners, or learning disabled come from the School Accountability Report Card unit of the California Department of Education.
GRADE LEVEL STUDENTS
Kindergarten 0
Grade 1 0
Grade 2 0
Grade 3 0
Grade 4 0
Grade 5 0
Grade 6 0
Grade 7 497
Grade 8 521
Grade 9 0
Grade 10 0
Grade 11 0
Grade 12 0
SOURCE: CBEDS, October 2008.
Fremont Unified School District
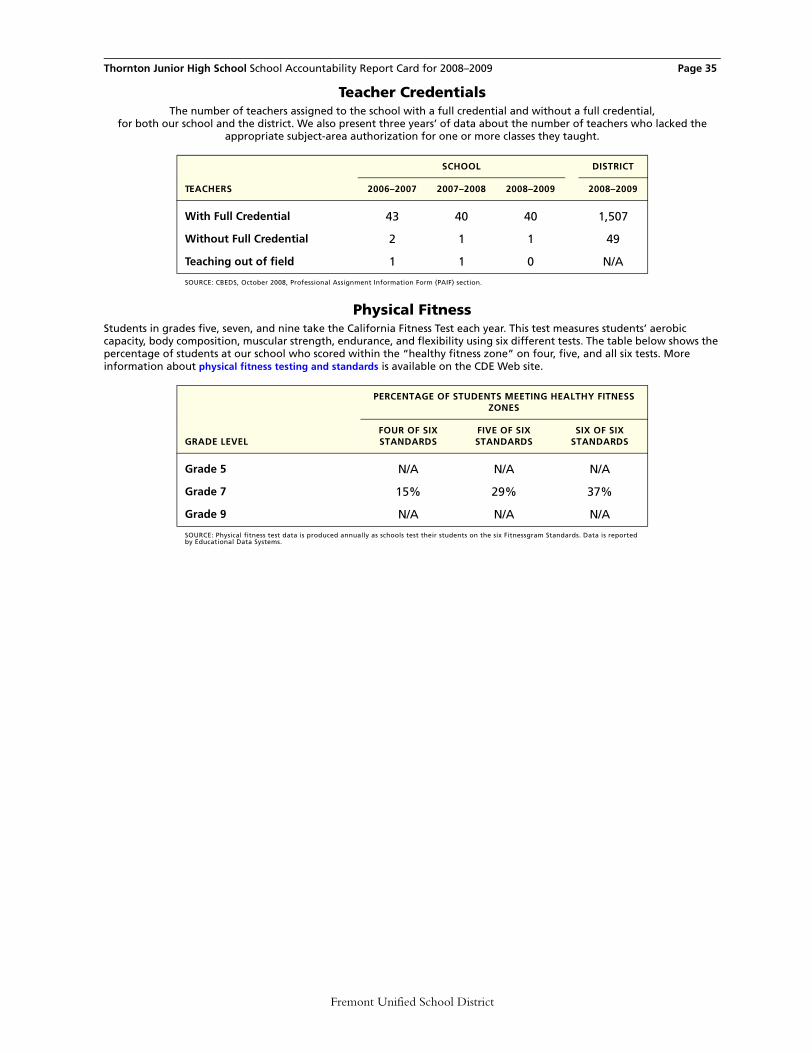
Thornton Junior High School School Accountability Report Card for 2008–2009 Page 35
Teacher CredentialsThe number of teachers assigned to the school with a full credential and without a full credential,
for both our school and the district. We also present three years’ of data about the number of teachers who lacked the appropriate subject-area authorization for one or more classes they taught.
Physical FitnessStudents in grades five, seven, and nine take the California Fitness Test each year. This test measures students’ aerobic capacity, body composition, muscular strength, endurance, and flexibility using six different tests. The table below shows the percentage of students at our school who scored within the “healthy fitness zone” on four, five, and all six tests. More information about physical fitness testing and standards is available on the CDE Web site.
SCHOOL DISTRICT
TEACHERS 2006–2007 2007–2008 2008–2009 2008–2009
With Full Credential 43 40 40 1,507
Without Full Credential 2 1 1 49
Teaching out of field 1 1 0 N/A
SOURCE: CBEDS, October 2008, Professional Assignment Information Form (PAIF) section.
PERCENTAGE OF STUDENTS MEETING HEALTHY FITNESS ZONES
GRADE LEVELFOUR OF SIX STANDARDS
FIVE OF SIX STANDARDS
SIX OF SIX STANDARDS
Grade 5 N/A N/A N/A
Grade 7 15% 29% 37%
Grade 9 N/A N/A N/A
SOURCE: Physical fitness test data is produced annually as schools test their students on the six Fitnessgram Standards. Data is reported by Educational Data Systems.
Fremont Unified School District
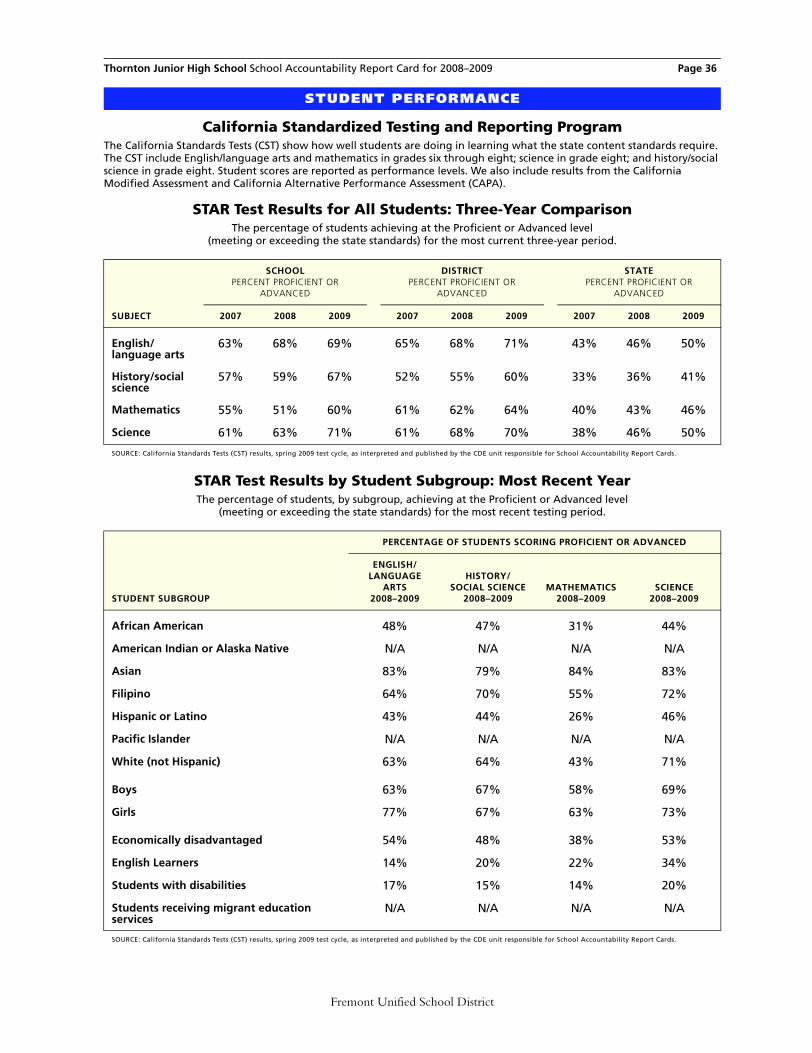
Thornton Junior High School School Accountability Report Card for 2008–2009 Page 36
California Standardized Testing and Reporting ProgramThe California Standards Tests (CST) show how well students are doing in learning what the state content standards require. The CST include English/language arts and mathematics in grades six through eight; science in grade eight; and history/social science in grade eight. Student scores are reported as performance levels. We also include results from the California Modified Assessment and California Alternative Performance Assessment (CAPA).
STAR Test Results for All Students: Three-Year ComparisonThe percentage of students achieving at the Proficient or Advanced level
(meeting or exceeding the state standards) for the most current three-year period.
STAR Test Results by Student Subgroup: Most Recent YearThe percentage of students, by subgroup, achieving at the Proficient or Advanced level
(meeting or exceeding the state standards) for the most recent testing period.
STUDENT PERFORMANCE
SCHOOLPERCENT PROFICIENT OR
ADVANCED
DISTRICTPERCENT PROFICIENT OR
ADVANCED
STATEPERCENT PROFICIENT OR
ADVANCED
SUBJECT 2007 2008 2009 2007 2008 2009 2007 2008 2009
English/language arts
63% 68% 69% 65% 68% 71% 43% 46% 50%
History/social science
57% 59% 67% 52% 55% 60% 33% 36% 41%
Mathematics 55% 51% 60% 61% 62% 64% 40% 43% 46%
Science 61% 63% 71% 61% 68% 70% 38% 46% 50%
SOURCE: California Standards Tests (CST) results, spring 2009 test cycle, as interpreted and published by the CDE unit responsible for School Accountability Report Cards.
PERCENTAGE OF STUDENTS SCORING PROFICIENT OR ADVANCED
STUDENT SUBGROUP
ENGLISH/LANGUAGE
ARTS2008–2009
HISTORY/SOCIAL SCIENCE
2008–2009MATHEMATICS
2008–2009SCIENCE
2008–2009
African American 48% 47% 31% 44%
American Indian or Alaska Native N/A N/A N/A N/A
Asian 83% 79% 84% 83%
Filipino 64% 70% 55% 72%
Hispanic or Latino 43% 44% 26% 46%
Pacific Islander N/A N/A N/A N/A
White (not Hispanic) 63% 64% 43% 71%
Boys 63% 67% 58% 69%
Girls 77% 67% 63% 73%
Economically disadvantaged 54% 48% 38% 53%
English Learners 14% 20% 22% 34%
Students with disabilities 17% 15% 14% 20%
Students receiving migrant education services
N/A N/A N/A N/A
SOURCE: California Standards Tests (CST) results, spring 2009 test cycle, as interpreted and published by the CDE unit responsible for School Accountability Report Cards.
Fremont Unified School District
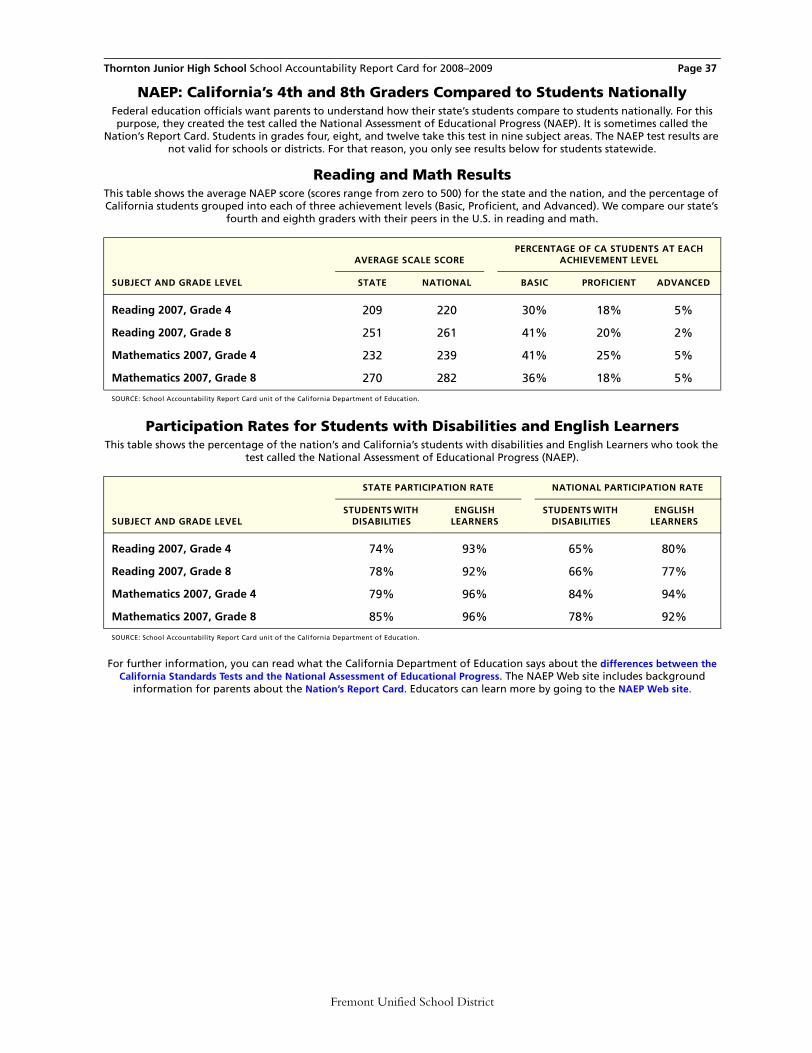
Thornton Junior High School School Accountability Report Card for 2008–2009 Page 37
NAEP: California’s 4th and 8th Graders Compared to Students NationallyFederal education officials want parents to understand how their state’s students compare to students nationally. For this purpose, they created the test called the National Assessment of Educational Progress (NAEP). It is sometimes called the
Nation’s Report Card. Students in grades four, eight, and twelve take this test in nine subject areas. The NAEP test results are not valid for schools or districts. For that reason, you only see results below for students statewide.
Reading and Math ResultsThis table shows the average NAEP score (scores range from zero to 500) for the state and the nation, and the percentage of California students grouped into each of three achievement levels (Basic, Proficient, and Advanced). We compare our state’s
fourth and eighth graders with their peers in the U.S. in reading and math.
Participation Rates for Students with Disabilities and English LearnersThis table shows the percentage of the nation’s and California’s students with disabilities and English Learners who took the
test called the National Assessment of Educational Progress (NAEP).
For further information, you can read what the California Department of Education says about the differences between the California Standards Tests and the National Assessment of Educational Progress. The NAEP Web site includes background
information for parents about the Nation’s Report Card. Educators can learn more by going to the NAEP Web site.
AVERAGE SCALE SCOREPERCENTAGE OF CA STUDENTS AT EACH
ACHIEVEMENT LEVEL
SUBJECT AND GRADE LEVEL STATE NATIONAL BASIC PROFICIENT ADVANCED
Reading 2007, Grade 4 209 220 30% 18% 5%
Reading 2007, Grade 8 251 261 41% 20% 2%
Mathematics 2007, Grade 4 232 239 41% 25% 5%
Mathematics 2007, Grade 8 270 282 36% 18% 5%
SOURCE: School Accountability Report Card unit of the California Department of Education.
STATE PARTICIPATION RATE NATIONAL PARTICIPATION RATE
SUBJECT AND GRADE LEVELSTUDENTS WITH
DISABILITIESENGLISH
LEARNERSSTUDENTS WITH
DISABILITIESENGLISH
LEARNERS
Reading 2007, Grade 4 74% 93% 65% 80%
Reading 2007, Grade 8 78% 92% 66% 77%
Mathematics 2007, Grade 4 79% 96% 84% 94%
Mathematics 2007, Grade 8 85% 96% 78% 92%
SOURCE: School Accountability Report Card unit of the California Department of Education.
Fremont Unified School District

Thornton Junior High School School Accountability Report Card for 2008–2009 Page 38
California Academic Performance Index (API)The Academic Performance Index (API) is an annual measure of the academic performance and progress of schools in California. APIs range from 200 to 1000, with a statewide target of 800. Detailed information about the API can be found on the CDE Web site at http://www.cde.ca.gov/ta/ac/ap/.
API Ranks: Three-Year ComparisonThe state assigns statewide and similar-schools API ranks for all schools. The API ranks range from 1 to 10. A statewide rank of 1 means that the school has an API in the lowest 10 percent of all middle schools in the state, while a statewide rank of 10 means that the school has an API in the highest 10 percent of all middle schools in the state. The similar-schools API rank reflects how a school compares with 100 statistically matched schools that have similar teachers and students.
API Changes by Subgroup: Three-Year ComparisonAPI changes for all students and student subgroups: the actual API changes in points added or lost for the past three years, and the most recent API. Note: “N/A” means that the student group is not numerically significant.
ACCOUNTABILITY
API RANK 2006–2007 2007–2008 2008–2009
Statewide rank 9 9 9
Similar-schools rank 5 4 3
SOURCE: The API Base Report from August 2009.
ACTUAL API CHANGE API
SUBGROUP 2006–2007 2007–2008 2008–2009 2008–2009
All students at the school -12 +3 +31 868
African American N/A N/A N/A N/A
American Indian or Alaska Native N/A N/A N/A N/A
Asian +8 -2 +35 952
Filipino N/A N/A N/A 833
Hispanic or Latino -11 -4 +0 742
Pacific Islander N/A N/A N/A N/A
White (non Hispanic) -42 +7 +26 822
Economically disadvantaged -19 +9 +51 766
English Learners N/A N/A N/A N/A
Students with disabilities N/A N/A N/A N/A
SOURCE: The API Growth Report as released in the Accountability Progress Report in October 2009.
Fremont Unified School District

Thornton Junior High School School Accountability Report Card for 2008–2009 Page 39
Federal Adequate Yearly Progress (AYP) and Intervention ProgramsThe federal law known as No Child Left Behind requires that all schools and districts meet all three of the following criteria in order to attain Adequate Yearly Progress (AYP): (a) a 95-percent participation rate on the state’s tests (b) a CDE-mandated percentage of students scoring Proficient or higher on the state’s English/language arts and mathematics tests (c) an API of at least 590 or growth of at least one point
AYP for the DistrictWhether the district met the federal requirement for AYP overall,
and whether the school and the district met each of the AYP criteria.
Intervention Program: District Program Improvement (PI)Districts receiving federal Title I funding enter Program Improvement (PI) if they do not make AYP for two consecutive years in the same content area (English/language arts or mathematics) and for each grade span or on the same indicator (API or graduation rate). After entering PI, districts advance to the next level of intervention with each additional year that they do not make AYP.
AYP CRITERIA DISTRICT
Overall No
Graduation rate Yes
Participation rate in English/language arts Yes
Participation rate in mathematics Yes
Percent Proficient in English/language arts Yes
Percent Proficient in mathematics No
Met Academic Performance Index (API) Yes
SOURCE: The AYP Report as released in the Accountability Progress Report in September 2009.
INDICATOR DISTRICT
PI stage Not in PI
The year the district entered PI N/A
Number of schools currently in PI 1
Percentage of schools currently in PI 2%
SOURCE: The Program Improvement Report as released in the Accountability Progress Report in September 2009.
Fremont Unified School District

Thornton Junior High School School Accountability Report Card for 2008–2009 Page 40
According to the CDE’s SARC Data Definitions, “State certification/release dates for fiscal data occur in middle to late spring, precluding the inclusion of 2008–09 data in most cases. Therefore, 2007–08 data are used for report cards prepared during 2009–10.”
Total expenses include only the costs related to direct educational services to students. This figure does not include food services, land acquisition, new construction, and other expenditures unrelated to core educational purposes. The expenses-per-student figure is calculated by dividing total expenses by the district’s average daily attendance (ADA). More information is available on the CDE’s Web site.
District Salaries, 2007–2008This table reports the salaries of teachers and administrators in our district for the 2007–2008 school year. This table compares our average salaries with those in districts like ours, based on both enrollment and the grade level of our students. In addition, we report the percentage of our district’s total budget dedicated to teachers’ and administrators’ salaries. The costs of health insurance, pensions, and other indirect compensation are not included.
DISTRICT EXPENDITURES
CATEGORY OF EXPENSE OUR DISTRICT SIMILAR DISTRICTS ALL DISTRICTS
FISCAL YEAR 2007–2008
Total expenses $249,600,507 N/A N/A
Expenses per student $8,031 $8,680 $8,594
FISCAL YEAR 2006–2007
Total expenses $231,739,841 N/A N/A
Expenses per student $7,455 $8,193 $8,117
SOURCE: Fiscal Services Division, California Department of Education.
SALARY INFORMATIONDISTRICTAVERAGE
STATEAVERAGE
Beginning teacher’s salary
$54,866 $42,065
Midrange teacher’s salary $75,516 $67,109
Highest-paid teacher’s salary
$99,925 $86,293
Average principal’s salary (middle school)
$137,710 $112,279
Superintendent’s salary $240,240 $216,356
Percentage of budget for teachers’ salaries
46% 39%
Percentage of budget for administrators’ salaries
6% 6%
SOURCE: School Accountability Report Card unit of the California Department of Education.
rev20100119_01-61176-6056915m/12432
Fremont Unified School District

School Accountability Report Card for 2008–2009
TITLE SUBJECTDATE OF
PUBLICATION ADOPTION
DATE
Timeless Voices, Timeless Themes Language Arts 2002 2003
Algebra 1 Math 2007 2008
Concepts, Skills & Problem Solving (Pre-Algebra) Math 2008 2008
Physical Science: Concepts in Action Science 2006 2008
Focus on Life Science Science 2008 2007
Focus on Physical Science Science 2008 2007
US: Independence to 1914 Social Studies 2006 2006
WH: Medieval to Early Modern Times Social Studies 2006 2006
TEXTBOOKS
Textbook Adoption List
Fremont Unified School District
Page 41