
Scheduling Under Uncertainty: Planning for the Ubiquitous Grid Neal Sample Pedram Keyani Gio...
36
Scheduling Under Uncertainty: Planning for the Ubiquitous Grid Neal Sample Pedram Keyani Gio Wiederhold Stanford University
-
date post
21-Dec-2015 -
Category
Documents
-
view
218 -
download
1
Transcript of Scheduling Under Uncertainty: Planning for the Ubiquitous Grid Neal Sample Pedram Keyani Gio...

Scheduling Under Uncertainty:
Planning for the Ubiquitous Grid
Neal SamplePedram KeyaniGio Wiederhold
Stanford University

2 Coordination 2002
Why We’re Here
Coding
Integration/Composition
1970 1990 2010
3 Coordination 2002
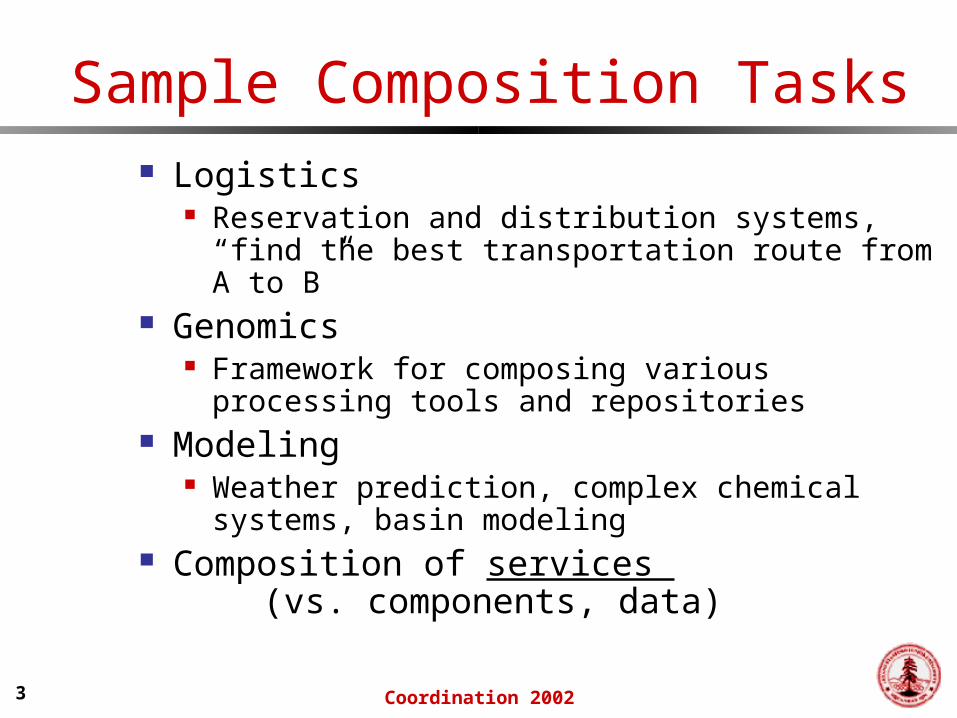
Sample Composition Tasks Logistics
Reservation and distribution systems, “find the best transportation route from A to B”
Genomics Framework for composing various processing
tools and repositories Modeling
Weather prediction, complex chemical systems, basin modeling
Composition of services (vs. components, data)

4 Coordination 2002
Remote, autonomous Services are not free
Fee (£) Execution time
Open Service Model GRID – principles UDDI, IETF SLP – protocols Globus, CPAM – runtime support
Composition of Large Services

5 Coordination 2002
Service Scheduling Goals Closest to Soft Real-time, Job Shop Objectives
Minimize transaction time Minimize transaction cost
Differences No control over service availability No control over resource allocation No control over workplace loads => Schedules become inaccurate

6 Coordination 2002
New Scheduling Requirements
Why not traditional scheduling (e.g., CSP)? Runtime performance changes More than just scheduling:
rescheduling in the face of runtime hazards
Why not traditional rescheduling? No resource allocation/control “Observe, not control”

7 Coordination 2002
Scheduling Difficulties Adaptation: Schedules must be adaptive
Schedules for T0 are only guesses Estimates for multiple stages may become
invalid => Schedules must be revised during runtime
Allocation: The scheduler does not handle resource allocation
Means: Competing objectives have orthogonal scheduling techniques Changing goals for tasks or users means
vastly increased scheduling complexity

8 Coordination 2002
Sample Program
//sample program
BEGIN
out1 = serviceA()
out2 = serviceB(out1)
out3 = serviceC(out2)
out4 = serviceD(out2)
END
//declarative
C
A
D
B

9 Coordination 2002
Budgeting
Time Maximum allowable execution time
Expense Total resources available to lease
services Surety
Schedule confidence Goal and assessment technique

10 Coordination 2002
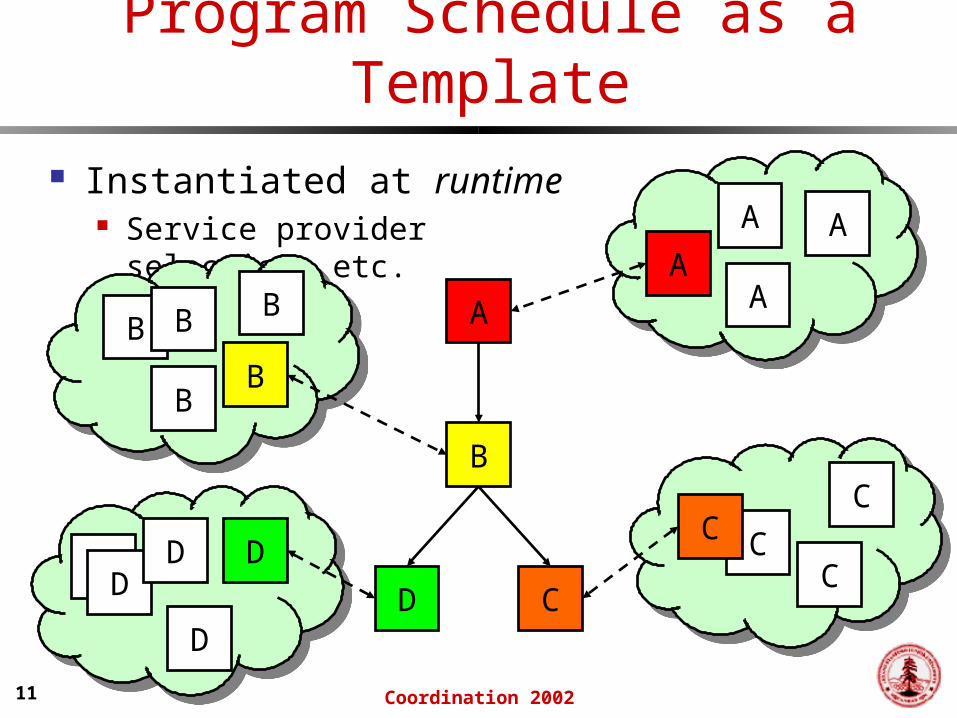
Program Schedule as a Template
Instantiated at runtime Service provider selection,
etc.
D
A
C
B
DDDD
D
A
A A
A
B
B B
B
B
CC
CC
11 Coordination 2002
Program Schedule as a Template
Instantiated at runtime Service provider selection,
etc.
D
A
C
B
DDDD
D
A
A A
A
B
B B
B
B
CC
CC

12 Coordination 2002
Steps in Scheduling
Estimation
Planning
Invocation
Monitoring
Completion
Rescheduling

13 Coordination 2002
CHAIMS Scheduler
ProgramAnalyzer
Input program
Planner
Requirements
Estimator/Bidder
Monitor Dispatcher
StatusCosts/Times Control
observe invokehaggle
Budget

14 Coordination 2002
t0 Schedule Selection
Guided by runtime “bids” Constrained by budget
D
A
C
B
DDDD
D
A
A A
A
B
B B
B
B
CC
CC
7±2h£50
6±1h£40
5±2h£30
3±1h£30

15 Coordination 2002
t0 Schedule Constraints
Budget Time: upper bound - e.g. 22h Cost: upper bound - e.g. £250 Surety: lower bound - e.g. 90% {22, 250, 90}
Steered by user preferences/weights <Time, Cost, Surety> = <10, 1, 5>
Selection (single value convolution) S1est [20, 150, 90] = (22-20)*10 + (250-150)*1 + (90-90)*5 = 120 S2est [22, 175, 95] = (22-22)*10 + (250-175)*1 + (95-90)*5 = 100 S3est [18, 190, 96] = (22-18)*10 + (250-190)*1 + (96-90)*5 = 130

16 Coordination 2002
Program Evaluation and Review Technique (PERT)
Service times:most likely(m), optimistic(a) and pessimistic(b)
32
2 iii
i
bam
e
6ii
i
ab
and iee 2iprogram
;programxet
program
etx
programprogram
eteTtTprob
)(
program
et
N(0, 1)
(1) expected duration (service)
(2) standard deviation
(3) expected duration (program)
(4) test value
(5) expectation test
(6) ~expectation test

17 Coordination 2002
t0 Schedule Properties
0
5
10
15
20
25
30
13 14 15 16 17 18 19 20 21 22 23
Pro
bab
ility
Den
sity
Probable Completion Time
deadlineBank = £100 surety

18 Coordination 2002
Runtime Hazards With resource allocation or without
hazards Scheduling becomes trivial
Runtime implies t0 schedule invalidation Sample hazards
Delays and slowdowns Stoppages Inaccurate estimations Communication loss Competitive displacement… OSM

19 Coordination 2002
Definition + Detection
execution time080
100
minimumsurety
hazard
90
sure
ty %
PROGRESSIVE HAZARD
serviceAstart
serviceBstart
(serviceB slow)
20 Coordination 2002
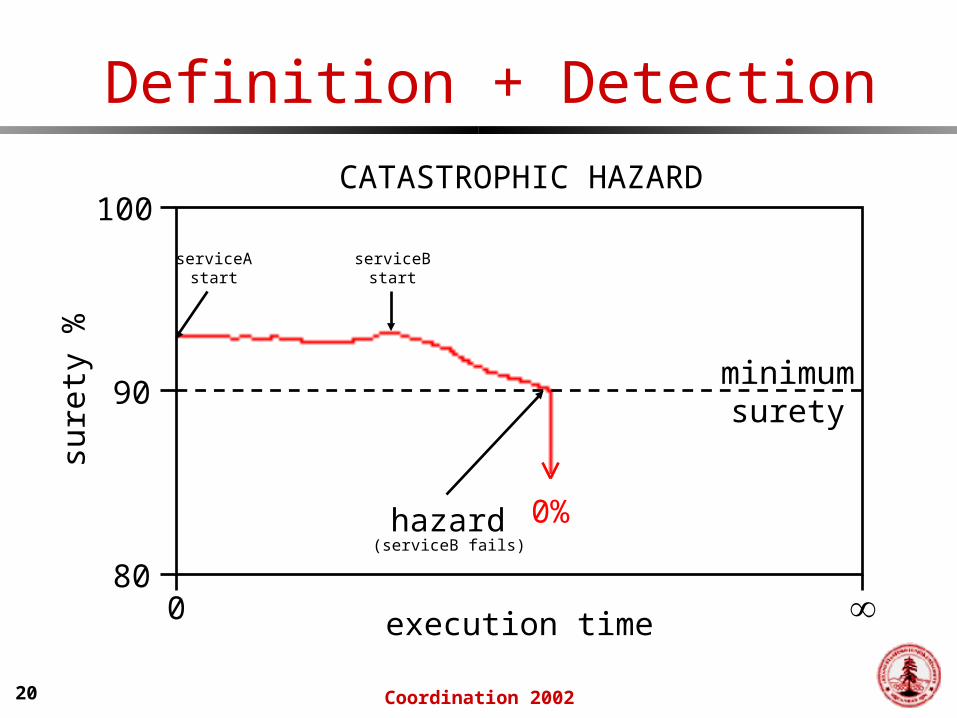
Definition + Detection
execution time080
100
minimumsurety
hazard
90
sure
ty %
CATASTROPHIC HAZARD
0%
serviceAstart
serviceBstart
(serviceB fails)
21 Coordination 2002
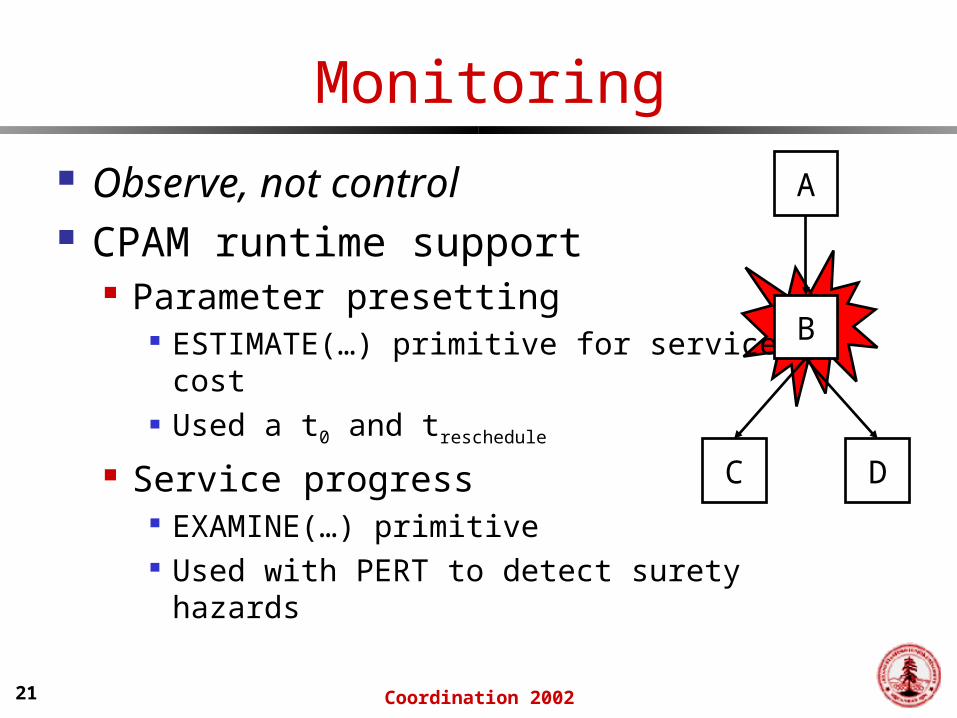
Monitoring
Observe, not control CPAM runtime support
Parameter presetting ESTIMATE(…) primitive for service cost Used a t0 and treschedule
Service progress EXAMINE(…) primitive Used with PERT to detect surety hazards
C
A
D
B

22 Coordination 2002
Schedule Repair
Simple cost model: early termination = linear £ recovery
Greedy selection of single repair – O(s*r)
execution time080
100
thazard
90
sure
ty %
C
A
D
B
trepair

23 Coordination 2002
Strategy 1: service replacement
Pro: minimize £ lost Pro: boost surety Con: lost investment of £ and time Con: concedes recovery chance
execution time080
100
thazard
90
sure
ty %
C
A
D
B
trepair
B’
24 Coordination 2002
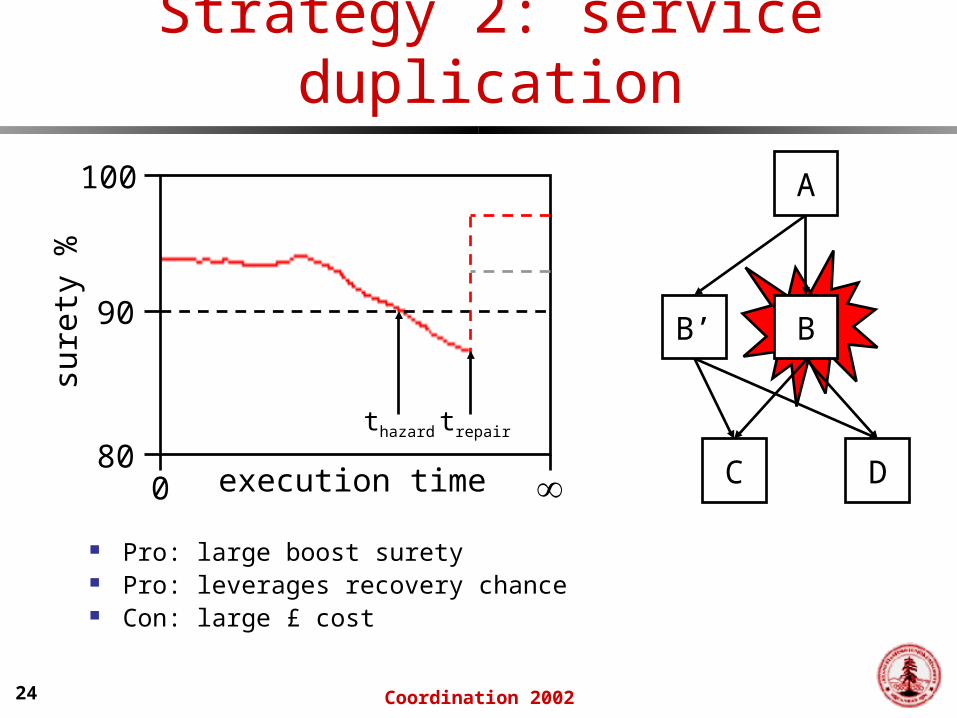
Strategy 2: service duplication
Pro: large boost surety Pro: leverages recovery chance Con: large £ cost
execution time080
100
thazard
90
sure
ty %
C
A
D
B
trepair
B’

25 Coordination 2002
Strategy 3: pushdown repair
Pro: cheap, no £ lost Pro: no time lost Con: cannot handle all hazard types, e.g. catastrophic hazards Con: requires recovery chance
execution time080
100
thazard
90
sure
ty %
C
A
D
B
trepair
C’
x

26 Coordination 2002
Strategy 4: do nothing/bail-out
Pro: no additional £ cost Pro: ideal solution for partitioning hazards Con: generally non-effective Con: depends on self-recovery
execution time080
100
thazard
90
sure
ty %
trepair
C
A
D
B
27 Coordination 2002
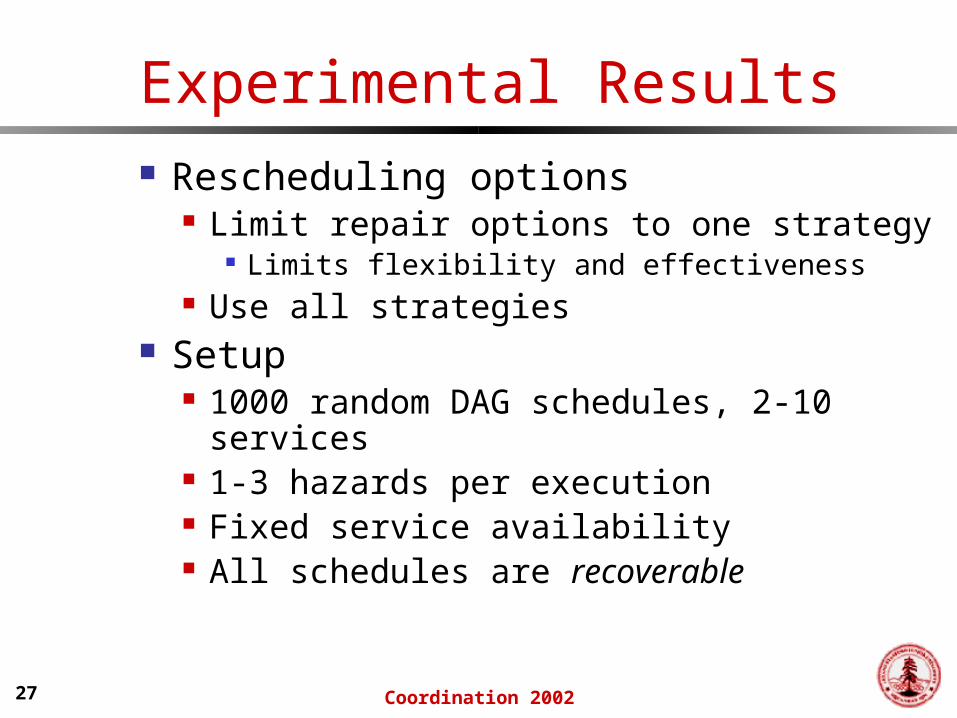
Experimental Results Rescheduling options
Limit repair options to one strategy Limits flexibility and effectiveness
Use all strategies Setup
1000 random DAG schedules, 2-10 services
1-3 hazards per execution Fixed service availability All schedules are recoverable

28 Coordination 2002
“The Numbers”
0
200
400
600
800
1000
do nothing replacement duplication all ideal
Value of close finishes? (!= 100% surety)

29 Coordination 2002
Why the Differences? Catastrophic hazard
Service provider failure - Cannot be solved by “do nothing”
Pseudo-hazard Communication failure, network partition Looks exactly like catastrophic hazard Can’t terminate for £ recovery - Appropriate solution is “do nothing”
Slowdown hazard (actual or apparent) Not a complete failure, multiple solutions - “do nothing” may be ideal or futile

30 Coordination 2002
A Fundamental Weakness Observations of progress are only
secondary indicators of current work rate
0
10
20
30
40
50
60
70
80
90
100
0 50 100 150 200
execution time
pro
gre
ss
%
projected finish
finish time

31 Coordination 2002
Open Questions Mundane issues
Taxonomy of hazard/solution combinations Vary service provider densities
Monitor resolution adjustments Networks are not free or zero latency Unstudied effect delayed status information
Pseudo-hazards What is a good amount of delay to avoid them?
(without getting into deeper trouble…) Accuracy of t0 service cost estimates
~hazard with delayed detection 1-way hazard
32 Coordination 2002
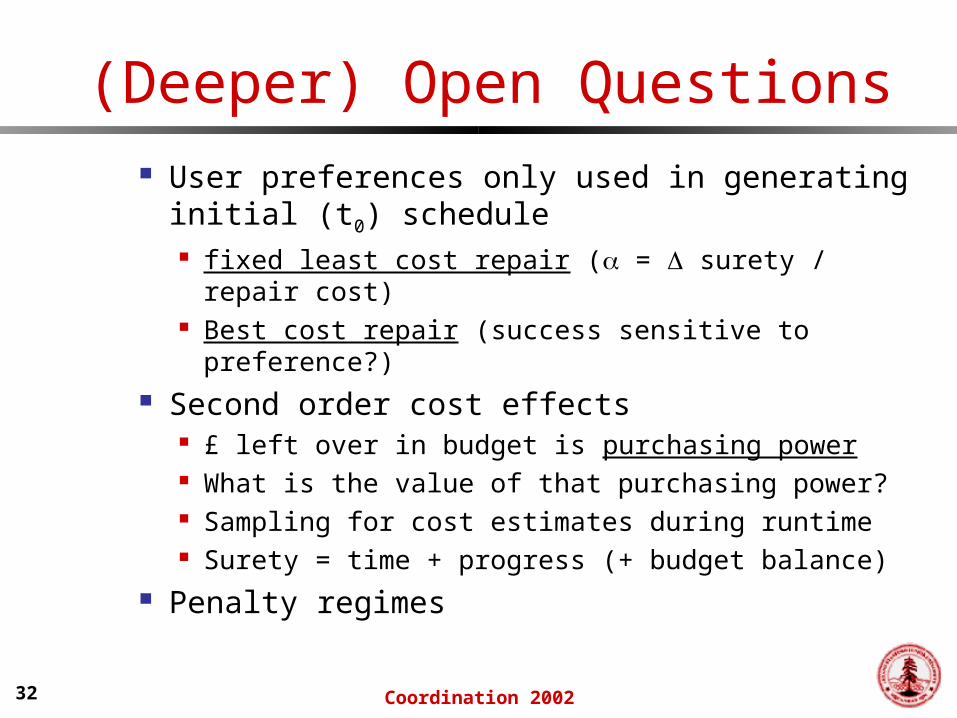
(Deeper) Open Questions User preferences only used in generating
initial (t0) schedule fixed least cost repair ( = surety / repair cost) Best cost repair (success sensitive to preference?)
Second order cost effects £ left over in budget is purchasing power What is the value of that purchasing power? Sampling for cost estimates during runtime Surety = time + progress (+ budget balance)
Penalty regimes

33 Coordination 2002
(Deeper) Open Questions
Simultaneous rescheduling Use more than one strategy for a
hazard NP – reduction to Hamiltonian Path NP here might not be that hard…
Approximations are acceptable Small set Strong constraints NP is worst case, not average case…

34 Coordination 2002
(Deeper) Open Questions
on time
target
start/run
finish
+
data transportation costs+
Completing the cost model

35 Coordination 2002
(Deeper) Open Questions
client ready to start
hold fee
late
early on time
target
start/run
reservation
finish
client ready for data
+ -+
+ +
data transportation costs+
Completing the cost model

36 Coordination 2002
Conclusions Initial results given artificial hazards
Seemingly effective rescheduling strategies
Difficult to characterize the solutions Should translate well out of the sandbox
and into an actual runtime Clear directions for continued research
Project home http://www-db.stanford.edu/CHAIMS/