Schedule F.1: Health and Human Services System Strategic ... · F.1-3 Executive Summary The Health...
84
Schedule F.1: Health and Human Services System Strategic Staffing Analysis and Workforce Plan for the Planning Period 2017–2021
Transcript of Schedule F.1: Health and Human Services System Strategic ... · F.1-3 Executive Summary The Health...

Schedule F.1: Health and Human Services System Strategic Staffing Analysis and Workforce Plan
for the Planning Period 2017–2021

F.1-2

F.1-3
Executive Summary The Health and Human Services (HHS) System Strategic Staffing Analysis and Workforce Plan is an integral part of HHS’ staffing plan. Workforce planning is a business necessity due to a number of factors, including: constraints on funding; increasing demand for HHS services; increasing number of current employees reaching retirement age resulting in fewer,
less experienced workers available as replacements; and increasing competition for highly skilled employees. HHS agencies are proactively addressing this challenge by preparing for the future and reducing risks. Designed for flexibility, the HHS System Strategic Staffing Analysis and Workforce Plan allows HHS executive management to make staffing adjustments according to the changing needs of HHS agencies. State leaders in Texas recognize the importance of workforce planning. As part of their strategic plans, state agencies are required under the Texas Government Code, Section 2056.0021, to develop a workforce plan in accordance with the guidelines developed by the State Auditor’s Office (SAO). To meet these requirements, this Schedule attachment to the HHS System Strategic Plan for the Fiscal Years 2017–2021 analyzes the following key elements for the entire HHS System: Current Workforce Demographics – Describes how many employees work for the
HHS System and HHS agencies, where they work, what they are paid, how many of them are return-to-work retirees, how many have left HHS, how many may retire, and whether or not minority groups are underutilized when compared to the state Civilian Labor Force (CLF) for Equal Employment Opportunity (EEO) job categories. The workforce is examined by gender, race, age and length of state service.
Expected Workforce Challenges – Describes anticipated staffing needs based on population trends, projected job growth and other demographic trends. A detailed examination of each identified shortage occupation was conducted to identify and understand retention and recruitment problems.
Strategies to Meet Workforce Needs – Describes recruitment and retention strategies that address expected workforce challenges for shortage occupation jobs.
The following is the detailed HHS System Strategic Staffing Analysis and Workforce Plan.

F.1-4

F.1-5
HEALTH AND HUMAN SERVICES SYSTEM STRATEGIC STAFFING ANALYSIS AND WORKFORCE PLAN
TABLE OF CONTENTS
EXECUTIVE SUMMARY ..................................................................................... F.1-3
HEALTH AND HUMAN SERVICES SYSTEM ..................................................... F.1-7 Overview .................................................................................................... F.1-7 HHS Mission ............................................................................................... F.1-8 HHS Vision ................................................................................................. F.1-8 HHS Values ................................................................................................ F.1-8
WORKFORCE DEMOGRAPHICS ..................................................................... F.1-11 Job Families ............................................................................................. F.1-12 Gender ..................................................................................................... F.1-12 Race ......................................................................................................... F.1-13 Age ........................................................................................................... F.1-14 Utilization Analysis ................................................................................... F.1-15 State Service ............................................................................................ F.1-17 Average Annual Employee Salary ............................................................ F.1-18 Return-to-Work Retirees .......................................................................... F.1-19
TURNOVER ....................................................................................................... F.1-21
RETIREMENT PROJECTIONS ......................................................................... F.1-25
CRITICAL WORKFORCE SKILLS ..................................................................... F.1-27
ENVIRONMENTAL ASSESSMENT ................................................................... F.1-29 The Texas Economy ................................................................................ F.1-29 Poverty in Texas ....................................................................................... F.1-29 Unemployment ......................................................................................... F.1-30 Other Significant Factors .......................................................................... F.1-30
EXPECTED WORKFORCE CHALLENGES ...................................................... F.1-33 Direct Care Workers (Direct Support Professionals and Psychiatric Nursing Assistants) ................................................................................................ F.1-33 Food Service Workers .............................................................................. F.1-36 Protective Services Workers .................................................................... F.1-37 Child Protective Services (CPS) Workers ................................................ F.1-38 Eligibility Services Staff ............................................................................ F.1-40 Inspector General's Office (IG) Staff......................................................... F.1-43 Claims Examiners .................................................................................... F.1-45 Social Workers ......................................................................................... F.1-45

Schedule F.1: HHS System Workforce Plan
F.1-6
Registered Therapists ............................................................................... F.1-47 Registered Nurses (RNs) .......................................................................... F.1-49 Licensed Vocational Nurses (LVNs) ......................................................... F.1-54 Nurse Practitioners and Physician Assistants ........................................... F.1-56 Pharmacists .............................................................................................. F.1-58 Dentists ..................................................................................................... F.1-60 Physicians ................................................................................................ F.1-61 Psychiatrists ............................................................................................. F.1-65 Psychologists ............................................................................................ F.1-68 Epidemiologists......................................................................................... F.1-70 Sanitarians ................................................................................................ F.1-71 Laboratory Staff ........................................................................................ F.1-72
DEVELOPMENT STRATEGIES TO MEET WORKFORCE NEEDS ................. F.1-77 Recruitment Strategies ............................................................................. F.1-77 Retention Strategies ................................................................................. F.1-81
Prepared by: System Support Services Human Resources Office

Schedule F.1: HHS System Workforce Plan
F.1-7
HEALTH AND HUMAN SERVICES SYSTEM
OVERVIEW
The 78th Legislature Transformation The 78th Legislature (Regular Session, 2003) transformed the Health and Human Services (HHS) agencies listed in Article II of the General Appropriations Act by creating an integrated, effective and accessible HHS System that protects public health and brings high-quality services and support to Texans in need. The HHS System consists of the following five agencies: Health and Human Services Commission (HHSC). Includes providing
leadership to all HHS agencies, administering programs previously administered by the Texas Department of Human Services and oversight of HHS agencies. Began services in 1991.
Department of Family and Protective Services (DFPS). Includes all programs previously administered by the Department of Protective and Regulatory Services. Began services on February 1, 2004.
Department of Assistive and Rehabilitative Services (DARS). Includes programs previously administered by the Texas Rehabilitation Commission, Commission for the Blind, Commission for the Deaf and Hard of Hearing and Interagency Council on Early Childhood Intervention. Began services on March 1, 2004.
Department of Aging and Disability Services (DADS). Includes intellectual and developmental disability and state supported living center programs previously administered by the Department of Mental Health and Mental Retardation, community care and nursing home services and long-term care regulatory programs of the Department of Human Services and aging services programs of the Texas Department of Aging. Began services on September 1, 2004.
Department of State Health Services (DSHS). Includes programs previously administered by the Texas Department of Health, the Texas Commission on Alcohol and Drug Abuse, the Health Care Information Council and mental-health community services and state hospital programs from the Department of Mental Health and Mental Retardation. Began services on September 1, 2004.
The 84th Legislature Transformation In 2013, the Sunset Commission began its almost two-year analysis, the first formal review of the previous consolidation. The findings and recommendations of the Sunset review formed the basis for the 84th Texas Legislature’s directive to transform the HHS system. With the passage of that legislation, HHS was given an opportunity to develop a more fully streamlined, efficient system that more effectively

Schedule F.1: HHS System Workforce Plan
F.1-8
provides services and benefits. Senate Bill 200 outlined a phased approach to this restructuring. The first phase transfers the following programs and functions to HHSC by September 1, 2016: select functions at DARS, client services at DADS and DSHS, and administrative services that support those respective HHS core services. As a result of this transfer and the transfer of other programs to the Texas Workforce Commission (TWC), DARS will be abolished on September 1, 2016. Additionally, the Nurse Family Partnership and Texas Home Visiting programs transfer from HHSC to the DFPS, which will continue its focus on protective services. In the second phase, regulatory programs as well as management of the operations of the state supported living centers and state hospitals will transfer to HHSC by September 1, 2017, and DADS will be abolished. After these transfers, DSHS’ streamlined structure will focus on its core public health functions.
HHS MISSION Improving the health, safety and well-being of Texans through good stewardship of public resources.
HHS VISION Making a difference in the lives of the people we serve.
HHS VALUES Accountability. We operate in a manner that reflects honesty, integrity and
reliability. Collaboration. We work with clients, stakeholders, public and private partners,
elected officials and our employees to make informed decisions and achieve excellence in service design and delivery.
Client-focused. We exist because people have needs, and we respect each and every person.
Independence. Our services and supports allow clients to reach their full potential.

Schedule F.1: HHS System Workforce Plan
F.1-9
Stewardship. We are focused on the appropriate use of resources entrusted to our care and use them efficiently, effectively and in a manner that builds public trust.
Transparency. We build confidence in our operations by being open, inclusive and holding ourselves accountable.
Diversity. We offer programs and services that value and respect the diversity of the State of Texas.

Schedule F.1: HHS System Workforce Plan
F.1-10

Schedule F.1: HHS System Workforce Plan
F.1-11
WORKFORCE DEMOGRAPHICS With a total of 54,018 full-time and part-time employees, the HHS workforce has increased by about one percent (545 employees) in the period from August 31, 2013 to August 31, 2015.1
Figure 1: HHS System Workforce for FY 13 - FY 15
Figure 2: HHS System Workforce for FY 15
1 HHSAS Database, as of 8/31/15.
0 10,000 20,000 30,000 40,000 50,000
FY13
FY14
FY15
53,473
54,558
54,018
0 2,000 4,000 6,000 8,000 10,000 12,000 14,000 16,000
DSHS
DADS
DARS
DFPS
HHSC
11,985
15,420
2,889
11,646
12,078

Schedule F.1: HHS System Workforce Plan
F.1-12
Job Families Approximately 91 percent of HHS employees (49,219 employees) work in 20 job families.2
Table 1: Largest Program Job Families
Job Family Number of EmployeesDirect Care Workers3 9,115Human Services Specialists 7,003Protective Services Workers4 6,596Eligibility Workers5 5,995Clerical Workers 5,399Program Specialists 2,969Registered Nurses (RNs)6 1,967Manager 1,249Licensed Vocational Nurse (LVNs) 1,028Rehabilitation Technicians 1,010CPS Supervisors 1,009Food Service Workers7 925System Analysts 883Human Services Technicians 735Custodians 707Maintenance Workers 581Program Supervisors 576Inspectors 569Claims Examiners 460Accountants 443
Gender Most HHS employees are female, making up about 75 percent of the HHS workforce.8 This breakdown is consistent across all HHS agencies.9
2 HHSAS Database, as of 8/31/15. 3 Direct care workers include direct support professionals and psychiatric nursing assistants. 4 Protective service workers include child protective service (CPS) specialists, CPS investigators, adult protective service (APS) specialists, state wide intake (SWI) specialists, Child Care Licensing (CCL) and residential licensing services (RCCL) specialists. 5 Eligibility workers include Texas works advisors, hospital based workers and medical eligibility specialists. 6 RNs include public health nurses. 7 Food service workers include food service workers, managers and cooks. 8 HHSAS Database, as of 8/31/15. 9 Ibid.

Schedule F.1: HHS System Workforce Plan
F.1-13
Table 2: HHS System Workforce Gender for FY 13 – FY 15
Gender FY 13 FY 14 FY 15 Male 25.1% 24.9% 24.9% Female 74.9% 75.1% 75.1%
Figure 3: HHS System Workforce by Gender for FY 15
Table 3: HHS Agencies by Gender
Agency Percentage Male Percentage Female HHSC 21.2% 78.8%DFPS 15.8% 84.2%DSHS 36.0% 64.0%DARS 24.4% 75.6%DADS 26.2% 73.8%
Race The workforce is diverse, with approximately 39 percent White, 30 percent Hispanic, 28 percent Black, and three percent Asian and Native American. This breakdown is consistent across all HHS agencies.10
10 HHSAS Database, as of 8/31/15.
Male25%
Female75%

Schedule F.1: HHS System Workforce Plan
F.1-14
Table 4: HHS System Workforce Race for FY 13 – FY 1511
Race FY 13 FY 14 FY 15 White 40.6% 39.9% 39.4%Black 27.4% 27.9% 28.1%Hispanic 29.3% 29.3% 29.6%Native American .6% .6% .5%Asian 2.1% 2.3% 2.3%
Figure 4: HHS System Workforce by Race for FY 15
Table 5: HHS Agencies by Race12
Agency Percentage
White Percentage
Black Percentage
Hispanic
Percentage Native
American Percentage
Asian HHSC 30.6% 28.3% 38.6% 0.6% 1.9%DFPS 39.7% 29.2% 29.1% 0.6% 1.3%DSHS 48.8% 19.0% 28.4% 0.6% 3.3%DARS 46.4% 22.7% 28.1% 0.7% 2.2%DADS 37.5% 35.4% 24.0% 0.4% 2.7%
Age The average age of an HHS worker is 43 years. This breakdown is consistent across all HHS agencies.13
11 Totals may not equal 100% due to rounding. 12 Ibid. 13 HHSAS Database, as of 8/31/15.
Hispanic29%
White39%
Black28%Asian
2%
Native American<1%

Schedule F.1: HHS System Workforce Plan
F.1-15
Table 6: HHS System Workforce Age for FY 13 – FY 15
Age FY 13 FY 14 FY 15 Under 30 16.3% 16.8% 16.4%30-39 22.9% 23.5% 23.8%40-49 26.1% 25.5% 25.1%50-59 24.8% 24.2% 24.1%Over 60 9.9% 10.1% 10.4%
Figure 5: HHS System Workforce by Age for FY 15
Average age: 43 yrs
Table 7: HHS Agencies by Age14
Agency Percentage Under 30
Percentage 30-39
Percentage 40-49
Percentage 50-59
Percentage 60 and over
HHSC 10.6% 24.8% 29.7% 25.5% 9.4%DFPS 20.5% 32.4% 24.8% 16.2% 6.2%DSHS 16.0% 20.0% 22.9% 27.4% 13.7%DARS 6.6% 20.0% 27.5% 30.6% 15.3%DADS 20.1% 20.4% 23.2% 25.3% 11.0%
Utilization Analysis Texas law requires that each state agency analyze its workforce and compare the number of Blacks, Hispanics and females employed by the agency to the available state Civilian Labor Force (CLF) for each job category.
14 Totals may not equal 100% due to rounding.
Under 30 yrs17%
30 - 39 yrs24%
40 - 49 yrs25%
50 - 59 yrs24%
60 yrs and over10%

Schedule F.1: HHS System Workforce Plan
F.1-16
The utilization analysis was conducted for each HHS agency using the 80% Rule. This rule compares the actual number of employees to the expected number of employees based on the available state CLF for Black, Hispanic and female employees. For purposes of this analysis, a group is considered underutilized when the actual representation in the workforce is less than 80% of what the expected number would be based on the CLF. The HHS Civil Rights Office (CRO) reviewed and conducted analyses for each individual agency’s workforce to determine where underutilization was identified. The utilization analysis of the HHS agencies for fiscal year 2015 indicated underutilization in the DADS and DSHS workforce. The following table summarizes the results of the utilization analysis for the agencies of the HHS System.
Table 8: HHS System Utilization Analysis Results15 16 17
HHS System
Agency
Job Category HHSC DFPS DARS DADS DSHS Officials/ Administrators No No No No Hispanic No
Professionals No No No No No No
Technicians No No No N/A Hispanic No
Protective Service No N/A No N/A No
Hispanic Female
Administrative Support No No No No No No
Skilled Craft Black
Hispanic N/A N/A N/A Hispanic Hispanic
Service Maintenance Hispanic N/A N/A N/A Hispanic Hispanic
Although underutilization was identified in the Skilled Craft job category, it should be noted that this job category comprises only 1.2 percent of the HHS System workforce. The other job categories showing underutilization are Officials/Administrators, Technicians, Protective Service, and Service Maintenance.
15 HHSAS Database, as of 8/31/15. 16 Data for underutilization percentages comes from Civilian Labor Force (CLF) Equal Employment Opportunity and Minority Hiring Practices Report Fiscal Years 2013-2014 published by Texas Workforce Commission, January 2015. Note: CLF data from TWC did not include Para-Professionals as a job category and did not indicate if members of that category were counted as part of any other categories - as a result, it is not included in the above chart. 17 “N/A” indicates the number of employees in these categories was too small (less than 30) to test any differences for statistical significance.
Schedule F.1: HHS System Workforce Plan
F.1-17
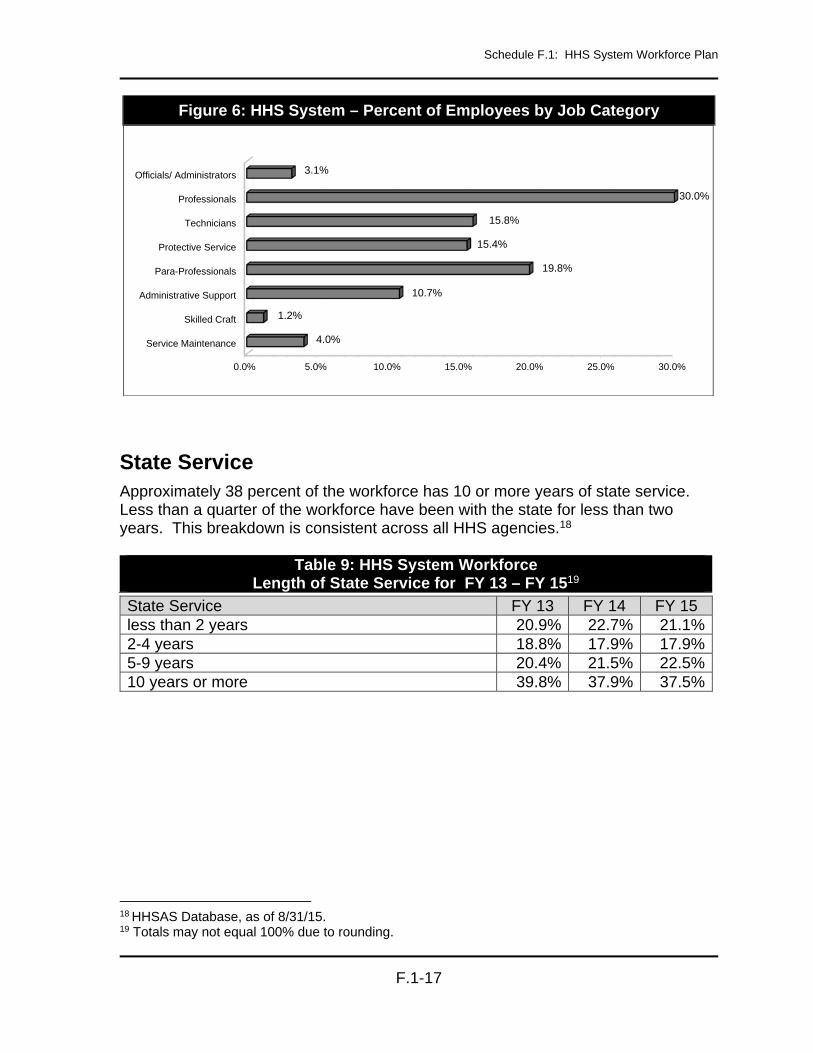
Figure 6: HHS System – Percent of Employees by Job Category
State Service Approximately 38 percent of the workforce has 10 or more years of state service. Less than a quarter of the workforce have been with the state for less than two years. This breakdown is consistent across all HHS agencies.18
18 HHSAS Database, as of 8/31/15. 19 Totals may not equal 100% due to rounding.
0.0% 5.0% 10.0% 15.0% 20.0% 25.0% 30.0%
Service Maintenance
Skilled Craft
Administrative Support
Para-Professionals
Protective Service
Technicians
Professionals
Officials/ Administrators
4.0%
1.2%
10.7%
19.8%
15.4%
15.8%
30.0%
3.1%
Table 9: HHS System Workforce Length of State Service for FY 13 – FY 1519
State Service FY 13 FY 14 FY 15 less than 2 years 20.9% 22.7% 21.1%2-4 years 18.8% 17.9% 17.9%5-9 years 20.4% 21.5% 22.5%10 years or more 39.8% 37.9% 37.5%

Schedule F.1: HHS System Workforce Plan
F.1-18
Figure 7: HHS System Workforce by Length of State Service
Table 10: HHS Agencies by Length of State Service20
Agency Percentage
Less than 2 yrsPercentage
2-4 yrs Percentage
5-9 yrs Percentage
10 yrs or moreHHSC 18.1% 16.7% 25.0% 40.2%DFPS 24.7% 17.7% 25.2% 32.5%DSHS 22.3% 17.9% 19.9% 39.9%DARS 11.4% 10.9% 21.2% 56.5%DADS 25.2% 20.5% 20.6% 33.8%
Average Annual Employee Salary On average, the annual salary for an HHS System employee is $39,743. DARS has the highest average annual salary at $50,700 and DADS has the lowest at $35,100.21 22
20 Totals may not equal 100% due to rounding. 21 HHSAS Database, as of 8/31/15. 22DFPS average salary includes CPS Stipend pay (CPI).
Less than 2 yrs22%
2 - 4 yrs18%
5 - 9 yrs23%
10 yrs or more37%

Schedule F.1: HHS System Workforce Plan
F.1-19
Figure 8: HHS Average Annual Salary by Agency
Return-to-Work Retirees HHS agencies routinely hire retirees to support both ongoing operational needs and to assist in implementing new initiatives. When recruiting for shortage occupations, special skill required positions or for special projects, retirees provide a good source of relevant program-specific knowledge. Rehired retirees constitute about four percent of the total HHS workforce.23
Figure 9: HHS Return-to-Work Retirees by Percent of Workforce
23 HHSAS Database, as of 8/31/15.
$0 $10,000 $20,000 $30,000 $40,000 $50,000 $60,000
DSHS
DADS
DARS
DFPS
HHSC
System
$40,188
$35,100
$50,700
$41,904
$40,524
$39,743
0.0% 0.5% 1.0% 1.5% 2.0% 2.5% 3.0% 3.5% 4.0% 4.5%
DSHS
DADS
DARS
DFPS
HHSC
System
533 employees, 4.4%
578 employees, 3.7%
116 employees, 4.0%
295 employees, 2.5%
470 employees, 3.9%
1,992 employees, 3.7%

Schedule F.1: HHS System Workforce Plan
F.1-20
HHS management understands that demographic trends over the next decade will increasingly impact recruitment from typical sources. Retired workers who have institutional knowledge will be needed to pass their expertise to others. Dealing with this aging workforce will require HHS agencies to attract more people to apply for work, encourage them to work longer and help make them more productive. Creative strategies will need to be devised to keep older workers on the job, such as hiring retirees as temps; letting employees phase into retirement by working part time; having experienced workers mentor younger employees; promoting telecommuting, flexible hours and job-sharing; urging retirement-ready workers to take sabbaticals instead of stepping down; and/or offering bonuses to forestall retirement. Legislative changes have posed additional challenges for recruiting these retired workers. Beginning September 1, 2009, the amount of time a retired employee must wait before returning to state employment increased from 30 to 90 days. In addition, state agencies that hire return-to-work retirees must pay the Employees Retirement System of Texas (ERS) a surcharge that is equal to the amount of the State's retirement contribution for an active employee. Of special concern to HHS is the possibility that the current practice of rehiring retirees may inhibit talented staff from moving into management or other senior positions. To address this problem and ensure that HHS considers and documents the selection of retirees, the System has adopted a requirement that before offering a supervisory position to a retiree, the hiring authority must document that: the retiree is the only candidate qualified to occupy the position; or is the best
qualified candidate for the position; and the agency or program efficiency, quality, or effectiveness will improve if the
retiree is selected, or deteriorate unless the retiree is selected.

Schedule F.1: HHS System Workforce Plan
F.1-21
TURNOVER The Article II (HHS agencies) employee turnover rate during fiscal year 2015 was 21.2 percent, as identified by the State Auditor’s Office (SAO). When compared to the turnover rates of other General Appropriations Act articles, HHS agencies had the highest turnover rate.24
Figure 10: Turnover Rate by Article for FY 15 (excludes inter-HHS agency transfers)
Note: The SAO does not consider it a loss when employees transfer between HHS agencies.
Table 11: HHS System Workforce - Turnover for FY 13 – FY 15
(excludes inter-HHS agency transfers)
Agency FY 13 FY 14 FY 15 HHS System 20.8% 20.5% 21.2%
DADS experienced the highest turnover rate (32.2 percent), with the lowest turnover rate at DARS (12.8 percent).25
24 State Auditor’s Office, “An Annual Report on Classified Employee Turnover for Fiscal Year 2015,” December 2014, Report No. 16-702, web page http://www.sao.state.tx.us/reports/main/16-702.pdf, last accessed 2/24/16. 25 Ibid.
0%
5%
10%
15%
20%
25%
Article I(General
Government)
Article II (HHS) Article III(Education)
Article IV(Judiciary)
Article V(Public Safetyand Criminal
Justice)
Article VI(Natural
Resources)
Article VII(Business and
EconomicDevelopment)
Article VIII(Regulatory)
12.7%
21.2%
10.7%
15.6%
19.2%
11.1%12.2%
10.6%

Schedule F.1: HHS System Workforce Plan
F.1-22
The SAO does not consider transfers between agencies as a loss to the state and therefore does not include this turnover in their calculations. However, when transfers between HHS agencies are taken into account, the HHS turnover rate increases from 21.2 percent to 23.3 percent. This additional turnover is significant because replacement costs are incurred by the agencies to process terminations and hires, to train new staff for different jobs and to recruit staff to replace those who have moved to another agency.26
Table 12: Turnover by HHS Agency for FY 15 (includes inter-HHS agency transfers)
Agency Average Annual
Headcount Total Separations Turnover Rate HHSC 12,518 2,207 17.6%DFPS 12,278 2,382 19.4%DSHS 12,615 2,944 23.3%DARS 2,967 380 12.8%DADS 16,688 5,379 32.2%Grand Total 57,066 13,292 23.3%
Of the total losses during fiscal year 2015, approximately 79 percent were voluntary separations and 21 percent were involuntary separations.27 28 Voluntary includes resignation, transfer to another agency and retirement. Involuntary includes dismissal for cause, resignation in lieu of separation, reduction in force and separation at will.29
26 State Auditor’s Office, “An Annual Report on Classified Employee Turnover for Fiscal Year 2015,” December 2014, Report No. 16-702, web page http://www.sao.state.tx.us/reports/main/16-702.pdf, last accessed 2/24/16. 27 Death accounted for .7% of separations. 28 State Auditor’s Office (SAO) FY 2015 Turnover Statistics. 29 State Auditor’s Office, “An Annual Report on Classified Employee Turnover for Fiscal Year 2015,” December 2014, Report No. 16-702, web page http://www.sao.state.tx.us/reports/main/16-702.pdf, last accessed 2/24/16.

Schedule F.1: HHS System Workforce Plan
F.1-23
Table 13: Reason for Separation
Reason Separations Percentage30
Voluntary Separations
Personal reasons 7,840 59.0%
Transfer to another agency 1,203 9.0%
Retirement 1,396 10.5%
Involuntary Separations
Termination at Will 51 0.4%
Resignation in Lieu 319 2.4%
Dismissal for Cause 2,400 18.1%
Reduction in Force 9 0.1% Certain job families have significantly higher turnover than other occupational series, including direct care workers31 at 42.5 percent, licensed vocational nurses (LVNs) at 35.0 percent, food service workers32 at 34.6 percent, dentists at 32.3 percent, and registered nurses33 (RNs) at 26.7 percent.34
30 Death accounted for 0.6% of separations (76 separations). 31 Direct care workers include DADS direct support professionals and DSHS psychiatric nursing assistants. 32 Food service workers include food service workers, managers and cooks. 33 RNs include public health nurses. 34 HHSAS Database for FY 2015.

Schedule F.1: HHS System Workforce Plan
F.1-24
Table 14: FY 15 Turnover for Significant Job Families35
Job Title
Average Annual
Headcount Separations Turnover
Rate
Direct Care Workers36 10,252 4,353 42.5%
Licensed Vocational Nurses (LVNs) 1,148 402 35.0%
Food Service Workers37 1,032 357 34.6%
Dentists 31 10 32.3%
Registered Nurses (RNs)38 2,131 570 26.7%
Protective Services Workers39 7,078 1,768 25.0%
Psychologists40 258 64 24.8%
Epidemiologists 94 23 24.5%
Social Workers 204 47 23.0%
Physicians 95 21 22.1%
Psychiatrists 141 31 22.0%
Pharmacists 100 20 20.0%
Eligibility Workers 6,348 1,262 19.9%
Laboratory Technicians 55 9 16.4%
IG Investigators 247 39 15.8%
Medical Technologists 70 11 15.7%
Inspector General's Office (IG) Auditors 105 15 14.3%
Microbiologists 137 19 13.9%
Claims Examiners 478 65 13.6%Registered Therapists 275 36 13.1%Nurse Practitioners and Physician Assistants 50 6 12.0%
Sanitarians 125 13 10.4%
Chemists 61 6 9.8%
35 Turnover is calculated as follows: The total number of employees who terminated during the period DIVIDED BY the average number of employees on the last day of each quarter in the period plus the employees that terminated during the quarter TIMES 100 to produce a percentage. 36 Direct care workers include direct support professionals and psychiatric nursing assistants. 37 Food service workers include food service workers, managers and cooks. 38 RNs include public health nurses. 39 Protective service workers include child protective service (CPS) specialists, CPS investigators, adult protective service (APS) specialists, state wide intake (SWI) specialists, Child Care Licensing (CCL) and residential licensing services (RCCL) specialists. 40 Includes psychologists, behavioral health specialists, and behavioral analysts.

Schedule F.1: HHS System Workforce Plan
F.1-25
RETIREMENT PROJECTIONS Currently, about 12 percent of the HHS workforce is eligible to retire and leave state employment. About two percent of the eligible employees retire each fiscal year. If this trend continues, approximately 10 percent of the current workforce is expected to retire in the next five years.41
Table 15: HHS System Retirements - Percent of Workforce (FY 11 – FY 15)
Fiscal Year Retirement
Losses Retirement
Turnover Rate
2011 1,301 2.2%2012 1,346 2.4%
2013 1,444 2.6%2014 1,390 2.4%
2015 1,396 2.4%
Table 16: HHS System First-Time Retirement Eligible Projection (FY 15 – FY 20)
Agency FY 15 FY 16 FY 17 FY 18 FY 19 FY 20
HHSC 276 2.3% 366 3.0% 447 3.7% 430 3.6% 442 3.7% 474 3.9%
DFPS 142 1.2% 205 1.8% 256 2.2% 274 2.4% 293 2.5% 262 2.2%
DARS 76 2.6% 116 4.0% 130 4.5% 139 4.8% 126 4.4% 138 4.8%
DADS 329 2.1% 397 2.6% 451 2.9% 458 3.0% 442 2.9% 478 3.1%
DSHS 323 2.7% 411 3.4% 428 3.6% 481 4.0% 419 3.5% 459 3.8% Grand Total 1,146 2.1% 1,495 2.8% 1,712 3.2% 1,782 3.3% 1,722 3.2% 1,811 3.4%
The loss of this significant portion of the workforce means the HHS agencies will lose some of their most knowledgeable workers, including many employees in key positions. Effective succession planning and employee development will be critical in ensuring there are qualified individuals who can replace those leaving state service.
HHSAS Database, as of 8/31/15.

Schedule F.1: HHS System Workforce Plan
F.1-26

Schedule F.1: HHS System Workforce Plan
F.1-27
CRITICAL WORKFORCE SKILLS The current climate of the information age, advances in technology, increasing population for the state, consolidation of services, right-sizing and outsourcing will continue to place increased emphasis on the demand for well-trained and skilled staff. The outsourcing and self-service automation of major HR functions, such as employee selection, have made it critical for HHS managers and employees to improve and commit to a continual learning of human resource policy, employee development, conflict resolution, time management, project management and automation skills. It is important for HHS to employ professionals who have the skills necessary for the development, implementation and evaluation of the health and human services programs. These skills include: Analytic/assessment skills; Policy development/program planning skills; Communication skills; Cultural competency skills; Basic public health sciences skills; Financial planning and management skills; Contract management skills; and Leadership and systems-thinking skills. As the Spanish speaking population in Texas increases, there will be an increased need for employees with bilingual skills, especially Spanish-English proficiency. In addition, most management positions require program knowledge and the majority of these jobs are filled through the promotion of current employees. As HHS continues to lose tenured staff, effective training will be needed to ensure that current employees develop the skills necessary to transfer into management positions. To promote this staff development, HHS must continue to grow the skills and talents of managers as part of a plan for succession. HHS has demonstrated this belief by establishing a HHS Leadership Academy, a formalized interagency training and mentoring program that provides opportunities to enhance the growth of high-potential managers as they take on greater responsibility in positions of leadership. The primary goals of the academy are to: prepare managers to take on higher and broader roles and responsibilities; provide opportunities for managers to better understand critical management
issues; provide opportunities for managers to participate and contribute while learning;
and

Schedule F.1: HHS System Workforce Plan
F.1-28
create a culture of collaborative leaders across the HHS system. Through this planned development of management skills and the careful selection of qualified staff, HHS will continue to meet the challenges posed by increased retirements.

Schedule F.1: HHS System Workforce Plan
F.1-29
ENVIRONMENTAL ASSESSMENT
The Texas Economy In 2011, the Texas economy emerged from the worldwide recession. Pre-recession Texas employment peaked at 10,639,900 jobs in 2008, a level that was surpassed by November of 2011. By January 2016, Texas added an additional 1,322,600 jobs.42 The Comptroller’s office reported that in 2014, the Texas’ real gross domestic product grew by 5.2 percent (compared to 2.4 percent for the U.S.). This continued economic recovery could have a profound impact on the recruitment and retention challenges facing HHS.43
Poverty in Texas As the number of families living in poverty increases for the state, the demand for services provided by the HHS System will also increase. The U.S. Department of Health and Human Services defined the poverty level for 2015 according to household/family size as follows: $24,250 or less for a family of four; $20,090 or less for a family of three; $15,930 or less for a family of two; and $11,770 or less for individuals.44 It is estimated that 17.2 percent of Texas residents live in families with annual incomes below the poverty level. This rate is slightly higher than the national poverty rate of 14.8 percent.45 46
42 “Comptroller’s Weekly Economic Outlook,” web page: http://thetexaseconomy.org/economic-outlook/, last accessed on 5/9/16. 43 Ibid. 44 ”Annual Update of the HHS Poverty Guidelines,” Federal Register (80 FR 3236), webpage: https://www.federalregister.gov/articles/2015/01/22/2015-01120/annual-update-of-the-hhs-poverty-guidelines, last accessed on 4/20/16. Note: Guidelines apply to the 48 Contiguous States and D.C. 45 U.S. Census Bureau: State and County Quickfacts, webpage http://quickfacts.census.gov/qfd/states/48000.html, last accessed on 4/20/16. 46 U.S. Census Bureau: State and County Quickfacts, webpage http://www.census.gov/quickfacts/table/PST045215/00, last accessed on 4/20/16.

Schedule F.1: HHS System Workforce Plan
F.1-30
Unemployment Another factor that directly impacts the demand for HHS System services is unemployment. In Texas, the August 2015 statewide unemployment rate was 4.4 percent, below the national rate of 5.1 percent.47 48
Other Significant Factors With over 27 million residents, Texas is one of the faster growing states in the nation. In just one period, April 1, 2010 to July 1, 2015, the population of Texas increased by more than two million, a 9.2 percent increase.49 The Texas population is expected to continue to increase. By 2020, the Texas population is expected to reach nearly 30 million residents.50 As the overall percentage of Whites continues to decline, the Texas population will become increasingly diverse over the next five years. By the year 2020, the Hispanic population is expected to surpass the White population and become the majority of the Texas population by 2042.51 The distribution of age groups in Texas closely mirrors that of the nation, with the largest percentage of Texas residents (60 percent) being between ages 19 to 64, followed by those 18 and under (28 percent) and those 65 and over (12 percent).52
47 Bureau of Labor Statistics, seasonally adjusted unemployment rate, web page http://data.bls.gov/timeseries/LASST480000000000003?data_tool=XGtable, last accessed on 5/9/16. 48 Bureau of Labor Statistics, seasonally adjusted unemployment rate, for 16 years and over, web page http://data.bls.gov/timeseries/LNS14000000?data_tool=XGtable, last accessed on 5/9/16. 49 American Fact Finder, U.S. Census Bureau, web page: http://www.census.gov/quickfacts/table/PST045215/48, last accessed on 5/9/16. 50 Office of the State Demographer, Texas State Data Center. 51 Policy Alert Supplement, November 2005, The National Center for Public Policy and Higher Education, web page http://www.highereducation.org/reports/pa_decline/states/TX.pdf, last accessed on 1/12/06. 52 The Kaiser Family Foundation, State Health Facts: Population by Age, based on U.S. Census Bureau's March 2015 Current Population Surveys, web page http://kff.org/other/state-indicator/distribution-by-age/, last accessed on 5/9/16. Note: Percentage totals may not equal 100 percent due to rounding.

Schedule F.1: HHS System Workforce Plan
F.1-31
Figure 11: Population Distribution by Age
Long term population projections by the Texas State Data Center estimate that by 2050, the number of persons older than age 65 will triple in size (from 2010-2050), approaching 7.9 million.53 This projected aging of the Texas labor force may have a major impact on growth of the labor force by dramatically lowering the overall labor force participation rate.
53 Lloyd B. Potter and Nazrul Hoque, “Texas Population Projections, 2010 to 2050,” Office of the State Demographer, November 2014, web page http://osd.texas.gov/Resources/Publications/2014/2014-11_ProjectionBrief.pdf, last accessed on 5/9/16.
28%(Texas)
60%(Texas)
12%(Texas)
25%(US)
62%(US)
15%(US)
18 and Under 19-64 65 and Over

Schedule F.1: HHS System Workforce Plan
F.1-32

Schedule F.1: HHS System Workforce Plan
F.1-33
EXPECTED WORKFORCE CHALLENGES HHS will need to continue to recruit and retain health and human services professionals, such as psychiatrists, physicians, psychologists, nurse practitioners, physician assistants, registered nurses, licensed vocational nurses, registered therapists, pharmacists, dentists, epidemiologists, sanitarians and laboratory staff. Additionally, certain jobs will continue to be essential to the delivery of services throughout the HHS System. Many of the jobs are low paying, highly stressful and experience higher than normal turnover, such as Eligibility Services staff, protective services workers (adult and children), Inspector General's Office staff, claims examiners, direct care workers (direct support professionals and psychiatric nursing assistants) and food service workers.
Direct Care Workers (Direct Support Professionals and Psychiatric Nursing Assistants) There are about 9,115 direct care workers employed in HHS state hospitals and state supported living centers. These positions require no formal education to perform the work, but employees are required to develop people skills to effectively interact with consumers. The physical requirements of the position are difficult and challenging due to the nature of the work. The pay is low, with an average hourly rate of $11.95.54
The overall turnover rate for employees in this group is very high, at about 43 percent annually.55 Taking into account these factors, state hospitals and state supported living centers have historically experienced difficulty in both recruiting and retaining these workers. Little change is expected.
Direct Support Professionals There are 6,187 direct support professionals in state supported living centers across Texas, representing approximately 11 percent of the System's total workforce.56 These employees provide 24-hour direct care to over 4,000 people who reside in state supported living centers. They directly support these individuals by providing services including basic hygiene needs, dressing and bathing, general health care, and dining assistance. They support life-sustaining medical care such as external feeding and lifting individuals with physical challenges. A trained and experienced direct care staff is essential to ensure consumer safety, health and well-being. There are no formal education requirements to apply for a job in this series; however, extensive on-the-job training is required. It takes six to nine months for a 54 HHSAS Database, as of 8/31/15. 55 HHSAS Database, FY 2015 data. 56 HHSAS Database, as of 8/31/15.

Schedule F.1: HHS System Workforce Plan
F.1-34
new direct support professional to become proficient in the basic skills necessary to carry out routine job duties. Employees who perform this work must interact with consumers on a daily basis. The work is performed in shifts throughout the day and night. The pay is low and the work is difficult and physically demanding. A typical HHS direct support professional is 38 years old and has about six years of state service.57 Turnover for direct support professionals is very high, at about 46 percent. This is one of the highest turnover rates of any job category in the System, reflecting the loss of about 3,265 workers during fiscal year 2015. Within this job family, entry-level Direct Support Professional Is experienced the highest turnover at 56 percent. Turnover rates by location ranged from 28 percent at the El Paso State Supported Living Center to 76 percent at the San Angelo State Supported Living Center.58 The average hourly salary rate for these employees is $11.92 per hour.59 The State Auditor’s Office 2014 market index analysis found the average state salary for Direct Support Professional IIs to be three percent behind the market rate.60 To deal with these retention difficulties, several state supported living centers have used contract staff to provide required coverage. Aside from being costly, HHS has experienced other challenges and problems with contracted staff, since these staff do not work consistently with the consumers and are therefore not able to carry out program plans fully. Contract staff are often placed for a very short time and do not always work with the same consumers. This situation can result in disruptions to consumer’s lives and the suspension of progress toward development goals. To address these difficulties, a two percent salary increase was approved by the 84th Legislature. In addition, HHS has plans to increase entry-level salaries for new direct support professionals and for currently employed direct support professionals during fiscal years 2018 and 2019. Retention of these workers remains a major challenge for the System. Maintaining required staffing levels of direct support professionals in state supported living centers is critical in meeting Intermediate Care Facilities for Persons with Intellectual Disability (ICF/ID) certification requirements.
57 HHSAS Database, as of 8/31/15. 58 HHSAS Database, FY 2015 data. 59 HHSAS Database, as of 8/31/15. 60 State Auditor’s Office, “A Biennial Report on the State’s Position Classification Plan,” September 2014, Report No. 15-701, web page http://www.sao.state.tx.us/reports/main/15-701.pdf, last accessed 4/21/16.

Schedule F.1: HHS System Workforce Plan
F.1-35
Psychiatric Nursing Assistants There are approximately 2,930 psychiatric nursing assistants employed in HHS state hospitals.61 These positions require high school education or equivalency to perform the work; however, there is extensive on-the-job training. Workers are assigned many routine basic care tasks in the state hospitals that do not require a license to perform, such as taking vital signs, and assisting with bathing, hygiene and transportation. These employees are required to interact with patients on a daily basis. They are likely to be the first to intervene during crisis situations, and are the frontline staff most likely to de-escalate situations to avoid the need for behavioral restraints. They also have a higher potential for on-the-job injuries, both from lifting requirements and intervention during crisis situations. Further complicating this situation, many of the applicants for these entry-level positions lack the experience needed to work with patients and often lack the physical ability necessary to carry out their job duties. The work is performed in shifts throughout the day and night. The work is difficult and the pay is low. Psychiatric nursing assistants earn an average hourly wage of $12.01 per hour. The State Auditor’s Office 2014 market index analysis found the average state salary for psychiatric nursing assistants ranged from eight to 11 percent behind the market rate.62 63 The average psychiatric nursing assistant is about 39 years old and has an average of seven years of state service.64 Turnover for psychiatric nursing assistants is very high at about 34 percent, reflecting the loss of 3,196 workers during fiscal year 2015. Within this job family, entry-level Psychiatric Nursing Assistant Is experienced the highest turnover at 43 percent. Turnover rates by location ranged from 27 percent at the Austin State Hospital to nearly 60 percent at the Big Spring State Hospital.65 HHS is currently experiencing difficulty filling vacant psychiatric nursing assistant positions. Vacant positions are going unfilled for many months. Positions at the Austin State Hospital are remaining vacant, on average, for about five months, and vacant positions at the Rio Grande State Center remain vacant, on average, for more than six months.66
61 HHSAS Database, as of 8/31/15. 62 Ibid. 63 State Auditor’s Office, “A Biennial Report on the State’s Position Classification Plan,” September 2014, Report No. 15-701, web page http://www.sao.state.tx.us/reports/main/15-701.pdf, last accessed 4/21/16. 64 HHSAS Database, as of 8/31/15. 65 HHSAS Database, FY 2015 data. 66 HHSAS Database, as of 8/31/15.
Schedule F.1: HHS System Workforce Plan
F.1-36
To address these difficulties, HHS may request an increase to all classifications in this job family based on market data. In addition, HHS has plans to increase entry-level salaries for new psychiatric nursing assistants and for currently employed direct support professionals during fiscal years 2018 and 2019. Recruitment and retention of these employees remains a major challenge for the System.
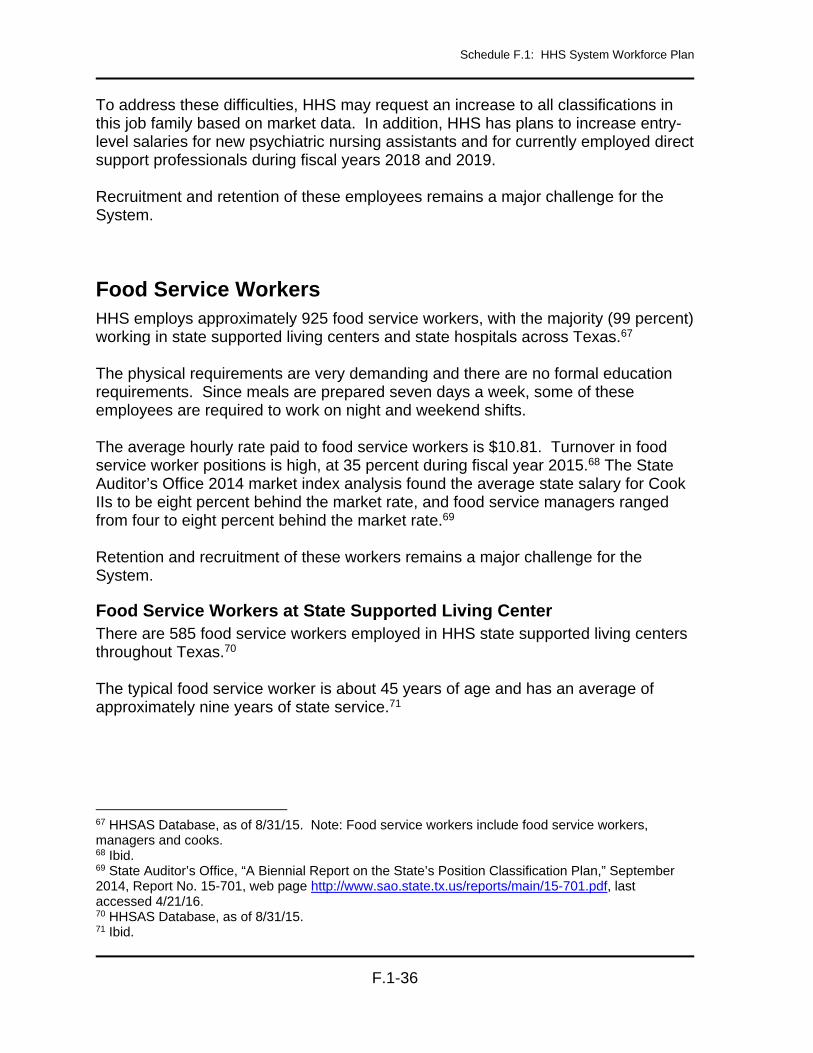
Food Service Workers HHS employs approximately 925 food service workers, with the majority (99 percent) working in state supported living centers and state hospitals across Texas.67 The physical requirements are very demanding and there are no formal education requirements. Since meals are prepared seven days a week, some of these employees are required to work on night and weekend shifts. The average hourly rate paid to food service workers is $10.81. Turnover in food service worker positions is high, at 35 percent during fiscal year 2015.68 The State Auditor’s Office 2014 market index analysis found the average state salary for Cook IIs to be eight percent behind the market rate, and food service managers ranged from four to eight percent behind the market rate.69
Retention and recruitment of these workers remains a major challenge for the System.
Food Service Workers at State Supported Living Center There are 585 food service workers employed in HHS state supported living centers throughout Texas.70 The typical food service worker is about 45 years of age and has an average of approximately nine years of state service.71
67 HHSAS Database, as of 8/31/15. Note: Food service workers include food service workers, managers and cooks. 68 Ibid. 69 State Auditor’s Office, “A Biennial Report on the State’s Position Classification Plan,” September 2014, Report No. 15-701, web page http://www.sao.state.tx.us/reports/main/15-701.pdf, last accessed 4/21/16. 70 HHSAS Database, as of 8/31/15. 71 Ibid.

Schedule F.1: HHS System Workforce Plan
F.1-37
Turnover in these food service worker positions is very high, at 37 percent. Turnover is at nearly 50 percent at the Corpus Christi and Lufkin state supported living centers.72
Food Service Workers at State Hospitals There are 333 food service workers employed at HHS state hospitals and centers throughout Texas.73 The typical food service worker is about 43 years of age and has an average of about eight years of state service.74 Turnover in these food service worker positions is high, at 30 percent. Turnover was at over 50 percent at the Big Spring State Hospital and 45 percent at the Rusk State Hospital.75
Protective Services Workers In 2014, there were 305,200 protective service worker jobs in the U.S., with a projected job growth of 6.2 percent by 2024.76 77 There are approximately 6,600 protective services workers employed by HHS as child protective service (CPS) specialists, CPS investigators, adult protective service (APS) specialists, state wide intake (SWI) specialists, Child Care Licensing (CCL) and Residential Licensing Services (RCCL) Specialists, making up about 12 percent of the HHS System workforce.78 79 The average annual salary for these workers is $40,425.60, a salary below both the national and state average annual salary. Nationally, protective services workers earn $46,610 annually, while in Texas, the average annual salary is $41,760.80
The 84th Legislature (Regular Session, 2015) continued its support of ongoing improvements by authorizing funds to allow HHS to continue to provide the salary retention supplement of $5,000 established by the 79th Legislature (Regular Session, 2005) for CPS investigation caseworkers and supervisors. As a means for increasing worker retention, the 84th Legislature (Regular Session, 2015) also
72 HHSAS Database, FY 2015 data. 73 HHSAS Database, as of 8/31/15. 74 Ibid. 75 HHSAS Database, FY 2015 data. 76 Occupational title used is child, family and school social workers. 77 U.S. Department of Labor, Bureau of Labor Statistics, Selected Occupational Projections Data, web page http://data.bls.gov/projections/occupationProj, Period: May 2014; last accessed on 4/25/16. 78 HHSAS Database, as of 8/31/15. 79 Protective Service Worker total does not include CCL and RCCL inspectors. 80 U.S. Department of Labor, Bureau of Labor Statistics, Occupational Employment Statistics, web page http://data.bls.gov/oes/search.jsp?data_tool=OES, Period: May 2015; last accessed on 4/25/16.

Schedule F.1: HHS System Workforce Plan
F.1-38
authorized the payment of up to $300 per month for experienced employees to mentor new workers. To retain trained, competent staff while providing the highest quality services for consumers over the next five years, HHS must: competitively recruit, retain and train quality staff to adequately manage
increasing caseloads and provide quality services to clients; meet the training demands of new staff, explore innovative ways to improve skills
and provide policy refresher training for supervisors and caseworkers; and maintain hiring efforts to fill protective services worker positions and Child Care
Licensing (CCL) and Residential Licensing Services (RCCL) specialist positions that are experiencing high turnover.
Child Protective Services (CPS) Workers Within the System, there are 5,485 filled CPS worker positions (1,906 CPS investigators and 3,579 CPS specialists). CPS workers are young (nearly 70 percent are under 40 years of age), with an average age of approximately 36 years and an average of about five years of state service. About 39 percent of these workers have less than two years of state service.81 Turnover with this group of employees is considered high, at about 26 percent. Turnover is highest for CPS Worker I positions, reaching 43 percent (representing the loss of 641 employees in fiscal year 2015).82 HHS is currently experiencing difficulty filling CPS worker positions. Vacant positions are going unfilled for an average of more than three months due to a shortage of qualified applicants available for work. Positions in the El Paso area remaining vacant, on average, for more than five months.83 As caseloads continue to increase, recruitment and retention of employees with an aptitude for CPS casework continues to be a challenge for HHS.
Statewide Intake Specialists (SWIs) There are approximately 320 SWI specialists with HHS. With an average age of about 39, approximately 63 percent of these specialists are under 40 years of age. SWI specialists have an average of about eight years of state service, with about 23 percent having less than two years of state service.84 85
81 HHSAS Database, as of 8/31/15. 82 HHSAS Database, FY 2015 data. 83 HHSAS Database, as of 8/31/15. 84 SWI specialists include Protective Services Intake Specialists I-V. 85 HHSAS Database, as of 8/31/15.

Schedule F.1: HHS System Workforce Plan
F.1-39
While overall turnover for SWI specialists at 19 percent is only slightly above the state average rate of 18 percent, entry-level Protective Service Intake Specialist Is are experiencing much higher turnover at 42 percent.86 87 HHS is currently experiencing difficulty filling vacant SWI specialist positions. Vacant positions are going unfilled, on average, for nearly five months due to a shortage of qualified applicants available for work.88
Adult Protective Services (APS) Specialists HHS employs about 670 APS specialists. The typical APS specialist is 40 years of age and has an average of eight years of state service. About 47 percent of these employees have less than five years of state service.89 90
APS specialist turnover is considered high at 23 percent. Certain regions of Texas experienced higher turnover than others, including Midland area at 37 percent and the San Antonio area at 32 percent. Entry-level APS Specialist Is experienced the highest turnover at 40 percent.91 With the aging of the Texas population, the HHS anticipates an increasing demand for adult protective services.
Child Care Licensing (CCL) and Residential Licensing Services (RCCL) Specialists There are 411 CCL and RCCL specialists employed within the System who monitor, investigate and inspect child day-care facilities and homes, residential child care facilities, child-placing agencies and foster homes.92 In addition, they conduct child abuse/ neglect investigations of children placed in 24-hour childcare facilities and child placing agencies licensed or certified by Residential Child Care Licensing. The typical specialist is 38 years of age and has an average of eight years of state service. About 44 percent of these employees have less than five years of state service.93 94 CCL and RCCL specialist turnover is high at 23 percent.95
86 HHSAS Database, FY 2015 data. 87 State Auditor’s Office (SAO) FY 2015 Turnover Statistics. 88 HHSAS Database, as of 8/31/15. 89 Ibid. 90 Ibid. 91 HHSAS Database, FY 2015 data. 92 CCL and RCCL specialists include CCL inspectors and specialists and RCCL inspectors and investigators. 93 HHSAS Database, as of 8/31/15. 94 Ibid. 95 HHSAS Database, FY 2015 data.

Schedule F.1: HHS System Workforce Plan
F.1-40
In addition, HHS experienced difficulty filling vacant positions. With a high vacancy rate of 16 percent, vacant positions go unfilled for months.96 Considering these factors, retention of these employees is an ongoing challenge.
Eligibility Services Staff Across the state, there are about 8,470 employees supporting eligibility determinations within the System, accounting for about 16 percent of the HHS System workforce.97 The majority of these individuals (7,968 employees or 94 percent) are employed as Texas works advisors, medical eligibility specialists, hospital based workers, eligibility clerks and eligibility supervisors.98
While overall turnover for Eligibility Services Staff is the same as the state average rate (at 18 percent), Texas works advisors and medical eligibility specialists are experiencing higher turnover (both at a rate of about 20 percent).99 100
Texas Works Advisors There are over 4,900 Texas works advisors within HHS that make eligibility determinations for SNAP, TANF, CHIP and Medicaid for children, families and pregnant women. The typical Texas works advisor is 41 years of age and has an average of about eight years of service.101 Turnover for these employees is high at about 20 percent, representing a loss of 1,048 workers in fiscal year 2015. Certain regions of Texas experienced higher turnover than others, including the Texas Panhandle at 30 percent and South Central Texas at 33 percent. Entry-level Texas Works Advisor Is experienced the highest turnover at 43 percent.102 In addition, HHS has experienced difficulty finding qualified candidates for new worker positions. Due to this shortage of qualified applicants, vacant positions go unfilled for an average of almost three months, with vacant positions in Southeast Texas remaining unfilled for an average of a little more than five months.103
96 HHSAS Database, as of 8/31/15. 97 HHSAS Database, as of 8/31/15. 98 Ibid. 99 HHSAS Database, FY 2015 data. 100 State Auditor’s Office (SAO) FY 2015 Turnover Statistics. 101 HHSAS Database, as of 8/31/15. 102 HHSAS Database, FY 2015 data. 103 HHSAS Database, as of 8/31/15.

Schedule F.1: HHS System Workforce Plan
F.1-41
Salary is one factor that may be contributing to the System’s difficulty recruiting and retaining eligibility workers. A 2010 Texas State Auditor’s survey of the salary earned by tenured eligibility workers in 11 states indicated that Texas ranked near the bottom.104
Figure 12: Average Salaries for Tenured Eligibility Workers
Recruitment and retention of these employees remain a continuing challenge for HHS.
Medical Eligibility Specialists Within HHS, there are 750 medical eligibility specialists determining financial eligibility for Medicaid for Elderly and People with Disabilities (MEPD). Medical eligibility specialists have, on average, about nine years of state service, with an average age of 42.105 Turnover for these employees is high at about 20 percent, representing the loss of 158 employees in fiscal year 2015. Entry-level Medical Eligibility Specialist Is experienced the highest turnover, at 37 percent.106 Retention of these specialists is an ongoing challenge.
104 State Auditor’s Office, “An Audit Report on the Supplemental Nutrition Assistance Program at the Health and Human Services Commission,” March 2010, Report No. 10-026, web page http://www.sao.state.tx.us/reports/main/10-026.pdf, last accessed 3/26/15. 105 HHSAS Database, as of 8/31/15. 106 HHSAS Database, FY 2015 data.
$0 $10,000 $20,000 $30,000 $40,000 $50,000 $60,000
New Mexico
Texas
Oregon
Indiana
Pennsylvania
Washington
Michigan
Illinois
$30,681
$31,735
$34,760
$35,544
$43,436
$43,674
$47,398
$58,860

Schedule F.1: HHS System Workforce Plan
F.1-42
Hospital Based Workers HHS has about 300 hospital based workers stationed in nursing facilities, hospitals, and clinics rather than in eligibility offices to determine eligibility for the SNAP, TANF, CHIP and Medicaid programs. These highly-tenured workers have an average of about 15 years of state service (about 56 percent of these employees have 10 or more years of state service), with an average age of 46.107 Turnover for these employees is currently below the state average (of 18 percent) at about 16 percent.108 109
Eligibility Clerks HHS employs about 1,445 eligibility clerks in various clerical, administrative assistant and customer service representative positions. The typical eligibility clerk is 46 years of age and has an average of 10 years of state service.110 The turnover rate for eligibility clerks is high at about 18 percent, representing the loss of about 280 employees (a three percent lower rate than reported for fiscal year 2013).111 112 Eligibility Specialist Clerk IIIs made up the majority of these losses at about 75 percent, with these positions often remaining unfilled for an average of six months.113 114 Recruitment and retention for these jobs are ongoing challenges.
Eligibility Supervisors Approximately 530 eligibility supervisors are employed within HHS. These highly-tenured supervisors have an average of 19 years of state service (75 percent of these employees have 10 or more years of state service), with an average age of 48.115 Though turnover for these employees is well managed at about 10 percent, 22 percent of these employees are currently eligible to retire from state employment. Within the next five years, nearly half of these employees will be eligible to retire.116 HHS will need to develop effective succession plans and creative recruitment strategies to replace these highly skilled and tenured employees. 107 HHSAS Database, as of 8/31/15. 108 State Auditor’s Office (SAO) FY 2015 Turnover Statistics. 109 HHSAS Database, FY 2015 data. 110 HHSAS Database, as of 8/31/15. 111 HHSAS Database, FY 2013 data. 112 HHSAS Database, FY 2015 data. 113 State Auditor’s Office (SAO) FY 2015 Turnover Statistics. 114 HHSAS Database, as of 8/31/15. 115 Ibid. 116 Includes return-to-work retirees. HHSAS Database, as of 8/31/15.

Schedule F.1: HHS System Workforce Plan
F.1-43
Inspector General's Office (IG) Staff Across the state, there are about 680 IG employees within HHS. The majority of these individuals (424 employees or 62 percent) are employed as auditors, investigators, and registered nurses (RNs).117 118
Auditors There are about 150 auditor positions within HHS, with about 65 percent working in IG.119 Of these staff, about 73 percent work in Audit Consolidated, and the remaining 27 percent are divided among numerous units within OIG, including Medicaid/CHIP Audit, WIC Vendor Monitoring, Hospital Audits and OIG Managed Care Operations. IG auditors perform operational and performance audits of programs, processes and systems across HHS agencies. IG auditors are responsible for performing contractor and medical provider audits and reviews to help ensure compliance with state and federal laws, rules and regulations and to identify potential overpayments. Employees in these classifications prepare audit reports that make recommendations for increasing operational efficiency, strengthening management controls, mitigating business risks and improving compliance. The typical IG auditor is about 51 years old and has an average of 14 years of state service.120 IG auditors earn an average annual salary of $53,323, which is below both the state and national average.121 The average annual earnings for accountants and auditors in 2015 was $75,280 nationally, and $78,490 in Texas.122 123 In addition, the State Auditor’s Office 2014 market index analysis found the average state salary for auditors ranged from seven to eight percent behind the market rate.124
117 HHSAS Database, as of 8/31/15. 118 IG RNs are discussed under the Registered Nurses subsection. 119 HHSAS Database, as of 8/31/15. 120 Ibid. 121 Ibid. 122 Ibid. 123 U.S. Department of Labor, Bureau of Labor Statistics, Occupational Employment Statistics, web page http://data.bls.gov/oes/search.jsp?data_tool=OES, Period: May 2015; last accessed on 5/2/16. 124 State Auditor’s Office, “A Biennial Report on the State’s Position Classification Plan,” September 2014, Report No. 15-701, web page http://www.sao.state.tx.us/reports/main/15-701.pdf, last accessed 4/21/16. Note: Since there were no Auditor IIs in IG, data on the market rate for this classification were not included.

Schedule F.1: HHS System Workforce Plan
F.1-44
Though turnover for all IG auditors is below the state average of 18 percent (at 14 percent), turnover for Auditor IIIs is high at about 19 percent.125 126 In addition, HHS may face significant recruitment challenges in the next few years to replace those employees who are eligible for retirement. More than a quarter of IG auditors are currently eligible to retire. In the next five years, this rate will increase to over 40 percent.127 To address these difficulties, HHS may create a career ladder for IG auditors, provide a salary equity adjustment, and increase entry-level salaries for new IG auditors and for currently employed IG auditors during fiscal years 2018 and 2019.
Investigators Of the 367 investigators working for HHS agencies, 247 of them (67 percent) work within IG.128 Nearly half of these employees work in the General Investigations section of the Enforcement Division, with the rest divided among numerous units within IG, including Criminal History Checks, Internal Affairs Consolidations, Medical Provider Integrity, and Sanctions. The typical investigator is about 46 years old and has an average of 13 years of state service. More than half of these employees have 10 or more years of state service.129 IG investigators earn an average annual salary of $48,859, which is below both the state and national average.130 The average annual earnings for investigators in 2015 was $69,180 nationally and $71,750 in Texas.131 132 Though turnover for these highly-tenured employees is slightly below the state average of 18 percent (at 16 percent), Investigator VIs are experiencing high turnover at 24 percent.133 In addition, about 13 percent of these employees are currently eligible to retire from state employment. Within the next five years, 32 percent of these highly skilled and tenured employees will be eligible to retire.134
125 State Auditor’s Office (SAO) FY 2015 Turnover Statistics. 126 HHSAS Database, FY 2013 data. 127 Includes return-to-work retirees. HHSAS Database, as of 8/31/15. 128 HHSAS Database, as of 8/31/15. 129 Ibid. 130 HHSAS Database, as of 8/31/15. 131 U.S. Department of Labor, Bureau of Labor Statistics, Occupational Employment Statistics, web page http://data.bls.gov/oes/search.jsp?data_tool=OES, Period: May 2015; last accessed on 5/2/16. 132 Occupational title used is Compliance Officers. 133 HHSAS Database, FY 2013 data. 134 Includes return-to-work retirees. HHSAS Database, as of 8/31/15.

Schedule F.1: HHS System Workforce Plan
F.1-45
Recruitment and retention for these jobs will continue to be ongoing challenges. To address these difficulties, HHS may create a career ladder for IG investigators, provide a salary equity adjustment, and increase entry-level salaries for new and currently employed IG investigators.
Claims Examiners HHS employs 460 claims examiners, with the majority (99 percent) employed in the Division for Disability Determination Services (DDS).135 These claims examiners have, on average, about 11 years of state service, with an average age of about 43 years.136 Entry-level DDS claims examiners must have a bachelor's degree and complete a two year training program before they are considered fully trained and able to work the various types of Social Security disability claims. Generally, it takes a minimum of two years for a DDS claims examiner to be fully competent in their knowledge of the complicated Social Security disability program. Though DDS claims examiners are separating from employment at an annual rate of only 14 percent, the vacancy rate for claims examiners is currently high at about 24 percent, with vacant positions often going unfilled for an average of seven months due to a shortage of qualified applicants available for work. These vacancy problems are expected to worsen as employees approach retirement. Over 20 percent of these tenured and highly skilled employees will be eligible to retire in the next five years.137 138 Due to cost of this extensive training that newly hired examiners must take to become fully competent in their job, continuous monitoring of retention of these employees will remain a priority for System management. In addition, as the Social Security Administration (SSA) allows for the filling of new approved vacancies, DDS will need to coordinate the timing of filling the new positions with the SSA to determine if DDS has the necessary resources (e.g. trainers, facility needs, etc.) to ensure all employees receive the required training and ongoing professional development.
Social Workers There are 206 social workers employed by HHS, with the majority (99 percent) housed in state supported living centers and state hospitals across the state.139
135 HHSAS Database, as of 8/31/15. 136 Ibid. 137 Includes return-to-work retirees. HHSAS Database, as of 8/31/15. 138 HHSAS Database, FY 2015 data. 139 HHSAS Database, as of 8/31/15.

Schedule F.1: HHS System Workforce Plan
F.1-46
Turnover for these social workers is high at 23 percent.140 One reason for this high turnover is the large disparity between private sector and HHS salaries. System social workers earn an average annual salary of $42,010.141 This salary falls significantly below the market rate. The average annual salary for social workers nationally is $54,020 and $55,510 in Texas.142 The State Auditor’s Office 2014 market index analysis found the average state salary for Social Worker IIs and IIIs was seven percent behind the market rate.143 These problems are expected to worsen as employees approach retirement. While 14 percent of these employees are currently eligible to retire, this number increases to nearly 25 percent in the next five years.144
Social Workers at State Supported Living Centers About 16 percent of HHS social workers (33 employees) work at state supported living centers across the state.145 These employees serve as a liaison between the individual, legally authorized representative and others to assure ongoing care, treatment and support through the use of person-centered practices. They gather information to assess an individual's support systems and service needs, support the assessment of the individual's rights and capacity to make decisions, and assist with the coordination of admissions, transfers, transitions and discharges. The typical social worker at these facilities is about 44 years old and has an average of nine years of state service.146 While the overall turnover for these social workers is less than the state average of 18 percent (at 15 percent), positions often remaining unfilled for an average of five months before being filled. At the Abilene State Supported Living Center, social worker positions remain vacant for about seven months.147 148 149
140 HHSAS Database, FY 2015 data. 141 HHSAS Database, as of 8/31/15. 142 U.S. Department of Labor, Bureau of Labor Statistics, Occupational Employment Statistics, web page http://data.bls.gov/oes/search.jsp?data_tool=OES, Period: May 2015; last accessed on 5/2/16. 143 State Auditor’s Office, “A Biennial Report on the State’s Position Classification Plan,” September 2014, Report No. 15-701, web page http://www.sao.state.tx.us/reports/main/15-701.pdf, last accessed 4/21/16. 144 Includes return-to-work retirees. HHSAS Database, as of 8/31/15. 145 HHSAS Database, as of 8/31/15. 146 Ibid. 147 State Auditor’s Office (SAO) FY 2015 Turnover Statistics. 148 HHSAS Database, FY 2015 data. 149 HHSAS Database, as of 8/31/15.

Schedule F.1: HHS System Workforce Plan
F.1-47
HHS may face significant recruitment challenges in the next few years to replace these employees who will be eligible for retirement. About 18 percent of these employees will be eligible to retire in the next five years.150
Social Workers at State Hospitals There are 171 social workers at HHS state hospitals.151 These employees are critical to managing patient flow in state hospitals and taking the lead role in communicating with patient families and community resources. Social workers provide essential functions within state hospitals that include conducting psychosocial assessments, therapeutic treatment and case coordination for individuals receiving services from HHS in-patient psychiatric hospitals and the Waco Center for Youth. State hospital social workers are about 42 years old and have an average of 10 years of state service.152 The overall turnover rate for these social workers is high at around 24 percent, with the Austin State Hospital and Big Spring State Hospital experiencing turnover of more than 30 percent.153 In addition, about 15 percent of these employees are currently eligible to retire. Within the next five years, 25 percent of these employees will be eligible to retire.154 Factors impacting recruitment include non-competitive salaries, credentialing requirements and increased need for individuals with Spanish-English bilingual skills. HHS competes with both federal and local governments, as well as the military and the private sector employers for social worker applicants. Many times the competitors are able to offer a higher starting salary.
Considering these factors, recruitment and retention for these jobs are ongoing challenges. To address these difficulties, HHS may consider increasing entry-level salaries for these social workers and for currently employed state hospital social workers during fiscal years 2018 and 2019.
Registered Therapists HHS employs 274 registered therapists, with the majority (98 percent) working in state supported living centers and state hospitals across Texas.155 HHS therapists are employed in a variety of specializations, including speech-language pathologists, 150 Includes return-to-work retirees. HHSAS Database, as of 8/31/15. 151 HHSAS Database, as of 8/31/15. 152 Ibid. 153 HHSAS Database, FY 2015 data. 154 Includes return-to-work retirees. HHSAS Database, as of 8/31/15. 155 HHSAS Database, as of 8/31/15.

Schedule F.1: HHS System Workforce Plan
F.1-48
audiologists, occupational therapists and physical therapists. Full staffing of these positions is critical to direct-care services. These highly skilled employees have, on average, about eight years of state service, with an average age of 45.156 System registered therapists earn an average annual salary of $72,788.157 The average annual salary for registered therapists nationally is $82,072 and $89,043 in Texas.158 In addition, the State Auditor’s Office 2014 market index analysis found the average state salary for registered therapists ranged from one to 26 percent behind the market rate.159
Though turnover for registered therapists is currently below the state average (at 13 percent), positions are remaining vacant for an average of about nine months.160 161 About 22 percent of System registered therapists will be eligible to retire within the next five years. HHS will need to develop creative recruitment strategies to replace these highly skilled employees.162
Registered Therapists at State Supported Living Centers About 78 percent for HHS registered therapists work at state supported living centers. These employees have, on average, about eight years of state service, with an average age of 45.163 Though turnover for these registered therapists is below the state average at 13 percent, HHS is experiencing difficulty filling vacant positions. Positions at the Abilene, Brenham, Mexia and San Angelo State Supported Living Centers remain unfilled for over 300 days.164 165 166 HHS may face significant recruitment challenges in the next few years to replace these highly skilled employees who will be eligible for retirement. Though only 10
156 HHSAS Database, as of 8/31/15. 157 Ibid. 158 U.S. Department of Labor, Bureau of Labor Statistics, Occupational Employment Statistics, web page http://data.bls.gov/oes/search.jsp?data_tool=OES, Period: May 2015; last accessed on 5/2/16. Note: Reported salaries represent the weighted average for occupational therapists, audiologists, speech-language pathologists and physical therapists. 159 State Auditor’s Office, “A Biennial Report on the State’s Position Classification Plan,” September 2014, Report No. 15-701, web page http://www.sao.state.tx.us/reports/main/15-701.pdf, last accessed 4/21/16. 160 HHSAS Database, FY 2015 data. 161 Ibid. 162 Includes return-to-work retirees. HHSAS Database, as of 8/31/15. 163 HHSAS Database, as of 8/31/15. 164 State Auditor’s Office (SAO) FY 2015 Turnover Statistics. 165 HHSAS Database, FY 2015 data. 166 HHSAS Database, as of 8/31/15.

Schedule F.1: HHS System Workforce Plan
F.1-49
percent of these employees are currently eligible to retire, over 20 percent of them will be eligible in the next five years.167 HHS will need to develop creative recruitment strategies to replace these highly skilled and tenured employees.
Registered Therapists at State Hospitals HHS employs 57 registered therapists at state hospitals across Texas.168 These highly skilled employees have, on average, about 12 years of state service, with an average age of 46.169 Though turnover for these employees is currently below the state average of 18 percent (at 15 percent), the San Antonio State Hospital is experiencing high turnover for these employees at 26 percent.170 In addition, positions at the North Texas State Hospital often remaining unfilled for over six months.171 Though only 12 percent of these highly skilled employees are currently eligible to retire, this number will increase to 26 percent in the next five years, making recruitment and retention for these jobs an ongoing challenge for the System.172
Registered Nurses (RNs) The nation and Texas continue to face a shortage of RNs, which is predicted to worsen over the next twenty years as baby boomers age and the need for health care grows. With state nursing schools facing budget cuts, they may be less able to hire enough faculty members to train new nurses to meet projected needs.173 RNs constitute one of the largest healthcare occupations. With 2.7 million jobs in the U.S., job opportunities for RNs are expected to grow faster than the average for all occupations. It is projected that there will be a need for 439,300 new RN jobs by 2024. With this level of job growth, it is projected that there will not be enough qualified applicants to meet the increased demand.174 175 176
167 Includes return-to-work retirees. HHSAS Database, as of 8/31/15. 168 HHSAS Database, as of 8/31/15. 169 Ibid. 170 HHSAS Database, FY 2015 data. 171 HHSAS Database, as of 8/31/15. 172 Includes return-to-work retirees. HHSAS Database, as of 8/31/15. 173 “Has the Recession Solved the Nursing Shortage? Experts say No,” Robert Wood Johnson Foundation, April 17, 2009, web page http://www.rwjf.org/pr/product.jsp?id=41728, last accessed 3/17/10. 174 U.S. Department of Labor, Bureau of Labor Statistics, Occupational Outlook Handbook, web page http://www.bls.gov/ooh/healthcare/registered-nurses.htm, last accessed on 3/16/16. 175 U.S. Department of Labor, Bureau of Labor Statistics, Selected Occupational Projections Data, web page http://www.bls.gov/emp/ep_table_110.htm, last accessed on 3/16/16. 176 Ibid.

Schedule F.1: HHS System Workforce Plan
F.1-50
Texas is also experiencing a critical shortage in RNs. It is projected that between 2005 and 2020, the demand for nurses in Texas will increase by 86 percent, while the supply will grow by only 53 percent.177 Although numbers vary from study to study, most concur that the nursing shortage is the most severe health workforce shortage currently facing both the nation and Texas.178 The Texas nurse-to-population ratio is below the national average of 921 nurses per 100,000 people, with the state ratio being only 753 nurses per 100,000 people.179 180 Although there are 115 nursing school programs across the state, most of them have more applicants than room for new students and only about two-thirds of enrolled students actually graduate.181 182 The shortage of trained instructors limits both the number of accepted students and the number of available classes offered. Other factors contributing to the current shortage include the steep population growth (resulting in a growing need for health care services), an aging nursing workforce, an overall aging and service-demanding population and an increased need for specialized nursing skills. This crisis is emerging just as skilled nurses are retiring and job opportunities in health care are expanding. The projected rates of growth in the youth, elderly and minority populations in Texas will result in an increased demand for health services from HHS System agencies. HHS employs approximately 1,967 RNs across the state, in state supported living centers, state hospitals, in Health Service Regions, and within the Inspector General's Office (IG).183 184 As the demand for nursing services increases and the supply decreases, the recruitment and retention of nurses becomes more difficult and the need for competitive salaries will become more critical.
177 “Texas Nursing: Our Future Depends on It. A Strategic Plan for the State of Texas to Meet Nursing Workforce Needs of 2013,” Texas Center for Nursing Workforce Studies, March 2009. 178 State of Nursing Workforce in Texas – Statewide Health Workforce Symposium Policy Brief, March 2005. 179 “Nursing Workforce in Texas - 2011: Demographics and Trends,” Texas Center for Nursing Workforce Studies, January 2013. Web page http://www.dshs.state.tx.us/chs/cnws/Final2-NursingWorkforceDemoTrends2011.pdf, last accessed 5/12/14. 180 "The U.S. Nursing Workforce: Trends in Supply and Education," Health Resources and Services Administration, Bureau of Health Professions, National Center for Health Workforce Analysis, April 2013. Web page http://bhpr.hrsa.gov/healthworkforce/reports/nursingworkforce/nursingworkforcefullreport.pdf, last accessed 5/15/14. 181 Texas Board of Nursing, web page http://www.bne.state.tx.us/pdfs/education_pdfs/education_programs/ApprovedRNschools.pdf, last accessed on 5/9/14. 182 “Professional Nursing Education in Texas: Demographics & Trends: 2006.” Department of State Health Services, web page http://www.dshs.state.tx.us/chs/cnws/2006ProfNrsgEdRpt.pdf, last accessed 3/17/10. 183 HHSAS Database, as of 8/31/15. 184 RNs include public health nurses.

Schedule F.1: HHS System Workforce Plan
F.1-51
Currently, the average annual salary for RNs is $57,738.185 This salary falls below both national and state averages for these occupations. Nationally, the average annual earnings for RNs in 2015 was $71,000.186 In Texas, the average annual earnings for RNs in 2015 was $69,890.187 In addition, the State Auditor’s Office 2014 market index analysis found the average state salary for RNs ranged from five to 16 percent behind the market rate.188 Many private hospitals are further widening the salary gap by offering signing bonuses. The non-competitive salaries offered by HHS agencies are directly contributing to the HHS System’s difficulties recruiting qualified applicants. Posted vacant positions are currently taking about five months to fill. The System is also losing existing staff to higher paying private health care jobs at an alarming rate (turnover of 27 percent for fiscal year 2015).189 It is expected that recruitment and retention of nurses will continue to be a problem for the System, as the nursing workforce shortage continues and as a significant portion of System nurses approach retirement. To address these difficulties, the 84th Legislature approved a targeted wage increase for RNs in localities with the highest turnover rates. In addition, HHS may consider increasing entry-level salaries for RNs and for currently employed RNs during fiscal years 2018 and 2019 and providing a salary equity adjustment for IG RNs.
RNs at State Supported Living Centers About 35 percent of System RNs (690 RNs) work at HHS state supported living centers across Texas.190 The typical state supported living center RN is about 47 years old and has an average of approximately seven years of state service.191 The turnover rate for these RNs is considered high at about 29 percent. Turnover is especially high at the Lubbock State Supported Living Center (at 42 percent) and the El Paso State Supported Living Center (at 52 percent).192
In addition, HHS finds it difficult to fill these vacant nurse positions. At these facilities, there are always vacant nursing positions that need to be filled. With a high vacancy rate for these positions (at approximately 11 percent), RN positions
185 HHSAS Database, as of 8/31/15. 186 U.S. Department of Labor, Bureau of Labor Statistics, Occupational Employment Statistics, web page http://data.bls.gov/oes/search.jsp?data_tool=OES, Period: May 2015; last accessed on 4/29/16. 187 Ibid. 188 State Auditor’s Office, “A Biennial Report on the State’s Position Classification Plan,” September 2014, Report No. 15-701, web page http://www.sao.state.tx.us/reports/main/15-701.pdf, last accessed 4/21/16. 189 HHSAS Database, FY 2015 data. 190 HHSAS Database, as of 8/31/15. 191 Ibid. 192 HHSAS Database, FY 2015 data.

Schedule F.1: HHS System Workforce Plan
F.1-52
often remain open for more than five months before being filled. Some facilities are experiencing even longer vacancy durations. At the Brenham State Supported Living Center it takes about seven months to fill a position, while at the Austin State Supported Living Center, it takes nearly eight months.193 In order to provide quality nursing care for consumers, it is essential that HHS maintain the lowest vacancy rate.
RNs at State Hospitals About 42 percent of System RNs (817 RNs) work at state hospitals across the Texas, providing frontline medical care of patients. They provide medications, primary health care and oversee psychiatric treatment.194 System nurses at state hospitals are generally required to work shifts and weekends. The work is demanding, requires special skills and staff often work long hours with minimal staffing. The work is also physically demanding, making it increasingly more difficult for the aging nursing workforce to keep up with these work demands. All of these job factors contribute to higher than average turnover rates. The typical RN at a System state hospital is about 48 years old and has an average of approximately 10 years of state service.195 The turnover rate for these RNs is considered high at about 28 percent. Turnover is especially high at the Rusk State Hospital, at 47 percent and within the Texas Center for Infectious Disease (at 42 percent).196
At these state hospitals, there are always vacant nursing positions that need to be filled. These RN positions often remain open for about five months before being filled. Some hospitals are experiencing even longer vacancy durations. At the North Texas State Hospital, it takes about seven months to fill a position, while at the Big Spring State Hospital, it takes nearly nine months.197
Public Health RNs About 10 percent of System RNs (193 RNs) provide direct care and population-based services in the many counties in Texas that have no local health department, or where state support is needed.198 These RNs are often the individuals who are on the frontline in the delivery of public health services to rural communities throughout the state, serving as consultants and advisors to county, local and stakeholder groups, and educating community partners. They assist in communicable disease
193 HHSAS Database, as of 8/31/15. 194 Ibid. 195 Ibid. 196 HHSAS Database, FY 2015 data. 197 HHSAS Database, as of 8/31/15. 198 Includes RN II - Vs in public health roles and public health nurses. Note: Public health nurses are also registered nurses.

Schedule F.1: HHS System Workforce Plan
F.1-53
investigation, control and prevention, and are critical to successful public health preparedness and response throughout the state. Public Health RNs have, on average, about eight years of state service, with an average age of about 50 years.199 While overall turnover for these RNs at 18 percent is at the same level as the state average rate, certain areas of Texas experienced higher turnover than others, including Health Service Regions the Lubbock area at about 30 percent and the Houston area at 35 percent.200 201
These RN positions often remain open for about five months before being filled.202
Inspector General's Office (IG) Registered Nurses (RNs) There are 80 RNs employed as Nurse IVs and Nurse Vs (about four percent of System RNs) within IG.203 These IG nurses conduct hospital and nursing facility medical investigations and reviews to determine the accuracy of data. They conduct investigations and examinations of alleged violations of laws, rules and regulations regarding fraud in Medicaid coding, and perform utilization reviews on Medicaid recipients in Medicaid approved hospitals to determine necessity of admission and the accuracy of diagnosis and procedural coding. Employees in this classification also conduct Long Term Care Minimum Data Set (MDS) assessment reviews in Medicaid approved nursing facilities to determine the accuracy of assessment data provided by the nursing facility to ensure accurate payment. IG nurse reviewers require at least one full year of training to be independent to conduct both hospital and nursing facility reviews. The typical IG nurse is about 53 years old and has an average of approximately seven years of state service.204 The turnover rate for IG nurses is considered high at about 20 percent.205 Recruitment and retention of these RNs remains one of the most critical issues for IG due to extensive travel requirements and salary constraints.
199 HHSAS Database, as of 8/31/15. 200 HHSAS Database, FY 2015 data. 201 State Auditor’s Office (SAO) FY 2015 Turnover Statistics. 202 HHSAS Database, as of 8/31/15. 203 Ibid. 204 Ibid. 205 HHSAS Database, FY 2015 data.

Schedule F.1: HHS System Workforce Plan
F.1-54
The high turnover of most qualified staff has shown an increasing tendency to leave HHS to accept higher paying jobs in the public and private sector. This situation is expected become more urgent over time, since 35 percent of these highly skilled employees will be eligible to retire from state employment in the next five years.206
Licensed Vocational Nurses (LVNs) There are about 1,024 direct care workers employed by HHS. The majority of these employees (about 99 percent) work at state hospitals and state supported living centers across Texas.207 About one percent work in Health Services Regions and central office program support, assisting in communicable disease prevention and control and the delivery of population-based services to individuals, families, and communities. On average, a System LVN is 45 years old and has eight years of state service.208 As with RNs, the nursing shortage is also impacting the HHS’ ability to attract and retain LVNs. Turnover for LVNs is currently very high at about 35 percent.209 Currently, the average annual salary for System LVNs during fiscal year 2015 was $36,766.210 This salary falls below both national and state averages for this occupation. Nationally, the average annual earnings for licensed practical nurses and LVNs was $44,030, and $45,130 in Texas.211 The State Auditor’s Office 2014 market index analysis found the average state salary for LVN IIs was 10 percent behind the market rate.212
To address these difficulties, the 84th Legislature approved a targeted wage increase for LVNs in localities with the highest turnover rates. In addition, HHS may consider increasing entry-level salaries for new LVNs and for currently employed staff during fiscal years 2018 and 2019.
206 Includes return-to-work retirees. HHSAS Database, as of 8/31/15. 207 Includes Licensed Vocational Nurse II and III. 208 HHSAS Database, as of 8/31/15. 209 HHSAS Database, FY 2015 data. 210 HHSAS Database, as of 8/31/15. 211 U.S. Department of Labor, Bureau of Labor Statistics, Occupational Employment Statistics, web page http://data.bls.gov/oes/search.jsp?data_tool=OES, Period: May 2015; last accessed on 4/29/16. 212 State Auditor’s Office, “A Biennial Report on the State’s Position Classification Plan,” September 2014, Report No. 15-701, web page http://www.sao.state.tx.us/reports/main/15-701.pdf, last accessed 4/21/16.

Schedule F.1: HHS System Workforce Plan
F.1-55
LVNs at State Supported Living Centers There are 534 LVNs employed at HHS state supported living centers across Texas. These LVNs are, on average, 45 years old and have an average of approximately eight years of state service.213 Turnover for LVNs at state supported living centers is one of the highest in the System at about 40 percent. Centers experienced the loss of 250 LVNs last fiscal year. Turnover is extremely high at the San Angelo State Supported Living Center (at 62 percent) and the El Paso State Supported Living Center (at 52 percent).214 With a very high vacancy rate of about 27 percent, vacant positions often go unfilled nearly six months. Some centers are experiencing even longer vacancy durations. At the Lufkin State Supported Living Center it takes about seven months to fill a position, while at the San Angelo State Supported Living Center, it takes over nine months.215
LVNs at State Hospitals There are approximately 480 LVNs employed at HHS state hospitals ad centers across Texas.216 On average, a state hospital LVN is about 44 years old and has eight years of state service.217 Turnover for these LVNs is currently very high at about 30 percent. Turnover is especially high at the Waco Center for Youth, at 67 percent and the San Antonio State Hospital (at 44 percent).218
Many LVNs come into the state hospital system with limited training in caring for psychiatric patients. HHS state hospitals invest in employee training to ensure the highest quality of nursing care. The high turnover for LVN positions has a direct impact on the training resources dedicated to this occupational group. Decreasing turnover levels will significantly reduce the amount of time spent on training new employees.
LVNs in Public Health Roles About one percent of System LVNs (10 LVNs) work in Health Services Regions across Texas. They have, on average, about 10 years of state service, with an average age of about 48 years.219
213 HHSAS Database, as of 8/31/15. 214 HHSAS Database, FY 2015 data. 215 HHSAS Database, as of 8/31/15. 216 Ibid. 217 Ibid. 218 HHSAS Database, FY 2015 data. 219 HHSAS Database, as of 8/31/15.

Schedule F.1: HHS System Workforce Plan
F.1-56
The overall turnover for these LVNs is high at 20 percent.220 Retention is expected to remain an issue as these employees approach retirement. Twenty percent of these tenured and skilled employees will be eligible to retire in the next five years.221
Nurse Practitioners and Physician Assistants Under the supervision of a physician, 49 System nurse practitioners and physician assistants are responsible for providing advanced medical services and clinical care to individuals at state hospitals and those who reside in state supported living centers across Texas.222
These highly skilled employees have, on average, about 11 years of state service, with an average age of 52. Over 40 percent of these employees have more than 10 years of state service.223 System nurse practitioners and physician assistants earn an average annual salary of $106,250.224 This salary falls slightly below the market rate. The State Auditor’s Office 2014 market index analysis found the average state salary for Nurse Practitioners to be eight percent behind the market rate and Physician Assistants were four percent behind the market rate.225 Though the turnover for nurse practitioners and physician assistants is currently well managed at about 12 percent, the vacancy rate is high at 14 percent, with positions remaining vacant for an average of about five months.226 227 Over 20 percent of nurse practitioners and physician assistants are currently eligible to retire, with this number increasing to 33 percent in the next five years. HHS will need to develop creative recruitment strategies to replace these highly skilled and tenured employees.228
220 HHSAS Database, FY 2015 data. 221 Includes return-to-work retirees. HHSAS Database, as of 8/31/15. 222 Ibid. 223 Ibid. 224 HHSAS Database, as of 8/31/15. 225 State Auditor’s Office, “A Biennial Report on the State’s Position Classification Plan,” September 2014, Report No. 15-701, web page http://www.sao.state.tx.us/reports/main/15-701.pdf, last accessed 4/21/16. 226 HHSAS Database, FY 2015 data. 227 HHSAS Database, as of 8/31/15. 228 Includes return-to-work retirees. HHSAS Database, as of 8/31/15.

Schedule F.1: HHS System Workforce Plan
F.1-57
Nurse Practitioners and Physician Assistants at State Supported Living Centers HHS employs 13 nurse practitioners and physician assistants at state supported living centers across Texas, while the majority of the employees (85 percent) are nurse practitioners.229 These highly skilled employees have, on average, about eight years of state service, with an average age of 54.230 Turnover for these nurse practitioners and physician assistants is slightly below the state average of 18 percent at 15 percent.231 232 With a high vacancy rate of 24 percent, vacant positions at state supported living centers go unfilled for months.233 Due to the continuing short supply and high demand for these professionals, HHS will need to develop creative recruitment strategies to replace these employees.
Nurse Practitioners and Physician Assistants at State Hospitals HHS employs 36 nurse practitioners and physician assistants at state hospitals across Texas. The majority of these individuals (83 percent) are employed as nurse practitioners.234
These highly skilled employees have, on average, about 13 years of state service, with an average age of 51.235 Though turnover for these state hospital employees is currently low at about 11 percent, positions are often remaining unfilled for over four months before being filled.236 237 About 22 percent of these highly skilled employees are currently eligible to retire. This number will increase to 33 percent in the next five years, making recruitment and retention for these jobs an ongoing challenge for the System.238
229 HHSAS Database, as of 8/31/15. 230 Ibid. 231 HHSAS Database, FY 2015 data. 232 State Auditor’s Office (SAO) FY 2015 Turnover Statistics. 233 HHSAS Database, as of 8/31/15. 234 Ibid. 235 Ibid. 236 HHSAS Database, FY 2015 data. 237 HHSAS Database, as of 8/31/15. 238 Ibid.

Schedule F.1: HHS System Workforce Plan
F.1-58
Pharmacists With about 297,000 active pharmacists as of May 2014, pharmacists represent one of the largest health professional groups in the U.S. While the overall supply of pharmacists has increased in the past decade, there has been an unprecedented demand for pharmacists and for pharmaceutical care services. Employment of pharmacists is projected to grow three percent from 2014 to 2024, slower than the average for all occupations. Increased demand for prescription medications is expected to lead to more demand for pharmaceutical services.239 HHS employs 95 pharmacists, with an average annual salary of $102,979.240 This salary falls significantly below the market rate. The average annual salary for pharmacists nationally is $119,270 and $120,480 in Texas.241 In addition, the State Auditor’s Office 2014 market index analysis found the average state salary for Pharmacist Is to be 14 percent behind the market rate.242 This disparity is affecting the System’s ability to recruit qualified applicants for open positions. Pharmacist positions often remain unfilled for over six months.243
With pharmacist turnover high at about 20 percent, HHS has often contracted with pharmacists to meet program needs.244 These contracted pharmacists are paid at rates that are well above the amount it would cost to hire pharmacists at state salaries. With a significant number of pharmacists nearing retirement age (or have already retired and returned to work), recruitment and retention will continue to be a problem for the System.
Pharmacists at State Supported Living Centers About half of System pharmacists (40 employees) work at HHS state supported living centers. The typical pharmacist at these facilities is about 45 years old and has an average of seven years of state service.245 Turnover for these pharmacists is currently high at about 23 percent, with pharmacist positions often remaining unfilled for about six months before being filled. Some of these facilities are experiencing even longer vacancy durations. At the Abilene State Supported Living Center a pharmacist position has remained vacant
239 U.S. Department of Labor, Bureau of Labor Statistics, Occupational Outlook Handbook, web page http://www.bls.gov/ooh/healthcare/pharmacists.htm, last accessed on 5/2/16. 240 HHSAS Database, as of 8/31/15. 241 U.S. Department of Labor, Bureau of Labor Statistics, Occupational Employment Statistics, web page http://data.bls.gov/oes/search.jsp?data_tool=OES, Period: May 2015; last accessed on 5/2/16. 242 State Auditor’s Office, “A Biennial Report on the State’s Position Classification Plan,” September 2014, Report No. 15-701, web page http://www.sao.state.tx.us/reports/main/15-701.pdf, last accessed 4/21/16. 243 HHSAS Database, as of 8/31/15. 244 HHSAS Database, FY 2015 data. 245 HHSAS Database, as of 8/31/15.

Schedule F.1: HHS System Workforce Plan
F.1-59
for over a year, while at the Corpus Christi State Supported Living Center, positions remain vacant for nearly six months.246 HHS may face significant recruitment challenges in the next few years to replace these highly skilled employees who will be eligible for retirement. Though only five percent of these employees are currently eligible to retire, a quarter of them will be eligible in the next five years.247
Pharmacists at State Hospitals There are 32 System pharmacists working in state hospitals across Texas. These highly skilled employees are essential to the timely filling of prescribed medications for patients in state hospitals. The majority of these employees are in Pharmacist II positions (28 employees or 88 percent).248 These pharmacists play a key role in the monitoring of costs and inventory of medications, and in the ongoing monitoring of in-patients’ medication histories, needs and potential adverse drug issues. They provide important clinical consultation to psychiatrists and physicians regarding complex medical and psychiatric conditions that may be intractable to traditional medication treatment interventions. The typical pharmacist at a state hospital is about 48 years old and has an average of 12 years of state service. About 44 percent of these employees have 10 or more years of service.249 Though turnover for these pharmacists is currently low at about 12 percent, positions are often remaining unfilled for nearly eight months before being filled. Some state hospitals are experiencing even longer vacancy durations. At the San Antonio State Hospital, a pharmacist position has remained vacant for over a year, while at the Terrell State Hospital, positions remain vacant for nearly six months.250 251 With 22 percent of these pharmacists currently eligible to retire, and 38 percent eligible to retire in the next five years, HHS will need to develop creative recruitment strategies to replace these skilled and highly tenured employees.252 To address these difficulties, HHS may consider increasing entry-level salaries for pharmacists and for currently employed state hospital pharmacists during fiscal years 2018 and 2019.
246 HHSAS Database, as of 8/31/15. 247 Includes return-to-work retirees. HHSAS Database, as of 8/31/15. 248 HHSAS Database, as of 8/31/15. 249 Ibid. 250 HHSAS Database, FY 2015 data. 251 HHSAS Database, as of 8/31/15. 252 Includes return-to-work retirees. HHSAS Database, as of 8/31/15.

Schedule F.1: HHS System Workforce Plan
F.1-60
Dentists The demand for dentists nationwide is expected to increase as the overall population grows. Employment of dentists is projected to grow by 18 percent through 2024.253 There are 28 dentists employed in HHS state supported living centers, state hospitals, and across the state in public health roles.254
Turnover for System dentists is very high, at 32 percent.255 One reason for this high turnover is the large disparity between private sector and HHS salaries. System dentists earn an average annual salary of $126,846.256 This salary falls significantly below the market rate. The average annual salary for dentists nationally is $172,350 and $171,870 in Texas.257 This disparity is also affecting the System’s ability to recruit qualified applicants for open positions. Dentist positions often remain unfilled for several months.258 In addition, since most dentists do not have the experience or interest to work with the challenging special patient populations, HHS continues to experience difficulty recruiting and attracting qualified dentists at the starting salary levels offered. These problems are expected to worsen as employees approach retirement. While 14 percent of these highly skilled employees are currently eligible to retire, this number will increase to 32 percent in the next five years.259
Dentists at State Supported Living Centers Over half of System dentists (61 percent) provide advanced dental care and treatment for individuals living at the HHS supported living centers across Texas. The typical pharmacist at these facilities is about 53 years old and has an average of nine years of state service.260 Turnover for these dentists is currently high at about 23 percent, with dentist positions often remaining unfilled for an average of four months before being filled. At the Brenham State Supported Living Center, dentist positions remain vacant for over six months.261 262 253 U.S. Department of Labor, Bureau of Labor Statistics, Occupational Outlook Handbook, web page http://www.bls.gov/ooh/healthcare/dentists.htm, last accessed on 5/2/16. 254 HHSAS Database, as of 8/31/15. 255 HHSAS Database, FY 2015 data. 256 HHSAS Database, as of 8/31/15. 257 U.S. Department of Labor, Bureau of Labor Statistics, Occupational Employment Statistics, web page http://data.bls.gov/oes/search.jsp?data_tool=OES, Period: May 2015; last accessed on 5/2/16. 258 HHSAS Database, as of 8/31/15. 259 Includes return-to-work retirees. HHSAS Database, as of 8/31/15. 260 HHSAS Database, as of 8/31/15. 261 HHSAS Database, FY 2015 data. 262 HHSAS Database, as of 8/31/15.

Schedule F.1: HHS System Workforce Plan
F.1-61
HHS may face significant recruitment challenges in the next few years to replace these highly skilled employees who will be eligible for retirement. About 18 percent of these employees are currently eligible to retire, and this number will increase to nearly 30 percent in the next five years.263
Dentists at State Hospitals and in Public Health Roles HHS employs three dentists in state hospitals, providing preventive care, emergency dental interventions and other treatment services to patients. Another five dentists perform public heath roles are Central Office staff or members of five regional dental teams who conduct dental surveillance, data collection and reporting and provide preventive oral health services. Services are provided primarily to low-income, pre-school and school-age children in rural areas with limited or no access to these services.264
These dentists are, on average, about 46 years old, with an average of about seven years of state service.265 Turnover for these dentist positions is very high at about 46 percent.266
Though only 13 percent of these dentists are currently eligible to retire, 38 percent will be eligible to retire in the next five years. HHS will need to develop creative recruitment strategies to replace these highly skilled employees.267
Physicians There are currently about 347,200 active physicians and surgeons across the country. Due to the increased demand for healthcare services by the growing and aging population, employment of physicians is projected to grow about 15 percent from 2014 to 2024, faster than the average for all occupations.268 269 HHS employs 86 physicians, with majority (93 percent) employed in HHS state supported living centers, state hospitals and in Health Service Regions.270
263 Includes return-to-work retirees. HHSAS Database, as of 8/31/15. 264 HHSAS Database, as of 8/31/15. 265 Ibid. 266 HHSAS Database, FY 2015 data. 267 Includes return-to-work retirees. HHSAS Database, as of 8/31/15. 268 U.S. Department of Labor, Bureau of Labor Statistics, Selected Occupational Projections Data, web page http://data.bls.gov/projections/occupationProj, Period: May 2014; last accessed on 4/25/16. 269 U.S. Department of Labor, Bureau of Labor Statistics, Occupational Outlook Handbook, web page http://www.bls.gov/ooh/healthcare/physicians-and-surgeons.htm, last accessed on 5/2/16. 270 HHSAS Database, as of 8/31/15.

Schedule F.1: HHS System Workforce Plan
F.1-62
These highly skilled employees have, on average, about 12 years of state service, with an average age of 59. Over 40 percent of these employees have more than 10 years of state service.271 System physicians are currently earning an average annual salary of $180,529.272 This salary is below the average wage paid nationally ($197,700), and also lower than the Texas average of $197,410.273 Turnover for these physicians is currently high at 22 percent. In addition, the vacancy rate is very high at 19 percent, with positions remaining vacant for an average of about seven months.274 275 About 38 percent of these highly skilled and tenured employees are currently eligible to retire, with this number increasing to 52 percent in the next five years.276 To address these difficulties, HHS may consider increasing entry-level salaries for physicians and for currently employed physicians during fiscal years 2018 and 2019.
Physicians at State Supported Living Centers There are 39 physicians working at state supported living centers across Texas.277 Full staffing of these positions is critical to direct-care services. These physicians have, on average, about nine years of state service, with an average age of 57. Local physicians who have established long term private practices often apply as a staff physician at state supported living centers late in their working career to secure retirement and insurance benefits, thus explaining the reason for the high average age. Only two full-time physicians are under 40 years of age.278 Turnover for these physicians is considered high at 24 percent.279 To deal with these recruitment and retention difficulties, HHS has often used contract physicians to provide required coverage. These contracted physicians are paid at rates that are well above the amount it would cost to hire physicians at state salaries (costing in excess of $200 per hour, compared to the hourly rate of about
271 HHSAS Database, as of 8/31/15. 272 HHSAS Database, as of 8/31/15. 273 U.S. Department of Labor, Bureau of Labor Statistics, Occupational Employment Statistics, web page http://data.bls.gov/oes/search.jsp?data_tool=OES, Period: May 2015; last accessed on 5/2/16. 274 HHSAS Database, FY 2015 data. 275 HHSAS Database, as of 8/31/15. 276 Includes return-to-work retirees. HHSAS Database, as of 8/31/15. 277 HHSAS Database, as of 8/31/15. 278 Ibid. 279 HHSAS Database, FY 2015 data.

Schedule F.1: HHS System Workforce Plan
F.1-63
$94 paid to physicians at state supported living centers).280 Aside from being more costly, the System has experienced other problems with contracted physicians, including a lengthy learning curve, difficulty in obtaining long-term commitments, excessive staff time spent procuring their services, difficulty in obtaining coverage, dependability and inconsistency of services due to their short-term commitment. To meet the health needs of individuals residing in state supported living centers, it is critical that HHS recruit and retain qualified physicians. However, due to the short supply and large demand, state supported living centers are experiencing difficulty hiring physicians. With a high vacancy rate of 17 percent, positions are remaining unfilled for an average of five months.281
Physicians at State Hospitals There are currently 30 physicians at HHS who are providing essential medical care in state hospitals.282 They take the lead role in diagnosing, determining a course of treatment, making referrals to outside medical hospitals, prescribing medications and monitoring the patients’ progress toward discharge. Physician services in state hospitals are essential to the ongoing monitoring and management of an increasing number of complex chronic medical conditions, such as diabetes, seizure disorders, hypertension and chronic obstructive pulmonary disease (COPD). These employees are critical to the System’s preparedness and response to medical services provided by the state and to major public health initiatives, such as obesity prevention, diabetes, disease outbreak control and others. These physicians have, on average, about 16 years of state service, with an average age of about 63. Local physicians who have established long term private practices often apply as physicians at state hospitals late in their working career to secure retirement and insurance benefits, contributing to the high overall age. Only 12 full-time physicians are under 50 years of age.283 Turnover for these physicians is currently high at 23 percent.284 With a very high vacancy rate of about 27 percent, it takes about nine months to fill a state hospital physician position with someone who has appropriate skills and expertise.285 In addition, HHS may face significant challenges in the next few years to replace those employees who are eligible for retirement. About 57 percent of these highly skilled and tenured employees are currently eligible to retire. Within five years,
280 HHSAS Database, as of 8/31/15. 281 Ibid. 282 HHSAS Database, FY 2015 data. 283 HHSAS Database, as of 8/31/15. 284 HHSAS Database, FY 2015 data. 285 Ibid.

Schedule F.1: HHS System Workforce Plan
F.1-64
nearly 67 percent will be eligible to retire. If these employees choose to retire, the HHS would lose some of the most experienced medical personnel – those with institutional knowledge and skills that will be difficult to match and even harder to recruit.286 Recruitment of qualified candidates, as well as retention of these highly skilled and knowledgeable employees, continues to be a challenge for the System. Compensation levels will need to be increased to effectively compete in a market where qualified applicants are in short supply and healthcare competitors offer a higher starting salary. The cost of obtaining clinical staff through a placement service or contract far exceeds the cost of hiring and retaining an agency physician. Attracting and keeping clinical staff that are trained in the use of HHS electronic equipment and clinical practices, as well as familiarity with the consumer population, is more productive and cost-effective.
Physicians in Public Health Roles There are 11 HHS physicians performing public health services.287 Physicians serving in public health roles in Health Service Regions and Central Office act as state and regional consultants and advisors to county, local, hospital, and stakeholder groups, and provide subject matter expertise on programs and services. These physicians provide public health services that are essential to the provision of direct clinical services in areas of the state where local jurisdictions do not provide services in communicable disease control and prevention and population-based services. Physicians serving in Health Service Regions initiate treatment of communicable diseases; refer, prescribe medication, and monitor treatment. They oversee infectious disease investigation, control, and prevention efforts regionally, and provide direction for public health preparedness and response centrally and in the Health Service Regions. Some of the physicians who serve as Regional Directors are required by statute to also serve as the Local Health Authority (LHA) in counties that do not have a designated LHA. As such, they enforce laws relating to public health; establish, maintain and enforce quarantines; and report the presence of contagious, infectious, and dangerous epidemic diseases in the health authority’s jurisdiction. As Regional Medical Directors, physicians in Health Service Regions serve as community leaders and conveyors of health-related organizations and individuals for the purpose of improving the health of all Texans. These physicians are, on average, about 52 years old, with an average of about 11 years of state service.288
286 Includes return-to-work retirees. HHSAS Database, as of 8/31/15. 287 HHSAS Database, as of 8/31/15. 288 Ibid.

Schedule F.1: HHS System Workforce Plan
F.1-65
Turnover for these positions is high at about 24 percent.289
Vacancies in Regional Medical Director (RMD) positions are extremely difficult to fill, especially in major metropolitan and border regions. One RMD vacancy in the Houston area took over three years to fill. RMD positions in the Tyler and Harlingen area have been vacant for 15 months. Currently, 27 percent of these physicians are eligible to retire, with the number employees eligible to retire increasing to over 60 percent in the next five years. HHS will need to develop creative recruitment strategies to replace these highly skilled employees.290
Psychiatrists There are currently about 28,000 psychiatrists nationwide. Increased demand for healthcare services by the growing and aging population is expected to result in a 15 percent rate of growth from 2014 to 2024.291 HHS employs 130 psychiatrists in HHS state supported living centers and state hospitals, with the majority of these psychiatrists (about 88 percent) employed in state hospitals across Texas.292 These highly skilled and tenured employees have, on average, about 12 years of state service, with an average age of 54.293 System psychiatrists currently earn an average annual salary of $218,777.294 The State Auditor’s Office 2014 market index analysis found the average state salary for Psychiatrist IIs to be six percent behind the market rate.295 Turnover for System psychiatrists is currently high at about 22 percent. In addition, the vacancy rate is very high at about 18 percent, with positions remaining vacant for an average of about eight months.296 297
289 HHSAS Database, FY 2015 data. 290 Includes return-to-work retirees. HHSAS Database, as of 8/31/15. 291 U.S. Department of Labor, Bureau of Labor Statistics, Selected Occupational Projections Data, web page http://data.bls.gov/projections/occupationProj, Period: May 2014; last accessed on 4/25/16. 292 HHSAS Database, as of 8/31/15. 293 Ibid. 294 Ibid. 295 State Auditor’s Office, “A Biennial Report on the State’s Position Classification Plan,” September 2014, Report No. 15-701, web page http://www.sao.state.tx.us/reports/main/15-701.pdf, last accessed 4/21/16. Note: Since these were no Auditor IIs in IG, data on the market rate for this classification was not included. 296 HHSAS Database, FY 2015 data. 297 HHSAS Database, as of 8/31/15.

Schedule F.1: HHS System Workforce Plan
F.1-66
About 30 percent of these highly skilled and tenured employees are currently eligible to retire, with this number increasing to 44 percent in the next five years.298 To address these difficulties, HHS may consider increasing entry-level salaries for psychiatrists and for currently employed psychiatrists during fiscal years 2018 and 2019.
Psychiatrists at State Supported Living Centers The 15 psychiatrists assigned to state supported living centers are in senior-level Psychiatrist III positions. Full staffing of these positions is critical to providing psychiatric services needed by residents.299 These psychiatrists have, on average, about eight years of state service, with an average age of 56.300 Turnover for these psychiatrists is very high at 39 percent.301 With a very high vacancy rate of 40 percent, vacant positions in state supported living centers go unfilled for over 10 months.302 In fact, many of the postings and advertisements for these positions result in no responses from qualified applicants. To deal with these recruitment and retention difficulties, HHS has often used contract psychiatrists to provide required coverage. These contracted psychiatrists are paid at rates that are well above the amount it would cost to hire psychiatrists at state salaries (costing in excess of $200 per hour, compared to the hourly rate of about $105 paid to System psychiatrists at state supported living centers).303 Aside from being more costly, HHS has experienced other problems with contracted psychiatrists, including a lengthy learning curve, difficulty in obtaining long-term commitments, excessive staff time spent procuring their services, difficulty in obtaining coverage, dependability and inconsistency of services due to their short-term commitment. To meet the health needs of individuals residing in state supported living centers, it is critical that HHS fill all budgeted psychiatrist positions and effectively recruit and retain qualified psychiatrists.
298 Includes return-to-work retirees. HHSAS Database, as of 8/31/15. 299 HHSAS Database, as of 8/31/15. 300 Ibid. 301 HHSAS Database, FY 2015 data. 302 HHSAS Database, as of 8/31/15. 303 Ibid.

Schedule F.1: HHS System Workforce Plan
F.1-67
Psychiatrists at State Hospitals There are currently 115 System psychiatrists providing essential medical and psychiatric care in state hospitals.304 These highly skilled employees take the lead role in diagnosing, determining a course of treatment, prescribing medications and monitoring patient progress. These psychiatrists have, on average, about 13 years of state service, with an average age of 53. About 53 percent of these employees have 10 or more years of service.305 Annual turnover for these psychiatrists is currently high at about 20 percent. Big Springs State Hospital reported the highest state hospital turnover rate of 57 percent.306 With a high vacancy rate of about 14 percent, most vacant psychiatrist positions go unfilled for months.307 At some state hospitals, these positions remain vacant for seven months (at the Rusk and Terrell state hospitals). These challenges are expected to continue, as more than 30 percent of these highly skilled and tenured employees are currently eligible to retire, and may leave at any time. Within five years, this number will increase to 46 percent.308 State hospitals face increasing difficulty in recruiting qualified psychiatrists. This has resulted in excessively high workloads for the psychiatrists on staff, reducing the ability of state hospitals to function at full capacity, placing hospital accreditation at risk and increasing the average length of patients' stay. To deal with these recruitment difficulties, the System has often used contract psychiatrists to provide required coverage. These contracted psychiatrists are paid at rates that are well above the amount it would cost to hire psychiatrists at state salaries (costing in excess of $200 per hour, compared to the hourly rate of about $105 paid to psychiatrists at state hospitals).309 These contracted psychiatrists may not be immediately available in an emergency (increasing the risk to patients) and are unable to provide the individualized treatment that arises from daily contact with staff and patients. Consequently, the patient’s length of stay increases and annual number of patients served decreases. Since medical records of patients are almost completely electronic, psychiatrists are required to be proficient at computer entry and documentation. It often takes many weeks to train a contract psychiatrist on the nuances of the electronic medical record system.
304 HHSAS Database, as of 8/31/15. 305 Ibid. 306 HHSAS Database, FY 2015 data. 307 HHSAS Database, as of 8/31/15. 308 Includes return-to-work retirees. HHSAS Database, as of 8/31/15. 309 HHSAS Database, as of 8/31/15.

Schedule F.1: HHS System Workforce Plan
F.1-68
Due to the complex medical and mental challenges that individuals residing in state hospitals exhibit, it is critical that HHS is able to effectively recruit and retain qualified psychiatrists. Continued targeted recruitment strategies and retention initiatives for these highly skilled professionals must be ongoing.
Psychologists There are 236 psychologists in HHS, with the majority (98 percent) employed in state supported living centers and state hospitals across the state.310
System psychologists earn an average annual salary of $57,043.311 This salary falls below the market rate. The State Auditor’s Office 2014 market index analysis found the average state salary for Psychologist IIs to be nine percent behind the market rate.312 Turnover for these psychologists is high at 25 percent, with psychologist positions often remaining unfilled for several months before being filled.313 314
Psychologists at State Supported Living Centers About 77 percent of HHS psychologists (182 employees) work at state supported living centers across Texas. These employees participate in quality assurance and quality enhancement activities related to the provision of psychological and behavioral services to state supported living center residents; provide consultation and technical assistance to individuals with cognitive, developmental, physical and health related needs; implement and evaluate behavioral support plans; review the use of psychotropic medication in treating behavior problems; perform chart reviews; and perform observations and assessments relevant to the design of positive interventions and supports for individuals.315 The typical psychologist at these facilities is about 41 years old and has an average of eight years of state service.316 Turnover for these psychologists is high at about 26 percent, reflecting the loss of about 52 workers during fiscal year 2015. Turnover rates by location ranged from 10
310 HHSAS Database, as of 8/31/15. Note: Includes Psychologists, Behavioral Health Specialists, and Behavioral Analysts. 311 HHSAS Database, as of 8/31/15. 312 State Auditor’s Office, “A Biennial Report on the State’s Position Classification Plan,” September 2014, Report No. 15-701, web page http://www.sao.state.tx.us/reports/main/15-701.pdf, last accessed 4/21/16. 313 HHSAS Database, FY 2015 data. 314 HHSAS Database, as of 8/31/15. 315 Ibid. 316 Ibid.

Schedule F.1: HHS System Workforce Plan
F.1-69
percent at the Denton State Supported Living Center to 75 percent at the El Paso State Supported Living Center.317 With a high vacancy rate for these positions (at approximately 11 percent), psychologist positions often remain open for months before being filled. At the Brenham State Supported Living Center, positions have remained vacant for an average of 10 months.318
Psychologists at State Hospitals There are 50 psychologists working at HHS state hospitals, with nearly 60 percent employed in Psychologist II positions.319 Full staffing of these positions is critical to providing needed psychological services to patients. These psychologists play a key role in the development of treatment programs for both individual patients and groups of patients. Their evaluations are critical to the ongoing management and discharge of patients receiving competency restoration services, an ever growing patient population in the state hospitals. They also provide testing and evaluation services important to ongoing treatment, such as the administration of IQ, mood, and neurological testing instruments. These highly skilled and tenured employees have, on average, about 10 years of state service, with an average age of 46.320 Turnover for these psychologists is high at about 22 percent. The San Antonio State Hospital experienced the highest turnover at 43 percent.321
The vacancy rate for these positions is very high, at about 18 percent, with positions often remaining unfilled for over seven months.322
HHS may face significant recruitment challenges in the next few years, as 18 percent of these highly skilled and tenured employees are currently eligible for retirement, and may leave HHS at any time.323 It is critical that the HHS fill all budgeted state hospital psychologist positions and is able to effectively recruit and retain qualified psychologists.
317 HHSAS Database, FY 2015 data. 318 HHSAS Database, as of 8/31/15. 319 Ibid. 320 Ibid. 321 HHSAS Database, FY 2015 data. 322 HHSAS Database, as of 8/31/15. 323 Includes return-to-work retirees. HHSAS Database, as of 8/31/15.

Schedule F.1: HHS System Workforce Plan
F.1-70
Epidemiologists HHS employs 91 full-time epidemiologists who provide services in the areas of infectious disease and injury control, chronic disease control, emergency and disaster preparedness, disease surveillance and other public health areas.324 They provide critical functions during disasters and pandemics and other preparedness and response planning. Nationally, there is a shortage of epidemiologists.325 326 Although epidemiology is known as the core science of public health, epidemiologists comprise less than one percent of all public health professionals.327 As of May 2014, there were approximately 5,800 epidemiologist jobs in the U.S., with a projected job growth rate of 6.3 percent by 2022.328 On average, System epidemiologists have about nine years of state service, with an average age of approximately 39 years.329 Turnover for System epidemiologists is currently high, at about 25 percent, well above the state average turnover rate of 18 percent. This rate is much higher for entry-level Epidemiologist Is, at 38 percent. When the level of on-the-job experience needed to adequately perform the job is considered, this high turnover rate is of special concern. It takes, on average, a year for a new epidemiologist to learn his or her job. Several years are required to develop the specialized expertise required of senior epidemiologists to support the state and protect public health.330 331 HHS is currently experiencing difficulty filling vacant epidemiologist positions. Vacant positions are going unfilled for many months due to a shortage of qualified applicants available for work.332 Low pay is a contributing factor in the inability to attract qualified epidemiologist applicants. System epidemiologists are currently earning an average annual salary
324 HHSAS Database, as of 8/31/15. 325 “2007 State Public Health Workforce Survey Results,” The Association of State and Territorial Health Officials, web page http://biotech.law.lsu.edu/cdc/astho/WorkforceReport.pdf, last accessed on 4/29/16. 326 Patricia A. Drehobl, Sandra W. Roush, Beth H. Stover, and Denise Koo, “Public Health Surveillance Workforce of the Future” Morbidity and Mortality Weekly Report (MMWR), 61(03); 25-29 (July 2012), web page http://www.cdc.gov/mmwr/pdf/other/su6103.pdf, last accessed on 5/9/14. 327 Melissa Taylor Bell and Irakli Khodeli. “Public Health Worker Shortages,” The Council of State Governments, November 2004. 328 U.S. Department of Labor, Bureau of Labor Statistics, Selected Occupational Projections Data, web page http://data.bls.gov/projections/occupationProj, Period: May 2014; last accessed on 4/20/16. 329 HHSAS Database, as of 8/31/15. 330 HHSAS Database, FY 2015 data. 331 State Auditor’s Office (SAO) FY 2015 Turnover Statistics. 332 HHSAS Database, as of 8/31/15.

Schedule F.1: HHS System Workforce Plan
F.1-71
of $56,861.333 This salary is significantly below the average wage paid nationally ($76,900), and also lower than the Texas average of $66,880.334 In addition, HHS may face significant recruitment challenges in the next few years to replace these highly skilled employees who are eligible for retirement. Though only 11 percent of these employees are currently eligible to retire, this rate will increase in the next five years to 23 percent.335 HHS will need to closely monitor this occupation due to the nationally non-competitive salaries and a general shortage of professionals performing this work.
Sanitarians Another public health profession currently experiencing shortages is environmental health workers (i.e., sanitarians).336 337 There are 127 sanitarians employed with HHS.338 HHS registered sanitarians inspect all food manufacturers, wholesale food distributors, food salvagers in Texas, as well as all retail establishments in the 188 counties not covered by local health jurisdictions and conduct a multitude of environmental inspections such as children’s camps, asbestos abatement, hazardous chemicals/products and many others. Sanitarians are instrumental in protecting the citizens of Texas from food-borne illness and many dangerous environmental situations and consumer products, including imported foods, drugs and consumer products. The U.S. Food and Drug Administration (FDA) and the Consumer Products Safety Commission (CPSC) have little manpower and therefore depend on the state programs to protect citizens. System sanitarians also respond to a variety of emergencies, including truck wrecks, fires, tornados, floods and hurricanes. They are the first line of defense against a bioterrorist attack on the food supply. On average, HHS sanitarians are 46 years old and have about 10 years of state service. About 43 percent of these employees have 10 or more years of state service.339
333 HHSAS Database, as of 8/31/15. 334 U.S. Department of Labor, Bureau of Labor Statistics, Occupational Employment Statistics, web page http://data.bls.gov/oes/search.jsp?data_tool=OES, Period: May 2015; last accessed on 4/20/16. 335 Includes return-to-work retirees. HHSAS Database, as of 8/31/15. 336 “2007 State Public Health Workforce Survey Results,” The Association of State and Territorial Health Officials, web page http://biotech.law.lsu.edu/cdc/astho/WorkforceReport.pdf, last accessed on 4/21/16. 337 Patricia A. Drehobl, Sandra W. Roush, Beth H. Stover, and Denise Koo, “Public Health Surveillance Workforce of the Future” Morbidity and Mortality Weekly Report (MMWR), 61(03); 25-29 (July 2012), web page http://www.cdc.gov/mmwr/pdf/other/su6103.pdf, last accessed on 5/9/14. 338 HHSAS Database, as of 8/31/15. 339 Ibid.

Schedule F.1: HHS System Workforce Plan
F.1-72
Though the turnover rate for HHS sanitarians is currently low at about 10 percent, HHS has experienced difficulty filling vacant positions, with vacant positions often going unfilled for many months due to a shortage of qualified applicants available for work.340 341 Historically, HHS has faced special challenges filling vacancies in both rural and urban areas of the state. In addition, the state requirement for sanitarians to be registered and have at least 30 semester hours of science (in addition to 18 hours of continuing education units annually) has made it increasingly difficult to find qualified individuals. With 17 percent of sanitarians currently eligible to retire, and 39 percent eligible to retire in the next five years, HHS will need to develop creative recruitment strategies to replace these skilled and highly tenured employees.342
Laboratory Staff HHS operates a state-of-the-art state laboratory in Austin and two regional laboratories, one in San Antonio and the other in Harlingen. The Austin State Hospital provides laboratory services for the other HHS state hospitals and state supported living centers. While laboratory staff is made up of a number of highly skilled employees, there are four job groups that are essential to laboratory operations: chemists, microbiologists, laboratory technicians and medical technologists. Targeted recruitment and retention strategies are used to ensure that HHS laboratories have enough staff to meet HHS goals. One strategy has been to contract with private laboratories. This has not been a particularly desirable alternative to hiring laboratory staff. Barriers to using contracts with private labs include securing a cost-effective contract arrangement and the difficulty in obtaining a long term commitment. In most cases, contracting with private lab services is more costly than hiring staff to perform these services. To further address these difficulties, HHS may consider increasing entry-level salaries for new laboratory staff and for currently employed staff during fiscal years 2018 and 2019.
340 HHSAS Database, FY 2015 data. 341 HHSAS Database, as of 8/31/15. 342 Includes return-to-work retirees. HHSAS Database, as of 8/31/15.

Schedule F.1: HHS System Workforce Plan
F.1-73
Chemists There are 59 chemists employed in the HHS Division for Disease Control and Preventive Services, all located in Austin.343 The typical System chemist is about 47 years old and has an average of about 12 years of state service. Nearly half of the employees have 10 years or more of state service.344 While the overall turnover rate for System chemists is well managed at about 10 percent annually, Chemist IIs experienced a 19 percent turnover rate, slightly above the state average turnover rate of 18 percent.345 346 The vacancy rate for System chemists is currently high at about 17 percent, with vacant positions often going unfilled for many months due to a shortage of qualified applicants available for work.347 These vacancy problems are expected to worsen as employees approach retirement. Nearly 20 percent of these tenured and highly skilled employees are currently eligible to retire.348 Low pay is a factor in the inability to attract qualified chemist applicants. System chemists earn an average annual salary of about $45,940.349 The State Auditor’s Office 2014 market index analysis found the average state salary for chemists ranged from three to 11 percent behind the market rate.350 The average annual salary for chemists nationally is $77,860 and $71,670 in Texas.351
Microbiologists There are 130 microbiologists working for HHS, with the majority at the Austin laboratory.352 System microbiologists have, on average, about 11 years of state service, with an average age of about 41 years.353
343 HHSAS Database, as of 8/31/15. 344 Ibid. 345 HHSAS Database, FY 2015 data. 346 State Auditor’s Office (SAO) FY 2015 Turnover Statistics. 347 HHSAS Database, as of 8/31/15. 348 Includes return-to-work retirees. HHSAS Database, as of 8/31/15. 349 HHSAS Database, as of 8/31/15. 350 State Auditor’s Office, “A Biennial Report on the State’s Position Classification Plan,” September 2014, Report No. 15-701, web page http://www.sao.state.tx.us/reports/main/15-701.pdf, last accessed 4/21/16. 351 U.S. Department of Labor, Bureau of Labor Statistics, Occupational Employment Statistics, web page http://data.bls.gov/oes/search.jsp?data_tool=OES, Period: May 2015; last accessed on 4/20/16. 352 HHSAS Database, as of 8/31/15. 353 Ibid.

Schedule F.1: HHS System Workforce Plan
F.1-74
The turnover rate for all System microbiologists is below the state average rate of 18 percent at about 14 percent. This rate is much higher for entry-level Microbiologist Is (at 26 percent) and Microbiologist IIs (at 21 percent).354 355 System microbiologists earn an average annual salary of about $43,069.356 The State Auditor’s Office 2014 market index analysis found the average state salary for microbiologists ranged from one to seven percent behind the market rate.357 This average annual salary also falls below the national and statewide market rates for this occupation. The average annual salary for microbiologists nationally is $76,230 and $55,100 in Texas.358 This disparity in earnings is affecting the System’s ability to recruit qualified applicants for open positions. Microbiologist positions often remain unfilled for several months.359 In addition, HHS may face significant recruitment challenges in the next few years to replace these highly skilled and tenured employees who are eligible for retirement. Though only 13 percent of these employees are currently eligible to retire, this rate will increase in the next five years to 25 percent.360
Laboratory Technicians The laboratory technician profession is currently experiencing national shortages.361 There are 53 laboratory technicians employed at HHS.362 The typical laboratory technician is about 41 years old and has an average of 11 years of state service.363 The turnover rate for System laboratory technicians is slightly below the state average rate of 18 percent at about 16 percent.364 365
354 State Auditor’s Office (SAO) FY 2015 Turnover Statistics. 355 HHSAS Database, FY 2015 data. 356 HHSAS Database, as of 8/31/15. 357 State Auditor’s Office, “A Biennial Report on the State’s Position Classification Plan,” September 2014, Report No. 15-701, web page http://www.sao.state.tx.us/reports/main/15-701.pdf, last accessed 4/21/16. 358 US Department of Labor, Bureau of Labor Statistics, Occupational Employment Statistics, web page http://data.bls.gov/oes/search.jsp?data_tool=OES, Period: May 2015; last accessed on 4/21/16. 359 HHSAS Database, as of 8/31/15. 360 Includes return-to-work retirees. HHSAS Database, as of 8/31/15. 361 Bill Malone, “May 2011 Clinical Laboratory News: Trends in Recruitment and Retention” Clinical Laboratory News, 37(5) (May 2011). 362 HHSAS Database, as of 8/31/15. 363 Ibid. 364 State Auditor’s Office (SAO) FY 2015 Turnover Statistics. 365 HHSAS Database, FY 2015 data.

Schedule F.1: HHS System Workforce Plan
F.1-75
The vacancy rate for System laboratory technicians is currently high at about 15 percent, with vacant positions often going unfilled for many months due to a shortage of qualified applicants available for work.366 Low pay is a factor in the inability to attract qualified laboratory technician applicants. HHS laboratory technicians earn an average annual salary of about $30,128.367 The average annual salary for medical and clinical laboratory technicians nationally is $41,420 and $38,970 in Texas.368 The State Auditor’s Office 2014 market index analysis found the average state salary for laboratory technicians ranged from five percent above to 15 percent behind the market rate.369 These problems are expected to worsen as employees approach retirement. Nearly 30 percent of these tenured and highly skilled employees will be eligible to retire in the next five years.370
Medical Technologists The medical technologist profession is also currently experiencing national shortages.371 Within HHS, there are 65 medical technologists.372 These workers perform complex clinical laboratory work and are critical to providing efficient and quality healthcare. System medical technologists have, on average, about 11 years of state service, with an average age of 44 years. About 45 percent of these employees have 10 or more years of state service.373 The turnover rate for all System medical technologists is slightly below the state average rate of 18 percent at about 16 percent. This rate is much higher for entry-level Medical Technologist Is (at 20 percent) and Medical Technologist IIs (at 34 percent).374 375
366 HHSAS Database, as of 8/31/15. 367 Ibid. 368 US Department of Labor, Bureau of Labor Statistics, Occupational Employment Statistics, web page http://data.bls.gov/oes/search.jsp?data_tool=OES, Period: May 2015; last accessed on 4/21/16. 369 State Auditor’s Office, “A Biennial Report on the State’s Position Classification Plan,” September 2014, Report No. 15-701, web page http://www.sao.state.tx.us/reports/main/15-701.pdf, last accessed 4/21/16. 370 Includes return-to-work retirees. HHSAS Database, as of 8/31/15. 371 Bill Malone, “May 2011 Clinical Laboratory News: Trends in Recruitment and Retention” Clinical Laboratory News, 37(5) (May 2011). 372 HHSAS Database, as of 8/31/15. 373 Ibid. 374 State Auditor’s Office (SAO) FY 2015 Turnover Statistics. 375 HHSAS Database, FY 2015 data.

Schedule F.1: HHS System Workforce Plan
F.1-76
The vacancy rate for System medical technologists is currently high at about 15 percent, with vacant positions often going unfilled for many months due to a shortage of qualified applicants available for work.376 HHS medical technologists earn an average annual salary of $41,993, which is below the average wage paid nationally ($61,860), and also lower than the Texas average of $59,660.377 378 In addition, the State Auditor’s Office 2014 market index analysis found the average state salary for medical technologists ranged from seven to 16 percent behind the market rate.379 This disparity is affecting the HHS’ ability to recruit qualified applicants for open positions.
Though only 14 percent of these employees are currently eligible to retire, over a quarter of these employees will be eligible in the next five years. HHS will need to develop creative recruitment strategies to replace these highly skilled and tenured employees, and to ensure a qualified applicant pool is available to select from as vacancies occur.380
376 HHSAS Database, as of 8/31/15. 377 Ibid. 378 U.S. Department of Labor, Bureau of Labor Statistics, Occupational Employment Statistics, web page http://data.bls.gov/oes/search.jsp?data_tool=OES, Period: May 2015; last accessed on 4/21/16. Note: The Employees are listed under the Occupational title of Medical and Clinical Laboratory Technologists. 379 State Auditor’s Office, “A Biennial Report on the State’s Position Classification Plan,” September 2014, Report No. 15-701, web page http://www.sao.state.tx.us/reports/main/15-701.pdf, last accessed 4/21/16. 380 Includes return-to-work retirees. HHSAS Database, as of 8/31/15.

Schedule F.1: HHS System Workforce Plan
F.1-77
DEVELOPMENT STRATEGIES TO MEET WORKFORCE NEEDS
Recruitment Strategies
General Strategies Increase attendance at job fairs, college fairs, and military installation recruiting
events. Develop or enhance partnerships with entities such as, but not limited to, social
service agencies, workforce centers, veteran networks, high schools, PAL programs and colleges or universities
Market positions that qualify for participation in the federal Public Service Loan Forgiveness (PSLF) Program, which allows qualifying full-time employees to have the remaining balance of their Direct Loans forgiven after making 120 qualifying monthly payments.
Promote the benefits of state employment, including job stability, insurance, career advancement ladder and opportunities, and the retirement pension plan.
Develop LinkedIn pages promoting HHS as an employer of choice; Create HHS Jobs pages for passive recruitment; Develop active recruitment strategies for candidate sourcing via social media
professional networks.
State Supported Living Center Strategies Continue to advertise employment opportunities using a variety of media
sources, including print advertising in local and regional newspapers, billboards, and local radio and television commercials.
Continue to post jobs on various employment and professional websites. Continue to use banners and billboard-style signage near the entrance of the
facilities to advertise available positions. Continue to use of direct mail to increase awareness of job opportunities. Continue to participate in major job fairs. Continue to host on-campus job fairs for direct support professionals, nurses,
and support positions such as Food Service, Housekeeping, and Maintenance, and management specialist/recruiter supports the facilities when requested by sending additional recruitment materials.
Continue to attend career fairs targeting veterans in an effort to recruit the growing number of veterans leaving military service and seeking employment in other governmental entities.
Continue to submit salary exception requests for approval of salary offers greater than the HHS allowable amount.
Continue to adjust nurse salaries in Regions 6, 7 and 11 to be more competitive with the private sector.

Schedule F.1: HHS System Workforce Plan
F.1-78
Continue to posting positions in multiple cities when possible and moved positions around to the different regions in an effort to recruit viable nurse applicants.
Continue to inform nurse applicants of available incentives such as teleworking from home or offering compressed or flex schedules.
Implement a nursing plan that provides promotional opportunities for nurses that want to remain in direct contact roles in addition to those seeking management opportunities.
Hire J-1 Visa Waiver applicants. The J-1 Visa Waiver allows a foreign student who is subject to the two-year foreign residence requirement to remain in the U.S. upon completion of degree requirements/residency program, if they find an employer to sponsor them. The J-1 Visa Waiver applies to specialty occupations in which there is a shortage. The J-1 Waiver could be used to recruit physicians, pharmacists, psychiatrists, dentists, psychologists, nurse practitioners, physician assistants, registered therapists, and others for a minimum of three years.
Request salary increases for physicians, nurse practitioners, and psychiatrists.
State Hospital and Public Health Strategies Continue using social work, nursing, medical student, psychiatric resident and
other medical professional student/intern rotations at state hospitals, central office, and within Health Service Regions.
Continue using internet-based job postings, billboards, job fairs, professional newsletters, list serves and recruitment firms.
Continue posting difficult-to-recruit positions in professional publications. Continue regular and ongoing dialogues and presence with baccalaureate and
advanced nursing program educators in Texas schools and respective universities in the state and surrounding areas;
Solidify a “pipeline” o from academia to HHS for students to learn about the work of the System
and gain experience, skills and qualifications through internships. o through ongoing public health nursing internships between nursing
schools and HHS for students to learn about the work, and gain experience, skills and qualifications through practical experience.
Work with nurse practitioner educational programs to develop, fund and promote specialty psychiatric nurse practitioner tracks with rotations in state hospitals.
Offer incentives and educational leave to encourage System non-licensed staff in state hospitals and Health Service Regions to train to become RNs or other critical shortage staff.
Review current sanitarian salaries from local health departments, industry and the federal government and make necessary salary adjustments.
Enhance capacity to recruit bilingual workers. Provide additional workforce support and expertise in area of recruitment to work
units.

Schedule F.1: HHS System Workforce Plan
F.1-79
Consider the use of recruitment bonuses and moving allowances for highly competitive job categories, such as psychiatrists, pharmacists and other “shortage” clinical professionals.
Fund stipends for Psychiatrists-in-Training at state hospitals. Request exception to HHS rules governing the hiring of licensed psychological
personnel to include license-eligible applicants, with agreement that full licensing will be obtained within a certain time frame.
Other Targeted Strategies Department of Family and Protective Services (DFPS) Protective Service Worker
Strategies: o Continue providing an internet resource. By clicking on the "Jobs" link
from https://www.dfps.state.tx.us/, users are taken to the "Come Work for Us" page that includes realistic job preview videos for Adult Protective Services (APS), Child Care Licensing (CCL), Residential Licensing Services (RCCL) Specialists, and Child Protective Services (CPS) positions, as well as written realistic job previews for all of the programs. CPS also has a self-screening test that asks applicants questions to help them decide which stage of service might be a better fit for them prior to applying.
o Continue using a pre-screening test for job applicants to assess skills and performance capabilities. DFPS implemented a new hiring process in March 2015 to focus screening efforts around identifying the best attributes needed to be successful as a direct delivery caseworker. The HSI is founded on research contained within A Research-Based Child Welfare Employee Selection Protocol6, and requires applicants to respond to a series of behavioral and skill assessment questions assessing risk in the following areas with a rating of Not A Strength (NAS), Adequate (ADQ), or Strong (STR): Attendance / Turnover Risk Conscientiousness Demonstrates Respect Self-Management Service Orientation Analytical Skills Reading Comprehension DFPS Math and Reasoning
After evaluating applications and HSI responses, the TAG Hiring Specialist and Program Supervisors collaborate to select which applicants they wish to interview and hire.

Schedule F.1: HHS System Workforce Plan
F.1-80
To refine the new HSI model further, Workforce Development and The National Association of Social Workers - Texas (NASWTX) are working in partnership on the development of an external stakeholder survey focused on clients' perspectives of what makes a great caseworker. This survey will focus on case outcomes and ask those who received services from DFPS what caseworker behaviors or characteristics made their experience great. If proven successful, the long-term goal for this project would be to take a similar approach to all DFPS Program services, informing agency hiring practices across the spectrum of DFPS services.
o Continue efforts to recruit bilingual workers by using consistent testing for bilingual skills and implementing a consistent policy for bilingual pay.
o Allow for the substitution of CPS related experience in lieu of education for CPS services statewide
o Provide an increased starting salary (6.8 percent or 3.4 percent) to social work graduates hired into APS, CPS and State Wide Intake (SWI).
o Improve the recruitment of students in the Title IV-E Child Welfare Training Program, which will increase organizational loyalty among its graduates
o Explore the feasibility of hiring individuals with two-year degrees for qualifying protective services worker positions, along with creating a career path for those individuals for achieving long-term service with HHS.
o Initiate a 2-year degreed CPS caseworker pilot for hiring internal candidates with qualifying job experience (e.g., Human Services and Administrative Technicians).
o Expand statewide for all CPS stages of service the substitution of experience in lieu of education.
o Increase the marketing of the unique values associated with "Protecting the Unprotected."
o Provide the following focused recruitment activities for jobs with low applicant pools and high vacancy rates: Offer 6.8 percent above base salary. Provide locality pay in some areas of the state. Provide recruitment bonuses to certain staff. As funding allows, deploy recruiters in key areas of the state to
build relationships and source potential applicants. Attend job fairs and organize hiring fairs in specific areas to
interview many staff in one or two days. Partner with DFPS media specialists to produce special interest
stories about jobs. Add training sessions to accommodate all new hires. Increase hiring specialist resources for targeted areas, when
necessary.

Schedule F.1: HHS System Workforce Plan
F.1-81
Work with contracted partners to expedite certain hiring activities.
Claims Examiners o Work with institutions of higher education in the Austin area to share
Social Security Administration's (SSA’s) training curriculum for Claims Examiners and explore interest with Department Heads and Professors for adding some of the SSA training concepts into their curriculum.
Sanitarians o Continue facilitating the use of a “Sanitarian-In-Training” model, whereby
individuals with appropriate education and experience but who lack the required license may be hired at a lower pay group in a related classification (as Environmental Protection Specialist Is) and provided the opportunity to obtain their license and supplement their field experience.
Retention Strategies
General Strategies Explore opportunities for flexible work schedules, telework, mobile work and
alternative officing. Develop a management forum and other tools to assist individuals with the
technical skills transition and be successful in positions that require both technical and management skills.
Continue promoting succession planning/career development through HHS programs, such as the HHS Leadership Development Program.
State Supported Living Center Strategies Continue paying licensure fees and required training and continuing education
costs for employees whose position require them to maintain professional licensure.
SSLC Division has added a Licensed Vocational Nurse IV to the available positions. This provides ability to retain LVN’s as their experience increases and also to offer higher salaries for more experienced applicants.
State Hospital and Public Health Strategies Continue involvement in HHS System-wide efforts to address health and human
services workforce issues, including retention of staff filling essential positions and participation in leadership development opportunities.
Continue to provide adequate training to assist employees in preparedness of their jobs and expand opportunities for cross-training.

Schedule F.1: HHS System Workforce Plan
F.1-82
Continue to provide formally approved continuing education for various licensed healthcare professionals that meet requirements for credentialing and evaluate options for paying for these continuing education programs.
Continue adjusting and approving Nursing Compensation plans every two years. Develop a methodology for performance-based merits. Improve the work environment through the provision of adequate technological
tools, streamlined business processes and additional supervisory training. Provide additional workforce support and expertise in the area of retention to
work units. Consider opportunities to mentor professional staff. Recognize and reward employees who make significant contributions. Increase System commitment to and effectiveness of retaining a racially and
ethnically diverse workforce. Implement continuous business improvement processes.
Other Targeted Strategies Department of Family and Protective Services (DFPS) Protective Service Worker
Strategies: o Partner with stakeholders to conduct a multi-phased benefits (i.e., salary)
study that evaluates the System's competitiveness and pay strategies within the existing industry market.
o Use applicable literature reviews, successful private sector initiatives, and internal statewide agency best practices to implement new or revise existing onboarding strategies.
o Administer surveys and use the data to improve existing practices and guide the development of new initiatives targeted to improve employee experiences.
o Use applicable literature reviews, successful private sector initiatives, and identified statewide agency best practices to implement new and revise existing strategies integrating employees into their units.
o Promote existing career enhancement/advancement ladders. o Create virtual town halls to provide an economical, sustainable, and
scalable way for statewide employees to interact with System executive staff on a more frequent basis.
o Develop and implement an employee recognition program beyond existing Stars and eRewards programs by soliciting feedback from workers, supervisors, and directors on current best practices and then compare findings to private sector best practices.
o Evaluate the effectiveness and scope of DFPS locality pay381 by: 381 The General Appropriations Act, Article II, authorizes HHS agencies to provide additional compensation to current and newly hired employees whose duty station is located in an area of the state in which the high cost of living is causing excessive employee turnover. This additional pay may not exceed $1,200 per month and is proportional to the hours worked during the month.

Schedule F.1: HHS System Workforce Plan
F.1-83
working with stakeholders and university partners to conduct a cost of living comparison for all counties in the State of Texas,
conducting a housing cost analysis for individuals in Region 9 to evaluate the impact of the stipend and determine if stipend amounts should be adjusted; and
reporting the results of such assessments by December 2016, as required by H.B. 1, Rider 41, of the 84th Legislature, Regular Session, 2015.
o Beginning December 1, 2015, overtime (OT) payment thresholds were reduced from 240 to 140 hours. Furthermore, after December 1, the OT payment process was automated so that employees with approved OT hours exceeding 140 are automatically paid down the following month, no longer require managers to authorize payment. OT payment trends are a concern within Workforce Development, due to the short-and long-term effects on agency employee retention and turnover rates. Workforce Development plans to accomplish the following during fiscal year 2016:
o Explore possibilities for changing when employees are paid out for OT when moving from non-exempt to exempt positions
o Measure existing financial incentives for effectiveness in fiscal years 2016-17 include longevity pay, mentoring stipend, travel reimbursements, regular and one-time merits, CPS performance bonus, investigative stipend, Title IV-E stipend, college degree pay, on-call pay, and high-risk pay.
Eligibility Staff: o Continue the Business Process Redesign initiative to streamline functions
performed by eligibility staff, creating capacity to help manage workloads as caseloads increase in relation to the anticipated population growth in Texas.
o Exploring the development of additional career tracks for clerical and eligibility staff to promote career advancement and reduce turnover.
o Exploring the development of a mentoring program to provide structured support to eligibility staff completing training.
o Utilizing telework across some business units and exploring expansion to others.
Epidemiologists: o Consider defining a non-manager career ladder beyond Epidemiologist III
for continued growth.
Claims Examiners: o Review current functional job descriptions of Claims Examiners to
determine if the period of time currently in place for promotions to the next

Schedule F.1: HHS System Workforce Plan
F.1-84
level could be reduced to allow for these employees, once trained, to work complicated cases sooner.
o Explore the possibility of having an additional Claims Examiner classification created to be more in line and competitive with their peers in other states and federal components who do the same work.