Scene Graph Generation by Iterative Message Passing · Scene Graph Generation by Iterative Message...
10
Scene Graph Generation by Iterative Message Passing Danfei Xu 1 Yuke Zhu 1 Christopher B. Choy 2 Li Fei-Fei 1 1 Department of Computer Science, Stanford University 2 Department of Electrical Engineering, Stanford University {danfei, yukez, chrischoy, feifeili}@cs.stanford.edu Abstract Understanding a visual scene goes beyond recognizing individual objects in isolation. Relationships between ob- jects also constitute rich semantic information about the scene. In this work, we explicitly model the objects and their relationships using scene graphs, a visually-grounded graphical structure of an image. We propose a novel end- to-end model that generates such structured scene repre- sentation from an input image. The model solves the scene graph inference problem using standard RNNs and learns to iteratively improves its predictions via message passing. Our joint inference model can take advantage of contex- tual cues to make better predictions on objects and their relationships. The experiments show that our model signif- icantly outperforms previous methods for generating scene graphs using Visual Genome dataset and inferring support relations with NYU Depth v2 dataset. 1. Introduction Today’s state-of-the-art perceptual models [15, 32] have mostly tackled detecting and recognizing individual objects in isolation. However, understanding a visual scene often goes beyond recognizing individual objects. Take a look at the two images in Fig. 1. Even a perfect object detec- tor would struggle to perceive the subtle difference between a man feeding a horse and a man standing by a horse. The rich semantic relationships between these objects have been largely untapped by these models. As indicated by a series of previous works [26, 34, 41], one crucial step towards a deeper understanding of visual scenes is building a struc- tured representation that captures objects and their semantic relationships. Such representation not only offers contex- tual cues for fundamental recognition tasks [27, 29, 38, 39] but also provide values in a larger variety of high-level vi- sual tasks [18, 44, 40]. The recent success of deep learning-based recognition models [15, 21, 36] has surged interest in examining the de- tailed structures of a visual scene, especially in the form of man horse object detection scene graph generation horse bucket eat from holding feeding man wearing glasses ... Figure 1. Object detectors perceive a scene by attending to indi- vidual objects. As a result, even a perfect detector would produce similar outputs on two semantically distinct images (first row). We propose a scene graph generation model that takes an image as in- put, and generates a visually-grounded scene graph (second row, right) that captures the objects in the image (blue nodes) and their pairwise relationships (red nodes). object relationships [5, 20, 26, 33]. Scene graph, proposed by Johnson et al. [18], offers a platform to explicitly model objects and their relationships. In short, a scene graph is a visually-grounded graph over the object instances in an image, where the edges depict their pairwise relationships (see example in Fig. 1). The value of scene graph represen- tation has been proven in a wide range of visual tasks, such as semantic image retrieval [18], 3D scene synthesis [4], and visual question answering [37]. Anderson et al. re- cently proposed SPICE [1] as an enhanced automated cap- tion evaluation metric defined over scene graphs. However, these models that use scene graphs either rely on ground- truth annotations [18], synthetic images [37], or extract a scene graph from text domain [1, 4]. To truly take advan- tage of such rich structure, it is crucial to devise a model that automatically generates scene graphs from images. In this work, we address the problem of scene graph gen- eration, where the goal is to generate a visually-grounded scene graph from an image. In a generated scene graph, an object instance is characterized by a bounding box with an object category label, and a relationship is characterized by a directed edge between two bounding boxes (i.e., ob- 1 arXiv:1701.02426v2 [cs.CV] 12 Apr 2017
Transcript of Scene Graph Generation by Iterative Message Passing · Scene Graph Generation by Iterative Message...

Scene Graph Generation by Iterative Message Passing
Danfei Xu1 Yuke Zhu1 Christopher B. Choy2 Li Fei-Fei1
1Department of Computer Science, Stanford University2Department of Electrical Engineering, Stanford University{danfei, yukez, chrischoy, feifeili}@cs.stanford.edu
Abstract
Understanding a visual scene goes beyond recognizingindividual objects in isolation. Relationships between ob-jects also constitute rich semantic information about thescene. In this work, we explicitly model the objects andtheir relationships using scene graphs, a visually-groundedgraphical structure of an image. We propose a novel end-to-end model that generates such structured scene repre-sentation from an input image. The model solves the scenegraph inference problem using standard RNNs and learnsto iteratively improves its predictions via message passing.Our joint inference model can take advantage of contex-tual cues to make better predictions on objects and theirrelationships. The experiments show that our model signif-icantly outperforms previous methods for generating scenegraphs using Visual Genome dataset and inferring supportrelations with NYU Depth v2 dataset.
1. IntroductionToday’s state-of-the-art perceptual models [15, 32] have
mostly tackled detecting and recognizing individual objectsin isolation. However, understanding a visual scene oftengoes beyond recognizing individual objects. Take a lookat the two images in Fig. 1. Even a perfect object detec-tor would struggle to perceive the subtle difference betweena man feeding a horse and a man standing by a horse. Therich semantic relationships between these objects have beenlargely untapped by these models. As indicated by a seriesof previous works [26, 34, 41], one crucial step towards adeeper understanding of visual scenes is building a struc-tured representation that captures objects and their semanticrelationships. Such representation not only offers contex-tual cues for fundamental recognition tasks [27, 29, 38, 39]but also provide values in a larger variety of high-level vi-sual tasks [18, 44, 40].
The recent success of deep learning-based recognitionmodels [15, 21, 36] has surged interest in examining the de-tailed structures of a visual scene, especially in the form of
man horse
obje
ct
dete
ctio
nsc
ene
grap
hge
nera
tion horse
bucket
eat fromholding
feedingman
wearing glasses...
Figure 1. Object detectors perceive a scene by attending to indi-vidual objects. As a result, even a perfect detector would producesimilar outputs on two semantically distinct images (first row). Wepropose a scene graph generation model that takes an image as in-put, and generates a visually-grounded scene graph (second row,right) that captures the objects in the image (blue nodes) and theirpairwise relationships (red nodes).
object relationships [5, 20, 26, 33]. Scene graph, proposedby Johnson et al. [18], offers a platform to explicitly modelobjects and their relationships. In short, a scene graph isa visually-grounded graph over the object instances in animage, where the edges depict their pairwise relationships(see example in Fig. 1). The value of scene graph represen-tation has been proven in a wide range of visual tasks, suchas semantic image retrieval [18], 3D scene synthesis [4],and visual question answering [37]. Anderson et al. re-cently proposed SPICE [1] as an enhanced automated cap-tion evaluation metric defined over scene graphs. However,these models that use scene graphs either rely on ground-truth annotations [18], synthetic images [37], or extract ascene graph from text domain [1, 4]. To truly take advan-tage of such rich structure, it is crucial to devise a modelthat automatically generates scene graphs from images.
In this work, we address the problem of scene graph gen-eration, where the goal is to generate a visually-groundedscene graph from an image. In a generated scene graph,an object instance is characterized by a bounding box withan object category label, and a relationship is characterizedby a directed edge between two bounding boxes (i.e., ob-
1
arX
iv:1
701.
0242
6v2
[cs
.CV
] 1
2 A
pr 2
017
ject and subject) with a relationship predicate (red nodes inFig. 1). The major challenge of generating scene graphsis reasoning about relationships. Much effort has been ex-pended on localizing and recognizing semantic relation-ships in images [6, 8, 26, 34, 39]. Most methods havefocused on making local predictions of object relation-ships [26, 34], which essentially simplify the scene graphgeneration problem into independently predicting relation-ships between pairs of objects. However, by doing lo-cal predictions these models ignore surrounding context,whereas joint reasoning with contextual information can of-ten resolve ambiguity due to local predictions in isolation.
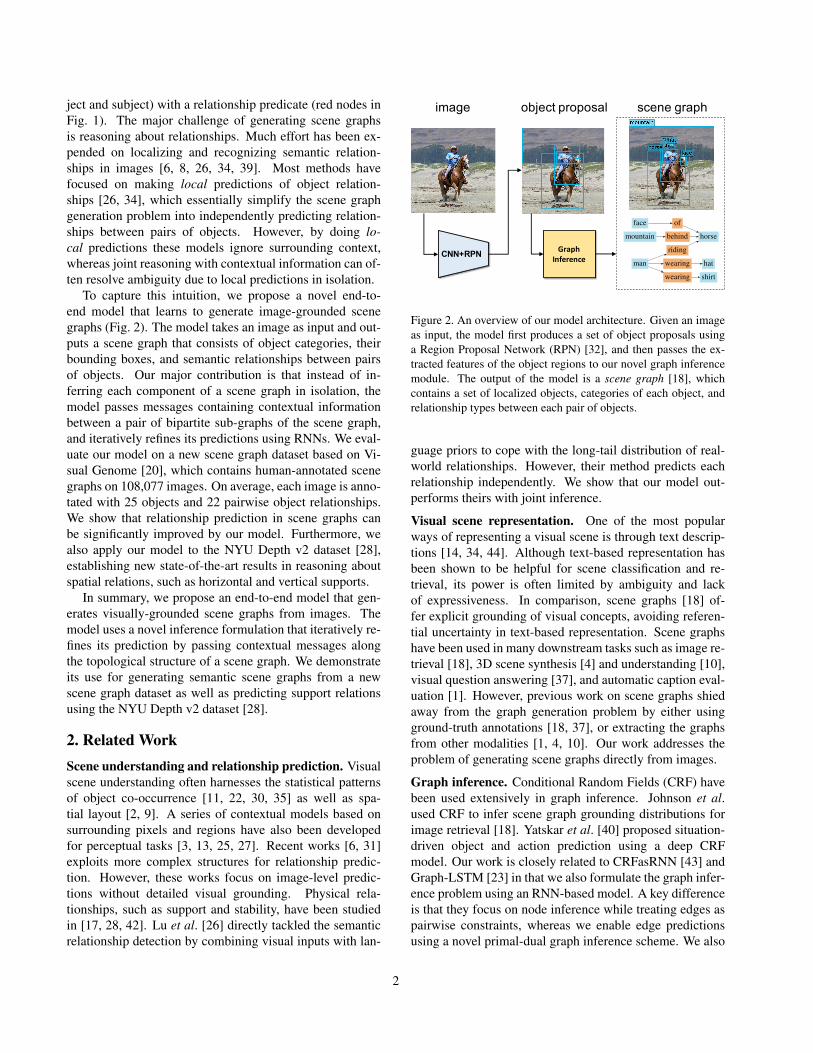
To capture this intuition, we propose a novel end-to-end model that learns to generate image-grounded scenegraphs (Fig. 2). The model takes an image as input and out-puts a scene graph that consists of object categories, theirbounding boxes, and semantic relationships between pairsof objects. Our major contribution is that instead of in-ferring each component of a scene graph in isolation, themodel passes messages containing contextual informationbetween a pair of bipartite sub-graphs of the scene graph,and iteratively refines its predictions using RNNs. We eval-uate our model on a new scene graph dataset based on Vi-sual Genome [20], which contains human-annotated scenegraphs on 108,077 images. On average, each image is anno-tated with 25 objects and 22 pairwise object relationships.We show that relationship prediction in scene graphs canbe significantly improved by our model. Furthermore, wealso apply our model to the NYU Depth v2 dataset [28],establishing new state-of-the-art results in reasoning aboutspatial relations, such as horizontal and vertical supports.
In summary, we propose an end-to-end model that gen-erates visually-grounded scene graphs from images. Themodel uses a novel inference formulation that iteratively re-fines its prediction by passing contextual messages alongthe topological structure of a scene graph. We demonstrateits use for generating semantic scene graphs from a newscene graph dataset as well as predicting support relationsusing the NYU Depth v2 dataset [28].
2. Related WorkScene understanding and relationship prediction. Visualscene understanding often harnesses the statistical patternsof object co-occurrence [11, 22, 30, 35] as well as spa-tial layout [2, 9]. A series of contextual models based onsurrounding pixels and regions have also been developedfor perceptual tasks [3, 13, 25, 27]. Recent works [6, 31]exploits more complex structures for relationship predic-tion. However, these works focus on image-level predic-tions without detailed visual grounding. Physical rela-tionships, such as support and stability, have been studiedin [17, 28, 42]. Lu et al. [26] directly tackled the semanticrelationship detection by combining visual inputs with lan-
CNN+RPN GraphInference
object proposalimage scene graph
horse
face of
man
riding
wearing
wearing
hat
shirt
mountain behind
Figure 2. An overview of our model architecture. Given an imageas input, the model first produces a set of object proposals usinga Region Proposal Network (RPN) [32], and then passes the ex-tracted features of the object regions to our novel graph inferencemodule. The output of the model is a scene graph [18], whichcontains a set of localized objects, categories of each object, andrelationship types between each pair of objects.
guage priors to cope with the long-tail distribution of real-world relationships. However, their method predicts eachrelationship independently. We show that our model out-performs theirs with joint inference.
Visual scene representation. One of the most popularways of representing a visual scene is through text descrip-tions [14, 34, 44]. Although text-based representation hasbeen shown to be helpful for scene classification and re-trieval, its power is often limited by ambiguity and lackof expressiveness. In comparison, scene graphs [18] of-fer explicit grounding of visual concepts, avoiding referen-tial uncertainty in text-based representation. Scene graphshave been used in many downstream tasks such as image re-trieval [18], 3D scene synthesis [4] and understanding [10],visual question answering [37], and automatic caption eval-uation [1]. However, previous work on scene graphs shiedaway from the graph generation problem by either usingground-truth annotations [18, 37], or extracting the graphsfrom other modalities [1, 4, 10]. Our work addresses theproblem of generating scene graphs directly from images.
Graph inference. Conditional Random Fields (CRF) havebeen used extensively in graph inference. Johnson et al.used CRF to infer scene graph grounding distributions forimage retrieval [18]. Yatskar et al. [40] proposed situation-driven object and action prediction using a deep CRFmodel. Our work is closely related to CRFasRNN [43] andGraph-LSTM [23] in that we also formulate the graph infer-ence problem using an RNN-based model. A key differenceis that they focus on node inference while treating edges aspairwise constraints, whereas we enable edge predictionsusing a novel primal-dual graph inference scheme. We also
2
share the same spirit as Structural RNN [16]. A crucialdistinction is that our model iteratively refines its predic-tions through message passing, whereas the Structural RNNmodel only makes one-time predictions along the temporaldimension, and thus cannot refine its past predictions.
3. Scene Graph GenerationA scene graph, as defined by Johnson et al. [18], is a
structured representation of an image, where nodes in ascene graph correspond to object bounding boxes with theirobject categories, and edges correspond to their pairwise re-lationships between objects. The task of scene graph gen-eration is to generate a visually-grounded scene graph thatmost accurately correlates with an image. Intuitively, indi-vidual predictions of objects and relationships can benefitfrom their surrounding context. For instance, knowing “ahorse is on grass field” is likely to increase the chance ofdetecting a person and predicting the relationship of “manriding horse”. To capture this intuition, we propose a jointinference framework to enable contextual information topropagate through the scene graph topology via a messagepassing scheme.
Inference on a densely connected graph can be very ex-pensive. As shown in previous work [19] and [43], densegraph inference can be approximated by mean field in Con-ditional Random Fields (CRF). Our approach is inspired byZheng et al. [43], which designs fully differentiable lay-ers to enable end-to-end learning with recurrent neural net-works (RNN). Yet their model relies on purpose-built RNNlayers. To achieve greater flexibility in a more principledtraining framework, we use a generic RNN unit instead, inparticular a Gated Recurrent Unit (GRU) [7]. At each iter-ation, each GRU takes its previous hidden state and an in-coming message as input, and produces a new hidden stateas output. Each node and edge in the scene graph main-tains its internal state in its corresponding GRU unit, whereall nodes share the same GRU weights (node GRUs), andall edges share the other set of GRU weights (edge GRUs).This setup allows the model to pass messages (i.e., aggre-gation of GRU hidden states) among the GRU units alongthe scene graph topology. We also propose a message pool-ing function that learns to dynamically aggregate the hiddenstates of the GRUs into messages.
We further observe that the unique structure of scenegraphs forms a bipartite structure of message passing chan-nels. Since messages only pass along the topological struc-ture of a scene graph, the set of edge GRUs and the set ofnode GRUs form a bipartite graph, where no message ispassed inside each set. Inspired by this observation, weformulate two disjoint sub-graphs that are essentially thedual graph to each other. The primal graph defines chan-nels for messages to pass from edge GRUs to node GRUs.The dual graph defines channels for messages to pass from
node GRUs to edge GRUs. With such primal-dual formu-lation, we can therefore improve inference efficiency byiteratively passing messages between these sub-graphs in-stead of through a densely connected graph. Fig. 3 gives anoverview of our model.
3.1. Problem Formulation
We first lay out the mathematical formulation of ourscene graph generation problem. To generate a visuallygrounded scene graph, we need to obtain an initial set ofobject bounding boxes. These bounding boxes can be ei-ther from ground-truth human annotation or algorithmicallygenerated. In practice, we use the Region Proposal Network(RPN) [32] to automatically generate a set of object bound-ing box proposals BI from an image I as the base input tothe inference procedure (Fig. 3(a)).
For each object box proposal, we need to infer two typesof object-centric variables: 1) an object class label, and 2)four bounding box offsets relative to the proposal box co-ordinates, which are used for refining the proposal boxes.In addition, we need to infer a relationship-centric variablebetween every pair of proposal boxes, which denotes thepredicate type of the relationship between the correspond-ing object pair. Given a set of object classes C (includingbackground) and a set of relationship types R (includingnone relationship), we denote the set of all variables to bex = {xclsi , xbboxi , xi→j |i = 1 . . . n, j = 1 . . . n, i 6= j},where n is the number of proposal boxes, xclsi ∈ C is theclass label of the i-th proposal box, xbboxi ∈ R4 is thebounding box offsets relative to the i-th proposal box coor-dinates, and xi→j ∈ R is the relationship predicate betweenthe i-th and the j-th proposal boxes.
At the high level, the inference task is to classify objects,predict their bounding box offsets, and classify relationshippredicates between each pair of objects. Formally, we for-mulate the scene graph generation problem as finding theoptimal x∗ = argmaxx Pr(x|I,BI) that maximizes thefollowing probability function given the image I and boxproposals BI :
Pr(x|I,BI) =∏i∈V
∏j 6=i
Pr(xclsi , xbboxi , xi→j |I,BI). (1)
In the next subsection, we introduce a way to approx-imate the inference procedure using an iterative messagepassing scheme modeled with Gated Recurrent Units [7].
3.2. Inference using Recurrent Neural Network
We use mean field to perform approximate inference. Wedenote the probability of each variable x as Q(x|·), and as-sume that the probability only depends on the current stateof each node and edge at each iteration. In contrast toZheng et al. [43], we use a generic RNN module to compute
3

edge GRU
node GRU
primalgraph
edgefeature
nodefeature
nodestate
outboundedge states
inboundedge states
dualgraph
edgestate
subjectstate
objectstate
edge GRU
node GRU
nodemessage
edgemessage
node message pooling
messagepassing
edge GRU
node GRU
node messagepooling
edge message pooling
messagepassing
edge message pooling
edge GRU
node GRU
...
T = 0 T = 1 T = 2 T = N
horse
face of
man
riding
wearing
wearing
hat
shirt
mountain behind
object proposal
scene graph
(a) (b) (c) (d)
Figure 3. An illustration of our model architecture (Sec. 3). The model first extracts visual features of nodes and edges from a set of objectproposals, and edge GRUs and node GRUs then take the visual features as initial input and produce a set of hidden states (a). Then a nodemessage pooling function computes messages that are passed to the node GRU in the next iteration from the hidden states. Similarly, anedge message pooling function computes messages and feed to the edge GRU (b). The ⊕ symbol denotes a learnt weighted sum. Themodel iteratively updates the hidden states of the GRUs (c). At the last iteration step, the hidden states of the GRUs are used to predictobject categories, bounding box offsets, and relationship types (d).
the hidden states. In particular, we choose Gated RecurrentUnits [7] due to its simplicity and effectiveness. We use thehidden state of the corresponding GRU, a high-dimensionalvector, to represent the current state of each node and eachedge. As all the nodes (edges) share the same update rule,we share the same set of parameters among all the nodeGRUs, and the other set of parameters among all the edgeGRUs (Fig. 3). We denote the current hidden state of nodei as hi and the current hidden state of edge i → j as hi→j .Then the mean field distribution can be formulated as
Q(x|I,BI) =
n∏i=1
Q(xclsi , xbboxi |hi)Q(hi|fvi )∏j 6=i
Q(xi→j |hi→j)Q(hi→j |fei→j)(2)
where fvi is the visual feature of the i-th node, and fei→j
is the visual feature of the edge from the i-th node to thej-th node. In the first iteration, the GRU units take the vi-sual features fv and fe as input (Fig. 3(a)). We use thevisual feature of the proposal box as the visual feature fvifor the i-th node. We use the visual feature of the union boxover the proposal boxes bi, bj as the visual feature fei→j foredge i ∈ j. These visual features are extracted by an ROI-pooling layer [12] from the image. In later iterations, theinputs are the aggregated messages from other GRU unitsof the previous step. We talk about how the messages areaggregated and passed in the next subsection.
3.3. Primal Dual Update and Message Pooling
Sec. 3.2 offers a generic formulation for solving graphinference problem using RNNs. However, we observe that
we can further improve the inference efficiency by leverag-ing the unique bipartite structure of a scene graph. In thescene graph topology, the neighbors of the edge GRUs arenode GRUs, and vice versa. Passing messages along thisstructure forms two disjoint sub-graphs that are the dualgraph to each other. Specifically, we have a node-centricprimal graph, in which each node GRU gets messages fromits inbound and outbound edge GRUs. In the edge-centricdual graph, each edge GRU gets messages from its sub-ject node GRU and object node GRU (Fig. 3(b)). We cantherefore improve inference efficiency by iteratively passingmessages between these two sub-graphs instead of througha densely connected graph (Fig. 3(c)).
As each GRU receives multiple incoming messages, weneed an aggregation function that can fuse information fromall messages into a meaningful representation. A naıve ap-proach would be standard pooling methods such as average-or max-pooling. However, we found that it is more effectiveto learn adaptive weights that can modulate the influences ofincoming messages and only keep the relevant information.We introduce a message pooling function that computes theweight factors for each incoming message and fuse the mes-sages using a weighted sum. We provide an empirical anal-ysis of different message pooling functions in Sec. 4.
Formally, given the current GRU hidden states of nodesand edges hi and hi→j , we denote the messages to updatethe i-th node as mi, which is computed by a function of itsown hidden state hi, and the hidden states of its outboundedge GRUs hi→j and inbound edge GRUs hj→i. Similarly,we denote the message to update the edge from the i-th nodeto the j-th node as mi→j , which is computed by a functionof its own hidden state hi→j , the hidden states of its subject
4

node GRU hi and its object node GRU hj . To be morespecific, mi and mi→j are computed by the following twoadaptively weighted message pooling functions:
mi =∑j:i→j
σ(vT1 [hi, hi→j ])hi→j +
∑j:j→i
σ(vT2 [hi, hj→i])hj→i
(3)
mi→j = σ(wT1 [hi, hi→j ])hi + σ(wT
2 [hj , hi→j ])hj (4)
where [·] denotes a concatenation of vectors, and σ denotesa sigmoid function. w1, w2 and v1, v2 are learnable param-eters. These two equations describe the primal-dual updaterules, as shown in (b) of Fig. 3.
3.4. Implementation Details
Our final output layers follow closely with the faster R-CNN setup [32]. We use a softmax layer to produce the finalscores for the object class as well as relationship predicate.We use a fully-connected layer to regress to the boundingbox offsets for each object class separately. We use the crossentropy loss for the object class and the relationship predi-cate. We use `1 loss for the bounding box offsets.
We use an MS COCO-pretrained VGG-16 network to ex-tract visual features from images. We freeze the weights ofall convolution layers, and only finetune the fully connectedlayers, including the GRUs. The node GRUs and the edgeGRUs have both 512-dimensional input and output. Dur-ing training, we first use NMS to select at most 2,000 boxesfrom all proposed boxes BI , and then randomly select 128boxes as the object proposals. Due to the quadratic numberof edges and sparsity of the annotations, we first sample alledges that have labels. If an image has less than 128 labelededges, we fill the rest with unlabeled edges. At test time,we use NMS to select at most 50 boxes from the object pro-posals with an IoU threshold of 0.3. We make predictionson all edges except the self-connections at the test time.
4. Experiments
We evaluate our method for generating scene graphsfrom images. We compare our model against a recentlyproposed model on visual relationship prediction [26]. Ourgoal is to analyze our model in datasets with both sparse anddense relationship annotations. We use a new scene graphdataset based on the VisualGenome dataset [20] in our mainexperiment. We also evaluate our model on the support re-lation inference task in the NYU Depth v2 dataset. The keydifference between these two datasets is that scene graphannotation is very sparse: among all possible pairing ofobjects, only 1.6% of them are labeled with a relationshippredicate. The NYU Depth v2 dataset, on the other hand,exhaustively annotates the support of every labeled object.
Our experiments show that our model outperforms the base-line model [26], and can generalize to other types of rela-tionships, in particular support relations [28], without anyarchitecture change.
Visual Genome We introduce a new scene graph datasetbased on the Visual Genome dataset [20]. The original VGscene graph dataset contains 108,077 images with an aver-age of 38 objects and 22 relationships per image. However,a substantial fraction of the object annotations have poor-quality and overlapping bounding boxes and/or ambiguousobject names. We manually cleaned up per-box annota-tions. On average, this annotation refinement process cor-rected 22 bounding boxes and/or names, deleted 7.4 boxes,and merged 5.4 duplicate bounding boxes per image. Thenew dataset contains an average of 25 distinct objects and22 relationships per image. In this experiment, we use themost frequent 150 object categories and 50 predicates forevaluation. As a result, each image has a scene graph ofaround 11.5 objects and 6.2 relationships. We use 70% ofthe images for training and the remaining 30% for testing.
NYU Depth V2 We also evaluate our model on the supportrelation graphs from the NYU Depth v2 dataset [28]. Thedataset contains 1,449 RGB-D images captured in 27 indoorscenes. Each image is annotated with instance segmenta-tion, region class labels, and support relations between re-gions. We use the standard split, with 795 images used fortraining and 654 images for testing.
4.1. Semantic Scene Graph Generation
Setup Given an image, the scene graph generation taskis to localize a set of objects, classify their category labels,and predict relationships between each pair of the objects.We evaluate our model on the new scene graph dataset. Weanalyze our model in three setups below.
1. The predicate classification (PREDCLS) task is topredict the predicates of all pairwise relationships ofa set of localized objects. This task examines themodel’s performance on predicate classification in iso-lation from other factors.
2. The scene graph classification (SGCLS) task is topredict the predicate as well as the object categoriesof the subject and the object in every pairwise relation-ship given a set of localized objects.
3. The scene graph generation (SGGEN) task is to si-multaneously detect a set of objects and predict thepredicate between each pair of the detected objects.An object is considered to be correctly detected if ithas at least 0.5 IoU overlap with the ground-truth box.
We adopted the image-wise recall evaluation metrics,R@50 and R@100, that are used in Lu et al. [26] for
5

0 1 2 3
number of iterations
0.30
0.35
0.40
0.45
0.50
0.55
R @
10
0 baseline
avg. pool
max pool
final model
Figure 4. Predicate classification performance (R@100) using ourmodels with different numbers of training iterations. Note that thebaseline model is equivalent to our model with zero iteration, as itfeeds the node and edge visual features directly to the classifiers.
all the three setups. The R@k metric measures thefraction of ground-truth relationship triplets (subject-predicate-object) that appear among the top k mostconfident triplet predictions in an image. The choice of thismetric is, as explained in [26], due to the sparsity of the rela-tionship annotations in Visual Genome — metrics like mAPwould falsely penalize positive predictions on unlabeled re-lationships. We also report per-type recall@5 of classifyingindividual predicate. This metric measures the fraction ofthe time the correct predicate is among the top 5 most con-fident predictions of each labeled relationship triplet. Asshown in Table 2, many predicates have very similar seman-tic meanings, for example, on vs. over and hangingfrom vs. attached to. The less frequent predicateswould be overshadowed by the more frequent ones duringtraining. We use the recall metric to alleviate such an effect.
4.1.1 Network Models
We evaluate our final model and a number of baseline mod-els. One of the key components in our primal-dual for-mulation is the message pooling functions that use learntweighted sum to aggregate hidden states of nodes and edgesinto messages (see Eq. 3 and Eq. 4). In order to demon-strate its effectiveness, we evaluate variants of our modelwith standard pooling methods. The first is to use average-pooling (avg. pool) instead of the learnt weighted sum toaggregate the hidden states. The second is similar to the firstone, but uses max-pooling (max pool). We also evaluateour models against a relationship detection model proposedby Lu et al. [26]. Their model consists of two components– a vision module that makes predictions from images, anda language module that captures language priors. We com-pare with their vision module, which uses the same inputsas ours; their language module is orthogonal to our model,and can be added independently. Note that this model isequivalent to our final model without any message passing.
Table 1. Evaluation results of the scene graph generation task onthe Visual Genome dataset [20]. We compare a few variations ofour model against a visual relationship detection module proposedby Lu et al. [26] (Sec. 4.1.1).
[26] avg. pool max pool final
PREDCLSR@50 27.88 32.39 34.33 44.75R@100 35.04 39.63 41.99 53.08
SGCLSR@50 11.79 15.65 16.31 21.72R@100 14.11 18.27 18.70 24.38
SGGENR@50 0.32 2.70 3.03 3.44R@100 0.47 3.42 3.71 4.24
Table 2. Predicate classification recall. We compare our finalmodel (trained with two iterations) with Lu et al. [26]. Top 20most frequent types (sorted by frequency) are shown. The evalua-tion metric is recall@5.
predicate [26] ours predicate [26] ourson 99.71 99.25 under 28.64 52.73has 98.03 97.25 sitting on 31.74 50.17in 80.38 88.30 standing on 44.44 61.90of 82.47 96.75 in front of 26.09 59.63
wearing 98.47 98.23 attached to 8.45 29.58near 85.16 96.81 at 54.08 70.41with 31.85 88.10 hanging from 0.00 0.00
above 49.19 79.73 over 9.26 0.00holding 61.50 80.67 for 12.20 31.71behind 79.35 92.32 riding 72.43 89.72
4.1.2 Results
Table 1 shows the performances of our model and the base-lines. The baseline model [26] makes individual predictionson objects and relationships in isolation. The only infor-mation that the predicate classifier takes is a bounding boxcovering the union of the two objects, making it likely toconfuse the subject and the object. We showcase some ofthe errors later in a qualitative analysis. Our final modelwith learnt weighted sum over the connecting hidden statesgreatly outperforms the baseline model (18% gain on pred-icate classification with R@100 metric) and the model vari-ants. This shows that learning to modulate the informationfrom other hidden states enables the network to extract morerelevant information and yields superior performances.
Fig. 4 shows the predicate classification performances ofour models trained with different numbers of iterations. Theperformance of our final model peaks at training with two it-erations, and gradually degrades afterward. We hypothesizethat this is because as the number of iterations increases,noisy messages start to permeate through the graph andhamper the final prediction. The max-pooling and average-pooling models, on the other hand, barely improve after thefirst iteration, showing ineffective message passing due tothese naıve aggregation methods.
Finally, Table 2 shows results of per-type predicate re-
6

Num
. of training iterations (N)
N=1
N=2
N=2
N=0(baseline)
(a) (b) (c)
horseeye riding
man
riding
wearing
wearing
hat
shirt
unknown on
umbrella
holding
unknown wearing man
holding
buildingunknown1 on
glass wearing
head wearing
vase
on in
flower
in
counter
onon
bear
on
horse
face of
man
riding
wearing
wearing
hat
shirt
mountain behind
vase
on in
flower
in
table
inat
bear
on
umbrella
on
snow on
woman
holding
buildingtree behind
glass of
head of
vase
on with
flower
in
table
underunder
bear
on
horse
face of
man
riding
wearing
wearing
hat
shirt
mountain behind
umbrella
behind
window on
man
holding
buildingtree near
glass on
head of
arm
man
has
has
has
wearing
wearing
wearing
shirt
on
hat
arm1
hand holding racket
pant
on
man
wearing
wearing
pole on fence
shirt
short
on
shoe on
windowwindow1 on
number on
leg of
sign on sign1
man
wearing near near
horse horse1pant
on
hat
on
shoe
on
window
on
train
has
building
near
window1
on
tree
near
face of
horsemountain behind
man
on
has
has
hat
shirt
vase
on has
table
hashas
flower
in
bear
on
umbrella
over
street on
man
holding
buildingtree in front of
glass of
head of
groundtruth
Figure 5. Sample predictions from the baseline model and our final model trained with different numbers of message passing iterations. Themodels take images and object bounding boxes as input, and produce object class labels (blue boxes) and relationship predicates betweeneach pair of objects (orange boxes). In order to keep the visualization interpretable, we only show the relationship (edge) predictions forthe pairs of objects (nodes) that have ground-truth relationship annotations.
call. Both the baseline model and our final model performwell in predicting frequent predicates. However, the gap be-tween the models expands for less frequent predicates. Thisis because our model uses contextual information to copewith the uneven distribution in the relationship annotations,whereas the baseline model suffers more from the skeweddistribution by making predictions in isolation.
4.1.3 Qualitative results
Fig. 5 shows qualitative results that compare our final modeltrained with different numbers of iterations and the baselinemodel. The results show that the baseline model tends toconfuse about the subject and the object in a relationship.For example, it predicts (umbrella-holding-man)in (b) and (counter-on-vase) in (c). Our fi-
7

Table 3. Evaluation results of support graph generation task. t-agstands for type-agnostic and t-aw stands for type-aware.
Support Accuracy PREDCLS
t-ag t-aw R@50 R@100Silberman et al. [28] 75.9 72.6 - -Liao et al. [24] 88.4 82.1 - -Baseline [26] 87.7 85.3 34.1 50.3Final model (ours) 91.2 89.0 41.8 55.5
nal model trained with one iteration is able to resolvesome of the ambiguity in the object-subject direction.For example, it predicts (umbrella-on-woman) and(head-of-man) in (b), but it still predicts cyclic re-lationships like (vase-in-flower-in-vase). Fi-nally, the final model trained with two iterations isable to make semantically correct predictions, e.g.,(umbrella-behind-man), and resolves the cyclicrelationships, e.g., (vase-with-flower-in-vase).Our model also often predicts predicates that are seman-tically more accurate than the ground-truth annotations,e.g., our model predicts (man-wearing-hat) in (a) andtable-under-vase in (c), whereas the ground-truth la-bels are (man-has-hat) and (table-has-vase),respectively. The bottom part of Fig. 5 showcases morequalitative results.
4.2. Support Relation Prediction
We then evaluate on the NYU Depth v2 dataset [28] withdensely labeled support relations. We show that our modelcan generalize to other types of relationships and is effectiveon both sparsely and densely labeled relationships.
Setup The NYU Depth v2 dataset contains three typesof support relationships: an object can be supported byan object from behind, by an object from below, or sup-ported by a hidden object. Each object is also labeled withone of the four structure classes: {floor, structure,furniture, prop}. We define the support graph gen-eration task as to predicting both the support relation typebetween objects and the structure class of each object. Wetake the smallest bounding box that encloses an object seg-mentation mask as its object region. We assume ground-truth object locations in this task.
We compare our final model with two previous mod-els [28, 24] on the support graph generation task. Follow-ing the metric used in previous work, we report two typesof support relation accuracies [28]: type-aware and type-agnostic. We also report the performance with R@50 andR@100 measurements of the predicate classification taskintroduced in Sec. 4.1. Note that both [28] and [24] useRGB-D images, whereas our model uses only RGB images.
Figure 6. Sample support relation predictions from our model onthe NYU Depth v2 dataset [28]. →: support from below, (:support from behind. Red arrows are incorrect predictions. Wealso color code structure classes: ground is in blue, structure isin green, furniture is in yellow, prop is in red. Purple indicatesmissing structure class. Note that the segmentation masks are onlyshown for visualization purpose.
Results Our model outperforms previous work, achiev-ing new state-of-the-art performance using only RGB im-ages. Our results show that having contextual informa-tion further improves support relation prediction, even com-pared to purpose-built models [24, 28] that used RGB-D im-ages. Fig. 6 shows some sample predictions using our finalmodel. Incorrect predictions typically occur in ambiguoussupports, e.g., books in shelves can be mistaken as beingsupported from behind (row 1, column 2). Geometric struc-tures that have weak visual features also cause failures. Inrow 2, column 1, the ceiling at the top left corner of theimage is predicted as supported from behind instead of sup-ported below by the wall, but the boundary between the ceil-ing and the wall is nearly invisible. Such visual uncertaintymay be resolved by having additional depth information.
5. Conclusions
We addressed the problem of automatically generating avisually grounded scene graph from an image by a novelend-to-end model. Our model performs iterative messagepassing between the primal and dual sub-graph along thetopological structure of a scene graph. This way, it improvesthe quality of node and edge predictions by incorporatinginformative contextual cues. Our model can be considereda more generic framework for graph generation problem. Inthis work, we have demonstrated its effectiveness in predict-ing Visual Genome scene graphs as well as support relationsin indoor scenes. A possible future direction would be to ex-plore its capability in other structured prediction problemsin vision and other problem domains.
8

Acknowledgements We would like to thank Ranjay Kr-ishna, Judy Hoffman, JunYoung Gwak, and anonymous re-viewers for useful comments. This research is partially sup-ported by a Yahoo Labs Macro award, and an ONR MURIaward.
References[1] P. Anderson, B. Fernando, M. Johnson, and S. Gould. Spice:
Semantic propositional image caption evaluation. In ECCV,2016.
[2] R. Baur, A. Efros, and M. Hebert. Statistics of 3d objectlocations in images. 2008.
[3] S. Bell, C. L. Zitnick, K. Bala, and R. Girshick. Inside-outside net: Detecting objects in context with skippooling and recurrent neural networks. arXiv preprintarXiv:1512.04143, 2015.
[4] A. X. Chang, M. Savva, and C. D. Manning. Learning spatialknowledge for text to 3d scene generation. 2014.
[5] Y.-W. Chao, Z. Wang, Y. He, J. Wang, and J. Deng. Hico:A benchmark for recognizing human-object interactions inimages. In ICCV, 2015.
[6] Y.-W. Chao, Z. Wang, Y. He, J. Wang, and J. Deng. Hico: Abenchmark for recognizing human-object interactions in im-ages. In Proceedings of the IEEE International Conferenceon Computer Vision, 2015.
[7] K. Cho, B. Van Merrienboer, D. Bahdanau, and Y. Bengio.On the properties of neural machine translation: Encoder-decoder approaches. arXiv preprint arXiv:1409.1259, 2014.
[8] C. Desai, D. Ramanan, and C. Fowlkes. Discriminative mod-els for static human-object interactions. In 2010 IEEE Com-puter Society Conference on Computer Vision and PatternRecognition-Workshops. IEEE, 2010.
[9] C. Desai, D. Ramanan, and C. C. Fowlkes. Discriminativemodels for multi-class object layout. International journalof computer vision, 95(1), 2011.
[10] M. Fisher, M. Savva, and P. Hanrahan. Characterizing struc-tural relationships in scenes using graph kernels. In ACMSIGGRAPH 2011 papers, 2011.
[11] C. Galleguillos, A. Rabinovich, and S. Belongie. Object cat-egorization using co-occurrence, location and appearance.In Computer Vision and Pattern Recognition, 2008. CVPR2008. IEEE Conference on. IEEE, 2008.
[12] R. Girshick. Fast r-cnn. In Proceedings of the IEEE Interna-tional Conference on Computer Vision, 2015.
[13] R. Girshick, J. Donahue, T. Darrell, and J. Malik. Region-based convolutional networks for accurate object detectionand segmentation. IEEE transactions on pattern analysisand machine intelligence, 38(1), 2016.
[14] A. Gupta and L. S. Davis. Beyond nouns: Exploiting prepo-sitions and comparative adjectives for learning visual classi-fiers. In European conference on computer vision. Springer,2008.
[15] K. He, X. Zhang, S. Ren, and J. Sun. Deep residual learningfor image recognition. CVPR, 2016.
[16] A. Jain, A. R. Zamir, S. Savarese, and A. Saxena. Structural-rnn: Deep learning on spatio-temporal graphs. arXiv preprintarXiv:1511.05298, 2015.
[17] Z. Jia, A. Gallagher, A. Saxena, and T. Chen. 3d-based rea-soning with blocks, support, and stability. In Proceedingsof the IEEE Conference on Computer Vision and PatternRecognition, 2013.
[18] J. Johnson, R. Krishna, M. Stark, L. J. Li, D. A. Shamma,M. S. Bernstein, and L. Fei-Fei. Image retrieval using scenegraphs. In IEEE Conference on Computer Vision and PatternRecognition (CVPR), 2015.
[19] P. Krahenbuhl and V. Koltun. Efficient inference in fullyconnected crfs with gaussian edge potentials. In Advances inNeural Information Processing Systems 24, 2011.
[20] R. Krishna, Y. Zhu, O. Groth, J. Johnson, K. Hata, J. Kravitz,S. Chen, Y. Kalantidis, L.-J. Li, D. A. Shamma, M. Bern-stein, and L. Fei-Fei. Visual genome: Connecting languageand vision using crowdsourced dense image annotations. InarXiv, 2016.
[21] A. Krizhevsky, I. Sutskever, and G. E. Hinton. Imagenetclassification with deep convolutional neural networks. InNIPS, 2012.
[22] L. Ladicky, C. Russell, P. Kohli, and P. H. Torr. Graph cutbased inference with co-occurrence statistics. In EuropeanConference on Computer Vision. Springer, 2010.
[23] X. Liang, X. Shen, J. Feng, L. Lin, and S. Yan. Semanticobject parsing with graph lstm. In European Conference onComputer Vision, 2016.
[24] W. Liao, M. Y. Yang, H. Ackermann, and B. Rosenhahn. Onsupport relations and semantic scene graphs. arXiv preprintarXiv:1609.05834, 2016.
[25] D. Lin, S. Fidler, and R. Urtasun. Holistic scene understand-ing for 3d object detection with rgbd cameras. In Proceed-ings of the IEEE International Conference on Computer Vi-sion, pages 1417–1424, 2013.
[26] C. Lu, R. Krishna, M. Bernstein, and L. Fei-Fei. Visual re-lationship detection with language priors. In European Con-ference on Computer Vision, 2016.
[27] R. Mottaghi, X. Chen, X. Liu, N.-G. Cho, S.-W. Lee, S. Fi-dler, R. Urtasun, and A. Yuille. The role of context for objectdetection and semantic segmentation in the wild. In CVPR,2014.
[28] P. K. Nathan Silberman, Derek Hoiem and R. Fergus. Indoorsegmentation and support inference from rgbd images. InECCV, 2012.
[29] A. Oliva and A. Torralba. The role of context in object recog-nition. Trends in cognitive sciences, 11(12):520–527, 2007.
[30] A. Rabinovich, A. Vedaldi, C. Galleguillos, E. Wiewiora,and S. Belongie. Objects in context. In 2007 IEEE 11thInternational Conference on Computer Vision. IEEE, 2007.
[31] V. Ramanathan, C. Li, J. Deng, W. Han, Z. Li, K. Gu,Y. Song, S. Bengio, C. Rossenberg, and L. Fei-Fei. Learningsemantic relationships for better action retrieval in images.In 2015 IEEE Conference on Computer Vision and PatternRecognition (CVPR). IEEE, 2015.
[32] S. Ren, K. He, R. Girshick, and J. Sun. Faster R-CNN: To-wards real-time object detection with region proposal net-works. In Advances in Neural Information Processing Sys-tems (NIPS), 2015.
[33] M. R. Ronchi and P. Perona. Describing common humanvisual actions in images. In BMVC, 2015.
9

[34] M. A. Sadeghi and A. Farhadi. Recognition using vi-sual phrases. In Computer Vision and Pattern Recognition(CVPR), 2011 IEEE Conference on, 2011.
[35] R. Salakhutdinov, A. Torralba, and J. Tenenbaum. Learningto share visual appearance for multiclass object detection.In Computer Vision and Pattern Recognition (CVPR), 2011IEEE Conference on. IEEE, 2011.
[36] K. Simonyan and A. Zisserman. Very deep convolutionalnetworks for large-scale image recognition. arXiv preprintarXiv:1409.1556, 2014.
[37] D. Teney, L. Liu, and A. v. d. Hengel. Graph-structured rep-resentations for visual question answering. arXiv preprintarXiv:1609.05600, 2016.
[38] A. Torralba. Contextual priming for object detection. Inter-national journal of computer vision, 53(2):169–191, 2003.
[39] B. Yao and L. Fei-Fei. Modeling mutual context of ob-ject and human pose in human-object interaction activities.In Computer Vision and Pattern Recognition (CVPR), 2010IEEE Conference on. IEEE, 2010.
[40] M. Yatskar, L. Zettlemoyer, and A. Farhadi. Situation recog-nition: Visual semantic role labeling for image understand-ing. 2016.
[41] Y. Zhao and S.-C. Zhu. Scene parsing by integrating func-tion, geometry and appearance models. In Proceedings of theIEEE Conference on Computer Vision and Pattern Recogni-tion, pages 3119–3126, 2013.
[42] B. Zheng, Y. Zhao, J. Yu, K. Ikeuchi, and S.-C. Zhu. Sceneunderstanding by reasoning stability and safety. Int. J. Com-put. Vis., 2015.
[43] S. Zheng, S. Jayasumana, B. Romera-Paredes, V. Vineet,Z. Su, D. Du, C. Huang, and P. Torr. Conditional randomfields as recurrent neural networks. In International Confer-ence on Computer Vision (ICCV), 2015.
[44] C. L. Zitnick, D. Parikh, and L. Vanderwende. Learningthe visual interpretation of sentences. In Proceedings of theIEEE International Conference on Computer Vision, 2013.
10