Scenario Planning Report - Austin, Texas
11
Scenario Planning Report Austin South Shore Central
Transcript of Scenario Planning Report - Austin, Texas
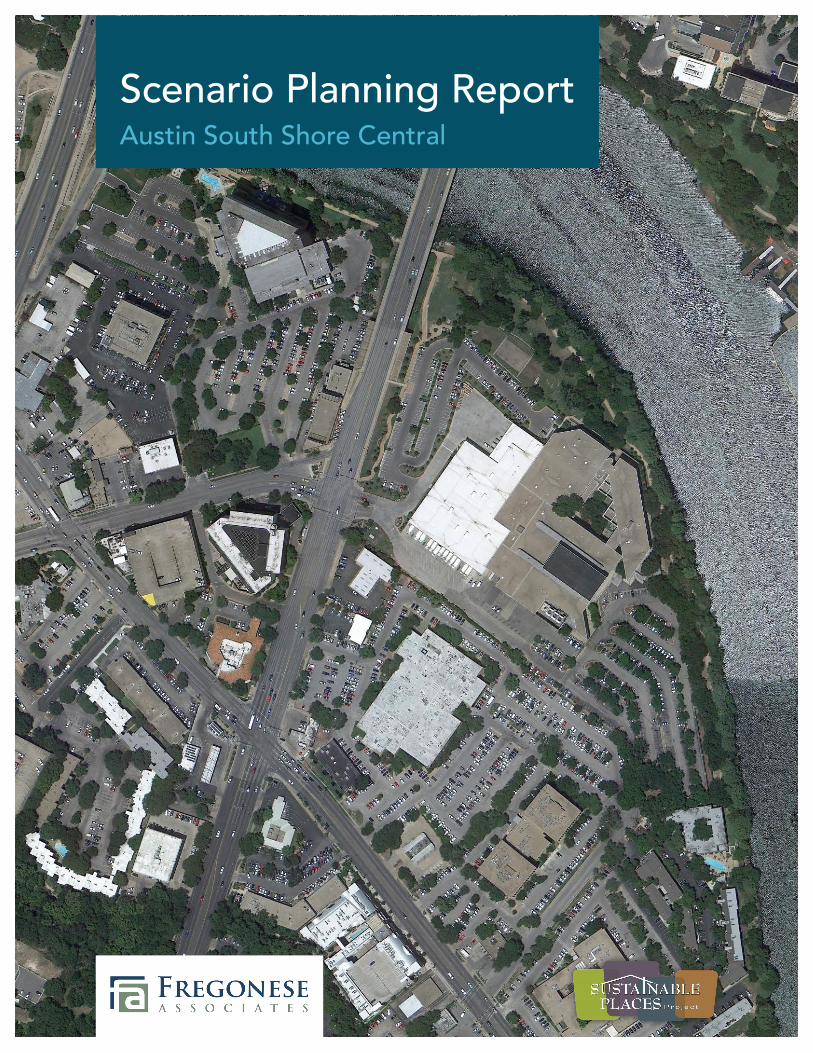
Scenario Planning ReportAustin South Shore Central

Introduction
Austin’s South Shore Central Sub-District
South Shore Central is an 88-acre sub-district of the waterfront overlay. As a fairly auto-oriented jobs center, the pedestrian environment isn’t conducive to walking, and access to the lake is unclear and informal due to poor street connectivity and large city blocks. The sub-district has many benefits including excellent access to down-town, connections to three major arterials, and its location on Lady Bird Lake, one of the City’s most important cultural and environmental assets.
Past planning efforts for the area have identified several desired community goals or outcomes:
• Access to the lake• Increased public open space• Affordable housing• Environmental performance• Green infrastructure• Walkability and bikeability• Fiscal balance
Sustainable Places Project and Demonstration Site Planning
Through a grant from HUD and a regional partnership of local governments and other stakeholder groups, the Capital Area Texas Sustainability (CATS) Consortium is developing a new approach to planning in Central Texas through the Sustainable Places Project. The project will examine several growth scenarios for activity centers in South Shore Central Austin, phase one of a proposed urban rail corridor running through Austin, Dripping Springs, Elgin, Hutto, and Lockhart. An innovative analytics tool is being developed to identify the long-term effects of the various scenarios on municipal budgets and the health of communities. We used this analysis tool to develop plans that align housing, jobs and transportation options in a way that complements existing community values. While other scenario planning efforts have been done for Dripping Springs, Elgin, Hutto, and Lockhart, this project examines several growth scenarios for South Shore Central Austin.
View of Downtown Austin from South Shore’s Statesman site.
2 Introduction
Scenario Planning Report Austin South Shore Central

3Scenario Planning
Scenario Planning
Establishing the Building-Level Foundation of Scenarios
Scenario planning is a methodology that allows communities to better prepare for the future by examining and comparing a set of plausible futures that result from different strategies, and then selecting those strategies that give rise to the most desirable outcomes given local or regional priorities. It uses powerful analytical tools to estimate how well existing or potential plans and strategies will meet important local and regional needs given different assumptions about the future.
The scenario planning process begins with the creation of realistic and feasible building prototypes based on local real estate market data. To do so, planners utilize a building-level return on investment (ROI) model. The model evaluates physical form inputs (e.g., height, unit sizes, parking configurations) as well as financial inputs (e.g., rents, sales price, construction costs, land costs). Scenarios developed using ROI models have a built-in business plan behind them, and in turn, master plans based on these scenarios are more likely to be implemented because they are founded on market-feasible solutions.
This analysis shows that South Shore Central’s potential rents are comparable to current downtown market rates due to amazing views and proximity to downtown. As a result, many development projects are financially feasible. Three prototypes were used in modeling South Shore Central: a 5- to 6-story “wrap” style mixed-use building, an 8-story “courtyard” building, and a 12- to 15-story high-rise building. All models were calibrated based on achiev-ing a 12% rate of return on the investment (IRR).
Construction Costs Hard: $19.6mSoft: $2.3m
Hard: $26.3mSoft: $2.9m
Hard: $63.2mSoft: $6.7m
Land Costs $3.7m($85 / sq ft)
$3.7m($85 / sq ft)
$3.7m($90 / sq ft)
Parking Type Structure Structure Underground / Structured
Density 91 du/acre 101 du/acre 215 du/acre
Square Feet Rental Res: 98,700Retail: 17,414
Rental Res: 109,000Retail: 19,200
Rental Res: 213,000Retail: 18,500
Rent (per Sq Ft) $2.02 $2.32 $2.95
Return (IRR) 12% 12% 12%
Profit (NOI) $2.35 million / yr $3.06 million / yr $6.76 million / yr
5-Story “Wrap” 8-Story Courtyard 12-Story+ High Rise
Scenario Planning ReportAustin South Shore Central

Three Scenarios for South Shore Central
Envision Tomorrow Plus was used to create three scenarios: a base scenario using existing zoning and standards, a scenario based on input from the American Institute of Architect’s Sustainable Design Assessment Team (SDAT) charette, and a scenario constructed by University of Texas/School of Architecture/Texas Futures Lab.
Scenario 1: Base Zoning Build OutThis scenario reflects the current development regulations that govern development in the South Shore area. Existing regulations examined by the model include: base zoning, waterfront overlay, PUDs (individual parcels), square footage maximums, height limits, impervious cover limits, FAR limits, and setback requirements.
Key Findings• Therearemanylayersofcomplexregulationsthatoftendo
notresultincreatingtheplacespeoplewant or that match the aspirations expressed in numerous planning documents.
• Thereiscurrentlynorealvisionforthesub-district. General principles were set forth in the 1985 Town Lake Corridor Study, but the vision it recommended was never developed.
• Lake access is an issue and is not guaranteed undercurrent regulations. For instance, most parcels are limited to 60 feet with the intended purpose of preserving views of down-town and the lake. This could potentially result in a wall of 60-foot buildings that obstruct views more than buildings of flexible design and height.
• Newdevelopment is currently being permittedwithout acohesive vision. The outcomes are uncertain for the public and potential investors. There are several projects being built or in permit-ting presently.
• Thelakefrontparcelhassquarefootagelimitsthateffectivelymeannonewbuildingcanexceedthreestories. Owned by the Statesman, this parcel enjoys some of the best views in the city.
Connectivity Map
Scenario Map
45
3
3
1
2
1. 17-Story/200 ft building
2. 3-Story building
3. 5-Story building
4. 3-Story building
5. Stepped back 3- to 5-story building w/50% impervious limit
Lake access is blocked by a building
Urban sidewalks are only required along building edges
4 Scenario Planning
Scenario Planning Report Austin South Shore Central

5Scenario Planning
Scenario 2: South Shore Central and SDAT VisionIn 2012, the American Institute of Architects awarded Austin a Sustainable Design Assessment Team (SDAT) to assist the South Shore Central community and its residents in addressing key issues. The SDAT Team members worked closely with local officials, com-munity leaders, technical experts, non-profit organizations and the public to study the community and its concerns. The team pre-sented a wide range of recommendations to the community in a public meeting. This scenario was developed to match the recom-mendations and design ideas that came out of the SDAT’s efforts.
Key Findings• Thevisionincludedasignificantemphasisonexpandingopen
space by leveraging existing natural areas, such as stream cor-ridors and the lakefront.
• Theexistinglarge,suburbanblockpatternwasmademorepedestrian-friendly with the addition fine grained local streets and pedestrian connections.
• Thebuildingsenvisionedforthesub-districtallowforcom-manding views fromwithin the residences or officeswhilepreservingview sheds fornearbyneighborhoods. However, they are taller and slimmer than what is allowed by current zoning.
• Connectivityandlinkagestothelakehavebeensignificantlyimproved.
• Active building fronts and good design were a commu-nity goal. Walkable urban sidewalks with green features were included as part of the overall design.
• Ambitious,affordablehousinggoalswereincluded.
Resulting Connectivity Map
1. 12-Story building 2. 8-Story building 3. 6-Story building
Scenario Map
Urban sidewalks are only required along building edges
SDAT Building Envelopes
Lake access is fundamental
Urban Sidewalks with Green Features
Active Building Fronts & Good Walking Environment
1
1
1
1
2
2
3
3
Scenario Planning ReportAustin South Shore Central

Scenario 3: University of Texas/School of Architecture/Texas Futures LabStudents in the UT Urban Design/Texas Futures Lab spent one term constructing a unique vision for the South Shore area as well. Their vision had a strong emphasis on green infrastructure and green building design and was based on the principles laid out in the SDAT Scenario including the same parking standards.
Key Findings• Off-siteimpactsfromrunoff,particularlyintothelake,were
fullyeliminatedthrough the use of bioswales and rain gardens.
• In order to create a family-oriented urban district,thestudentsincludedbuildingswithlargerthanaverageunitsizes.
• Affordablehousingunitsweremixedwithmarket-rateunitsthroughoutthesub-district.
• Connectivity was improved through the inclusion of manysmall road and pedestrian routes. This resulted in the most dense road network of all three scenarios.
• Abroaderrangeofbuildingtypeswereincludedwithinthesub-districtincluding townhomes and point towers.
• TheUT/TexasFuturesLabincludedplansforrailaccess.
Resulting Connectivity Map
Scenario Map
1. 16-Story point tower
2. 6-Story courtyard building
3. 5-Story apartment with affordable
4. 4-Story apartment with affordable
5. 12-Story point tower
6. 16-Story hotel
7. 6-Story wrap
Building Envelopes - view along South Congress Avenue
Building Envelopes - view towards downtown
1
3
4
45
7
7
2
1
1
6
6 Scenario Planning
Scenario Planning Report Austin South Shore Central

7Scenario Planning
Scenario Results & Comparison
Population and Housing
• TotalPopulation: 5,544-8,472 new residents added to the sub-district in all scenarios. The SDAT Scenario adds the most new residents – 8,742 more than today. The Base Scenario allows for 7,733 more residents.
• TotalHousingUnits: Housing units doubled to quadrupled in all scenarios, with the SDAT Scenario providing the most housing – 3,911 new multifamily units.
• HousingUnitTypes:Predominantly mid-rise developments in all scenarios.
• AverageRentforNewUnits:$2.15-2.38 per sq ft market rents for all scenarios. The SDAT Scenario resulted in the highest achievable rents at $2.38 per sq ft.
• EmploymentMix: SDAT is the only scenario that expands employment.
• Jobs-HousingBalance: All scenarios trade jobs for housing due to goals of current and proposed policies to add housing to the area. Currently the jobs-housing balance is 3.5. Base Scenario shows the smallest jobs-housing balance at 0.9 and the UT/Tx Futures Lab Scenario has the highest jobs-housing balance at 1.4 of the three scenarios.
• HousingandJobDensity:Housing density is 2-3 times higher in all three scenarios than it is currently because housing is being built instead of new office and job related buildings.
• NewAffordableUnits: 14% of units in the SDAT and 15% of units in the UT/Tx Futures Lab are affordable.
Transportation
• VehicleUse:10-25% fewer vehicle miles traveled (VMT) per person in all scenarios, with the dense street network in the UT/Tx Futures Lab Scenario resulting in the lowest VMT at 17.34 miles per person.
• TravelChoiceswithintheSub-District: 54-73% of internal trips are by foot, this is primarily due to more people living and working close to desired destinations. The improved street network is also a major factor. The SDAT Scenario showed the highest rate of walking trips at 73%.
• TransitTrips:Transit trips double in all three scenarios, with the UT/Tx Futures Lab Scenario showing the most total transit trips at 4,924.77.
• SharedParking:Increases in walking, combined with mixing uses presents an opportunity for shared parking in the area.
Fiscal Performance
• NewBuildingValue: $1.8 billion in new building value added by the SDAT scenario, the most of any scenario, although all scenarios resulted in $1 billion or more added value.
• GrossMonthlyResidentialRent: $8-9 billion in gross monthly rent possible through the Base and SDAT Scenarios. Because there are fewer units in the UT/Tx Futures Lab Scenario it results in lower total rental revenue.
• Revenuesvs.Expenditures:The SDAT Scenario generates revenue at the lowest cost because it includes more non-residential development.
• NetAnnualRevenue: The SDAT Scenario results in $21 million in net revenue by including a good mix of non-residential (office and retail) in the area, more than any other scenario. Residential uses have higher service costs compared to non-residential uses, contributing to reduced net annual revenue for the housing intensive UT/Tx Futures Lab Scenario.
Scenario Planning ReportAustin South Shore Central

Open Space and Green Infrastructure
• NewOpenSpace:SDAT and UT/Tx Futures Lab Scenarios more than double open space over the Base Scenario. Both scenarios result in ~20 acres of open space and an additional 5-7 acres of green roofs.
• ImperviousBuildingAreaCover:SDAT and UT/Tx Futures Lab Scenarios halve the amount of impervi-ous building cover of the Base Scenario.
• ImperviousParkingLotAreaCover: SDAT and UT/Tx Futures Lab Scenarios create one-third or less parking lot coverage over the Base Zone Build Out. The UT/Tx Futures Lab Scenario requires only 8% of the sub-district’s surface as parking compared to 30% for the Base Scenario.
• ImperviousCoverAcrossEntireSite:Base Scenario results in more impervious cover than exists today, with approximately 15% more site covered with impervious site than required by the SDAT and UT/Tx Futures Lab Scenarios.
• NewGreenRoofArea:Green roofs and other green features help reduce impervious surface areas significantly in the SDAT and UT/Tx Futures Lab Scenarios.
• ReducedRunoff:The UT/Tx Futures Lab Scenario results in significantly less stormwater runoff into Lady Bird Lake than the other two scenarios. No green features are required in the Base Scenario, thus there is no reduction in runoff.
Sustainability
• EnergyUse:With conventional energy use, all scenarios are about the same, The UT/Tx Futures Lab Scenario requires slightly more energy primarily due to larger unit sizes.
• EnergySavingsfromGreenFeatures:The UT/Tx Futures Lab Scenario shows significant energy use and cost reductions due to green features over the Base Scenario. Green roofs and rain gardens make a big difference in overall energy savings. The UT/Tx Futures Lab Scenario green features save $110,669 per year; the SDAT Scenario’s green features save $26,036 per year.
• CO2EmissionsAvoided:The UT/Tx Futures Lab Scenario’s energy savings result in 1.46 million fewer pounds of CO2 emitted each year. Energy savings are total pollutant reduction and CO2 emissions avoided. Green features are not required in Base Scenario, thus there are no significant energy savings.
A table summarizing all indicator data for existing conditions and the three scenarios can be found at the end of this document in the Appendix.
Conclusions and Lessons LearnedThe analysis of these three scenarios has provided useful insights for the South Shore Central Sub-District.
• The base scenario performs well in some areas such as travel demand. While the other scenarios improved on these indicators, the inherent centrality of the site means that vehicle miles traveled will be lower, and non-auto travel modes higher than in the same development in a non-central location.
• The sub-district suffers from a lack of defined urban form and a strategy to obtain and build infrastructure.
• All three scenarios are profitable and could be built under current market conditions.
• The three scenarios are not significantly different in terms of density. They were all within a few hundred units of each other.
• Because of the land costs and high-density buildings, the average new rents will be more than $2,000 a month without actions from City. However, the market would probably support these rents.
• There are many tools to ensure that 20% or more of the new units are affordable at 60% of median income. However, many of these require public funds to subsidize the units, or a regulatory scheme to incentivize the units.
8 Conclusions and Lessons Learned
Scenario Planning Report Austin South Shore Central

9Conclusions and Lessons Learned
One of the obvious solutions to realize community goals is to sponsor a master plan for the sub-district. A master plan for the sub-district could bring:
• Up to $21 million in new annual net revenue through property and sales taxes.
• If these funds were captured and directed back into the site, they could fund acquisition and creation of public open space, trails and pedestrian connections, roadways and streetscapes, green infrastructure, public art, and other community benefits.
• Up to 1,400 new jobs (SDAT Scenario) and better jobs-housing balance in all the scenarios.
• An integrated approach to infrastructure.
• Greater connectivity to and along the lake.
In addition, the scenarios indicated that green infrastructure is feasible. Examples include:
• Green roofs
• Biofiltration
• Rain gardens
• Rainwater harvesting
It is possible to leverage an active housing market to achieve affordable housing goals in several ways, such as:
• Using density bonuses to allow higher density and therefore more return, but having a portion of the additional profits used to develop affordable units.
• Development agreements with the City.
Finally, a small area plan would allow a community dialogue that would provide a way to meet several conflicting goals, including:
• A financially feasible and motivating path forward for private development.
• Improved public access to Lady Bird Lake and its shoreline.
• Development of community amenities by capture of the value of new development or of incremental new taxes generated by the project.
• Ensure that views from adjacent neighborhoods are preserved while yielding these benefits.
• Achieving lower environmental impacts than current codes while achieving equivalent profits and affordability.
• Development of a more walkable neighborhood.
• The addition of many more affordable housing units than would otherwise be built.
• The creation of a superior urban design while achieving the above goals.
Scenario Planning ReportAustin South Shore Central

Appendix: Full Scenario Indicator Data
IndicatorExisting
Conditions
Scenario1:BaseZoneBuildOut
Scenario2:SDAT
Scenario3:UT/Tx
FuturesLab
Total population 2,878 10,611 11,620 8,422 Population added N/A 7,733 8,742 5,544
Total housing (units) 1,359 4,744 5,270 3,179 Housing added (units) N/A 3,385 3,911 1,820
Average household size (persons) 2 2 2 2
New Housing Units by Type
High-rise (10+ stories) N/A 1,002 1,199 603 Mid-rise (4-8 stories) N/A 2,503 2,714 1,662 Low-rise (1-3 stories) N/A 314 258 113
Average rent for new units N/A 2 2 2
Employment by type
Retail 530 1,375 1,841 671 Office 3,086 1,737 2,898 2,417 Industrial 35 35 - - Public/Civic 1,133 1,133 1,133 - Educational - - - - Hotel/Hospitality 489 489 910 626
Jobs Housing Balance 3.5 0.9 1.2 1.4
Housing units per Gross Acre 22.7 67.7 67.4 44.8
Jobs per gross acre 79.8 60.3 54.6 60.2
Combined Living Costs ($) 1,659 2,602 2,656 2,774 Transportation costs/month ($) 687 664 660 633 Energy costs/month ($) 72 75 75 83 Housing costs/month ($) 900 1,863 1,921 2,058
New affordable housing units N/A - 594 331
VMT per capita (miles) 23.1 20.8 20.2 17.3
Trips within the district by mode
Walk 36% 54% 73% 68%Vehicle 64% 46% 27% 32%
Walking trips 3,388 8,158 10,872 9,151 Transit trips 2,171 3,474 4,583 4,925
Pop
ulat
ion
and
Ho
usin
gTr
ansp
ort
atio
n
10 Appendix: Full Scenario Indicator Data
Scenario Planning Report Austin South Shore Central

11Appendix: Full Scenario Indicator Data
IndicatorExisting
Conditions
Scenario1:BaseZoneBuildOut
Scenario2:SDAT
Scenario3:UT/Tx
FuturesLab
Reduction in parking demand from shared parking and mixed use
N/A 14.1% 14.9% 18.3%
Intersection density (intersections/sq mi)
58 101 123 274
New building value ($) N/A 1,288,583,187 1,799,471,119 999,304,467
Gross monthly rent ($/month) N/A 8,006,058 9,132,980 5,719,592
Net annual revenue ($) N/A 11,079,295 21,268,458 8,880,230 Annual revenues ($) N/A 29,797,745 44,397,770 24,056,033 Annual expenditures ($) N/A 18,718,450 23,129,312 15,175,803
New open space (acres) N/A 10 26 26 Green roofs (acres) N/A - 5 7 Open space (acres) N/A 10 21 19
New impervious cover
Building area N/A 90% 56% 46%Parking lot area N/A 30% 13% 8%Entire site 75% 82% 67% 66%
New green roof area (sq ft) N/A - 231,573 313,135
Reduced runoff (gallons/year) N/A - 1,305,267 5,857,531
Energy use (1000 BTU/year) 71.6 74.7 74.7 78.9
Energy savings from green features ($/year)
N/A - 26,036 110,669
CO2 avoided (lbs) N/A - 324,734 1,455,881
Tran
spo
rtat
ion
Fisc
al P
erfo
rman
ceO
pen
Spac
e &
Gre
en In
frast
ruct
ure
Sust
aina
bilit
y
Scenario Planning ReportAustin South Shore Central