Environment and tree size controlling stem sap flux in a ...

1 | Scattered Tree Assessment Manual
p
Native Vegetation Council (NVC)
Scattered Tree Assessment
Manual
July 2020

Scattered Tree Assessment Manual | 2
Disclaimer
While every reasonable effort has been made to verify the information
in this fact sheet use of the information contained is at your sole risk.
The Department recommends that you independently verify the
information before taking any action.
Licensed under Creative Commons
Attribution 3.0 Australia License
www.creativecommons.org/licenses/by/3.0/au
Copyright Owner: Crown in right of the
State of South Australia 2015

3 | Scattered Tree Assessment Manual
Contents
1 QUICK REFERENCE GUIDE 4 2 INTRODUCTION 5 3 PRELIMINARY OFFICE PROCEDURE 6 4 FIELD PROCEDURE 6
4.1 Equipment 6
4.2 Description of the Vegetation under Applications 6
4.3 Completing the Scattered Tree Assessment Field Inspection 7
4.3.1 General information about the datasheet 7
5 FILLING IN THE ASSESSMENT DATA REPORT SPREADSHEET 10
5.1 Single Trees 10
5.2 Clumps of trees 12
5.3 Tree Scores 12
5.3.1 Tree score 12
5.3.2 Multiplication factor 13
5.3.3 Biodiversity score 13
6 SUBMISSION OF ASSESSMENT SCORESHEET 13
6.1 Scattered Tree Information and Scores 13
6.2 Clearance Application or Regulation Reports 13
7 APPENDICES 14
7.1 Appendix 1 Scattered Tree Field Datasheets 14
7.2 Appendix 2 Scattered Tree Assessment Scoresheet 15
7.3 Appendix 3 Useful Resources 17
7.4 Appendix 4 List of ‘Scattered Tree’-Using Wildlife 18
7.5 Appendix 5 Scattered Tree Height Categories 27
7.6 Appendix 6 Additional Information 30
7.7 Appendix 7 Distribution of Differing Growth Forms of Eucalypts 32
7.8 Appendix 8 Dead Trees Included as Native Vegetation 38

Scattered Tree Assessment Manual | 4
1 Quick Reference Guide
1. View vegetation and terrain (NatureMaps, Google Streetview) to help estimate
time for field assessment.
2. Undertake assessment. Record general information – date of inspection,
inspectors, number of trees, name of applicant, etc. Collect the following
information on each tree:
Photo
GPS point
Species – sub-species level
Height (m)
Diameter of trunk (cm) – recorded at 1.5m above the ground
Health – % of canopy dieback
Hollows – number and size (Small = <5cm, Medium = 5-15cm, Large = >15cm)
3. Complete data report. Enter information into data report Excel spreadsheet. Enter
data collected in the field as well as information on the remnancy figures and
conservation significance (i.e. threatened plant species, habitat for threatened
fauna).
4. Submit Scattered tree Assessment data report and associated information to
the NVB. The assessment data report must be provided to NVMU electronically.

5 | Scattered Tree Assessment Manual
2 Introduction
The Scattered Tree Assessment method has been derived from the report - Scattered tree clearance assessment in
South Australia: streamlining, guidelines for assessment and rural industry extension (2002) J.L. Cutten & M.W.
Hodder, Biodiversity Assessment Services.
This manual has been designed to assist accredited consultants to collect, record, and present information
correctly when preparing Data Reports for native vegetation clearance applications or regulation application for
the clearance of scattered trees.
The NVC Scattered Tree Assessment method is suitable for assessing scattered trees in the following instances:
• Individual scattered trees (i.e. canopy does not overlap). Spatial distribution of trees may vary from
approach what would be considered their original distribution (Pre-European) through to single isolated
trees in the middle of a paddock or
• Dead trees (when a dead tree is considered native vegetation – see Appendix 8) or
• Clumps of trees (contiguous overlapping canopies) if the clump is small (~<0.1 ha) and;
• For both scattered trees and clumps;
o the ground layer comprising wholly or largely of introduced species
o some scattered colonising native species may be present, but represents <5% of the ground
cover
o the area around the trees consists of introduced pasture or crops.
If the vegetation does not fit within this definition, then the Bushland Assessment or Rangeland Assessment
method should be applied.
The data required for assessment involves a scoring process referred to as the Point Scoring System (PSS). The PSS
has been developed to facilitate assessment, in a quantifiable way, of the relative biodiversity value of a tree,
providing consistency between assessments and stream-lining the process. This information assists to determine if
clearance is at variance with the principles of clearance in Schedule 1 of the Native Vegetation Act 1991. In
particular, this relates to Principle 1(b)-Wildlife habitat.
The PSS is also used in the calculation of the Significant Environment Benefit (SEB) requirements. This calculation
incorporates requirements from the Native vegetation SEB policy for the clearance of scattered trees. In particular,
this relates to the application of the multiplication factor, which provides for a greater SEB requirement for more
significant trees.
The Data Report is required as part of a clearance application to provide essential information to the Native
Vegetation Branch (NVB) for its assessment of the proposed clearance against the Principles of clearance
contained in the Act. The NVB compiles an assessment report, which is supplied to the applicant and then
submitted to the Native Vegetation Council (NVC) for a decision on whether to approve the clearance.
Information supplied in data reports on receipt to NVB are checked for data quality and completeness; they may
also be subject to audit. If required, site inspections may be undertaken as part of this process.
The NVC encourages users of this assessment method to consider if activities could impact sites of indigenous
significance. Please refer to the Department of State Development's Aboriginal Affairs and Reconciliation for
further information.

Scattered Tree Assessment Manual | 6
3 Preliminary Office Procedure
The clearance application should be complete with aerial imagery, land tenure information (including property
boundaries) and applicant’s clearance proposal.
Prior to a site inspection, the clearance proposal should be evaluated taking into consideration the following dot
points. Consultants can contact the NVB to obtain access to the previous clearance application files. Alternatively,
information relating to past clearance applications, SEB areas and Heritage Agreements can be found on
NatureMaps.
Assess whether there have been previous clearance applications on the property and adjacent properties
to determine:
o previous decisions
o locations of previous consent areas/trees and SEB areas
o species lists for areas of vegetation in the locality
o potential fauna of significance to look out for in the locality (e.g. Red-tailed Black Cockatoos, or
indicators that they may occur, such as feeding trees and potential nest sites)
o potential land management issues.
This will provide information about flora and fauna habitat, and may reduce the amount of work involved
in the site inspection. In addition it ensures that the integrity of previous approved vegetation
management programs/decisions is maintained.
Examine the clearance proposal to identify possible alternative clearance areas that may result in reduced
native vegetation clearance. For example shifting the centre pivot location or reducing the pivot radius.
Check in Regional Biodiversity and/or NRM Plans for whether the application is located within areas of
conservation importance such as threatened habitat areas,
Refer to information available on threatened species, recovery plans, research reports (see Appendix 3).
4 Field Procedure
4.1 Equipment
You will need this manual, datasheets, pencil, gps, camera, large scale aerial imagery and plant bag.
4.2 Description of the Vegetation under Applications
Plant data should be recorded on the scattered tree field datasheet (Appendix 1).
In general, plants should be identified to sub-species or variety level where appropriate (e.g. SA blue gum in South
East region consists of 4 different sub-species: Eucalyptus leucoxylon ssp. leucoxylon, E. leucoxylon ssp. pruinosa, E.
leucoxylon ssp. stephanaie, E. leucoxylon ssp. megalocarpa).
If a plant species is unknown, or the collector is unsure of its identity in the field, a specimen should be collected,
labelled and pressed as soon as possible in order to verify the correct identity of the plant at a later time.

7 | Scattered Tree Assessment Manual
4.3 Completing the Scattered Tree Assessment Field Inspection
4.3.1 General information about the datasheet
For scattered trees, certain attribute data must be collected to enable the PSS to be used. This information can be
collected using the field datasheet (Appendix 1).
Only score dead trees when they are considered to constitute native vegetation (see Appendix 8). Data recorded
on site should include:
General information – name of applicant, date of inspection, number of trees in application, observer’s
names and information on regeneration.
GPS point - record the Australian Map Grid reference (Easting, Northing and Datum) of each tree using a
GPS unit. Take the reading as close as possible to the tree trunk. Assign a waypoint number and tree
number ID, enter these in the scattered tree datasheet (Appendix 1).
Photo - photograph each tree or clump of trees under application and include a range pole at the base of
the tree that gives scale. If possible take the photo from as far away from the tree as possible to fit the
whole tree in the photo. Tree photos with object of known height at the base of the tree can be used to
support height measurements, provided the full tree is within the photo. Enter photo number on the data
sheet.
Species - identify tree species to sub-species as per section 3.2 above.
Height - record tree height in metres using a reliable repeatable method, such as a clinometer. This
estimate includes the dead portions. Tree height is used in the measurement of size, and is estimated to
get an indication of wildlife habitat value (i.e. the taller the tree, generally the more resources that tree
possesses). Where a clinometer is not available the following method is reliable and efficient to use in the
field.
Using fingers/end of pen, for two-metre calibration
This method is used to estimate tree heights and involves using another person as a two-metre guide, standing
against the tree. The person measuring the tree stands back from the tree (no particular distance), calibrating
the two metre height with a distance between two fingers (or the end of a pen, etc), and then measuring the tree
in two metre intervals.
The main problem with this method, is that when measuring up the tree with the two fingers (or other
instrument), it is sometimes difficult (especially with a taller tree), to continue vertically. Further towards the top
of the tree, it is easy to start measuring in a backward curve, rather than straight upward (eg. Figure 1a below).
In this way, the estimation of the height of particularly a taller tree is likely to be less accurate. In any case,
fingers should be narrowed slightly as the calibration moves up the tree (eg. Figure 1b below).

Scattered Tree Assessment Manual | 8
Tree trunk diameter - measure tree trunk diameter in centimetres at 1 metres height above ground level. Use
foresters’ diameter tape. If the trunk is forked at 1m height or multi-trunked/stemmed, record the diameter of
the largest trunk. If the trunk bulges unusually at 1m height then measure the next lowest point that best
represents the actual diameter of the tree.
Health - estimate tree health by recording the per cent foliage dieback (any number between 0 and 100 –
although 100% implies dead and should only be scored when dead trees are considered native vegetation).
‘Dieback’ refers to the proportion of the total possible tree volume that is missing or is ‘dead’ due to ill health.
When estimating foliage dieback, if mistletoe is present include half of the mistletoe volume in the tree
volume and half as percent dieback estimate.
The following points, and photographs in Figure 2, help distinguish what to measure when estimating
dieback:
o When visualising the total possible tree volume, imagine the extent of the canopy if all branches/
branchlets had foliage extending to their extremities
o When estimating the % ‘dieback’, in general, only consider dieback to be that which occurs from the
tips of tree branches/branchlets - density of the foliage is generally not considered to be taken into
account when estimating % dieback, because some trees have a naturally sparse canopy cover, and
are not necessarily any less healthy than a tree with a dense canopy cover
o Lack of foliage on some lower branches/branchlets is usually considered to be normal on healthy
trees (occurs due to natural shading as tree grows older) and is generally not included within the
measurement of dieback (reliance on visual experience and judgment is necessary to differentiate
between normal levels of foliage loss and true ‘dieback’)
o If dead stags are present on the tree, these are counted as part of dieback, and are incorporated into
the height measurement of the assessment procedure.
Figure 1a) & b): Estimating tree height using fingers/end of pen, for two-metre calibration.

9 | Scattered Tree Assessment Manual
No dieback 20% dieback
40% dieback 60% dieback
Figure 2: Examples of trees with different percentages
of dieback
80% dieback
Figure 2: Examples of trees with varying percentages of dieback.
Hollows - Walk around the tree, and record visible hollows (using binoculars if necessary), recording their
details using the following key:
ENTRANCE SIZE: lrg = large (diameter 15cm or more)
med = medium (diameter >5cm to <15cm)
sm = small (diameter 5cm or less)

Scattered Tree Assessment Manual | 10
Additional information - Further information can be collected on trees that will assist with determining
the health and wildlife habitat value of scattered trees. In particular, addition information can be collected
relating to the value of hollows for habitat for trees in the South East of SA. Refer to Appendix 6 for
details.
5 Filling in the Assessment Data Report
Spreadsheet
Post field data collection, attribute data is entered into an MS Excel spreadsheet (assessment data report
spreadsheet), and formulae in the table automatically adjust each value according to the weightings. Attribute
scores are automatically summed and a formula applied that determines a final tree score – with a maximum of
100 points. The higher the score, the higher the biodiversity value of that tree. Appendix 2 provides an example of
the spreadsheet.
5.1 Single Trees
Enter data for each attribute
For most of the attributes, data is entered as an absolute value e.g. tree height in metres. However for density, data
is entered as a category value e.g. 1 for low, 2 for medium, and 3 for high value. The instructions below outline the
procedure for each attribute. Enter data into the cells in light purple in the Scattered tree assessment data report
spreadsheet -
1. Species name
Enter (select from list) species name of the tree.
Where required, select the species name based on form (shrub or tree), environment (scattered or in a
clump) or location (e.g. South East) as this influences the height category (See Appendix 5 for scattered
tree height categories).
Refer to Appendix 7 for further location information for different growth forms of the following species:
Eucalyptus leucoxylon, Eucalyptus fasciculosa, Eucalyptus behriana, Eucalyptus obliqua and Eucalyptus
willisii.
2. Height
Enter tree height (in metres).
The tree will be assigned up to 4 points based on the size of the tree. This is determined from the
maximum height the tree is expected to reach, this based on the species and form entered in the “Species
name” field.
The maximum score after weighting is 5 [Formula is: = (Tree Height/Maximum height of that species *3)
*1.25]
3. Diameter
Enter the tree trunk diameter (in centimetres).
The tree will be points based on the diameter of the tree in accordance with the following formulas –
If trunk diameter is less than or equal to 40cm – Trunk diameter * 0.8
If trunk diameter is greater than 40cm but less than or equal to 80cm – ((Trunk diameter – 40)*0.4)+3.2
If trunk diameter is greater than 80cm – ((Trunk diameter – 80)*0.2)+4.8
The score is weighting is 1 [Formula is: = points *1]
Value

11 | Scattered Tree Assessment Manual
4. Health
Enter % dieback for the tree, e.g. 30 for 30% dieback.
The tree will be assigned a score based on the percent dieback that is present. The maximum possible
score for health is 3 points [Formula is: = ((100 - % dieback)*0.03)]
5. Hollows
Enter the number of hollows for each size category (sm, med or lrg).
The tree will be assigned 0. 1 or 2 points based on the number and size of hollows (See below for details).
This information also informs fauna habitat suitability of a tree.
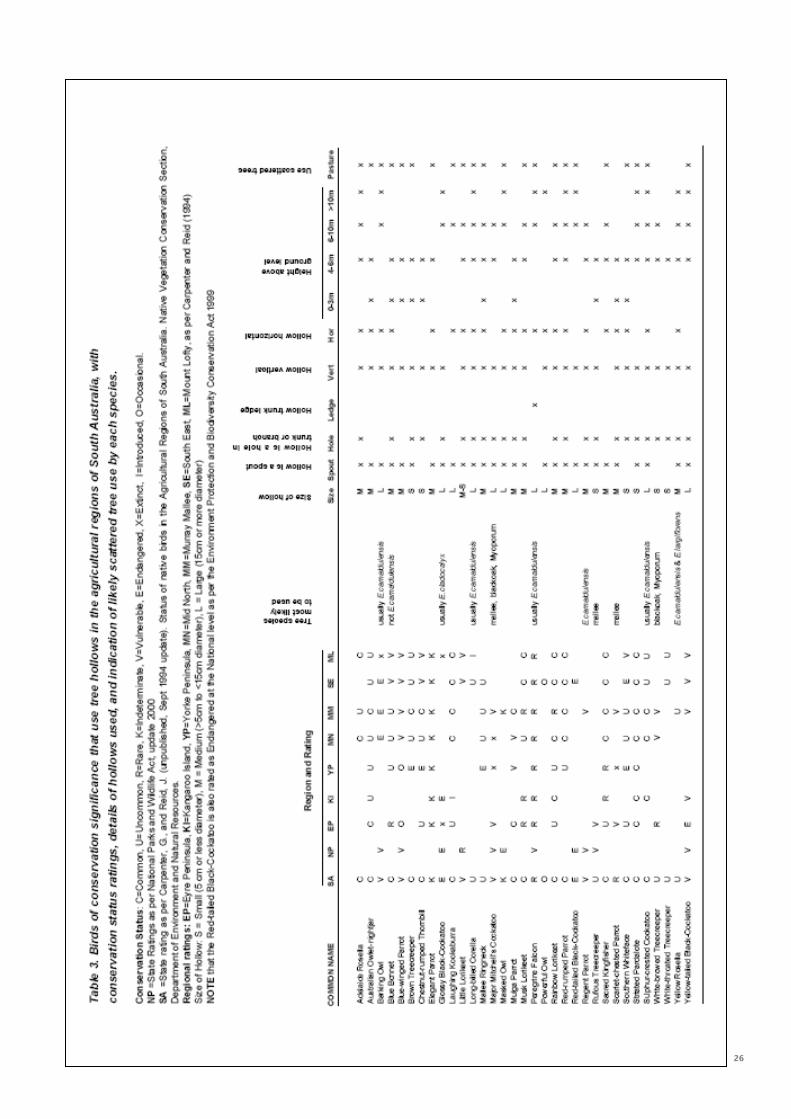
The scores are based on Table 3 and calculated as below
- A small hollow is assigned a score of 1
- A medium hollow is assigned a score of 4
- A large hollow is assigned a score of 8
The score for all the hollows that a tree contains will be summed together and assigned points according
to below.
- A total score of 0 = 0 point
- A total score between 1 – 5 = 1 point
- A total score >5 = 2 points
The maximum possible score after weighting is 1.20 [Formula = Tree points*0.6].
6. Suitability for threatened species
Enter the number of fauna species in each category (uncommon, rare species listed under the National
Parks and Wildlife Act 1972, Vulnerable or Endangered under the National Parks and Wildlife Act 1972,
Environmental Protection and Biodiversity Conservation Act 1999) that the tree provides suitable habitat.
For this attribute, under take a database search of BDBSA, Nature Maps and Atlas of Living Australia to
identify species recorded with a 5km radius of the application area since 1995, supplemented with
information from wildlife experts. Note that roosting, perching and feeding, as well as nesting, are
included in the definition of ‘use’ by wildlife. Refer to Appendix 4 for a list of ‘scattered tree’-using
wildlife.
The tree will be assigned between 0 and 1.8 points based on habitat suitability (see below for details).
The scores are based on Table 3 and calculated as below.
- Habitat for each uncommon species is assigned a score of 0.125
- Habitat for Rare species under NP&W Act 1972 (excluding EPBC listed sp.) is assigned a score of 0.5
- Habitat for Vulnerable and Endangered species under NP&W Act 1972 (excluding EPBC listed sp.) is
assigned a score of 4
- Habitat for EPBC Act 1999 listed species is assigned a score of 16
The scores a summed together to provide a total for the tree for habitat suitability and assigned points
according to below
- A total score of 0 = 0 points
- A total score of <0.5 = 0.6 point
- A total score of <4 = 1 points
- A total score <16 = 1.4 points
- A total score >=16 = 1.8 points

Scattered Tree Assessment Manual | 12
7. Threatened species
If the tree species under application for clearance is listed under the NP&W Act 1972, entre R for Rare, V
for Vulnerable or E for Endangered.
The tree will be assigned 1, 2 or 3 points based on the information below;
The scores are determined as below
- A Rare species is assigned 1 point
- A Vulnerable species is assigned 2 points
- An Endangered species is assigned 3 points
The maximum possible score after weighting for proximity to bushland is 0.9 [Formula = points*0.3].
8. Remnancy (i.e. percent vegetation cover)
Enter the percent vegetation cover for the IBRA Association that the tree occurs within.
The maximum possible score is 1.6 [Formula = (100 – remnancy) *0.016].
5.2 Clumps of trees
Whenever possible, information should be recorded for each individual tree, particularly where trees within clumps
have highly variable attributes or the clump is of mixed species. However on occasions it may be difficult to
distinguish between trees if they are in a dense clump. In such circumstances, information can be collected for the
clump. The same data that is required for single scattered trees are collected for clumps of scattered trees,
however “averaging” of the trees attributes is used. Data is recorded on the scattered tree datasheet. The data
required for clumps of scattered trees are:
• a GPS Point. Allocate a clump identity (label clumps A-Z to avoid confusion with tree numbering)
• estimate of the numbers of trees present (if individual trees are indistinguishable, check whether stems
join at or just below the soil surface)
• list the plant species present and approximate numbers of each
• height estimate of the tallest tree/s noting the species of the tallest tree/s
• estimate the average diameter of the trunks of all the trees
• number, sizes, and notes on types of hollows seen (using key in Table 1)
• health (i.e. dieback percentage) of canopy as a whole.
For the purposes of the PSS, a clump is treated as a single entity, i.e. the height of the largest tree is measured,
dieback is based on the entire canopy of the clump, the hollows score is based on the total number of hollows in
the clump, and by definition the density score will be 3 points. When entering “averaged” data for clumps of trees
in the PSS spreadsheet, the data should be replicated for each of trees in the clump i.e. if there are 12 trees in the
clump, 12 individual entries are required. Multiple entries are required to calculate the correct SEB score.
5.3 Tree Scores
5.3.1 Tree score
The PPS will provide a total score for each tree out of a maximum of 155 points (the total score is the sum of the
weighted values, cubed and then divided by 55.5 points).

13 | Scattered Tree Assessment Manual
5.3.2 Multiplication factor
This score is then increased by a multiplication factor, as required by Guidelines for a Significant Environmental
Benefit for the Clearance of Scattered Trees. This Guideline has been established under Section 29(4a) of the Native
Vegetation Act 1991.
The multiplication factor is applied as set out in the table below.
Tree Score Multiplication factor
<20 0.032
20-29 0.048
30-40 0.064
41-60 0.08
>60 0.096
Example of how the multiplication factor is applied:
Tree Score Multiplication
Factor
Example tree
scores
Tree Biodiversity
Score
<20 0.032 10 0.32
20-29 0.048 25 1.2
30-40 0.064 35 2.24
41-60 0.08 50 4
>60 0.096 70 6.72
Total SEB requirement for example trees 14.48
5.3.3 Biodiversity score
Once the multiplication factor has been applied (this is applied on SEB sheet of the assessment data report
spreadsheet), the Biodiversity score for the tree will be obtained, which is a maximum of 15 Points. It is this score
that will determine the SEB requirement.
6 Submission of Assessment Scoresheet
6.1 Scattered Tree Information and Scores
Scattered tree Assessment Scoresheet will be provided as part of an assessment report and as an electronic
version. This data will be stored within DEW information systems.
6.2 Clearance Application or Regulation Reports
If you are required to complete a Clearance Application or Regulation report, use NVB’s assessment template.
The template will outline what information needs to be provided and in what format.

Scattered Tree Assessment Manual | 14
7 Appendices
7.1 Appendix 1 Scattered Tree Field Datasheets

15 | Scattered Tree Assessment Manual
7.2 Appendix 2 Scattered Tree Assessment Scoresheet
PSS sheet
Tree Species
Number of trees
in a clump
(enter 1 for
individual
trees)
Height Diameter Dieback
Number of
Hollows
Suitability for fauna
threatened species
Threatened
sp. Remnancy
Loss Factor
Fau
na h
ab
itat
sco
re
T
hre
ate
ne
d f
lora
sc
ore
Biodiversity score
(Max 15) (Score per tree)
Total biodiversity
score
SEB Points
Req.
Total SEB
Payment
No.
(plus form and
location description) (m) at 1m %
Sm
all
Med
im
Larg
e
Number of species
Tree species is;
R = Rare V =
Vulnerable E =
Endangered
IBRA $
above
Un
co
mm
on
NP
&W
Act
- R
are
NP
&W
Act
- E
nd
an
gere
d o
r V
uln
era
ble
(ex
clu
de
EB
PC
Sp
p)
EP
BC
Lis
ted
sp
p. Assoc.
ground % veg
level
(cm)
remaining
1
2
3
4
5
6

Scattered Tree Assessment Manual | 16
SEB Scoresheet (Provides a summary of the SEB requirements)
SEB Required for Scattered Trees (Version - 1 July 2020)
Landscapes Region
Total Biodiversity Score 0.00
Mean Annual Rainfall (mm)
Total SEB Points required 0.00
Economies of Scale factor
Total SEB $ required $0.00
IBRA Association Number of
Trees Total SEB Points required
Payment in NV Fund (GST Exclusive)
Administration fee (GST Inclusive)
Total
0 0 0.00 $0.00 $0.00 $0.00

17 | Scattered Tree Assessment Manual
7.3 Appendix 3 Useful Resources
BDBSA (Biological Database of South Australia) is a database that allows flora and fauna data to be displayed for individual species
or for a specified region.
NatureMaps is an initiative of the Department of Environment, Water and Natural Resources that provides a common access point
to maps and geographic information about South Australia's natural resources in an interactive online mapping format.
The Atlas of Living Australia (ALA) contains information on all the known species in Australia, aggregated from a wide range of data
providers: museums, herbaria, community groups, government agencies, individuals and universities.
EPBC Act - Protected Matters Search Tool. The Protected Matters Search Tool generates a report that will help determine whether
matters of national environmental significance or other matters protected by the Environment Protection and Biodiversity
Conservation Act 1999 are likely to occur in your area of interest.
Regional Natural Resource Management Plans are available from DEWNR.
http://www.environment.sa.gov.au/Conservation/Managing_natural_resources/Policy_plans
National Recovery Plans
Recovery Plans Made or Adopted under the Environmental Protection and Biodiversity Conservation Act 1999
http://www.environment.gov.au/biodiversity/threatened/recovery.html
Draft National Recovery South-eastern Subspecies of the Plans Red Tailed Black Cockatoo (RTBC)
http://www.environment.gov.au/biodiversity/threatened/publications/c-b-graptogyne.html
Cutten, J.L. & Hodder, M.W. (2002) Scattered tree clearance assessment in South Australia. Streamlining guidelines for assessment
and rural industry extension.
Carruthers, S, Bickerton, H, Carpenter, G, Brook, A and Hodder, M (2004) A Landscape Approach to the Ecological Value of Paddock
Trees. A Discussion Paper prepared for the South Australian Native Vegetation Council. Summary Report Years 1 & 2. Biodiversity
Assessment Services, available from Native Vegetation & Biodiversity Management Unit, Urrbrae, SA
Carruthers, S, (2005) A Landscape Approach to the Ecological Value of Paddock Trees. A Discussion Paper prepared for the South
Australian Native Vegetation Council. Biodiversity Assessment Services, available from Native Vegetation & Biodiversity
Management Unit, Urrbrae, SA
Available online.
http://www.environment.sa.gov.au/Knowledge_Bank/Science_research/Publications/NVC_Research_Grant_final_reports
Census of South Australian Vascular Plants. (The census is updated regularly)
http://www.flora.sa.gov.au/census.html
Scattered Tree Assessment Manual | 18
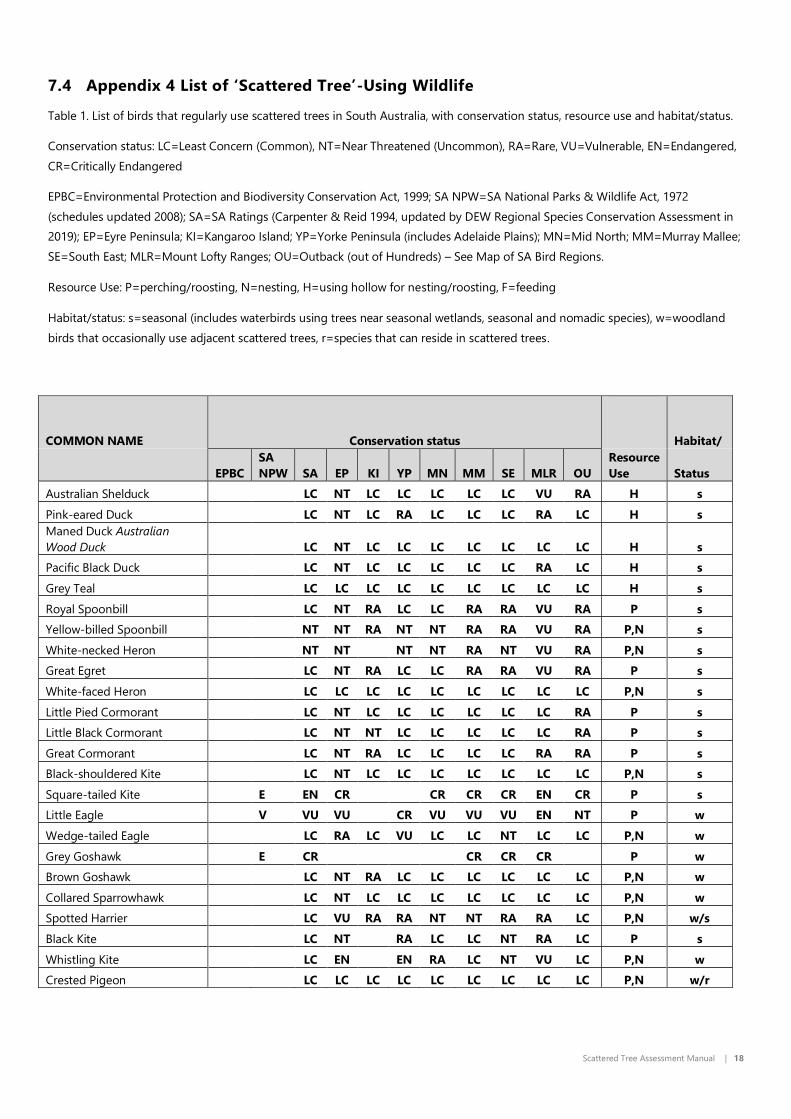
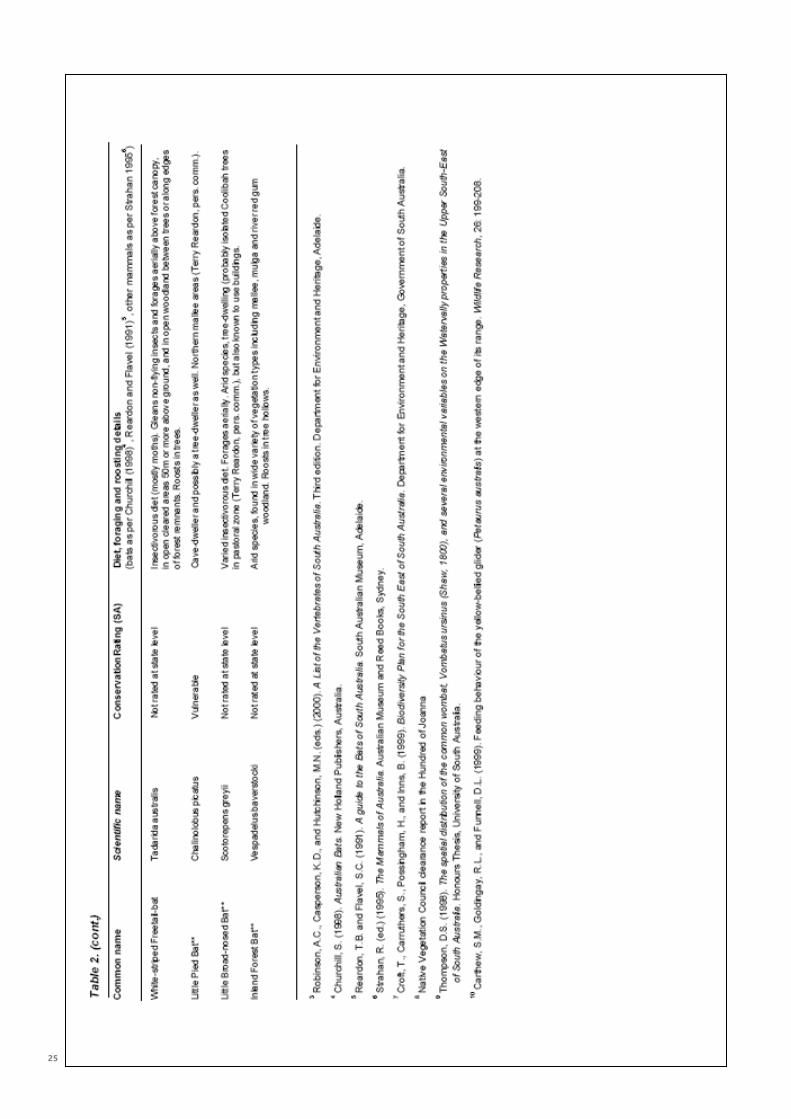
7.4 Appendix 4 List of ‘Scattered Tree’-Using Wildlife
Table 1. List of birds that regularly use scattered trees in South Australia, with conservation status, resource use and habitat/status.
Conservation status: LC=Least Concern (Common), NT=Near Threatened (Uncommon), RA=Rare, VU=Vulnerable, EN=Endangered,
CR=Critically Endangered
EPBC=Environmental Protection and Biodiversity Conservation Act, 1999; SA NPW=SA National Parks & Wildlife Act, 1972
(schedules updated 2008); SA=SA Ratings (Carpenter & Reid 1994, updated by DEW Regional Species Conservation Assessment in
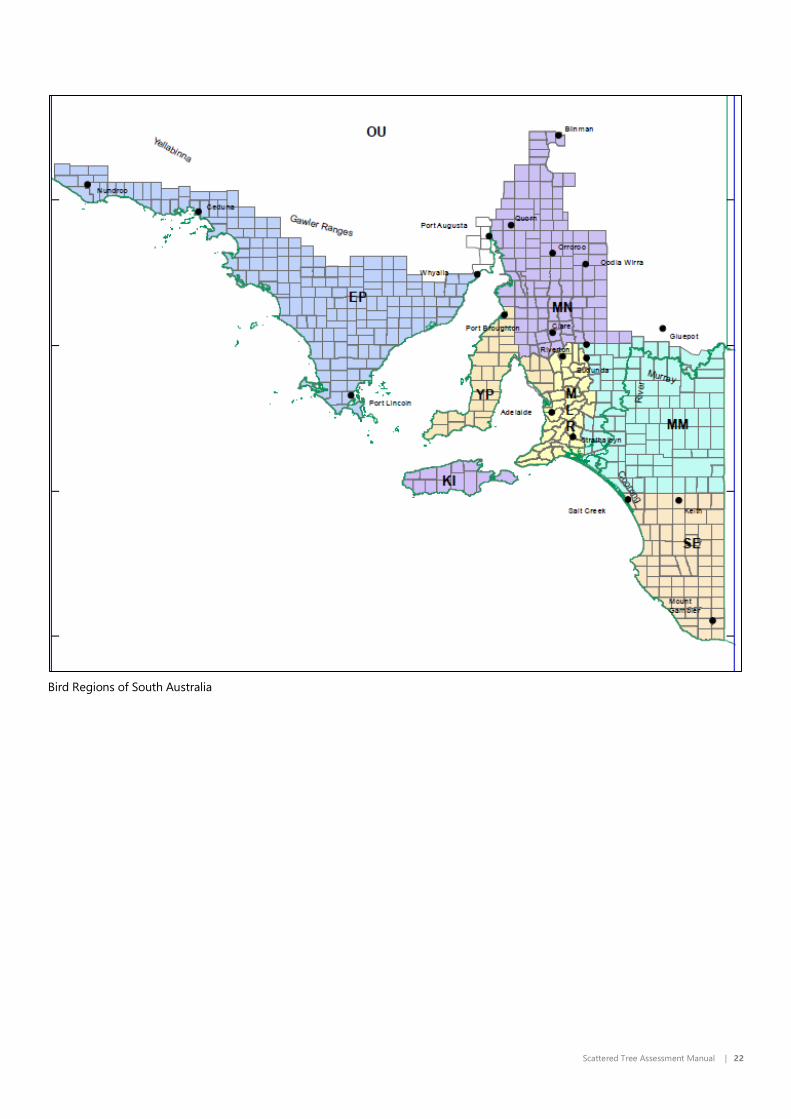
2019); EP=Eyre Peninsula; KI=Kangaroo Island; YP=Yorke Peninsula (includes Adelaide Plains); MN=Mid North; MM=Murray Mallee;
SE=South East; MLR=Mount Lofty Ranges; OU=Outback (out of Hundreds) – See Map of SA Bird Regions.
Resource Use: P=perching/roosting, N=nesting, H=using hollow for nesting/roosting, F=feeding
Habitat/status: s=seasonal (includes waterbirds using trees near seasonal wetlands, seasonal and nomadic species), w=woodland
birds that occasionally use adjacent scattered trees, r=species that can reside in scattered trees.
COMMON NAME Conservation status
Habitat/
EPBC
SA
NPW SA EP KI YP MN MM SE MLR OU
Resource
Use Status
Australian Shelduck LC NT LC LC LC LC LC VU RA H s
Pink-eared Duck LC NT LC RA LC LC LC RA LC H s
Maned Duck Australian
Wood Duck LC NT LC LC LC LC LC LC LC H s
Pacific Black Duck LC NT LC LC LC LC LC RA LC H s
Grey Teal LC LC LC LC LC LC LC LC LC H s
Royal Spoonbill LC NT RA LC LC RA RA VU RA P s
Yellow-billed Spoonbill NT NT RA NT NT RA RA VU RA P,N s
White-necked Heron NT NT NT NT RA NT VU RA P,N s
Great Egret LC NT RA LC LC RA RA VU RA P s
White-faced Heron LC LC LC LC LC LC LC LC LC P,N s
Little Pied Cormorant LC NT LC LC LC LC LC LC RA P s
Little Black Cormorant LC NT NT LC LC LC LC LC RA P s
Great Cormorant LC NT RA LC LC LC LC RA RA P s
Black-shouldered Kite LC NT LC LC LC LC LC LC LC P,N s
Square-tailed Kite E EN CR CR CR CR EN CR P s
Little Eagle V VU VU CR VU VU VU EN NT P w
Wedge-tailed Eagle LC RA LC VU LC LC NT LC LC P,N w
Grey Goshawk E CR CR CR CR P w
Brown Goshawk LC NT RA LC LC LC LC LC LC P,N w
Collared Sparrowhawk LC NT LC LC LC LC LC LC LC P,N w
Spotted Harrier LC VU RA RA NT NT RA RA LC P,N w/s
Black Kite LC NT RA LC LC NT RA LC P s
Whistling Kite LC EN EN RA LC NT VU LC P,N w
Crested Pigeon LC LC LC LC LC LC LC LC LC P,N w/r

19 | Scattered Tree Assessment Manual
COMMON NAME Conservation status
Resource
Use
Habitat/
EPBC
SA
NPW SA EP KI YP MN MM SE MLR OU
Status
Peaceful Dove LC VU RA NT LC NT VU LC P w
Black-eared Cuckoo NT NT EN NT NT RA EN RA P s
Horsfield's Bronze Cuckoo LC LC LC LC LC LC NT NT LC P s
Pallid Cuckoo NT NT VU RA NT NT RA NT P s
Masked Owl E EN CR CR CR EX EN P,H w
Eastern Barn Owl LC LC LC NT LC LC LC RA LC P,H r
Barking Owl R RA CR CR CR EX RA P,H w
Southern Boobook LC LC LC VU LC LC NT NT LC P,H w
Australian Owlet-nightjar LC LC VU VU LC LC NT RA LC H w
Laughing Kookaburra LC NT RA LC LC NT LC RA P,H w/r
Sacred Kingfisher NT RA RA RA NT NT NT NT RA P,H w
Red-backed Kingfisher LC NT VU LC RA LC P s
Rainbow Bee-eater LC LC VU RA LC LC NT VU LC P s
Nankeen Kestrel LC LC LC LC LC LC LC LC LC P,N w/r
Australian Hobby LC RA RA NT LC LC NT LC LC P,N w/r
Brown Falcon LC LC LC LC LC LC LC LC LC P,N w/r
Black Falcon R RA EN RA NT RA RA RA NT P,N s
Peregrine Falcon R RA VU VU EN RA RA RA RA VU P,H,N w/r
Sulphur-crested Cockatoo LC RA RA RA LC NT LC P,H w/r
Little Corella LC NT LC LC LC LC LC LC LC P,H w/r
Long-billed Corella LC LC P,H w/r
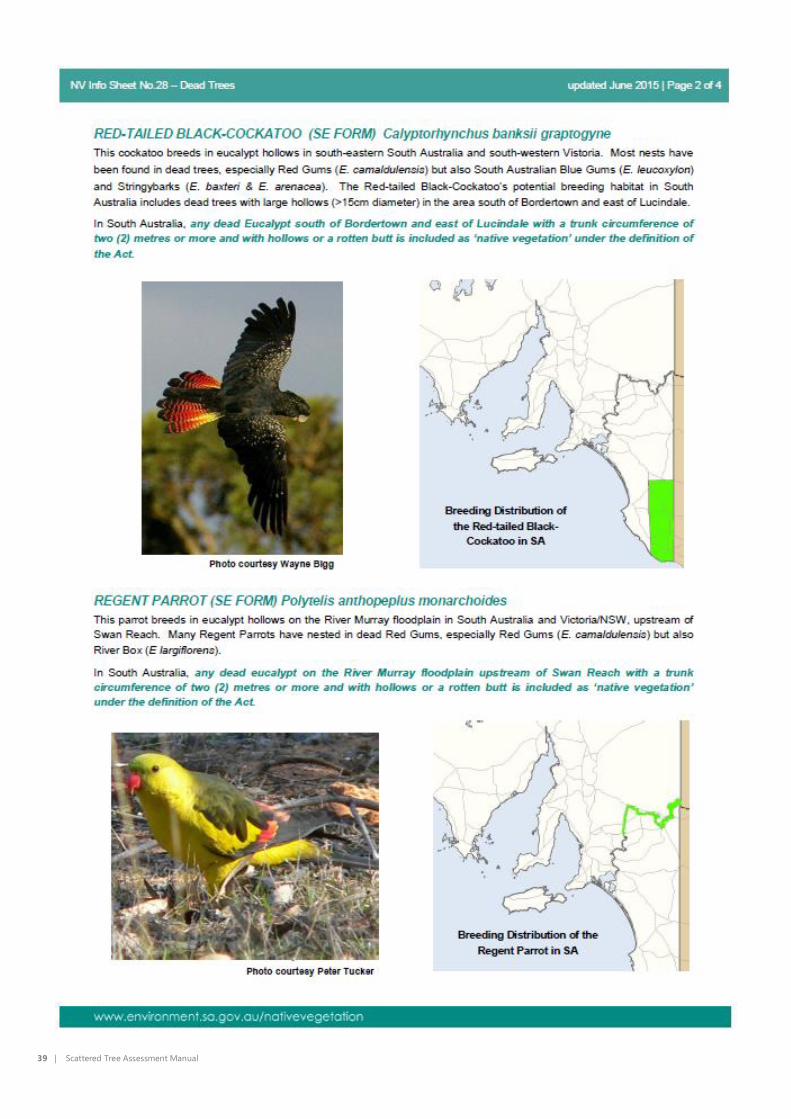
Red-tailed Black Cockatoo
(south-eastern subspecies) EN E EN EN P,H,F w
Glossy Black Cockatoo
(Kangaroo Island subspecies) EN E EN EX EN EX P,H w
Galah LC LC LC LC LC LC LC LC LC P,H w/r
Major Mitchell's Cockatoo R RA VU EX EX EN RA P,F w/r
Cockatiel LC RA RA NT RA RA RA LC P,H s
Yellow-tailed Black Cockatoo V VU CR VU VU VU VU P,H w
Australian Ringneck (eastern
subspecies) Mallee Ringneck NT VU NT NT NT RA NT P,H,F w
Australian Ringneck (western
subspecies) Port Lincoln
Ringneck LC LC LC P,H,F w
Musk Lorikeet LC VU LC NT LC LC LC P,H,F w/s
Swift Parrot CR E CR CR CR CR P,F s
Budgerigar LC NT RA LC NT RA RA LC P,H s
Blue-winged Parrot V VU VU VU VU VU VU VU P,H w
Elegant Parrot R RA RA RA RA RA RA RA VU RA P,H w
Bluebonnet LC NT VU RA NT EN VU LC P,H w
Purple-crowned Lorikeet NT NT NT NT NT NT NT NT NT P,H,F w/s
Little Lorikeet E EN EX EX CR EN EN CR P,H,F w/s
Crimson Rosella
LC
LC
LC
LC
LC
LC
LC
P,H,F
w/r

Scattered Tree Assessment Manual | 20
COMMON NAME Conservation status
Habitat/
EPBC
SA
NPW SA EP KI YP MN MM SE MLR OU
Resource
Use Status
Crimson Rosella (Mount
Lofty - Flinders Ranges form)
Adelaide Rosella LC LC LC LC LC P,H,F w/r
Crimson Rosella (River
Murray form) Yellow Rosella NT NT P,H,F w
Eastern Rosella LC LC LC LC LC P,H,F w/r
Regent Parrot (eastern
subspecies) VU V VU VU P,H w
Red-rumped Parrot LC RA NT LC LC LC NT NT P,H w/r
Mulga Parrot LC LC VU NT LC EX VU LC P,H w
Rainbow Lorikeet LC NT LC LC RA LC LC LC P,H,F w/s
Brown Treecreeper NT EN NT NT EN VU NT P,H w
Eastern Spinebill LC LC RA RA NT LC F w
New Holland Honeyeater LC LC LC LC LC LC LC LC P,F w
Striped Honeyeater R RA CR EN RA EX EX P,F w
Blue-faced Honeyeater R RA RA VU P,F w
Black-chinned Honeyeater V VU CR CR CR VU CR P,F w
Brown-headed Honeyeater LC LC LC NT NT LC NT NT NT P,F w
White-naped Honeyeater NT RA RA RA RA NT NT P,F w
Spiny-cheeked Honeyeater LC LC LC LC LC LC LC LC P,F w
Little Wattlebird LC LC LC LC LC LC P,F w
Red Wattlebird LC LC LC LC LC LC LC LC RA P,F w/r
Yellow-faced Honeyeater LC RA RA LC LC LC P,F w
Noisy Miner LC LC LC LC LC LC P,F w/r
Yellow-throated Miner LC LC LC LC LC VU P,F w
White-fronted Honeyeater LC LC RA LC LC RA RA LC P,F s
Singing Honeyeater LC LC LC LC LC LC LC LC P,F w
White-plumed Honeyeater LC RA LC LC LC LC LC LC P,N,F w/r
Spotted Pardalote (south-
eastern subspecies) NT NT EN NT NT P,F w/s
Spotted Pardalote (yellow-
rumped subspecies) Yellow-
rumped Pardalote NT NT NT NT RA NT NT NT NT P,F w
Striated Pardalote LC LC LC LC LC LC LC LC LC P,H,F w/s
Weebill LC LC NT LC LC NT LC LC P,F w
Western Gerygone R RA VU RA RA RA P,F s
White-throated Gerygone R RA RA RA RA P,F s
Chestnut-rumped Thornbill LC LC VU NT LC VU VU LC P,H,F w
Yellow-rumped Thornbill LC LC LC LC LC LC NT LC P,N w/r
Yellow Thornbill NT VU NT NT RA NT P,F w
Striated Thornbill LC LC LC LC LC P,F w
Southern Whiteface LC LC EN LC NT EN VU LC P,H w
Masked Woodswallow LC LC RA LC LC NT RA LC P s
White-browed Woodswallow NT NT RA NT NT NT RA NT P s

21 | Scattered Tree Assessment Manual
COMMON NAME Conservation status
Habitat/
EPBC
SA
NPW SA EP KI YP MN MM SE MLR OU
Resource
Use Status
Black-faced Woodswallow LC NT RA LC NT LC P w
Dusky Woodswallow LC LC LC RA NT LC NT RA NT P w
Australian Magpie LC LC LC LC LC LC LC LC LC P,N r
Black-faced Cuckooshrike LC LC LC LC LC LC LC LC LC P,N,F w
White-bellied Cuckooshrike R RA EN RA EN P,F w
White-winged Triller LC NT RA NT NT RA RA LC P,F s
Varied Sittella NT NT VU RA NT NT VU RA F w
Crested Shriketit R RA VU VU VU VU RA F w
Golden Whistler LC LC LC NT RA NT LC LC F w
Rufous Whistler LC LC RA LC NT NT NT LC P,F w/s
Grey Shrikethrush LC LC LC LC LC LC LC LC LC F w
Olive-backed Oriole R RA RA RA RA RA P,F s
Willie Wagtail LC LC LC LC LC LC LC NT LC P,N,F w/r
Grey Fantail LC LC LC NT LC LC LC LC RA P,F w
Magpielark LC LC LC LC LC LC LC LC LC P,N w/r
Forest Raven LC LC P,N w
Little Raven LC LC LC LC LC LC LC LC RA P,N w/r
Australian Raven LC LC NT VU LC NT LC LC P,N w
Jacky Winter NT NT EN RA NT RA P w
Jacky Winter (south-eastern
subspecies) R RA VU RA CR P w
Scarlet Robin R RA EN RA EN VU RA RA VU P w
Red-capped Robin LC LC VU NT LC EN RA LC P w
Welcome Swallow LC LC LC LC LC LC LC LC LC P s
Tree Martin LC LC LC NT LC LC LC NT LC P,H w/s
Rufous Songlark LC NT LC LC NT RA VU LC P s
Silvereye LC LC LC LC LC LC LC NT LC P,F w/s
Mistletoebird LC NT NT LC NT NT LC LC F w/s
Diamond Firetail V VU VU CR VU VU EN VU P,N w
Scattered Tree Assessment Manual | 22
Bird Regions of South Australia

23 | Scattered Tree Assessment Manual
Scattered Tree Assessment Manual | 24
25 | Scattered Tree Assessment Manual
Scattered Tree Assessment Manual | 26
27 | Scattered Tree Assessment Manual
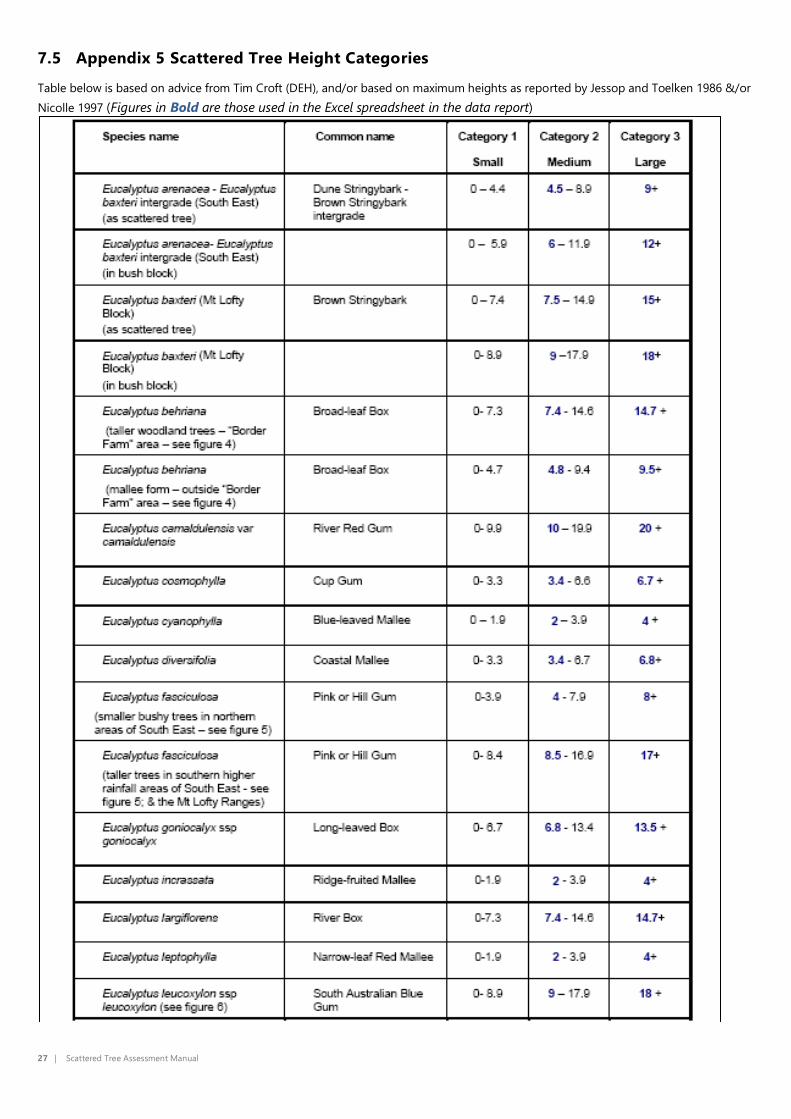
7.5 Appendix 5 Scattered Tree Height Categories
Table below is based on advice from Tim Croft (DEH), and/or based on maximum heights as reported by Jessop and Toelken 1986 &/or
Nicolle 1997 (Figures in Bold are those used in the Excel spreadsheet in the data report)

Scattered Tree Assessment Manual | 28

29 | Scattered Tree Assessment Manual

Scattered Tree Assessment Manual | 30
7.6 Appendix 6 Additional Information
There is additional information that may (although is optional) be collected in relation to scattered trees. This information is usefully in
determining the habitat value and health of the tree.
Additional data relating to hollows – South East region only
Collection of data to the key below is only if the tree in located in the Southeast Region and a large hollow has been identified.
LOCATION: br = in a branch,
Tr = in the trunk
HEIGHT: Record the height above ground level (in metres) of the hollow entrance
ORIENTATION: hor = horizontal branch (>45º from vertical),
vert = vertical branch (<45º from vertical),
POSITION: sp = spout: i.e. entrance of hollow at end of branch,
si = side: i.e. entrance of hollow along side of branch.
DIRECTION: (for vertical branches only):
high = entrance to hollow is at higher end of the branch,
low = entrance to hollow is at the lower end of branch
Note any additional information such as whether the hollows have more than one entrance. Be aware of fissures, dark patches
and depressions that look like hollows but aren’t.
Additional descriptive information
Record additional descriptive information. Note anything that may help determine what wildlife use the tree. Record the presence of
things such as:
Any evidence of wildlife use of tree, e.g. bird sightings, hollow use (i.e. animal in hollow or entrance edges well-worn), bird
dropping piles below tree, sugar glider feeding marks in bark etc,
The numbers and approximate size/shape of nests (small nests <20cm diameter, medium nests 21-50cm, and large nests
>50cm),
The number of hollows with feral bee hives in them,
The presence of native understorey species, weeds, intact soil crust etc, and
Note Aboriginally modified trees, as they are likely to have cultural heritage importance.
Mistletoe
Additional data relating to health
In addition to estimating % dieback, also record other factors that may be affecting tree health, e.g. record evidence of
damage caused by insects (borers, lerps, galls, defoliators etc), stock ring-barking, fire scars, split limbs, Mundulla Yellows,
Mistletoe or other diseases etc, and if possible estimate the % of affected leaves (e.g. for Mundulla Yellows estimate the % of
foliage affected, and whether it is the new leaves &/or old leaves, epicormic growth or non-epicormic growth that is affected).
Enter data in the appropriate data sheet column.
Dieback: Determine whether dieback is permanent or temporary (e.g. lerps, grasshoppers, fire are usually temporary) by
checking for the presence of insects, epicormic growth, and the condition of the bark etc, and subsequently record details of
the type of dieback as the NVMU assessment may use this information when deciding if the final tree score should be
modified to reflect the temporary nature of dieback. For example, an otherwise healthy tree, temporarily defoliated by
grasshoppers or fire will almost certainly recover, but would receive a low health score using the measure of foliage lost (i.e.
‘dieback’).
Epicormic growth: Record presence or absence of epicormic growth. Preferably it would be useful to record what % of the total
foliage is epicormic and the average length of any epicormic shoots (class intervals: <50cm, 50-100cm, and >100cm). Always
have normal leaves and epicormic growth adding up to 100% (unless you also record the % of dead brown leaves). Collection

31 | Scattered Tree Assessment Manual
of this additional information may eventually help determine whether there are better ways to reduce subjectivity and improve
the measurements of tree health, and/or amount of resources. Recording the presence of fruit also allows the option of
requiring an applicant to collect seed from those specific trees as a condition of consent.
Reproductive Performance: Score abundance in very general categories for buds (B), flowers (Fl), and fruits (Fr) where:
“0” = none
“+” = low (some amount present on only a few branchlets)
“++” = moderate (present on most branchlets but not as abundant as leaves)
“+++” = extensive (present on most branchlets and at least as numerous as leaves)

Scattered Tree Assessment Manual | 32
7.7 Appendix 7 Distribution of Differing Growth Forms of Eucalypts
Figure 1. Distribution of large form of Eucalyptus behriana in the South East of SA (Source: Tim Croft, DEH)
33 | Scattered Tree Assessment Manual
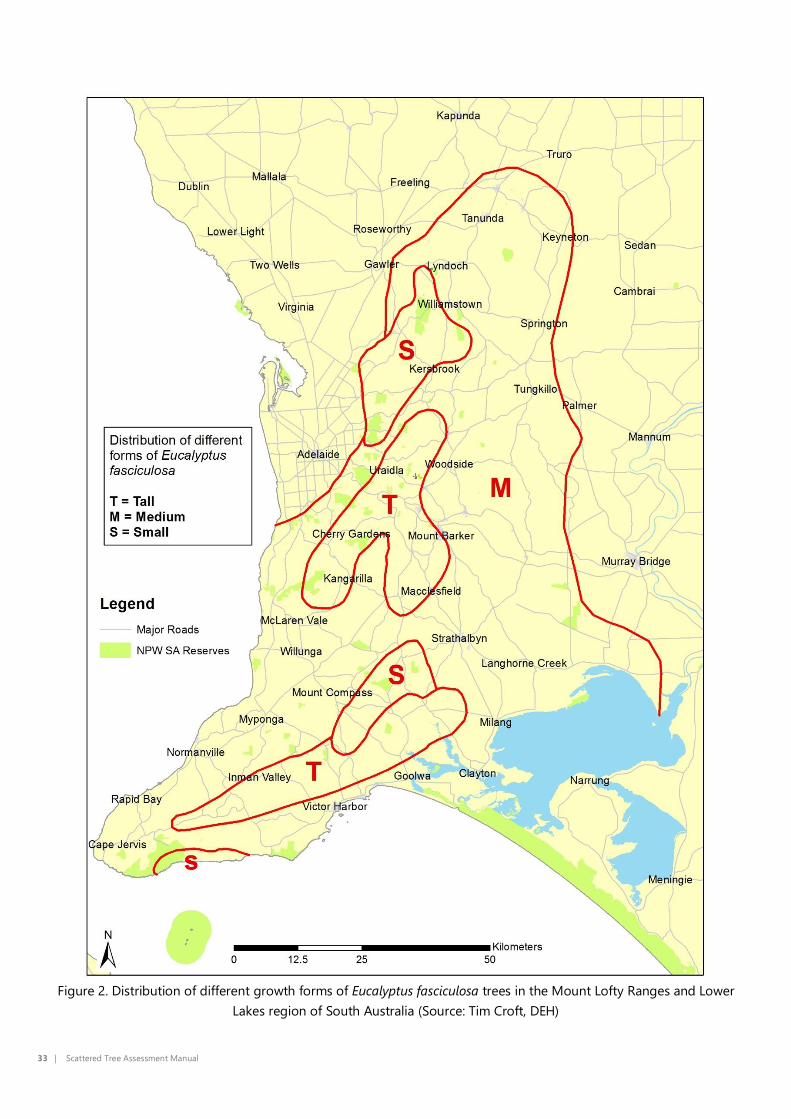
Figure 2. Distribution of different growth forms of Eucalyptus fasciculosa trees in the Mount Lofty Ranges and Lower
Lakes region of South Australia (Source: Tim Croft, DEH)

Scattered Tree Assessment Manual | 34
Figure 3. Distribution of different growth forms of Eucalyptus fasciculosa trees in the Southeast region of South Australia
(Source: Tim Croft, DEH)

35 | Scattered Tree Assessment Manual
Figure 4. Distribution of the four subspecies of Eucalyptus leucoxylon in the South East of South Australia.
(Source: Tim Croft, DEH)

Scattered Tree Assessment Manual | 36
Figure 5. Distribution of small form of Eucalyptus obliqua in the South East of South Australia
(Source: Tim Croft, DEH)
37 | Scattered Tree Assessment Manual
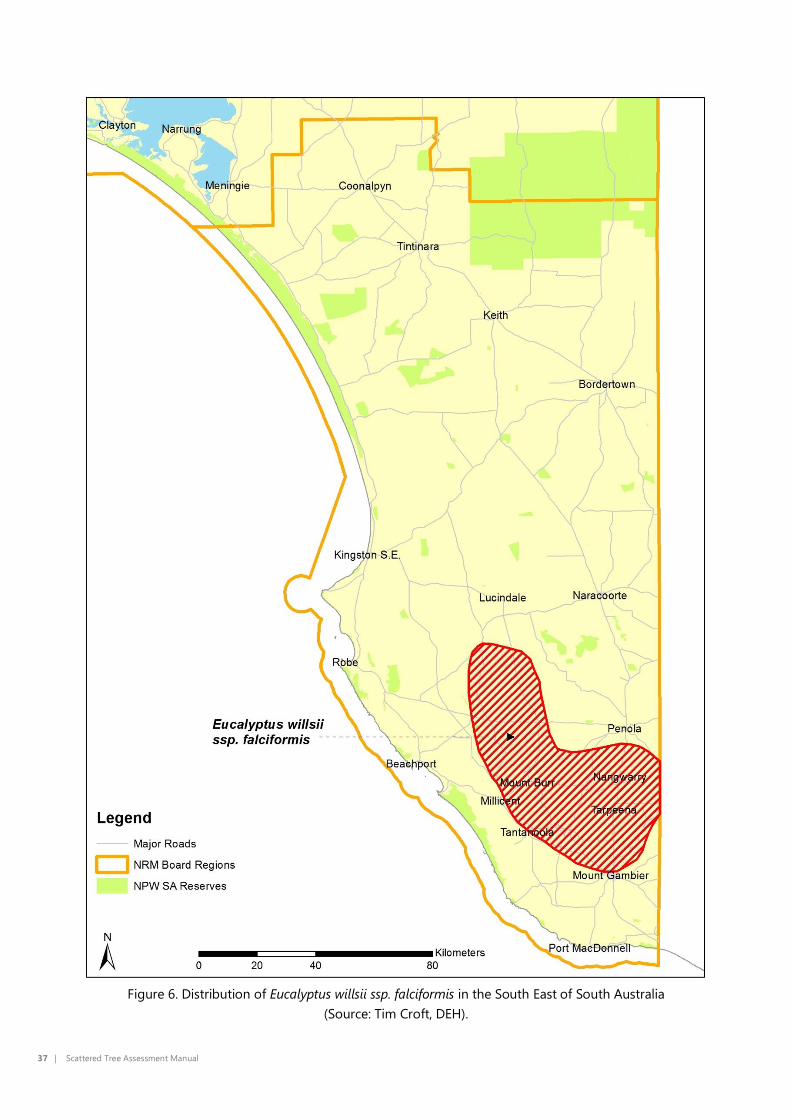
Figure 6. Distribution of Eucalyptus willsii ssp. falciformis in the South East of South Australia
(Source: Tim Croft, DEH).

Scattered Tree Assessment Manual | 38
7.8 Appendix 8 Dead Trees Included as Native Vegetation
39 | Scattered Tree Assessment Manual

Scattered Tree Assessment Manual | 40

41 | Scattered Tree Assessment Manual

Scattered Tree Assessment Manual | 42