Scaling up renewable energy deployment in island regions: insights and lessons
46
Scaling Up Renewable Energy Deployment in Island Regions: Insights and Lessons Webinar in Partnership with Leonardo Energy and The Clean Energy Regulators Initiative (CERI) 12 th of February 2015
-
Upload
european-copper-institute -
Category
Technology
-
view
860 -
download
1
Transcript of Scaling up renewable energy deployment in island regions: insights and lessons
Scaling Up Renewable Energy Deployment in Island Regions: Insights and Lessons Webinar in Partnership with Leonardo Energy and The Clean Energy Regulators Initiative (CERI) 12th of February 2015
Brief Bio
Toby Couture is Founder and Director of E3 Analytics, an international renewable energy consultancy based in Berlin. He has advised over thirty governments around the world on the economic, financial, and policy aspects of renewable energy development, including both in on-‐‑grid, off-‐‑grid, and island regions. Prior to founding E3 Analytics, Toby was Energy & Financial Markets Analyst at the U.S. National Renewable Energy Laboratory (NREL) in Colorado. He now lives and works in Berlin.
http://www.e3analytics.eu/
Overview
1. The Role of RE Targets
2. Designing Net Metering Policies in Island Regions
3. Designing Feed-‐‑in Tariff Policies in Island Regions
4. Utility-‐‑led Approaches to RE Development 5. Designing Bankable PPAs for Island Regions
6. Concluding Remarks
1. The Role of RE Targets
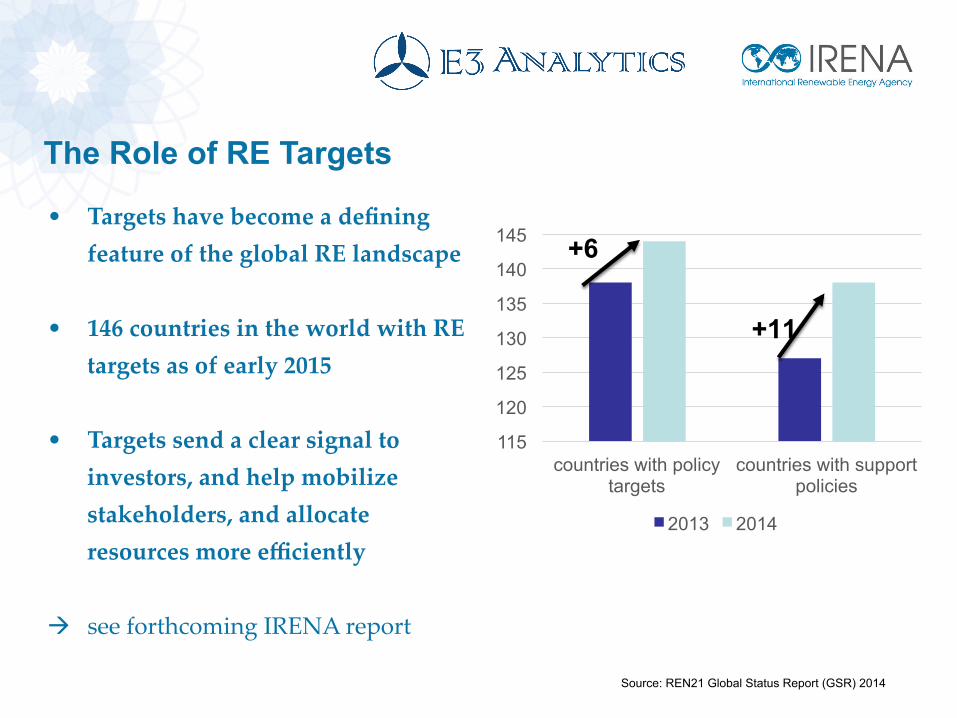
The Role of RE Targets
• Targets have become a defining feature of the global RE landscape
• 146 countries in the world with RE targets as of early 2015
• Targets send a clear signal to investors, and help mobilize stakeholders, and allocate resources more efficiently
à see forthcoming IRENA report
115
120
125
130
135
140
145
countries with policy targets
countries with support policies
2013 2014
+6
+11
Source: REN21 Global Status Report (GSR) 2014
Rationales for RE Targets
• Increasing energy security / Diversifying the fuel mix
• Reducing fossil fuel consumption • Improving energy access • Mitigating climate change and other
environmental risks (fuel spills) • Macro-‐‑economic benefits (i.e., job
creation) • Increasing private sector investment • Etc.
Island Regions and RE Targets
• A growing number of island regions in particular are adopting ambitious RE Targets: § Tokelau (100%) § Tuvalu (100%) § Cape Verde (50% -‐‑ 100%) § Samsø (100%) § El Hierro (100%) § Bonaire (100%) § Hawaii (40%) § Etc.
100% Report: h^p://bit.ly/1C9Bs9K Tokelau: h^p://ecogeneration.com.au/news/powering_the_pacific/078578/ Bonaire: h^p://www.edinenergy.org/bonaire.html
RE Targets
à In order to achieve targets, governments need clear policies, and strategies
Overview of Three Primary Policy Options
1. Net Metering/Net Billing
2. Feed-‐‑in Tariffs
3. Utility-‐‑led RE Development
2. Designing Net Metering Policies in Island Regions
Q: What is Net Metering?
Policy allowing customer-‐‑sited RE projects to produce electricity onsite to offset their onsite consumption. NM enables the customer to “run the meter backwards” by exporting power back to the grid. Typically does not involve a cash payment: credit only. Excess generation can typically be rolled over up to 12 months
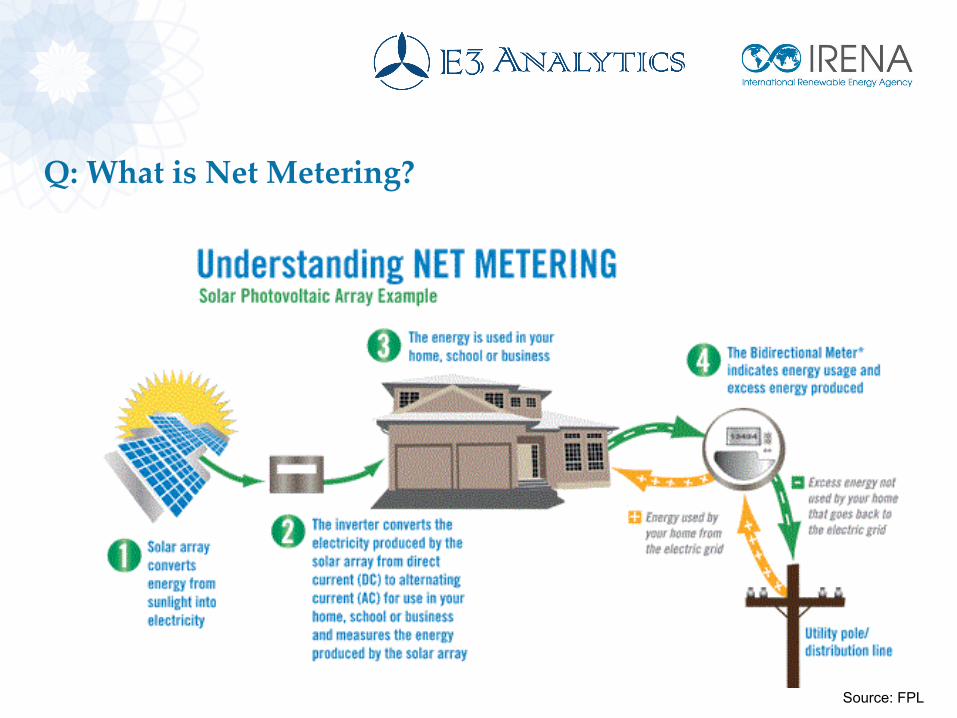
Q: What is Net Metering?
Source: FPL
What is the difference between Net Metering and Net Billing?
Net Metering: the same meter rolls backward, and the customer gets a credit at the same price as the electricity purchased.
à NM traditionally involved only one bi-‐‑directional meter
Net Billing: the rate at which customers are credited is different from the
rate they pay: can be higher or lower, or linked to time-‐‑of-‐‑day
à Net Billing traditionally involved two different meters (one to
meter consumption, the other to meter output)
Neither of these distinctions is universally applicable: too many
exceptions; terms are used in different ways.
Q: How to determine the appropriate rate to credit excess
generation under a Net Metering policy?
Three basic options:
1. Compensation below the retail rate (E.g. Palau @ 50% of avoided costs)
2. Compensation at the retail rate (E.g. Many U.S. States)
3. Compensation above the retail rate (E.g. Previous policy in Queensland, Australia @ AUS $0.44/kWh)
Q: How to determine the appropriate rate to credit excess
generation under a Net Metering policy?
Cost of distributed technologies such as solar PV are below retail rates + often below utilities’ avoided costs of generation
Many utilities and regulatory agencies are concerned that traditional
net metering may lead to “over-‐‑compensation” and/or cost-‐‑shifting
b/w customers
Q: Why should island utilities encourage customer-owned and
sited generation?
When customer-‐‑sited generation is:
1. cheaper than utility avoided costs and/or
2. when electricity tariffs are below cost recovery,
encouraging customer-‐‑owned and sited generation produces net
benefits (and savings) both to society and to the utility.
Q: “But, if I design a Net Metering
policy in an island with high retail
rates, won’t my customers “jump on
the bandwagon” and leave the
utility with decreasing revenues
with which to service fixed costs,
and potentially threaten the utility’s
solvency?”
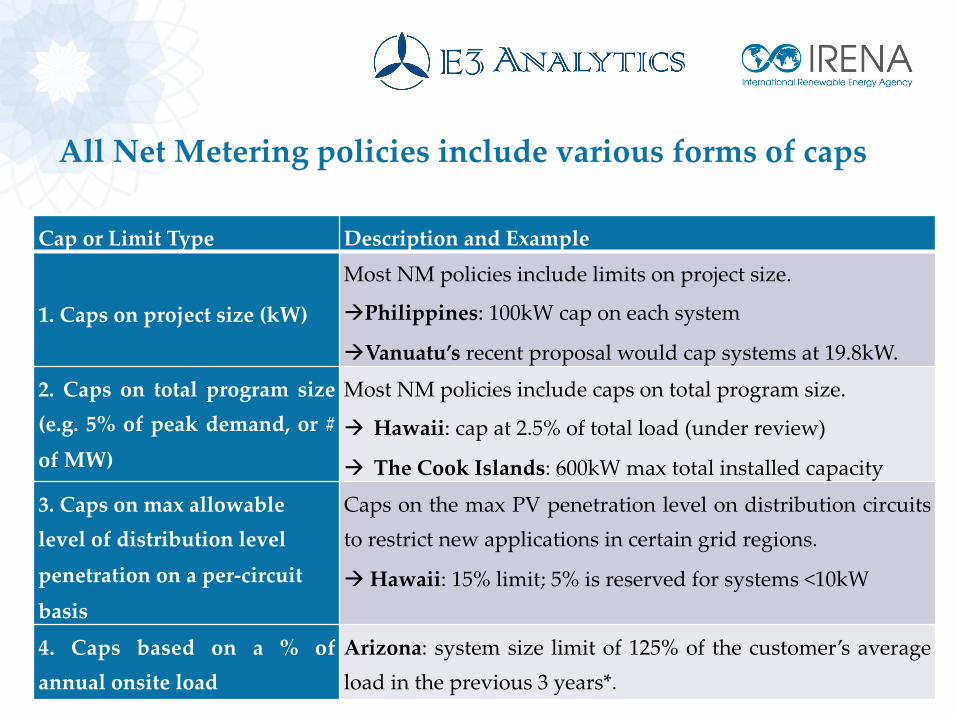
All Net Metering policies include various forms of caps
Cap or Limit Type Description and Example
1. Caps on project size (kW)
Most NM policies include limits on project size.
à Philippines: 100kW cap on each system
à Vanuatu’s recent proposal would cap systems at 19.8kW.
2. Caps on total program size (e.g. 5% of peak demand, or #
of MW)
Most NM policies include caps on total program size.
à Hawaii: cap at 2.5% of total load (under review)
à The Cook Islands: 600kW max total installed capacity
3. Caps on max allowable level of distribution level
penetration on a per-‐‑circuit
basis
Caps on the max PV penetration level on distribution circuits to restrict new applications in certain grid regions.
à Hawaii: 15% limit; 5% is reserved for systems <10kW
4. Caps based on a % of annual onsite load
Arizona: system size limit of 125% of the customer’s average load in the previous 3 years*.
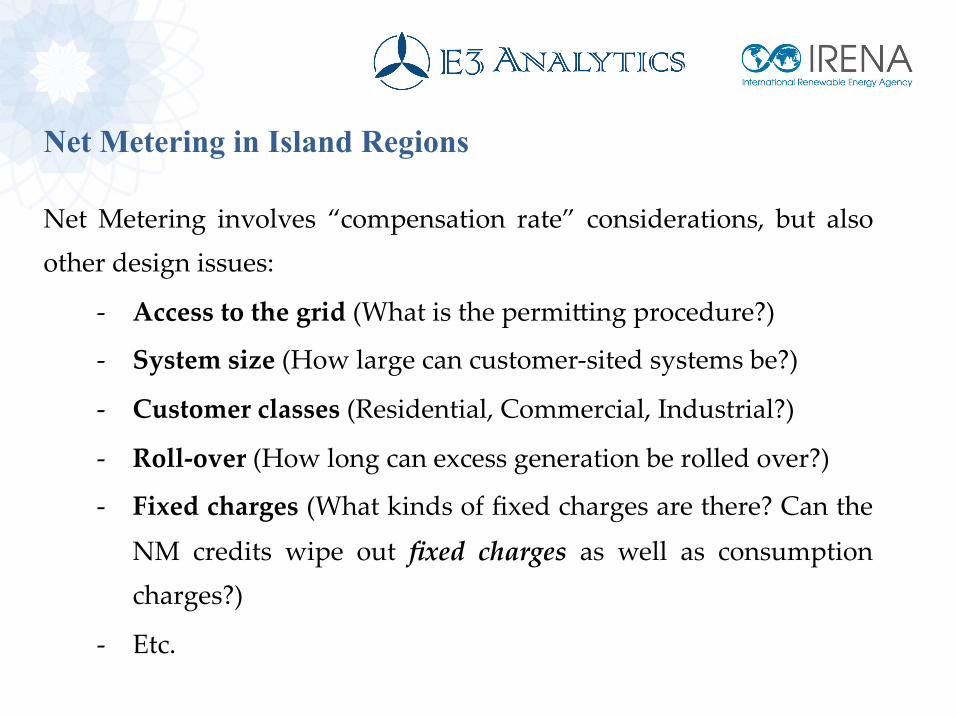
Net Metering in Island Regions
Net Metering involves “compensation rate” considerations, but also other design issues:
-‐‑ Access to the grid (What is the permi^ing procedure?)
-‐‑ System size (How large can customer-‐‑sited systems be?)
-‐‑ Customer classes (Residential, Commercial, Industrial?)
-‐‑ Roll-‐‑over (How long can excess generation be rolled over?)
-‐‑ Fixed charges (What kinds of fixed charges are there? Can the
NM credits wipe out fixed charges as well as consumption charges?)
-‐‑ Etc.
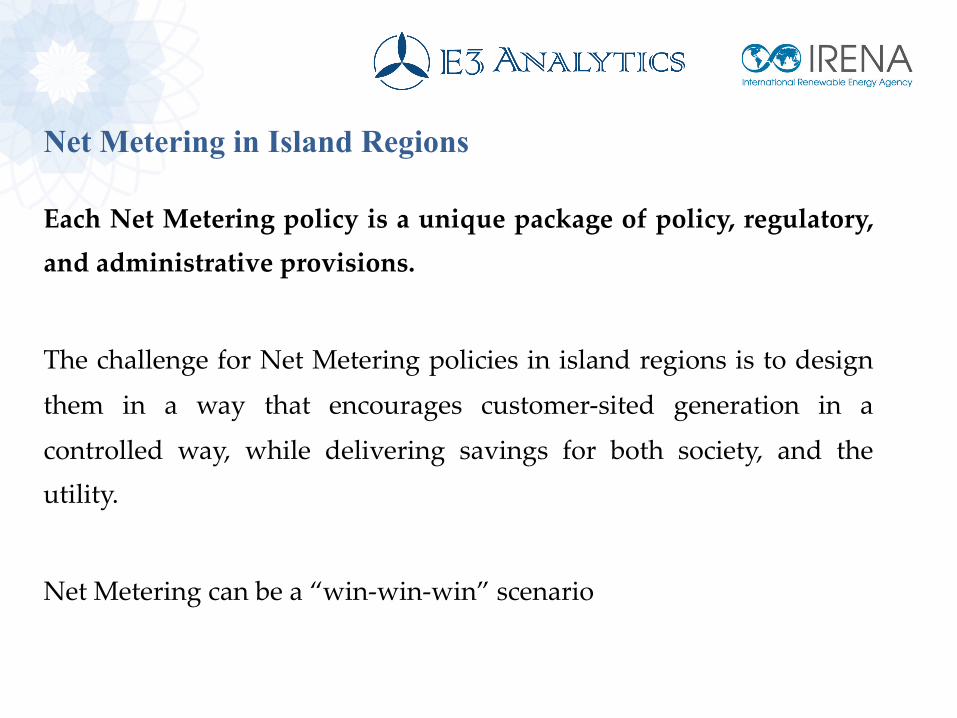
Net Metering in Island Regions
Each Net Metering policy is a unique package of policy, regulatory, and administrative provisions.
The challenge for Net Metering policies in island regions is to design
them in a way that encourages customer-‐‑sited generation in a
controlled way, while delivering savings for both society, and the utility.
Net Metering can be a “win-‐‑win-‐‑win” scenario
3. Designing FIT Policies in Island Regions
What are Feed-in Tariffs?
Three Key Elements:!!
!1. Clear price for electricity sold to the grid!!2. Clear, long-term contract!!3. Guaranteed access to the grid!
!à Payment for 100% of generation!
à 100% export-oriented: no self-consumption !
à Traditionally two separate meters; participants receive both a check and a bill!
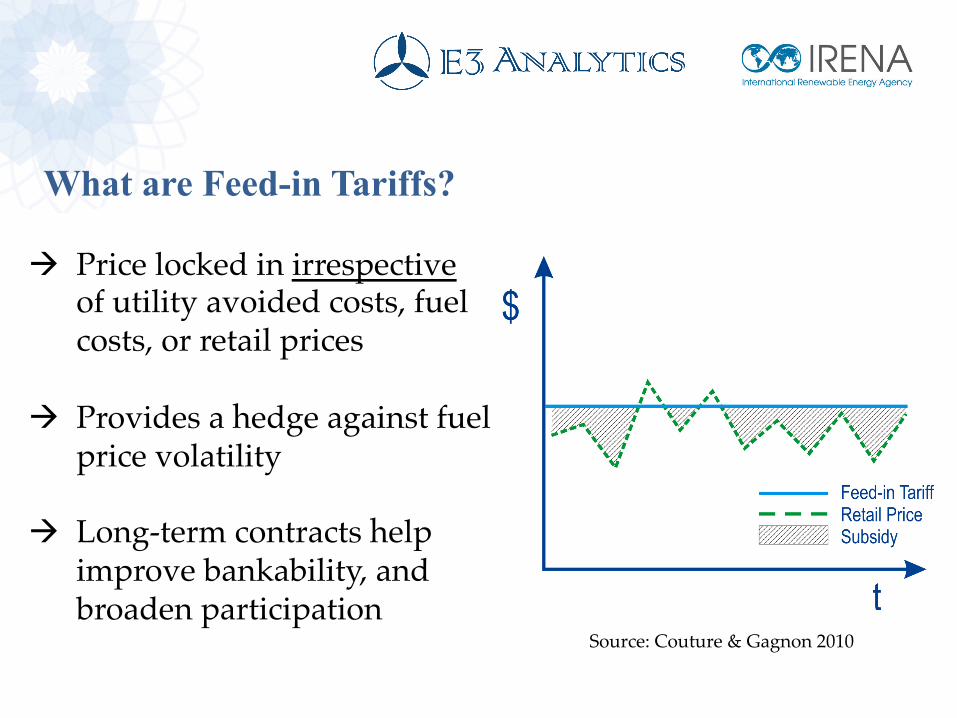
What are Feed-in Tariffs?
à Price locked in irrespective of utility avoided costs, fuel costs, or retail prices!
à Provides a hedge against fuel price volatility!
à Long-term contracts help improve bankability, and broaden participation!
! Source: Couture & Gagnon 2010
What are Feed-in Tariffs?
- FITs used in approximately 100 jurisdictions globally !
- Responsible for ~ 45% of global wind power investment!
- ~ 75% of global solar PV investment!!!!
Q: Why have FITs been successful?
FITs provide homeowners & investors what they need: !!à Attractive policy and regulatory conditions (stable LT
contracts) to invest in renewable energy projects!
à a clear cost-based price for electricity sold to the network over a pre-determined period!
à differentiated pricing by technology, and by project size, !
!
Q: “But, if I design a FIT policy in an
island state, won’t my customers all race
to become IPPs, gradually take over the
generation business, profit from long-
term contracts underwritten by the utility,
and leave the utility with decreasing
revenues with which to pay for fixed
costs and ensure system reliability?”
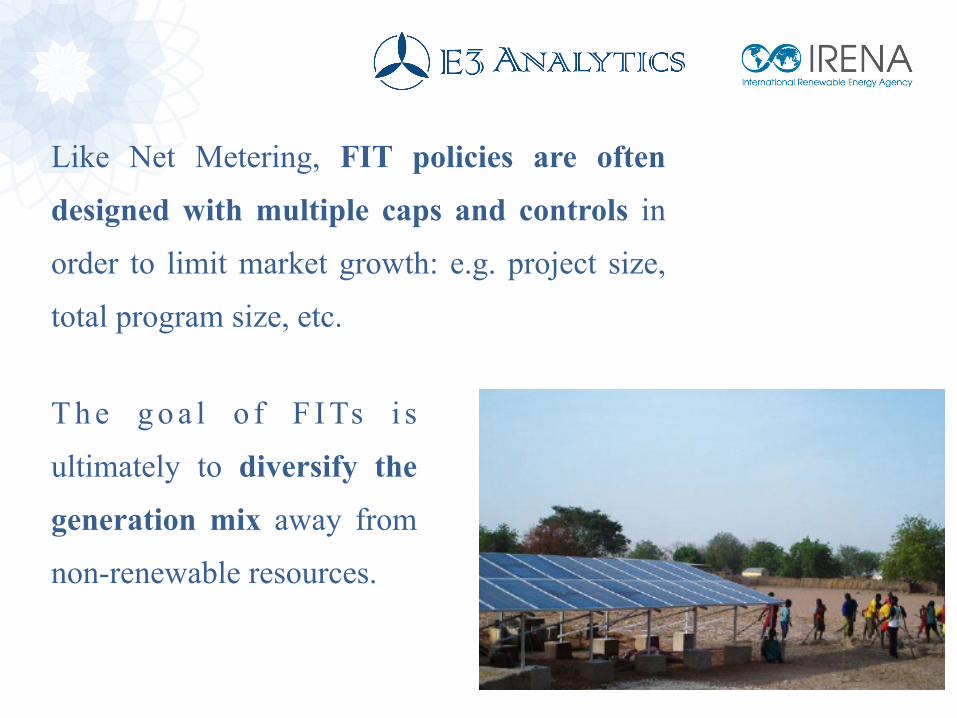
Like Net Metering, FIT policies are often
designed with multiple caps and controls in
order to limit market growth: e.g. project size,
total program size, etc.
T h e g o a l o f F I Ts i s
ultimately to diversify the
generation mix away from
non-renewable resources.
Q: Are FITs appropriate for island regions?
- Policy challenges can be limited through good policy design !
- Monitoring of project applications, and clear permitting procedures, can also eliminate the risks of runaway development!
!à As with all public policy, the keys are in the design, oversight, and overall structure of the policy. !
Q: How to set FIT rates for island regions with high avoided costs of generation?
Three basic options:
1. Based on the cost of generation: i.e. like traditional FITs
2. Based on the full utility avoided costs
3. Somewhere in between
Q: How to set FIT rates for island regions with high avoided costs of generation?
Examples:
• Virgin Islands: Recently adopted FIT policy directs the Public Service Commission to develop FIT rates. The PSC’s sets rates at a slight discount to the utility’s avoided cost of generation. The current anticipated rate is USD $0.26/kWh.
• Hawaii: FIT policy currently ranges from USD $0.189 to $0.218/kWh, depending on system size and is below generation costs but a^ractive for private investment.
• Grenada: “Standard Offer” Program: Customers can connect and receive one of two options: l 1) fixed FIT of USD $0.17/kWh over 10-‐‑yrs; or 2) per kWh payment based on the utility’s avoided fuel cost, adjusted annually
Q: Should the FIT rate be linked to utility avoided costs /
avoided fuel prices?
Pros: • Avoids the risk of locking in
high priced contracts if fuel prices decline (overpayment)
E.g. California (mid-‐‑1980s), fuel prices collapsed à utilities continue paying Standard Offer rates far higher than their avoided cost of supply
Cons: • Risk of increasing fuel
prices à Overpayment and “wealth transfer”
• Risk of decreasing fuel
prices à underpayment
Uncertainty to utilities and
customer/generators
Q: How to design FITs for island regions?
1. Include appropriate oversight of the project application and permitting process!
2. Introduce clear caps on total capacity installed!
3. Revise the tariffs regularly (e.g. annually) !
4. Implement a clear accounting and monitoring system!
Q: How to design FITs for island regions?
5. Publish annual reports on the progress of the policy (e.g. number of projects, total capacity installed, and total generation (MWh) supplied to the network, etc.) !!6. Include incentives for customer-sited storage systems to help smooth fluctuations in output and ease grid integration!!7. Enhance in-house forecasting capabilities!!8. Explore the use of “demand sinks”: e.g. desalination plants, heating/cooling loads, ice production, etc. to stabilize the grid and better align demand with supply!

4. Utility-‐‑led Models of Developing RE on Islands
Q: Rather than using a FIT or Net Metering, why don’t utilities in island regions build (or contract to own) renewable energy projects themselves?
Utility-led Models of RE Development
Three basic options:!!1. Utility-owned and Financed (privatized): !A private utility finances the construction of the RE project and owns the
underlying asset. Typically earns a regulated rate of return on the investment.
Operations and maintenance (O&M) can be performed by the utility, or via
subcontract with a maintenance provider.
Example: HECO in Hawaii!
Utility-led Models of RE Development
!2. Utility-owned and Financed (public): !A public utility finances the construction of the RE project and owns the
underlying asset. Operations and maintenance can be performed by the
utility, or via subcontract with a maintenance provider, or the original EPC
team.
Example: Electra in Cape Verde:
Utility-led Models of RE Development
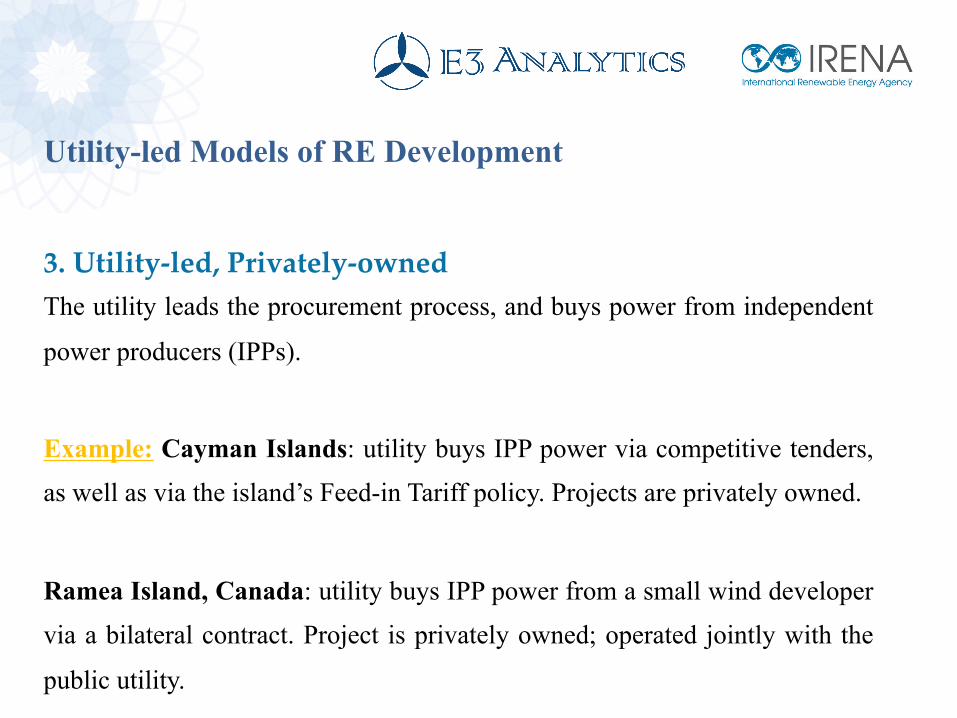
3. Utility-led, Privately-owned!The utility leads the procurement process, and buys power from independent
power producers (IPPs).
Example: Cayman Islands: utility buys IPP power via competitive tenders,
as well as via the island’s Feed-in Tariff policy. Projects are privately owned.
Ramea Island, Canada: utility buys IPP power from a small wind developer
via a bilateral contract. Project is privately owned; operated jointly with the
public utility.
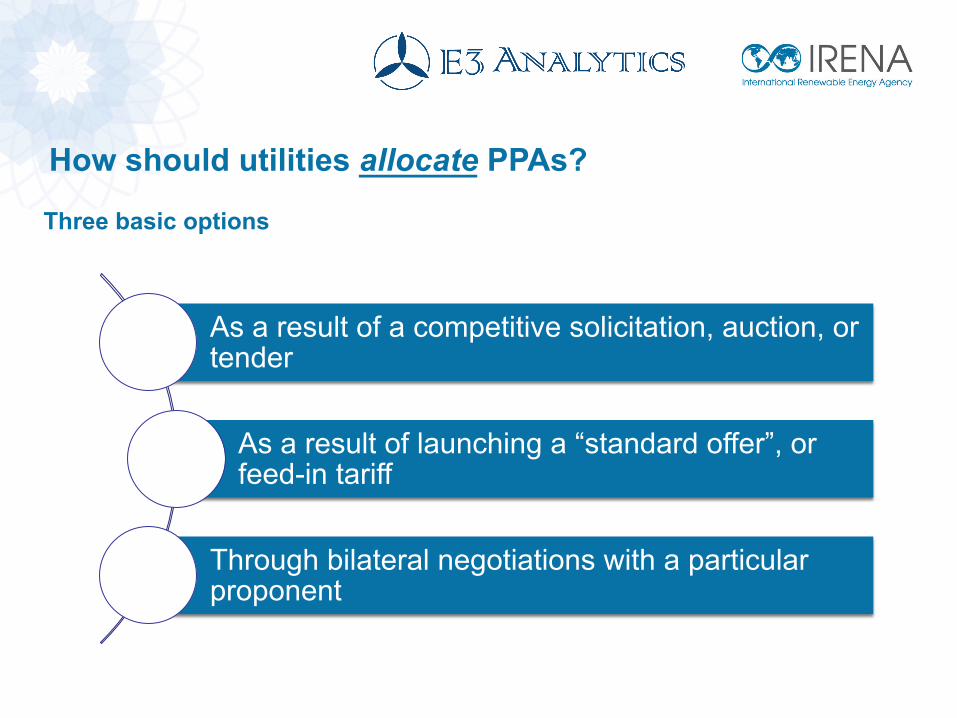
How should utilities allocate PPAs?
Three basic options
As a result of a competitive solicitation, auction, or tender
As a result of launching a “standard offer”, or feed-in tariff
Through bilateral negotiations with a particular proponent

5. Designing Bankable PPAs on Islands
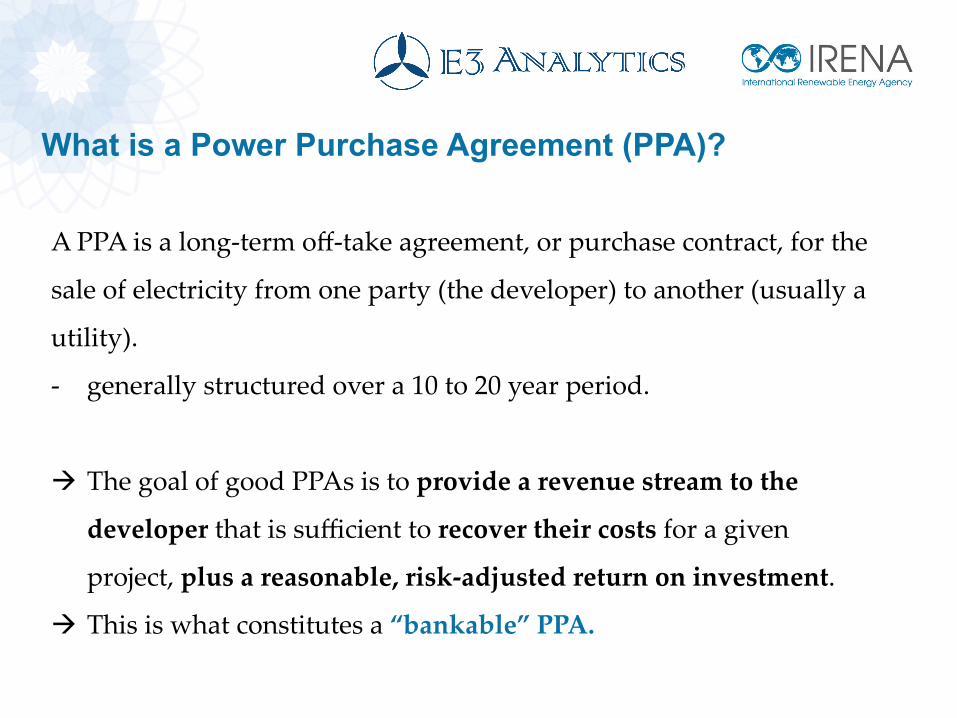
A PPA is a long-‐‑term off-‐‑take agreement, or purchase contract, for the
sale of electricity from one party (the developer) to another (usually a
utility).
-‐‑ generally structured over a 10 to 20 year period.
à The goal of good PPAs is to provide a revenue stream to the
developer that is sufficient to recover their costs for a given
project, plus a reasonable, risk-‐‑adjusted return on investment.
à This is what constitutes a “bankable” PPA.
What is a Power Purchase Agreement (PPA)?
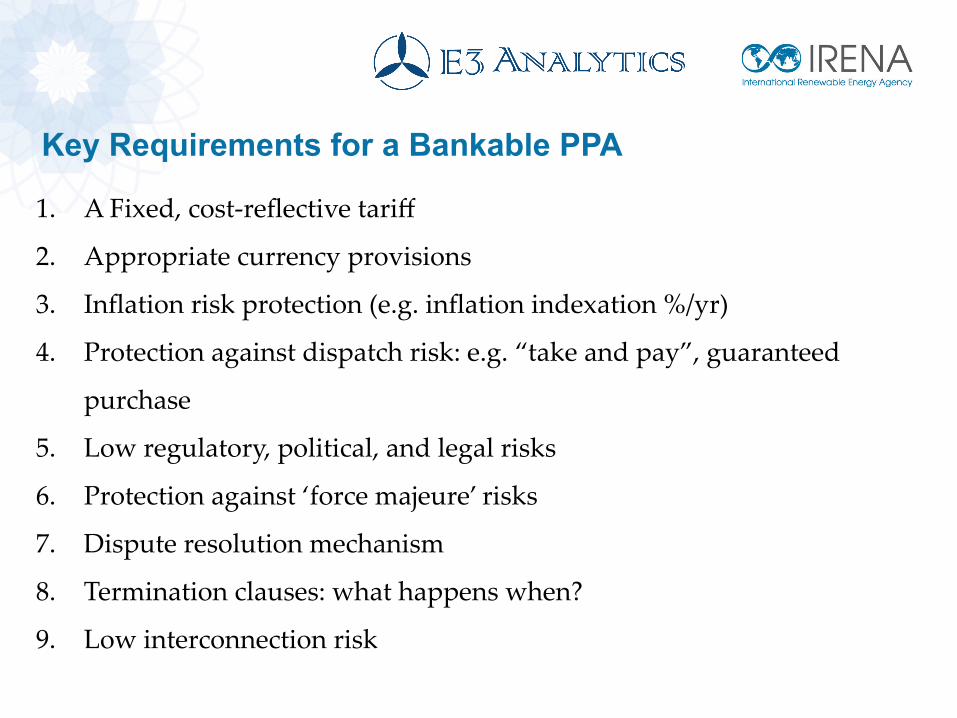
1. A Fixed, cost-‐‑reflective tariff
2. Appropriate currency provisions
3. Inflation risk protection (e.g. inflation indexation %/yr)
4. Protection against dispatch risk: e.g. “take and pay”, guaranteed
purchase
5. Low regulatory, political, and legal risks
6. Protection against ‘force majeure’ risks
7. Dispute resolution mechanism
8. Termination clauses: what happens when?
9. Low interconnection risk
Key Requirements for a Bankable PPA
Guidelines for Negotiating PPAs in Island Regions
1. Seek out other PPA contracts that have been signed, either in the region, or globally to compare
2. Identify and organize the contract clauses on a topical basis (e.g. grid connection, payment terms, liquidated damages, etc.)
3. Use the sample PPA contracts, and identify any clauses that are missing, or that need to be adapted to the local island context.
4. Hire an expert with experience in PPA design in island regions to either participate in the contract negotiations, to draft the original contract draft, or to review the final draft before it is signed

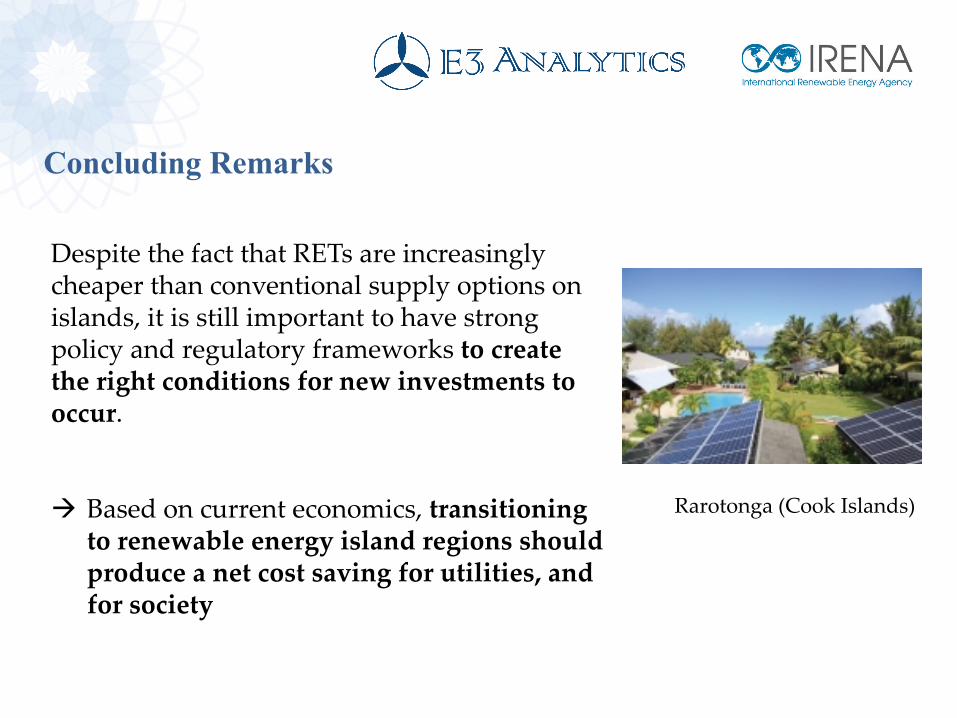
Concluding Remarks
Concluding Remarks
Despite the fact that RETs are increasingly cheaper than conventional supply options on islands, it is still important to have strong policy and regulatory frameworks to create the right conditions for new investments to occur. à Based on current economics, transitioning to renewable energy island regions should produce a net cost saving for utilities, and for society
Rarotonga (Cook Islands)

Thank you
Questions?