Scaling up real networks by geometric branching growth
10
APPLIED MATHEMATICS ECONOMIC SCIENCES Scaling up real networks by geometric branching growth Muhua Zheng a,b,c , Guillermo Garc´ ıa-P ´ erez d,e,f , Mari ´ an Bogu ˜ n´ a b,c , and M. ´ Angeles Serrano b,c,g,1 a School of Physics and Electronic Engineering, Jiangsu University, Zhenjiang 212013, China; b Departament de F´ ısica de la Mat ` eria Condensada, Universitat de Barcelona, 08028 Barcelona, Spain; c Universitat de Barcelona Institute of Complex Systems, Universitat de Barcelona, 08028 Barcelona, Spain; d Quantum Technology Finland Centre of Excellence, Turku Centre for Quantum Physics, Department of Physics and Astronomy, University of Turku, FI-20014 Turun Yliopisto, Finland; e Complex Systems Research Group, Department of Mathematics and Statistics, University of Turku, FI-20014 Turun Yliopisto, Finland; f Algorithmiq Ltd, 20100 Turku, Finland; and g Catalan Institution for Research and Advanced Studies (ICREA), 08010 Barcelona, Spain Edited by Sune Lehmann, Technical University of Denmark, Kongens Lyngby, Denmark, and accepted by Editorial Board Member David L. Donoho April 6, 2021 (received for review September 15, 2020) Real networks often grow through the sequential addition of new nodes that connect to older ones in the graph. However, many real systems evolve through the branching of fundamental units, whether those be scientific fields, countries, or species. Here, we provide empirical evidence for self-similar growth of network structure in the evolution of real systems—the journal-citation network and the world trade web—and present the geomet- ric branching growth model, which predicts this evolution and explains the symmetries observed. The model produces multi- scale unfolding of a network in a sequence of scaled-up replicas preserving network features, including clustering and commu- nity structure, at all scales. Practical applications in real instances include the tuning of network size for best response to external influence and finite-size scaling to assess critical behavior under random link failures. complex network | self-similarity | network evolution | geometric branching growth | geometric renormalization I n the context of network science, growth is most often modeled through the sequential addition of new nodes that connect to older ones in a graph by different attachment mechanisms (1, 2), including models of hidden variables, where nodes are char- acterized by intrinsic properties (3, 4). Other growth processes have also been considered, such as duplication to explain large- scale proteome evolution (5, 6). Here, we take an alternative approach and explore the relation between branching growth (7) and geometric renormalization (GR) (8) to explain self-similar network evolution. Renormalization in networks, based on the ideas of the renormalization group in statistical physics (9–11), acts as a sort of inverse branching process by coarse-graining nodes and rescaling interactions. Thus, branching growth can be seen as an inverse renormalization transformation: an idea that was introduced in ref. 12 using a purely topological approach to reproduce the structure of fractal networks, where fractality was interpreted as an evolutionary drive toward robustness. How- ever, topological distances in networks are seriously constrained by the small-world property, while the characterization of frac- tality in real networks disregards fundamental features of their structure, including clustering and community organization. GR (8) is an alternative technique that can be performed by virtue of the discovery that the structure of real networks is underlain by a latent hyperbolic geometry (13, 14). Thus, the likelihood of interactions between nodes depends on their dis- tances in the underlying space, via a universal connectivity law that operates at all scales and simultaneously encodes short- and long-range connections. This approach has been able to explain many features of the structure of real networks, includ- ing the small-world property, scale-free degree distributions, and clustering, as well as fundamental mechanisms such as prefer- ential attachment in growing networks (4) and the emergence of communities (15, 16). Given a network map, GR produces a multiscale unfolding of the network in scaled-down replicas over progressively longer length scales. This transformation has revealed self-similarity to be a ubiquitous symmetry in real net- works, whose structural properties remain scale-invariant as the observational resolution is decreased (8). This poses the question of whether this self-similarity could be related to the mechanisms driving the growth of real networks and, therefore, whether their evolution could be conceptualized within the framework of the GR group. In this work, we show that real networks—citations between scientific journals (17, 18) and international trade (19)—have evolved in a self-similar way over time spans of more than 100 y, meaning that their local, mesoscale, and global topological properties remain in a steady state as time goes by, with a mod- erate increase of the average degree. We demonstrate that the observations can be modeled by a geometric branching growth (GBG) process that produces a self-similar metric expansion. Beyond the capacity of the model to explain and predict the self-similar evolution of real networks effectively, the technique is flexible and allows us to generate scaled-up network repli- cas that, when combined with scaled-down network replicas (8), provide a full up-and-down self-similar multiscale unfolding of complex networks that covers both large and small scales. We illustrate the use of GBG multiscale unfolding in real network instances via the tuning of network size for optimal response to Significance Branching processes underpin the complex evolution of many real systems. However, network models typically describe net- work growth in terms of a sequential addition of nodes. Here, we measured the evolution of real networks—journal cita- tions and international trade—over a 100-y period and found that they grow in a self-similar way that preserves their struc- tural features over time. This observation can be explained by a geometric branching growth model that generates a mul- tiscale unfolding of the network by using a combination of branching growth and a hidden metric space approach. Our model enables multiple practical applications, including the detection of optimal network size for maximal response to an external influence and a finite-size scaling analysis of critical behavior. Author contributions: M. ´ A.S. designed research; M.Z., G.G.-P., M.B., and M. ´ A.S. per- formed research; M.Z., G.G.-P., M.B., and M. ´ A.S. analyzed data; and M.Z., G.G.-P., M.B., and M. ´ A.S. wrote the paper.y The authors declare no competing interest.y This article is a PNAS Direct Submission. S.L. is a guest editor invited by the Editorial Board.y Published under the PNAS license.y 1 To whom correspondence may be addressed. Email: [email protected].y This article contains supporting information online at https://www.pnas.org/lookup/suppl/ doi:10.1073/pnas.2018994118/-/DCSupplemental.y Published May 18, 2021. PNAS 2021 Vol. 118 No. 21 e2018994118 https://doi.org/10.1073/pnas.2018994118 | 1 of 10 Downloaded at Universitat de Barcelona on May 18, 2021
Transcript of Scaling up real networks by geometric branching growth

APP
LIED
MA
THEM
ATI
CSEC
ON
OM
ICSC
IEN
CES
Scaling up real networks by geometricbranching growthMuhua Zhenga,b,c , Guillermo Garcıa-Perezd,e,f , Marian Bogunab,c , and M. Angeles Serranob,c,g,1
aSchool of Physics and Electronic Engineering, Jiangsu University, Zhenjiang 212013, China; bDepartament de Fısica de la Materia Condensada, Universitatde Barcelona, 08028 Barcelona, Spain; cUniversitat de Barcelona Institute of Complex Systems, Universitat de Barcelona, 08028 Barcelona, Spain; dQuantumTechnology Finland Centre of Excellence, Turku Centre for Quantum Physics, Department of Physics and Astronomy, University of Turku, FI-20014 TurunYliopisto, Finland; eComplex Systems Research Group, Department of Mathematics and Statistics, University of Turku, FI-20014 Turun Yliopisto, Finland;fAlgorithmiq Ltd, 20100 Turku, Finland; and gCatalan Institution for Research and Advanced Studies (ICREA), 08010 Barcelona, Spain
Edited by Sune Lehmann, Technical University of Denmark, Kongens Lyngby, Denmark, and accepted by Editorial Board Member David L. Donoho April 6,2021 (received for review September 15, 2020)
Real networks often grow through the sequential addition of newnodes that connect to older ones in the graph. However, manyreal systems evolve through the branching of fundamental units,whether those be scientific fields, countries, or species. Here, weprovide empirical evidence for self-similar growth of networkstructure in the evolution of real systems—the journal-citationnetwork and the world trade web—and present the geomet-ric branching growth model, which predicts this evolution andexplains the symmetries observed. The model produces multi-scale unfolding of a network in a sequence of scaled-up replicaspreserving network features, including clustering and commu-nity structure, at all scales. Practical applications in real instancesinclude the tuning of network size for best response to externalinfluence and finite-size scaling to assess critical behavior underrandom link failures.
complex network | self-similarity | network evolution | geometricbranching growth | geometric renormalization
In the context of network science, growth is most often modeledthrough the sequential addition of new nodes that connect to
older ones in a graph by different attachment mechanisms (1,2), including models of hidden variables, where nodes are char-acterized by intrinsic properties (3, 4). Other growth processeshave also been considered, such as duplication to explain large-scale proteome evolution (5, 6). Here, we take an alternativeapproach and explore the relation between branching growth (7)and geometric renormalization (GR) (8) to explain self-similarnetwork evolution. Renormalization in networks, based on theideas of the renormalization group in statistical physics (9–11),acts as a sort of inverse branching process by coarse-grainingnodes and rescaling interactions. Thus, branching growth can beseen as an inverse renormalization transformation: an idea thatwas introduced in ref. 12 using a purely topological approach toreproduce the structure of fractal networks, where fractality wasinterpreted as an evolutionary drive toward robustness. How-ever, topological distances in networks are seriously constrainedby the small-world property, while the characterization of frac-tality in real networks disregards fundamental features of theirstructure, including clustering and community organization.
GR (8) is an alternative technique that can be performed byvirtue of the discovery that the structure of real networks isunderlain by a latent hyperbolic geometry (13, 14). Thus, thelikelihood of interactions between nodes depends on their dis-tances in the underlying space, via a universal connectivity lawthat operates at all scales and simultaneously encodes short-and long-range connections. This approach has been able toexplain many features of the structure of real networks, includ-ing the small-world property, scale-free degree distributions, andclustering, as well as fundamental mechanisms such as prefer-ential attachment in growing networks (4) and the emergenceof communities (15, 16). Given a network map, GR producesa multiscale unfolding of the network in scaled-down replicas
over progressively longer length scales. This transformation hasrevealed self-similarity to be a ubiquitous symmetry in real net-works, whose structural properties remain scale-invariant as theobservational resolution is decreased (8). This poses the questionof whether this self-similarity could be related to the mechanismsdriving the growth of real networks and, therefore, whether theirevolution could be conceptualized within the framework of theGR group.
In this work, we show that real networks—citations betweenscientific journals (17, 18) and international trade (19)—haveevolved in a self-similar way over time spans of more than 100y, meaning that their local, mesoscale, and global topologicalproperties remain in a steady state as time goes by, with a mod-erate increase of the average degree. We demonstrate that theobservations can be modeled by a geometric branching growth(GBG) process that produces a self-similar metric expansion.Beyond the capacity of the model to explain and predict theself-similar evolution of real networks effectively, the techniqueis flexible and allows us to generate scaled-up network repli-cas that, when combined with scaled-down network replicas (8),provide a full up-and-down self-similar multiscale unfolding ofcomplex networks that covers both large and small scales. Weillustrate the use of GBG multiscale unfolding in real networkinstances via the tuning of network size for optimal response to
Significance
Branching processes underpin the complex evolution of manyreal systems. However, network models typically describe net-work growth in terms of a sequential addition of nodes. Here,we measured the evolution of real networks—journal cita-tions and international trade—over a 100-y period and foundthat they grow in a self-similar way that preserves their struc-tural features over time. This observation can be explained bya geometric branching growth model that generates a mul-tiscale unfolding of the network by using a combination ofbranching growth and a hidden metric space approach. Ourmodel enables multiple practical applications, including thedetection of optimal network size for maximal response to anexternal influence and a finite-size scaling analysis of criticalbehavior.
Author contributions: M.A.S. designed research; M.Z., G.G.-P., M.B., and M.A.S. per-formed research; M.Z., G.G.-P., M.B., and M.A.S. analyzed data; and M.Z., G.G.-P., M.B.,and M.A.S. wrote the paper.y
The authors declare no competing interest.y
This article is a PNAS Direct Submission. S.L. is a guest editor invited by the EditorialBoard.y
Published under the PNAS license.y1 To whom correspondence may be addressed. Email: [email protected]
This article contains supporting information online at https://www.pnas.org/lookup/suppl/doi:10.1073/pnas.2018994118/-/DCSupplemental.y
Published May 18, 2021.
PNAS 2021 Vol. 118 No. 21 e2018994118 https://doi.org/10.1073/pnas.2018994118 | 1 of 10
Dow
nloa
ded
at U
nive
rsita
t de
Bar
celo
na o
n M
ay 1
8, 2
021
an external influence, referred to here as “the optimal mass,” anda finite-size scaling analysis of critical behavior under randomlink failures.
Self-Similar Evolution of Real NetworksWe consider the evolution of the journal-citation network (JCN)(17) and of the world trade web (WTW) (19) over time spans ofmore than 100 years.
The evolution of JCNs offers a quantitative proxy for thedevelopment of contemporary science and the emergence of avast number of new scientific fields and subfields, driven by diver-sification and specialization (17, 18, 20–22). Here, we analyzedata from ref. 17, where the time period 1900–2013 is dividedinto time windows of 10 y before 1970 and of 5 y thereafter. Onecitation network is reconstructed for each time window, wherejournals are represented as nodes that are linked whenevercitations between their publications exist.
An increase of the number of actors is also a hallmark ofthe evolution of the international trade system. The number ofsovereign states in the world increased from 42 in 1900 to 195in 2016 (23), mainly due to processes such as decolonization;the dismantlement of large or multicultural states such as theUSSR and Yugoslavia (1991) into a number of smaller states;the parliamentary split of an existing state into two, as hap-pened in Czechoslovakia (1993); and independence processesafter civil wars, like that of the Republic of South Sudan andthe Republic of the Sudan (2011). Here, we use networks inthe World Trade Atlas (19), a collection of annual world tradenetwork maps in hyperbolic geometry, which provide informa-tion on the long-term evolution of the international trade systemfrom 1870 to 2013, where nodes represent countries linked bybilateral trade relationships. The maps revealed that globaliza-tion, hierarchization, and localization are main forces shapingthe trade space, which naturally exhibits hyperbolic geometry,rather than Euclidean, as a reflection of its complex architecture.
More details of the two datasets are available in SI Appendix,section I, and the main statistical properties are in SI Appendix,Tables S1 and S2.
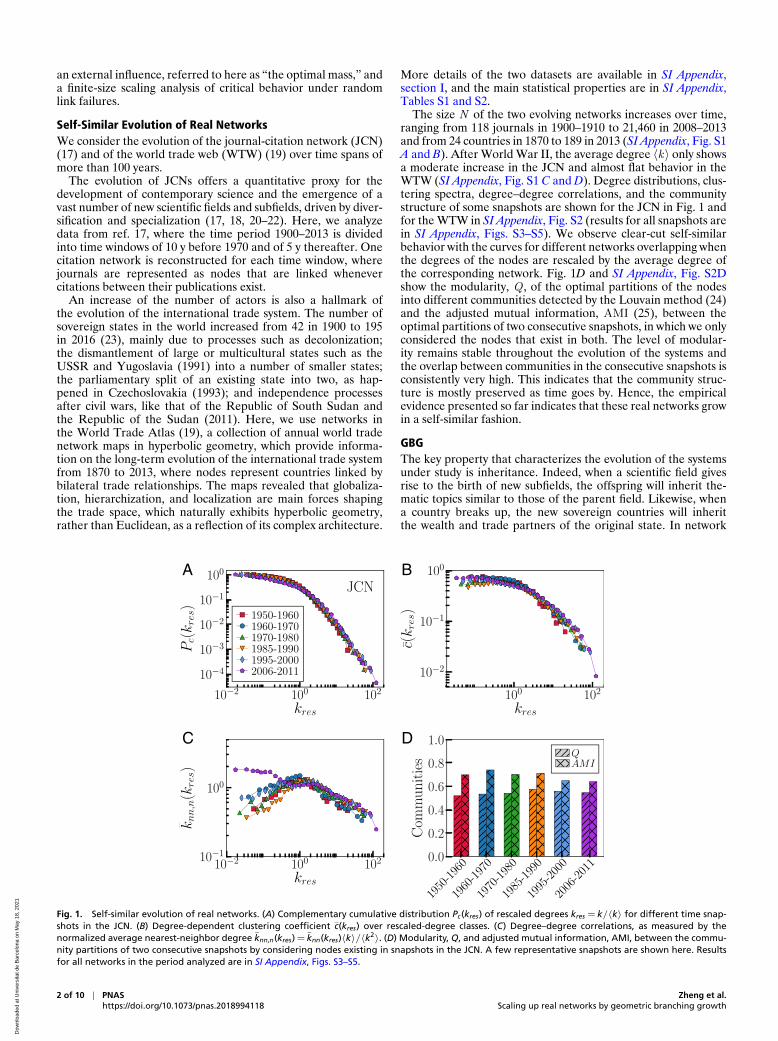
The size N of the two evolving networks increases over time,ranging from 118 journals in 1900–1910 to 21,460 in 2008–2013and from 24 countries in 1870 to 189 in 2013 (SI Appendix, Fig. S1A and B). After World War II, the average degree 〈k〉 only showsa moderate increase in the JCN and almost flat behavior in theWTW (SI Appendix, Fig. S1 C and D). Degree distributions, clus-tering spectra, degree–degree correlations, and the communitystructure of some snapshots are shown for the JCN in Fig. 1 andfor the WTW in SI Appendix, Fig. S2 (results for all snapshots arein SI Appendix, Figs. S3–S5). We observe clear-cut self-similarbehavior with the curves for different networks overlapping whenthe degrees of the nodes are rescaled by the average degree ofthe corresponding network. Fig. 1D and SI Appendix, Fig. S2Dshow the modularity, Q , of the optimal partitions of the nodesinto different communities detected by the Louvain method (24)and the adjusted mutual information, AMI (25), between theoptimal partitions of two consecutive snapshots, in which we onlyconsidered the nodes that exist in both. The level of modular-ity remains stable throughout the evolution of the systems andthe overlap between communities in the consecutive snapshots isconsistently very high. This indicates that the community struc-ture is mostly preserved as time goes by. Hence, the empiricalevidence presented so far indicates that these real networks growin a self-similar fashion.
GBGThe key property that characterizes the evolution of the systemsunder study is inheritance. Indeed, when a scientific field givesrise to the birth of new subfields, the offspring will inherit the-matic topics similar to those of the parent field. Likewise, whena country breaks up, the new sovereign countries will inheritthe wealth and trade partners of the original state. In network
A B
C D
Fig. 1. Self-similar evolution of real networks. (A) Complementary cumulative distribution Pc(kres) of rescaled degrees kres = k/〈k〉 for different time snap-shots in the JCN. (B) Degree-dependent clustering coefficient c(kres) over rescaled-degree classes. (C) Degree–degree correlations, as measured by thenormalized average nearest-neighbor degree knn,n(kres) = knn(kres)〈k〉/〈k2〉. (D) Modularity, Q, and adjusted mutual information, AMI, between the commu-nity partitions of two consecutive snapshots by considering nodes existing in snapshots in the JCN. A few representative snapshots are shown here. Resultsfor all networks in the period analyzed are in SI Appendix, Figs. S3–S5.
2 of 10 | PNAShttps://doi.org/10.1073/pnas.2018994118
Zheng et al.Scaling up real networks by geometric branching growth
Dow
nloa
ded
at U
nive
rsita
t de
Bar
celo
na o
n M
ay 1
8, 2
021

APP
LIED
MA
THEM
ATI
CSEC
ON
OM
ICSC
IEN
CES
terms, this means that when a node belonging to a given com-munity splits, offspring nodes most likely will belong to thesame community establishing relations preferentially with simi-lar partners. In addition, the degree of a node can be consideredas a proxy of its wealth. Thus, when a node splits, we expectthat its ability to generate connections will be partially inheritedby the newborn offspring. Following these principles, we intro-duce a model for network evolution that is able to incorporateinheritance while preserving the self-similarity observed in realsystems.
The model is based on a geometric description of networksthat provides a simple and accurate explanation for the observedregularities in real systems (26). Such representation assigns twocoordinates to every node in a real network, one related to itssimilarity to other nodes and another to its degree (13), so itseems particularly suited for our problem. The combination ofthe two components leads to hyperbolic space as the naturalgeometry underlying the hierarchical architecture of networks(27). The GBG mechanism that we propose here splits existing
nodes into offspring that are placed in a close neighborhood oftheir parent’s node location in the underlying space. In this way,newborn nodes automatically inherit structural properties oftheir parent node effectively encoded in the similarity and popu-larity coordinates that determine their connections in the evolvednetwork. By iterative application, the GBG transformation pro-duces, thus, a self-similar multiscale unfolding of the network ina shell of scaled-up replicas of progressively increasing size. Thismechanism is illustrated in Fig. 2A, where the similarity subspaceis represented as a circle, and the size of the node is related to itsdegree. In the next subsection, we briefly explain the basics of thegeometric description of networks before introducing the GBGmodel.
Geometric Description of Complex Networks. The GBG modelintroduced in this work is built upon a geometric description ofcomplex networks, which is very well described by the S1 model(13). The S1 model is a hidden-variables model, meaning thatnodes are assigned attributes that modulate the likelihood of
Fig. 2. Sketch of the GBG model. (A) In each layer of the self-similar upwards multiscale unfolding, the size of each node is proportional to thelogarithm of its hidden degree, κ. Different colors represent different geometric communities. Dashed lines connect ancestors to their descendantsalong the flow (blue arrows). A pair of nodes, i and j, with hidden degrees κi and κj has been highlighted, for which the angular separation, ∆θij ,represents their similarity distance. In A, Inset, we show a sketch of the branching process from an ancestor to its pair of descendants. The com-plementary cumulative distribution of z values together with their corresponding stable distribution fittings are in B for JCN 1965–1975 and in Cfor WTW 1965.
Zheng et al.Scaling up real networks by geometric branching growth
PNAS | 3 of 10https://doi.org/10.1073/pnas.2018994118
Dow
nloa
ded
at U
nive
rsita
t de
Bar
celo
na o
n M
ay 1
8, 2
021
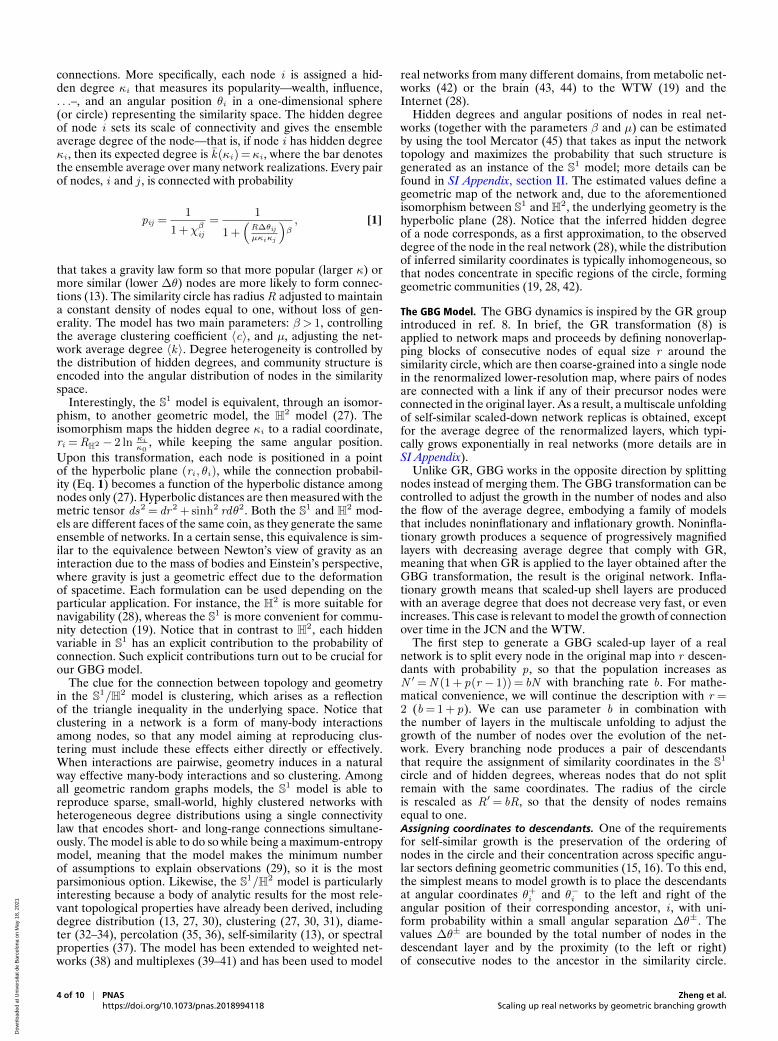
connections. More specifically, each node i is assigned a hid-den degree κi that measures its popularity—wealth, influence,. . .–, and an angular position θi in a one-dimensional sphere(or circle) representing the similarity space. The hidden degreeof node i sets its scale of connectivity and gives the ensembleaverage degree of the node—that is, if node i has hidden degreeκi , then its expected degree is k(κi) =κi , where the bar denotesthe ensemble average over many network realizations. Every pairof nodes, i and j , is connected with probability
pij =1
1 +χβij=
1
1 +(
R∆θijµκiκj
)β
, [1]
that takes a gravity law form so that more popular (larger κ) ormore similar (lower ∆θ) nodes are more likely to form connec-tions (13). The similarity circle has radius R adjusted to maintaina constant density of nodes equal to one, without loss of gen-erality. The model has two main parameters: β > 1, controllingthe average clustering coefficient 〈c〉, and µ, adjusting the net-work average degree 〈k〉. Degree heterogeneity is controlled bythe distribution of hidden degrees, and community structure isencoded into the angular distribution of nodes in the similarityspace.
Interestingly, the S1 model is equivalent, through an isomor-phism, to another geometric model, the H2 model (27). Theisomorphism maps the hidden degree κi to a radial coordinate,ri =RH2 − 2 ln κi
κ0, while keeping the same angular position.
Upon this transformation, each node is positioned in a pointof the hyperbolic plane (ri , θi), while the connection probabil-ity (Eq. 1) becomes a function of the hyperbolic distance amongnodes only (27). Hyperbolic distances are then measured with themetric tensor ds2 = dr2 + sinh2 rdθ2. Both the S1 and H2 mod-els are different faces of the same coin, as they generate the sameensemble of networks. In a certain sense, this equivalence is sim-ilar to the equivalence between Newton’s view of gravity as aninteraction due to the mass of bodies and Einstein’s perspective,where gravity is just a geometric effect due to the deformationof spacetime. Each formulation can be used depending on theparticular application. For instance, the H2 is more suitable fornavigability (28), whereas the S1 is more convenient for commu-nity detection (19). Notice that in contrast to H2, each hiddenvariable in S1 has an explicit contribution to the probability ofconnection. Such explicit contributions turn out to be crucial forour GBG model.
The clue for the connection between topology and geometryin the S1/H2 model is clustering, which arises as a reflectionof the triangle inequality in the underlying space. Notice thatclustering in a network is a form of many-body interactionsamong nodes, so that any model aiming at reproducing clus-tering must include these effects either directly or effectively.When interactions are pairwise, geometry induces in a naturalway effective many-body interactions and so clustering. Amongall geometric random graphs models, the S1 model is able toreproduce sparse, small-world, highly clustered networks withheterogeneous degree distributions using a single connectivitylaw that encodes short- and long-range connections simultane-ously. The model is able to do so while being a maximum-entropymodel, meaning that the model makes the minimum numberof assumptions to explain observations (29), so it is the mostparsimonious option. Likewise, the S1/H2 model is particularlyinteresting because a body of analytic results for the most rele-vant topological properties have already been derived, includingdegree distribution (13, 27, 30), clustering (27, 30, 31), diame-ter (32–34), percolation (35, 36), self-similarity (13), or spectralproperties (37). The model has been extended to weighted net-works (38) and multiplexes (39–41) and has been used to model
real networks from many different domains, from metabolic net-works (42) or the brain (43, 44) to the WTW (19) and theInternet (28).
Hidden degrees and angular positions of nodes in real net-works (together with the parameters β and µ) can be estimatedby using the tool Mercator (45) that takes as input the networktopology and maximizes the probability that such structure isgenerated as an instance of the S1 model; more details can befound in SI Appendix, section II. The estimated values define ageometric map of the network and, due to the aforementionedisomorphism between S1 and H2, the underlying geometry is thehyperbolic plane (28). Notice that the inferred hidden degreeof a node corresponds, as a first approximation, to the observeddegree of the node in the real network (28), while the distributionof inferred similarity coordinates is typically inhomogeneous, sothat nodes concentrate in specific regions of the circle, forminggeometric communities (19, 28, 42).
The GBG Model. The GBG dynamics is inspired by the GR groupintroduced in ref. 8. In brief, the GR transformation (8) isapplied to network maps and proceeds by defining nonoverlap-ping blocks of consecutive nodes of equal size r around thesimilarity circle, which are then coarse-grained into a single nodein the renormalized lower-resolution map, where pairs of nodesare connected with a link if any of their precursor nodes wereconnected in the original layer. As a result, a multiscale unfoldingof self-similar scaled-down network replicas is obtained, exceptfor the average degree of the renormalized layers, which typi-cally grows exponentially in real networks (more details are inSI Appendix).
Unlike GR, GBG works in the opposite direction by splittingnodes instead of merging them. The GBG transformation can becontrolled to adjust the growth in the number of nodes and alsothe flow of the average degree, embodying a family of modelsthat includes noninflationary and inflationary growth. Noninfla-tionary growth produces a sequence of progressively magnifiedlayers with decreasing average degree that comply with GR,meaning that when GR is applied to the layer obtained after theGBG transformation, the result is the original network. Infla-tionary growth means that scaled-up shell layers are producedwith an average degree that does not decrease very fast, or evenincreases. This case is relevant to model the growth of connectionover time in the JCN and the WTW.
The first step to generate a GBG scaled-up layer of a realnetwork is to split every node in the original map into r descen-dants with probability p, so that the population increases asN ′=N (1 + p(r − 1)) = bN with branching rate b. For mathe-matical convenience, we will continue the description with r =2 (b = 1 + p). We can use parameter b in combination withthe number of layers in the multiscale unfolding to adjust thegrowth of the number of nodes over the evolution of the net-work. Every branching node produces a pair of descendantsthat require the assignment of similarity coordinates in the S1
circle and of hidden degrees, whereas nodes that do not splitremain with the same coordinates. The radius of the circleis rescaled as R′= bR, so that the density of nodes remainsequal to one.Assigning coordinates to descendants. One of the requirementsfor self-similar growth is the preservation of the ordering ofnodes in the circle and their concentration across specific angu-lar sectors defining geometric communities (15, 16). To this end,the simplest means to model growth is to place the descendantsat angular coordinates θ+
i and θ−i to the left and right of theangular position of their corresponding ancestor, i , with uni-form probability within a small angular separation ∆θ±. Thevalues ∆θ± are bounded by the total number of nodes in thedescendant layer and by the proximity (to the left or right)of consecutive nodes to the ancestor in the similarity circle.
4 of 10 | PNAShttps://doi.org/10.1073/pnas.2018994118
Zheng et al.Scaling up real networks by geometric branching growth
Dow
nloa
ded
at U
nive
rsita
t de
Bar
celo
na o
n M
ay 1
8, 2
021
APP
LIED
MA
THEM
ATI
CSEC
ON
OM
ICSC
IEN
CES
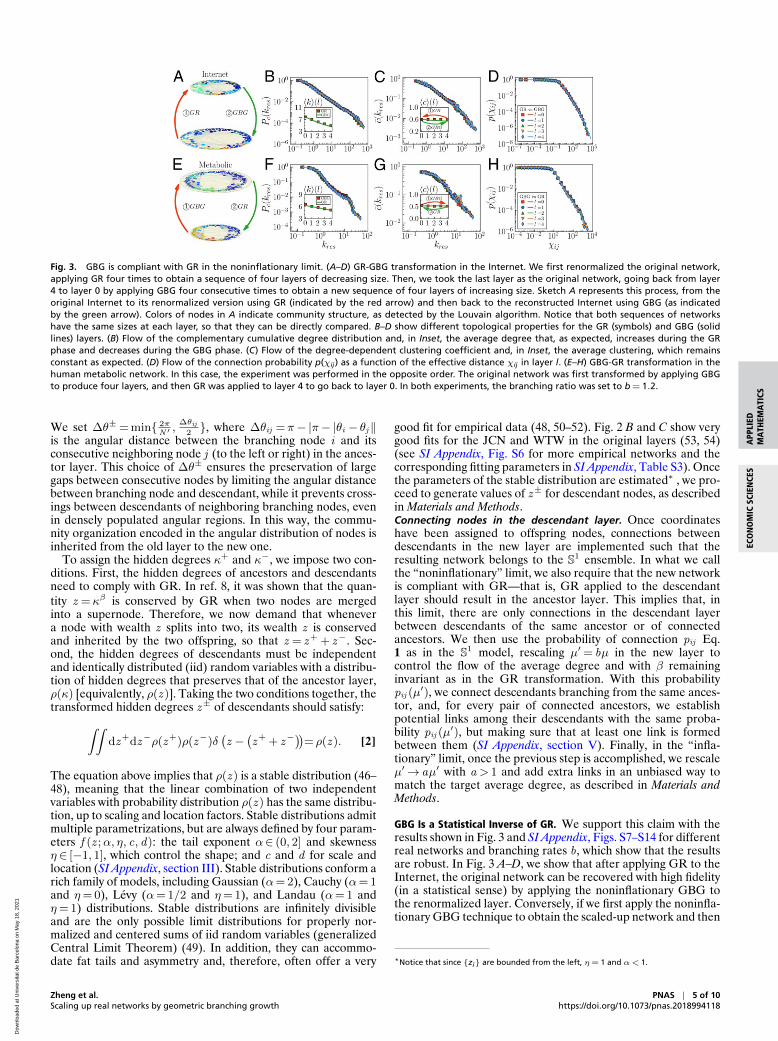
Fig. 3. GBG is compliant with GR in the noninflationary limit. (A–D) GR-GBG transformation in the Internet. We first renormalized the original network,applying GR four times to obtain a sequence of four layers of decreasing size. Then, we took the last layer as the original network, going back from layer4 to layer 0 by applying GBG four consecutive times to obtain a new sequence of four layers of increasing size. Sketch A represents this process, from theoriginal Internet to its renormalized version using GR (indicated by the red arrow) and then back to the reconstructed Internet using GBG (as indicatedby the green arrow). Colors of nodes in A indicate community structure, as detected by the Louvain algorithm. Notice that both sequences of networkshave the same sizes at each layer, so that they can be directly compared. B–D show different topological properties for the GR (symbols) and GBG (solidlines) layers. (B) Flow of the complementary cumulative degree distribution and, in Inset, the average degree that, as expected, increases during the GRphase and decreases during the GBG phase. (C) Flow of the degree-dependent clustering coefficient and, in Inset, the average clustering, which remainsconstant as expected. (D) Flow of the connection probability p(χij) as a function of the effective distance χij in layer l. (E–H) GBG-GR transformation in thehuman metabolic network. In this case, the experiment was performed in the opposite order. The original network was first transformed by applying GBGto produce four layers, and then GR was applied to layer 4 to go back to layer 0. In both experiments, the branching ratio was set to b = 1.2.
We set ∆θ±= min{ 2πN ′ ,
∆θij2}, where ∆θij =π− |π− |θi − θj‖
is the angular distance between the branching node i and itsconsecutive neighboring node j (to the left or right) in the ances-tor layer. This choice of ∆θ± ensures the preservation of largegaps between consecutive nodes by limiting the angular distancebetween branching node and descendant, while it prevents cross-ings between descendants of neighboring branching nodes, evenin densely populated angular regions. In this way, the commu-nity organization encoded in the angular distribution of nodes isinherited from the old layer to the new one.
To assign the hidden degrees κ+ and κ−, we impose two con-ditions. First, the hidden degrees of ancestors and descendantsneed to comply with GR. In ref. 8, it was shown that the quan-tity z =κβ is conserved by GR when two nodes are mergedinto a supernode. Therefore, we now demand that whenevera node with wealth z splits into two, its wealth z is conservedand inherited by the two offspring, so that z = z+ + z−. Sec-ond, the hidden degrees of descendants must be independentand identically distributed (iid) random variables with a distribu-tion of hidden degrees that preserves that of the ancestor layer,ρ(κ) [equivalently, ρ(z )]. Taking the two conditions together, thetransformed hidden degrees z± of descendants should satisfy:∫∫
dz+dz−ρ(z+)ρ(z−)δ(z −
(z+ + z−
))= ρ(z ). [2]
The equation above implies that ρ(z ) is a stable distribution (46–48), meaning that the linear combination of two independentvariables with probability distribution ρ(z ) has the same distribu-tion, up to scaling and location factors. Stable distributions admitmultiple parametrizations, but are always defined by four param-eters f (z ;α, η, c, d): the tail exponent α∈ (0, 2] and skewnessη ∈ [−1, 1], which control the shape; and c and d for scale andlocation (SI Appendix, section III). Stable distributions conform arich family of models, including Gaussian (α= 2), Cauchy (α= 1and η= 0), Levy (α= 1/2 and η= 1), and Landau (α= 1 andη= 1) distributions. Stable distributions are infinitely divisibleand are the only possible limit distributions for properly nor-malized and centered sums of iid random variables (generalizedCentral Limit Theorem) (49). In addition, they can accommo-date fat tails and asymmetry and, therefore, often offer a very
good fit for empirical data (48, 50–52). Fig. 2 B and C show verygood fits for the JCN and WTW in the original layers (53, 54)(see SI Appendix, Fig. S6 for more empirical networks and thecorresponding fitting parameters in SI Appendix, Table S3). Oncethe parameters of the stable distribution are estimated∗ , we pro-ceed to generate values of z± for descendant nodes, as describedin Materials and Methods.Connecting nodes in the descendant layer. Once coordinateshave been assigned to offspring nodes, connections betweendescendants in the new layer are implemented such that theresulting network belongs to the S1 ensemble. In what we callthe “noninflationary” limit, we also require that the new networkis compliant with GR—that is, GR applied to the descendantlayer should result in the ancestor layer. This implies that, inthis limit, there are only connections in the descendant layerbetween descendants of the same ancestor or of connectedancestors. We then use the probability of connection pij Eq.1 as in the S1 model, rescaling µ′= bµ in the new layer tocontrol the flow of the average degree and with β remaininginvariant as in the GR transformation. With this probabilitypij (µ
′), we connect descendants branching from the same ances-tor, and, for every pair of connected ancestors, we establishpotential links among their descendants with the same proba-bility pij (µ
′), but making sure that at least one link is formedbetween them (SI Appendix, section V). Finally, in the “infla-tionary” limit, once the previous step is accomplished, we rescaleµ′→ aµ′ with a > 1 and add extra links in an unbiased way tomatch the target average degree, as described in Materials andMethods.
GBG Is a Statistical Inverse of GR. We support this claim with theresults shown in Fig. 3 and SI Appendix, Figs. S7–S14 for differentreal networks and branching rates b, which show that the resultsare robust. In Fig. 3 A–D, we show that after applying GR to theInternet, the original network can be recovered with high fidelity(in a statistical sense) by applying the noninflationary GBG tothe renormalized layer. Conversely, if we first apply the noninfla-tionary GBG technique to obtain the scaled-up network and then
*Notice that since {zi} are bounded from the left, η= 1 and α< 1.
Zheng et al.Scaling up real networks by geometric branching growth
PNAS | 5 of 10https://doi.org/10.1073/pnas.2018994118
Dow
nloa
ded
at U
nive
rsita
t de
Bar
celo
na o
n M
ay 1
8, 2
021

recover the networks by GR, the result is analogous; see Fig. 3E–H for the Metabolic network (details of the datasets are in SIAppendix, section I)† . This means that noninflationary GBG andGR flows produce the same values of average clustering, aver-age degree, and empirical connection probability, among otherproperties. The GBG transformation also preserves the originalcommunity structure, as detected by the Louvain algorithm (24).Furthermore, since the transformation also preserves the corre-lation between hidden angles and degrees, the self-similarity ofthe scaled-up networks extends to structural correlations amongnodes, such as degree–degree correlations (45).
As shown, GBG is a statistical inverse of GR, but inflation-ary GBG is not because of the new links added to increase theaverage degree over the value given by inverse GR. During theevolution of the real systems analyzed in this work, we observea global increase of the density of connections (SI Appendix,Fig. S1). In the WTW, this is due to the global growth of theworld gross domestic product and in the JCN to the increasingnumber of researchers, and thus publications, within the scien-tific system. Parameter a in the inflationary limit of GBG can beadjusted to model such global increase by controlling the growthof the average degree. If we apply GR to the obtained replica,we would recover an inflated version of the original network withextra links that we would need to deflate to recover the originalnetwork. To rebalance the average degree one needs an extramechanism, like the pruning used in ref. 8 to produce scaled-down network replicas. The deflation procedure is analogous tothe inflation technique, and we give the details in SI Appendix,sections VII and VIII. Given that the addition of links in theinflationary step of the inflationary GBG process, as well as thepruning of links to decrease the average degree of GR layers arecompliant with the S1 model, we say then that GBG is a statisti-cal inverse of GR, while inflationary GBG (GBG + addition oflinks) is a statistical inverse of deflationary GR (GR + pruningof links) (SI Appendix, Fig. S18).
Behavior of the Average Degree. In the noninflationary GBGmodel (a = 1), we can use the inverse of the GR relation betweenthe average degrees in a descendant layer and in the ancestorlayer (8), using µ′= bµ to obtain 〈k〉(l) = (b−ν)l〈k〉(0), wherethe scaling factor ν depends on the connectivity structure of theoriginal network, and 〈k〉(l) (the mean degree of layer l) refersto the original network when l = 0. Typically, as the scaling fac-tor ν is positive in real networks (8), the average degree of thedescendant layers decreases exponentially with the number oflayers.
As explained previously, in the inflationary regime, µ′ isrescaled by α> 1, resulting in µ′= abµ. In this case, the aver-age degree, 〈k〉(l)a , thus depends on a . Its behavior as a functionof the network size across layers can be calculated following thesame derivations as in ref. 8, which gives
〈k〉(l)a =a l〈k〉(l)=(ab−ν)l〈k〉(0)=
[N (l)
N (0)
]−ν+ ln a
ln b 〈k〉(0), [3]
with N (l) and N (0) the network sizes on layers land 0, respectively.‡ In the last step, we have used
†Notice that the semigroup property of GR also holds for GBG, meaning that two con-secutive GBG transformations of scale b over a network are equivalent to a singletransformation of scale b2. This is easy to derive when the branching rate has an integervalue, but it holds even if b< 2. Results supporting this claim are shown in SI Appendix,Fig. S15 for a synthetic network produced with the S1 model and different values of band in SI Appendix, Figs. S16 and S17 for different real networks.
‡Notice that the inflationary process is applied here to every layer in the flow. If,instead, it is applied in a single step to the last layer produced in a noninflationaryGBG transformation, then 〈k〉(l)a = a〈k〉(l) = a(b−ν )l〈k〉(0) .
l = ln(N (l)/N (0)
)/ ln b, implied by the relation N (l) = b lN (0).
From Eq. 3, the average degree 〈k〉(l)a increases as a power ofN (l). SI Appendix, Fig. S19 shows the high degree of congruencybetween this theoretical prediction, the empirical data, andsimulations (as explained below) of the inflationary version ofGBG, in JCN and WTW.Predicting the evolution of real networks. The inflationary GBGmodel reproduces the self-similar evolution of JCN and WTW.To support this claim, we divide the empirical data into two con-secutive time windows: the first for estimation purposes and thesecond for validation purposes. Note that JCN and WTW datafrom before World War II are not used due to the high fluctu-ations of the network properties (SI Appendix, Figs. S3 and S4).We fix a value of b in the range 1< b< 2 to adjust the rate ofgrowth in our GBG simulation in such a way that we can produceenough snapshots to compare with the real data. With this valueof b, we estimate parameter a from the empirical evolution of theaverage degree vs. network size (see details in SI Appendix, sec-tion VI). We find that a remains stable over time (SI Appendix,Fig. S20), consistent with the empirical observation that the aver-age degree grows as a power of the system size (Fig. 4A and SIAppendix, Fig. S21A). Next, we use the network snapshot at theend of the estimation period as the initial layer in GBG multi-scale unfolding to simulate a number of scaled-up layers that wethen compare to empirical snapshots of approximately the samesize in the validation set. The comparisons of degree distribu-tions, clustering, degree–degree correlations, and modularity areshown in Fig. 4 D–G. Similar results are found for the WTW(SI Appendix, Fig. S21).
We also measured the local rich-club and nested self-similarityeffects, reported in Fig. 4B and SI Appendix, Figs. S22 and S23.We name as “local rich-club effect” and “nested self-similarityeffect” the observation in real networks that the nested hier-archy of subgraphs produced by progressively thresholding thedegrees of the nodes presents, respectively, an increasing inter-nal average degree and self-similar structure (13, 35). This is ahighly nontrivial property with crucial implications, such as theabsence of a critical threshold in any phase transition whosecritical point depends monotonously on the average degree,including percolation, epidemic spreading processes, and theIsing model (55). The results show that all of the networksanalyzed in this paper, including JCN and WTW, present thetwo effects (SI Appendix, Figs. S22 and S23). Notice that stan-dard growing network models, including the Barabasi–Albertmodel (1) and the Popularity–Similarity Optimization model inhyperbolic space (4), have a constant average degree as the net-work grows, and they also present a constant average degreeof the subgraphs in the nested hierarchy (SI Appendix, Fig.S24). Therefore, they lack the local rich-club effect. In fact,if those models were adjusted to increase the average degreeover time, as happens in the real networks that we analyze inthis work, the flow of the average degree in the nested hier-archy would be decreasing, in stark contrast to the empiricalobservations (SI Appendix, Fig. S24B). In addition, the resultsare robust for different values of b and for different startingtimes (SI Appendix, Fig. S25–S27). Therefore, the GBG modelreproduces the self-similar evolution of the structure of thetwo networks with high fidelity. More comparisons between themodel and empirical observations are also shown in SI Appendix,Figs. S28–S31.
Scaled-Up Real Network ReplicasThe GBG model is not only able to explain the self-similargrowth of real networks, but it can also be used as a technique toproduce magnified replicas of real networks in research scenar-ios very different from the study of network evolution. Scaled-upreplicas of real networks are versions where the number of nodes
6 of 10 | PNAShttps://doi.org/10.1073/pnas.2018994118
Zheng et al.Scaling up real networks by geometric branching growth
Dow
nloa
ded
at U
nive
rsita
t de
Bar
celo
na o
n M
ay 1
8, 2
021

APP
LIED
MA
THEM
ATI
CSEC
ON
OM
ICSC
IEN
CES
B CA
D E F G
Fig. 4. The GBG model predicts the self-similar evolution of real networks. (A) Evolution of the average degree 〈k〉 vs. network size N. The estimation,validation, and projection sections are separated by vertical dashed lines. Blue circles, green squares, and red stars represent empirical data, validationpoints, and projection from the model, respectively. The data in the estimation section are used to find values of a (see details in SI Appendix, sectionVI). The branching rate, b, is fixed to 1.5, and the corresponding value of a is 1.415 (SI Appendix, Fig. S20). For validation purposes, we grow the networkfrom 1965 to 1975 using GBG and compare the resulting networks with empirical (Emp.) snapshots of the same size. The equivalence between givensnapshots of the real JCN and the networks generated by GBG is stated in C. In D–G, we show a comparison of the topological properties of simulated andempirical networks. (B) Local rich-club effect. (D) Complementary cumulative distribution of rescaled degrees. (E) Degree-dependent clustering coefficientover rescaled-degree classes. (F) Degree–degree correlations. (G) The modularity Q.
is increased while preserving the statistical properties of theoriginal network, in particular, its average degree 〈k (0)〉. UsingGBG, the procedure is straightforward and involves adjustingthe parameter b, the number of layers l , and the inflationaryparameter a . The idea is to single out a specific scale after acertain number of noninflationary GBG steps and to tune a toincrease the average degree to the target value by adding newlinks using Eq. 5 (see details in SI Appendix, section VII). Noticethat this application of the GBG model can also be extended tonetworks that do not necessarily evolve according to the model,as it exploits the underlying geometric structure and congruencywith geometric models observed in many real-world networks.
More specifically, GBG, possibly in combination with GR,allows us to investigate size effects in real networks, a prospectthat becomes extremely useful in different applications. We illus-trate this through two examples. In the first, we explore a dynam-ical model of opinion formation running on a real network—aFacebook network—with the goal of detecting the network sizethat produces an optimal response of the system to an externalinfluence. In the second, we combine scale-up network replicasproduced by GBG with scaled-down network replicas producedby GR (as described in ref. 8) to explore the critical behaviorof a real network, the Internet, close to the transition where theglobal connectivity of the network disintegrates under randomlink failures.
Size-induced stochastic resonance in real networks.We study the behavior of a model of opinion formation thatdepends nontrivially on the size of the network on which it runs.Here, we use a small Facebook network of 320 users workingfor the same software company (56) (see data description in SIAppendix, section I). The opinion-formation model was intro-duced in ref. 57. The opinion of a node can change due toimitation following a majority rule, an external influence in theform of a periodic “fashion” wave, or noise. This model wasshown to present a stochastic resonance effect in small-worldnetworks (58), displaying an optimal response of the populationto the fashion wave for some noise level. The system also dis-plays a size-induced stochastic resonance effect (59, 60), whichmeans there is an optimal value for the number of nodes, theoptimal mass, for which the average opinion best follows thefashion, as a consequence of the coupling between noise andsystem size.
However, those results were for graphs produced by networkmodels that allow one to control the size of the generated net-works, and not for real networks. The GBG technique providesthe opportunity to study size-induced stochastic resonance inreal networks. We produced a GBG self-similar multiscale shellof the Facebook network preserving the average degree of theoriginal network (see SI Appendix, Fig. S32 for the statisticalproperties of the replicas as compared with the original net-work) and simulated the dynamical process described next ineach layer. Each node has one of two possible opinions. Ateach time step of the process, a node is randomly selected andgoes through a sequence of operations. The node first adoptsthe majority opinion among its connected neighbors, then it isforced to follow the fashion with a probability that depends onthe strength and periodicity of the fashion, and, finally, it adoptsrandomly a new opinion with a probability that depends on theintensity of the random noise (see SI Appendix, section IX fordetails of our implementation). We modeled the external influ-ence as a cosine function with amplitude A and period T andmeasured the response of the system as a function of the noiseintensity ε for different system sizes. To measure the responseof the system, we used the spectral amplification factor (61)R = 4A−2|〈e i2πt/Tρ(t)〉|, where ρ(t) = 1
N
∑i mi(t) is the aver-
age opinion in the evolution, mi(t) is the opinion of node i attime t , and 〈· · · 〉 denotes a time average.
The results are shown in Fig. 5A. The optimal response, Rmax,is plotted in Inset as a function of N . For each size, N , there is amaximum response for some intermediate value of the noise andthe optimal value occurs at some combination of noise and size.Interestingly, for sufficiently small values of noise (Fig. 5C), R isenhanced by increasing the noise, and for every noise intensity,ε, the optimal response occurs at approximately the same valueas in Rmax, N = 2,379. Hence, we conclude that there is an opti-mal mass for which the average opinion best follows the externalinfluence. Moreover, we also found that there is some value of Nfor which R has a minimum—that is, the average opinion followsthe external influence to the least extent.
Critical behavior of real networks under random link failures.The random failure of links in networks leads to a percola-tion transition: a continuous structural change that disaggregatesthe large cluster of connected network nodes into a bundle ofsmall isolated components (35, 55), hence disabling the system.
Zheng et al.Scaling up real networks by geometric branching growth
PNAS | 7 of 10https://doi.org/10.1073/pnas.2018994118
Dow
nloa
ded
at U
nive
rsita
t de
Bar
celo
na o
n M
ay 1
8, 2
021
BA
C D
Fig. 5. Controlling network size from network snapshots. (A and C) Opti-mal mass of a Facebook network for best response to external modulation ina noisy environment. (A) System response, R, as a function of the noise inten-sity, ε, for different network sizes. A, Inset shows the maximum response as afunction of N. (C) System response, R, as a function of N for different valuesof the noise intensity, ε. The range of noise values on the x axis correspondsto the gray region in A. (B and D) Scaling with system size of random linkfailure as a bond percolation process in the Internet. (B) Susceptibility, χ,as a function of bond occupation probability, p, for different network sizes,N. (D) Critical bond occupation probability, pc, and the maximum, χmax, ofthe susceptibility, χ, as functions of network size, N. The dashed lines arepower-law fits, and the black symbols in D indicate the original network.The GBG and GR shells are produced with b = 2.
The fraction of links removed, p, acts as a control parameterthat can be manipulated to change the state of the system inin silico experiments, and the transition occurs at some specificvalue: pc . Close to this critical point, the macroscopic propertiesof the network, such as the relative size of the largest connectedcluster and the average cluster size, behave as power laws ofthe distance to the critical point, (p− pc)δ , with some criticalexponents. One way of extracting these exponents is by observ-ing how certain quantities vary as the size of the system changes.However, the finite size scaling technique has faced serious chal-lenges in real networks due to the lack of data beyond singlesnapshots.
Next, we show that a downward–upward multiscale shell ofreplicas produced by the joint action of the GBG and GR tech-niques on a real Internet network (see SI Appendix, Fig. S32for the statistical properties of the replicas as compared withthe original network) can be used to study the finite size scalingbehavior of bond percolation using only the data from a singlesnapshot (Fig. 5 B and D). We measured the average size of thelargest component, 〈G〉, and its fluctuations—i.e., susceptibilityχ= 〈G2〉−〈G〉2
〈G〉 —as a function of p in each layer of the multiscaleshell using the fast algorithm of Newman and Ziff (62). In finitesystems, a peak in the susceptibility, χ, diverging with the systemsize indicates the presence of a continuous phase transition, andits position provides a way to estimate the percolation threshold,pc : Fig. 5B. In Fig. 5D, we show that the critical link failure prob-ability, pc , approaches zero as a power law, pc(N )∼N−0.374,and the maximum, χmax, of the susceptibility also diverges as
a power law: χmax(N )∼N 0.456. Not only do these results sug-gest a vanishing percolation threshold in the real Internet graph,as usually happens in scale-free networks, but they also pro-vide a method to estimate the corresponding critical exponentsnumerically, thus offering a way to study critical phenomena insingle-instance real networks.
ConclusionsReal networks are observed to evolve in a self-similar way thatpreserves their topology throughout the growth process overlong time spans. The GBG model lays out a minimal num-ber of simple principles that combine branching growth, one ofthe paradigms of evolution, and network geometry to explainthe empirical findings via a technique that generates self-similarmetric expansion of a network replicating its original structure.One of the essential assumptions in the model, the preservationof the distribution of hidden degrees as the number of nodesincreases, leads to the introduction of stable distributions in thecontext of network modeling. Stable distributions, a rich fam-ily of probability distributions with intriguing theoretical andpractical properties, are widely used to model heavy-tailed datafrom many types of physical and economic systems and rep-resent an alternative to the power-law paradigm in the studyof complex networks. Meanwhile, the GBG model relies on auniversal connectivity law that operates at all scales, simultane-ously encoding short- and long-range connections, which keepsits form over time. Our results suggest that the same principlesorganize network connectivity at different length scales in realnetworks and that these principles are also sustained over time.As a result, simplicity, as one of the rationales for self-similarity,is one of the keys to understanding and predicting networkevolution.
While some limitations of our model are obvious—forinstance, the exclusion of the birth/death processes of links andnodes—we believe that complementary hypotheses would notaffect the results and our GBG model in any fundamental way.The model captures the main mechanisms that drive and pre-dict the self-similar evolution of real networks. In parallel, andbeyond the explanatory power of the model to effectively decodethe self-similar evolution of real networks, GBG is also a tech-nique to produce scaled-up replicas of networks: an effectiveand versatile tool facilitating analysis of the behavior of net-works at different size scales. The combination of GBG withscaled-down network replicas produced by GR provides full up-and-down self-similar multiscale unfolding of complex networksthat covers both large and small scales. Potential applicationsthat require optimization or control of system size in complexsystems are countless. Apart from those explained here, we canmention the assessment of scalability issues in dynamic processesin core functions of real networks, such as in Internet routingprotocols.
Finally, the presence of symmetry has been observed to affectsynchronization on networks (63) and the spectrum of eigen-vectors of the Laplacian matrix (64), which controls diffusiveprocesses. Future work will be needed to clarify the influence ofthe evolutionary self-similarity of real networks described in thispaper on dynamical processes taking place on them.
Materials and MethodsGenerating z±. First, we infer the parameters of the stable distribution ofa given layer α, η, c, and d. Then, if b = 2, meaning that all nodes split, thedistribution for descendants,
f(z±;α±, η±, c±, d±) = f(z±;α, η, c/21/α, d/2), [4]
follows immediately from Eq. 2, and basic properties of the stable distribu-tion, with the shape parameters remaining invariant, and scale and location
8 of 10 | PNAShttps://doi.org/10.1073/pnas.2018994118
Zheng et al.Scaling up real networks by geometric branching growth
Dow
nloa
ded
at U
nive
rsita
t de
Bar
celo
na o
n M
ay 1
8, 2
021

APP
LIED
MA
THEM
ATI
CSEC
ON
OM
ICSC
IEN
CES
being adjusted so that the stable distribution of the ancestor layer isrecovered when we sum the hidden variables z± of the descendants. Thesefunctions and Bayes’ rule can be used to generate numerically the valuesof z+ from the probability of hidden degrees of descendants, conditionalon the degree of the ancestor ρ(z+|z)nor, normalized to ensure that thehidden degrees of descendants are nonnegative. Finally, once z+ has beengenerated, z− is calculated deterministically by using z− = z− z+, and thevariables z± are transformed back into κ± using κ= z1/β (SI Appendix,section IV). In the case of fractional b, we produce the hidden variablesz± of the descendants of branching nodes using f(z;α, η, c/b1/α, d/b) andassume that the stable distribution in the new layer is f(z;α, η, c/b1/α, d/b).This gives a good approximation to the mixture of stable distributionsthat result from nodes with different branching behavior. SI Appendix,Fig. S6 demonstrates that the distribution of hidden variables z of descen-dants has the same shape as that of the ancestor layer in different realnetworks.
Inflationary GBG. We first proceed as in the noninflationary case. Oncewe have a noninflationary GBG map, we set µ′a = aµ′ = abµ, (a > 1)to adjust the average degree to a larger value by adding extralinks between any pair of nodes that remained unconnected usingprobability:
πij =pij(µ
′a)− pij(µ
′)
1− pij(µ′). [5]
These steps ensure that 1) all pairs of descendants in the GBG layer are con-nected with probability pij(µ
′a), with the original form Eq. 1 in the ancestor
layer, and hence the resulting network belongs to the S1 ensemble; 2) linksexist between descendants of connected ancestors; and 3) the noninflation-ary limit is recovered for a = 1, that is, in this case, πij = 0, and no extra linksare formed so that GBG complies with GR, and there are only connectionsin the descendant layer between descendants of the same ancestor or ofconnected ancestors.
Data Availability. Backbones of the WTW were taken from ref. 19. Back-bones of the WTW and the JCN and their hyperbolic maps have beendeposited in the Zenodo platform and can be freely accessed (https://zenodo.org/record/4023964) (65).
ACKNOWLEDGMENTS. This work was supported by a James S. McDonnellFoundation Scholar Award in Complex Systems; the Catalan Institution forResearch and Advanced Studies Academia award, funded by the Generalitatde Catalunya; Agencia Estatal de Investigacion Project PID2019-106290GB-C22; Spanish Ministerio de Ciencia, Innovacion y Universidades ProjectFIS2016-76830-C2-2-P (AEI/FEDER, UE); project Mapping Big Data Systems:Embedding Large Complex Networks in Low-Dimensional Hidden MetricSpaces, Ayudas Fundacion BBVA a Equipos de Investigacion Cientıfica 2017;and Generalitat de Catalunya Grant 2017SGR1064. Furthermore, G.G.-P. wassupported by the Academy of Finland via Center of Excellence ProgramProjects 312058 and 287750; and from the emmy.network foundation underthe aegis of the Fondation de Luxembourg.
1. A. Barabasi, R. Albert, Emergence of scaling in random networks. Science 286, 509–512 (1999).
2. P. L. Krapivsky, G. J. Rodgers, S. Redner, Degree distributions of growing networks.Phys. Rev. Lett. 86, 5401–5404 (2001).
3. G. Bianconi, A.-L. Barabasi, Competition and multiscaling in evolving networks.Europhys. Lett. 54, 436–442 (2001).
4. F. Papadopoulos, M. Kitsak, M. A. Serrano, M. Boguna, D. Krioukov, Popularity versussimilarity in growing networks. Nature 489, 537 (2012).
5. R. V. Sole, R. Pastor-Satorras, E. Smith, T. B. Kepler, A model of large-scale proteomeevolution. Adv. Complex Syst. 5, 43–54 (2002).
6. R. Pastor-Satorras, E. Smith, R. V. Sole, Evolving protein interaction networks throughgene duplication. J. Theor. Biol. 22, 199–210 (2003).
7. A. N. Kolmogorov, N. A. Dmitriev, “Branching random processes” in Selected Worksof A. N. Kolmogorov, A. N. Shiryayev, Ed. (Springer Science+Business Media,Dordrecht, The Netherlands, 1992), pp. 309–314.
8. G. Garcıa-Perez, M. Boguna, M. A. Serrano, Multiscale unfolding of real networks bygeometric renormalization. Nat. Phys. 14, 583–589 (2018).
9. K. G. Wilson, The renormalization group: Critical phenomena and the Kondoproblem. Rev. Mod. Phys. 47, 773 (1975).
10. K. G. Wilson, The renormalization group and critical phenomena. Rev. Mod. Phys. 55,583 (1983).
11. L. P. Kadanoff, Statistical Physics: Statics, Dynamics and Renormalization (WorldScientific Publishing Company, Singapore, 2000).
12. C. Song, S. Havlin, H. A. Makse, Origins of fractality in the growth of complexnetworks. Nat. Phys. 2, 275 (2006).
13. M. A. Serrano, D. Krioukov, M. Boguna, Self-similarity of complex networks andhidden metric spaces. Phys. Rev. Lett. 100, 078701 (2008).
14. D. Krioukov, F. Papadopoulos, A. Vahdat, M. Boguna, Curvature and temperature ofcomplex networks. Phys. Rev. E 80, 035101(R) (2009).
15. G. Garcıa-Perez, M. A. Serrano, M. Boguna, Soft communities in similarity space. J.Stat. Phys. 173, 775–782 (2018).
16. K. Zuev, M. Boguna, G. Bianconi, D. Krioukov, Emergence of soft communities fromgeometric preferential attachment. Sci. Rep. 5, 9421 (2015).
17. D. Hric, K. Kaski, M. Kivela, Stochastic block model reveals maps of citation patternsand their evolution in time. J. Inform. 12, 757–783 (2018).
18. S. Fortunato et al., Science of science. Science 359, eaao0185 (2018).19. G. Garcıa-Perez, M. Boguna, A. Allard, M. A. Serrano, The hidden hyperbolic
geometry of international trade: World trade atlas 1870–2013. Sci. Rep. 6, 33441(2016).
20. S. Milojevic, Quantifying the cognitive extent of science. J. Inform. 9, 962–973 (2015).21. F. Radicchi, S. Fortunato, C. Castellano, Universality of citation distributions: Toward
an objective measure of scientific impact. Proc. Natl. Acad. Sci. U.S.A. 105, 17268–17272 (2008).
22. D. Wang, C. Song, A. Barabasi, Quantifying long-term scientific impact. Science 342,127–132 (2013).
23. Correlates of War Project, State system membership list, v2016. http://correlatesofwar.org. Accessed 18 January 2019.
24. V. D. Blondel, J. L. Guillaume, R. Lambiotte, E. Lefebvre, Fast unfolding of communi-ties in large networks. J. Stat. Mech. Theor. Exp. 2008, P10008 (2008).
25. N. X. Vinh, J. Epps, J. Bailey, Information theoretic measures for clusterings compar-ison: Variants, properties, normalization and correction for chance. J. Mach. Learn.Res. 11, 2837–2854 (2010).
26. M. Boguna et al., Network geometry. Nat. Rev. Phys. 3, 114–135 (2021).27. D. Krioukov, F. Papadopoulos, M. Kitsak, A. Vahdat, M. Boguna, Hyperbolic geometry
of complex networks. Phys. Rev. E 82, 036106 (2010).
28. M. Boguna, F. Papadopoulos, D. Krioukov, Sustaining the internet with hyperbolicmapping. Nat. Commun. 1, 62 (2010).
29. M. Boguna, D. Krioukov, P. Almagro, M. A. Serrano, Small worlds and clustering inspatial networks. Phys. Rev. Res. 2, 023040 (2020).
30. L. Gugelmann, K. Panagiotou, U. Peter. “Random hyperbolic graphs: Degreesequence and clustering,” in Automata, Languages, and Programming, A. Czumaj,K. Mehlhorn, A. Pitts, R. Wattenhofer, eds. (Lecture Notes in Computer Science,Springer, Berlin, Germany, 2012), vol. 7392, pp. 573–585.
31. E. Candellero, N. Fountoulakis, Clustering and the hyperbolic geometry of complexnetworks. Internet Math. 12, 2–53 (2016).
32. M. A. Abdullah, N. Fountoulakis, M. Bode, Typical distances in a geometric model forcomplex networks Internet Math., 10.24166/im.13.2017 (2017).
33. T. Friedrich, A. Krohmer, On the diameter of hyperbolic random graphs. SIAM J.Discrete Math. 32, 1314–1334 (2018).
34. T. Muller, M. Staps, The diameter of KPKVB random graphs. Adv. Appl. Probab. 51,358–377 (2019).
35. M. A. Serrano, D. Krioukov, M. Boguna, Percolation in self-similar networks. Phys.Rev. Lett. 106, 048701 (2011).
36. N. Fountoulakis, T. Muller, Law of large numbers for the largest component in ahyperbolic model of complex networks. Ann. Appl. Probab. 28, 607–650 (2018).
37. M. Kiwi, D. Mitsche, Spectral gap of random hyperbolic graphs and relatedparameters. Ann. Appl. Probab. 28, 941–989 (2018).
38. A. Allard, M. A. Serrano, G. Garcıa-Perez, M. Boguna, The geometric nature ofweights in real complex networks. Nat. Commun. 8, 14103 (2017).
39. K.-K. Kleineberg, M. Boguna, M. A Serrano, F. Papadopoulos, Hidden geometriccorrelations in real multiplex networks. Nat. Phys. 12, 1076–1081 (2016).
40. K.-K. Kleineberg, L. Buzna, F. Papadopoulos, M. Boguna, M. A. Serrano, Geomet-ric correlations mitigate the extreme vulnerability of multiplex networks againsttargeted attacks. Phys. Rev. Lett. 118, 218301 (2017).
41. K.-K. Kleineberg, Metric clusters in evolutionary games on scale-free networks. Nat.Commun. 8, 1–8 (2017).
42. M. A. Serrano, M. Boguna, F. Sagues, Uncovering the hidden geometry behindmetabolic networks. Mol. Biosyst. 8, 843–850 (2012).
43. A. Allard, M. A. Serrano, Navigable maps of structural brain networks across species.PLoS Comput. Biol. 16, e1007584 (2020).
44. M. Zheng, A. Allard, P. Hagmann, Y. Aleman-Gomez, M. A. Serrano, Geometric renor-malization unravels self-similarity of the multiscale human connectome. Proc. Natl.Acad. Sci. U.S.A. 117, 20244–20253 (2020).
45. G. Garcıa-Perez, A. Allard, M. A. Serrano, M. Boguna. Mercator, Uncovering faith-ful hyperbolic embeddings of complex networks. New J. Phys. 21, 123033(2019).
46. P. Levy, Calcul des Probabilites (Gauthier-Villars, Paris, France, 1925).47. S. Borak, W. Hardle, R. Weron. “Stable distributions” in Statistical Tools for Finance
and Insurance. P. Cizek, W. K. Hardle, R. Weron, eds. (Springer, Berlin, Germany, 2005),pp. 21–44.
48. J. P. Nolan, Stable Distributions-Models for Heavy Tailed Data (Springer Nature,Boston, MA, 2019).
49. B. V. Gnedenko, A. N. Kolmogorov, Limit Distributions for Sums of IndependentRandom Variables (Addison-Wesley, Boston, MA, 1954).
50. B. B. Mandelbrot, The variation of certain speculative prices. J. Bus. 36, 394–419(1963).
51. E. F. Fama, The behavior of stock-market prices. J. Bus. 38, 34–105 (1965).52. M. Kateregga, S. Mataramvura, D. Taylor, Parameter estimation for stable distribu-
tions with application to commodity futures log-returns. Cogent Econ. Fin. 5, 1318813(2017).
Zheng et al.Scaling up real networks by geometric branching growth
PNAS | 9 of 10https://doi.org/10.1073/pnas.2018994118
Dow
nloa
ded
at U
nive
rsita
t de
Bar
celo
na o
n M
ay 1
8, 2
021

53. J. P. Nolan, Numerical calculation of stable densities and distribution functions.Commun. Stat. Stoch. Model. 13, 759–774 (1997).
54. J. Royuela-del Val, F. Simmross-Wattenberg, C. Alberola-Lopez, libstable: Fast, par-allel, and high-precision computation of α-stable distributions in R, C/C++, andMATLAB. J. Stat. Software, 78, i01 (2017).
55. S. N. Dorogovtsev, A. V. Goltsev, J. F. F. Mendes, Critical phenomena in complexnetworks. Rev. Mod. Phys. 80, 1275 (2008).
56. M. Fire, R. Puzis, Organization mining using online social networks. Network. SpatialEcon. 16, 545–578 (2016).
57. M. Kuperman, D. Zanette, Stochastic resonance in a model of opinion formation onsmall-world networks. Euro. Phys. J. B Condens. Matter. Complex Syst. 26, 387–391(2002).
58. L. Gammaitoni, P. Hanggi, P. Jung, F. Marchesoni, Stochastic resonance. Rev. Mod.Phys. 70, 223 (1998).
59. A. Pikovsky, A. Zaikin, M. A. de la Casa, System size resonance in coupled noisysystems and in the Ising model. Phys. Rev. Lett. 88, 050601 (2002).
60. R. Toral, C. J. Tessone, Finite size effects in the dynamics of opinion formation.Commun. Comput. Phys. 1, 1–19 (2006).
61. P. Jung, P. Hanggi, Stochastic nonlinear dynamics modulated by external periodicforces. Europhys. Lett. 8, 505 (1989).
62. M. E. J. Newman, R. M. Ziff, Efficient Monte Carlo algorithm and high-precisionresults for percolation. Phys. Rev. Lett. 85, 4104 (2000).
63. L. M. Pecora, F. Sorrentino, A. M. Hagerstrom, T. E. Murphy, R. Roy, Cluster synchro-nization and isolated desynchronization in complex networks with symmetries. Nat.Commun. 5, 4079 (2014).
64. M. T. Schaub, J.-C. Delvenne, R. Lambiotte, M. Barahona, “Structured networks andcoarse-grained descriptions: A dynamical perspective” in Advances in Network Clus-tering and Blockmodeling, P. Doreian, V. Batagelj, A. Ferligoj, eds. (John Wiley & Sons,Hoboken, NJ, 2019), pp. 333–361.
65. M. Zheng, G. Garcıa-Perez, M. Boguna, M. Angeles Serrano, Scaling up real networksby geometric branching growth. Zenodo. http://doi.org/10.5281/zenodo.4023964.Deposited 11 September 2020.
10 of 10 | PNAShttps://doi.org/10.1073/pnas.2018994118
Zheng et al.Scaling up real networks by geometric branching growth
Dow
nloa
ded
at U
nive
rsita
t de
Bar
celo
na o
n M
ay 1
8, 2
021


![Complex Scaling and Geometric Analysis of Several ...arXiv:math/0610710v1 [math.DG] 24 Oct 2006 Complex Scaling and Geometric Analysis of Several Variables Kang-Tae Kim Steven G. Krantz](https://static.fdocuments.in/doc/165x107/5f039aba7e708231d409df85/complex-scaling-and-geometric-analysis-of-several-arxivmath0610710v1-mathdg.jpg)