Building better dissemination systems for national development indicators Phanom Pehn , Cambodia
Scaling Up for Better HealtH in camBodia
WHO/HDS/2007.1
MINISTRY OF HEALTHKINGDOM OF CAMBODIA

Scaling Up for Better HealtH in camBodia
A Country Case Study for the World Health Organization in follow-up to the High-Level Forum
on the Health Millennium Development Goals
AcknowledgementsThis report was financed by the World Health Organization (WHO), Geneva, with funds originating from the Australian Government, through the Australian Agency for International Development. The author, Christopher Lane, can be contacted at [email protected]. The views expressed in this paper are those of the author and should not be attributed to WHO.
This report was drafted on the basis of a desk study in December 2006 and a field visit to Phnom Penh, 27 January – 9 February 2007. The author is grateful for assistance received from many stakeholders in the Cambodian health system including: Michael O’Leary, Maryam Bigdeli, Rebecca Dodd, Cecil Haverkamp, Benjamin Lane and Paul Weelen at the WHO Offices in Geneva and Cambodia; H.E. Nuth Sokhom, H.E. Eng Huot, Dr Char Meng Chuor, Dr Lo Veasna Kiri, Dr Or Vandine and Ms Khout Thavary, Ministry of Health, Cambodia; Dr Mean Chi Vun, NCHADS, Cambodia; H.E. Dr Hang Chuon Naron and Dr Sok Saravuth, Ministry of Economy and Finance, Cambodia; Theng Pagnathun, Ministry of Planning, Cambodia; John Nelmes, IMF, Cambodia; Katja Janovsky and Toomas Palu, World Bank, Cambodia; Elizabeth Smith, DFID, Cambodia; Alice Levisay, UNFPA, Cambodia and Philip Courtnadge, UNDP/CDC, Cambodia.
© World Health Organization 2007All rights reserved. Publications of the World Health Organization can be obtained from WHO Press, World Health Organization, 20 Avenue Appia, 1211 Geneva 27, Switzerland (tel: +41 22 791 2476; fax: +41 22 791 4857; email: [email protected]). Requests for permission to reproduce or translate WHO publications – whether for sale or for noncommercial distribution – should be addressed to WHO Press, at the above address (fax: +41 22 791 4806; email: [email protected]
The designations employed and the presentation of the material in this publication do not imply the expression of any opinion whatsoever on the part of the World Health Organization concerning the legal status of any country, territory, city or area or of its authorities, or concerning the delimitation of its frontiers or boundaries. Dotted lines on maps represent approximate border lines for which there may not yet be full agreement.
The mention of specific companies or of certain manufacturers’ products does not imply that they are endorsed or recommended by the World Health Organization in preference to others of a similar nature that are not mentioned. Errors and omissions excepted, the names of proprietary products are distinguished by initial capital letters.
All reasonable precautions have been taken by the World Health Organization to verify the information contained in this publication. However, the published material is being distributed without warranty of any kind, either express or implied. The responsibility for the interpretation and use of the material lies with the reader. In no event shall the World Health Organization be liable for damages arising from its use.
The named authors alone are responsible for the views expressed in this publication.
Printed in Phnom Penh, Cambodia.
Scaling Up for Better Health in Cambodia �
Table Of COnTenTS
Executive Summary 3
1. Context of the High-Level Forums on the Health MDGs 5
2. Policy and financing framework for scaling up health services 8
3. Resource flows in the health sector 11
(a) Health providers 11
(b) Financial resources 12
(c) Human resource issues 23
4. Illustrative financial scaling-up scenarios 25
5. Illustrative costs of scaling up health services 29
6. Summary of constraints to scaling up for better health and the advocacy role 33 of the Post-HLF process
Annex 1. Estimated donor disbursements for health, 2003 and 2005 36
Annex 2. Source data for costing exercise 37
References 43
2 Scaling Up for Better Health in Cambodia
liST Of aCrOnymS
AsDB Asian Development BankAOP Annual Operational PlanCCM Country Coordinating MechanismCDC Council for the Development of CambodiaCDHS Cambodia Demographic and Health SurveyCPA Complementary Package of ActivitiesCPIA Country Policy and Institutional AssessmentDFID Department for International DevelopmentDHS Demographic and Health SurveyGAVI The GAVI Alliance (formerly known as the Global Alliance for Vaccines and Immunization)GDP Gross Domestic ProductGFATM The Global Fund to Fight AIDS, Tuberculosis and MalariaGHP Global Health PartnershipHEF Health Equity FundHFCP Health Facility Coverage PlanHLF High-Level ForumHNI HealthNet InternationalHSP Health Strategic PlanIMF International Monetary FundJAPR Joint Annual Performance ReviewMBPI Merit-Based Pay InitiativeMDGs Millennium Development GoalsMOH Ministry of HealthMPA Minimum Package of ActivitiesMTEF Medium-Term Expenditure FrameworkNCHADS National Centre for HIV/AIDS, Dermatology and STDsNSDP National Strategic Development PlanOD Operational DistrictOECD Organisation for Economic Co-operation and DevelopmentOPM Oxford Policy ManagementPAP Priority Action ProgrammePETS Public Expenditure Tracking SurveyPFM Public Finance ManagementPHC Primary Health CarePHD Provincial Health DepartmentPIU Project Implementation UnitPIP Public Investment PlanPMG Priority Mission GroupPRSP Poverty Reduction Strategy PaperSTDs Sexually-Transmitted DiseasesSWAp Sector-Wide ApproachSWiM Sector-Wide ManagementTB TuberculosisTWG-H Technical Working Group for HealthUNDP United Nations Development ProgrammeUNFPA United Nations Population FundURC University Research Co. Llc.WB World BankWHO World Health Organization
Scaling Up for Better Health in Cambodia �
exeCuTive Summary
contextThis report analyses the barriers to scaling up health service provision in Cambodia with a view to attaining the health millennium development goals (MDGs). It focuses primarily on financial and administrative impediments, but also considers the extent to which human resources and the institutional framework pose binding constraints to achieving the MDGs. The report is aimed at: (1) a Cambodian audience, in the context of the ongoing review of the Health Strategic Plan (HSP) and complements reviews of the Sector-Wide Management (SWiM) Approach and discussions on donor harmonization and alignment; and (2) an international audience in the context of country studies for the High-Level Forum (HLF) on the Health MDGs and its follow-up process.
The health status of Cambodians is clearly improving as a result of rising incomes, a reduction of health costs, and increasing spending on health. Based on recent trends, the Cambodian MDGs to reduce infant and child mortality, lower the fertility rate, improve antenatal care and reduce HIV/AIDS prevalence are likely to be met or exceeded. Success is less assured for maternal mortality, contraceptive prevalence, attended births, and combating tuberculosis (TB) and malaria.
But despite these encouraging signs, much remains to be done.
◗ Key health indicators are weaker than in neighboring countries even though total health spending in Cambodia is higher per head.
◗ Public service wages are very low and service quality correspondingly weak: only one in five illness episodes is treated in the public sector.
◗ There are shortages of key medical personnel (particularly midwives).
◗ Financial barriers prevent a large section of the population from accessing essential health services.
◗ The limited amount of public finance for health does not yet have robust systems to track its use and efficacy which poses a major constraint for planning and health-efficient resource allocation.
◗ External aid for health, while substantial, is highly fragmented and not closely aligned to stated health priorities.
key findings Much of the policy and financing framework for scaling up for better health is in place. The primary challenge ahead is to translate the stated strategic health objectives and desired service packages into a comprehensive assessment of financial resources needed for implementation, and to establish a means to track the impact of financial flows on health outcomes.
With recent higher levels of public health spending, rising donor flows and already high levels of out-of-pocket private spending, adequacy of gross health financing does not currently appear to be the central impediment to achieving the health MDGs. But there are serious issues relating to the allocation and efficiency of use of existing resources that could be tackled more energetically by government and the donor community in order to transition from a health system financed largely by out-of-pocket payments and weak private providers to one where efficient public health services play a more prominent role.
An effective transition will also depend on raising the effectiveness with which resources are deployed. In this context, institutional fragmentation and rigidity in both the external aid community and domestic health system remain barriers to progress. Simply scaling up financial or human resources that cannot be allocated and used efficiently is unlikely to translate into dramatically improved health outcomes. At the same time, the outlook for tackling the identified efficiency constraints is generally positive and the resource issues are continuing to show improvement.
The aggregate numbers of health professionals do not appear to be an overriding constraint to scaling up for better health, but skill levels and the incentives provided to deploy existing human resources effectively could be much improved.
This report projects trends in overall health financing over the decade to 2015 (including government, donor and out-of-pocket sources) based on existing macroeconomic and budgetary projections. It then looks at the potential costs of scaling up in the health sector (based on existing studies) and considers the financing gap, and the implications for financial sustainability. The financing and costing scenarios show that:
◗ Based on current trends, health financing per capita is likely to increase by nearly 80% in nominal terms, and just under 50% in real terms, by 2015. However, private
(out-of-pocket) spending on health would remain the main component of health financing. The scenario suggests that the health budget (combining donors and government) would rise by US$ 10 per capita. If higher government/donor spending led to efficiency gains (by substituting for out-of-pocket spending), then overall health spending could decline as a share of gross domestic product (GDP). The incremental costs for strengthening primary health facilities, reducing financial barriers to access and introducing performance-based pay are estimated to be an extra US$ 2 per head per year.
◗ If the financing scenario is accurate, donor/government resources will not cover these extra costs until 2011, i.e. a financing gap would exist in the period 2007–2011. Government financing alone could only cover the extra costs from 2013, suggesting that additional donor-bridge financing would be needed for a period of up to five to six years.
next stepsThe last section of this report identifies actions that would strengthen efforts to achieve the health MDGs. Many of these actions are already under way or under consideration.
Steps to strengthen the policy and financing framework
◗ Elaborate a rolling Medium-Term Expenditure Framework (MTEF) for the health sector, based on the existing three-year operational plan, consistent with the health strategic plan, and with a comprehensive-costed expansion of service provision.
◗ Integrate the health Public Investment Plan (PIP) process into the existing annual and three-year operational plan process.
◗ Define more clearly the national health financing strategy based on evaluation of existing pilots for contracting and equity funds.
◗ Align the annual operational plan and the programme-based budget so that budget execution data can be used to link financial flows to health outcomes.
Steps to overcome financial impediments to scaling up
◗ Devolve budget control and management closer to service delivery, under the stewardship of the central Ministry of Health (MOH) (as envisaged by ongoing public sector reform efforts).
◗ Some donors to consider integrating a core segment of their financing into the budget, perhaps as early as 2009 in the planned successor to the Health Sector Support Project (§P).
◗ Donors and government to work together to build consensus on the policy framework for scaling up. Contracting and equity funds and increasing the share of donor funds that would flow through the budget are areas that require particular attention. To this end, the establishment of a government/donor task team on deepening harmonization and alignment is encouraging.
◗ As an incremental step, aid-financing flows could be delivered at the level of the health sector where implementation takes place.
◗ Improve tracking of the commitment and use of donor funds.
Steps to address human resource impediments to scaling up (in the process of implementation or under consideration)
◗ Merit-based performance incentives for key managerial positions as a first step towards decent pay for health sector employees.
◗ Performance-related salary supplements paid in operational districts.
◗ A joint needs assessment of capacity gaps across the health system, leading to a long-term capacity and skill-building strategy, in order to move away from initiatives which address the specific needs of programmes or projects, but which do not take a holistic approach.
Finally, the view of many stakeholders is that intersectoral linkages to health are a neglected area with the potential to further achievement of MDG goals with limited resource inputs. Two examples that could have significant impacts on health status are: (1) improving clean water supplies and reducing waterborne diseases; and (2) use of charcoal and respiratory problems. Further study would be beneficial.
� Scaling Up for Better Health in Cambodia
exeCuTive Summary
Scaling Up for Better Health in Cambodia �
1. COnTexT Of THe HigH-level fOrumS On THe HealTH mDgs
To spur action on alignment and harmonization between development partners and country-level governments, participants at the High-Level Forums on the Health MDGs suggested that at least two “proof of concept” country case studies be conducted.1 These studies would analyse the scope for addressing critical administrative and financial bottlenecks that could impede attainment of health MDGs at the country level. Actions would focus on improvements to macro- economic frameworks, poverty reduction strategy papers (PRSPs), health sector strategies, MTEFs, domestic financing and development partner coordination and funding arrangements. The studies are expected to contribute to advocacy efforts at the international level for development partners to improve the quality of aid for health. At the local level, the studies could identify support needed to improve spending and aid allocation and efficiency.
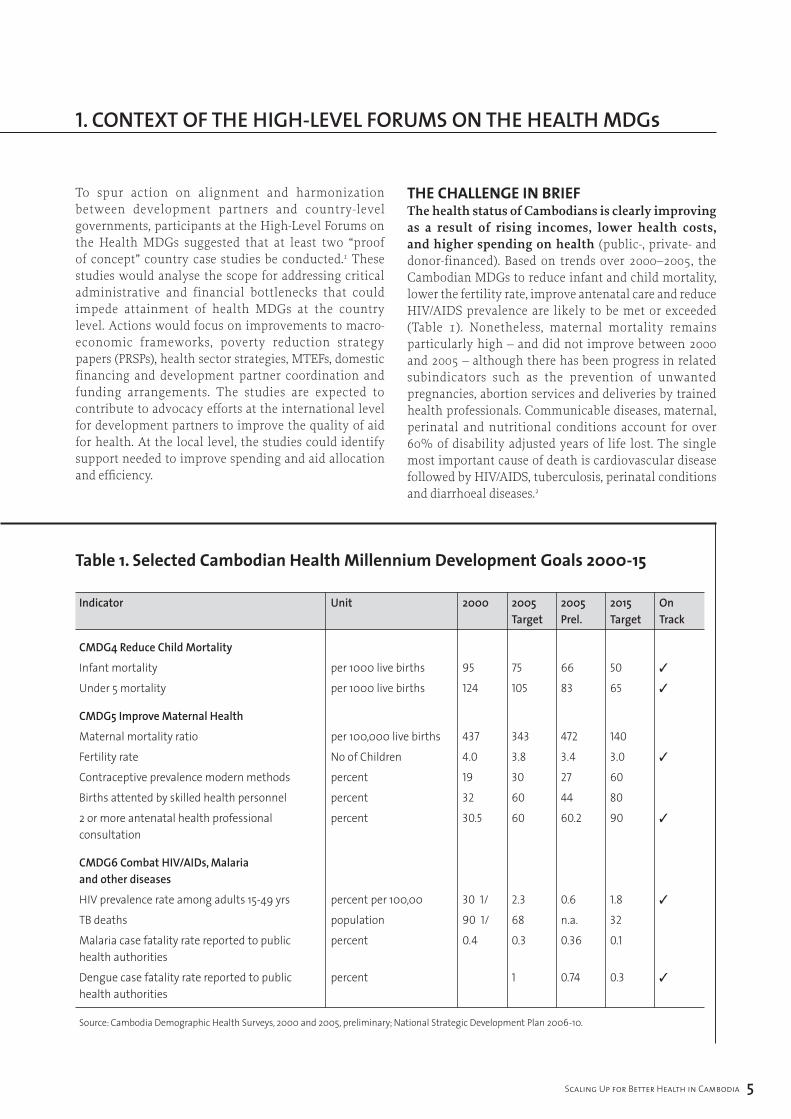
the chAllenge in briefThe health status of Cambodians is clearly improving as a result of rising incomes, lower health costs, and higher spending on health (public-, private- and donor-financed). Based on trends over 2000–2005, the Cambodian MDGs to reduce infant and child mortality, lower the fertility rate, improve antenatal care and reduce HIV/AIDS prevalence are likely to be met or exceeded (Table 1). Nonetheless, maternal mortality remains particularly high – and did not improve between 2000 and 2005 – although there has been progress in related subindicators such as the prevention of unwanted pregnancies, abortion services and deliveries by trained health professionals. Communicable diseases, maternal, perinatal and nutritional conditions account for over 60% of disability adjusted years of life lost. The single most important cause of death is cardiovascular disease followed by HIV/AIDS, tuberculosis, perinatal conditions and diarrhoeal diseases.2
table 1. Selected cambodian Health millennium development goals 2000-15
Indicator Unit 2000 200� 200� 20�� On Target Prel. Target Track
CMDG� Reduce Child Mortality
Infant mortality per 1000 live births 95 75 66 50 ✓
Under 5 mortality per 1000 live births 124 105 83 65 ✓
CMDG� Improve Maternal Health
Maternal mortality ratio per 100,000 live births 437 343 472 140
Fertility rate No of Children 4.0 3.8 3.4 3.0 ✓
Contraceptive prevalence modern methods percent 19 30 27 60
Births attented by skilled health personnel percent 32 60 44 80
2 or more antenatal health professional percent 30.5 60 60.2 90 ✓ consultation
CMDG6 Combat HIV/AIDs, Malaria and other diseases
HIV prevalence rate among adults 15-49 yrs percent per 100,00 30 1/ 2.3 0.6 1.8 ✓
TB deaths population 90 1/ 68 n.a. 32
Malaria case fatality rate reported to public percent 0.4 0.3 0.36 0.1health authorities
Dengue case fatality rate reported to public percent 1 0.74 0.3 ✓
health authorities
Source: Cambodia Demographic Health Surveys, 2000 and 2005, preliminary; National Strategic Development Plan 2006-10.
6 Scaling Up for Better Health in Cambodia
1. COnTexT Of THe HigH-level fOrumS On THe HealTH mDgs
But despite some very encouraging signs of progress, much remains to be done:
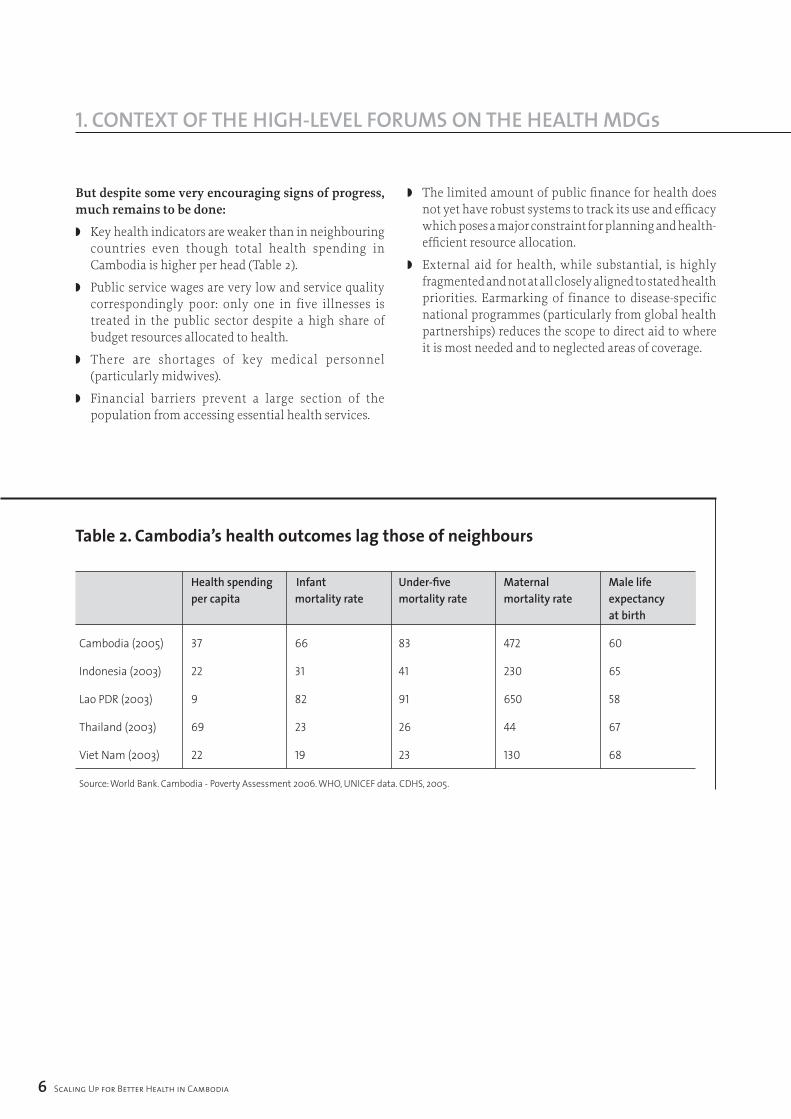
◗ Key health indicators are weaker than in neighbouring countries even though total health spending in Cambodia is higher per head (Table 2).
◗ Public service wages are very low and service quality correspondingly poor: only one in five illnesses is treated in the public sector despite a high share of budget resources allocated to health.
◗ There are shortages of key medical personnel (particularly midwives).
◗ Financial barriers prevent a large section of the population from accessing essential health services.
◗ The limited amount of public finance for health does not yet have robust systems to track its use and efficacy which poses a major constraint for planning and health-efficient resource allocation.
◗ External aid for health, while substantial, is highly fragmented and not at all closely aligned to stated health priorities. Earmarking of finance to disease-specific national programmes (particularly from global health partnerships) reduces the scope to direct aid to where it is most needed and to neglected areas of coverage.
table 2. cambodia’s health outcomes lag those of neighbours
Health spending Infant Under-five Maternal Male life per capita mortality rate mortality rate mortality rate expectancy at birth
Cambodia (2005) 37 66 83 472 60
Indonesia (2003) 22 31 41 230 65
Lao PDR (2003) 9 82 91 650 58
Thailand (2003) 69 23 26 44 67
Viet Nam (2003) 22 19 23 130 68
Source: World Bank. Cambodia - Poverty Assessment 2006. WHO, UNICEF data. CDHS, 2005.
Scaling Up for Better Health in Cambodia 7
Donors support a shared sector policy and strategy (known as Sector-Wide Management or SWiM) focused on broad coordination issues such as formulating plans and targets and reviewing progress. A subgroup of donors jointly finance a health sector reform project (World Bank, DfID, Asian Development Bank and UNFPA). However, outside of this subgroup, there is less focus on moving towards harmonized management and implementation procedures and formal agreements with the government on aid modalities.
outline of the cAse studyThe overall case study is premised on the idea that the main impediments to scaling up can be grouped as those relating to: institutional planning and strategy arrangements, financial resources, and human resources. These constraints are discussed in turn with actions that might contribute to relaxing the constraints. The institutional framework for defining and allocating health
spending and financing over the medium term (strategic) and in the short term (operational) is discussed in Section 2. We then consider financial and human resources and their implications for scaling up service provision over the medium term in Section 3.
Section 4 develops an overall health-financing scenario for government, donor and private financing for health. Section 5 develops indicative costs of actions that could address specific resource bottlenecks, based on existing studies and analyses how these might be financed. The final section summarizes recommendations and areas in which the post-HLF process might play advocacy and support roles.
The case study linked closely with a review of the SWiM conducted in late 2006 and a parallel donor mission that consulted with donors on ways to strengthen harmonization and alignment of aid in support of Cambodia.
� Scaling Up for Better Health in Cambodia
2. POliCy anD finanCing frameWOrk fOr SCaling uP HealTH ServiCeS
The strategic vision of the MOH is clear. The 2003–2007 HSP adopts 20 strategies, of which eight form the essential core. Of the core strategies, improving health service delivery (comprising three elements) is the stated top priority. Service delivery objectives are: (i) improve access and coverage for the poor; (ii) deliver the minimum package of activities (MPA) at the primary health level; and (iii) deliver the complementary package of activities (CPA) at hospitals (particularly obstetric and paediatric care). The other priority strategies are: behavioural change of health providers; quality improvement in public health; human resource development focused on midwife training; a stable and increasing flow of funds to health; and, organizational and management reform in the MOH to respond effectively to change. The HSP is monitored through health coverage, facility utilization, and health outcome indicators which are evaluated at the annual Joint Annual Performance Report (JAPR). In parallel, there is a strategic framework for tackling HIV/AIDS (2006–2010). The broad strategies for health and HIV/AIDS are integrated into the National Strategic Development Plan (NSDP, 2006–2010).
Several efforts have been made to develop an MTEF for health albeit with less than full coverage of financing and weak data on health service delivery costs. The 2003–2007 MTEF, which parallels the HSP, used an indicative costing model for health services delivery, and identified funding gaps of US$ 80–100 million per year, mainly because of partial coverage of development partners’ actual and projected financial support. Separately, work is ongoing on a three-year rolling operational plan linking spending to health programmes and health objectives down to the provincial level. The three-year rolling plan is not yet fully operational as it still lacks a substantial proportion of information on development partner-projected funding by recipient and objective. It also lacks reliable information on fixed and variable costs of service provision at the operational district (OD) level that would enable costing increases in public service delivery at the primary health care (PHC) level.3 Independent of the rolling plan, the Ministry of Economy and Finance produces a sectoral breakdown of projected spending consistent with its MTEF, based upon the sectoral spending pattern in the NSDP.
The PIP for health summarizes the main investment projects by programme over a rolling three-year horizon. Aside from articulating the purpose and benefits of the programmes, its main use is to allocate the government investment budget and identify funding
gaps. In practice, most of the 24 health programmes in the PIP have a significant financing gap, including in the first year of the investment programme. With some notable exceptions, the project justifications/benefit appraisals do not enable a comparison of costs and benefits across projects. Another weakness in the PIP is that donor financing is aggregated at the programme level, making it difficult to hold donors accountable for their committed financial support. Moreover, there appears to be no system to report PIP outcomes either for government or donor financing flows, and the programme format utilized appears to have been developed independently of the recurrent budget format utilized by the MOH.
The MOH has defined some elements of a medium-term health financing strategy. The 1998 National Charter on Health Financing encouraged the development of a variety of health-financing schemes for testing and evaluation. This, in turn, led to the development of a policy of user fees at all levels of the health system, and numerous innovative pilots of contracting health service provision, health equity funds and community-based health insurance schemes. In support of the Health Financing Charter, a master plan for social health insurance was approved in 2003 envisaging compulsory health insurance for formal sector workers, voluntary community-based insurance and social assistance through equity funds. In 2005, a National Equity Fund Implementation and Monitoring Framework was approved although key issues such as population coverage and the benefit package vary across Health Equity Fund (HEF) schemes. In parallel, a government-wide process of decentralization and deconcentration is under discussion. While the details of the reform are not yet decided, the implications for the health sector are increased responsibilities for provincial and commune authorities in setting and executing health budgets.
Much of the medium-term institutional framework for scaling up for better health is in place. The primary challenge ahead is to translate the stated strategic health objectives and desired service packages into costed medium-term plans for the public sector. In parallel, this will enable the MOH to define more clearly the relative contributions of the public sector, donors and private payments in a comprehensive health financing strategy. The challenge ahead is most evident at the primary service delivery level (health centres, district hospitals) where the decade-long experience with contracting services and health equity funds now needs to be translated into national policies for service delivery and
Scaling Up for Better Health in Cambodia �
2. POliCy anD finanCing frameWOrk fOr SCaling uP HealTH ServiCeS
associated financing. Health sector medium-term costing and financing will provide a powerful advocacy tool for maintaining and increasing budgetary resources allocated to health, as well as catalysing external finance in support of the health strategy.
The short-term planning machinery effectively identifies priority (key) areas of work to implement the health sector strategy. The key areas of work are identified through the JAPR. For 2006, the priorities are: (i) emergency obstetric care; (ii) attendance at delivery by trained health providers; (iii) integrated management of childhood illnesses; (iv) full MPA status at health centres; and (v) birth-spacing strategies.
Public health spending is set out in two separate documents: the annual health budget plan focused on inputs and the health sector annual operational plan (AOP) focused on outputs. Consequently, budget institutions produce separate budgets classified by inputs (budget) and by outputs (AOP) and adjust the output budget in line with the approved annual budget as needed.
The annual budget covers self-financed spending, including that financed by user fees at the facility level and donor financing that is delivered through the treasury system (none at present), excluding own capital investment funds, and is presented by health institution on an input basis (wages, goods and services, etc.). In 2007, there is a partial shift towards programme budgeting for selected health strategies, although this excludes notably wages. The budget covers central health institutions (headquarters, national programmes and hospitals) and provincial health departments (PHDs). The budget does not indicate transfers from the provincial level to ODs or from ODs to health service delivery centres (health centres and referral hospitals).
The health sector AOP links the annual budget and donor financing to health sector activities and priorities. Financing is allocated across objectives for MOH headquarters (34 objectives), national hospitals (13), public health programmes (42) and provinces (70). Therefore, the AOP can be used, for example, to show the planned allocation of financial resources to the five priority work areas (which cover about a third of the total number of objectives and a quarter of total government and donor financing in 2006) or the source of expected funding for each objective at each level of the health system down to the provincial level.
The success in achieving objectives is monitored through facility records, household surveys and the health information system and is not linked to financial flows. The AOP cannot - in its present form - be used to track the allocation of financial resources across objectives for several reasons: budget execution data does not indicate the objective of expenditure, disbursement data from external partners is not received on a timely basis or in a consistent format, and the number of objectives would make financial accounting by either the budget or donors extremely difficult. A key policy advance would be to refine the AOP to link it more closely to budget execution and thereby enable the tracking of financial resources to service outcomes. This would enable health managers to track how efficiently resources are used, and target areas for improving resource allocation efficiency. Better tracking would also encourage external partners to use the budget system to deliver funding. As public finance management reforms take root, the alignment of the AOP with budget formulation and reporting should prove be possible, most likely using a programme budget classification for three or four core health objectives. The 2007 health budget marks a significant step towards a more programmatic approach with the budget divided into five main programmes. The next significant step is to allocate wages and administration costs to the three main health programmes (communicable disease control, noncommunicable diseases and other health-related issues, and child and maternal health).
The elaboration of the policy framework involves extensive consultation between the MOH and development partners. Development partners are involved at all stages of elaboration of the policy framework, from the HSP to the AOP underpinned by the extensive provision of technical assistance. The main consultation points are: defining and reviewing the HSP (a strategy review is ongoing through reviews of the sector wide management in health, contracting and midwife training); the annual joint annual performance review which assesses progress and defines priorities ahead; and monthly meetings of the technical working group for health (TWG-H) that primarily operate as a forum for information exchange.
�0 Scaling Up for Better Health in Cambodia
2. POliCy anD finanCing frameWOrk fOr SCaling uP HealTH ServiCeS
Summary of institutional framework and strategy impediments to scaling up Many of the key elements of a country-owned strategy for the development of the health sector are in place: A strategic health sector plan (Health Strategic Plan 2003–2007, currently under review for period beyond 2007) setting out broad priorities, a strategic plan for HIV/AIDS (National Strategic Plan for Multisector Response to HIV/AIDS 2006–2010), a rolling three-year operational plan for the health sector (Annual Operational Plan 2005–2007), and a joint performance review conducted with development partners on an annual basis (JAPR, 2006). The existing short- and medium-term strategies set out clear objectives in terms of desired improvements in health outcomes in considerable detail, elaborate a wide range of targets to assess progress and a monitoring system to gauge whether progress is being implemented.
The recognized weaknesses in strategic planning relate to the assessment of financial resources needed for implementation. Actions in four key areas would provide a more supportive policy environment for scaling up for better health. In each area, work is already initiated or under way, and the ongoing HSP review provides the opportunity to further advance preparations. The key areas identified above are:
◗ Elaborate a rolling MTEF for the health sector consistent with the HSP, based on a costed expansion of service provision. The three-year rolling operational plan should form the basis of this framework extended to a five-year horizon for the major spending and financing aggregates. The rolling expenditure framework should be reflected in the Ministry of Economy and Finance MTEF (with discrepancies resolved during the budget submission process). The child survival package costing already undertaken would constitute an element of this expenditure framework. Existing pilots for contracting services and health equity funds could be other elements of the costing as discussed further in Section 5.
◗ Integrate the health PIP process into the existing annual and three-year operational plan process. This will better highlight the financing needs of the health sector, particularly as regards external finance.
◗ Align the annual operational plan and the programme-based budget so that budget execution data can be used to link financial resources to health outcomes.
◗ Define more clearly the national health financing strategy based on evaluation of existing pilots for contracting and equity funds. The ongoing review of contracting is a key input to defining the strategy.
Scaling Up for Better Health in Cambodia ��
2. POliCy anD finanCing frameWOrk fOr SCaling uP HealTH ServiCeS 3. reSOurCe flOWS in THe HealTH SeCTOr
This section summarizes financial and human resource allocation in the health sector and implications for scaling up.
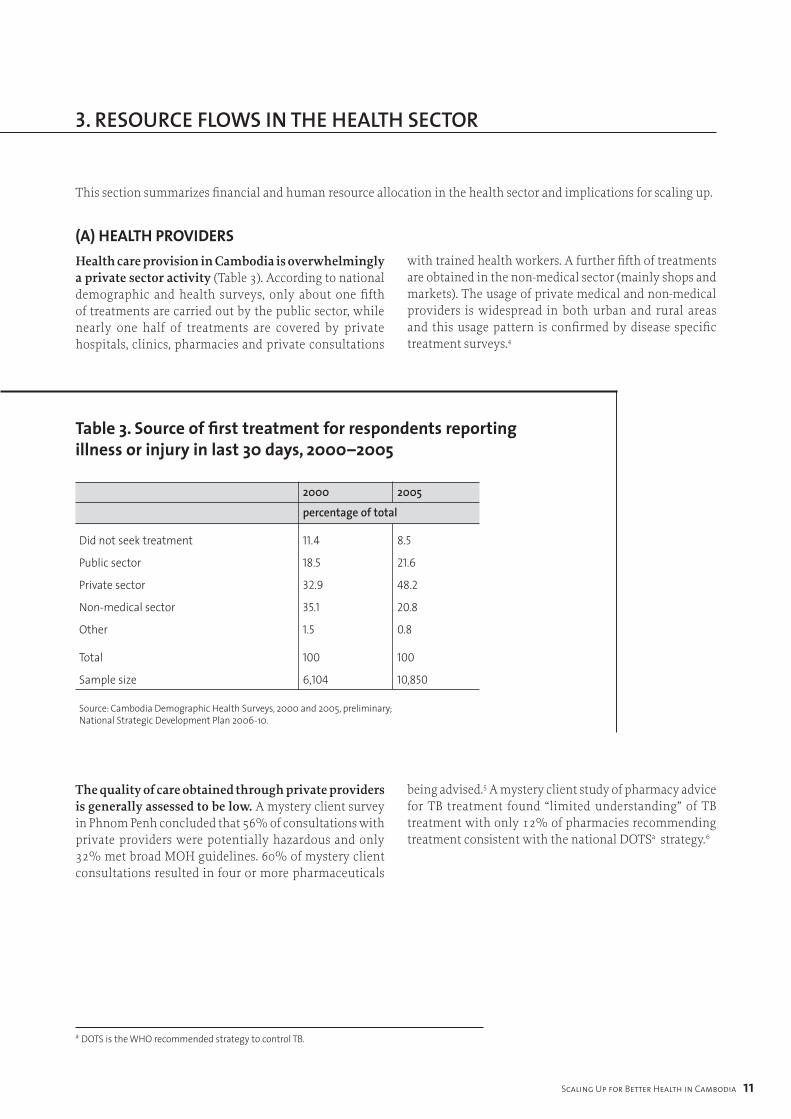
table 3. Source of first treatment for respondents reporting illness or injury in last 30 days, 2000–2005
2000 200�
percentage of total
Did not seek treatment 11.4 8.5
Public sector 18.5 21.6
Private sector 32.9 48.2
Non-medical sector 35.1 20.8
Other 1.5 0.8
Total 100 100
Sample size 6,104 10,850
Source: Cambodia Demographic Health Surveys, 2000 and 2005, preliminary; National Strategic Development Plan 2006-10.
The quality of care obtained through private providers is generally assessed to be low. A mystery client survey in Phnom Penh concluded that 56% of consultations with private providers were potentially hazardous and only 32% met broad MOH guidelines. 60% of mystery client consultations resulted in four or more pharmaceuticals
being advised.5 A mystery client study of pharmacy advice for TB treatment found “limited understanding” of TB treatment with only 12% of pharmacies recommending treatment consistent with the national DOTSa strategy.6
a DOTS is the WHO recommended strategy to control TB.
(A) heAlth providers Health care provision in Cambodia is overwhelmingly a private sector activity (Table 3). According to national demographic and health surveys, only about one fifth of treatments are carried out by the public sector, while nearly one half of treatments are covered by private hospitals, clinics, pharmacies and private consultations
with trained health workers. A further fifth of treatments are obtained in the non-medical sector (mainly shops and markets). The usage of private medical and non-medical providers is widespread in both urban and rural areas and this usage pattern is confirmed by disease specific treatment surveys.4
�2 Scaling Up for Better Health in Cambodia
3. reSOurCe flOWS in THe HealTH SeCTOr
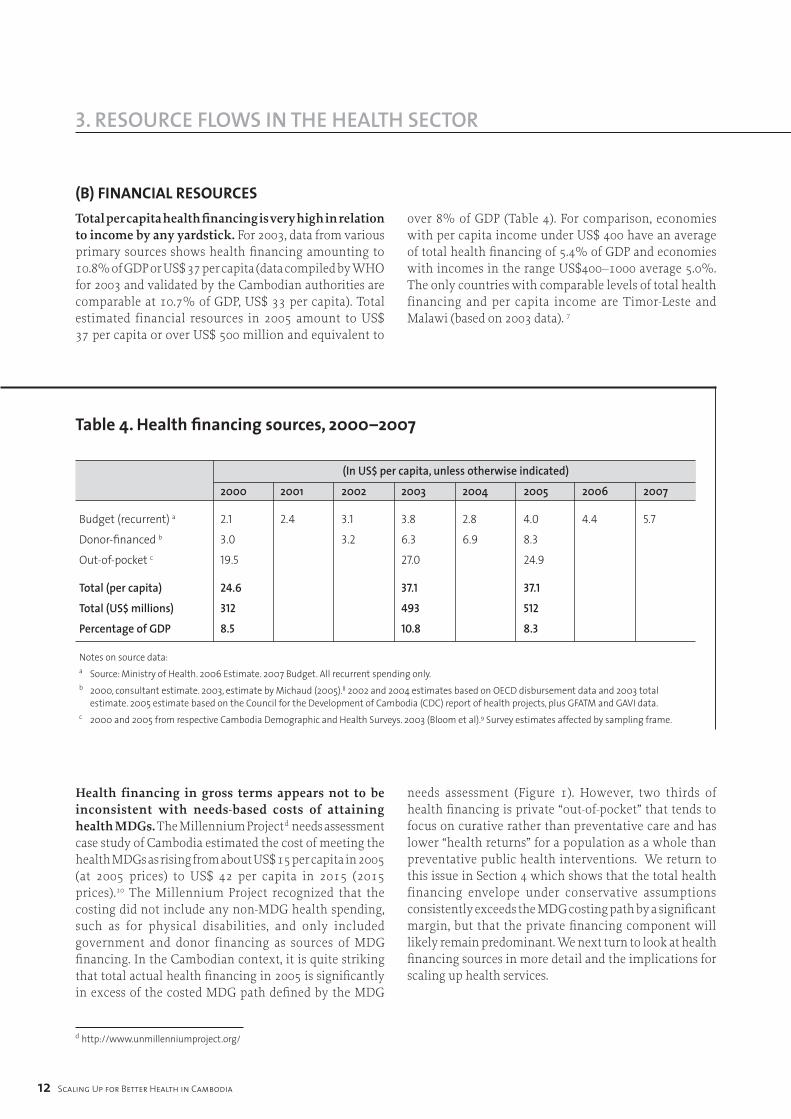
(b) finAnciAl resourcesTotal per capita health financing is very high in relation to income by any yardstick. For 2003, data from various primary sources shows health financing amounting to 10.8% of GDP or US$ 37 per capita (data compiled by WHO for 2003 and validated by the Cambodian authorities are comparable at 10.7% of GDP, US$ 33 per capita). Total estimated financial resources in 2005 amount to US$ 37 per capita or over US$ 500 million and equivalent to
over 8% of GDP (Table 4). For comparison, economies with per capita income under US$ 400 have an average of total health financing of 5.4% of GDP and economies with incomes in the range US$400–1000 average 5.0%. The only countries with comparable levels of total health financing and per capita income are Timor-Leste and Malawi (based on 2003 data). 7
table 4. Health financing sources, 2000–2007
(In US$ per capita, unless otherwise indicated)
2000 200� 2002 200� 200� 200� 2006 2007
Budget (recurrent) a 2.1 2.4 3.1 3.8 2.8 4.0 4.4 5.7
Donor-financed b 3.0 3.2 6.3 6.9 8.3
Out-of-pocket c 19.5 27.0 24.9
Total (per capita) 24.6 37.1 37.1
Total (US$ millions) 312 493 512
Percentage of GDP 8.5 10.8 8.3
Notes on source data:a Source: Ministry of Health. 2006 Estimate. 2007 Budget. All recurrent spending only.b 2000, consultant estimate. 2003, estimate by Michaud (2005).8 2002 and 2004 estimates based on OECD disbursement data and 2003 total estimate. 2005 estimate based on the Council for the Development of Cambodia (CDC) report of health projects, plus GFATM and GAVI data.c 2000 and 2005 from respective Cambodia Demographic and Health Surveys. 2003 (Bloom et al).9 Survey estimates affected by sampling frame.
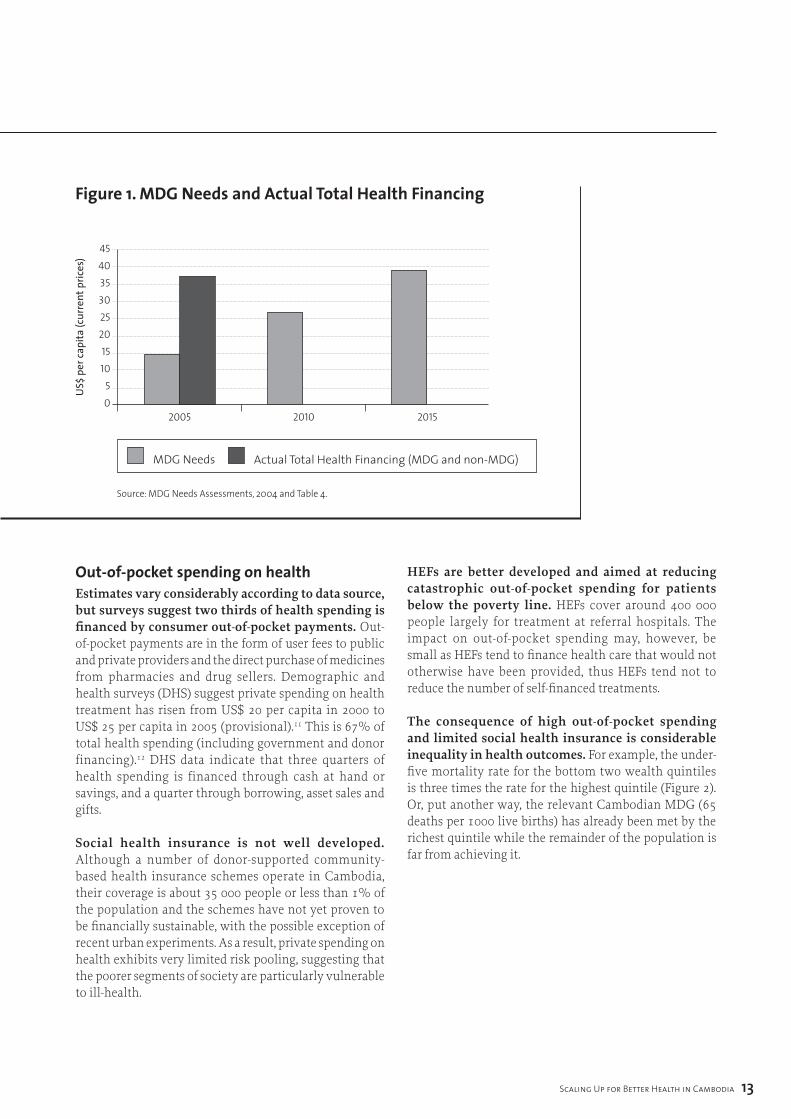
Health financing in gross terms appears not to be inconsistent with needs-based costs of attaining health MDGs. The Millennium Projectd needs assessment case study of Cambodia estimated the cost of meeting the health MDGs as rising from about US$ 15 per capita in 2005 (at 2005 prices) to US$ 42 per capita in 2015 (2015 prices).10 The Millennium Project recognized that the costing did not include any non-MDG health spending, such as for physical disabilities, and only included government and donor financing as sources of MDG financing. In the Cambodian context, it is quite striking that total actual health financing in 2005 is significantly in excess of the costed MDG path defined by the MDG
needs assessment (Figure 1). However, two thirds of health financing is private “out-of-pocket” that tends to focus on curative rather than preventative care and has lower “health returns” for a population as a whole than preventative public health interventions. We return to this issue in Section 4 which shows that the total health financing envelope under conservative assumptions consistently exceeds the MDG costing path by a significant margin, but that the private financing component will likely remain predominant. We next turn to look at health financing sources in more detail and the implications for scaling up health services.
d http://www.unmillenniumproject.org/
Scaling Up for Better Health in Cambodia ��
3. reSOurCe flOWS in THe HealTH SeCTOr
figure 1. mdg needs and actual total Health financing
out-of-pocket spending on healthEstimates vary considerably according to data source, but surveys suggest two thirds of health spending is financed by consumer out-of-pocket payments. Out-of-pocket payments are in the form of user fees to public and private providers and the direct purchase of medicines from pharmacies and drug sellers. Demographic and health surveys (DHS) suggest private spending on health treatment has risen from US$ 20 per capita in 2000 to US$ 25 per capita in 2005 (provisional).11 This is 67% of total health spending (including government and donor financing).12 DHS data indicate that three quarters of health spending is financed through cash at hand or savings, and a quarter through borrowing, asset sales and gifts.
Social health insurance is not well developed. Although a number of donor-supported community-based health insurance schemes operate in Cambodia, their coverage is about 35 000 people or less than 1% of the population and the schemes have not yet proven to be financially sustainable, with the possible exception of recent urban experiments. As a result, private spending on health exhibits very limited risk pooling, suggesting that the poorer segments of society are particularly vulnerable to ill-health.
HEFs are better developed and aimed at reducing catastrophic out-of-pocket spending for patients below the poverty line. HEFs cover around 400 000 people largely for treatment at referral hospitals. The impact on out-of-pocket spending may, however, be small as HEFs tend to finance health care that would not otherwise have been provided, thus HEFs tend not to reduce the number of self-financed treatments.
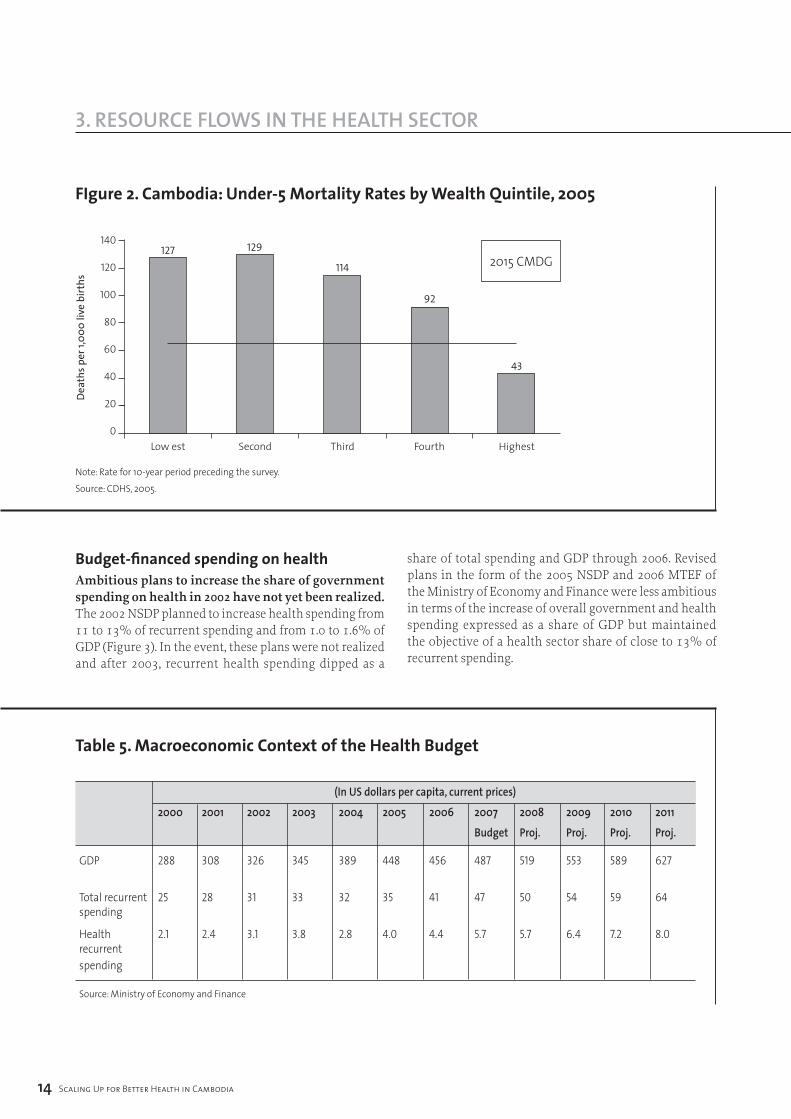
The consequence of high out-of-pocket spending and limited social health insurance is considerable inequality in health outcomes. For example, the under-five mortality rate for the bottom two wealth quintiles is three times the rate for the highest quintile (Figure 2). Or, put another way, the relevant Cambodian MDG (65 deaths per 1000 live births) has already been met by the richest quintile while the remainder of the population is far from achieving it.
4540353025201510
50
2005 2010 2015
MDG Needs Actual Total Health Financing (MDG and non-MDG)
Source: MDG Needs Assessments, 2004 and Table 4.
US$
per
capi
ta (c
urre
nt p
rices
)
�� Scaling Up for Better Health in Cambodia
3. reSOurCe flOWS in THe HealTH SeCTOr
figure 2. cambodia: Under-5 mortality rates by Wealth Quintile, 2005
140
120
100
80
60
40
20
0Low est Second Third Fourth Highest
127 129
114
92
43
Dea
ths p
er 1,
000
live
birt
hs
Note: Rate for 10-year period preceding the survey.Source: CDHS, 2005.
2015 CMDG
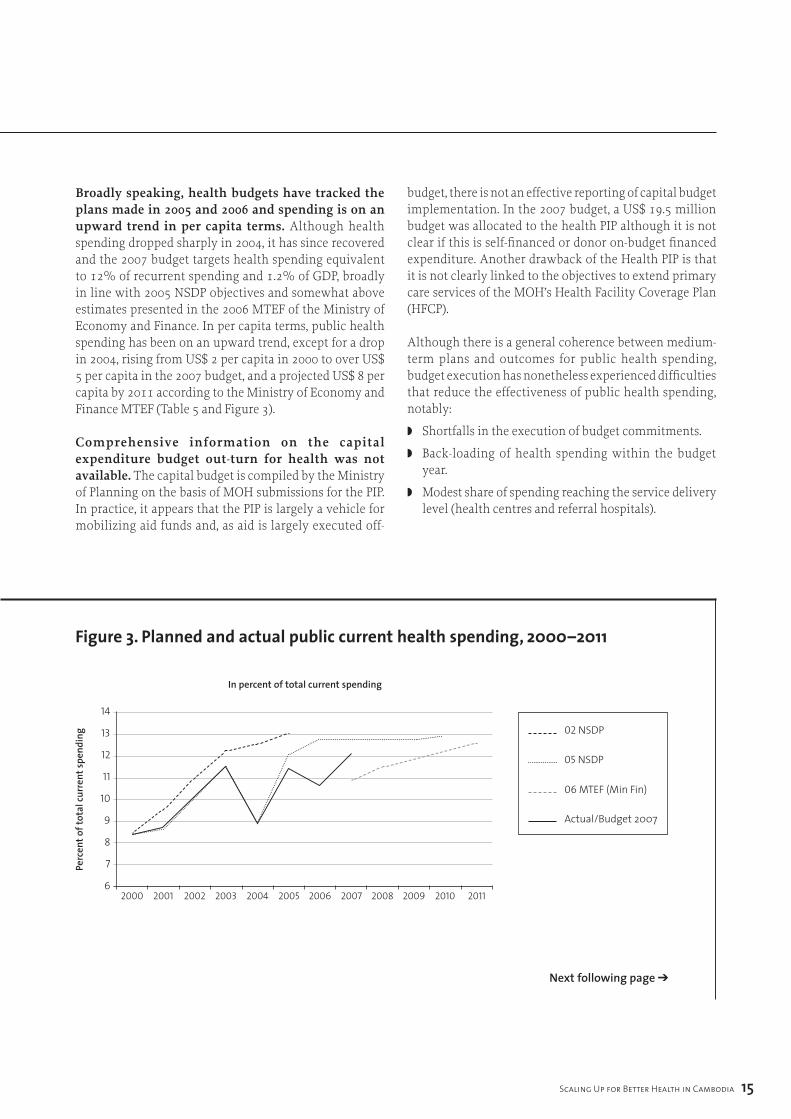
Budget-financed spending on healthAmbitious plans to increase the share of government spending on health in 2002 have not yet been realized. The 2002 NSDP planned to increase health spending from 11 to 13% of recurrent spending and from 1.0 to 1.6% of GDP (Figure 3). In the event, these plans were not realized and after 2003, recurrent health spending dipped as a
share of total spending and GDP through 2006. Revised plans in the form of the 2005 NSDP and 2006 MTEF of the Ministry of Economy and Finance were less ambitious in terms of the increase of overall government and health spending expressed as a share of GDP but maintained the objective of a health sector share of close to 13% of recurrent spending.
table 5. macroeconomic context of the Health Budget
(In US dollars per capita, current prices)
2000 200� 2002 200� 200� 200� 2006 2007 200� 200� 20�0 20��
Budget Proj. Proj. Proj. Proj.
GDP 288 308 326 345 389 448 456 487 519 553 589 627
Total recurrent 25 28 31 33 32 35 41 47 50 54 59 64 spending
Health 2.1 2.4 3.1 3.8 2.8 4.0 4.4 5.7 5.7 6.4 7.2 8.0 recurrent spending
Source: Ministry of Economy and Finance
Scaling Up for Better Health in Cambodia ��
3. reSOurCe flOWS in THe HealTH SeCTOr
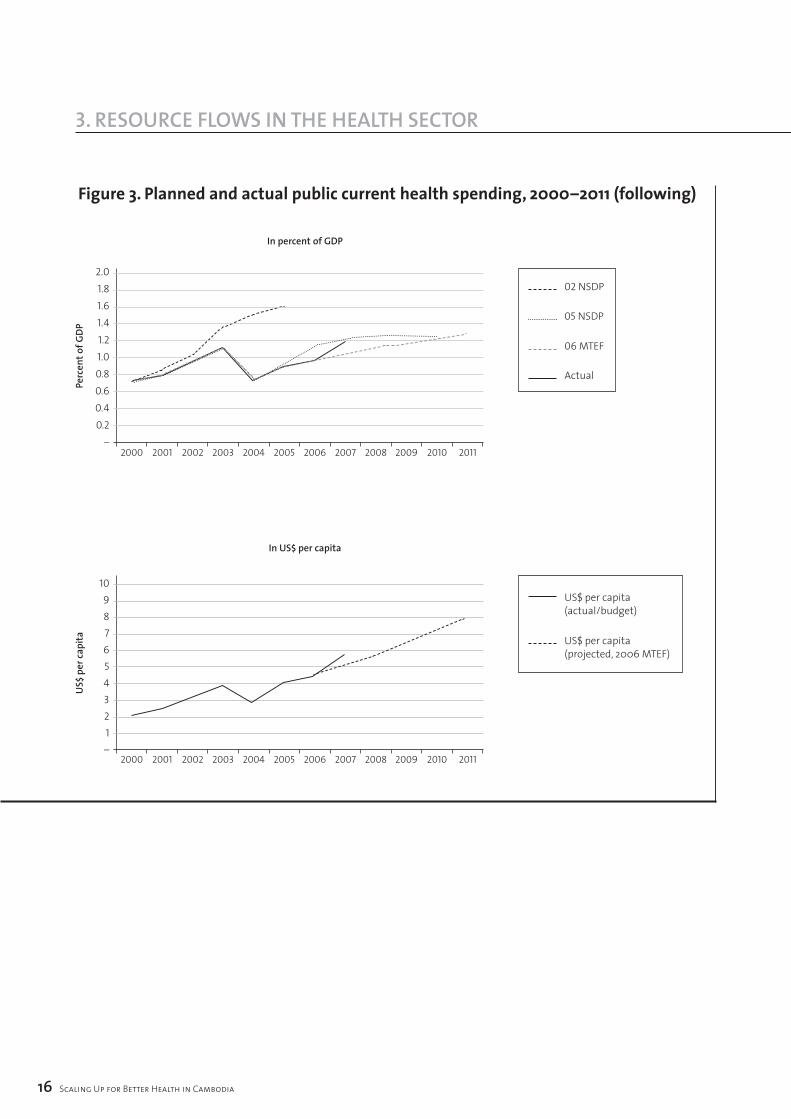
Broadly speaking, health budgets have tracked the plans made in 2005 and 2006 and spending is on an upward trend in per capita terms. Although health spending dropped sharply in 2004, it has since recovered and the 2007 budget targets health spending equivalent to 12% of recurrent spending and 1.2% of GDP, broadly in line with 2005 NSDP objectives and somewhat above estimates presented in the 2006 MTEF of the Ministry of Economy and Finance. In per capita terms, public health spending has been on an upward trend, except for a drop in 2004, rising from US$ 2 per capita in 2000 to over US$ 5 per capita in the 2007 budget, and a projected US$ 8 per capita by 2011 according to the Ministry of Economy and Finance MTEF (Table 5 and Figure 3).
Comprehensive information on the capital expenditure budget out-turn for health was not available. The capital budget is compiled by the Ministry of Planning on the basis of MOH submissions for the PIP. In practice, it appears that the PIP is largely a vehicle for mobilizing aid funds and, as aid is largely executed off-
budget, there is not an effective reporting of capital budget implementation. In the 2007 budget, a US$ 19.5 million budget was allocated to the health PIP although it is not clear if this is self-financed or donor on-budget financed expenditure. Another drawback of the Health PIP is that it is not clearly linked to the objectives to extend primary care services of the MOH’s Health Facility Coverage Plan (HFCP).
Although there is a general coherence between medium-term plans and outcomes for public health spending, budget execution has nonetheless experienced difficulties that reduce the effectiveness of public health spending, notably:
◗ Shortfalls in the execution of budget commitments.
◗ Back-loading of health spending within the budget year.
◗ Modest share of spending reaching the service delivery level (health centres and referral hospitals).
figure 3. planned and actual public current health spending, 2000–2011
14
13
12
11
10
9
8
7
62000 2001 2002 2003 2004 2005 2006 2007 2008 2009 2010 2011
Perc
ent o
f tot
al cu
rren
t spe
ndin
g 02 NSDP
05 NSDP
06 MTEF (Min Fin)
Actual/Budget 2007
In percent of total current spending
Next following page ➔
�6 Scaling Up for Better Health in Cambodia
3. reSOurCe flOWS in THe HealTH SeCTOr
figure 3. planned and actual public current health spending, 2000–2011 (following)
2.01.81.61.41.21.00.80.60.40.2
–2000 2001 2002 2003 2004 2005 2006 2007 2008 2009 2010 2011
Perc
ent o
f GDP
02 NSDP
05 NSDP
06 MTEF
Actual
In percent of GDP
10987654321–
2000 2001 2002 2003 2004 2005 2006 2007 2008 2009 2010 2011
US$
per
capi
ta
US$ per capita (actual/budget)
US$ per capita (projected, 2006 MTEF)
In US$ per capita
Scaling Up for Better Health in Cambodia �7
3. reSOurCe flOWS in THe HealTH SeCTOr
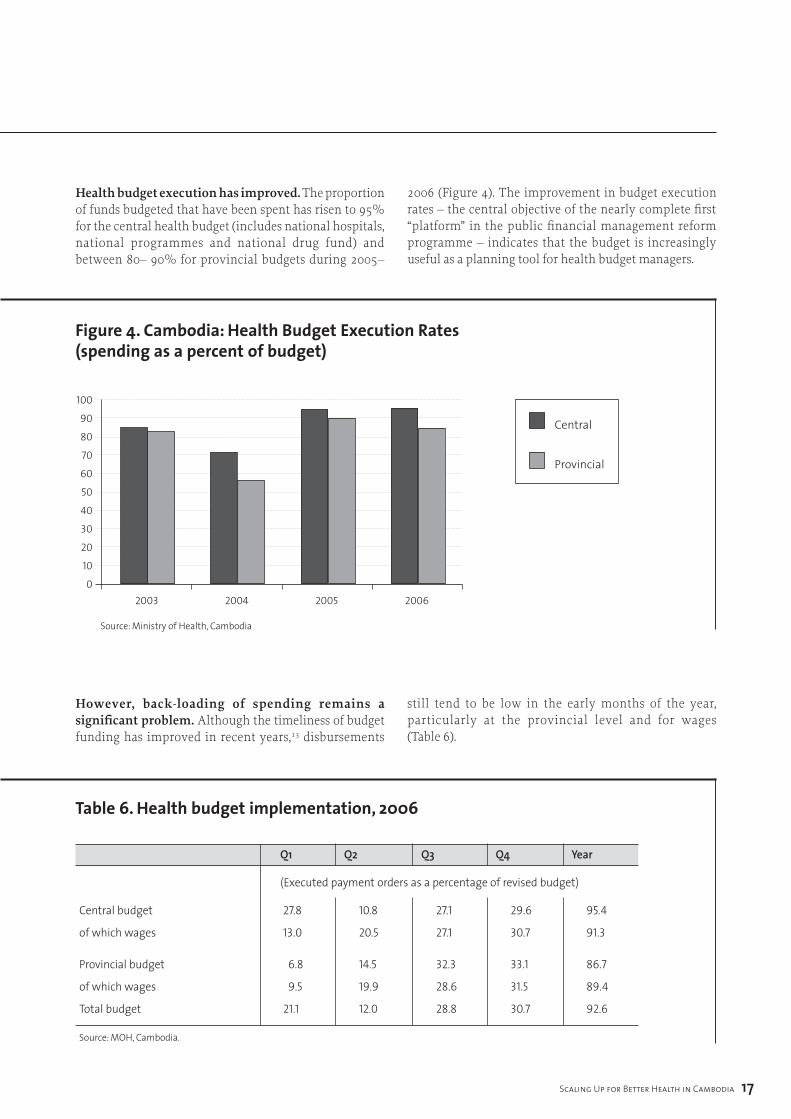
Health budget execution has improved. The proportion of funds budgeted that have been spent has risen to 95% for the central health budget (includes national hospitals, national programmes and national drug fund) and between 80– 90% for provincial budgets during 2005–
2006 (Figure 4). The improvement in budget execution rates – the central objective of the nearly complete first “platform” in the public financial management reform programme – indicates that the budget is increasingly useful as a planning tool for health budget managers.
figure 4. cambodia: Health Budget execution rates (spending as a percent of budget)
100
90
80
70
60
50
40
30
20
10
02003 2004 2005 2006
Central
Provincial
Source: Ministry of Health, Cambodia
However, back-loading of spending remains a significant problem. Although the timeliness of budget funding has improved in recent years,13 disbursements
still tend to be low in the early months of the year, particularly at the provincial level and for wages (Table 6).
table 6. Health budget implementation, 2006
Q� Q2 Q� Q� Year
(Executed payment orders as a percentage of revised budget)
Central budget 27.8 10.8 27.1 29.6 95.4
of which wages 13.0 20.5 27.1 30.7 91.3
Provincial budget 6.8 14.5 32.3 33.1 86.7
of which wages 9.5 19.9 28.6 31.5 89.4
Total budget 21.1 12.0 28.8 30.7 92.6
Source: MOH, Cambodia.
Payment delays reduce the effectiveness of health services through non-availability of needed resources and weaken staff motivation as wage arrears accumulate. Delays arise in particular because of multiple levels of approvals required to enter commitments and draw down funds. Proposals for decentralization that reduce the number of approval steps could further improve the disbursement rate of budget funds.
The relatively low proportion of public funding reaching the service delivery level and the difficulty in tracking the financing flows to service delivery pose the most significant public finance issues for scaling up service provision, particularly if budget decentralization continues.14 The main problems centre upon:
◗ The lack of a comprehensive budget preparation package for health facilities below the provincial level – ODs and health facilities. As a result, districts and facilities do not know their budget entitlement and are not directly accountable for their use of budget finance. In practice, the most reliable source of financing at the facility level is user fees. Higher-level managers do not have information on the use of provincial budgets for administration purposes (provincial and OD level) or on transfers to facilities.
◗ An issue related to the lack of budgeting at lower levels is the widespread prevalence of in-kind rather than cash transfers. Thus, provinces supply facilities with fuel and materials while drugs are distributed by the central medical store.
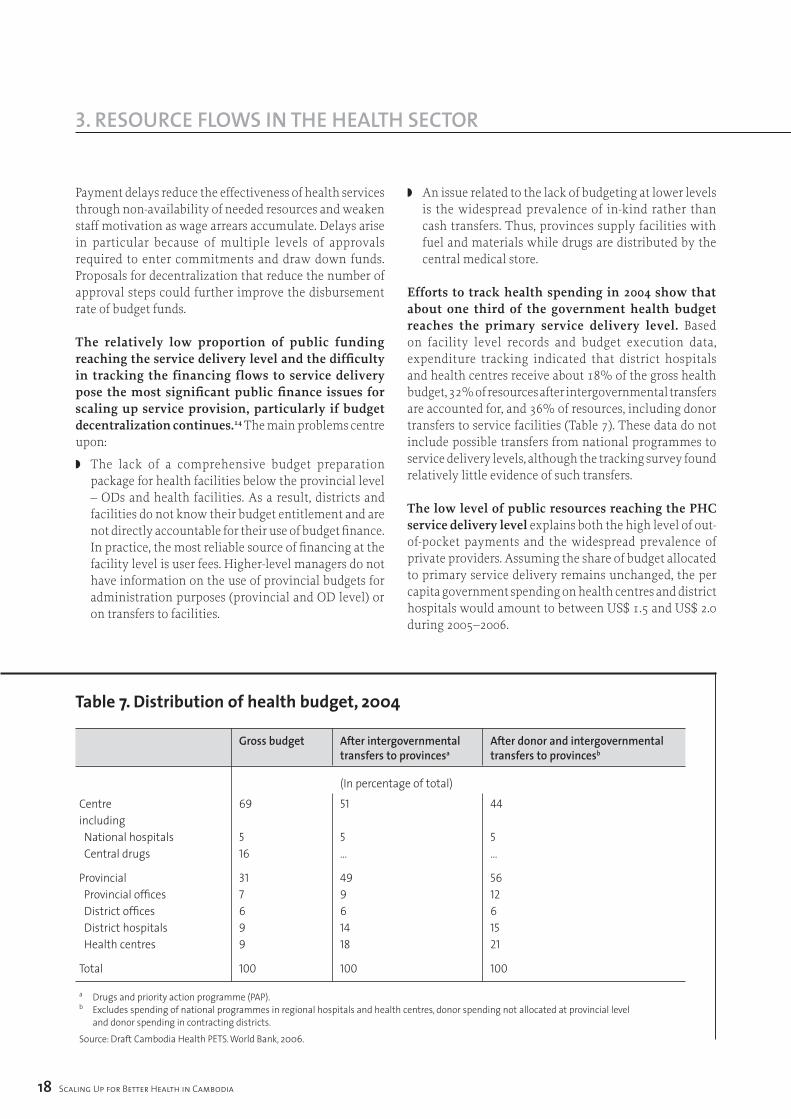
Efforts to track health spending in 2004 show that about one third of the government health budget reaches the primary service delivery level. Based on facility level records and budget execution data, expenditure tracking indicated that district hospitals and health centres receive about 18% of the gross health budget, 32% of resources after intergovernmental transfers are accounted for, and 36% of resources, including donor transfers to service facilities (Table 7). These data do not include possible transfers from national programmes to service delivery levels, although the tracking survey found relatively little evidence of such transfers.
The low level of public resources reaching the PHC service delivery level explains both the high level of out-of-pocket payments and the widespread prevalence of private providers. Assuming the share of budget allocated to primary service delivery remains unchanged, the per capita government spending on health centres and district hospitals would amount to between US$ 1.5 and US$ 2.0 during 2005–2006.
�� Scaling Up for Better Health in Cambodia
3. reSOurCe flOWS in THe HealTH SeCTOr
table 7. distribution of health budget, 2004
Gross budget After intergovernmental After donor and intergovernmental transfers to provincesa transfers to provincesb
(In percentage of total)
Centre 69 51 44including National hospitals 5 5 5 Central drugs 16 … …
Provincial 31 49 56 Provincial offices 7 9 12 District offices 6 6 6 District hospitals 9 14 15 Health centres 9 18 21
Total 100 100 100
a Drugs and priority action programme (PAP).b Excludes spending of national programmes in regional hospitals and health centres, donor spending not allocated at provincial level and donor spending in contracting districts.Source: Draft Cambodia Health PETS. World Bank, 2006.
Scaling Up for Better Health in Cambodia ��
3. reSOurCe flOWS in THe HealTH SeCTOr
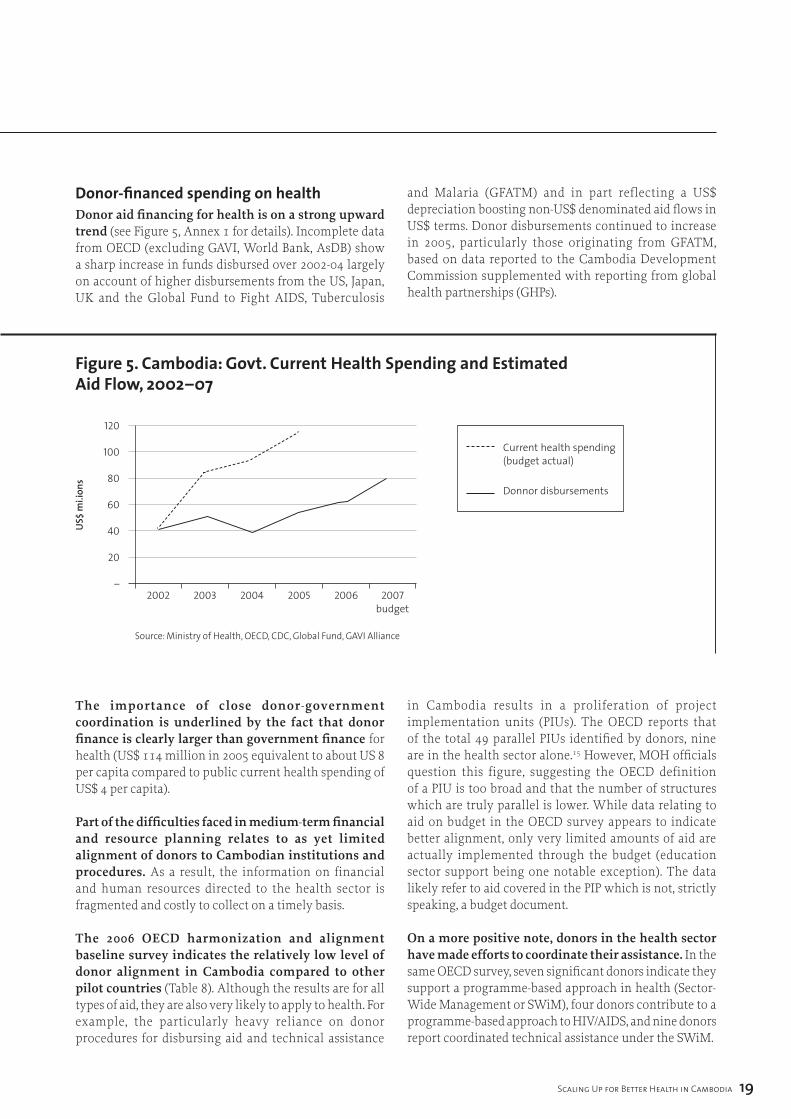
donor-financed spending on healthDonor aid financing for health is on a strong upward trend (see Figure 5, Annex 1 for details). Incomplete data from OECD (excluding GAVI, World Bank, AsDB) show a sharp increase in funds disbursed over 2002-04 largely on account of higher disbursements from the US, Japan, UK and the Global Fund to Fight AIDS, Tuberculosis
and Malaria (GFATM) and in part reflecting a US$ depreciation boosting non-US$ denominated aid flows in US$ terms. Donor disbursements continued to increase in 2005, particularly those originating from GFATM, based on data reported to the Cambodia Development Commission supplemented with reporting from global health partnerships (GHPs).
figure 5. cambodia: govt. current Health Spending and estimated aid flow, 2002–07
120
100
80
60
40
20
–2002 2003 2004 2005 2006 2007
budget
Current health spending (budget actual)
Donnor disbursements
Source: Ministry of Health, OECD, CDC, Global Fund, GAVI Alliance
The importance of close donor-government coordination is underlined by the fact that donor finance is clearly larger than government finance for health (US$ 114 million in 2005 equivalent to about US 8 per capita compared to public current health spending of US$ 4 per capita).
Part of the difficulties faced in medium-term financial and resource planning relates to as yet limited alignment of donors to Cambodian institutions and procedures. As a result, the information on financial and human resources directed to the health sector is fragmented and costly to collect on a timely basis.
The 2006 OECD harmonization and alignment baseline survey indicates the relatively low level of donor alignment in Cambodia compared to other pilot countries (Table 8). Although the results are for all types of aid, they are also very likely to apply to health. For example, the particularly heavy reliance on donor procedures for disbursing aid and technical assistance
in Cambodia results in a proliferation of project implementation units (PIUs). The OECD reports that of the total 49 parallel PIUs identified by donors, nine are in the health sector alone.15 However, MOH officials question this figure, suggesting the OECD definition of a PIU is too broad and that the number of structures which are truly parallel is lower. While data relating to aid on budget in the OECD survey appears to indicate better alignment, only very limited amounts of aid are actually implemented through the budget (education sector support being one notable exception). The data likely refer to aid covered in the PIP which is not, strictly speaking, a budget document.
On a more positive note, donors in the health sector have made efforts to coordinate their assistance. In the same OECD survey, seven significant donors indicate they support a programme-based approach in health (Sector-Wide Management or SWiM), four donors contribute to a programme-based approach to HIV/AIDS, and nine donors report coordinated technical assistance under the SWiM.
US$
mi.i
ons
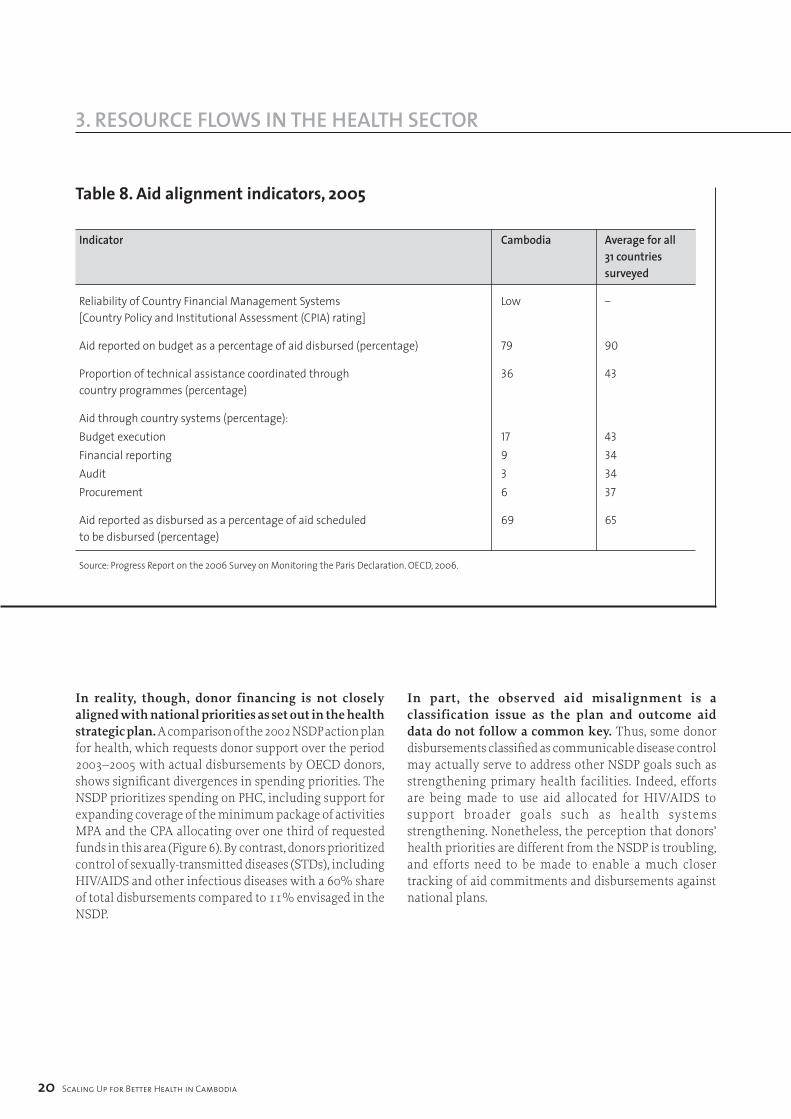
table 8. aid alignment indicators, 2005
Indicator Cambodia Average for all �� countries surveyed
Reliability of Country Financial Management Systems Low – [Country Policy and Institutional Assessment (CPIA) rating]
Aid reported on budget as a percentage of aid disbursed (percentage) 79 90
Proportion of technical assistance coordinated through 36 43 country programmes (percentage)
Aid through country systems (percentage):Budget execution 17 43Financial reporting 9 34Audit 3 34Procurement 6 37
Aid reported as disbursed as a percentage of aid scheduled 69 65 to be disbursed (percentage)
Source: Progress Report on the 2006 Survey on Monitoring the Paris Declaration. OECD, 2006.
20 Scaling Up for Better Health in Cambodia
3. reSOurCe flOWS in THe HealTH SeCTOr
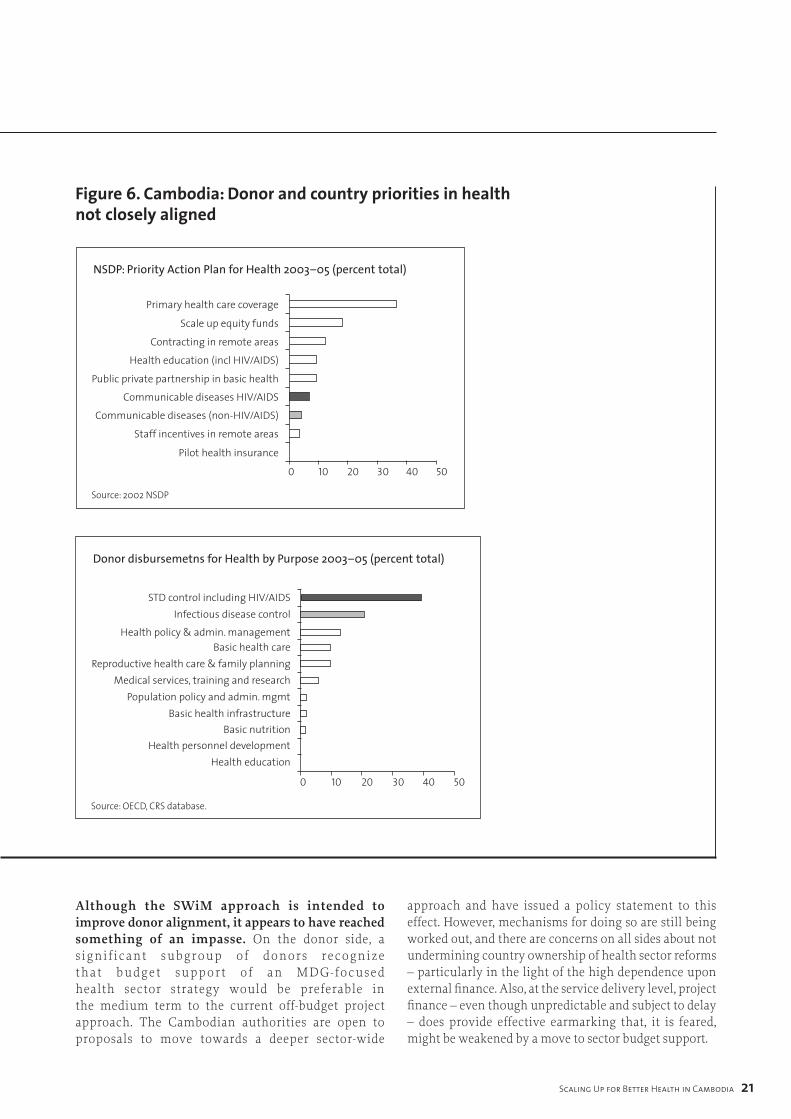
In reality, though, donor financing is not closely aligned with national priorities as set out in the health strategic plan. A comparison of the 2002 NSDP action plan for health, which requests donor support over the period 2003–2005 with actual disbursements by OECD donors, shows significant divergences in spending priorities. The NSDP prioritizes spending on PHC, including support for expanding coverage of the minimum package of activities MPA and the CPA allocating over one third of requested funds in this area (Figure 6). By contrast, donors prioritized control of sexually-transmitted diseases (STDs), including HIV/AIDS and other infectious diseases with a 60% share of total disbursements compared to 11% envisaged in the NSDP.
In part, the observed aid misalignment is a classification issue as the plan and outcome aid data do not follow a common key. Thus, some donor disbursements classified as communicable disease control may actually serve to address other NSDP goals such as strengthening primary health facilities. Indeed, efforts are being made to use aid allocated for HIV/AIDS to support broader goals such as health systems strengthening. Nonetheless, the perception that donors’ health priorities are different from the NSDP is troubling, and efforts need to be made to enable a much closer tracking of aid commitments and disbursements against national plans.
Scaling Up for Better Health in Cambodia 2�
3. reSOurCe flOWS in THe HealTH SeCTOr
figure 6. cambodia: donor and country priorities in health not closely aligned
0 10 20 30 40 50
Primary health care coverage
Scale up equity funds
Contracting in remote areas
Health education (incl HIV/AIDS)
Public private partnership in basic health
Communicable diseases HIV/AIDS
Communicable diseases (non-HIV/AIDS)
Staff incentives in remote areas
Pilot health insurance
NSDP: Priority Action Plan for Health 2003–05 (percent total)
Source: 2002 NSDP
0 10 20 30 40 50
STD control including HIV/AIDSInfectious disease control
Health policy & admin. managementBasic health care
Reproductive health care & family planningMedical services, training and research
Population policy and admin. mgmtBasic health infrastructure
Basic nutritionHealth personnel development
Health education
Donor disbursemetns for Health by Purpose 2003–05 (percent total)
Source: OECD, CRS database.
Although the SWiM approach is intended to improve donor alignment, it appears to have reached something of an impasse. On the donor side, a s ignif icant subgroup of donors recognize that budget support of an MDG-focused health sector strategy would be preferable in the medium term to the current off-budget project approach. The Cambodian authorities are open to proposals to move towards a deeper sector-wide
approach and have issued a policy statement to this effect. However, mechanisms for doing so are still being worked out, and there are concerns on all sides about not undermining country ownership of health sector reforms – particularly in the light of the high dependence upon external finance. Also, at the service delivery level, project finance – even though unpredictable and subject to delay – does provide effective earmarking that, it is feared, might be weakened by a move to sector budget support.
22 Scaling Up for Better Health in Cambodia
3. reSOurCe flOWS in THe HealTH SeCTOr
The role of GHPs – particularly GFATM which has emerged as a major new financing source – is likely to be key in improving aid alignment. GFATM presents something of a dilemma: on the one hand, it supports a country-led participatory process with all major stakeholders participating in a Country Coordinating Mechanism (CCM).16 On the other, local stakeholders are concerned that the CCM is parallel to the existing technical working group on health – adding unnecessary transaction costs – and would like to see the two streamlined. In addition, GFATM’s disease-specific focus on HIV/AIDS, tuberculosis and malaria does not map closely to the priorities expressed in the Cambodian health sector strategy noted above, notwithstanding the importance of these diseases in Cambodia. The combination of the large amount of health financing available on grant terms (over US$ 200 million committed in principle) creates an inevitable and understandable incentive to deviate somewhat from the health sector strategy priorities related to health systems strengthening.
overcoming financial impediments to scaling upWith recent higher levels of public health spending, rising donor flows and already high levels of out-of-pocket private spending, adequacy of gross health financing does not currently appear to be the central impediment to achieving health MDGs. But there are serious issues relating to the allocation and efficiency of the use of existing resources that could be tackled more energetically by government and the donor community, specifically:
◗ The trends in the levels of public-financed health care are encouraging but are deflated by a lack of transparency and accountability for spending at the service delivery level and delays in the flow of budgeted funds. The evidence that exists on expenditure tracking suggests a relatively small share of the health budget reaches the delivery level, and certainly in comparison to the prominence of PHC objectives in the HSP.
◗ Public sector reforms supporting deconcentration and public finance management reform will address transparency and accountability issues by devolving budget control and management closer to service delivery. Better tracking and accountability, as envisaged in the second “platform” of the public financial reform programme (2007–2009) will in turn set the stage for channeling donor finance through the
budget and addressing harmonization and alignment problems with donor finance. Issues critical to future success in this area are:
� Linking operational planning (AOP) with the budget process to strengthen financial management at least down to the operational district level; this will enable provincial AOPs to be the basis on which the provincial budget request for health is made; provincial administrations in turn will need to improve transparency by communicating comprehensively AOPs to operational districts and health faculties;
� Maintaining the stewardship role of the central MOH in the elaboration of the provincial operating plan;
� Integrating the health investment plan more clearly with the recurrent budget and objectives defined in the HFCP;
� Reducing in-kind transfers, particularly from the central to the provincial level to increase budgetary transparency;
� More timely disbursement of budget allocations through improved cash management in the Ministry of Economy and Finance;
� Deconcentration of budgetary controls.
◗ With continued progress on budgeting and financial accountability, including expenditure tracking, integration into the budget of a core segment of donor financing should be an achievable objective, perhaps as early as 2009 in the planned successor to the HSSP. Slow progress on harmonization and alignment of donor support results in high transaction costs from use of donor systems and substantial differences between stated public policies and the actual use of donor funds. While incremental change is possible, the key to aid alignment and harmonization ultimately lies in disbursement through government systems, particularly the budget process. Use of government procedures is also key to ensuring the financial sustainability of donor-funded activities as government ownership is much strengthened through the use of government procedures.
◗ The current impasse over changing funding modalities (from SWiM to SWAp) could be addressed by both greater consensus on policies and increasing the share of donor funds that would flow through the budget. Reaching a consensus on specifics of the health sector strategy that remain
Scaling Up for Better Health in Cambodia 2�
3. reSOurCe flOWS in THe HealTH SeCTOr
undecided (particularly contracting and equity fund modalities) would address concerns over ownership. The support of more donors to pooling funds in support of the health sector strategy might also tilt the balance of benefits more decisively away from the current predominance of project finance. A change of position by a major donor, for example GFATM, could be particularly instrumental.
◗ Agreement between government and willing donors to define agreed aid modalities and areas for harmonization is needed. The main areas should include reporting, disbursement, audit, review missions, analytical studies and terms of aid consistent with the Ministry of Economy and Finance standard operating procedures. Aligning donor funding with Ministry of Economy and Finance procedures is likely to be a key challenge. The recently-proposed Task Force for Deepening Harmonization and Alignment in the Health Sector is a useful mechanism to advance this agenda. The proposals from CDC to include harmonization and alignment indicators in aid reporting are particularly useful and welcome.
◗ As an incremental step, aid-financing flows could be delivered at the level of the health sector where implementation takes place and link clearly to the annual operational plan and, in time, the three-year rolling operational plan. Thu, national functions (HQ, national hospitals and national functions of public health programmes) are funded at the national level, and provincial functions (including technical assistance, incentives, equity funding) are funded at the provincial level through provincial accounts. The objective of the consolidation would be to simplify the financial flows in the sector, improve aid monitoring and evaluation and reduce costs, while preserving the stewardship role of the central MOH.
◗ Tracking the commitment and use of donor funds has not yet advanced significantly and will require active follow-up. The MOH initiative to circulate questionnaires to donors on aid activities is particularly welcome and will require active follow-up to ensure universal participation. A web-based questionnaire could speed the collection of data.
◗ Given the high levels and poor quality out-of-pocket spending, making quicker progress to the MDGs will in part depend on improving the performance of private providers. Accreditation of private providers and re-attestation of providers could be considered as part of a stronger regulatory effort by the MOH headquarters. The public sector, which is
in direct competition with providers could “capture” more out-of-pocket spending through strengthened PHC services, and developing national policies on financial support for low-income patients. These issues are discussed below.
(c) humAn resource issuesAs widely recognized in the health literature, the amount and quality of human resources are key factors in achieving better health outcomes. The evidence base for Cambodia suggests that the quantity of health professionals is not such an issue as the level of training and expertise of personnel and inadequate financial incentives to serve the population where most needed.
Although lack of time prevented a detailed investigation of human resource issues, some salient points emerge from published reports:
◗ In terms of human resource needs, the Millennium Project points to modest shortfalls against projected needs for 2015: tentative estimates suggest 4300 doctors exist against a likely need of 5800 in 2015 and for nurses and midwives, a shortfall of 2000 against a need of 16 800 by 2015.
◗ Some 30 low- and middle-income countries have lower densities of doctors and nurses than Cambodia, mostly in sub-Saharan Africa. For example, by comparison with Rwanda, Cambodia has three times the number of doctors per thousand population and 45% more nurses.17
◗ In selected disease-specific areas, human resource shortages also do not appear a problem. For example, a survey of needs for TB treatment in health facilities in high-burden countries reported no overall staff shortages in Cambodia at current and targeted detection rates although training and distribution of staff were reported as issues.18 By contrast, the shortage of midwives is a well-documented problem.
2� Scaling Up for Better Health in Cambodia
3. reSOurCe flOWS in THe HealTH SeCTOr
Adequate aggregate numbers of health professionals, albeit with shortages of some key specialists do not, however, translate into people on the ground if the incentives to work are not present. In ODs covered by service contracts under the HSSP, staff shortages were reportedly widespread particularly in remote provinces (except in provinces with only one OD).19 The draft health expenditure tracking survey found staff absenteeism to amount to 29% at referral hospitals and 26% at health centres in surveys conducted on arrival at health facilities.Inadequate levels of public-sector pay in the health sector are widely agreed to contribute to shortage of skilled health workers at the facility level, particularly in remote areas, and to encourage the “poaching” of patients for parallel private practice. Basic salaries of managerial (“A”-grade) administrative, clinical and support staff are low against any standard. Facility staff receive top-up payments from user fees and some additional allowances are paid by both government and donor projects. However, a survey of public sector health workers indicated that the financial incentives necessary to eliminate private practice by managerial (“A”-grade) staff might cost US$ 400 per month, and about US$ 160 per month to increase hours of public practice while maintaining opportunities for private practice.20
The problems with the quality of medical treatment and advice in both the public and private sectors (as many private practitioners also work in the public sector) suggest a need for concerted efforts to raise skill levels over the medium term. While there is extensive technical assistance and training provided by external donors, amounting to more than one third of total aid according to OECD disbursement data, it appears relatively short-term in nature – used for example to pay training course attendance allowances. This in turn points to the importance of paying adequate salaries in the first place, rather than donors paying staff to attend training courses.
Summary of human resource impediments to scaling up The aggregate numbers of health professionals do not appear to be an overriding constraint to scaling up for better health, but skill levels and the incentives provided to deploy existing human resources effectively could be much improved.
A menu of constructive proposals to address human resource impediments are either in the process of implementation or under consideration:
◗ Merit-based performance incentives (MBPI) are under consideration for selected health sector workers to improve financial incentives and replace an ad hoc system of salary supplements paid by donors and the government. As discussed further below, this appears a cost-effective way to start improving performance of public sector workers although this falls short of a comprehensive effort covering both managers and their staff.
◗ Performance-related salary supplements are paid in ODs that have contracted out services and the evidence suggests significantly better quality service and health outcomes as a result. Again, this appears a relatively cost-effective method of addressing financial incentives that is developed further below.
◗ For donors, as proposed in the Institutional Development Synthesis Report (2006),21 there is need to take a more holistic view of the needs of the sector rather than focused support for national programmes and donor projects. This could be addressed through a joint needs assessment of capacity gaps across the health system, leading to a long-term capacity and skill-building strategy.
Scaling Up for Better Health in Cambodia 2�
3. reSOurCe flOWS in THe HealTH SeCTOr 4. illuSTraTive finanCial SCaling-uP SCenariOS
The purpose of a scaling-up scenario is to define the total resource envelope for health financing over the medium term on the basis of current macroeconomic and fiscal policies. It is important to consider prospective public, private and donor financing for health as they are linked through broader decisions on the allocation of the government budget, household budgets and global donor priorities. Thus, for example, if public health spending increases rapidly (financed by tax increases), private spending is likely to fall as patients migrate to lower cost/better-quality public treatment and because higher taxes will reduce disposable income available for privately-paid health care. The financial scenario in turn can help identify what range of additional health services could reasonably be financed within the total resource envelope.
An optimistic scenario for government health spending is presented in the Institutional Development Synthesis Report (for the MOH). On the basis of rapid GDP growth (10% per annum), it projects an increase of government spending from 12% to 20% of GDP and an increase in the health share of total spending from 12% to 14.5% by 2015. Under this scenario, government health spending would increase fourfold by 2015 to US$
21 per capita and sixfold by 2020. While the vision may be desirable from the health sector viewpoint, it is not supported by government macroeconomic projections, the medium-term budgetary vision or the NSDP. The implications for other elements of health financing of an explosive growth of government health spending are not explored.
An alternative “realistic and holistic” approach is to use the existing macroeconomic and budgetary MTEF through 2011 as the basis for projecting forward government and private-financed health care through to 2015, and add rough estimates for the level of future donor assistance based on current donor indications.
The assumptions used for the growth of dollar GDP, total recurrent spending and the health recurrent spending share would lead to a projected increase of government recurrent spending on health from US$ 4.4 per head in 2005 to US$ 11.4 per head in 2015. This estimate is substantially lower than the Institutional Development Plan vision, but nonetheless represents a substantive increase in the level of spending (details of the assumptions used are shown in Box 1).
Box 1. assumptions for projecting government health spending
GDP growth: The MTEF projects dollar-denominated GDP to increase by 8.5% per year (almost identical to the rate of growth over the decade to 2005) through 2011. We assume the growth rate is maintained through 2015. Per capita dollar GDP rises by an average of 7% per year.
Total recurrent spending: The MTEF projects spending to rise from 9% GDP in 2006 by 0.2% per year, i.e. to 11% GDP by 2015, in line with historical experience. For simplification, and owing to lack of data on capital budget implementation, we assume that capital spending is financed by external donors, as has largely been the case to date, particularly in the social sectors.
Government recurrent health spending: The MTEF assumes an increase in the health share of recurrent spending from 11% to 12.5% by 2011 (consistent with the NSDP). As health spending has broadly tracked medium-term budget allocations, this appears a reasonable approach for projecting health spending through 2011. As no strategic decision has been taken to continue to increase the health share of the budget beyond the term of the NSDP, the share is assumed to remain stable after 2011.
The impact of oil revenues. Cambodia is likely to become an oil producer in the period through 2015 and oil revenues have the potential to significantly increase social sector spending. However, it is difficult to precisely calculate the effect of oil revenues on government spending at this stage because: (1) the oil production projections and taxation regime are not known; and (2) no decisions have been made on what proportion of incremental revenue would be saved or spent.
26 Scaling Up for Better Health in Cambodia
4. illuSTraTive finanCial SCaling-uP SCenariOS
Based on these assumptions, private household health financing is likely to continue to be much larger than government financing over the medium term. The health share of private household consumption has declined in the period 2000–2005 (from 7.6% to 6.7% using DHS expenditure and national accounts data), equivalent to US$ 25 per capita (some six times the size of government financing). This most likely reflects a relative price decline of health services against other goods and services. Assuming that the share of projected private consumption health financing remains stable, per capita financing increases to US$ 44 by 2015 or four times the level of projected government financing and higher than the estimated cost of meeting health MDGs through public health care provision. We discuss below whether increases in government and donor spending on health would reduce the demand for private financing.
Donor health financing is volatile and difficult to project. Donor financing depends on the independent decisions of multiple agencies that operate with a relatively short time-span for forward commitments. While some donors such as UNFPA and GAVI commit aid for five-year periods, they account for a relatively small share of total health aid, while some large donors such as the USA only announce aid plans one year ahead. Further, there are substantial differences between commitments and disbursements due to implementation performance, exchange rate movements and broader trends in global health.
For a baseline projection, it assumed that aid disbursements rise by 3% a year in dollar per capita terms or nearly 5% in nominal terms (equivalent to an increase from US$ 114 million to US$ 185 million over the 10 years to 2015). Relevant factors used to make this assumption are discussed in Box 2.
Box 2. factors affecting future donor aid flows
◗ Recent substantial aid increases have been linked in particular to the scaling up of vertical funds support, notably from GFATM. However, GFATM disbursements growth has started to slow down and the pipeline of the grants approved but not disbursed is equivalent to two years’ disbursements at current rates (see www.theglobalfund.org).
◗ US dollar depreciation has contributed to the increase of aid flows since 2003 and cannot be reliably expected to continue over the medium term.
◗ While some new donors are likely to support the health sector in Cambodia (notably Australia), others are changing aid priorities (AsDB has moved away from direct financing of health to indirect financing of health-related issues such as water).
◗ While global aid for health is projected to rise, the rate of increase is likely to be more modest than the strong growth since 2003.
◗ The recent trends in Cambodia of rapid income growth and improving health indicators, particularly for HIV/AIDS, are both factors that are likely to slow the growth of aid for health over the medium term.22
Scaling Up for Better Health in Cambodia 27
4. illuSTraTive finanCial SCaling-uP SCenariOS
bAseline finAncing scenArio summAry The baseline financing assumptions generate an increase in total health financing per capita 2005–2015 of nearly 80% in nominal terms, and just below 50% in real terms.23 Government and then private financing rise most rapidly, driven by the assumption of rapid GDP
growth. The share of private financing in overall financing remains stable. In the baseline scenario, the health budget (combining donors and government) rises by US$ 10 per capita through 2015 in nominal terms (Table 9).
table 9. cambodia: Baseline Health financing projecionsa (in US$ per capita)
2005 2006 2007 2008 2009 2010 2011 2012 2013 2014 2015
Govt financed current 4.0 4.4 5.7 5.7 6.4 7.2 8.0 8.7 9.5 10.3 11.1 spending
External financing 8.3 8.5 8.8 9.0 9.3 9.6 9.9 10.2 10.5 10.8 11.1 for health
Household financing 24.9 26.4 27.8 29.3 30.9 32.6 34.3 36.6 39.0 41.5 44.3
Total 37.1 39.3 42.3 44.1 46.6 49.3 52.2 55.5 58.9 62.6 66.5
a Government financing projected from 2007, external and household financing from 2006. Source: Author’s estimates
how would rising government And donor heAlth finAncing Affect privAte finAncing? An increase in the resources for health allocated by government and donors will undoubtedly affect private household health-financing decisions. Only if the government/donor-increased financing had no impact on health services and status would household decisions be unaffected. Survey evidence from increased health spending on Cambodian PHC facilities in contracting districts does indicate a significant reduction of private out-of-pocket spending.24 The higher the efficiency of increased public spending in terms of improving health outcomes, the greater the likely impact would be on private health financing and spending.
To model changing levels of private health care financing, we consider three alternative scenarios against the baseline scenario (Figure 7):
◗ Partial substitution. Each dollar increment of government and donor financing per capita reduces out-of-pocket spending by US$ 0.50, i.e. an elasticity of -0.5.
◗ Full substitution. Out-of-pocket spending reduces dollar for dollar (elasticity of -1) with rising government and donor insurance financing.
◗ Improved efficiency. Each dollar increment of government and donor financing per head lowers private spending by US$ 1.5 resulting from a more efficient delivery of services.
With high efficiency increases in government/donor health spending, overall health spending could decline as a share of GDP but private spending on health would remain the main component of health financing. As would be expected, the greater the impact of higher public/donor spending on private spending, the more substantive the effect on reducing the comparatively high burden of out-of-pocket financing. In the best-case scenario – where an increase of public spending results in a larger reduction of private spending, either through preventing more serious illnesses or because services are delivered at much lower cost than would be the case in the private sector – the health financing to GDP ratio reduces close to a level that would be normally expected in a low- or lower-middle income country by 2015 (6% of GDP).
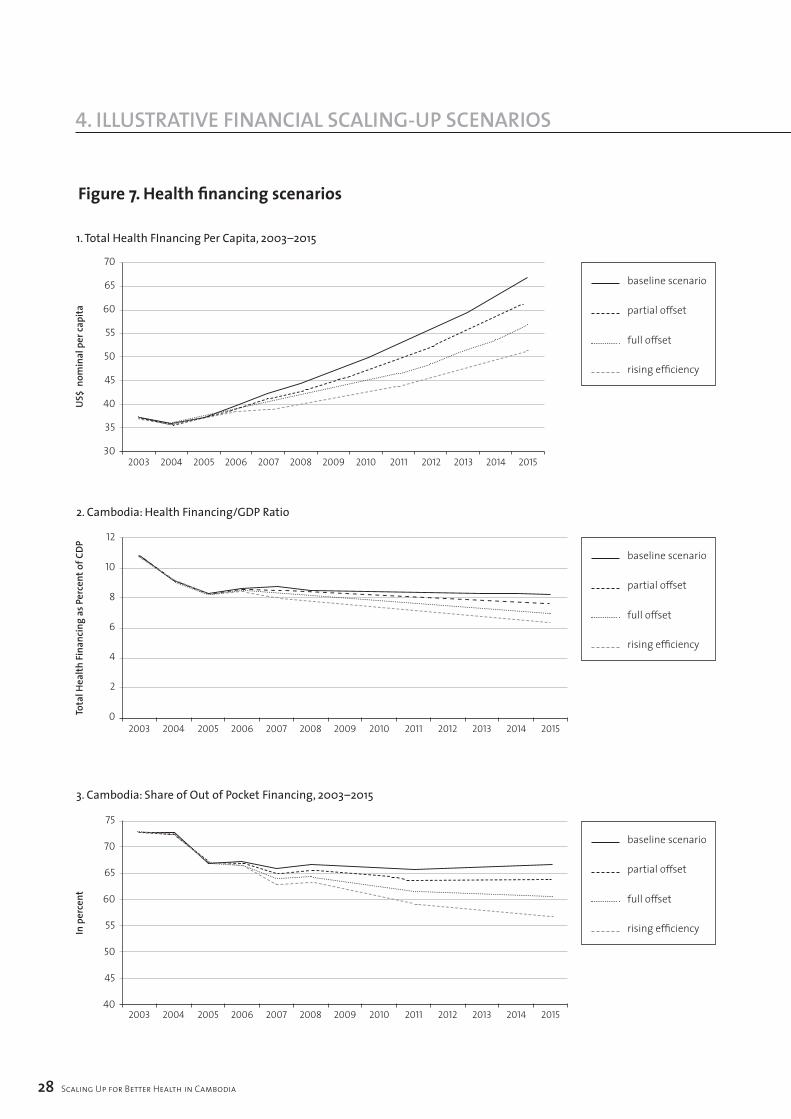
figure 7. Health financing scenarios
2� Scaling Up for Better Health in Cambodia
4. illuSTraTive finanCial SCaling-uP SCenariOS
70
65
60
55
50
45
40
35
302003 2004 2005 2006 2007 2008 2009 2010 2011 2012 2013 2014 2015
1. Total Health FInancing Per Capita, 2003–2015
baseline scenario
partial offset
full offset
rising efficiency
12
10
8
6
4
2
02003 2004 2005 2006 2007 2008 2009 2010 2011 2012 2013 2014 2015
2. Cambodia: Health Financing/GDP Ratio
75
70
65
60
55
50
45
402003 2004 2005 2006 2007 2008 2009 2010 2011 2012 2013 2014 2015
US$
nom
inal
per
capi
taTo
tal H
ealth
Fina
ncin
g as
Per
cent
of C
DPIn
per
cent
3. Cambodia: Share of Out of Pocket Financing, 2003–2015
baseline scenario
partial offset
full offset
rising efficiency
baseline scenario
partial offset
full offset
rising efficiency
Scaling Up for Better Health in Cambodia 2�
4. illuSTraTive finanCial SCaling-uP SCenariOS 5. illuSTraTive COSTS Of SCaling uP HealTH ServiCeS
The previous section looked at likely changes to the way health is financed in coming years, based on past trends. This section develops a second scenario, around the potential costs of addressing some of the key impediments to scaling up. The two scenarios are then compared in order to assess the financing gap and issues related to the financial sustainability of scaling up. The exercise is intended to identify whether the existing macroeconomic and budgetary framework and likely levels of donor support are consistent with addressing some of the key impediments to scaling up. The exercise is not intended to recommend a particular set of policies or interventions nor is it comprehensive in scope. The ongoing health strategy review based on a broad evidence base and various stakeholder views is the appropriate forum for overall policy development.
We consider interventions directed at three of the most important impediments to effective scaling up for better health, using evidence from existing pilot schemes or costed proposals:
◗ Increasing the level and share of resources delivered to PHC facilities to provide the minimum and complementary package of activities at health centres and referral hospitals respectively that are closely linked to achieving many of the health MDGs;
◗ A national scheme to finance health care for the poor, given the likely continued predominance of private spending (whether out-of-pocket or insurance-based) and the likelihood risk that financial barriers to access prevent achievement of the MDGs for substantial segments of the population;
◗ Linking public sector salaries to performance for key staff in MOH headquarters, national programmes and PHDs.
The recurrent cost figures developed represent rough estimates of a particular package of national service delivery and pay incentives and are not a substitute for a rigorous and more detailed costing exercise. The estimates do not include additional overheads at other levels of government. They also do not cover investment requirements (other than depreciation) that would be needed to accommodate higher demand for health services.
strengthening phc fAcilities Numerous studies based on pilot projects in Cambodia have concluded that performance-based health centre and referral hospital services, often contracted out to non-government providers, have improved utilization rates by 40% to 50%, without substantially raising the cost-per-patient visit.25 Increases in wages paid to staff and higher drug usage are offset by spreading fixed costs across more patients. Contracting has been piloted in 11 ODs covering over 10% of the population financed by the HSSP. The services provided by health centres are a proxy for the MPA, and district hospitals proxy the CPA.
Cost data from 2002 are used to indicate the incremental cost per capita of introducing performance-based contracting for health centres and referral hospitals inflated to 2007 prices using the change in the GDP deflator over the period. Source data for the incremental cost calculations are shown in Annex B.
The total additional recurrent cost (including depreciation) of scaling up the contracting model for PHC nationwide is estimated be US$ 16 million per year equivalent to US$ 1.1 per capita per year. In comparison to existing levels of government spending at primary facilities of US$ 1.5 – US$ 2.0 per capita per year, scaling up provision would represent substantial increase. Moreover, services would continue to be subject to user fees and increased facility utilization would in effect transfer out-of-pocket spending from private to public facilities. These estimates do not include overheads for expatriate management staff, OD or PHD administrative costs. As such, the estimates are indicative at best. There is also an ongoing debate as to whether service providers would be governmental or nongovernmental. The costs shown are based on nongovernmental providers.
reducing finAnciAl bArriers to Access The experience with HEFs piloted at district referral hospitals in Cambodia shows increasing utilization rates. There are not substantive reductions of user-fee paying patients, suggesting that the funds effectively target poor patients and reduce financial barriers to care. Costs per capita of HEFs vary according to coverage (definition of eligibility), unit cost of treatment and increases in hospitalization rates. Per capita coverage costs per year vary widely. Annex B shows details of the pilot schemes and calculates annual per capita cost as a function of the main parameters.
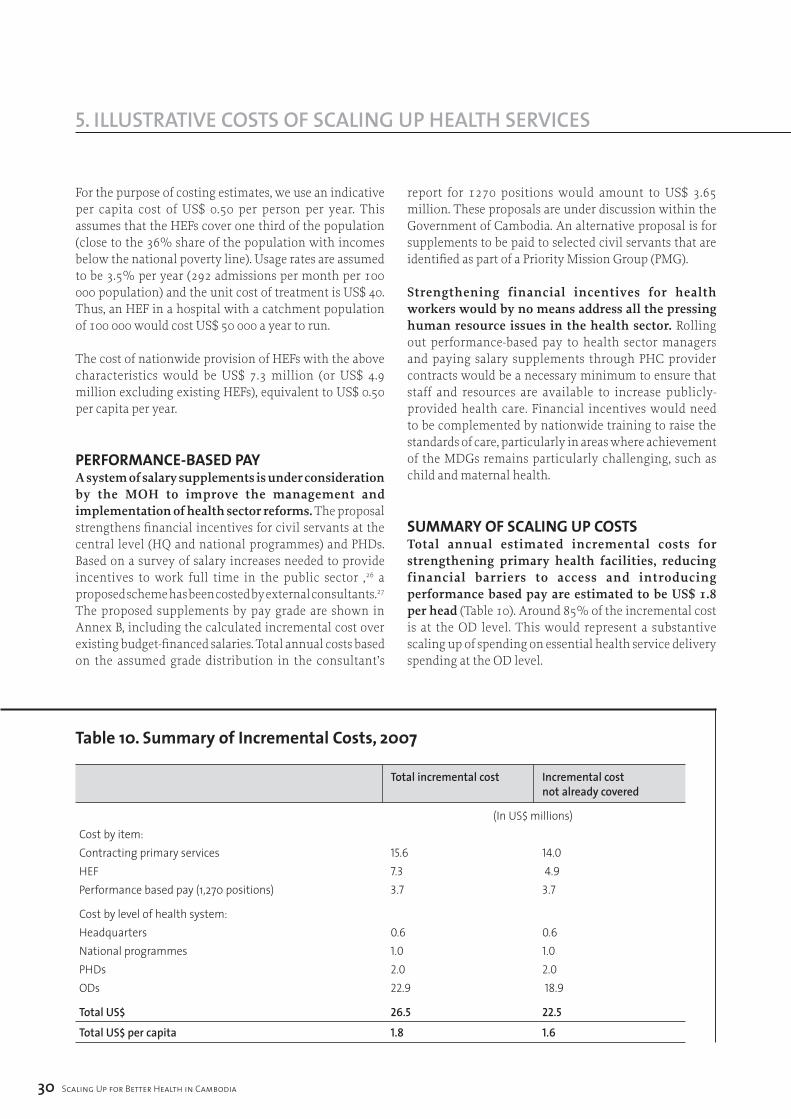
�0 Scaling Up for Better Health in Cambodia
5. illuSTraTive COSTS Of SCaling uP HealTH ServiCeS
For the purpose of costing estimates, we use an indicative per capita cost of US$ 0.50 per person per year. This assumes that the HEFs cover one third of the population (close to the 36% share of the population with incomes below the national poverty line). Usage rates are assumed to be 3.5% per year (292 admissions per month per 100 000 population) and the unit cost of treatment is US$ 40. Thus, an HEF in a hospital with a catchment population of 100 000 would cost US$ 50 000 a year to run.
The cost of nationwide provision of HEFs with the above characteristics would be US$ 7.3 million (or US$ 4.9 million excluding existing HEFs), equivalent to US$ 0.50 per capita per year.
performAnce-bAsed pAyA system of salary supplements is under consideration by the MOH to improve the management and implementation of health sector reforms. The proposal strengthens financial incentives for civil servants at the central level (HQ and national programmes) and PHDs. Based on a survey of salary increases needed to provide incentives to work full time in the public sector ,26 a proposed scheme has been costed by external consultants.27 The proposed supplements by pay grade are shown in Annex B, including the calculated incremental cost over existing budget-financed salaries. Total annual costs based on the assumed grade distribution in the consultant’s
report for 1270 positions would amount to US$ 3.65 million. These proposals are under discussion within the Government of Cambodia. An alternative proposal is for supplements to be paid to selected civil servants that are identified as part of a Priority Mission Group (PMG).
Strengthening financial incentives for health workers would by no means address all the pressing human resource issues in the health sector. Rolling out performance-based pay to health sector managers and paying salary supplements through PHC provider contracts would be a necessary minimum to ensure that staff and resources are available to increase publicly-provided health care. Financial incentives would need to be complemented by nationwide training to raise the standards of care, particularly in areas where achievement of the MDGs remains particularly challenging, such as child and maternal health.
summAry of scAling up costsTotal annual estimated incremental costs for strengthening primary health facilities, reducing financial barriers to access and introducing performance based pay are estimated to be US$ 1.8 per head (Table 10). Around 85% of the incremental cost is at the OD level. This would represent a substantive scaling up of spending on essential health service delivery spending at the OD level.
table 10. Summary of incremental costs, 2007
Total incremental cost Incremental cost
not already covered
(In US$ millions)Cost by item: Contracting primary services 15.6 14.0HEF 7.3 4.9 Performance based pay (1,270 positions) 3.7 3.7
Cost by level of health system: Headquarters 0.6 0.6National programmes 1.0 1.0PHDs 2.0 2.0ODs 22.9 18.9
Total US$ 26.5 22.5
Total US$ per capita 1.8 1.6
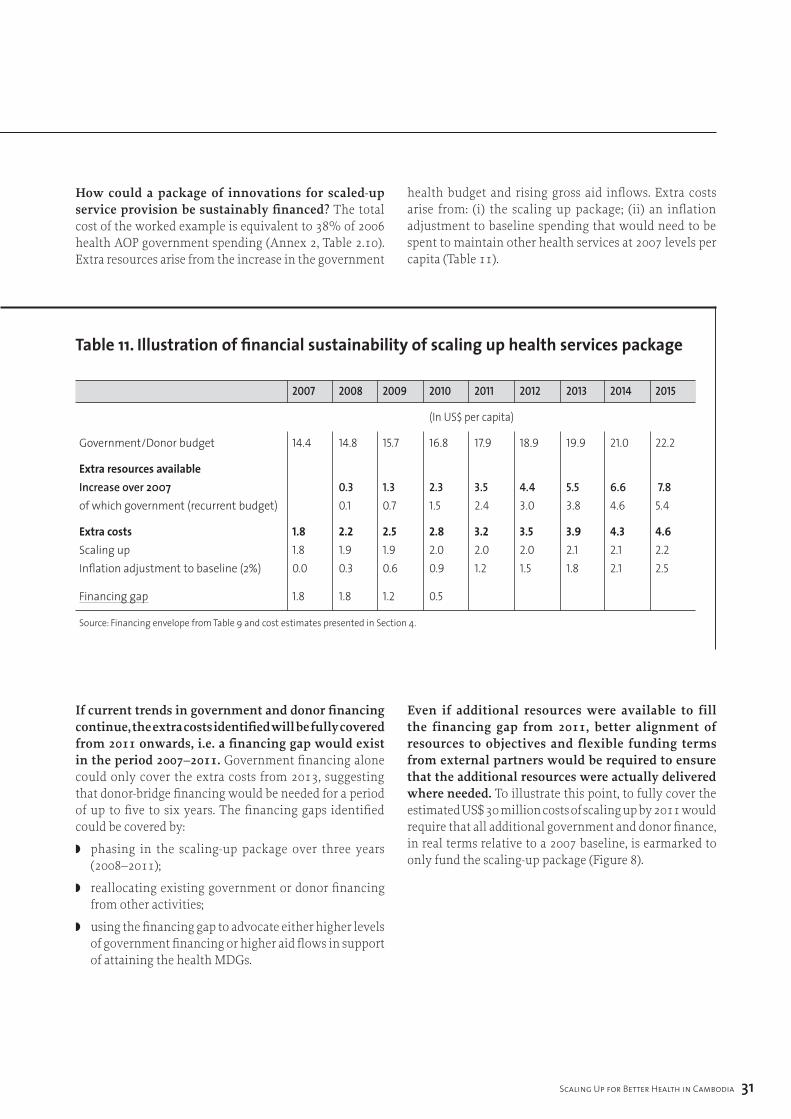
Scaling Up for Better Health in Cambodia ��
5. illuSTraTive COSTS Of SCaling uP HealTH ServiCeS
How could a package of innovations for scaled-up service provision be sustainably financed? The total cost of the worked example is equivalent to 38% of 2006 health AOP government spending (Annex 2, Table 2.10). Extra resources arise from the increase in the government
health budget and rising gross aid inflows. Extra costs arise from: (i) the scaling up package; (ii) an inflation adjustment to baseline spending that would need to be spent to maintain other health services at 2007 levels per capita (Table 11).
table 11. illustration of financial sustainability of scaling up health services package
2007 2008 2009 2010 2011 2012 2013 2014 2015
(In US$ per capita)
Government/Donor budget 14.4 14.8 15.7 16.8 17.9 18.9 19.9 21.0 22.2
extra resources available Increase over 2007 0.3 1.3 2.3 3.5 4.4 5.5 6.6 7.8 of which government (recurrent budget) 0.1 0.7 1.5 2.4 3.0 3.8 4.6 5.4
extra costs 1.8 2.2 2.5 2.8 3.2 3.5 3.9 4.3 4.6 Scaling up 1.8 1.9 1.9 2.0 2.0 2.0 2.1 2.1 2.2 Inflation adjustment to baseline (2%) 0.0 0.3 0.6 0.9 1.2 1.5 1.8 2.1 2.5
Financing gap 1.8 1.8 1.2 0.5
Source: Financing envelope from Table 9 and cost estimates presented in Section 4.
If current trends in government and donor financing continue, the extra costs identified will be fully covered from 2011 onwards, i.e. a financing gap would exist in the period 2007–2011. Government financing alone could only cover the extra costs from 2013, suggesting that donor-bridge financing would be needed for a period of up to five to six years. The financing gaps identified could be covered by:
◗ phasing in the scaling-up package over three years (2008–2011);
◗ reallocating existing government or donor financing from other activities;
◗ using the financing gap to advocate either higher levels of government financing or higher aid flows in support of attaining the health MDGs.
Even if additional resources were available to fill the financing gap from 2011, better alignment of resources to objectives and flexible funding terms from external partners would be required to ensure that the additional resources were actually delivered where needed. To illustrate this point, to fully cover the estimated US$ 30 million costs of scaling up by 2011 would require that all additional government and donor finance, in real terms relative to a 2007 baseline, is earmarked to only fund the scaling-up package (Figure 8).
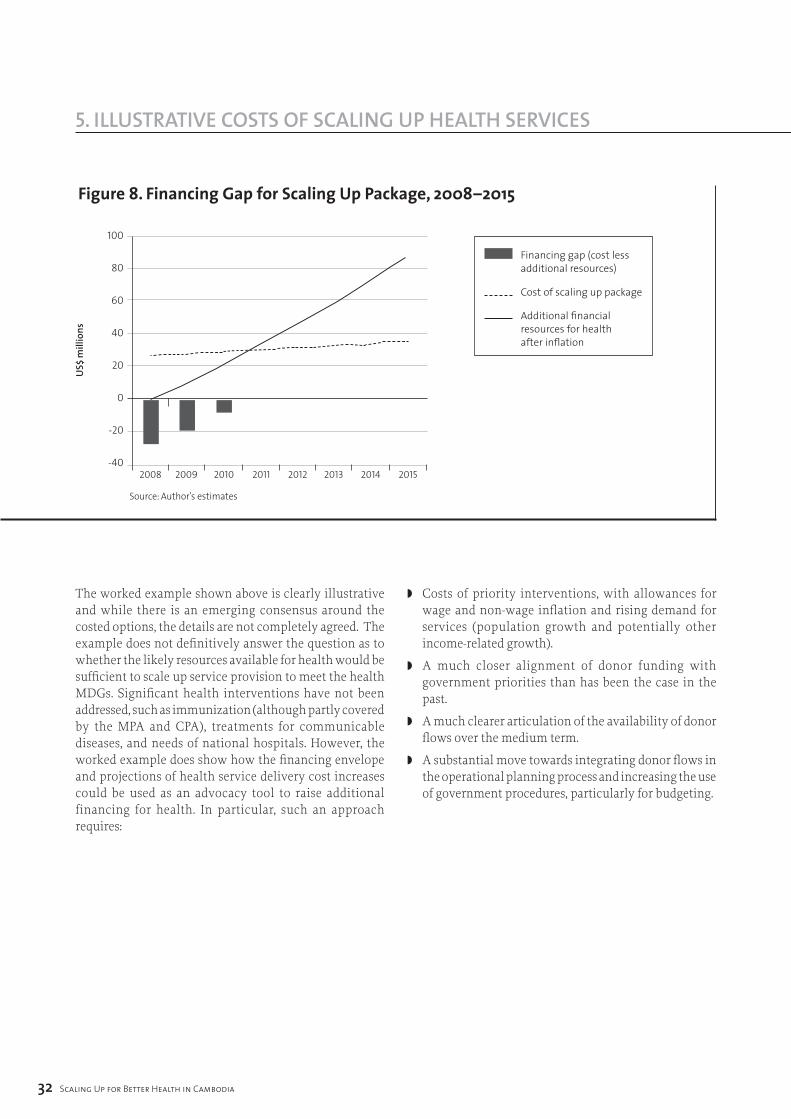
figure 8. financing gap for Scaling Up package, 2008–2015
�2 Scaling Up for Better Health in Cambodia
5. illuSTraTive COSTS Of SCaling uP HealTH ServiCeS
100
80
60
40
20
0
-20
-402008 2009 2010 2011 2012 2013 2014 2015
US$
mill
ions
Source: Author’s estimates
Financing gap (cost less additional resources)
Cost of scaling up package
Additional financial resources for health after inflation
The worked example shown above is clearly illustrative and while there is an emerging consensus around the costed options, the details are not completely agreed. The example does not definitively answer the question as to whether the likely resources available for health would be sufficient to scale up service provision to meet the health MDGs. Significant health interventions have not been addressed, such as immunization (although partly covered by the MPA and CPA), treatments for communicable diseases, and needs of national hospitals. However, the worked example does show how the financing envelope and projections of health service delivery cost increases could be used as an advocacy tool to raise additional financing for health. In particular, such an approach requires:
◗ Costs of priority interventions, with allowances for wage and non-wage inflation and rising demand for services (population growth and potentially other income-related growth).
◗ A much closer alignment of donor funding with government priorities than has been the case in the past.
◗ A much clearer articulation of the availability of donor flows over the medium term.
◗ A substantial move towards integrating donor flows in the operational planning process and increasing the use of government procedures, particularly for budgeting.
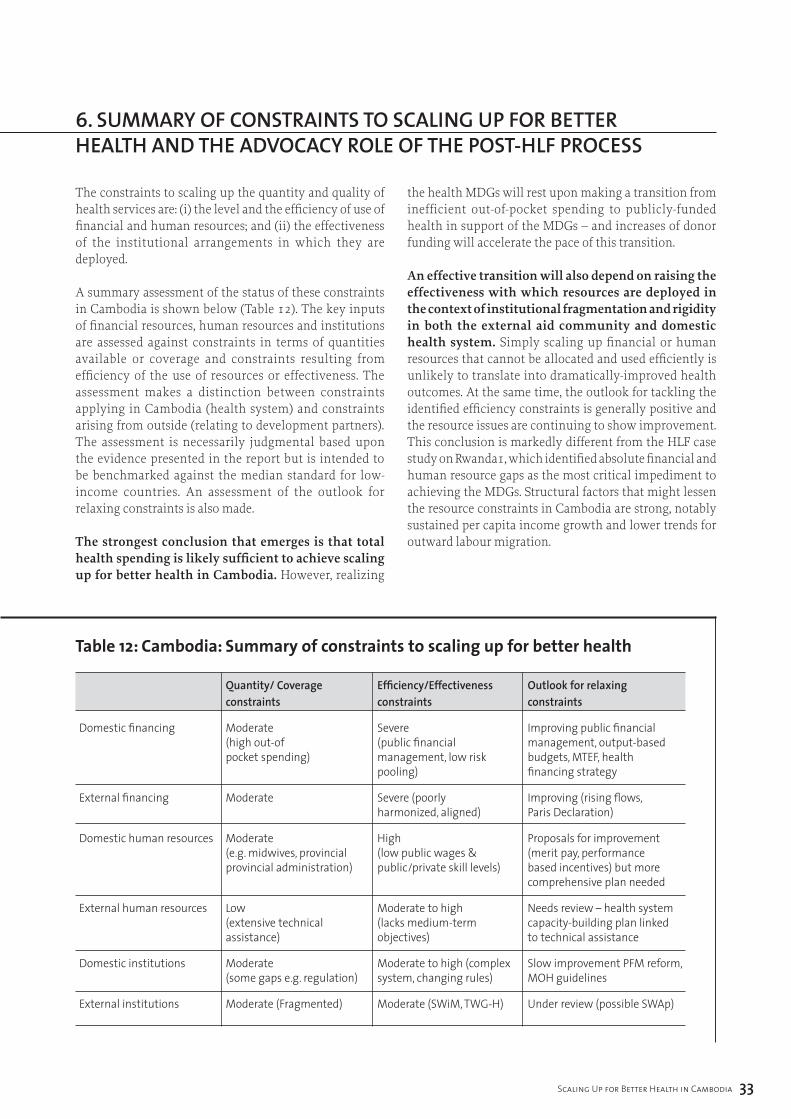
Scaling Up for Better Health in Cambodia ��
5. illuSTraTive COSTS Of SCaling uP HealTH ServiCeS 6. Summary Of COnSTrainTS TO SCaling uP fOr beTTer HealTH anD THe aDvOCaCy rOle Of THe POST-Hlf PrOCeSS
The constraints to scaling up the quantity and quality of health services are: (i) the level and the efficiency of use of financial and human resources; and (ii) the effectiveness of the institutional arrangements in which they are deployed.
A summary assessment of the status of these constraints in Cambodia is shown below (Table 12). The key inputs of financial resources, human resources and institutions are assessed against constraints in terms of quantities available or coverage and constraints resulting from efficiency of the use of resources or effectiveness. The assessment makes a distinction between constraints applying in Cambodia (health system) and constraints arising from outside (relating to development partners). The assessment is necessarily judgmental based upon the evidence presented in the report but is intended to be benchmarked against the median standard for low-income countries. An assessment of the outlook for relaxing constraints is also made.
The strongest conclusion that emerges is that total health spending is likely sufficient to achieve scaling up for better health in Cambodia. However, realizing
the health MDGs will rest upon making a transition from inefficient out-of-pocket spending to publicly-funded health in support of the MDGs – and increases of donor funding will accelerate the pace of this transition.
An effective transition will also depend on raising the effectiveness with which resources are deployed in the context of institutional fragmentation and rigidity in both the external aid community and domestic health system. Simply scaling up financial or human resources that cannot be allocated and used efficiently is unlikely to translate into dramatically-improved health outcomes. At the same time, the outlook for tackling the identified efficiency constraints is generally positive and the resource issues are continuing to show improvement. This conclusion is markedly different from the HLF case study on Rwanda1, which identified absolute financial and human resource gaps as the most critical impediment to achieving the MDGs. Structural factors that might lessen the resource constraints in Cambodia are strong, notably sustained per capita income growth and lower trends for outward labour migration.
table 12: cambodia: Summary of constraints to scaling up for better health
Quantity/ Coverage Efficiency/Effectiveness Outlook for relaxing constraints constraints constraints
Domestic financing Moderate Severe Improving public financial (high out-of (public financial management, output-based pocket spending) management, low risk budgets, MTEF, health pooling) financing strategy
External financing Moderate Severe (poorly Improving (rising flows, harmonized, aligned) Paris Declaration)
Domestic human resources Moderate High Proposals for improvement (e.g. midwives, provincial (low public wages & (merit pay, performance provincial administration) public/private skill levels) based incentives) but more comprehensive plan needed
External human resources Low Moderate to high Needs review – health system (extensive technical (lacks medium-term capacity-building plan linked assistance) objectives) to technical assistance
Domestic institutions Moderate Moderate to high (complex Slow improvement PFM reform, (some gaps e.g. regulation) system, changing rules) MOH guidelines
External institutions Moderate (Fragmented) Moderate (SWiM, TWG-H) Under review (possible SWAp)
�� Scaling Up for Better Health in Cambodia
6. Summary Of COnSTrainTS TO SCaling uP fOr beTTer HealTH anD THe aDvOCaCy rOle Of THe POST-Hlf PrOCeSS
One of the most effective examples of scaling up resources in Cambodia that has delivered impressive health improvements is HIV/AIDS treatment and prevention. With more time, this report would have focused more on successes in national programmes financed by global health partnerships and lessons that could be applied across the health system. Consistent with the typology above, the success in HIV/AIDS prevention and treatment has been in the context of a strong institution (e.g. NCHADS) with a relatively efficient use of human resources (skilled personnel with adequate compensation levels) and with sound management of financial resources (modern financial system and performance-based financing). The successes have been achieved by a fair degree of harmonization and alignment across multiple donors and implementing agencies.
This evident success has not been achieved without costs elsewhere. First, the ability to spend financial resources quickly and effectively has attracted high levels of external finance to HIV/AIDS interventions: significantly in excess of levels that had been planned for in a system-wide perspective, partially reducing flows to the rest of the system (partially because external finance earmarked for HIV/AIDS would not have been available for other health interventions). While also partly offset by very limited domestic financing (e.g. 0.3% of NCHADS spending is financed from the central budget), spending on HIV/AIDS treatment and prevention is higher than it would otherwise have been if allocated solely through the budgetary process. Second, the human resource incentives available in NCHADS and related delivery institutions (mostly NGOs) have, unsurprisingly, drawn better-skilled health workers from the rest of the system, affecting efficiency elsewhere.
However, it would be wrong to conclude that the allocation of financial and human resources skewed towards HIV/AIDS treatment and prevention was unjustified. The health outcomes have been impressive (MDG already achieved) and resources have flowed to where there was a strong presumption they might be effectively used. However, it points clearly to the need to focus efforts in improving the efficiency of other parts of the health system, particularly as regards external financing in order to support steady progress towards the other MDGs.
The report has made several suggestions for practical ways to address the constraints largely drawing on existing studies, reports and stakeholder views. The post-HLF process participants stand ready to assist the Cambodian authorities in any way that might constructively advance the agenda for addressing the constraints.
Key actions – some already under way – that could contribute to reducing constraints to scaling up include:
institutional planning and strategy issues
◗ Elaborate an MTEF for the health sector consistent with the HSP, based on a costed expansion of service provision. The core elements of this framework already exist in the form of the three-year operational plan which, in a strengthened form, would be the basis of the cost and spending projections.
◗ Integrate the health PIP process into the existing annual and three-year operational plan process, and explicitly link to the MOH coverage plan. This will better highlight the financing needs of the health sector, particularly as regards external finance. Use integrated financing gap projections actively as an advocacy tool to increase public and donor health financing.
◗ Align the annual operational plan and the programme-based budget so that budget execution data can be used to link financial resources to health outcomes; annual operational plans, particularly at the provincial level, should be the basis for budget negotiations.
◗ Define more clearly the national health financing strategy based on evaluation of existing pilots for contracting and equity funds. Use the national health-financing strategy to articulate financing objectives in conjunction with the MTEF. A simplified example was developed in Sections 4 and 5 in this report.
Scaling Up for Better Health in Cambodia ��
6. Summary Of COnSTrainTS TO SCaling uP fOr beTTer HealTH anD THe aDvOCaCy rOle Of THe POST-Hlf PrOCeSS
financial resource issues◗ With continued progress on budgeting and financial
accountability including expenditure tracking, integration of at least a core segment of donor financing into the budget system should be a desirable and achievable objective, perhaps as early as 2009 in the planned successor to the HSSP to contribute to improving alignment of donor and government objectives. Other donors that continue to deliver resources outside the budget will nonetheless need to be aligned behind the policy framework.
◗ The apparent impasse on moving forward to pooled funding on budget might be addressed by additional donors joining the subgroup of partners who co-finance the current HSSP. The participation of GFATM could be particularly instrumental in changing the balance of pros and cons for pooled funding in a SWAp, perhaps in the context of the proposed health systems strengthening grant.
◗ A government-donor task team on deepening harmonization and alignment has been established. It will be important for this group to define agreed aid modalities and areas for harmonization. The main areas should include reporting, disbursement, audit, review missions, analytical studies and terms of aid.
◗ As a parallel step, aid-financing flows could be delivered at the level of the health sector where implementation takes place and link clearly to the annual operational plan and, in time, the three-year rolling operational plan. Thus, national functions are funded at the national level, and provincial functions are funded at the provincial level through provincial accounts. The objective of the consolidation would be to simplify the financial flows in the sector, improve aid monitoring and evaluation, and reduce costs.
◗ The MOH initiative to circulate questionnaires to donors on aid activities is a particularly important initiative that will inform policy-makers on alignment of aid with government policies, and will require active follow-up to ensure universal participation.
Human resource issues◗ MBPIs are under consideration for selected health
sector workers to improve financial incentives and replace an ad hoc system of salary supplements paid by donors and the government. This appears a cost-effective way to start improving performance of public sector workers, but additional efforts will be needed to deal with low salaries across all health employees over the medium term.
◗ Performance-related salary supplements are also paid in operational districts that have contracted for services and the evidence suggests significantly better quality service and health outcomes as a result. Again, this appears a relatively cost-effective method of addressing financial incentives and improving service quality and effectiveness.
◗ For donors, as proposed in the Institutional Development Synthesis Report (2006),28 there is need to take a more holistic view of the technical assistance needs of the sector rather than focused support for national programmes and donor projects. This could be addressed through a joint needs assessment of capacity gaps across the health system leading to a long-term capacity-building strategy. Key MDG-related areas would include a nationwide skill-building strategy for health care workers, particularly for child and maternal health.
The view of many stakeholders is that intersectoral linkages to health is a neglected area with the potential to further achievement of MDG goals with limited resource inputs. Two examples could have significant impacts on health status: (i) improving clean water supplies and reducing waterborne diseases; (ii) use of charcoal and respiratory problems. This report has not been able to cover the extent to which intersectoral linkages pose constraints to effective scaling up, given the wide institutional scope of such an exercise. Consideration could be given to a follow-up multidisciplinary study and review of evidence.
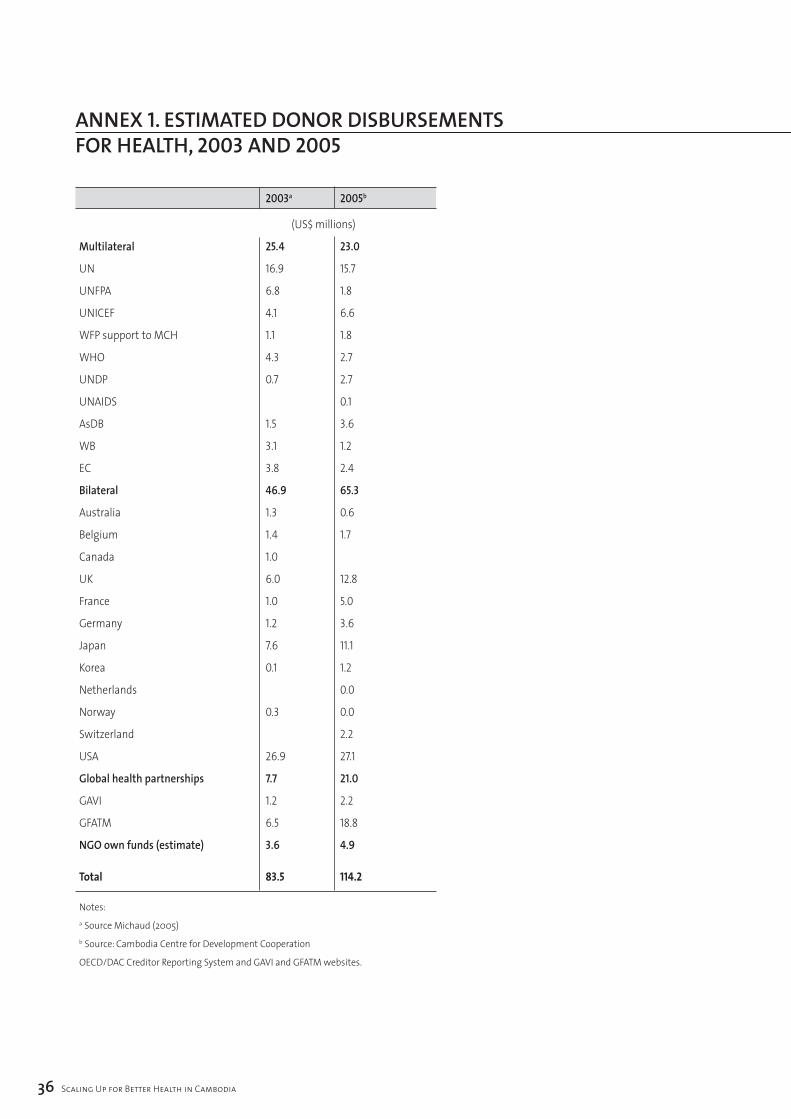
�6 Scaling Up for Better Health in Cambodia
annex 1. eSTimaTeD DOnOr DiSburSemenTS fOr HealTH, 2003 anD 2005
2003a 2005b
(US$ millions)
Multilateral 25.4 23.0
UN 16.9 15.7
UNFPA 6.8 1.8
UNICEF 4.1 6.6
WFP support to MCH 1.1 1.8
WHO 4.3 2.7
UNDP 0.7 2.7
UNAIDS 0.1
AsDB 1.5 3.6
WB 3.1 1.2
EC 3.8 2.4
Bilateral 46.9 65.3
Australia 1.3 0.6
Belgium 1.4 1.7
Canada 1.0
UK 6.0 12.8
France 1.0 5.0
Germany 1.2 3.6
Japan 7.6 11.1
Korea 0.1 1.2
Netherlands 0.0
Norway 0.3 0.0
Switzerland 2.2
USA 26.9 27.1
Global health partnerships 7.7 21.0
GAVI 1.2 2.2
GFATM 6.5 18.8
NGO own funds (estimate) 3.6 4.9
total 83.5 114.2
Notes:a Source Michaud (2005)b Source: Cambodia Centre for Development Cooperation
OECD/DAC Creditor Reporting System and GAVI and GFATM websites.
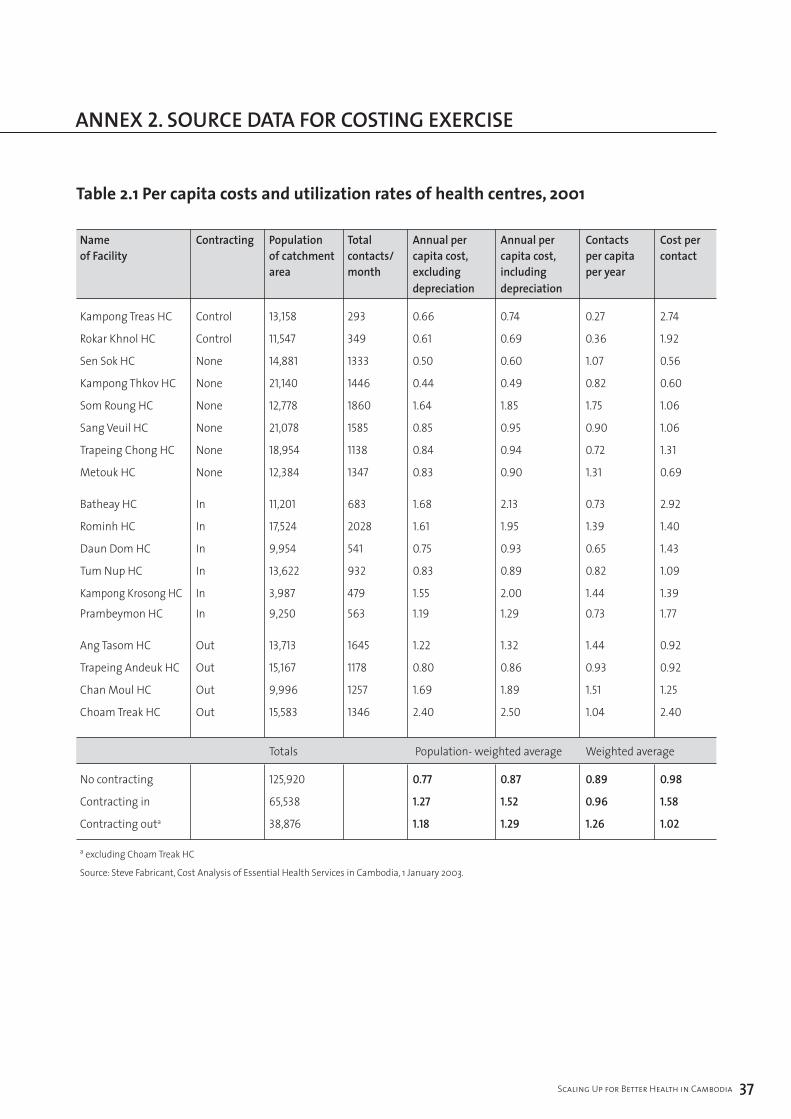
Scaling Up for Better Health in Cambodia �7
annex 1. eSTimaTeD DOnOr DiSburSemenTS fOr HealTH, 2003 anD 2005
table 2.1 per capita costs and utilization rates of health centres, 2001
Name Contracting Population Total Annual per Annual per Contacts Cost per of Facility of catchment contacts/ capita cost, capita cost, per capita contact area month excluding including per year depreciation depreciation
Kampong Treas HC Control 13,158 293 0.66 0.74 0.27 2.74
Rokar Khnol HC Control 11,547 349 0.61 0.69 0.36 1.92
Sen Sok HC None 14,881 1333 0.50 0.60 1.07 0.56
Kampong Thkov HC None 21,140 1446 0.44 0.49 0.82 0.60
Som Roung HC None 12,778 1860 1.64 1.85 1.75 1.06
Sang Veuil HC None 21,078 1585 0.85 0.95 0.90 1.06
Trapeing Chong HC None 18,954 1138 0.84 0.94 0.72 1.31
Metouk HC None 12,384 1347 0.83 0.90 1.31 0.69
Batheay HC In 11,201 683 1.68 2.13 0.73 2.92
Rominh HC In 17,524 2028 1.61 1.95 1.39 1.40
Daun Dom HC In 9,954 541 0.75 0.93 0.65 1.43
Tum Nup HC In 13,622 932 0.83 0.89 0.82 1.09
Kampong Krosong HC In 3,987 479 1.55 2.00 1.44 1.39
Prambeymon HC In 9,250 563 1.19 1.29 0.73 1.77
Ang Tasom HC Out 13,713 1645 1.22 1.32 1.44 0.92
Trapeing Andeuk HC Out 15,167 1178 0.80 0.86 0.93 0.92
Chan Moul HC Out 9,996 1257 1.69 1.89 1.51 1.25
Choam Treak HC Out 15,583 1346 2.40 2.50 1.04 2.40
Totals Population- weighted average Weighted average
No contracting 125,920 0.77 0.87 0.89 0.98
Contracting in 65,538 1.27 1.52 0.96 1.58
Contracting outa 38,876 1.18 1.29 1.26 1.02
a excluding Choam Treak HC
Source: Steve Fabricant, Cost Analysis of Essential Health Services in Cambodia, 1 January 2003.
annex 2. SOurCe DaTa fOr COSTing exerCiSe
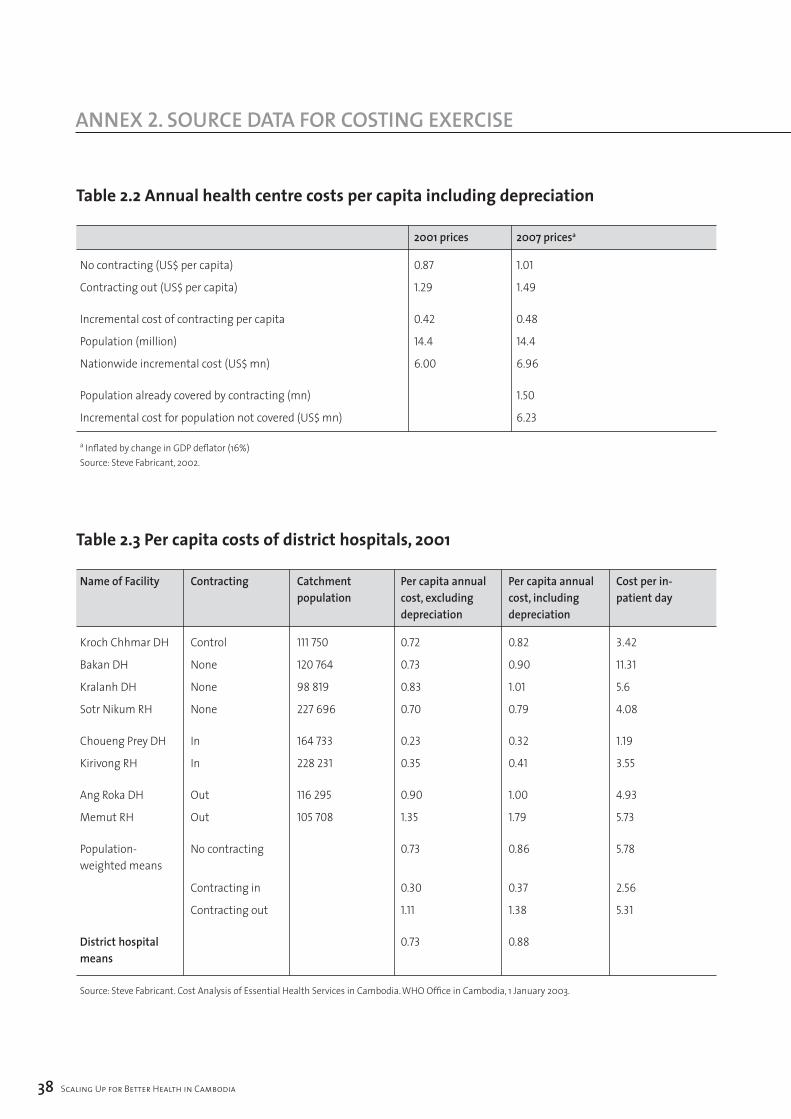
�� Scaling Up for Better Health in Cambodia
annex 2. SOurCe DaTa fOr COSTing exerCiSe
table 2.2 annual health centre costs per capita including depreciation
200� prices 2007 pricesa
No contracting (US$ per capita) 0.87 1.01
Contracting out (US$ per capita) 1.29 1.49
Incremental cost of contracting per capita 0.42 0.48
Population (million) 14.4 14.4
Nationwide incremental cost (US$ mn) 6.00 6.96
Population already covered by contracting (mn) 1.50
Incremental cost for population not covered (US$ mn) 6.23
a Inflated by change in GDP deflator (16%)Source: Steve Fabricant, 2002.
table 2.3 per capita costs of district hospitals, 2001
Name of Facility Contracting Catchment Per capita annual Per capita annual Cost per in- population cost, excluding cost, including patient day depreciation depreciation
Kroch Chhmar DH Control 111 750 0.72 0.82 3.42
Bakan DH None 120 764 0.73 0.90 11.31
Kralanh DH None 98 819 0.83 1.01 5.6
Sotr Nikum RH None 227 696 0.70 0.79 4.08
Choueng Prey DH In 164 733 0.23 0.32 1.19
Kirivong RH In 228 231 0.35 0.41 3.55
Ang Roka DH Out 116 295 0.90 1.00 4.93
Memut RH Out 105 708 1.35 1.79 5.73
Population- No contracting 0.73 0.86 5.78 weighted means
Contracting in 0.30 0.37 2.56
Contracting out 1.11 1.38 5.31
District hospital 0.73 0.88 means
Source: Steve Fabricant. Cost Analysis of Essential Health Services in Cambodia. WHO Office in Cambodia, 1 January 2003.
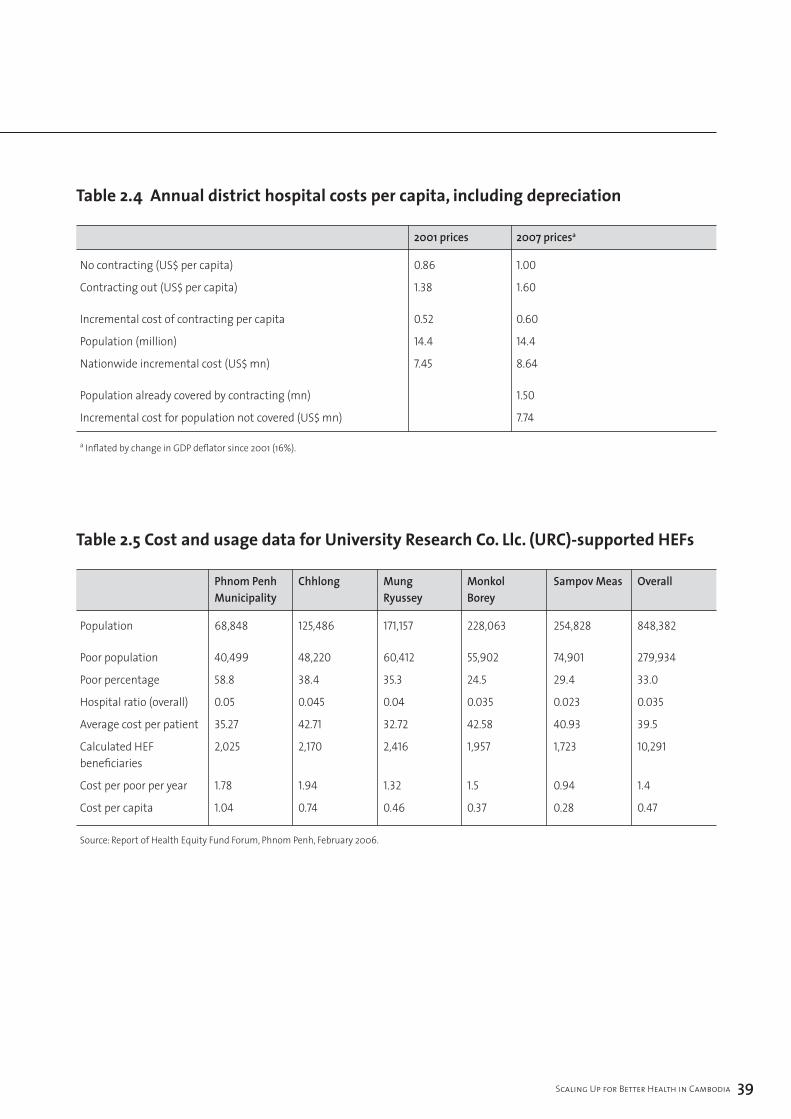
Scaling Up for Better Health in Cambodia ��
table 2.4 annual district hospital costs per capita, including depreciation
200� prices 2007 pricesa
No contracting (US$ per capita) 0.86 1.00
Contracting out (US$ per capita) 1.38 1.60
Incremental cost of contracting per capita 0.52 0.60
Population (million) 14.4 14.4
Nationwide incremental cost (US$ mn) 7.45 8.64
Population already covered by contracting (mn) 1.50
Incremental cost for population not covered (US$ mn) 7.74
a Inflated by change in GDP deflator since 2001 (16%).
table 2.5 cost and usage data for University research co. llc. (Urc)-supported Hefs
Phnom Penh Chhlong Mung Monkol Sampov Meas Overall Municipality Ryussey Borey
Population 68,848 125,486 171,157 228,063 254,828 848,382
Poor population 40,499 48,220 60,412 55,902 74,901 279,934
Poor percentage 58.8 38.4 35.3 24.5 29.4 33.0
Hospital ratio (overall) 0.05 0.045 0.04 0.035 0.023 0.035
Average cost per patient 35.27 42.71 32.72 42.58 40.93 39.5
Calculated HEF 2,025 2,170 2,416 1,957 1,723 10,291 beneficiaries
Cost per poor per year 1.78 1.94 1.32 1.5 0.94 1.4
Cost per capita 1.04 0.74 0.46 0.37 0.28 0.47
Source: Report of Health Equity Fund Forum, Phnom Penh, February 2006.
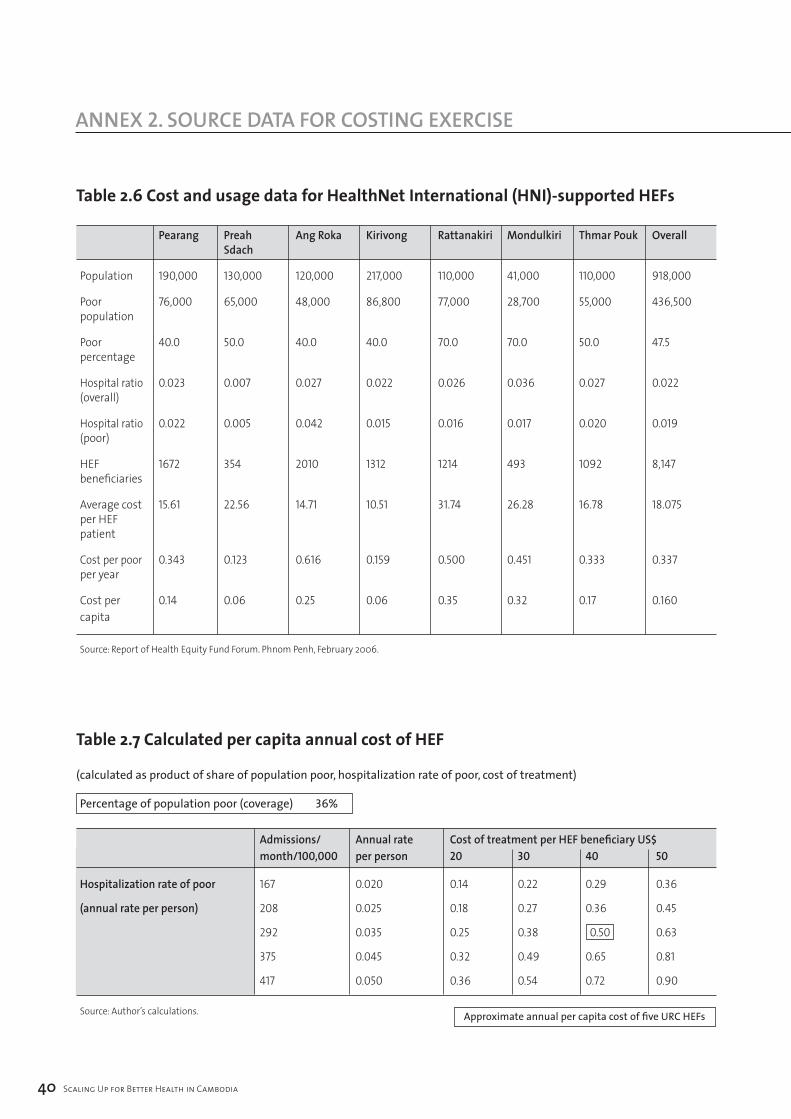
�0 Scaling Up for Better Health in Cambodia
annex 2. SOurCe DaTa fOr COSTing exerCiSe
table 2.6 cost and usage data for Healthnet international (Hni)-supported Hefs
Pearang Preah Ang Roka Kirivong Rattanakiri Mondulkiri Thmar Pouk Overall Sdach
Population 190,000 130,000 120,000 217,000 110,000 41,000 110,000 918,000
Poor 76,000 65,000 48,000 86,800 77,000 28,700 55,000 436,500 population
Poor 40.0 50.0 40.0 40.0 70.0 70.0 50.0 47.5 percentage
Hospital ratio 0.023 0.007 0.027 0.022 0.026 0.036 0.027 0.022 (overall)
Hospital ratio 0.022 0.005 0.042 0.015 0.016 0.017 0.020 0.019 (poor)
HEF 1672 354 2010 1312 1214 493 1092 8,147 beneficiaries
Average cost 15.61 22.56 14.71 10.51 31.74 26.28 16.78 18.075 per HEF patient
Cost per poor 0.343 0.123 0.616 0.159 0.500 0.451 0.333 0.337 per year
Cost per 0.14 0.06 0.25 0.06 0.35 0.32 0.17 0.160 capita
Source: Report of Health Equity Fund Forum. Phnom Penh, February 2006.
table 2.7 calculated per capita annual cost of Hef
(calculated as product of share of population poor, hospitalization rate of poor, cost of treatment)
Percentage of population poor (coverage) 36%
Admissions/ Annual rate Cost of treatment per HEF beneficiary US$ month/100,000 per person 20 30 40 50
Hospitalization rate of poor 167 0.020 0.14 0.22 0.29 0.36
(annual rate per person) 208 0.025 0.18 0.27 0.36 0.45
292 0.035 0.25 0.38 0.50 0.63
375 0.045 0.32 0.49 0.65 0.81
417 0.050 0.36 0.54 0.72 0.90
Source: Author’s calculations. Approximate annual per capita cost of five URC HEFs
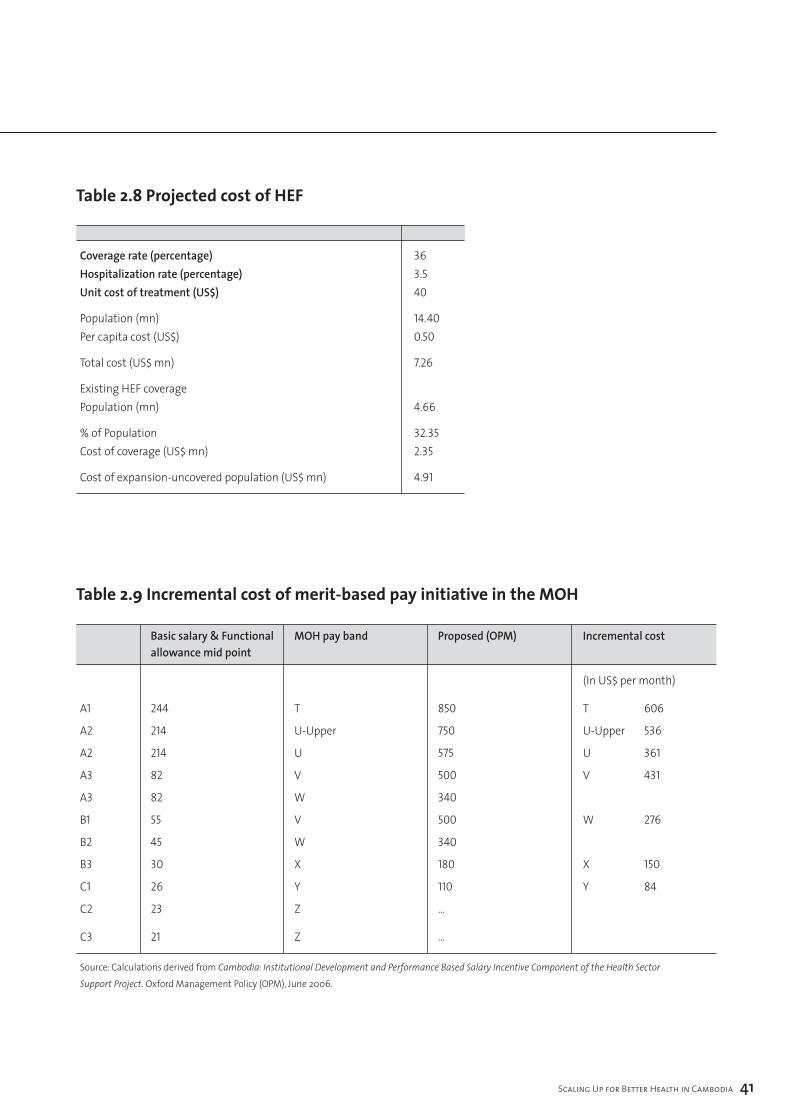
Scaling Up for Better Health in Cambodia ��
table 2.8 projected cost of Hef
Coverage rate (percentage) 36Hospitalization rate (percentage) 3.5Unit cost of treatment (US$) 40
Population (mn) 14.40 Per capita cost (US$) 0.50
Total cost (US$ mn) 7.26
Existing HEF coverage Population (mn) 4.66
% of Population 32.35 Cost of coverage (US$ mn) 2.35
Cost of expansion-uncovered population (US$ mn) 4.91
table 2.9 incremental cost of merit-based pay initiative in the moH
Basic salary & Functional MOH pay band Proposed (OPM) Incremental cost allowance mid point
(In US$ per month)
A1 244 T 850 T 606
A2 214 U-Upper 750 U-Upper 536
A2 214 U 575 U 361
A3 82 V 500 V 431
A3 82 W 340
B1 55 V 500 W 276
B2 45 W 340
B3 30 X 180 X 150
C1 26 Y 110 Y 84
C2 23 Z …
C3 21 Z …
Source: Calculations derived from Cambodia: Institutional Development and Performance Based Salary Incentive Component of the Health Sector Support Project. Oxford Management Policy (OPM), June 2006.
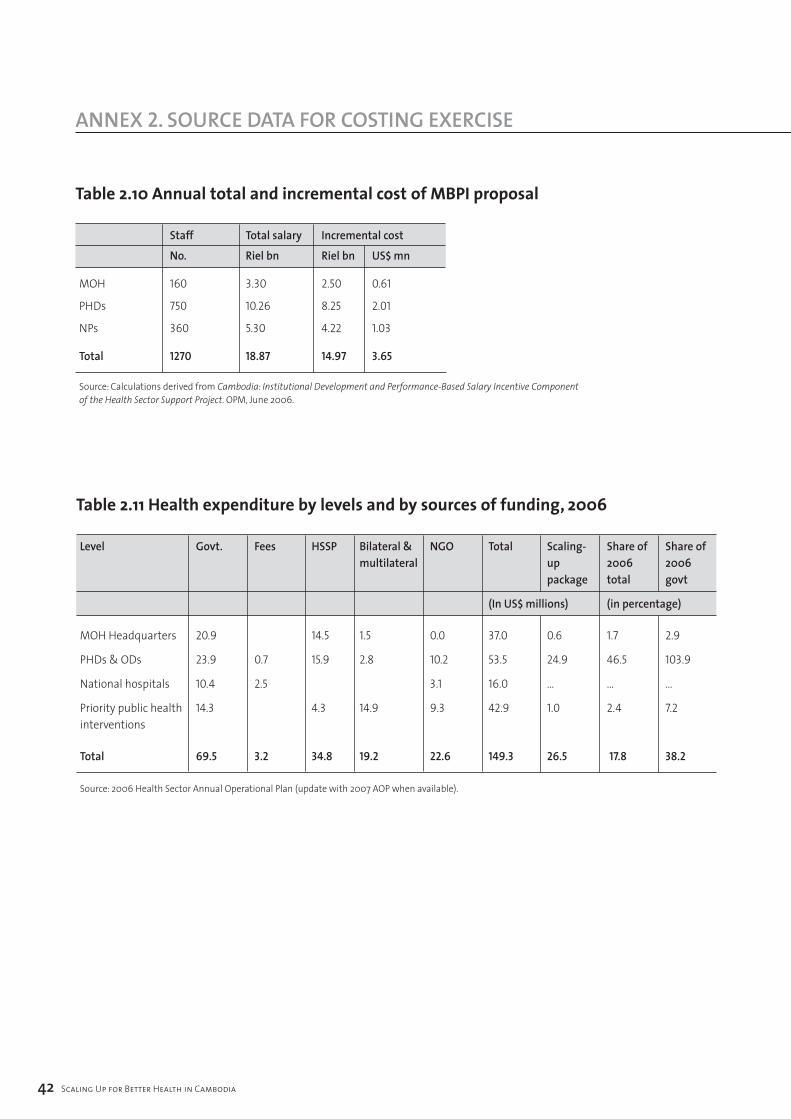
table 2.10 annual total and incremental cost of mBpi proposal
Staff Total salary Incremental cost
No. Riel bn Riel bn US$ mn
MOH 160 3.30 2.50 0.61
PHDs 750 10.26 8.25 2.01
NPs 360 5.30 4.22 1.03
Total 1270 18.87 14.97 3.65
Source: Calculations derived from Cambodia: Institutional Development and Performance-Based Salary Incentive Component of the Health Sector Support Project. OPM, June 2006.
�2 Scaling Up for Better Health in Cambodia
annex 2. SOurCe DaTa fOr COSTing exerCiSe
table 2.11 Health expenditure by levels and by sources of funding, 2006
Level Govt. Fees HSSP Bilateral & NGO Total Scaling- Share of Share of multilateral up 2006 2006 package total govt
(In US$ millions) (in percentage)
MOH Headquarters 20.9 14.5 1.5 0.0 37.0 0.6 1.7 2.9
PHDs & ODs 23.9 0.7 15.9 2.8 10.2 53.5 24.9 46.5 103.9
National hospitals 10.4 2.5 3.1 16.0 … … …
Priority public health 14.3 4.3 14.9 9.3 42.9 1.0 2.4 7.2 interventions
Total 69.5 3.2 34.8 19.2 22.6 149.3 26.5 17.8 38.2
Source: 2006 Health Sector Annual Operational Plan (update with 2007 AOP when available).
Scaling Up for Better Health in Cambodia ��
referenCeS
1 The first study on Rwanda concluded that the best-case scenario for scaling up health financing would be insufficient to achieve the Health MDGs and focused on practical ways to improve the efficiency of public and donor financed spending, particularly through a government-donor compact to better align donor aid to achieving the MDGs.
2 Source: World Health Organization death and DALY estimates by cause 2002. www.who.int/entity/healthinfo/statistics/bodgbddeathdalyestimates.xls
3 A draft report of costing child survival interventions was produced in 2006.
4 The 2002 National TB Prevalence Survey reports that TB treatment was: 19% private hospitals and clinics 2% health centres; 1% government hospitals; 48% pharmacies and self-medication and 35% did not seek treatment (from page 1, An Assessment of Private Sector Services for Tuberculosis: Cambodia, URC Technical Report June 2004).
5 Private practitioners in Phnom Penh: A mystery client study. 2002. Rose G, Dixon S, Kiry LV, Wilkinson S, Vickery C. World Health Organization, Geneva.
6 Assessment of Private Sector Services for Tuberculosis, op. cit.
7 Calculated using 2003 data from WHO Statistical Information Service.
8 Michaud, C. 2005. External Resource Flows to the Health Sector in Cambodia. World Health Organization, Geneva.
9 Bloom, E. Bhushan I. Clingingsmith D. Hong R., King E. Kremer M. Loevinsohn B. Schwartz J. Contracting for Health: Evidence from Cambodia. Unpublished manuscript.
10 J. Sachs, J. McArthur, G. Schmidt-Traub, C. Bahadur, M. Faye, and M. Kruk. 2004. Millennium Development Goals Needs Assessments, Country Case Studies of Bangladesh, Cambodia, Ghana, Tanzania and Uganda. UN Millennium Project. The case study estimated the cost of achieving the MDGs as an average of US$ 22 per capita per year during 2005-2015 (in 2000 US$) or about US$ 25 per capita per year in 2005 prices.
11 The DHS estimates are based on self assessments of health spending and may be biased by low-frequency high-cost medical interventions (such care involving international travel) and are sensitive to the survey frame and the magnitude of a few outlying high cost illnesses. Data from the 2004 socioeconomic survey indicate that 5.1% of household spending was allocated to health, equivalent to US$ 19 per capita if applied to 2005 estimates of private consumption spending (national accounts basis). Because of widely varying estimates of health spending in socioeconomic surveys from 1993, 1997 and 2004 and changing sampling methodology across surveys, the DHS estimates of health spending are preferable.
12 Equitap, Who Pays for Health Care in Asia, 2005 report comparable shares of private spending on health in low-income Asian countries: 65% in Bangladesh (1999) and 75% in Nepal (1995). The high share reflects the small taxable base in low-income agrarian economies and the correspondingly low level of publicly financed health care.
13 Data collected by the Health Sector Support Project indicate that the turnover for receipt of priority action programme funds reduced from 109 days in 2005 to 74 days in Q3 2006.
14 This section draws on a draft of Cambodia Health Public Expenditure Tracking Survey Report. 2006 East Asia and Pacific Region, World Bank, Washington DC.
15 A parallel project implementation unit is accountable to the donor agency, not the government; the donor agency and not the government determines terms of reference for externally appointed staff and appoints professional staff, and PIU staff not relevant government institutions have responsibility for management of implementation issues. Data on parallel PIUs are shown in the statistical Annex to the OECD DAC monitoring survey 2006.
16 The CCM has 27 members consisting of: government (9), aid agencies (9), NGOs (5), private for profit sector (1), persons living with HIV/AIDS (1) and academic/educational sector (2). See Kober, K. and W. Van Damme, The Early Steps in Setting up the Global Fund in Cambodia. 2003. Institute of Tropical Medecine, Belgium.
17 See WHO Statistical Information Service.
18 J. Figueria-Munoz et al. 2005. The Health Workforce Crisis in TB Control: A Report from High Burden Countries. Human Resources for Health 2005-3:2.
19 MOH, Cambodia. Mid-Term Review Report, Health Sector Support Project. October 2006.
20 Oxford Policy Management. 2005. Health Workers Incentive Survey report for the MOH Institutional Development and Incentives for Better Health Care project.
21 Institutional Development Plans for the Cambodian Health Sector: Synthesis Report. Oxford Policy Management, November 2006.
22 See Lane C. and A. Glassman “Bigger and Better? Scaling up and innovation in health aid”. 2007. Health Affairs pp935-948, Vol. 26 Number 4.
referenCeS
23 Assumes dollar prices rise by 2% per year, although the relevant inflation rate to apply would be dependent on the rate of price increases of key inputs such as labour and drugs which could be substantially affected by policies adopted.
24 Contracting for Health: Evidence from Cambodia. Op cit.
25 See: Annear P., D. Wilkinson, M Chean, M. van Pelt. 2006. Study of financial access to health services for the poor in Cambodia. Report for MOH, WHO, AusAid and RMIT University; Fabricant, Steve. 2002. Cost analysis of essential health services in Cambodia. MOH/WHO Health Sector Reform Phase III Project; Report of the Health Equity Forum. 2006. MOH/ WHO/ Belgian Technical Cooperation.
26 Health Workers Incentive Survey report for the MOH Institutional Development and Incentives for Better Health Care project.
27 Oxford Policy Management. 2006. Report: Design of a pay band structure to support the introduction of the merit-based pay initiative in the MOH.
28 Institutional Development Plans for the Cambodian Health Sector: Synthesis Report. Oxford Policy Management, November 2006.


World Health Organization Geneva
http://www.who.int