Scaling of Structural and Rheological Response of L3 ... of Structural and Rheological Response of L...
16
Scaling of Structural and Rheological Response of L 3 Sponge Phases in the “Sweetened” Cetylpyridinium/ Hexanol/Dextrose/Brine System L. Porcar,* W. A. Hamilton, and P. D. Butler Condensed Matter Sciences Division, Oak Ridge National Laboratory, Oak Ridge, Tennessee 37831 G. G. Warr University of Sydney, School of Chemistry, Sydney, NSW 2006, Australia Received April 17, 2003. In Final Form: August 21, 2003 We report a study of the shear response of sponge phases in cetylpyridinium chloride (CPCl)/hexanol/ brine/dextrose systems by parallel measurements of rheology and structure by small angle neutron scattering (SANS). Our measurements show that this dextrose added to the extensively studied CPCl/hexanol/brine system is taken up exclusively by the brine solvent, resulting in an equivalent CPCl/hexanol membrane structure and phase behavior for this modified system. Adding dextrose to the brine in these systems to volume fractions up to 0.4 allows us to increase the solvent viscosity by more than an order of magnitude. This lowers the cooperative membrane diffusion coefficient in this system as measured by dynamic light scattering by the same factor, resulting in a corresponding slowing of the Helfrich fluctuation dominated membrane dynamics. Our results show clear and consistent evidence of shear-induced sponge to lamellar phase transformations in these systems. Further, both the rheological and microstructural responses of these systems follow universal master curves when plotted against a rescaled applied shear γ ˘ ηs/φ 3 , where φ is the membrane volume fraction and ηs is the viscosity of the brine/dextrose solvent. This well-defined shear response is characterized by three distinct regimes. At low shear rates the sponge phases exhibit Newtonian flow behavior and no structural change is observed. For intermediate shear rates, the systems shear thin and SANS measurements show that the sponge phases are progressively transformed into lamellar phases with the CPCl/hexanol membrane normals aligned parallel to the velocity gradient. This continuous process and the absence of a stress plateau in the rheological measurements both rule out the existence of a biphasic state in this region and thus of a first-order transition between sponge and lamellar phases as is observed in equilibrium phase diagrams. At higher shear rates, the systems are apparently again Newtonian, but the induced lamellar phase appears to collapse and a new (and as yet unidentified) large-scale structure forms. We have found these systems to be extremely sensitive to evaporation, and reproducibility of the scattering measurements required the use of a Couette shear cell with a specially designed vapor barrier. Introduction For many years shear-induced structural transforma- tion and ordering in complex fluids such as polymers, surfactant solutions, and liquid crystals have been ex- tensively studied for both scientific and industrial reasons. As the length scales directly controllable by technological means have grown smaller, there has been a convergence of practical and fundamental interests toward a common aim: the understanding of the microstructural response as correlated with macroscopic rheological behavior. 1 Depending on characteristic structural relaxation times, shear flow can produce the familiar viscous heating of simple liquids 2 or more dramatic “complex” effects at odds with our usual expectations of fluid behavior: both macroscopically, as in the anisotropic rheological responses of viscoelastic liquids, and microscopically, in phenomena such as shear melting 3 or crystallization. 4-6 To a large extent what makes a fluid complex is an extended structural organization such as that exhibited by long polymer chains or the self-assembled threadlike micelles and membranes in surfactant systems. Processes acting over these longer length scales are slower and more easily disrupted by normally accessible shears. Interactions with the shear flow field can then induce either structural perturbations or full-blown phase changes, which in their turn affect the viscosity and shear response of the fluid. The rich variety of responses of membrane phases to shear flow has attracted a great deal of attention in the past few years. The most widely processed and studied membrane mesophase is undoubtedly the smectic lamellar L R phase (Figure 1), which is observed in nonionic, anionic, cationic, and zwitterionic surfactant systems as well as in block copolymers. Under steady shear, L R phases display three different stationary states. 7,8 The perpendicular “a” orientation corresponds to membranes with their normals aligned parallel to the vorticity direction; the transverse * Current address: National Institute for Standards and Tech- nology Center for Neutron Research, Gaithersburg, MD 20899. (1) Butler, P. D. Curr. Opin. Colloid Interface Sci. 1999, 4, 214 and references therein. (2) Macosko, C. W. Rheology: principles, measurements and ap- plications; Wiley-VCH: New York, 1994. (3) Ackerson, B. J.; Clark, N. Phys. Rev. A 1984, 30, 906. (4) Hamilton, W. A.; Butler, P. D.; Magid, L. J.; Han, Z.; Slawecki, T. M. Phys. Rev. E 1999, 60 (2), R1146. (5) Panine, P.; Narayanan, T.; Vermant, J.; Mewis, J. Phys. Rev. E 2002, 66 (2), art. no. 022401 Part 1. (6) Slawecki, T. M.; Glinka, G. J.; Hammouda, B. Phys. Rev. E 1998, 58 (4), R4084. (7) Miecowicz, M. Nature 1946, 158, 27. (8) Safinya, C. R.; Sirota, E. B.; Bruinsma, R. F.; Jeppesen, C.; Plano, R. J.; Wenzel, L. J. Science 1993, 261, 588. 10779 Langmuir 2003, 19, 10779-10794 10.1021/la034661w CCC: $25.00 © 2003 American Chemical Society Published on Web 10/11/2003
Transcript of Scaling of Structural and Rheological Response of L3 ... of Structural and Rheological Response of L...

Scaling of Structural and Rheological Response of L3Sponge Phases in the “Sweetened” Cetylpyridinium/
Hexanol/Dextrose/Brine System
L. Porcar,* W. A. Hamilton, and P. D. Butler
Condensed Matter Sciences Division, Oak Ridge National Laboratory,Oak Ridge, Tennessee 37831
G. G. Warr
University of Sydney, School of Chemistry, Sydney, NSW 2006, Australia
Received April 17, 2003. In Final Form: August 21, 2003
We report a study of the shear response of sponge phases in cetylpyridinium chloride (CPCl)/hexanol/brine/dextrose systems by parallel measurements of rheology and structure by small angle neutron scattering(SANS). Our measurements show that this dextrose added to the extensively studied CPCl/hexanol/brinesystem is taken up exclusively by the brine solvent, resulting in an equivalent CPCl/hexanol membranestructure and phase behavior for this modified system. Adding dextrose to the brine in these systems tovolume fractions up to 0.4 allows us to increase the solvent viscosity by more than an order of magnitude.This lowers the cooperative membrane diffusion coefficient in this system as measured by dynamic lightscattering by the same factor, resulting in a corresponding slowing of the Helfrich fluctuation dominatedmembrane dynamics. Our results show clear and consistent evidence of shear-induced sponge to lamellarphase transformations in these systems. Further, both the rheological and microstructural responses ofthese systems follow universal master curves when plotted against a rescaled applied shear γηs/φ3, whereφ is the membrane volume fraction and ηs is the viscosity of the brine/dextrose solvent. This well-definedshear response is characterized by three distinct regimes. At low shear rates the sponge phases exhibitNewtonian flow behavior and no structural change is observed. For intermediate shear rates, the systemsshear thin and SANS measurements show that the sponge phases are progressively transformed intolamellar phases with the CPCl/hexanol membrane normals aligned parallel to the velocity gradient. Thiscontinuous process and the absence of a stress plateau in the rheological measurements both rule out theexistence of a biphasic state in this region and thus of a first-order transition between sponge and lamellarphases as is observed in equilibrium phase diagrams. At higher shear rates, the systems are apparentlyagain Newtonian, but the induced lamellar phase appears to collapse and a new (and as yet unidentified)large-scale structure forms. We have found these systems to be extremely sensitive to evaporation, andreproducibility of the scattering measurements required the use of a Couette shear cell with a speciallydesigned vapor barrier.
Introduction
For many years shear-induced structural transforma-tion and ordering in complex fluids such as polymers,surfactant solutions, and liquid crystals have been ex-tensively studied for both scientific and industrial reasons.As the length scales directly controllable by technologicalmeans have grown smaller, there has been a convergenceof practical and fundamental interests toward a commonaim: the understanding of the microstructural responseas correlated with macroscopic rheological behavior.1
Depending on characteristic structural relaxation times,shear flow can produce the familiar viscous heating ofsimple liquids2 or more dramatic “complex” effects at oddswith our usual expectations of fluid behavior: bothmacroscopically,as in theanisotropic rheological responsesof viscoelastic liquids, and microscopically, in phenomenasuch as shear melting3 or crystallization.4-6 To a large
extent what makes a fluid complex is an extendedstructural organization such as that exhibited by longpolymer chains or the self-assembled threadlike micellesand membranes in surfactant systems. Processes actingover these longer length scales are slower and more easilydisrupted by normally accessible shears. Interactions withthe shear flow field can then induce either structuralperturbations or full-blown phase changes, which in theirturn affect the viscosity and shear response of the fluid.
The rich variety of responses of membrane phases toshear flow has attracted a great deal of attention in thepast few years. The most widely processed and studiedmembrane mesophase is undoubtedly the smectic lamellarLR phase (Figure 1), which is observed in nonionic, anionic,cationic, and zwitterionic surfactant systems as well asin block copolymers. Under steady shear, LR phases displaythree different stationary states.7,8 The perpendicular “a”orientation corresponds to membranes with their normalsaligned parallel to the vorticity direction; the transverse
* Current address: National Institute for Standards and Tech-nology Center for Neutron Research, Gaithersburg, MD 20899.
(1) Butler, P. D. Curr. Opin. Colloid Interface Sci. 1999, 4, 214 andreferences therein.
(2) Macosko, C. W. Rheology: principles, measurements and ap-plications; Wiley-VCH: New York, 1994.
(3) Ackerson, B. J.; Clark, N. Phys. Rev. A 1984, 30, 906.(4) Hamilton, W. A.; Butler, P. D.; Magid, L. J.; Han, Z.; Slawecki,
T. M. Phys. Rev. E 1999, 60 (2), R1146.
(5) Panine, P.; Narayanan, T.; Vermant, J.; Mewis, J. Phys. Rev. E2002, 66 (2), art. no. 022401 Part 1.
(6) Slawecki, T. M.; Glinka, G. J.; Hammouda, B. Phys. Rev. E 1998,58 (4), R4084.
(7) Miecowicz, M. Nature 1946, 158, 27.(8) Safinya, C. R.; Sirota, E. B.; Bruinsma, R. F.; Jeppesen, C.; Plano,
R. J.; Wenzel, L. J. Science 1993, 261, 588.
10779Langmuir 2003, 19, 10779-10794
10.1021/la034661w CCC: $25.00 © 2003 American Chemical SocietyPublished on Web 10/11/2003

“b” orientation has the normals aligned parallel to theflow; and the parallel “c” orientation has the normalsaligned along the velocity gradient direction. In thesestudies extensive nonequilibrium phase diagrams havebeen constructed for many systems representing thesteady states of the lamellar system under shear.9,10 Inaddition to these simply oriented lamellar phases, whichhave immediate consequences in the processing of poly-meric systems, it has also been found that shear flow caninduce the formation of more complicated structures.Pioneering studies by Roux and co-workers9,11,12 showedthat prolonged steady shear in a Couette cell may causea dynamic transition from the LR smectic phase tomultilamellar vesicles, often called “onions” or “spheru-lites”. The possibility of introducing encapsulated particleswithin or between the layers of the spherulite structurehas received considerable attention for delayed releaseapplications in drug delivery, biochemical catalysis, andcosmetic technologies.13 The size of the vesicles is closelyrelated to the shear rate γ, and under certain conditionsof formation, these may be sufficiently monodisperse thatthey may be ordered in a crystalline phase by furthershear.14-18
In many systems the isotropic L3 sponge phase mem-brane structure is observed in narrow phase regionsadjacent to the domain of stability of LR phases (Figures1 and 2). These L3 phases are free flowing, which couldmake them attractive for mixing or transfer stages intechnological processes involving the more viscous neigh-boring membrane phase. Unlike lamellar and crystallinephases, sponge phases present no long-range order. Anumber of studies19 have determined that this phaseconsists of one infinite membrane bilayer in a convolutedmorphology, which is randomly interconnected throughoutspace and divides the sample volume into two equivalentstrongly interwoven subvolumes. The relative stability ofthe isotropic L3 and LR structures depends critically onthe membrane curvature and flexibility. In consequence,transitions between these two phases may readily be
induced by altering these membrane properties. Suchchanges may be achieved by many methods, includingvarying temperature, electrolyte concentration, and co-surfactant surfactant ratio, all of which have beenextensively studied over the past decade.20-23 Morerecently it has been shown that structural transformationssimilar to these bulk isotropic transitions can also beinduced by geometrical constraints. The confinement ofa sponge phase between two rigid macroscopic walls of asurface forces apparatus can lead to a first-order transitionto a lamellar phase,24,25 which rapidly relaxes when theconfinement ceases.
We have recently characterized the ordering of the bulksponge phase in the proximity of a quartz surface usingsimultaneous measurement of neutron reflectometry (NR)and near surface small angle neutron scattering (NS-SANS) of a reflection geometry sample cell.26 The NRresults indicate a layered surface ordering correlated withthe solid-liquid interface and decaying exponentially withdepth over distances corresponding to a few membraneseparations. NS-SANS results are consistent with con-ventional SANS measurements, indicating that the lay-ered ordering established does not constitute a phase of(9) Diat, O.; Roux, D.; Nallet, F. J. Phys. II 1993, 3, 1427.
(10) Zipfel, J.; Berghausen, J.; Lindner, P.; Richtering, W. J. Phys.Chem. B 1999, 103, 2841.
(11) Diat, O.; Roux, D. J. Phys. II 1993, 3, 9.(12) Gulik-Krzywicki, T.; Dedieu, J. C.; Roux, D.; Degert, C.;
Laversanne, R. Langmuir 1996, 12, 4668.(13) Lasic, D. D. Liposomes; Elsevier: New York, 1993.(14) Diat, O.; Roux, D.; Nallet, F. Phys. Rev. E 1995, 51, N.4, 3296.(15) Sierro, P.; Roux, D. Phys. Rev. Lett. 1997, 78, 1496.(16) Lee, T. D.; Olsson, U.; Mortensen, K. Phys. Chem. Chem. Phys.
2001, 3, 1310.(17) Berni, M. G.; Lawrence, C. J.; Machin, D. Adv. Colloid Interface
Sci. 2002, 98, 217.(18) Courbin, L.; Delville, J. P.; Rouch, J.; Panizza, P. Phys. Rev.
Lett. 2002, 89, 148305.(19) Porte, G. J. Phys.: Condens. Matter 1992, 4, 8649 and references
therein.
(20) Nastishin, Y.; Lambert, E.; Boltenhagen, P. C. R. Acad. Sci.Paris 1995, t. 321, Ser. Iib 205.
(21) Porte, G.; Marignan, J.; Bassereau, P.; May, R. J. Phys. (Paris)1988, 49, 511.
(22) Ghosh, O.; Miller, C. A. J. Phys. Chem. 1987, 91, 4528.(23) Strey, R.; Jahn, W.; Skouri, M.; Porte, G.; Marignan, J.; Olsson,
U. Structure and Dynamics of strongly Interacting Colloids andSupramolecular Aggregates in Solution; Chen, S., Huang, J. S., Eds.;Kluwer Academic Publishers: Dordrecht, 1992; p 351.
(24) Antelmi, D. A.; Kekicheff, P.; Richetti, P. J. Phys. II 1995, 5,103.
(25) Petrov, P.; Olsson, U.; Christenson, H.; Miklavic, S.; Wenner-strom, H. Langmuir 1994, 10, 988.
(26) Hamilton, W. A.; Porcar, L.; Butler, P. D.; Warr, G. G. J. Chem.Phys. 2002, 116, 8533.
Figure 1. Schematic representation of sponge (L3) and lamellar(LR) membrane morphologies and their respective characteristiclengths, the sponge pore size ê, and lamellar periodicity d. Theinset shows an expanded view of a section of the membraneshowing the aggregation of surfactant molecules forming thebilayer of thickness δ.
Figure 2. Partial phase diagram at 20 °C of (a) CPCl/hexanol/brine (0.2 M NaCl) and (b) CPCl/hexanol/dextrose/brine (0.2 MNaCl) at a dextrose volume fraction in brine ψ ) 0.4. φ is themembrane volume fraction, and h represents the mass ratio ofthe hexanol cosurfactant to CPCl. Increasing h corresponds toan increase in the intrinsic curvature of the membrane, whichis reflected in the sequence of phases and biphasic regions shownhere: stacked lamellar (LR), sponge (L3), and isotropic micellar(Iso). This is typical of membrane-forming surfactant phasebehavior with respect to a change in such a parameter.Substitution of D2O for H2O for contrast in the neutronscattering experiments lowers the values of h at which thesephases are observed by about 2% for both these dextrose volumefractions.
10780 Langmuir, Vol. 19, No. 26, 2003 Porcar et al.

significant volume and is therefore driven by local changesto the free energy at the interface. Similar results wereearlier reported by Zhou et al.27 for bicontinuous C10E4/octane/D2O microemulsions, a system topologically similarto the sponge phases.
In some sense we expect dynamical responses to shearto be similar to those to the geometric constraint in thatthey arise from the introduction of anisotropy to a system.The dilute isotropic sponge phases studied here show astriking example of such a dynamical response when, whilebeing gently shaken or stirred, they become birefringent.As is well-known, stacked lamellar phases are stronglybirefringent, so this response suggests a shear-inducedanisotropic ordering. In their theoretical analysis of thenonequilibrium transitions in complex systems based onthe Maxwell effect, Cates and Milner28 predicted thatcoupling between the order parameter and the shear flowshould shift an observed isotropic to lamellar transitionby suppressing fluctuations and thus altering the forcesacting to stabilize the isotropic phase. In such an analysis,shear may be viewed as a quasi-thermodynamic variable,since the transformations considered are those betweenphases that exist in equilibrium. Further, they predictedthat the induced phase should occur preferentially in anorientation with the lamellar periodicity normal to boththe velocity and the velocity gradient (the a orientationas defined above). These predictions were confirmedexperimentally by Koppi et al.,29 who found a shear-induced shift in the isotropic to lamellar transitiontemperature in a block copolymer system. Cates andMilner also suggested that shear flow should similarlydestabilize the isotropic sponge phase and stabilize theanisotropic lamellar phase, thus neatly explaining thetransient birefringent response in these systems.
Such a transition must occur when the time scales forviscous and Brownian motions become comparable, so thatthe Peclet number30 is of order unity. The Peclet numberis defined here as Pe ) γê2/D, where ê is the sponge’scharacteristic length and D is the diffusion coefficient.The diffusion constant for the membrane is given by aStokes relationship and scales as D ∼ kBT/êηs, where ηsis the solvent viscosity. Thus, as originally noted by Catesand Milner,28 the critical shear rate for a transition shouldscale as γc ∼ kBT/ê3ηs. The correlation length itself scalesas ê ∼ δ/φ, where δ is the membrane thicknessstypically∼20 Åsand φ is the volume fraction of membrane, so thatfor a 10% membrane volume fraction sponge phase ê ∼200 Å. In a surfactant water system ηs ) 1 cP, and so γcshould be about 100 000 s-1. Thus, at moderate concen-trations of commonly studied sponge phases, a transitionshould occur at shear rates nearly an order of magnitudeabove the highest available experimentally under con-trolled conditions (∼15 000 s-1). However, the strongconcentration dependence predicted for γc suggests thatexperimentally accessible critical shear rates (near orbelow 103 s-1) should occur for very dilute sponge phases(membrane volume fractions < 2%), and indeed transientbirefringence under stirring is most easily observed insuch low concentration samples.31
Taking advantage of this strong concentration depen-dence by working on a hyperswollen lyotropic C12E5
system, Yamamoto and Tanaka32 were able to show inlight scattering measurements that oscillatory shear flowwould suppress the first-order nature of a sponge tolamellar transition, reducing the width of the phasecoexistence region. As one would expect from the quasi-thermodynamic characteristics of the predicted transfor-mation, this suppression was fully reversible and disap-peared upon cessation of the shearing flow. Totalsuppression of the transition was observed at an averageshear rate ⟨γ⟩ ∼ 300 s-1, consistent with the expected valueof γc calculated for their 1.8% C12E5 in the water spongephase of 270 s-1 (in this case, the membrane thickness δ∼ 30 Å). Also consistent with the scaling prediction werequantitative Couette shear studies of the birefringentresponse to shear in quaternary sodium dodecyl sulfate(SDS)/pentanol/dodecane/water sponge systems by Diatet al.,33 which indicated that birefringence occurs abovea critical shear rate which increased as the cube of themembrane volume fraction.
However, in a surprising contradiction to this prediction,Majhoub et al.34 recently reported small-angle X-raysstudies apparently indicating that relatively concentrated10-15% sponge phases in the CPCl/hexanol/brine spongesystem could be totally transformed to a lamellar phaseunder Couette shear at an unexpectedly low critical shearrate of about 50 s-1. This work is obviously at odds withthe good agreement found by Yamamoto and Tanaka aswell as the failure of other workers to observe such a lowshear transition in concentrated sponge phases of thisand other systems.35-37 Even more surprisingly, theyclaimed that in their case the shear-induced sponge tolamellar transition was apparently not reversible and thatthe “stabilized” lamellar phase produced in their experi-ments was never observed to relax to its initial equilibriumsponge phase after shear cessation.
While these reports have reopened the question of sheardriven L3 to LR transitions of the CPCl/hexanol/brinesystem in particular and of the dynamics of the transitionin general,38 the conclusions in each case are based onobservations of a few specific sponge phase samples. Toaddress the dynamics of these transitions systematicallyrequires a system that may be expected to exhibit thisbehavior in an experimentally accessible shear regime (ifpossible well below 10 000 s-1) for the widest possible rangeof the relevant system parameters. As discussed above,the critical shear rate for a sponge to lamellar transitionwill be proportional to the cube of the membrane con-centration and inversely proportional to the sampleviscosity. The strong concentration dependence suggeststhat a convenient critical shear rate should be achievableby studying dilute samples, as was done by YamamotoandTanaka.32 However, thedecreasingwidthof thespongephase stability domain with dilution, loss of scatteringsignal strength of the characteristic sponge cell size
(27) Zhou, X.-L.; Lee, L. T.; Chen, S.-H.; Strey, R. Phys. Rev. A 1992,46, 6479.
(28) Cates, M. E.; Milner, S. T. Phys. Rev. Lett. 1989, 62, 1856.(29) Koppi, K. A.; Tirrell, M.; Bates, F. S. Phys. Rev. Lett. 1993, 70,
1449.(30) Hunter, R. J. Foundations of Colloid Science Volume I; Oxford
University Press: 1987.(31) Hoffman, H.; Hofman, S.; Rauscher, A.; Kalus, J. Prog. Colloid
Polym. Sci. 1991, 84, 24.
(32) Yamamoto, J.; Tanaka, H. Phys. Rev. Lett. 1996, 77, 4390.(33) Diat, O.; Roux, D. Langmuir 1995, 11, 1392.(34) Majhoub, H. F.; Bourgaux, C.; Sergot, P.; Kleman, M. Phys. Rev.
Lett. 1998, 81, 2076.(35) Porte, G. (private communication).(36) Butler, P. D.; Porcar, L.; Hamilton, W. A.; Warr, G. G. Phys. Rev.
Lett. 2002, 88, 059601.(37) Porcar, L.; Hamilton, W. A.; Butler, P. D.; Warr, G. G. Phys. Rev.
Lett. 2002, 89, 168301.(38) Recently published results (Leon, A.; Bonn, D.; Meunier, J.; Al-
Kahwaji, A.; Kellay, H. Phys. Rev. Lett. 2001, 86, 938) also claim thatshear induces a quite extraordinary first-order sponge to lamellartransition for a 7% membrane volume fraction in the AOT/brine system.After a delay time at constant shear rates, random nucleation and growthof a lamellar phase within the sponge phase has been observed. Thedelay time reported before nucleation was observed decreased as theimposed shear rate increased, but the transition did not depend directlyon the shear rate (or the total strain) on the sample.
Scaling of Response of L3 Sponge Phases Langmuir, Vol. 19, No. 26, 2003 10781

signature and its movement to lower scattering vector,the difficulty of performing corresponding rheologicalmeasurement on these low viscosity solutions, and greatlyincreased sensitivity to cosurfactant evaporation in theparticular case of the CPCl/hexanol/brine system makethis option less attractive than it might initially appear.
In the work reported here, to avoid the necessity ofmeasurements on very low membrane volume fractionsponge phases, we have additionally adopted the alterna-tive strategy of increasing the solvent viscosity. We takeour lead from work indicating that, in microemulsionsystems, adding sugar can achieve this result withoutaltering the form of the phase diagram.39 Similarly, wefind that dissolving dextrose in the brine solvent does notsignificantly alter the general phase behavior or spongestructure observed for this system. However, it does allowus to increase the solvent viscosity of our sponge phasesamples by about an order of magnitude. Simple crossedpolarizer observations of these CPCl/hexanol/dextrose/brine sponge solutions at moderate membrane concentra-tions were extremely promising, showing clear birefrin-gence upon gentle stirring. This was not observed in sugar-free CPCl/hexanol/brine samples at the same membranevolume fractions and indicated a greatly increased shearresponse and a probable lowering of the critical shearrate for a sponge to lamellar transition for these samples.A further advantage to be expected for these sweetenedsponge phases is one of hydrodynamic stability, since theincreased viscosity reduces a sample’s Reynolds numberat a given cell rotation speed, moving the onset ofturbulence in the Couette cell to higher shear rates.
Experimental Methods
Materials. Cetylpyridinium chloride (CPCl) was purchasedfrom Sigma and recrystallized twice in acetone. Hexanol (purity> 99.99%), dextrose (purity > 99.9%), and sodium chloride (NaClpurity > 99.99%) were obtained from Sigma-Aldrich and usedas received. Water was ultrapure deionized Millipore water. Forneutron scattering measurements, water was replaced by heavywater in order to increase the scattering contrast betweenmembrane and solvent. We found that this substitution onlyslightly changed the phase boundaries reported for light water,with the difference in density apparently acting to compensatefor changes in solubility. After weighing and mixing of thesurfactant, cosurfactant, water, and dextrose, the sample solu-tions were stirred and centrifuged several times in order to ensurehomogeneity. The samples were then left undisturbed at 20 °Cfor several days to allow them to reach thermodynamic equi-librium.
We have used the following densities: 0.2 M NaCl in D2O,1.107 g/cm3; 0.2 M NaCl in H2O, 1.00 g/cm3; CPCl, 0.98 g/cm3;hexanol, 0.818 g/cm3: dextrose, 1.562 g/cm3. In this work thesample composition is fully described by the following param-eters: the membrane volume fraction, φ ) (VCPCl + Vhex)/Vtotal(the very low solubilities of CPCl and hexanol in water havebeen neglected); the mass mixing ratio of the membrane, h )mhex/mCPCl; and the volume fraction of dextrose in the solvent,ψ ) Vdextrose/(Vdextrose + Vbrine). To minimize spurious evaporationeffects, all samples were in the hexanol-rich part of the spongephase stability domain close to the L3/Iso (isotropic) boundary.Using samples far away from the L3/LR coexistence region reducestheir sensitivity to small losses of the hexanol cosurfactant, whichmight otherwise drive the system rapidly (and irreversibly) intothe biphasic region (Figure 2).
Neutron Scattering. (i) To characterize the static structuresof the CPCl/hexanol/dextrose/heavy brine samples, standardSANS measurements on samples in Helma Suprasil quartz“banjo” cells were performed both on the NG-3 SANS spectrom-eter40 at the Cold Neutron Research Facility, National Instituteof Standards and Technology, Gaithersburg, and on the High
Flux Isotope Reactor SANS instrument at Oak Ridge NationalLaboratory.41 The incident neutron wavelength used was 6 Åwith ∆λ/λ ∼ 0.15 at NIST and 4.75 Å with ∆λ/λ ∼ 0.05 at theHFIR. The scattering data were collected on a two-dimensionaldetector and covered the entire accessible Q range or roughly0.003-0.4 Å-1. Each raw data set was corrected for detectorbackground, sensitivity, and scattering from the empty cell inthe usual fashion.42 Conversion to the absolute scale on NG-3 isdone in the standard manner using the direct beam as a primarystandard and correcting for sample transmission. At the HFIR,the absolute scale is obtained by comparison with precalibratedsecondary standards based on measurement of the beam flux,the vanadium incoherent cross section, and the scattering fromwater.42 All 2D data in these measurements were isotropic andwere radially averaged.
(ii) SANS under shear measurements were performed on theNG-3 SANS spectrometer, and the incident neutron wavelengthused was 6 Å with ∆λ/λ of 15%. The scattering data were collectedon a two-dimensional detector covering a range of momentumtransfers Q from 0.004 to 0.03 Å-1. Samples were Couette shearedbetween two concentric quartz cylinders with an annular gap of0.5 or 1 mm (outer radius 25 mm) with the inner stator cylinderstationary and maintained at constant temperature (20 ( 0.1°C) to control viscous heating. All measurements were performedbelow the critical Reynolds number for this configuration (∼1500).Our ORNL neutron Couette cell has a specially designed vaporbarrier to absolutely minimize the effects of evaporation. Thisis critical in obtaining consistent reproducible results in a verysensitive system such as the L3 sponge phase studied here, which,as noted above, only a very small amount of cosurfactantevaporation will bring into an equilibrium LR lamellar phase.43
The two scattering configurations used in the Couette SANSmeasurements are shown in Figure 3a: In the radial geometry,the neutron beam passes through the sample along the velocitygradient direction,∇V, across the diameter of the cylinders, while,in the tangential geometry, the beam passes along the flowdirection, V, along the tangent of the sample annulus. Theseconfigurations allow us to measure membrane orientationsrelative to the (V, Z) and (∇V, Z) planes, respectively, where Zdenotes the rotation axis of the cylinders, which in this case isthe vorticity axis of the shear field. Thus, in Figure 3b we showschematics of the pattern of Bragg peaks expected in scatteringfrom the a, b, and c orientations of an aligned lamellar phaseunder Couette shear. A typical measuring time was 5 min for theradial geometry and 25 min for the tangential geometry. In theradial configuration, a 10 mm diameter sample aperture wasused, while, in the tangential one, rectangular slits 12 mm highand with widths of 0.6 and 0.4 mm were used for the 1 or 0.5 mmgaps, respectively.
Each raw data set was corrected for detector background,sensitivity, and scattering from the empty cell in the usualfashion.42 In the radial scattering configuration, conversion toan absolute scale can be done in the standard manner using thedirect beam as a primary standard, correcting for sampletransmission and thickness, tRAD ) 2g (i.e. twice the Couettegap). Absolute calibration in the tangential geometry is moreproblematic and is usually accomplished (if indeed it is doneat all) by matching the intensity of an isotropic scatterer in theradial geometry with it in the tangential one. In this workwe used an alternate method: from the tangential trans-mission TTAN we obtain an effective tangential thickness tTANconsistent with the absorption coefficient obtained from theradial transmission TRAD and its known thickness tRAD, that is,tTAN ) tRAD ln[TTAN]/ln[TRAD]. Using this value then allowsreduction of the tangential data to an absolute scale in thesame manner as is described above for the radial data. Thismethod provides good quantitative agreement between theseconfigurations for these samples. It is fully described in a previous
(39) Chen, V. Ph.D. Thesis, University of Minnesota, 1988.
(40) Glinka, C. J.; Barker, J. G.; Hammouda, B.; Krueger, S.; Moyer,J. J.; Orts, W. J. J. Appl. Crystallogr. 1998, 31, 430.
(41) This instrument has been shortened from the 30 m geometrydescribed in detail by: Koehler, W. C. Physica B 1996, 137, 320. Thesample to detector distance is now 12 m (down from 18 m).
(42) Wignall, G. D.; Bates, F. S. J. Appl. Crystallogr. 1986, 20, 28.(43) Porcar, L.; Hamilton, W. A.; Butler, P. D.; Warr, G. G. Rev. Sci.
Instrum. 2002, 73, 2345.
10782 Langmuir, Vol. 19, No. 26, 2003 Porcar et al.

paper,43 which also gives details of the design and capabilitiesof the ORNL Couette cell.
Rheology. The rheological characterizations of CPCl/hexanol/dextrose/heavy brine samples were carried out using a RheoStress150 rheometer from Haake (Gebr. Haake GmbH, Karlsruhe,Germany). The measurements were performed at controlledCouette shearratesusing acoaxial cylinderstress sensorofdoublegap geometry (Haake DG41) designed for low viscosity measure-ments. The gap widths were 0.3 and 0.25 mm. The cup of thecoaxial cylinders is constructed of stainless steel, while therotating stress sensor bob is titanium plated. For our samples,this apparatus allows viscosity measurement at shear ratessufficiently low to obtain the zero shear rate limit viscosity andhigh enough to reach the non-Newtonian range. Rheologicalmeasurements were taken by shear sweeping over a range of γfrom 1 to 8000 s-1, waiting at each discrete shear rate for asteady shear response to be established, at a fixed temperatureof 20 °C with samples free of foam. A full vapor barrier is notavailable for this instrument, and a makeshift installation wasonly partially effective so each measurement was limited to abouta 20 min duration. Afterward the recovered samples were sealedin small bottles and carefully observed between crossed polarizersto ensure that they still showed the isotropic sponge structureand exhibited no static birefringence indicating the presence ofan equilibrium lamellar phase component, which as the phasediagrams (Figure 2) of this system indicate, can arise relatively
rapidly in this unsealed sample bob upon the evaporation of onlya small amount of the hexanol cosurfactant.36
Dynamic Light Scattering (DLS). The simple quasi-elasticlight scattering determinations of the membrane’s cooperativediffusion coefficient presented here were taken at a singlescattering angle of 90° using a Coulter model N4 MD “submicronparticle analyzer” (Coulter Electronics, Inc., Hialeah, FL) atthe He/Ne laser wavelength λ ) 6328 Å. Values were correctedfor refractive index variation of the samples from 1.34 for thenormal brine solvent to 1.42 at the highest dextrose concentration,ψ ) 0.4.
Experimental ResultsEquilibrium Phase Behavior of Sweetened Mem-
brane Phases. At volume fractions up to ψ ) 0.4 (thehighest concentration used in these measurements), thepresence of dextrose in the brine solvent (0.2 M NaCl)was not observed to alter the sequences of phases in thissystem. Simple visual and crossed polarizer observationsshowed that changing the mass ratio h of the membraneconstituents hexanol and CPCl, which controls theinterfacial film curvature, gives rise to micelle, lamellar,and sponge phases and coexistence regions in the samesequence as that encountered in the unsweetened CPCl/hexanol/brine system. There were relatively small shiftsin the observed phase boundaries. Figure 2 representsthe phase diagram in the region of the stability domainof the sponge phase for the CPCl/hexanol membranesystem (a) in H2O brine and (b) in fully sweetened H2Obrine (ψ ) 0.4). The stability region of the sponge phaseis of about the same width with respect to h over the rangeof membrane volume fractions, but as ψ changes from 0to 0.4, the value of h at which the sponge phase occursdecreases by about 12%. Substitution of heavy D2O brineas a constituent of the system for neutron contrast in thescattering measurements also results in a small shift inthe phase region, lowering h by about 2% for systemswith and without dextrose. Again, the phase sequence isunchanged, and we found that phase widths in h were thesame as those for the corresponding undeuterated system.
Static Structure of Sweetened Sponge Phases. Wehave investigated the effect of dextrose on the convolutedsponge phase structure using SANS on the deuteratedsponge system. Figure 4a represents fits to the measuredSANS intensity for sponge samples at a constant mem-brane volume fraction φ ) 0.15 for normal heavy brine (ψ) 0) and at the dextrose solvent volume fractions used inthis study: ψ ) 0.1, 0.2, 0.3, and 0.4. Clearly, the overallscattering pattern and the position and width of thecorrelation peak characteristic of the sponge pore sizeappear to be in good agreement, indicating that thestructure is unaffected by the addition of dextrose.
Quantitative values were obtained from the followingfit to the data. We have used the SANS structure factordue to Lei et al.,44 which may be written
The first two terms of this expression are the structurefactor derived by Roux et al.,45,46 which describes themembrane correlations on a length scale much larger thanthe pore size in terms of an “inside-outside” correlationlength úio. This expression has successfully been used to
(44) Lei, N.; Safinya, C. R.; Roux, D.; Liang, K. S. Phys. Rev. E 1997,56, 608.
(45) Roux, D.; Cates, M. E.; Olsson, U.; Ball, R. C.; Nallet, F.; Bellocq,A. M. Europhys. Lett. 1990, 11, 229.
(46) Roux, D.; Coulon, C. J. Phys. Chem. 1992, 96, 4147.
Figure 3. (a) Schematic representation of the sample geometryin a Couette shear cell neutron scattering experiment for radialand tangential geometries and identification of the axes withrespect to the shear cell. (b) Schematic of expected scatteringpeaks in radial and tangential geometries from aligned lamellarphases in the Couette shear field with the following membraneorientations: a, perpendicular to the flow vorticity direction Z;b, perpendicular to the flow direction V; c, perpendicular to theshear gradient ∇V.
S(Q) ) 1 +A arctan[Qúio/2]
Q+ B
1/ú32 + (Q - Q3)
2(1)
Scaling of Response of L3 Sponge Phases Langmuir, Vol. 19, No. 26, 2003 10783

fit light scattering data from different systems over a broadrange of very small Q. The choice of a volume fraction φ
) 0.15 for this dextrose series allows us to measure thescattering over a Q range where it is dominated by thecontribution of the final Lorentzian term, which charac-terizes the scattering from the sponge structure by acorrelation length ú3 and the average pore size ê ≡ 2π/Q3.The concentration is high enough that the contribution ofthe larger scale structure in our fits is that of a simplesmall A/Q term, while it is low enough that form factorscattering variations due to the membrane’s scatteringcontrast thickness are also relatively smooth near thesponge correlation peak.
For the form factor, Lei et al.44 used a numericalcalculation of the scattering randomly oriented disks ofthe membrane with a definite radius R and contrastthickness t0sin this case the thickness of the membrane’shydrocarbon core. We have used the form factor forscattering from membrane “discoids” of contrast thicknesst0 with a Gaussian distribution of transverse scatteringlength density characterized by a radius of gyration σ.For the purposes of fitting our sponge scattering data, theform factors of disks and discoids should be essentiallyequivalent when their radii of gyration are the same, thatis, when R ) x2σ, with the latter having the advantageof being more mathematically tractable. Starting from anaveraged membrane form factor due to Nallet et al.,47 we
have derived an analytical approximation for the formfactor of these discoids averaged over random orientations:
This form is simplified slightly from a previously publishedapproximate form26 in that it assumes that (as is the casefor the dilute and semidilute samples studied here) theneutron contrast discoids have relatively large transverseradii of gyration σ, which we may therefore use toapproximate their full radius of gyration Rg = (σ2 +t02/12)1/2; that is, we assume the transverse radius of
gyration is much greater than the rms width of thehydrocarbon core σ . t0/(12)1/2. As expected, this expressionagreed well with the numerically calculated values of theLei et al. form factor when R ) x2σ; however, theavailability of an analytical form factor makes fitting thescattering data simpler and much faster. Each such discoidhas an effective scattering contrast volume VD ) πσ2t0.(Thus, at low Q we may readily verify that this form factorapproximately recovers the expected Guinier behavior,P(Qf0) ≈ (∆F)2VD
2 exp[-Q2σ2/3].)The observed scattering intensity Icoh(Q) is then the sum
of the coherent structural scattering Icoh(Q) ) NS(Q) P(Q),where N is the effective number density of the discoids insolution, and an isotropic incoherent contribution Iincohdominated by hydrogen scattering.
The effective number density of these discoids in solutionis determined from their full volume; that is, N ) φ/πσ2δ,where δ is the full membrane thickness as opposed to thescattering contrast thickness t0. The charged surface grouplayers on the outer surfaces of CPCl/hexanol membranesare about 2.5 Å thick and have lower contrast with respectto the solvent both intrinsically and because of penetrationof solvent molecules which are excluded from the hydro-phobic core. In the following fits, we therefore maintainedδ ≡ t0 + 5 Å.
The values of the structural parameters obtained fromthe fits to these data are presented in Table 1. None of thefit parameters, even those most sensitive to change of thesponge structure, the pore size ê and the sponge correlationlength ú3, vary systematically or significantly with thesugar concentration. This is further illustrated in Figure4b, which shows the coherent scattering intensity fromthese samples after subtraction of the incoherent scat-tering background obtained from the fits and scaling outthe expected differences in scattering power between thesamples (which varies by about a factor of 2 over the series).
(47) Nallet, F.; Laversanne, R.; Roux, D. J. Phys. II 1993, 3, 487. Thestarting lamellar form factor may be viewed as arising from averaginga standard lamellar form factor over a Gaussian distribution ofmembrane thicknesses. The specific parameters in the exponential termexp[-Q2 t0
2/32] in the numerator of eq 2 correspond to this distributionhaving a standard deviation equal to one-quarter the contrast thickness,a value which both we and Nallet et al. found satisfactory. Note: Anobvious typographical error in our published derivation of the randomorientation discoid form factor in ref 26 omitted the minus sign in theexponential in this equation (there equation C2).
Figure 4. (a) Measured SANS intensity and best fits from eqs1 and 2 with parameters from Table 1 for sponge phases atconstant membrane volume fraction φ ) 0.15 for a range ofdextrose volume fractions. The absolutely scaled intensitycurves are shifted for clarity. (b) Normalized coherent SANSintensity Icoh/(∆F)2 for these samples, where ∆F is the neutroncontrast between the hydrophobic membrane tail and thesolvent. For the ψ ) 0 sample ∆F ) 6.42 × 10⁻⁶ Å-2 and for theψ ) 0.4 sample ∆F ) 4.47 × 10⁻⁶ Å-2, so the normalizing factor(∆F)2 varies by about 2 over the range of this series.
Table 1. Sponge Structure Parameters Obtained for theFits Shown in Figure 4a to the Small Angle Neutron
Scattering Signal from O ) 0.15 Sponge Phase Samples ata Series of Dextrose Volume Fractions in Brine ψ
ψ ú3 (Å) ê ≡ 2π/Q3 (Å) σ (Å) t0 (Å) Iincoh (cm-1)
0 81 240 25.1 20.4 0.230.10 87 236 26.7 20.7 0.320.20 89 234 27.6 20.8 0.410.30 90 236 27.8 20.9 0.530.40 86 240 26.9 20.7 0.63
P(Q) ≈ 4(πσ2∆F)2 (1 - cos[Qt0] exp[-Q2t02/32])/Q2
Q2σ2 + 2 exp[-Q2σ2/6 ](2)
10784 Langmuir, Vol. 19, No. 26, 2003 Porcar et al.
If we assume there is no incorporation of dextrose into themembrane, the scattering power will be proportional tothe square of the difference in scattering length densityof the CPCl/hexanol hydrophobic core and the dextrose inheavy brine solvent for that particular sample. Thusscaled, the scattering data from all five samples are inexcellent agreement, indicating that the dextrose isexcluded from the membrane and has no significant effecton the sponge structure over these length scales.
The hydrocarbon core thickness obtained from the fitsin Figure 4a is t0 ) 20.7 ( 0.2 Å, which compares extremelywell with previous determinations of the CPCl/hexanolmembrane contrast width, t0 ) 20.5 ( 1 Å, obtained inscattering experiments on sponge and lamellar membranephases in normal brine.26,48,49 As those measurements focuson the sponge phases’s characteristic correlation pore peakscattering, we chose a relatively high membrane volumefraction to ensure that this appeared at higher Q toseparate it from the strong long-range correlation scat-tering at low Q. Figure 5 shows higher Q range measure-ments on two samples at lower membrane volume fractionφ ) 0.05 in normal brine and at our highest dextrosevolume fraction of ψ ) 0.4. At this choice of concentrationand higher Q range (Qσ . 1), the scattering is dominatedby the membrane form factor (S(Q) = 1) and may beapproximated by50
In the presentation of this scattering data, we have scaledout both the strong Q-4 dependence in this range and thenominal scattering contrast factor (∆F)2. We note that boththe magnitude and functional form of the result I(Q)Q4/(∆F)2 depend directly on the membrane thicknesses δ ≡t0 + 5 Å. Clearly, over their common range, the rescaledscattering measurements are in excellent agreement. (Theusable signal-to-noise ratio for the unsweetened brine
sample data extends to higher Q, since it has both astronger coherent scattering signal due to higher mem-brane to solvent contrast and a lower contribution to theincoherentbackgroundscattering fromthesolvent.)Again,the fits to these data give values of t0 consistent with eachother and with earlier determinations of the hydrocarboncore thickness of the CPCl/hexanol membrane.
To first-order, the scale invariance of the curvatureelasticity of membrane phases such as the sponge scaleleads to a simple scaling of the structure factor scatter-ing.51,52 The scattered intensity is inversely proportionalto the membrane volume fraction φ, as are the sizes ofsuch features as the pores. The latter means that thepositions of such features as the pore-pore correlationpeak in Q are proportional to φ. To the extent that thisscaling may be energetically driven, it is important toverify that it is maintained for the high dextrose con-centration, low membrane volume fraction samples re-quired for the rheological measurements presented here.Figure 6 shows static scattering measurements before (a)and after (b) rescaling to eliminate both scale invarianceand scattering power (Iφ/(∆F)2 vs Q/φ) for two dilute heavybrine sponge structural series: (i) a series at a constantmembrane volume fraction of φ ) 0.05, with varyingdextrose concentrations in the brine ψ ) 0, 0.2, 0.3 and0.4, and (ii) an (intersecting) series with a constant highdextrose volume fraction ψ ) 0.4 with varying membranevolume fractionsφ) 0.03, 0.05, 0.07, and 0.10. The identityof the rescaled profiles is striking, and the scale invarianceof the sponge structure is clearly maintained even at thehighest ratio of dextrose to CPCl/hexanol in these samples.
Rheology: (a) Low Shear Rate Response. The responseof a complex fluid to shear may be described in terms ofthe Peclet number or, equivalently, in terms of the Deborahnumber2 De ≡ γ/ω, defined as the ratio of the appliedshear rate to the characteristic response frequency ω ofthe material. (In our case, a simple estimate of the responsefrequency can be inferred from the expression for thecritical shear rate derived from the Peclet number ω ∼ γc∼ kBT/ê3ηs, yielding Pe ∼ De ∼ γê3ηs/kBT.) For De < 1, theresponse is essentially Newtonian, and in this section, wecompare the rheological properties of sweetened andunsweetened sponges in this limit, which holds for all oursamples for shear rates γ e 100 s-1. (See, for instance, thesamples’s viscosity in the low shear region of Figures 9and 12a.). Although we note a definite increase of theviscosity for dextrose-containing samples compared withthose measured with the normal brine system, thisNewtonian behavior indicates that shear has no significantinfluence on the sponge microstructure of any of thesesamples in this range.
Snabre and Porte53 proposed a stress relaxation mech-anism to describe the viscosity behavior of the spongephase at low shear rates at which the morphology is onlystretched, that is, if the sponge structure is not entangledor passages between membranes are destroyed. Relief ofstresses in the slightly distorted sponge structure doesnot therefore depend on complicated high energy pro-cesses, such as passages moving past or across each otheror being created or destroyed, but is dominated by simpleviscous flow of the surfactant in the membrane and thesolvent through the passages. In this case, they predicted
(48) Bouglet, G.; Ligoure, C. Eur. Phys. J. B 1999, 9, 137.(49) Roux, D.; Nallet, F.; Freyssingeas, E.; Porte, G.; Bassereau, P.;
Skouri, M.; Marignan, J. Europhys. Lett. 1992, 17, 575.(50) The validity of eq 3 at high Q may be further confirmed by
comparing its behavior to that of the expected Porod form for scatteringfrom randomly oriented sharp interfaces in this limit; that is, I(Q) ≈2π(∆F)2Sv/Q4, where Sv is the total interfacial area per unit volume(Porod, G. Kolloid Z. 1951, 124, 82). A two sided patch of membranehas the interfacial area 2A and volume Aδ, which is a fraction φ of thetotal volume occupied (on average) by the patch; so Sv ) (2A)/(Aδ/φ) )2φ/δ. Inserting this in the Porod expression, we recover the large Qlimit of eq 3: I(Q) . 4πφ(∆F)2/δQ4.
(51) Skouri, M.; Marignan, J.; Appell, J.; Porte, G. J. Phys. II 1991,1, 1121.
(52) Porte, G. From Giant Membranes to Fluid Membranes: Poly-morphism in Dilute Solutions of Surfactant Molecules. In Soft MatterPhysics; Daoud, M., Williams, C. E., Eds.; Springer: Berlin, 1995;Chapter 5, p 155.
(53) Snabre, P.; Porte, G. Europhys. Lett. 1990, 13, 641.
Figure 5. Higher Q range scattering measurements on twosamples at membrane volume fraction φ ) 0.05 in normal brineand at our highest dextrose volume fraction of ψ ) 0.4.Intensities have been scaled by Q4/(∆F)2. Fits are to theisotropically averaged discoids form factor eq 3.
I(Q) ≈ NP(Q) ≈4πφ(∆F)2
δ(1 - cos[Qt0] exp[-Q2t0
2/32])
Q4(3)
Scaling of Response of L3 Sponge Phases Langmuir, Vol. 19, No. 26, 2003 10785
that the low shear viscosity of sponge phases shoulddepend on membrane volume fraction as η0(φ) ) Aηs +Bφ. Here the prefactor A directly represents the apparentviscosity change due to flow pattern restrictions imposedupon the solvent by the scale invariant sponge geometry.As such, it should therefore be independent of the chemicalsystemandmembranevolumefraction.SnabreandPorte53
and later Gomati et al.54 found values of A of about 3 forCPCl/hexanol in normal brine sponges. The second termtakes into account chemical system and membrane volumefraction dependent effects such as the diffusion of sur-factant molecules within the membrane and surface areadrag as the solvent moves past it.
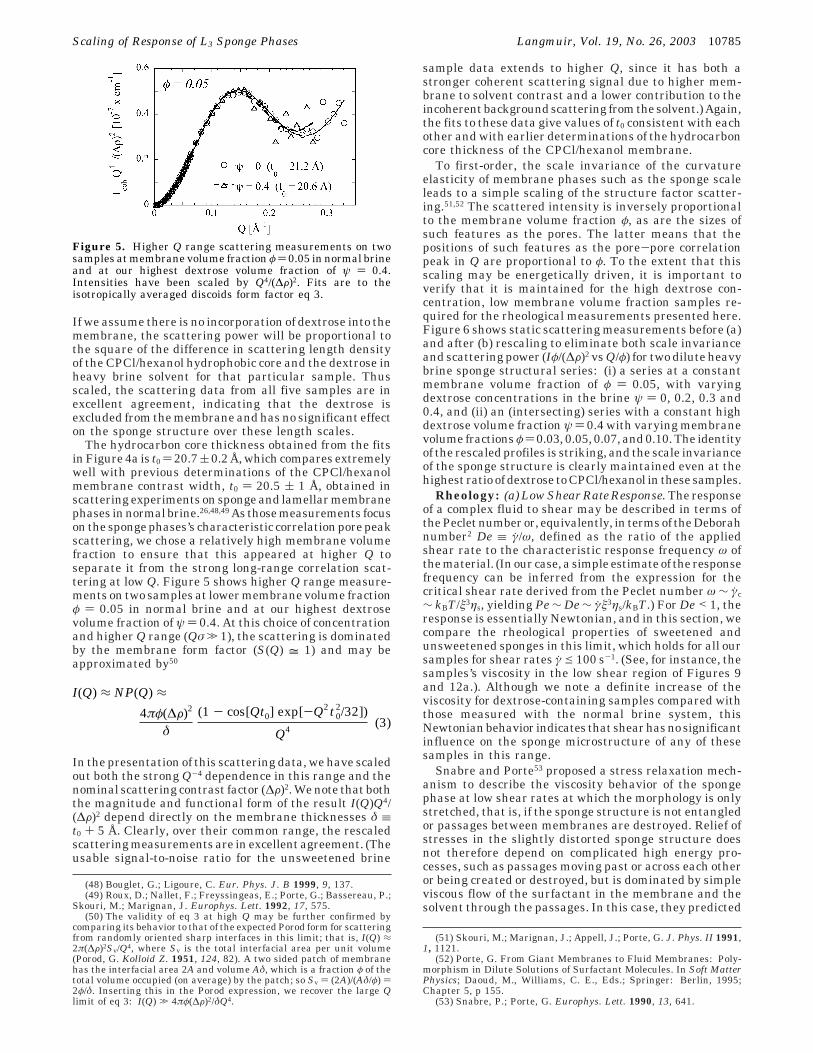
Figure 7 shows the variation in the ratio of the zeroshear limit viscosity of sponge samples to that of thesolvent η0/ηs for a series of membrane volume fractions φwithout dextrose ψ ) 0 and at high dextrose volumefractions ψ ) 0.4. The measured viscosity for our lightwater brine at 20 °C was 1.04 cP, while that of the highdextrose brine is more than an order of magnitude higher,13.4 cP. For both sample series the predicted linearbehavior with membrane volume fraction is observed withthe sponge to solvent viscosity ratio extrapolating to almostexactly the same value, A ≈ 3.4 at φ ) 0, indicating thatthe geometry dependent prefactor is the same for thissystem with and without dextrose added to the brine.
Cooperative Membrane Diffusion Coefficient.Porte et al.55 have demonstrated that for symmetricsponge56 phases the characteristic relaxation frequencyof concentration fluctuations τD
-1 determined by dynamiclight scattering (DLS) is simply related to Q2, with theconstant of proportionality being the cooperative mem-brane diffusion coefficient τD
-1 ) DQ2. This is consistentwith a simple diffusion process under the constraint ofthe conservation of the membrane volume fraction in thesesystems. Using the classical Stokes-Einstein relation forobjects of effective hydrodynamic radius êH, we maytherefore write D ) kBT/6πηsêH. Figure 8a shows mea-surements D as determined by DLS for sponge samplesat a constant membrane volume fraction φ ) 0.05 for ourfull range of dextrose volume fractions ψ ) 0-0.4 plottedagainst the reciprocal of the viscosity of the brine solvent,1/ηs. Clearly, the measured membrane diffusion coef-ficients are inversely proportional to the solvent viscosity.From the straight line fit to these data we may infer aneffective hydrodynamic radius of êH of 760 Å, which, aswe might expect, is roughly equal to the pore-porecorrelation distance ê ≈ 800 Å (Q3 ) 0.008 Å-1) measuredfor corresponding φ ) 0.05 sponge samples in sweetenedheavy brine. The measured viscosities for the light andheavy brines with added dextrose solvent used in themeasurements presented in this paper are plotted inFigure 8b.
(b) Full Shear Response. We have found the slowerresponse times in this system due to the increase in thesolvent viscosity with the addition of dextrose to the brinemake it relatively easy to reach Deborah numbers De aboveunity at experimentally convenient shear rates, viscosities,and membrane volume fractions. Figure 9 shows that,while a normal brine sponge sample at a membranevolume fraction φ ) 0.1 is Newtonian, indicating that Dee1 to the highest shear rate accessible in our Couetterheometer, γ ∼ 8000 s-1, a highly sweetened sponge (ψ )
(54) Gomati, R.; Bouguerra, N.; Gharbi, A. Physica B 2002, 322, 262.
(55) Porte, G.; Delsanti, M.; Billard, I.; Skouri, M.; Appell, J.;Marignan, J.; Debeauvais, F. J. Phys. II 1991, 1, 1101.
(56) This simple proportionality of the relaxation frequency to Q2
cannot be assumed for asymmetric sponges (Granek, R.; Cates, M. E.Phys. Rev. A 1992, 46, 3319) or hyperswollen sponge phases (Freys-singeas, E.; Roux, D.; Nallet, F. J. Phys. II 1997, 7, 913). However, bothof these exceptions apply to much higher dilution than any consideredin this work. Further, it has been shown19 that the CPCl/hexanol/brinesystem does not in fact exhibit any of these peculiarities, and we mayexpect this to hold for our dextrose modification of the solvent of thissystem.
Figure 6. Static scattering measurements before (a) and after (b) rescaling to eliminate both scale invariance and scattering power(Iφ/(∆F)2 vs Q/φ) for two dilute heavy brine sponge sample series: at a constant membrane volume fraction of φ ) 0.05, with varyingdextrose concentrations in the brine ψ ) 0, 0.2, 0.3, and 0.4; and at a constant dextrose volume fraction ψ ) 0.4, with varyingmembrane volume fractions φ ) 0.03, 0.05, 0.07, and 0.10.
Figure 7. Variation of η0/ηs, the ratio of the low shear rateviscosity of sponge phases η0 to the solvent viscosity ηs, withmembrane volume fraction φ, for normal brine solvent (ηs ) 1.0cP) and viscosity highest dextrose volume fraction of ψ ) 0.4brine (ηs ) 13.4 cP).
10786 Langmuir, Vol. 19, No. 26, 2003 Porcar et al.

0.4) at the same volume fraction begins to shear thin ata shear rate over an order of magnitude lower. This isconsistent with the scaling relation outlined above, whichpredicts that critical shear rates in this system shouldscale inversely with the solvent viscosity.
The full range of viscosity versus shear rate behaviorwe observed for these sweetened sponge systems isaccessible in our rheometer at a lower membrane volumefraction ofφ) 0.05 at the same high dextrose concentrationψ ) 0.4 and is shown in Figure 10a. Again, this is consistentwith the scaling predictions which indicate that halvingthe membrane volume fraction should reduce critical shear
rates by a factor of 8. The full shear behavior ischaracterized by three distinct regions: At low shear rates(region I), the sponge phase sample exhibits Newtonianbehavior (as described in the previous section), and itsstructure is apparently not affected by the shear. In anintermediate range (region II), the solution shear thins,indicating that some structural change is occurring. Athigher shear rates for our lower membrane volumefraction, high solvent viscosity samples, we now reach athird “quasi-Newtonian” region (III), where the viscosityis nearly constant once again. Figure 10b shows the shearstress measurements from which the viscosity is derived(τ ) ηγ). The absence of a plateau in this stress curve orof any detectable hysteresis57 in region II indicates thatthe structural change which gives rise to the shearthinning is not first-order as predicted by the theory ofCates and Milner28 and rules out biphasic effects such as“shear banding”,58,59 distinguishing this response fromthose recently reported for polymeric bicontinuous mi-croemulsions by Krishnan et al.60 The gradual variationof the viscosity over the shear-thinning region for thissystem suggests a transformation that proceeds byprogressively distorting the membrane structure ratherthan creating a new phase.
SANSMeasurementsofSweetenedSpongePhasesunderShear. Thedetails of themicrostructural responsesof sweetened sponge phases to shear were investigated ina series of Couette SANS measurements on a CPCl/hexanol/heavy brine/dextrose sponge phases. Figure 11
(57) No hysteresis in the viscosity was detectable in measurementscans sweeping the shear rate up or down within region II. Nor did weobserve any difference in the viscosity measured in this region aftershearing for 10 s or 5 min at a particular shear rate.
(58) Berret, J. F.; Roux, D. C.; Lindner, P. Eur. Phys. J. B 1998, 5,67.
(59) Olmsted, P. D.; Lu, C. Y. D. Phys. Rev. E 1997, 56, R55.(60) Krishnan, K.; Almdal, K.; Burghardt, W. R.; Lodge, T. P.; Bates,
F. S. Phys. Rev. Lett. 2001, 87, 098301. Krishnan, K.; Chapman, B.;Bates, F. S.; Lodge, T. P.; Almdal, K.; Burghardt, W. R. J. Rheol. 2002,46, 529. This work presents an excellent example of constant shearstress measurements corresponding to a “flow-induced phase separation”(i.e. biphasic) regime expected for a first-order transition.
Figure 8. (a) Cooperative coefficient of diffusion D for spongesamples at a constant membrane volume fraction φ ) 0.05 forour full range of dextrose volume fractions ψ ) 0-0.4 plottedagainst the reciprocal of the viscosity of the brine solvent, 1/ηs.(b) Viscosity ηs versus dextrose volume fraction ψ for the normaland heavy brine solvents used in this study. The dashed lineshows CRC Handbook of Chemistry and Physics data.
Figure 9. Viscosity η versus shear rate γ for CPCl/hexanolmembrane sponge samples with membrane volume fraction φ) 0.1 in normal brine solvent (ψ ) 0) and at dextrose volumefraction in brine ψ ) 0.4. While the normal brine sponge sampleis Newtonian to shear rates of at least 8000 s-1, the ψ ) 0.4sponge shows pronounced shear thinning above ∼500 s-1.
Figure 10. Full range of shear response observed for thesesweetened sponge systems in (a) viscosity η and (b) shear stressτ versus γ for a membrane volume fraction of φ ) 0.05 at highdextrose concentration, ψ ) 0.4.
Scaling of Response of L3 Sponge Phases Langmuir, Vol. 19, No. 26, 2003 10787

Figure 11. Variation in scattering in radial and tangential geometries with shear γ for a φ ) 0.05/ψ ) 0.4 heavy brine spongesample phase in radial and tangential geometries for a range of shear rates spanning all three shear regions. The graphs on theright show the corresponding scattering intensity of these data along the flow (V), shear gradient (∇V), and vorticity (Z) axes, asidentified in Figure 3 for the two geometries: IZ(RAD) and IV for the radial configuration; IZ(TAN) and I∇V for the tangential configuration.Each intensity has been sector averaged over ∆θ ) (10° of the axis.
10788 Langmuir, Vol. 19, No. 26, 2003 Porcar et al.
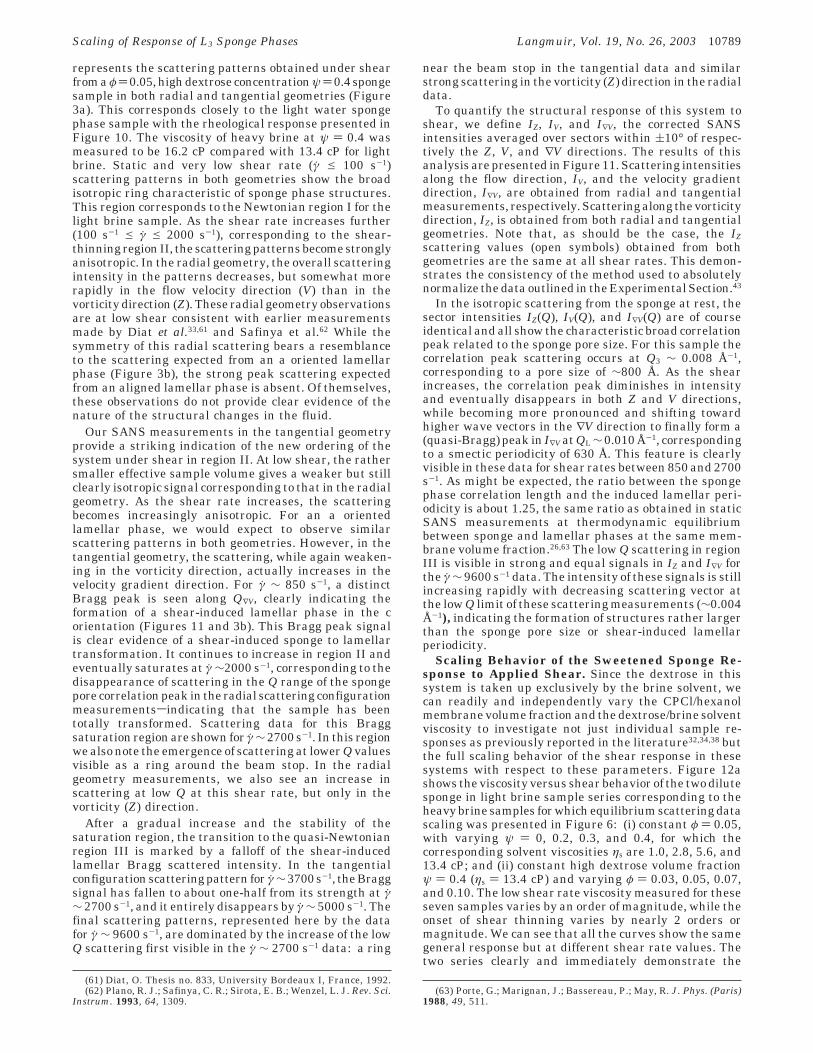
represents the scattering patterns obtained under shearfrom aφ) 0.05, high dextrose concentration ψ ) 0.4 spongesample in both radial and tangential geometries (Figure3a). This corresponds closely to the light water spongephase sample with the rheological response presented inFigure 10. The viscosity of heavy brine at ψ ) 0.4 wasmeasured to be 16.2 cP compared with 13.4 cP for lightbrine. Static and very low shear rate (γ e 100 s-1)scattering patterns in both geometries show the broadisotropic ring characteristic of sponge phase structures.This region corresponds to the Newtonian region I for thelight brine sample. As the shear rate increases further(100 s-1 e γ e 2000 s-1), corresponding to the shear-thinning region II, the scattering patterns become stronglyanisotropic. In the radial geometry, the overall scatteringintensity in the patterns decreases, but somewhat morerapidly in the flow velocity direction (V) than in thevorticity direction (Z). These radial geometry observationsare at low shear consistent with earlier measurementsmade by Diat et al.33,61 and Safinya et al.62 While thesymmetry of this radial scattering bears a resemblanceto the scattering expected from an a oriented lamellarphase (Figure 3b), the strong peak scattering expectedfrom an aligned lamellar phase is absent. Of themselves,these observations do not provide clear evidence of thenature of the structural changes in the fluid.
Our SANS measurements in the tangential geometryprovide a striking indication of the new ordering of thesystem under shear in region II. At low shear, the rathersmaller effective sample volume gives a weaker but stillclearly isotropic signal corresponding to that in the radialgeometry. As the shear rate increases, the scatteringbecomes increasingly anisotropic. For an a orientedlamellar phase, we would expect to observe similarscattering patterns in both geometries. However, in thetangential geometry, the scattering, while again weaken-ing in the vorticity direction, actually increases in thevelocity gradient direction. For γ ∼ 850 s-1, a distinctBragg peak is seen along Q∇V, clearly indicating theformation of a shear-induced lamellar phase in the corientation (Figures 11 and 3b). This Bragg peak signalis clear evidence of a shear-induced sponge to lamellartransformation. It continues to increase in region II andeventually saturates at γ ∼2000 s-1, corresponding to thedisappearance of scattering in the Q range of the spongepore correlation peak in the radial scattering configurationmeasurementssindicating that the sample has beentotally transformed. Scattering data for this Braggsaturation region are shown for γ ∼ 2700 s-1. In this regionwe also note the emergence of scattering at lower Q valuesvisible as a ring around the beam stop. In the radialgeometry measurements, we also see an increase inscattering at low Q at this shear rate, but only in thevorticity (Z) direction.
After a gradual increase and the stability of thesaturation region, the transition to the quasi-Newtonianregion III is marked by a falloff of the shear-inducedlamellar Bragg scattered intensity. In the tangentialconfiguration scattering pattern for γ∼3700 s-1, the Braggsignal has fallen to about one-half from its strength at γ∼ 2700 s-1, and it entirely disappears by γ ∼ 5000 s-1. Thefinal scattering patterns, represented here by the datafor γ ∼ 9600 s-1, are dominated by the increase of the lowQ scattering first visible in the γ ∼ 2700 s-1 data: a ring
near the beam stop in the tangential data and similarstrong scattering in the vorticity (Z) direction in the radialdata.
To quantify the structural response of this system toshear, we define IZ, IV, and I∇V, the corrected SANSintensities averaged over sectors within (10° of respec-tively the Z, V, and ∇V directions. The results of thisanalysis are presented in Figure 11. Scattering intensitiesalong the flow direction, IV, and the velocity gradientdirection, I∇V, are obtained from radial and tangentialmeasurements, respectively. Scattering along the vorticitydirection, IZ, is obtained from both radial and tangentialgeometries. Note that, as should be the case, the IZscattering values (open symbols) obtained from bothgeometries are the same at all shear rates. This demon-strates the consistency of the method used to absolutelynormalize the data outlined in the Experimental Section.43
In the isotropic scattering from the sponge at rest, thesector intensities IZ(Q), IV(Q), and I∇V(Q) are of courseidentical and all show the characteristic broad correlationpeak related to the sponge pore size. For this sample thecorrelation peak scattering occurs at Q3 ∼ 0.008 Å-1,corresponding to a pore size of ∼800 Å. As the shearincreases, the correlation peak diminishes in intensityand eventually disappears in both Z and V directions,while becoming more pronounced and shifting towardhigher wave vectors in the ∇V direction to finally form a(quasi-Bragg) peak in I∇V at QL ∼ 0.010 Å-1, correspondingto a smectic periodicity of 630 Å. This feature is clearlyvisible in these data for shear rates between 850 and 2700s-1. As might be expected, the ratio between the spongephase correlation length and the induced lamellar peri-odicity is about 1.25, the same ratio as obtained in staticSANS measurements at thermodynamic equilibriumbetween sponge and lamellar phases at the same mem-brane volume fraction.26,63 The low Q scattering in regionIII is visible in strong and equal signals in IZ and I∇V forthe γ ∼ 9600 s-1 data. The intensity of these signals is stillincreasing rapidly with decreasing scattering vector atthe low Q limit of these scattering measurements (∼0.004Å-1), indicating the formation of structures rather largerthan the sponge pore size or shear-induced lamellarperiodicity.
Scaling Behavior of the Sweetened Sponge Re-sponse to Applied Shear. Since the dextrose in thissystem is taken up exclusively by the brine solvent, wecan readily and independently vary the CPCl/hexanolmembrane volume fraction and the dextrose/brine solventviscosity to investigate not just individual sample re-sponses as previously reported in the literature32,34,38 butthe full scaling behavior of the shear response in thesesystems with respect to these parameters. Figure 12ashows the viscosity versus shear behavior of the two dilutesponge in light brine sample series corresponding to theheavy brine samples for which equilibrium scattering datascaling was presented in Figure 6: (i) constant φ ) 0.05,with varying ψ ) 0, 0.2, 0.3, and 0.4, for which thecorresponding solvent viscosities ηs are 1.0, 2.8, 5.6, and13.4 cP; and (ii) constant high dextrose volume fractionψ ) 0.4 (ηs ) 13.4 cP) and varying φ ) 0.03, 0.05, 0.07,and 0.10. The low shear rate viscosity measured for theseseven samples varies by an order of magnitude, while theonset of shear thinning varies by nearly 2 orders ormagnitude. We can see that all the curves show the samegeneral response but at different shear rate values. Thetwo series clearly and immediately demonstrate the
(61) Diat, O. Thesis no. 833, University Bordeaux I, France, 1992.(62) Plano, R. J.; Safinya, C. R.; Sirota, E. B.; Wenzel, L. J. Rev. Sci.
Instrum. 1993, 64, 1309.(63) Porte, G.; Marignan, J.; Bassereau, P.; May, R. J. Phys. (Paris)
1988, 49, 511.
Scaling of Response of L3 Sponge Phases Langmuir, Vol. 19, No. 26, 2003 10789

expected trends: that required shear rates for the shear-thinning behavior are lowered as membrane volumefractions decrease or sample viscosities increase.
We now compare the rheological behavior in this systemwith the expected scaling behavior. The left-hand scale inFigure 12b corresponds to the normalized sample viscosityη/η0, where η0 is the zero shear viscosity (obtained byextrapolation) versus a rescaled shear rate γηs/φ3sessentially a scaled Deborah number. (The values of thescaling factor ηs/φ3 for these series, which vary by nearly2 orders of magnitude, are listed in Table 2.) As we cansee, all the curves are now closely superimposed on arheological “master” curve with, overall, the same threewell-defined regions of the shear response described above.All three regimes are only clearly observed for the mostdilute samples with high solvent viscosity because of themechanical limitations of the rheometer. Vertical dottedlines indicate nominal boundaries of the shear regions,the region I/II boundary at γηs/φ3 ) 1.4 × 10⁷ s-1 cP, andthat for II/III at γηs/φ3 ) 3.5 × 10⁸ s-1 cP. Also plotted onthis graph (right-hand scale) are correspondingly rescaledshear stress curves τ(ηs/η0)/φ3. These too show clear mastercurve behavior. From these master curves we see thatviscosity and stresses again vary smoothly over the shear-thinning region II, indicating that the samples are notbiphasic in this region and that the transition is not first-order.58,59
To quantify the scaling dependence of the “critical shearrate” on these parameters in Figure 13, we plot thecrossover shear rate (γI/II) between regime I and regimeII, quantified as the point at which shear thinning hasreduced the sample viscosity to 95% of its zero shear limitin a log-log representation against φ/ηs. For a series of
membrane volume fractions at ψ ) 0.4 (ηs ) 13.4 cP), wefind excellent agreement with the predicted φ3 behavior,obtaining an exponent of 2.98 ( 0.15. The result for theconstant membrane volume fraction φ ) 0.05 serieswith varying solvent viscosity is nearly as good, withthe expected 1/ηs dependence being unity to within theerror limits of the experimentally determined exponentof 0.92 ( 0.08.
The structural response of all seven samples in the heavybrine sample series [(i) constant φ ) 0.05, with varyingψ ) 0, 0.2, 0.3, and 0.4, for which the corresponding solventviscosities ηs are 1.2, 3.3, 6.7, and 16.2 cP; and (ii) constanthigh dextrose volume fraction ψ ) 0.4 (ηs ) 16.2 cP) andvarying φ ) 0.03, 0.05, 0.07, and 0.10] may be quantifiedin terms of the variation of the anisotropy parameters inthe scattering patterns. For the (Z, V) and (Z, ∇V) planescattering data collected in the radial and tangentialconfigurations, respectively (Figure 3a), the correspondinganisotropy parameters are conventionally defined33 as theintensity contrast between the perpendicular directionsfor the two geometries as
Figure 12. (a) Variation of the viscosity η versus shear γ for the light brine sponge sample series: at constant membranevolume fraction φ ) 0.05 and varying dextrose concentration (and solvent viscosity ηs) ψ ) 0, 0.2, 0.3, and 0.4; and at constanthigh dextrose concentration ψ ) 0.4 and varying membrane volume fraction φ ) 0.03, 0.05, 0.07, and 0.10. (b) The same datapresented as the viscosity ratio η/η0 (left-hand scale), where η0 is the extrapolated zero shear viscosity, versus the rescaled shearrate γηs/φ3, showing master curve behavior. The right-hand scale shows the corresponding master curve behavior of the shear stressrescaled as τ(ηs/η0)/φ3. Dotted vertical lines show the nominal boundaries of the three shear response regions discussed in the text.
Table 2. Sample Parameters and Corresponding ShearResponse Scaling Factors for Rheological Series inLight Brine and Corresponding Scattering Series in
Heavy Brine
φ ψηs(H2O)
(cP)ηs(H2O)/φ3
(cP)ηs(D2O)
(cP)ηs(D2O)/φ3
(cP)
0.03 0.4 13.4 5.0 × 10⁵ 16.2 6.0 × 10⁵
0.05 0.4 13.4 1.1 × 10⁵ 16.2 1.3 × 10⁵
0.05 0.3 5.5 4.4 × 10⁴ 6.7 5.4 × 10⁴
0.07 0.4 13.4 3.9 × 10⁴ 16.2 4.7 × 10⁴
0.05 0.2 2.7 2.2 × 10⁴ 3.3 2.2 × 10⁴
0.10 0.4 13.4 1.3 × 10⁴ 16.2 1.6 × 10⁴
0.05 0 1.0 8.0 × 10³ 1.2 9.6 × 10³
Figure 13. Scaling exponents of the shear response in thesweetened sponge systems determined from variation of theposition of the region I/II boundary (defined as the point wherethe viscosity has fallen to 95% of its zero shear viscosity η0)versus φ/ηs for two sponge phase sample series: (2) constantdextrose volume fraction and solvent viscosity ψ ) 0.4/ηs )13.4 cP for varying membrane volume fractions φ; and (O)constant membrane volume fraction φ ) 0.05 for varyingdextrose concentrations and viscosities ηs ) 1.0-13.4 cP.
ARAD ) |IV - IZ
IV + IZ| and ATAN ) |I∇V - IZ
I∇V + IZ| (4)
10790 Langmuir, Vol. 19, No. 26, 2003 Porcar et al.
To track the sample anisotropy at length scales charac-teristic of the sponge and lamellar phases, these param-eters are evaluated in the region of the sponge correlationpeak Q3 ∼ 2π/ê. Figure 14 shows the variation of theseparameters for a range of membrane volume fractions atdifferent dextrose content ψ against the same rescalingof the shear rate γηs/φ3 used for the light water rheologicalseries measurements. Again, for the full sample series wesee that the shear response follows a master curvedependence on γηs/φ3, as was observed for the rheologicalmeasurements. (The values of the scaling factor ηs/φ3 forthese series are listed in Table 2.) The dotted lineboundaries between the regions are drawn at the samevalues of γηs/φ3 as they were for the rheological measure-ments shown in Figure 12 and indicate that the variationof these microscopic anisotropies closely corresponds tothe macroscopic rheological observations. In the zero andlow shear region I, both ARAD and ATAN are zero, indicatingan isotropic structure. In region II, both anisotropyparameters begin to increase. For ATAN this is due to theshear-induced formation of lamellar phases with mem-brane normals oriented parallel to the velocity gradient(c orientation), giving rise to strong Bragg scattering inthe ∇V direction. In this region ARAD also increases, butmore slowlysdespite an overall loss of scattering intensityin the radial scattering geometry scattering patterns. Thisis due to scattering in the vorticity (Z) direction decreasingmore slowly than the scattering along the flow (V) direction(see Figure 11).
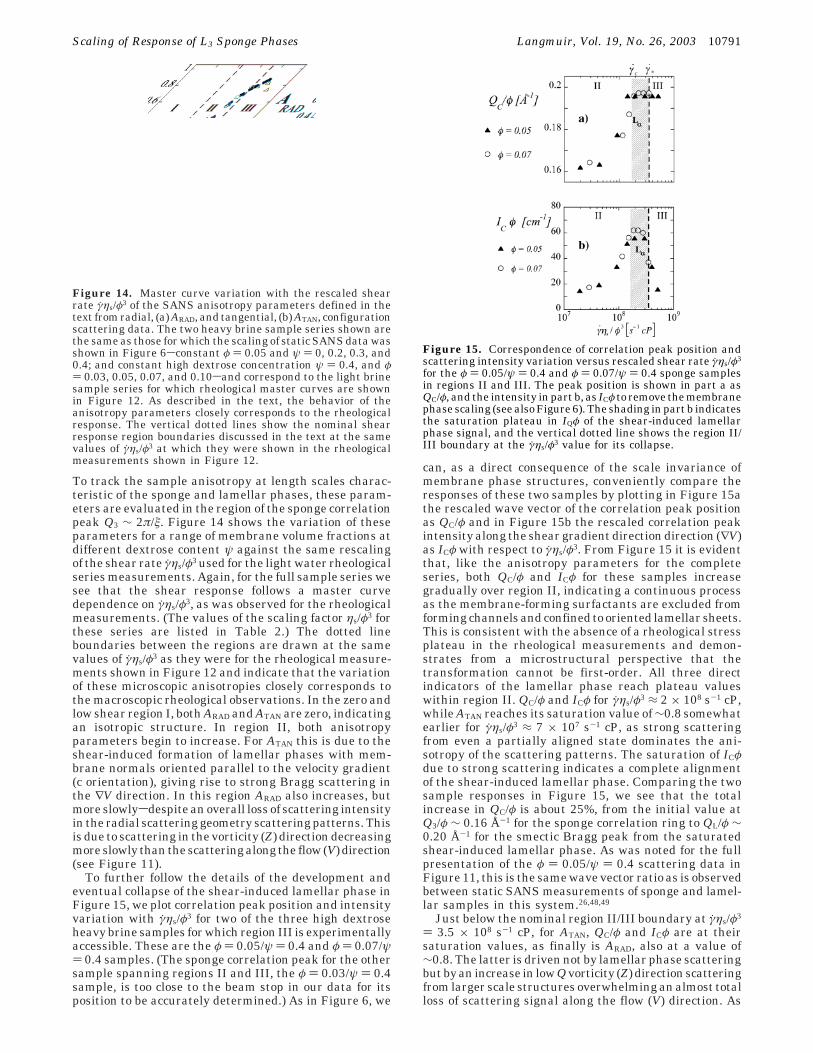
To further follow the details of the development andeventual collapse of the shear-induced lamellar phase inFigure 15, we plot correlation peak position and intensityvariation with γηs/φ3 for two of the three high dextroseheavy brine samples for which region III is experimentallyaccessible. These are the φ ) 0.05/ψ ) 0.4 and φ ) 0.07/ψ) 0.4 samples. (The sponge correlation peak for the othersample spanning regions II and III, the φ ) 0.03/ψ ) 0.4sample, is too close to the beam stop in our data for itsposition to be accurately determined.) As in Figure 6, we
can, as a direct consequence of the scale invariance ofmembrane phase structures, conveniently compare theresponses of these two samples by plotting in Figure 15athe rescaled wave vector of the correlation peak positionas QC/φ and in Figure 15b the rescaled correlation peakintensity along the shear gradient direction direction (∇V)as ICφ with respect to γηs/φ3. From Figure 15 it is evidentthat, like the anisotropy parameters for the completeseries, both QC/φ and ICφ for these samples increasegradually over region II, indicating a continuous processas the membrane-forming surfactants are excluded fromforming channels and confined to oriented lamellar sheets.This is consistent with the absence of a rheological stressplateau in the rheological measurements and demon-strates from a microstructural perspective that thetransformation cannot be first-order. All three directindicators of the lamellar phase reach plateau valueswithin region II. QC/φ and ICφ for γηs/φ3 ≈ 2 × 10⁸ s-1 cP,while ATAN reaches its saturation value of ∼0.8 somewhatearlier for γηs/φ3 ≈ 7 × 10⁷ s-1 cP, as strong scatteringfrom even a partially aligned state dominates the ani-sotropy of the scattering patterns. The saturation of ICφdue to strong scattering indicates a complete alignmentof the shear-induced lamellar phase. Comparing the twosample responses in Figure 15, we see that the totalincrease in QC/φ is about 25%, from the initial value atQ3/φ ∼ 0.16 Å-1 for the sponge correlation ring to QL/φ ∼0.20 Å-1 for the smectic Bragg peak from the saturatedshear-induced lamellar phase. As was noted for the fullpresentation of the φ ) 0.05/ψ ) 0.4 scattering data inFigure 11, this is the same wave vector ratio as is observedbetween static SANS measurements of sponge and lamel-lar samples in this system.26,48,49
Just below the nominal region II/III boundary at γηs/φ3
) 3.5 × 10⁸ s-1 cP, for ATAN, QC/φ and ICφ are at theirsaturation values, as finally is ARAD, also at a value of∼0.8. The latter is driven not by lamellar phase scatteringbut by an increase in low Q vorticity (Z) direction scatteringfrom larger scale structures overwhelming an almost totalloss of scattering signal along the flow (V) direction. As
Figure 14. Master curve variation with the rescaled shearrate γηs/φ3 of the SANS anisotropy parameters defined in thetext from radial, (a) ARAD, and tangential, (b) ATAN, configurationscattering data. The two heavy brine sample series shown arethe same as those for which the scaling of static SANS data wasshown in Figure 6sconstant φ ) 0.05 and ψ ) 0, 0.2, 0.3, and0.4; and constant high dextrose concentration ψ ) 0.4, and φ) 0.03, 0.05, 0.07, and 0.10sand correspond to the light brinesample series for which rheological master curves are shownin Figure 12. As described in the text, the behavior of theanisotropy parameters closely corresponds to the rheologicalresponse. The vertical dotted lines show the nominal shearresponse region boundaries discussed in the text at the samevalues of γηs/φ3 at which they were shown in the rheologicalmeasurements shown in Figure 12.
Figure 15. Correspondence of correlation peak position andscattering intensity variation versus rescaled shear rate γηs/φ3
for the φ ) 0.05/ψ ) 0.4 and φ ) 0.07/ψ ) 0.4 sponge samplesin regions II and III. The peak position is shown in part a asQC/φ, and the intensity in part b, as ICφ to remove the membranephase scaling (see also Figure 6). The shading in part b indicatesthe saturation plateau in IQφ of the shear-induced lamellarphase signal, and the vertical dotted line shows the region II/III boundary at the γηs/φ3 value for its collapse.
Scaling of Response of L3 Sponge Phases Langmuir, Vol. 19, No. 26, 2003 10791

the region III boundary is passed, two of the lamellarphase ordering indicators, ICφ and ATAN, fall dramatically.Their rapid decline signals a transformation of the shear-induced lamellar phase. ATAN falls to a value of ∼0.1 asstrong isotropic scattering emerges for the radial config-uration data at low Q, while, despite the noticeableincrease in the vorticity (Z) direction at low Q, ARAD cannotincrease significantly above the saturation value of about∼0.8 it has already attained. Note, however, in contrastto the case for the initial shear-induced alignment, thepeak position does not change immediately as the intensityfalls, as the rescaled peak position QC/φ stays near thesmectic Bragg value∼0.2 Å-1, somewhat beyond the regionII/III boundary for the φ ) 0.05/ψ ) 0.4 and φ ) 0.07/ψ) 0.4 samples, indicating that some fraction of the lamellarphase persists through this process. This is most clearlyseen in the tangential configuration scattering pattern inFigure 11 for the φ ) 0.05/ψ ) 0.4 sample data shear ratejust beyond collapse, γ ) 3700 s-1 (γηs/φ3 ) 4.03 × 10⁸ s-1
cP)sas collapse proceeds (the Bragg intensity has fallenby 50% from the saturation value), the lamellar peakscattering coexists with the strong scattering at small Qfrom whatever structure is now being formed. It seemsthat, unlike the shear-induced lamellar transformationitself, the shear-induced collapse is a quasi-first-orderprocess.
DiscussionScaling of the Shear Response of the Sweetened
Sponge Phases. Altogether these results present clearevidence that a sponge to lamellar transformation can beinduced by shear flow in these sponge systems. For bothrheological and SANS data, the master curves presentedabove against the rescaled shear rate γηs/φ3 indicate goodagreement with the expected scaling behavior of thesponge phase response to shear. As well as can bedetermined from the limited number of samples for whichour region III is experimentally accessible, this scalingcontinues to the final collapse of the shear-inducedlamellar phase.
One question which is occasionally raised with respectto membrane phase fluid dynamics is whether the solventviscosity ηs or the sample viscosity, that is, η0, is therelevant scale viscosity to employ in treatments of shearflow responses in membrane systems. It has been usualto employ the solvent viscosity to estimate viscousdissipation,64-66 the assumption being the motion of themore fluid solvent as modified by geometric constraintspresented by the membrane structure may be treated ina manner analogous to flow in porous media. However,Bruinsma and Rabin67 used the sample viscosity in theirtheory of the dynamics of lamellar phase shear response,as did Zilman and Granek68 to explain lamellar tospherulite transitions in surfactant systems. More re-cently, Al kahwaji and Kellay69 found that the onset ofturbidity and increased small angle light scattering infreely suspended thin films under shear that theyinterpreted as a signature of lamellar collapse scaledinversely with the lamellar phase viscosity rather thanthe solvent viscosities in their AOT and C12E5 membranelamellar phases.
In the treatment of the low shear rheology of these dilutesystems above, we found that the simple constraint to
solvent flow presented by the membrane geometry of thesponge labyrinth dominates the sample viscosity at lowshear rates, that is, η0 ≈ Αηs, with a relatively smallmembrane volume fraction dependent contribution. Whilethis essentially embodies the assumption which hasmotivated the choice of the solvent viscosity scaling, italso limits the usefulness of these systems in addressingthis question. Thus, we found that nearly equivalentmaster curve rescaling to those shown for the rheology inFigure 12b and the scattering data in Figures 14 and 15with respect to the solvent viscosity ηs can in fact beproduced with respect to the zero shear rate viscosity η0,that is, versus a rescaled shear rate parameter γη0/φ3.The normalization of the shear stress corresponding tothe viscosity normalization of η/η0 in the equivalent ofFigure 12b is then τ/φ3, rather than τ(ηs/η0)/φ3. Using thesame data for the γI/II as those of Figure 13 plotted againstφ/η0,weobtainedasimilarvalue for theexpectedcoefficientof viscosity of 0.95 ( 0.08, although the coefficient for φwas 3.29 ( 0.15, nearly two standard deviations beyondthe expected value. Examination of Figure 7 will showthat this scaling equivalence is simply due to the fact thatalthough the values of η0 and ηs vary by more than anorder of magnitude for the two series presented in Figure13, φ ) 0.05/ψ ) 0-0.04 and φ ) 0.03-0.10/ψ ) 0.4,which cover the full range of samples with critical shearrates γI/II accessible with our rheometer, their ratio η0/ηsvaries by less than 20%. The variation is even less betweenthose samples with comparable scaling factors and thussignificant data overlap.
Nature of the Shear-Induced Lamellar PhaseTransformation. Despite the good agreement with thescaling predictions, two important aspects of our experi-mental observations depart both from the theoreticalpicture presented by Cates and Milner and from resultsreported for isotropic diblock systems to which their theoryhas also been applied.60 First, they predicted an aorientation of the shear-induced lamellar phase, withmembrane normals in the vorticity direction, rather thanthe c orientation, with membrane normals along the flowgradient direction, we observed in our system. Yamamotaand Tanaka32 also observed c orientations for their C12E5sponges under oscillatory Poiseuille shear. In the case ofthis aspect of the sponge response, we note that a spongemembrane does not establish a connection between regionsof solvent that it separates, which are able to flow freelyon either side. In the isotropic diblock phase investigatedby Koppi et al.,29 which did show the a orientation, theinterfacial region represents a physical connection be-tween regions rich in the two polymer species. This mighttend to favor the a orientation lamellar structure, sinceadjacent layers are moving together in the flow field.
Second, Cates and Milner suggested that under shearthe isotropic phase should separate into coexisting iso-tropic and lamellar phases over some intermediate flowregime before a uniform lamellar phase is formed at highshear. We saw no evidence of phase coexistence, asignature of a first-order transition, in these measure-ments. The absence of a stress plateau in the correspondingshear-thinning rheological regime together with theabsence of hysteresis and the gradual increase of thealigned correlation peak intensity (Figures 11 and 15a)and its continuously shifting position indicate a progres-sive transformation from sponge to lamellar order asmembrane-forming material is excluded from channelsand confined to more oriented membranessfinally formingstacked sheets. Since a c oriented shear-induced lamellarphase does not contribute to the scattering in the radialgeometry, coexistence of sponge and shear-induced lamel-
(64) Martin, P. C.; Parodi, O.; Pershan, P. S. Phys. Rev. A 1972, 6,2401.
(65) Brochard, F.; de Gennes, P. G. Pramana, Suppl. 1975, 1, 1.(66) Nallet, F.; Roux, D.; Prost, J. J. Phys. (Paris) 1989, 50, 3147.(67) Bruinsma, R.; Rabin, Y. Phys. Rev. A 1992, 45, 994.(68) Zilman, A. G.; Granek, R. Eur. Phys. J. B 1999, 11, 593.(69) Al kahwaji, A.; Kellay, H. Phys. Rev. Lett. 2000, 84, 3073.
10792 Langmuir, Vol. 19, No. 26, 2003 Porcar et al.
lar phases in our Couette cell would simply present anisotropic sponge scattering pattern in the radial geometry,simultaneously with lamellar Bragg scattering against aweaker isotropic background in the tangential geometry.Further, the completely reversible transformations weobserved showed no appreciable hysteresis. The timeresolution limit of the SANS data collection schemeemployed in these measurements was about 1 min. Withinthis time after the cessation of shear, Bragg scatteringfrom shear-induced lamellar phases gave way completelyto the isotropic scattering characteristic of the spongestructure. On similar time scales, we observed nohistory effects upon repeating rheological measurementsof samples previously sheared to the shear-thinningregime II.
In the initial Newtonian region (I), there is no discerniblechange in the isotropic scattering ring from the spongephase (hence, no structural changes), as the shear rate iswell below the membrane response frequency, τ3
-1 (De ,1), allowing ample time for stress relaxation in the systemby simple diffusion. In the shear-thinning region (II), asthe shear rate approaches this frequency (γ f ∼τ3
-1, Def 1), the isotropic structure is then progressively stretchedin the flow direction, as total dissipation of the shear-induced stresses can no longer be achieved. The continuousnature of the transformation may to some extent bereconciled with a quasi-thermodynamic picture by con-sidering that in the continuously fluctuating spongesystem the opportunity for sponge handle creation (ordestruction) between membranes will be offered onsomething like the frequency. The density of connectionsor handles in the gradient direction (∇V) will decrease ifthe energy cost of the stretched membrane passages inthis direction increases. As this cost approaches andexceeds that of the lamellar state configuration foradjacent membranes, this would lead to the progressivedevelopment of a smectic order in the observed c orienta-tion, as passages are less likely to be created (or recreated)in this direction with membranes moving past each otherat ever increasing speeds, ∼γê. In the a orientationadjacent membranes are moving together in the flow field,so no such relative velocity effects will hamper thereformation of passages in the vorticity direction. Theshear-thinning response we observe is consistent with themicroscopic structural change to this increasingly aniso-tropic sheared sponge structure. Membranes aligned withtheir normals aligned along the flow gradient directioncan slide past each other easily in the Couette flow field.At some point, the thermodynamic rate of disruption ofpassages connecting membrane sheets along the flowgradient direction will exceed the limit at which diffusivemembrane motions allow them to be re-established, sothe fully aligned shear-induced lamellar phase character-ized by the saturation of the scattered intensity I∇V at thefinal peak position QL is formed.
Collapse of the Shear-Induced Lamellar Phase.The fully aligned shear-induced phase is maintained overonly a narrow range of the higher shear rates in regionII (shaded region in Figure 15b). At the highest shears inregion III, the shear-induced lamellar phase becomesunstable. Although the position of the Bragg peak doesnot shift, a sharp drop in I∇V at the onset of region IIIsignals the disappearance of this shear-induced lamellarphase. Rheologically the solution becomes “quasi”-New-tonian at a roughly constant viscosity, rather lower thanthat of the low shear region I. Structurally the shear-induced lamellar phase gives way to a structure withcorrelations on a much longer length scale with strongscattering at low Q (close to the beam stop in all our
measurements). The coexistence of the shear-inducedBragg scattering signal with this lowQ scattering suggeststhat the transition may be quasi-first-order. The isotropyof the tangential scattering and the strong anisotropy ofthe radial pattern (see Figure 11, γ ) 9600 s-1) clearlysuggest that the large scale organization of material inregion III has cylindrical symmetry about the flow axis,V. However, the continuing rise in intensity to the lowestQ values attained here does not reveal any length scalesfor the shear-induced structures involved. Unfortunatelyour current data on a limited number of samples do notcover this region in sufficient detail or over a wide enoughrange of length scales to allow us to fully determine thenature of the transition and of the final structures beingformed.
However, the data presented here do allow us to ruleout two suggested explanations of these high shear rateobservations fairly easily. The first is hydrodynamicsthat we are simply observing turbulent breakup of thelamellar phase. For the outer cylinder rotation used forour Couette shear cell, the turbulence regime is reachedat a critical Reynolds number above about 1500. In thepresent case, due to their high viscosities, this would notbe expected for any of our ψ ) 0.4 samples at shear ratesbelow ∼50 000 s-1 (well beyond the range presented hereand the operational limits of our shear cell43). Also,turbulent flow would result in an increase in the apparentviscosity, which we do not observe, and would be expectedto lead to fully isotropic scattering, whereas at the highestshear rates our radial scattering patterns remain stronglyanisotropic (see Figure 11, γ ) 9600 s-1). A secondpossibility that the final large scale structures are thespherulites or multilamellar vesicles11-14,18 often encoun-tered when lamellar phases are subjected to high shearrates is ruled out by the absence of their characteristicBragg peaks in either radial or tangential configurations.
While the word “collapse” is apposite to describe therapid disappearance of the shear-induced lamellar phaseat the onset of region III, it is also suggested by thefollowing interpretationof thatbehavior.Whenundulationforces stabilize a lamellar structure, it has been theoreti-cally predicted that the phase should collapse when theintermembrane resistance to compression vanishes, asshearing flow suppresses fluctuations. This mechanismis a logical extension of the sponge-to-lamellar transitionitself, which occurs by suppression of membrane fluctua-tions in the ∇V direction in the isotropic phase. Lamellarcollapse was predicted by Ramaswamy70 for shear rateslarger than a critical value γ* ∼ (kBT)3/κ2ηsd3, where κ isthe membrane bending modulus and d is the separationof adjacent bilayers. For CPCl/hexanol membranes, κ hasbeen experimentally determined26,49,71 to be≈1kBT at roomtemperature, so we have γ* ∼ kBT/ηsd3. This critical shearrate follows the same scaling dependence as γc, but witha different characteristic distance. Since d ) 2π/QL andassuming a rough equality of the respective prefactors,we might expect γ*/γc ∼ (ê/d)3 ) (QL/Q3)3. For our observedscattering peaks, (QL/Q3) ≈ 1.25, so γ*/γc ∼ 2. This is closeto the observed width of the stable region of the saturatedshear-induced lamellar phase (the shaded ICφ plateauregion in Figure 15b) before it collapses at higher shear.72
With respect to the narrowness of this window of stability,we note that Bruinsma and Rabin67 speculated that
(70) Ramaswamy, S. Phys. Rev. Lett. 1992, 69, 112. Note that theactual expression given in this reference is typographically incorrect.Ramaswamy, S. (private communication).
(71) Bouglet, G.; Ligoure, C.; Bellocq, A. M.; Dufourc, E.; Mosser, G.Phys. Rev. E 1998, 57, 834.
Scaling of Response of L3 Sponge Phases Langmuir, Vol. 19, No. 26, 2003 10793
lamellar collapse might preclude the shear-induced spongeto lamellar transformation altogether.
ConclusionIn this work we have shown that dextrose dissolved in
the brine solvent of a CPCl/hexanol/brine system has littleeffect on the equilibrium phase behavior of this system.More particularly, the dextrose is excluded from thestructures formed by CPCl/hexanol, and our SANSmeasurements indicate that there is no significant effecton the membrane or equilibrium sponge phase morphologyin this system due to this addition. However, whilestructural effects are minimal, order of magnitude changesmay readily be made to the solvent viscosity and conse-quently the membrane dynamics. This strategy of addingan inert thickener to the solvent, which is simply excludedfrom the self-assembled structural components, may beof general utility in studies of the dynamics in this classof complex fluids. In the present case, it has allowed usto perform parallel SANS and rheological measurementsof the shear response of the “sweetened” (CPCl)/hexanol/brine/dextrose sponges to unambiguously demonstratethat shearing these dilute sponge phases in a Couette cellinduces a lamellar phase transformation in this system,as they shear thin. Further, the magnitude of the criticalshear rates we observe for this transformation and moreparticularly their scaling with respect to membranevolume fraction and solvent viscosity are as expected fromsimple dimensional and fluid scaling arguments. Sincethe sponge systems studied are extremely sensitive toevaporation of the hexanol cosurfactant, our scatteringexperiments relied on the use of a newly designed Couettecell vapor barrier to maintain the sample within a smallsealed volume. The overall consistency of the SANSmeasurements using this cell clearly suggests that earlierX-ray scattering effects interpreted as being due to a shear-induced first-order sponge to lamellar phase transition inthis system at rather low shear for CPCl/hexanol/brinesponge samples without dextrose are simply compositiondriven, first-order transitions due to evaporation ratherthan the applied shear rate.
However, important details of the response we observesclear c rather than a orientation of the shear-inducedlamellar phase and complete suppression of the first-ordernature of the equilibrium phase transition in this system(with no indication of first-order character observable ineither rheological or microstructural measurements)sarenot as predicted by Cates and Milner.28 So, while their
theory has been confirmed for some isotropic copolymerphases,29 these observations and the varying details ofshear responses from other topologically similar systemswith differing relaxation paths60 suggest that in its presentform it cannot be applied straightforwardly to the classas a whole.
The significant slowing of the membrane dynamicsachievable by the introduction of dextrose in the systemallowed us to observe what is apparently the collapse ofthe shear-induced lamellar phase. To our knowledge, thisis the first observation of collapse of a bulk lamellarphase.73 The window of stability for the shear-inducedphase before collapse occurs is in reasonable agreementwith theoretical predictions of the relative scaling of thesetwo processes for this system. That this window is openeven so narrowly may be fortuitous; collapse wouldpreclude lamellar saturation altogether for only relativelysmall changes in the bending modulus of the membranes.In other systems it is possible that the clear separationof the regimes we observe here may not be achieved. Whilescattering measurements from the three samples for whichthe collapse range of the rescaled shear parameter γηs/φ3
∼ 3.5 × 10⁸ s-1 cP is accessible certainly suggest that thistransition may be first-order, further detailed SANS andrheological measurements in this range will be necessaryto confirm this and the exact nature of the large scalestructures formed in this system at these shear rates.
Acknowledgment. Our thanks to J.B. Hayter, whoinitiated our work on the ORNL neutron scatteringCouette shear cell; D. Glandon, B. Taylor, and R. Maplesfor their work on its various incarnations; C. Tsouris ofORNL for the use of his rheometer; B. Gu of ORNL for theuse of his DLS instrument; J. P. Fluxench for the artworkof Figure 1; and G. Porte of the University of Montpellier,France, for fruitful discussions and helpful suggestions.Oak Ridge National Laboratory is managed by UT-BatelleLLC under Contract DE-AC05-00OR22725 for the U.S.Department of Energy. The NG3 SANS instrument atthe National Institute of Standards and Technology Centerfor Neutron Research is supported by the U.S. NationalScience Foundation under agreement DMR-9986442.Identification of equipment or materials does not implyrecommendation by NIST. P.D.B. acknowledges supportas a NIST employee from NSF Grant DMR-9423101during the early part of this study, and G.G.W. acknowl-edges that of the Australian Nuclear Science and Tech-nology Organization and the Australian Research Council.
LA034661W(72) Note that this theory too assumes lamellar phases in “a”orientation contrary to the “c” orientation we observe for the shear-induced phase. Nevertheless, the scaling laws involved will tend to bevalid, since they are derived from a limited number of phase charac-teristics and hydrodynamic motions.
(73) Note that ref 69 claims to observe a shear-induced lamellarcollapse on thin lamellar film.
10794 Langmuir, Vol. 19, No. 26, 2003 Porcar et al.