
CAVITATION INVESTIGATION OF HYDROFOILS FOR MARINE HYDROKINETIC TURBINES

3POLISH MARITIME RESEARCH, No 4/2006
INTRODUCTION
Model experiments with marine propellers are still an important element of the process of marine propeller design. A meaningful proportion of these experiments are devoted to cavitation phenomena themselves and to different consequences of cavitation. Marine propellers exhibit a variety of specificforms of cavitation, shown schematically in Fig.1. The main forms include sheet, bubble, vortex and cloud cavitation. All forms of cavitation are as a rule unsteady and during propeller blades motion they undergo a process of inception, develop-ment and desinence, either related to the unsteadiness of flowaround the propeller or resulting from the inherent unsteadiness of the cavitation phenomena themselves. They may lead to many negative consequences, such as pulsating pressure field,hydro-acoustic signals, erosion etc. It is important that predic-tions of full scale cavitation behaviour of a propeller, made on the basis of model experiments, are realistic and accurate. This requires detailed knowledge of specific scale effects related tocavitation phenomena.
Scale effects in cavitation experiments with marine propeller models
Jan A. SzantyrGdańsk University of Technology
ABSTRACT
The paper presents an overview of specific scale effects encountered in the cavitation experi-ments with marine propeller models. These scale effects result from unavoidable dissimilarity between model and full scale flow phenomena. They may influence first of all inceptionof different forms of cavitation, but they also are visible in development and desinence of cavitation on propeller blades. These scale effects may be divided into five main categories,which are described in detail. The influence of these five categories of scale effects on the
different aspects of cavitation performance of marine propellers is discussed.
Keywords: cavitation, marine propellers, model experiments, scale effect
With an exception of a few depressurized model basins, majority of model experiments with marine propellers are conducted in cavitation tunnels. As a rule these experiments are based on fulfilling two simple similarity criteria. The firstcriterion requires equality of model and full scale advance coefficients:
(1)
where :
This criterion ensures similarity of the basic kinematics of model and full scale flow around the propeller blades. How-ever, this does not imply full similarity of flow in model andfull scale, because Reynolds numbers in these two situations are markedly different. This leads to formation of different boundary layers in model and full scale. As a routine in the course of experiments it is only ensured that flow on the bladesof a propeller model is supercritical, selecting sufficiently highnumber of propeller model revolutions to fulfil the followingcondition :
(2)
where :
Full scale propeller Reynolds numbers are in the range ReS = = 107. In practice condition (2) does not always ensure fully Fig. 1. Different forms of cavitation encountered on marine propellers .
V – propeller advance velocityn – propeller number of revolutionsD – propeller diameterindex S – full scale (ship) valuesindex M – model values.
MM
MM
SS
SS Dn
VJ
DnV
J ===
c – blade section chord length at non-dimensional radius 0.75ν – kinematic viscosity coefficient of water.
5
M
MMMM 105
cDn75.0Re ·≥
=

4 POLISH MARITIME RESEARCH, No 4/2006
turbulent flow in model scale and regions of laminar flow maystill be present on model propeller blades, especially near the hub. In full scale the flow is always turbulent from the leadingedge. Other consequences of difference in model and full scale Reynolds numbers demonstrate themselves as differences in boundary layer separation or laminar/turbulent transition. These differences lead to the difference in open water characteristics, which require corrections [5] and they also have an influence oncavitation behaviour of the model and full scale propellers.
The second criterion requires equality of model and full scale cavitation number :
(3)
where :
pA – atmospheric pressure in full scaleρ – water densityg – acceleration of gravityh – immersion of the point where cavitation number is
definedpV – critical pressure of waterpTUN – tunnel pressure at the point where cavitation number
is definedVR – reference velocity, either equal V or equal nD
The second criterion is expected to ensure the similarity of inception, growth and desinence of different cavitation pheno-mena present on marine propeller blades. However, it is known for many years now that cavitation phenomena are far too complex to be scaled properly by a single simple parameter like the cavitation number. Fulfilling relation (3) leaves a numberof important scale effects due to the following reasons :
difference in static pressure distribution between the model and full scale propeller
difference in water quality – first of all in nuclei content difference in boundary layer phenomena difference in time and velocity scales difference in size between model and full scale propeller.
These effects and their consequences are discussed in detail in the following sections. It is demonstrated that these scale effects may seriously affect the accuracy of full scale prediction of marine propeller cavitation performance made on the basis of model experiments.
THE EFFECT OF THE STATIC PRESSURE DISTRIBUTION
The typical scale coefficients of marine propeller modelsare in the range λ = 20 – 30. Let us consider for example a ty-pical medium size propeller having the diameter DS = 6.0 [m] and its shaft centre submerged at 9.0 [m] below free surface. Its model may have the diameter DM = 0.25 [m]. It is obvious that criterion (3) may be fulfilled exactly only at one selecteddepth. Usually either shaft centre or blade tip in upper posi-tion are selected for this purpose. This situation is explained in Fig.2, where an exemplary distributions of model and full scale cavitation numbers along propeller blades are calculated assuming σS = σM at blade tip.
As may be seen in Fig.2 there are quite meaningful differen-ces in the distribution of cavitation numbers along the blades in vertical position, resulting from the different static pressure distribution in model and full scale. These differences may result in discrepancies between model and full scale cavitation
pictures on the blades in vertical positions and also in the time history of unsteady cavitation associated with blade motion in the non-uniform ship wake velocity field. In order to providean assessment of importance of this effect Fig.3 shows two
2RMM
VMTUNM2
RSS
VSSSAS
V21
pp
V21
pghp
−==
−+=
Fig. 3. Comparison of cavitation extent observed at : a) σM = σS (blade tip) and b) σM = σS (shaft centre).
Fig. 2. Distribution of cavitation numbers along the blades of full scale and model propellers .
9 m
6 m
0.25 m
FULL SCALE MODEL SCALE

5POLISH MARITIME RESEARCH, No 4/2006
photographs of cavitation extent on a model propeller blade in two conditions, namely with criterion (3) fulfilled at blade tipand at shaft centre. As may be seen in this figure, the differenceis quite substantial. The expected full scale cavitation extent at blade top position should be somewhere in between the two pictures shown in Fig.3. Of course as in most cases cavitation phenomena are concentrated near the blade tip, the picture in Fig.3a may be regarded as closer to full scale reality. However, if the sheet cavity extends along most of the blade leading edge or we are specifically interested in the hub vortex formation,these effects may be decisive in proper scaling of the results.
The influence of static pressure distribution on the unsteadycavitation associated with blade rotation may be elucidated by comparing the variation of blade tip cavitation number with blade rotation in model and full scale, as shown in Fig.4. It may be seen in this figure that the rate of change of the cavitation number withblade position angle is much higher in full scale than in model scale. This may lead to a smaller angular extent of the cavitation phenomena on the blade in full scale than in model scale.
Fig. 4. Variation of the tip cavitation number with blade position angle .
In order to demonstrate the importance of this effect, cavi-tation sketches for different blade positions taken at different, appropriately chosen cavitation numbers are shown in Fig.5. In this figure three blade positions are shown, namely 315 [deg],i.e. 45 [deg] before reaching top, 0 [deg] and 45 [deg] after pas-sing top. The upper row shows sketches at cavitation numbers corresponding to full scale at the respective blade positions, while the lower row shows sketches corresponding to model experiment with condition (3) fulfilled at blade tip in top position.These sketches should be of course treated only as a quasi-ste-ady approximation of the real processes, but still it gives some idea about possible differences in scaling to full scale.
The scale effect discussed in this section may also influenceother important cavitation characteristics of marine propellers, for example the propeller induced pressure pulsations, which are routinely measured in the cavitation tunnel and scaled for full scale. In this case setting condition (3) either at the blade tip or at the shaft centre leads to markedly different results which are shown in Tab.1. This table includes the amplitudes of the first three harmonics of pressure pulsations, given in[kPa] and starting with blade frequency. The pressure pulsations were measured in the cavitation tunnel and re-calculated into full scale values. The measurements refer to the point located immediately above propeller in the ship plane of symmetry. It may be seen that the alternative choice of setting condition (3) at blade tip or shaft centre produces almost 80 per cent difference, what correlates well with the pictures of cavitation in Fig.3. The true full scale prediction should be placed somewhere in between the two sets of values given in Tab.1, perhaps closer to the data for “blade tip” criterion.
Tab. 1. Pressure pulsations amplitudes in[kPa]
Harmonic no. σM = σS blade tip σM = σS shaft centre1 405 2352 155 943 122 67
3.200
2.870
3.200
2.870
270 0 90
2.597
[deg]
FULL SCALE
MODEL SCALE
θ = 315 [deg] θ = 0 [deg] θ = 45 [deg]Fig. 5. Variation of sheet cavity with angular blade position observed in model scale (lower row) and simulated for full scale (upper row) .
6 POLISH MARITIME RESEARCH, No 4/2006
THE EFFECT OF THE WATER QUALITY – NUCLEI CONTENT
From the point of view of cavitation the water quality in the experimental installation or at sea is described primarily by the dissolved air content, nuclei content and its previous history. In general there are meaningful differences in these parameters between the laboratory and full scale situations, which are the source of specific scale effects. These effects affect first of allthe inception of cavitation, but they also have some influence onfurther development and desinence of cavitation. The detailed mechanisms of these scale effects are described below.
The classical cavitation similarity criterion (3) is based on the assumption that the critical pressure pCR, i.e. pressure at which the liquid starts to rupture under tension and cavitation develops, is equal to the vapour pressure of the liquid pV . How-ever, it is known for quite a long time that the amount of tension that a liquid may withstand is substantial and it depends firstof all on the dissolved gas content, nuclei content and previous history of the liquid. All these three factors are strongly inter--related with each other. Consequently, pCR in most practical situations is not equal pV and the cavitation number for inception of cavitation should be written in the following form :
where :
Then the cavitation inception condition should take the following form :
- Cpmin = σI (5)
where : Cpmin is the non-dimensional minimum pressure coefficient on the tested object.
It would be very convenient if the value of pT could be related directly to the nuclei content of the water. However, due to the complicated physics of cavitation inception this is not possible. Some guidance concerning this relation may be obtained from a simple condition for the stability of a single spherical vapour bubble, which is developed from the well--known Rayleigh Plesset equation [1] :
(6)
where :
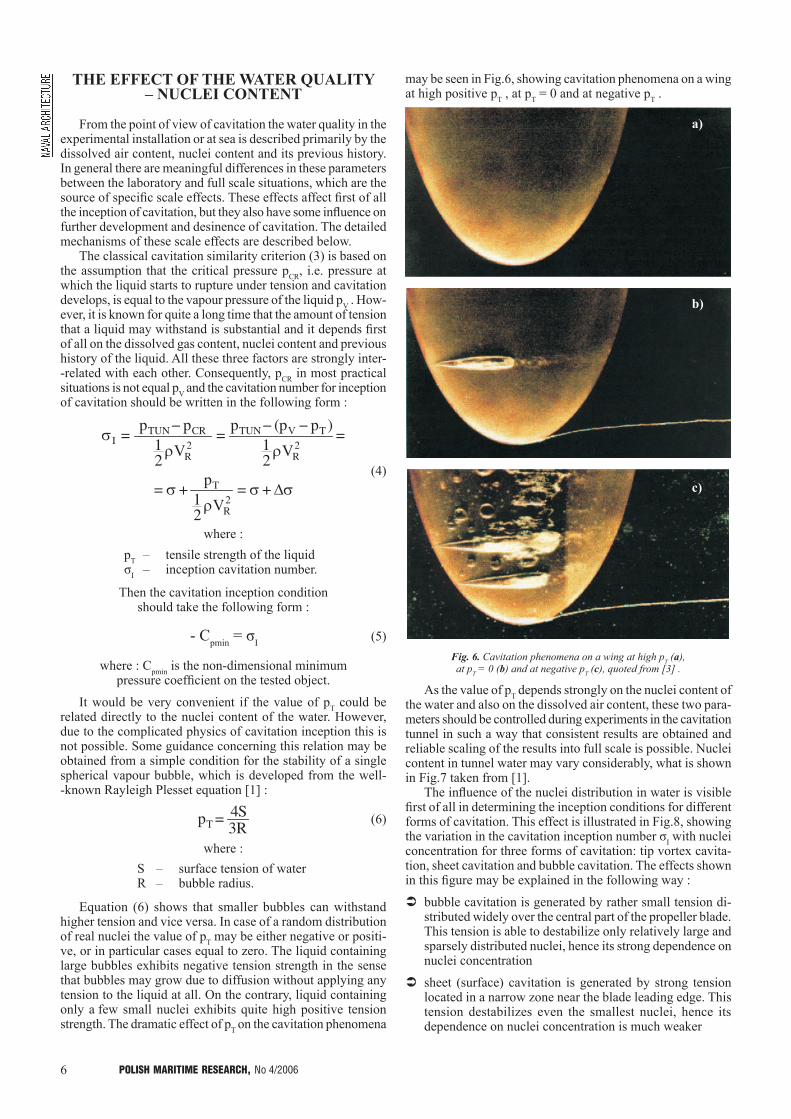
Equation (6) shows that smaller bubbles can withstand higher tension and vice versa. In case of a random distribution of real nuclei the value of pT may be either negative or positi-ve, or in particular cases equal to zero. The liquid containing large bubbles exhibits negative tension strength in the sense that bubbles may grow due to diffusion without applying any tension to the liquid at all. On the contrary, liquid containing only a few small nuclei exhibits quite high positive tension strength. The dramatic effect of pT on the cavitation phenomena
may be seen in Fig.6, showing cavitation phenomena on a wing at high positive pT , at pT = 0 and at negative pT .
Fig. 6. Cavitation phenomena on a wing at high pT (a), at pT = 0 (b) and at negative pT (c), quoted from [3] .
As the value of pT depends strongly on the nuclei content of the water and also on the dissolved air content, these two para-meters should be controlled during experiments in the cavitation tunnel in such a way that consistent results are obtained and reliable scaling of the results into full scale is possible. Nuclei content in tunnel water may vary considerably, what is shown in Fig.7 taken from [1].
The influence of the nuclei distribution in water is visiblefirst of all in determining the inception conditions for differentforms of cavitation. This effect is illustrated in Fig.8, showing the variation in the cavitation inception number σI with nuclei concentration for three forms of cavitation: tip vortex cavita-tion, sheet cavitation and bubble cavitation. The effects shown in this figure may be explained in the following way :
bubble cavitation is generated by rather small tension di-stributed widely over the central part of the propeller blade. This tension is able to destabilize only relatively large and sparsely distributed nuclei, hence its strong dependence on nuclei concentration
sheet (surface) cavitation is generated by strong tension located in a narrow zone near the blade leading edge. This tension destabilizes even the smallest nuclei, hence its dependence on nuclei concentration is much weaker
pT – tensile strength of the liquidσI – inception cavitation number.
+=
+=2R
T
V21p
( )
−−= =
−=
2R
TVTUN2R
CRTUNI
V21
ppp
V21
pp
(4)
S – surface tension of waterR – bubble radius.
R3S4pT=
a)
b)
c)

7POLISH MARITIME RESEARCH, No 4/2006
tip vortex cavitation is initiated in a small volume around the centre of the vortex. Its inception depends on the probability of nuclei of suitable size flowing into that volume. Thisprobability is the direct function of nuclei concentration, hence the dependence is strong.
Fig. 8. Influence of the nuclei concentration on the inception cavitationnumber for three forms of cavitation [2] .
The influence of dissolved air on the cavitation inceptioncondition may be qualitatively illustrated by Fig.9 showing experimentally obtained curves for inception of tip vortex, hub vortex, sheet (surface) and bubble cavitation for two concen-trations of dissolved air.
Fig. 9. Influence of dissolved air on cavitation inceptionon a marine propeller model [2] .
The above described scale effect in cavitation experiments with marine propeller models is especially important for naval and other special applications. In these applications ensuring a completely cavitation-free operation is essential because of acoustic emission. It requires very precise knowledge about scale effects important for scaling cavitation inception condi-tion. This implies, among other things, information about nuclei content in sea water. Measurements of such nuclei content were conducted for example by the French Navy [2]. Results of the assessment of sea water tensile strength at different depth are shown for example in Fig.10. These results may serve as certain guidance in scaling of the results of model experiments with marine propellers into full scale.
Fig. 10. Results of measurements of sea water tensile strength at different depths [2] .
In case of typical cargo ship propellers it is generally ac-cepted that routine guidelines for degassing water in cavitation tunnel and keeping the dissolved air content below about 30 per cent of saturation are sufficient to ensure the model cavitationtest results corresponding to full scale situation. However, it is still important to know the nature of the scale effect due to the water quality.
Fig. 7. Distribution of nuclei in water in three stages of degassing [1] .
[-]
0
1
2
3
Low Med. Med. HighHigh conc. Low conc.
Tension
Propeller withbubble cavitation
10
11
12
13
Tension
Propeller withblade surface cavitation
Tension
Propeller withtip vortex cavitation
5
10
15
20
[-]
[-]
Low Med. Med. HighHigh conc. Low conc.
Low Med. Med. HighHigh conc. Low conc.
Cavitation inception
Tip vortex cavitation
Hub cavitation
Blade surface cavitation
Bubble cavitation
02 = 5 ppm
02 = 3 ppm
5 ppm
3 ppm
VB
VA
5 ppm
3 ppm
Advance ratio, J [-]
[-]

8 POLISH MARITIME RESEARCH, No 4/2006
THE EFFECT OF THE BOUNDARY LAYER PHENOMENA
The boundary layer phenomena depend primarily on the value of the Reynolds number. This number is composed of the characteristic velocity, characteristic dimension and viscosity coefficient. However, in the case of cavitation scaling it maybe distinguished between Reynolds number effect (strictly linked to the boundary layer phenomena) and separate effects of the flow velocity and object size, which have a completelydifferent physical mechanism and are discussed separately in the following sections.
In turn the “pure” Reynolds number effect may be divi-ded into (1) a difference in quasi-steady pressure distribution between model scale and full scale propeller blades and (2) unsteady velocity/pressure fluctuations inside the boundarylayer. The first of these two effects is of lesser importance,but nonetheless it should be taken into account. The limited relative importance of this effect may be assessed on the basis of lift-related scale effect corrections for marine propellers as discussed for example in [7].
The second effect is much more important, particularly from the point of view of cavitation inception scaling. According to [6] pressure fluctuations inside the boundary layer on a bladesection profile may reach quite high amplitudes, comparablewith the mean value of pressure in the vicinity of the leading edge. These fluctuations may be added to the distribution ofmean pressure along the blade section profile.
Fig. 11. Pressure fluctuations inside the boundary layeron a blade section in model scale and full scale .
These fluctuations reach maximum amplitudes in the regionof laminar/turbulent transition. Due to the difference between model and full scale Reynolds numbers this region of transition is located differently on the model scale blade section profileand in corresponding full scale situation (cf. Fig.11). In full scale this region is located close to the leading edge, where the point of minimum of the mean pressure coefficient Cp is also located if the profile operates at an angle of attack. In modelscale this region is located further downstream, where the mean pressure on the suction side of the profile is already markedlyhigher. Consequently, at the value σA of the local cavitation number inception may take place in full scale, but not in model scale. Typical frequency of pressure/velocity oscillation in the transition zone is of order 1 [kHz], while the own oscillation frequency of cavitation nuclei between 20 and 50 microns (most frequently encountered in real flows) is of order 50 [kHz]. Fromthis we may conclude that any of these micro-bubbles reaching the laminar/turbulent transition zone will be destabilized by the pressure pulsations and may cause inception of cavitation. If the local cavitation number is sufficiently low, say equal to σB , inception and development of cavitation will be experienced both in full and model scale.
THE EFFECT OF THE TIME AND VELOCITY SCALES
It is generally accepted that inception of cavitation takes place when cavitation nuclei present in the flow are destabili-zed by the flow conditions and they undergo dynamic growth[5]. In order to achieve this, the nuclei must be acted upon by a sufficiently low pressure during a sufficiently long time. Thissituation is illustrated in Fig.12. In this figure Cp is the non--dimensional pressure distribution along a blade section profileand σI means the theoretical cavitation inception number, based on the assumption pCR = pV . Due to the above described effect, the actual inception cavitation number will be lower and equal TI . It may be assumed that a certain value C of the multiple of
mean pressure difference between local pressure and vapour pressure ∆p and time ∆t is required to initiate cavitation. This parameter C is inversely proportional to the typical size of cavitation nuclei (compare Eq. 6), so it may be assumed that its value is similar in model and full scale. Then the following relation may be developed:
(7)
where :
Fig. 12. The effect of time and pressure difference on cavitation inception .
The following observations may be made from the form of equation (7) :
the same object tested at different velocities will have dif-ferent values of the actual inception cavitation number T
I ; this value will be smaller for smaller velocity; on the other hand it will be closer to σI for larger velocity
for two geometrically similar objects of different sizes tested at the same velocity the smaller object will exhibit smaller value of T
I
two geometrically similar objects of different sizes tested at the same value of V0L will exhibit identical values of T
I .
-CP -CP
REGION OF TRANSITION
XC
A
B
CP
C P
XCFULL SCALE MODEL SCALE
0
= ==
Lx
VL
CV2
tpC P20
( )−
= Lx
dCLV2
Lx
Lx
TIP0
2
1
( )
I
IT C P
CP
xL1 2
0
V0
-CP
xL
xL
V0 – characteristic velocity of flow at the blade sectionL – length of the blade section∆Cp – non-dimensional pressure difference (cf. Fig.12).

9POLISH MARITIME RESEARCH, No 4/2006
If the relation (7) is applied to the situation of the model and full scale marine propeller, it may be concluded that the characteristic velocity V0 in full scale is about twice the model value and the characteristic length L in full scale is about 25 times the model value. Consequently, the actual inception ca-vitation number T
I will be visibly higher in full scale than in model scale. As a result, cavitation inception in full scale may happen earlier than indicated by the model experiments. This effect may be illustrated by the photographs shown in Fig.13. In these photographs cavitation on the so called Schiebe body is shown at two different flow velocities but at the same valueof the cavitation number.
Fig. 13. Schiebe body tested at the same cavitation number but at V0 = 8 [m/s] (a) and at V0 = 14 [m/s] (b), quoted from [3] .
THE EFFECT OF THE OBJECT SIZEOne could assume that if the scale effect due to the differen-
ce between model and full scale Reynolds number is properly taken into account, then there is no need to analyse separately the effect of object size. However, the complicated nature of cavitation leads to a separate scale effect of the object size. This may be justified by the following reasoning :
two geometrically similar objects of different sizes will exhibit similar regions of low pressure having size propor-tional to the object size
if the same distribution of the cavitation nuclei in the onco-ming flow is assumed in both cases, then more nuclei willenter the low pressure region around the larger object
consequently, the probability of destabilization of nuclei and cavitation inception is higher for a larger object.
This effect may be illustrated by the photographs shown in Fig.14. However, it should be kept in mind that in the laboratory experiments there are always many different factors influencingthe results at the same time. The results shown in Fig.14, but also in Fig.13 may be the joint consequence of effects mentio-ned in this section and in two preceding sections together.
Fig. 14. Three geometrically similar Schiebe bodies of different sizes tested at the same cavitation number :
a) diameter 15 [mm], b) diameter 30 [mm], c) diameter 60 [mm], quoted from [3].
CONCLUSIONThe above presented analysis of the specific scale effects,
influencing full scale predictions of the marine propellerscavitation behaviour made on the basis of model experiments, leads to the following conclusions :
most of the specific scale effects are more important forinception of cavitation on marine propellers and less important for the fully developed cavitation phenomena; consequently, these scale effects are more important for design of “silent propellers” (naval, research, passenger ships etc.) than for routine cargo ships propellers
the unavoidable effect of static pressure distribution may affect both inception and development of cavitation; it may also generate meaningful differences in the propeller induced pressure pulses; the influence of this scale effect
a)
b)
c)
a)
b)

10 POLISH MARITIME RESEARCH, No 4/2006
may be minimized by proper selection of the cavitation number in model experiments
the water quality effect, in particular the distribution of ca-vitation nuclei in the experimental facility and at sea, is the source of important scale effect on cavitation inception; at present it can not be fully taken into account during scaling of the model results due to the lack of information about true full scale situation
the boundary layer scale effect may lead to meaningful under-prediction of the cavitation inception condition in full scale
the velocity and time scale effect may also lead to under--prediction of the full scale cavitation inception condition
the effect of object size also points to a possibility of under--prediction of the full scale cavitation inception condition
consequently, the results of model experiments performed for prediction of cavitation inception on full scale propellers must be taken with special care and the designers should be aware of the fact that all specific scale effects cause the fullscale propeller cavitation behaviour visibly less optimistic than indicated by model experiments.
NOMENCLATURE
c - blade section chord lengthCp - non-dimensional pressure coefficientCpmin - minimum value of the non-dimensional pressure coefficientΔCp - non-dimensional pressure differenceD - propeller diameterg - acceleration of gravityh - immersion of point where cavitation number is definedJ - propeller advance coefficientL - characteristic lengthn - propeller number of revolutionspA - atmospheric pressureΔp - difference between local pressure and vapour pressurepCR - critical pressurepI - cavitation inception pressurepT - tensile strength of the liquidpTUN - pressure inside cavitation tunnelpV - vapour pressureR - cavitation bubble radiusRe - Reynolds numberS - surface tension of waterΔt - time necessary for cavitation inceptionV - propeller advance velocityV0 - characteristic velocityVR - reference velocity
- non - dimensional coordinate along profile chord
θ - propeller blade position angleλ - model scale coefficientν - kinematic viscosity coefficientρ - density of waterσ - cavitation numberΔσ - change in cavitation number due to tensile strenght of waterσI - inception cavitation numberTI - inception cavitation number including water tensile strength
BIBLIOGRAPHY
1. Brennen C.E.: Cavitation and Bubble Dynamics. Oxford University Press. 1995
2. Gindroz B., Billet M.L.: Nuclei and Acoustic Cavitation Inception of Ship Propellers. Proc. 2nd Int. Symposium on Cavitation. Tokyo, Japan. 1994
3. Keller A.P.: Cavitation Scale Effects – A Representation of its Visual Appearance and Empirically Found Relations. Proc. Intern. Conference NCT’50, Newcastle-upon-Tyne. 2000
4. Keller A.P.: New Scaling Laws for Hydrodynamic Cavitation Inception. Proc. 2nd Int. Symposium on Cavitation. Tokyo, Japan. April 1994
5. Knapp R.T, Daily J.W., Hammitt F.G.: Cavitation, Mc Graw Hill. 1970
6. Schlichting H.: Grenzschicht Theorie. Verlag G. Braun. Karlsruhe. 1965
7. Szantyr J.: Lift Based Propeller Scale Effect and Its Influence onPropulsive Characteristics of Ships. Trans. West Japan Soc. Of Naval Architects No. 84(1992)
CONTACT WITH THE AUTHOR
Jan A. Szantyr, Prof. D. Sc., Ph. D. (Nav. Arch.)Department of Turbomachinery
and Fluid Mechanics,Gdańsk University of Technology
Narutowicza 11/1280-958 Gdańsk, POLAND
e-mail : [email protected]
xc
TOP KORAB in 2005
Every year the Polish Society of Naval Architects and Marine Engineers, TOP KORAB, traditionally arranges, apart from its current activity, open meetings during which are discussed topics in advance announced dealing with shipbuilding and maritime economy.
In the year 2005 the following problems were dealt with by Gdańsk Division of the Society :
Prospects of Polish shipbuilding industry in taking advantage from the current boom in the worldwide market
Drilling unit equipment made in Poland Fuel system blocks for ship diesel engines The fastest-in-the-world computers and their techno-
logical trends To day and to morrow of the firm Hydrobudowa
S.A.
And in Szczecin Division of the Society :
Optimization models for engineering and economy Organization of the Conference on : Past, present and
future state of Polish shipbuilding industry
In 2005 the most important event for the Society was the signing of the agreement on establishment of RINA/KORAB Joint Branch. The agreement was signed on behalf of TOP KORAB by B. Banach, its Chairman and J. Czuczman, its Vice-chairman, and on behalf of RINA by T. Blakeley, RINA Chairman. The document was also signed by Prof. J. W. Doerffer, Honorary Member of TOP KORAB, Fellow Member of RINA.


![Visualization of Unsteady Behavior of Cavitation in ... · cavitation state, transition-cavitation state, and super-cavitation state in the orifice throat [5]. Under relative high](https://static.fdocuments.in/doc/165x107/5b4f673e7f8b9a166e8c4c74/visualization-of-unsteady-behavior-of-cavitation-in-cavitation-state-transition-cavitation.jpg)


![Numerical Study on Cavitation Noise of Symmetrical Blade … 2018... · 2018-09-05 · Figure 1: The frequency ranges of cavitation noise for marine propellers (Seol, 2005)[12]. 2.2.Symmetrical](https://static.fdocuments.in/doc/165x107/5e3799c97446173dbf3be229/numerical-study-on-cavitation-noise-of-symmetrical-blade-2018-2018-09-05.jpg)


