
SCALABLE CLUSTERING BY TRUNCATED FUZZY -MEANS …gan/ggpaper/gan2016tfcm.pdf · SCALABLE CLUSTERING...
13
Big Data and Information Analytics doi:10.3934/bdia.2016007 c American Institute of Mathematical Sciences Volume 1, Number 2&3, April & July 2016 pp. 247–259 SCALABLE CLUSTERING BY TRUNCATED FUZZY c-MEANS Guojun Gan Department of Mathematics University of Connecticut 341 Mansfield Road, Storrs, CT 06269-1009, USA Qiujun Lan Business School Hunan University Changsha, Hunan 410082, China Shiyang Sima Columbian College of Arts & Sciences George Washington University Washington, D.C., 20052, USA (Communicated by Weidong Bao) Abstract. Most existing clustering algorithms are slow for dividing a large dataset into a large number of clusters. In this paper, we propose a truncated FCM algorithm to address this problem. The main idea behind our proposed algorithm is to keep only a small number of cluster centers during the iterative process of the FCM algorithm. Our numerical experiments on both synthetic and real datasets show that the proposed algorithm is much faster than the original FCM algorithm and the accuracy is comparable to that of the original FCM algorithm. 1. Introduction. Data clustering refers to a process of dividing a set of items into homogeneous groups or clusters such that items in the same cluster are similar to each other and items from different clusters are distinct [10, 1]. As one of the most popular tools for data exploration, data clustering has found applications in many scientific areas such as bioinformatics [21, 26], actuarial science and insurance [11, 13], image segmentation [20, 25], to name just a few. During the past six decades, many clustering algorithms have been developed by researchers from different areas. These clustering algorithms can be divided into two groups: hard clustering algorithms and fuzzy clustering algorithms. In hard clustering algorithms, each item is assigned to one and only one cluster; In fuzzy clustering algorithms, each item can be assigned to one or more clusters with some degrees of membership. Examples of hard clustering algorithms include the k-means algorithm [27], which is one of the most widely used clustering algorithm. The FCM (Fuzzy c-means) algorithm [9, 4, 3] is a popular fuzzy clustering algorithm. 2010 Mathematics Subject Classification. Primary: 62H30, 68T10, 91C20; Secondary: 62P10. Key words and phrases. Data clustering, fuzzy c-means, scalable clustering. 247
Transcript of SCALABLE CLUSTERING BY TRUNCATED FUZZY -MEANS …gan/ggpaper/gan2016tfcm.pdf · SCALABLE CLUSTERING...
Big Data and Information Analytics doi:10.3934/bdia.2016007c©American Institute of Mathematical SciencesVolume 1, Number 2&3, April & July 2016 pp. 247–259
SCALABLE CLUSTERING BY TRUNCATED FUZZY c-MEANS
Guojun Gan
Department of MathematicsUniversity of Connecticut
341 Mansfield Road, Storrs, CT 06269-1009, USA
Qiujun Lan
Business School
Hunan UniversityChangsha, Hunan 410082, China
Shiyang Sima
Columbian College of Arts & Sciences
George Washington UniversityWashington, D.C., 20052, USA
(Communicated by Weidong Bao)
Abstract. Most existing clustering algorithms are slow for dividing a large
dataset into a large number of clusters. In this paper, we propose a truncated
FCM algorithm to address this problem. The main idea behind our proposedalgorithm is to keep only a small number of cluster centers during the iterative
process of the FCM algorithm. Our numerical experiments on both syntheticand real datasets show that the proposed algorithm is much faster than the
original FCM algorithm and the accuracy is comparable to that of the original
FCM algorithm.
1. Introduction. Data clustering refers to a process of dividing a set of itemsinto homogeneous groups or clusters such that items in the same cluster are similarto each other and items from different clusters are distinct [10, 1]. As one of themost popular tools for data exploration, data clustering has found applications inmany scientific areas such as bioinformatics [21, 26], actuarial science and insurance[11, 13], image segmentation [20, 25], to name just a few.
During the past six decades, many clustering algorithms have been developed byresearchers from different areas. These clustering algorithms can be divided intotwo groups: hard clustering algorithms and fuzzy clustering algorithms. In hardclustering algorithms, each item is assigned to one and only one cluster; In fuzzyclustering algorithms, each item can be assigned to one or more clusters with somedegrees of membership. Examples of hard clustering algorithms include the k-meansalgorithm [27], which is one of the most widely used clustering algorithm. The FCM(Fuzzy c-means) algorithm [9, 4, 3] is a popular fuzzy clustering algorithm.
2010 Mathematics Subject Classification. Primary: 62H30, 68T10, 91C20; Secondary: 62P10.Key words and phrases. Data clustering, fuzzy c-means, scalable clustering.
247
248 GUOJUN GAN, QIUJUN LAN AND SHIYANG SIMA
The FCM algorithm is formulated to minimize an objective function. Let X ={x1,x2, . . . ,xn} be a dataset containing n points. Let k be the desired number ofclusters. Then the objective function of the FCM algorithm is defined as
Q(U,Z) =
k∑l=1
n∑i=1
uαil‖xi − zl‖2, (1)
where U = (uil)n×k is an n × k fuzzy k partition matrix, α > 1 is the fuzzifier,Z = {z1, z2, . . . , zk} is a set of k centers, and ‖ · ‖ is the L2-norm or Euclideandistance. Here a fuzzy k partition of a dataset of n points is an n× k matrix thatsatisfies the following conditions:
uil ∈ [0, 1], i = 1, 2, . . . , n, l = 1, 2, . . . , k, (2a)
k∑l=1
uil = 1, i = 1, 2, . . . , n, (2b)
n∑i=1
uil > 0, l = 1, 2, . . . , k. (2c)
Similar to the k-means algorithm, the FCM algorithm employs an iterative processto minimize the objective function.
The FCM algorithm has some advantages over the k-means algorithm. For ex-ample, the FCM algorithm can reduce the number of local minima of the objectivefunction [22]. However, the FCM algorithm is not efficient for dividing a largedataset into many clusters. Examples of such situations include clustering millionsof web pages into a thousand categories [5] and clustering hundreds of thousandsinsurance policies into a thousand clusters in order to select a thousand representa-tive policies [11, 13]. This inefficiency is caused by the following two factors. First,the FCM algorithm needs to store the full fuzzy partition matrix, which containsnk elements. Second, the FCM algorithm needs to calculate nk distances at eachiteration.
In this paper, we propose a modified version of the FCM algorithm, called theTFCM (Truncated FCM) algorithm, to address the aforementioned drawback of theFCM algorithm. In the TFCM algorithm, a subset of the full fuzzy partition matrixis stored and the number of distance calculations at each iteration is reduced. Theidea of the TFCM algorithm stems from the insight that when k is large, a datapoint belongs to only a few clusters with high degrees of membership. As a result,we can ignore the clusters with low degrees of membership while preserving theoverall quality of the clustering.
The remaining part of this paper is organized as follows. In Section 2, we givea brief review of relevant work. In Section 3, we introduce the TFCM algorithmin detail. In Section 4, we demonstrate the performance of the TFCM algorithmusing numerical experiments. Finally, we conclude the paper with some remarks inSection 5.
2. Related work. As one of the most popular fuzzy clustering algorithms, theFCM algorithm was originally proposed by [9] and later modified by [4]. Manyimprovements of the FCM algorithm have been proposed since its introduction. Inthis section, we give a brief review of research work related to the efficiency of theFCM algorithm.
SCALABLE CLUSTERING BY TRUNCATED FUZZY c-MEANS 249
[6] proposed the AFCM (Approximate FCM) algorithm by replacing some vari-ates in the FCM equations with integer-valued or real-valued estimates. The AFCMalgorithm was developed to process digital images interactively. In the implementa-tion of the AFCM algorithm, the fuzzy memberships uil are approximated by realnumbers with three decimal places and stored as integers in [0, 1000] in memory. Inaddition, the AFCM algorithm stores six internal tables in memory and uses a tablelookup approach to eliminate the use of exponentiation operators in the updatingof the cluster centers and fuzzy memberships. Experimental results show that theruntime of each iteration of the AFCM algorithm is reduced approximately to onesixth of that of a literal implementation of the FCM algorithm.
[7] proposed a multistage random sampling FCM algorithm, called the mrFCMalgorithm, to reduce the runtime of the FCM algorithm. The mrFCM algorithmconsists of two phases. In the first phase, the FCM algorithm is applied to aseries of subsamples selected randomly from the whole dataset in order to find goodinitial cluster centers. In the second phase, the standard FCM algorithm with theinitial cluster centers obtained from the first phase is applied to partition the wholedataset.
[19] proposed the psFCM (partition simplification FCM) algorithm to speed upthe FCM algorithm by simplifying the computation at each iteration and reducingthe number of iterations. Similar to the mrFCM algorithm [7], the psFCM algorithmalso consists of two phases. In the first phase, the kd-tree method is first used topartition the whole dataset into small blocks. All points in a block are representedby the centroid of the block. In this way, a large dataset is reduced to a simplifieddataset that is much smaller than the original dataset. Then the FCM algorithm isapplied to the simplified dataset to obtain the actual cluster centers. In the secondphase, the FCM algorithm with the cluster centers obtained from the first phase isapplied to partition the original dataset.
[23] proposed a modified version of the FCM algorithm by eliminating the needto store the fuzzy partition matrix U . In the modified version, updating the clustercenters and updating the fuzzy memberships are combined into a single step. Theoriginal FCM algorithm has a time complexity of O(nk2d), but this modified versionreduces the time complexity to O(nkd), where n, k, and d denote the number of datapoints, the desired number of clusters, and the number of attributes, respectively.
[24] proposed the PFCM (Parallel FCM) algorithm for clustering large datasetsby using the Message Passing Interface (MPI). In the PFCM algorithm with Pprocessors, a dataset of n points is divided into P blocks of equal size so that eachprocessor processes n/P data points. The fuzzy partition matrix is also divided intoP sections so that the memberships of local data points of a processor are storedin the processor’s memory. An MPI call is used to pass messages if a computationrequires data points stored in other processes. The PFCM algorithm is an exampleof speeding up the FCM algorithm through hardware. Another example of speedingup the FCM algorithm through hardware is to use the graphics-processing unit(GPU) [28].
[17] proposed the geFFCM (generalized extensible fast fuzzy c-means) algorithmto cluster very large datasets. The geFFCM algorithm is similar to the mrFCMalgorithm [7] and the psFCM algorithm [19] in the sense that divide-and-conquerstrategy is used by all three algorithms. In the geFFCM algorithm, a subsampleXSS is drawn from the original datasetX without replacement such that the numberof features for which XSS and X agree is not less than a specified number. Then the
250 GUOJUN GAN, QIUJUN LAN AND SHIYANG SIMA
standard FCM algorithm is applied to XSS to obtain the cluster centers. Finally,the cluster centers are used to obtain the fuzzy partition matrix of the originaldataset.
[18] compared three different implementation of the FCM algorithm for clusteringvery large datasets. In particular, [18] compared the random sample and extensionFCM, single-pass FCM, and on-line FCM. In addition, kernelized versions of thethree algorithms were also compared. [29] proposed the FCM++ algorithm toimprove the speed of the FCM algorithm by using the seeding mechanism of theK-means++ [2].
Almost all of the aforementioned algorithms aim at speeding up the FCM al-gorithm for large datasets. These algorithms do not scale well when the desirednumber of clusters is large. The algorithm proposed by [23] reduces the time com-plexity of the FCM algorithm from O(nk2d) to O(nkd). However, the algorithm stillneeds to calculate nk distances at each iteration. In the next section, we proposethe truncated fuzzy c-means algorithm to approximate the FCM algorithm whenthe desired number of clusters is large.
3. The TFCM algorithm. In this section, we introduce the TFCM (TruncatedFuzzy c-means) algorithm.
Let X = {x1,x2, . . . ,xn} be a dataset containing n points. Let k be the desirednumber of clusters. A fuzzy partition matrix U = (uil)n×k of dividing X into kclusters is an n× k matrix that satisfies the following conditions
uil ∈ [0, 1], i = 1, 2, . . . , n, l = 1, 2, . . . , k,
andk∑l=1
uil = 1, i = 1, 2, . . . , n.
Let T be an integer such that 1 ≤ T ≤ k. Let UT be the set of fuzzy partitionmatrices U such that each row of U has at most T nonzero entries. In other words,U ∈ UT if U is a fuzzy partition matrix such that for each i = 1, 2, . . . , n,
|{l : uil > 0}| ≤ T, (3)
where | · | denote the number of elements in a set.Then the objective function of the TFCM algorithm is defined as
P (U,Z) =
n∑i=1
k∑l=1
uαil(‖xi − zl‖2 + ε
), (4)
where α > 1 is the fuzzifier, U ∈ UT , Z = {z1, z2, . . ., zk} is a set of cluster centers,‖ · ‖ is the L2-norm or Euclidean distance, and ε is a small positive number usedto prevent division by zero. Let Ii = {l : uil > 0} for i = 1, 2, . . . , n. Then we canrewrite the objective function (4) as
P (U,Z) =
n∑i=1
∑l∈Ii
uαil(‖xi − zl‖2 + ε
). (5)
From Equation (5) we see that the main difference between the TFCM algorithmand the fuzzy c-means algorithm is the constraint given in Equation (3). If T = 1,then the TFCM algorithm becomes the k-means algorithm. If T = k, then theTFCM algorithm becomes the fuzzy c-means algorithm.
SCALABLE CLUSTERING BY TRUNCATED FUZZY c-MEANS 251
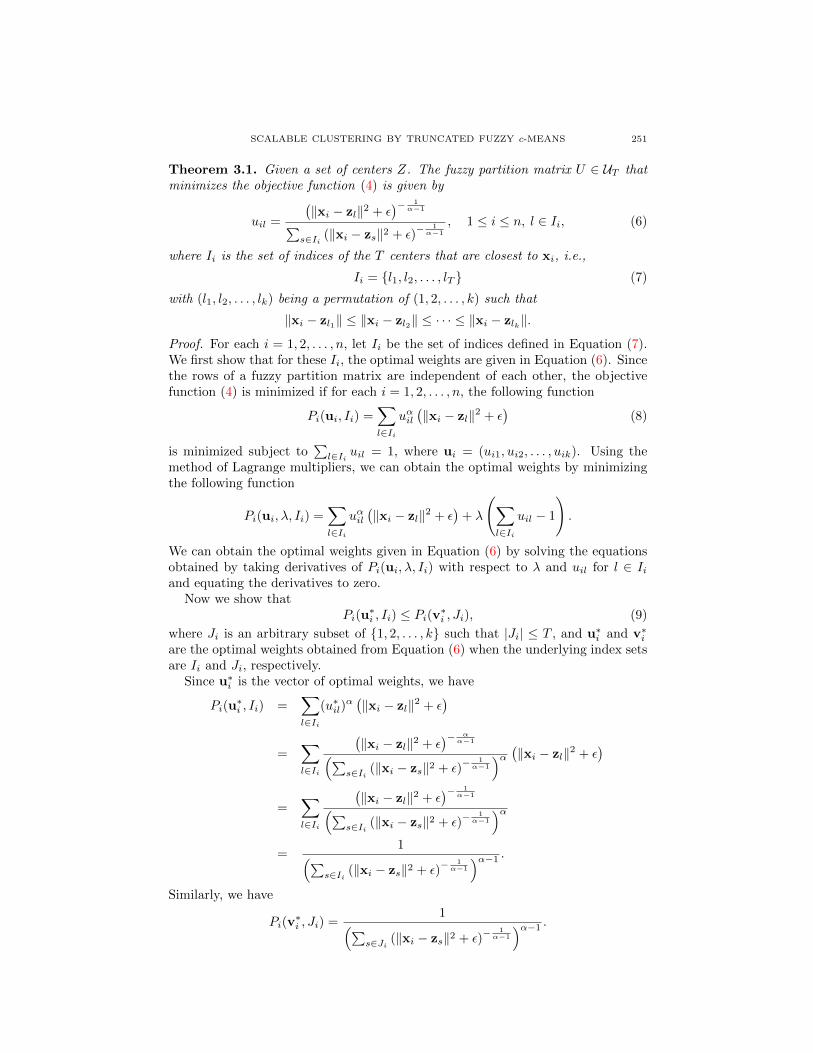
Theorem 3.1. Given a set of centers Z. The fuzzy partition matrix U ∈ UT thatminimizes the objective function (4) is given by
uil =
(‖xi − zl‖2 + ε
)− 1α−1∑
s∈Ii (‖xi − zs‖2 + ε)− 1α−1
, 1 ≤ i ≤ n, l ∈ Ii, (6)
where Ii is the set of indices of the T centers that are closest to xi, i.e.,
Ii = {l1, l2, . . . , lT } (7)
with (l1, l2, . . . , lk) being a permutation of (1, 2, . . . , k) such that
‖xi − zl1‖ ≤ ‖xi − zl2‖ ≤ · · · ≤ ‖xi − zlk‖.
Proof. For each i = 1, 2, . . . , n, let Ii be the set of indices defined in Equation (7).We first show that for these Ii, the optimal weights are given in Equation (6). Sincethe rows of a fuzzy partition matrix are independent of each other, the objectivefunction (4) is minimized if for each i = 1, 2, . . . , n, the following function
Pi(ui, Ii) =∑l∈Ii
uαil(‖xi − zl‖2 + ε
)(8)
is minimized subject to∑l∈Ii uil = 1, where ui = (ui1, ui2, . . . , uik). Using the
method of Lagrange multipliers, we can obtain the optimal weights by minimizingthe following function
Pi(ui, λ, Ii) =∑l∈Ii
uαil(‖xi − zl‖2 + ε
)+ λ
(∑l∈Ii
uil − 1
).
We can obtain the optimal weights given in Equation (6) by solving the equationsobtained by taking derivatives of Pi(ui, λ, Ii) with respect to λ and uil for l ∈ Iiand equating the derivatives to zero.
Now we show thatPi(u
∗i , Ii) ≤ Pi(v∗i , Ji), (9)
where Ji is an arbitrary subset of {1, 2, . . . , k} such that |Ji| ≤ T , and u∗i and v∗iare the optimal weights obtained from Equation (6) when the underlying index setsare Ii and Ji, respectively.
Since u∗i is the vector of optimal weights, we have
Pi(u∗i , Ii) =
∑l∈Ii
(u∗il)α(‖xi − zl‖2 + ε
)=
∑l∈Ii
(‖xi − zl‖2 + ε
)− αα−1(∑
s∈Ii (‖xi − zs‖2 + ε)− 1α−1
)α (‖xi − zl‖2 + ε)
=∑l∈Ii
(‖xi − zl‖2 + ε
)− 1α−1(∑
s∈Ii (‖xi − zs‖2 + ε)− 1α−1
)α=
1(∑s∈Ii (‖xi − zs‖2 + ε)
− 1α−1
)α−1 .Similarly, we have
Pi(v∗i , Ji) =
1(∑s∈Ji (‖xi − zs‖2 + ε)
− 1α−1
)α−1 .
252 GUOJUN GAN, QIUJUN LAN AND SHIYANG SIMA
Since α > 1, Ii contains the indcies of the T centers that are closest to xi, and|Ji| ≤ T , we have∑
s∈Ii
(‖xi − zs‖2 + ε
)− 1α−1 ≥
∑s∈Ji
(‖xi − zs‖2 + ε
)− 1α−1 ,
which shows that the inequality given in Equation (9) is true. This completes theproof.
Theorem 3.2. Given a fuzzy partition matrix U ∈ UT . The set of centers Z thatminimizes the objective function (4) is given by
zlj =
∑ni=1 u
αilxij∑n
i=1 uαil
=
∑i∈Cl u
αilxij∑
i∈Cl uαil
, (10)
for l = 1, 2, . . . , k and j = 1, 2, . . . , d, where d is the number of features, zlj is thejth component of zl, and Cl = {i : uil > 0}.
The proof of Theorem 3.2 is omitted as it is similar to the result of the FCMalgorithm.
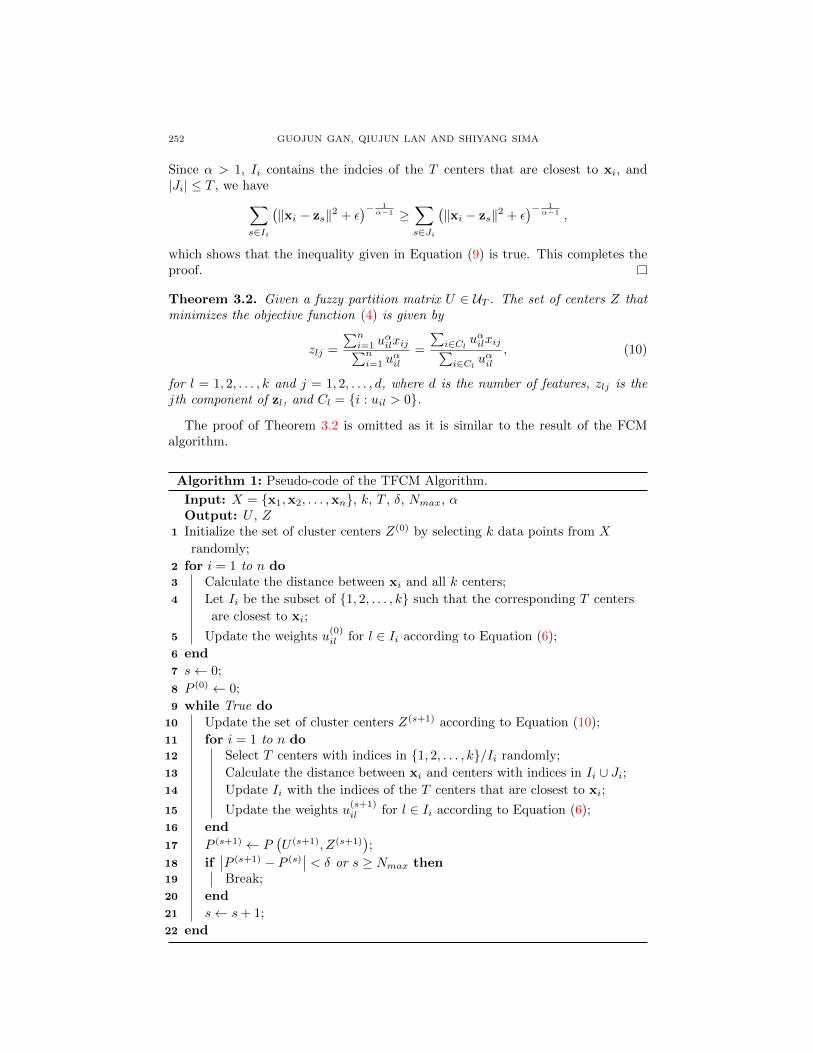
Algorithm 1: Pseudo-code of the TFCM Algorithm.
Input: X = {x1,x2, . . . ,xn}, k, T , δ, Nmax, αOutput: U , Z
1 Initialize the set of cluster centers Z(0) by selecting k data points from X
randomly;
2 for i = 1 to n do3 Calculate the distance between xi and all k centers;
4 Let Ii be the subset of {1, 2, . . . , k} such that the corresponding T centers
are closest to xi;
5 Update the weights u(0)il for l ∈ Ii according to Equation (6);
6 end
7 s← 0;
8 P (0) ← 0;
9 while True do10 Update the set of cluster centers Z(s+1) according to Equation (10);
11 for i = 1 to n do12 Select T centers with indices in {1, 2, . . . , k}/Ii randomly;
13 Calculate the distance between xi and centers with indices in Ii ∪ Ji;14 Update Ii with the indices of the T centers that are closest to xi;
15 Update the weights u(s+1)il for l ∈ Ii according to Equation (6);
16 end
17 P (s+1) ← P(U (s+1), Z(s+1)
);
18 if∣∣P (s+1) − P (s)
∣∣ < δ or s ≥ Nmax then19 Break;
20 end
21 s← s+ 1;
22 end
SCALABLE CLUSTERING BY TRUNCATED FUZZY c-MEANS 253
The pseudo-code of the TFCM algorithm is given in Algorithm 1. The TFCMalgorithm consists of two phases: the initialization phase and the iteration phase. Inthe initialization phase, we initialize the cluster centers to be k data points randomlyselected from the dataset. We also calculate the distances between all data pointsand all initial centers in order to calculate the weights U . In the iteration phase,for each data point xi, we only calculate the distances between the data point and2 ∗ T cluster centers, which include the T existing centers saved in Ii and T centersrandomly selected from the remaining k − T centers. Among the 2 ∗ T centers, weonly keep the T centers that are closest to the point xi and save them for the nextiteration. The advantage of selecting some centers from the remaining centers isthat it helps us to find the true center for a data point if the true center was notselected in the initialization phase or previous iterations.
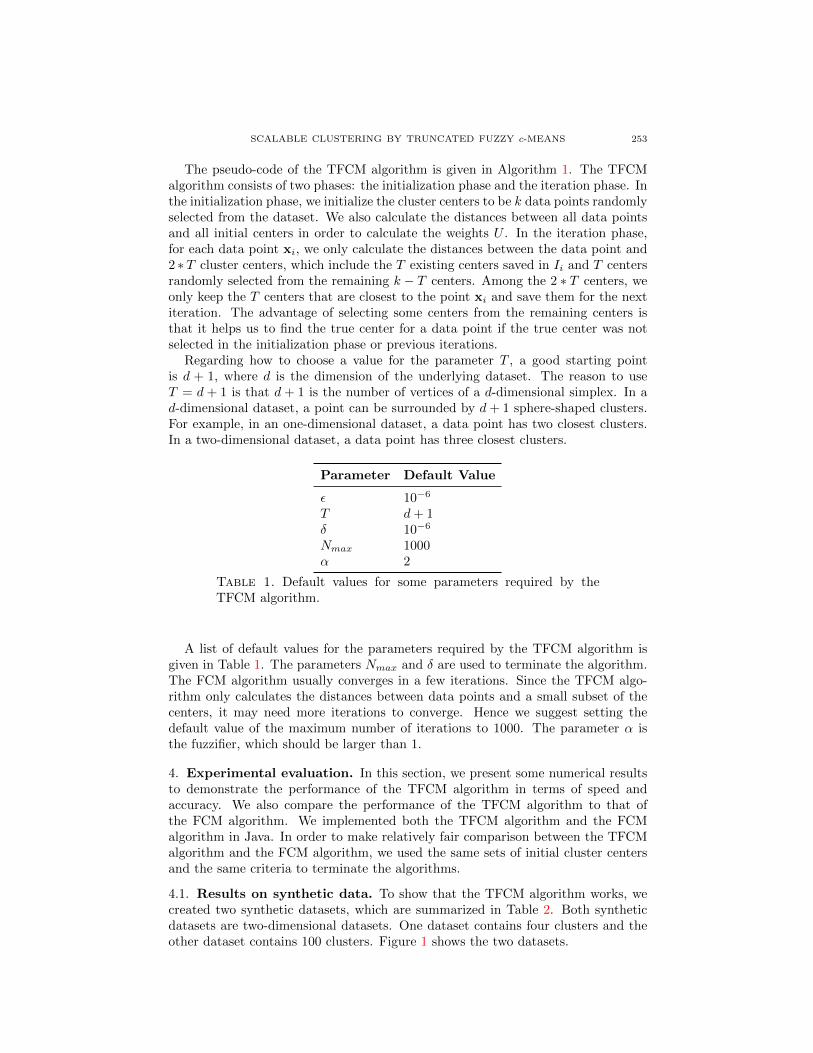
Regarding how to choose a value for the parameter T , a good starting pointis d + 1, where d is the dimension of the underlying dataset. The reason to useT = d + 1 is that d + 1 is the number of vertices of a d-dimensional simplex. In ad-dimensional dataset, a point can be surrounded by d+ 1 sphere-shaped clusters.For example, in an one-dimensional dataset, a data point has two closest clusters.In a two-dimensional dataset, a data point has three closest clusters.
Parameter Default Value
ε 10−6
T d+ 1δ 10−6
Nmax 1000α 2
Table 1. Default values for some parameters required by theTFCM algorithm.
A list of default values for the parameters required by the TFCM algorithm isgiven in Table 1. The parameters Nmax and δ are used to terminate the algorithm.The FCM algorithm usually converges in a few iterations. Since the TFCM algo-rithm only calculates the distances between data points and a small subset of thecenters, it may need more iterations to converge. Hence we suggest setting thedefault value of the maximum number of iterations to 1000. The parameter α isthe fuzzifier, which should be larger than 1.
4. Experimental evaluation. In this section, we present some numerical resultsto demonstrate the performance of the TFCM algorithm in terms of speed andaccuracy. We also compare the performance of the TFCM algorithm to that ofthe FCM algorithm. We implemented both the TFCM algorithm and the FCMalgorithm in Java. In order to make relatively fair comparison between the TFCMalgorithm and the FCM algorithm, we used the same sets of initial cluster centersand the same criteria to terminate the algorithms.
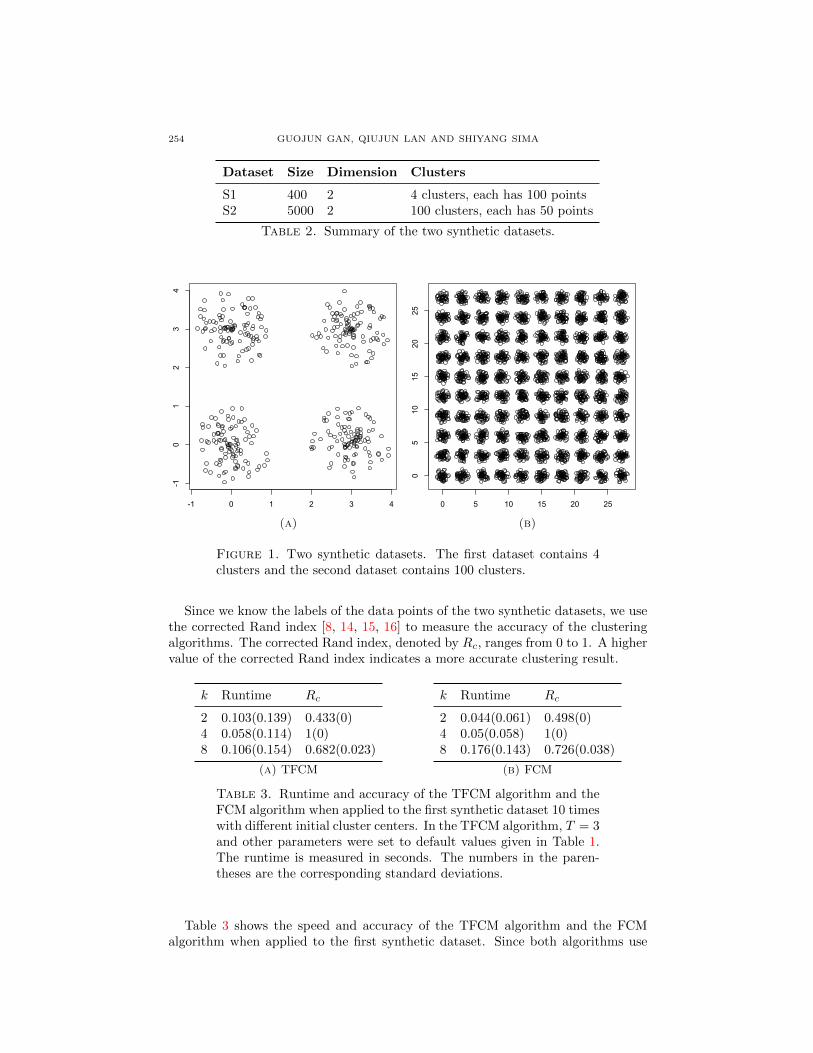
4.1. Results on synthetic data. To show that the TFCM algorithm works, wecreated two synthetic datasets, which are summarized in Table 2. Both syntheticdatasets are two-dimensional datasets. One dataset contains four clusters and theother dataset contains 100 clusters. Figure 1 shows the two datasets.
254 GUOJUN GAN, QIUJUN LAN AND SHIYANG SIMA
Dataset Size Dimension Clusters
S1 400 2 4 clusters, each has 100 pointsS2 5000 2 100 clusters, each has 50 points
Table 2. Summary of the two synthetic datasets.
-1 0 1 2 3 4
-10
12
34
(a)
0 5 10 15 20 25
05
1015
2025
(b)
Figure 1. Two synthetic datasets. The first dataset contains 4clusters and the second dataset contains 100 clusters.
Since we know the labels of the data points of the two synthetic datasets, we usethe corrected Rand index [8, 14, 15, 16] to measure the accuracy of the clusteringalgorithms. The corrected Rand index, denoted by Rc, ranges from 0 to 1. A highervalue of the corrected Rand index indicates a more accurate clustering result.
k Runtime Rc
2 0.103(0.139) 0.433(0)4 0.058(0.114) 1(0)8 0.106(0.154) 0.682(0.023)
(a) TFCM
k Runtime Rc
2 0.044(0.061) 0.498(0)4 0.05(0.058) 1(0)8 0.176(0.143) 0.726(0.038)
(b) FCM
Table 3. Runtime and accuracy of the TFCM algorithm and theFCM algorithm when applied to the first synthetic dataset 10 timeswith different initial cluster centers. In the TFCM algorithm, T = 3and other parameters were set to default values given in Table 1.The runtime is measured in seconds. The numbers in the paren-theses are the corresponding standard deviations.
Table 3 shows the speed and accuracy of the TFCM algorithm and the FCMalgorithm when applied to the first synthetic dataset. Since both algorithms use
SCALABLE CLUSTERING BY TRUNCATED FUZZY c-MEANS 255
random initial cluster centers, we run the two algorithms 10 times to alleviate theimpact of initial cluster centers on the performance measures.
The first synthetic dataset contains 400 data points and four clusters of equalsize. When the number of clusters k was set to small numbers (e.g., 2 and 4), theTFCM algorithm was slower than the FCM algorithm on average. However, whenk was set to 8, the TFCM algorithm outperformed the FCM algorithm on averagein terms of speed. In terms of accuracy, both the TFCM algorithm and the FCMalgorithm produced a corrected Rand index of 1 when k was set to the true numberof clusters. In addition, the standard deviations of the corrected Rand index arezero when k = 2 and 4, indicating that the clustering results were not affected bythe initial cluster centers. However, when k = 8, the standard deviations becomepositive, indicating that the clustering results were affected by the initial clustercenters.
The test results on the first synthetic dataset show that when k is small, theTFCM algorithm is slower than the FCM algorithm. This is expected as the im-plementation of TFCM involves sorting distances. The additional runtime causedby sorting is more than the reduced runtime resulted from less number of distancecalculations.
k Runtime Rc
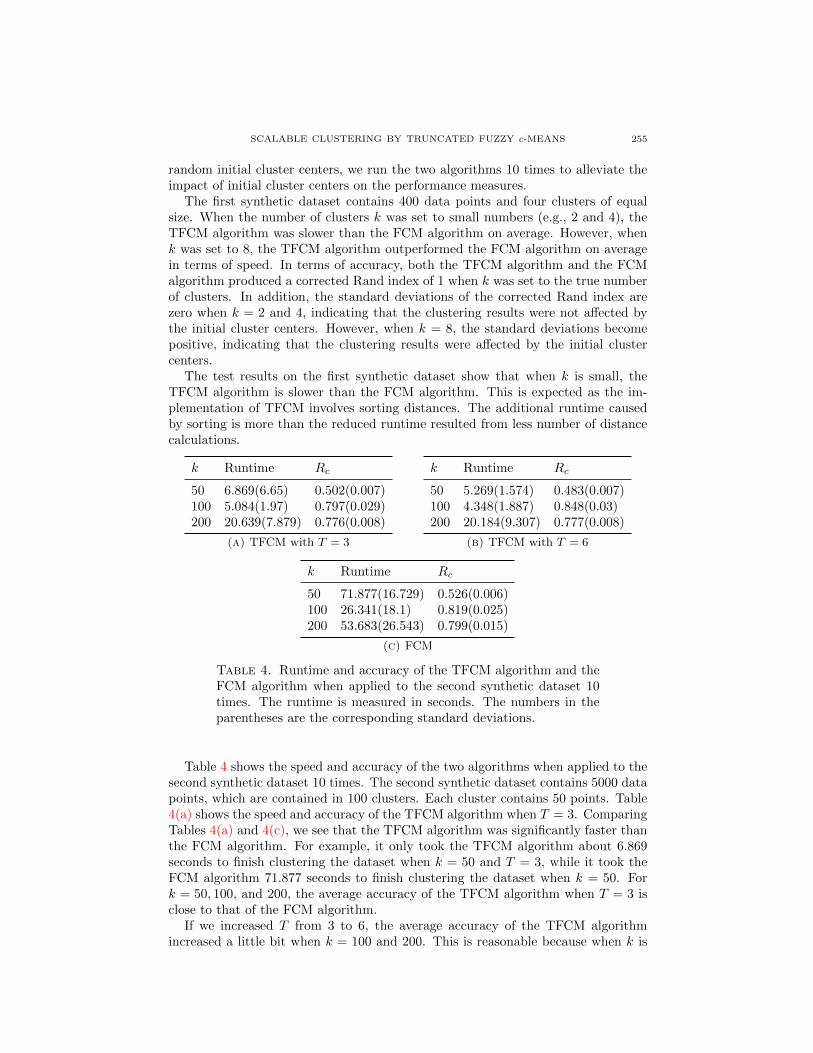
50 6.869(6.65) 0.502(0.007)100 5.084(1.97) 0.797(0.029)200 20.639(7.879) 0.776(0.008)
(a) TFCM with T = 3
k Runtime Rc
50 5.269(1.574) 0.483(0.007)100 4.348(1.887) 0.848(0.03)200 20.184(9.307) 0.777(0.008)
(b) TFCM with T = 6
k Runtime Rc
50 71.877(16.729) 0.526(0.006)100 26.341(18.1) 0.819(0.025)200 53.683(26.543) 0.799(0.015)
(c) FCM
Table 4. Runtime and accuracy of the TFCM algorithm and theFCM algorithm when applied to the second synthetic dataset 10times. The runtime is measured in seconds. The numbers in theparentheses are the corresponding standard deviations.
Table 4 shows the speed and accuracy of the two algorithms when applied to thesecond synthetic dataset 10 times. The second synthetic dataset contains 5000 datapoints, which are contained in 100 clusters. Each cluster contains 50 points. Table4(a) shows the speed and accuracy of the TFCM algorithm when T = 3. ComparingTables 4(a) and 4(c), we see that the TFCM algorithm was significantly faster thanthe FCM algorithm. For example, it only took the TFCM algorithm about 6.869seconds to finish clustering the dataset when k = 50 and T = 3, while it took theFCM algorithm 71.877 seconds to finish clustering the dataset when k = 50. Fork = 50, 100, and 200, the average accuracy of the TFCM algorithm when T = 3 isclose to that of the FCM algorithm.
If we increased T from 3 to 6, the average accuracy of the TFCM algorithmincreased a little bit when k = 100 and 200. This is reasonable because when k is
256 GUOJUN GAN, QIUJUN LAN AND SHIYANG SIMA
large, increasing T helps find the true cluster centers. Comparing Table 4(b) andTable 4(c), we see that the average corrected Rand index of the TFCM algorithmis higher than that of the FCM algorithm when k was set to the true number ofclusters. This might be caused by the fact that we only used 10 runs to calculatethe average accuracy. If we use 100 runs to calculate the average corrected Randindex, the FCM algorithm may be more accurate than the TFCM algorithm.
If we look at the average runtime for different k at Tables 4(a), 4(b), and 4(c), wesee that the average runtime when k was set to the true number of clusters is lowerthan that when k was set to other numbers. For example, the average runtime ofthe TFCM algorithm when k = 100 and T = 3 was 5.084 seconds, which is lowerthan the average runtime when k = 50 and k = 200. We see a similar patternof runtime for the FCM algorithm. This is caused by the fact that when k is notset to the true number of clusters, it takes both the algorithms more iterations toconverge on average.
4.2. Results on real data. As we mentioned in the introduction section of thisarticle, data clustering was used to divide a large portfolio of variable annuitycontracts into hundreds of clusters in order to find representative contracts formetamodeling [11, 13]. Existing clustering algorithms are slow for dividing a largedataset into hundreds of clusters. In this subsection, we apply the TFCM algorithmto divide a large portfolio of variable annuity contracts into hundreds of clusters.
The variable annuity dataset was simulated by a Java program [12]. The datasetcontains 10,000 variable annuity contracts. The original dataset contains categoricalvariables. We converted the categorical variables into binary dummy variables andnormalized all numerical variables to the interval [0,1]. The resulting dataset has22 numerical features. Since the dataset has no labels, we cannot use the correctedRand index to measure the accuracy of the clustering results. To compare theclustering results of this dataset, we use the within-cluster sum of squares definedas
WSS =
k∑l=1
∑x∈Cl
d∑j=1
(xj − zlj)2 , (11)
where C1, C2, . . . , Ck are k hard clusters obtained from the fuzzy membership matrixU and zl is the average of the data points in the cluster Cl. For fixed k, a lowervalue of WSS indicates a better clustering result.
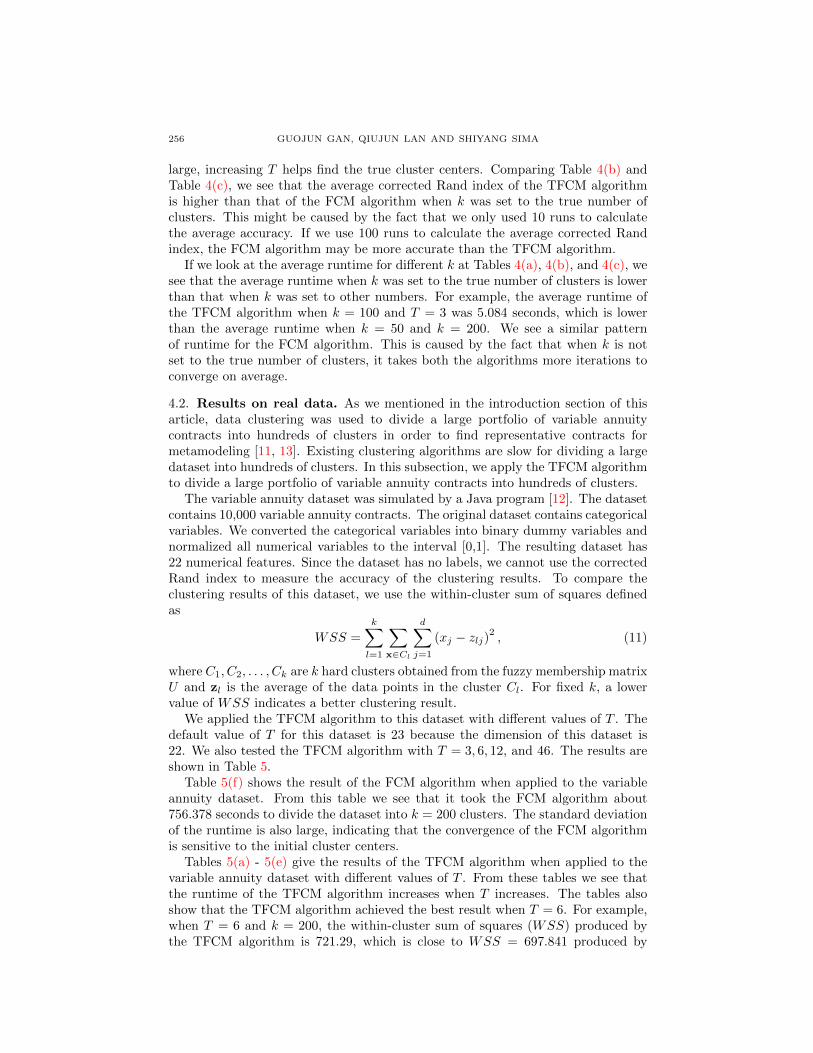
We applied the TFCM algorithm to this dataset with different values of T . Thedefault value of T for this dataset is 23 because the dimension of this dataset is22. We also tested the TFCM algorithm with T = 3, 6, 12, and 46. The results areshown in Table 5.
Table 5(f) shows the result of the FCM algorithm when applied to the variableannuity dataset. From this table we see that it took the FCM algorithm about756.378 seconds to divide the dataset into k = 200 clusters. The standard deviationof the runtime is also large, indicating that the convergence of the FCM algorithmis sensitive to the initial cluster centers.
Tables 5(a) - 5(e) give the results of the TFCM algorithm when applied to thevariable annuity dataset with different values of T . From these tables we see thatthe runtime of the TFCM algorithm increases when T increases. The tables alsoshow that the TFCM algorithm achieved the best result when T = 6. For example,when T = 6 and k = 200, the within-cluster sum of squares (WSS) produced bythe TFCM algorithm is 721.29, which is close to WSS = 697.841 produced by
SCALABLE CLUSTERING BY TRUNCATED FUZZY c-MEANS 257
k Runtime WSS
100 6.417(1.9) 944.636(14.574)200 16.167(5.565) 735.001(6.37)
(a) TFCM with T = 3
k Runtime WSS
100 16.734(5.133) 930.14(15.614)200 31.871(19.216) 721.291(5.3)
(b) TFCM with T = 6
k Runtime WSS
100 71.185(22.023) 958.137(15.234)200 87.918(22.641) 740.548(6.688)
(c) TFCM with T = 12
k Runtime WSS
100 164.02(57.612) 994.111(18.829)200 219.695(51.104) 783.113(7.156)
(d) TFCM with T = 23
k Runtime WSS
100 280.137(70.577) 1049.864(24.202)200 339.216(80.694) 822.988(8.866)
(e) TFCM with T = 46
k Runtime WSS
100 597.828(193.2) 895.205(16.264)200 756.378(382.952) 697.841(6.736)
(f) FCM
Table 5. Speed and accuracy of the TFCM algorithm and theFCM algorithm when applied to the variable annuity dataset 10times. The runtime is in seconds. The numbers in the parenthesesare the corresponding standard deviations.
the FCM algorithm. When T increases from 6 to 46, the WSS measure increases.This is counterintuitive because we expect WSS to decrease when T increases.The reason we see that WSS decreased when T increased from 6 to 46 is that weused two criteria to terminate the algorithm: δ and Nmax. When T is large, weexpect that it takes the TFCM algorithm more iterations to get the change of theobjective function to be less than δ. Since we terminated the TFCM algorithmwhen the number of iterations reaches Nmax = 1000, the clustering result was stillsuboptimal.
If we compare Table 5(b) and Table 5(f), we see that the TFCM algorithm ismore than 20 times faster than the FCM algorithm. For example, it took the FCMalgorithm about 756 seconds on average to divide the dataset into 200 clusters, but
258 GUOJUN GAN, QIUJUN LAN AND SHIYANG SIMA
it only took the TFCM algorithm about 32 seconds on average to divide the datasetinto 200 clusters.
In summary, the numerical experiments show that the TFCM algorithm outper-formed the FCM algorithm in terms of speed when the desired number of clusters islarge. The accuracy of the TFCM algorithm is close to that of the FCM algorithm.
5. Concluding remarks. In some situations, we need to divide a large datasetinto a large number of clusters. For example, we need to divide millions of web pagesinto thousands of categories [5] and divide a large portfolio of insurance policies intohundreds of clusters in order to select representative policies [11, 13]. Most existingalgorithms are not efficient when used to divide a large dataset into a large numberof clusters.
In this paper, we proposed a truncated fuzzy c-means (TFCM) algorithm toaddress the problem when both the number of data points and the desired numberof clusters are large. The TFCM algorithm is similar to the FCM algorithm inthe initialization phase. However, the TFCM algorithm is different from the FCMalgorithm in the iteration phase where the TFCM algorithm only keeps a subset ofcluster centers for each data point and only calculates the distances between eachdata point and a subset of cluster centers. Our numerical experiments on bothsynthetic and real datasets show that the TFCM algorithm outperforms the FCMalgorithm significantly in terms of speed when the desired number of clusters islarge. In addition, the accuracy of the TFCM algorithm is comparable to that ofthe FCM algorithm.
We implement the TFCM algorithm in a straightforward way according to thepseudo-code given in Algorithm 1. The speed of the TFCM algorithm can befurther improved by using the technique introduced by [23]. This technique allowsus to combine the step of updating the cluster centers and the step of updating thefuzzy memberships into a single step. In future, we would like to incorporate thistechnique into the TFCM algorithm and compare the TFCM algorithm with otheralgorithms mentioned in Section 2.
Acknowledgments. This research was partially supported the National NaturalScience Foundation of China (Grant No.71171076).
REFERENCES
[1] C. C. Aggarwal and C. K. Reddy (eds.), Data Clustering: Algorithms and Applications, CRCPress, Boca Raton, FL, USA, 2014.
[2] D. Arthur and S. Vassilvitskii, k-means++: The advantages of careful seeding, in Proceedings
of the Eighteenth Annual ACM-SIAM Symposium on Discrete Algorithms, SODA ’07, Societyfor Industrial and Applied Mathematics, Philadelphia, PA, USA, 2007, 1027–1035.
[3] J. C. Bezdek, R. Ehrlich and W. Full, FCM: The fuzzy c-means clustering algorithm, Com-puters & Geosciences, 10 (1984), 191–203.
[4] J. Bezdek, Pattern Recognition with Fuzzy Objective Function Algorithms, Kluwer AcademicPublishers, Norwell, MA, USA, 1981.
[5] A. Broder, L. Garcia-Pueyo, V. Josifovski, S. Vassilvitskii and S. Venkatesan, Scalable k-means by ranked retrieval, in Proceedings of the 7th ACM International Conference on Web
Search and Data Mining, WSDM ’14, ACM, 2014, 233–242.[6] R. L. Cannon, J. V. Dave and J. Bezdek, Efficient implementation of the fuzzy c-means
clustering algorithms, IEEE Transactions on Pattern Analysis and Machine Intelligence,
PAMI-8 (1986), 248–255.[7] T. W. Cheng, D. B. Goldgof and L. O. Hall, Fast fuzzy clustering, Fuzzy Sets and Systems,
93 (1998), 49–56.
SCALABLE CLUSTERING BY TRUNCATED FUZZY c-MEANS 259
[8] M. de Souto, I. Costa, D. de Araujo, T. Ludermir and A. Schliep, Clustering cancer geneexpression data: A comparative study, BMC Bioinformatics, 9 (2008), p497.
[9] J. C. Dunn, A fuzzy relative of the ISODATA process and its use in detecting compact
well-separated clusters, Journal of Cybernetics, 3 (1973), 32–57.[10] G. Gan, Data Clustering in C++: An Object-Oriented Approach, Data Mining and Knowl-
edge Discovery Series, Chapman & Hall/CRC Press, Boca Raton, FL, USA, 2011.[11] G. Gan, Application of data clustering and machine learning in variable annuity valuation,
Insurance: Mathematics and Economics, 53 (2013), 795–801.
[12] G. Gan, A multi-asset Monte Carlo simulation model for the valuation of variable annuities,in Proceedings of the Winter Simulation Conference, 2015, 3162–3163.
[13] G. Gan and S. Lin, Valuation of large variable annuity portfolios under nested simulation: A
functional data approach, Insurance: Mathematics and Economics, 62 (2015), 138–150.[14] G. Gan and M. K.-P. Ng, Subspace clustering using affinity propagation, Pattern Recognition,
48 (2015), 1455–1464.
[15] G. Gan and M. K.-P. Ng, Subspace clustering with automatic feature grouping, PatternRecognition, 48 (2015), 3703–3713.
[16] G. Gan, Y. Zhang and D. K. Dey, Clustering by propagating probabilities between data
points, Applied Soft Computing, 41 (2016), 390–399.[17] R. J. Hathaway and J. C. Bezdek, Extending fuzzy and probabilistic clustering to very large
data sets, Computational Statistics & Data Analysis, 51 (2006), 215–234.[18] T. Havens, J. Bezdek, C. Leckie, L. Hall and M. Palaniswami, Fuzzy c-means algorithms for
very large data, IEEE Transactions on Fuzzy Systems, 20 (2012), 1130–1146.
[19] M.-C. Hung and D.-L. Yang, An efficient fuzzy c-means clustering algorithm, in ProceedingsIEEE International Conference on Data Mining, 2001, 225–232.
[20] Z.-X. Ji, Q.-S. Sun and D.-S. Xia, A modified possibilistic fuzzy c-means clustering algorithm
for bias field estimation and segmentation of brain MR image, Computerized Medical Imagingand Graphics, 35 (2011), 383–397.
[21] D. Jiang, C. Tang and A. Zhang, Cluster analysis for gene expression data: A survey, IEEE
Transactions on Knowledge and Data Engineering, 16 (2004), 1370–1386.[22] F. Klawonn, Fuzzy clustering: Insights and a new approach, Mathware & Soft Computing,
11 (2004), 125–142.
[23] J. F. Kolen and T. Hutcheson, Reducing the time complexity of the fuzzy c-means algorithm,IEEE Transactions on Fuzzy Systems, 10 (2002), 263–267.
[24] T. Kwok, K. Smith, S. Lozano and D. Taniar, Parallel fuzzy c- means clustering for large datasets, in Euro-Par 2002 Parallel Processing (eds. B. Monien and R. Feldmann), vol. 2400 of
Lecture Notes in Computer Science, Springer, 2002, 365–374.
[25] H. Liu, F. Zhao and L. Jiao, Fuzzy spectral clustering with robust spatial information forimage segmentation, Applied Soft Computing, 12 (2012), 3636–3647.
[26] J. D. MacCuish and N. E. MacCuish, Clustering in Bioinformatics and Drug Discovery, CRCPress, Boca Raton, FL, 2010.
[27] J. Macqueen, Some methods for classification and analysis of multivariate observations, in
Proceedings of the 5th Berkeley Symposium on Mathematical Statistics andProbability (eds.
L. LeCam and J. Neyman), University of California Press, Berkely, CA, USA, 1 (1967),281–297.
[28] S. A. A. Shalom, M. Dash and M. Tue, Graphics hardware based efficient and scalable fuzzy c-means clustering, in Proceedings of the 7th Australasian Data Mining Conference, 87 (2008),179–186.
[29] A. Stetco, X.-J. Zeng and J. Keane, Fuzzy c-means++: Fuzzy c-means with effective seeding
initalization, Expert Systems with Applications, 42 (2015), 7541– 7548.
Received July 2016; revised August 2016.
E-mail address: [email protected]
E-mail address: [email protected]
E-mail address: [email protected]