Scada market forecast to 2022 by scalar market research
42
1 SCADA Market, by Type (Hardware, Software, Service), Hardware (RTU, PLC, Communication Device, Other Hardware), Service (Consulting, Implementation & Integration, Training & Support), End-users (Public Sector, Manufacturing, Oil & Gas, Energy & Utility, Transportation, Healthcare, Telecom) - Global Revenue, Trends, Growth, Share, Size and Forecast to 2022 November 2016
-
Upload
scalar-market-research -
Category
Business
-
view
18 -
download
1
Transcript of Scada market forecast to 2022 by scalar market research

1
SCADA Market, by Type (Hardware, Software,
Service), Hardware (RTU, PLC, Communication
Device, Other Hardware), Service (Consulting,
Implementation & Integration, Training &
Support), End-users (Public Sector,
Manufacturing, Oil & Gas, Energy & Utility,
Transportation, Healthcare, Telecom) - Global
Revenue, Trends, Growth, Share, Size and
Forecast to 2022
November 2016

2
About Scalar Market Research
Scalar Market Research, Inc. is a Chicago, US-based market research and consulting
firm that serves Fortune 1000 companies, leading businesses and upcoming
organizations from around the world to help them achieve their business goal of
sustainable revenue growth, utilizing Scalar's premium market research reports and
consulting services to make critical strategic decisions.
Our real-time industry data tracking, with the help of advanced analytics and machine
learning, offers our clients highly accurate 360-degree perspective of key
developments in niche markets. Our team of industry experts, with a thorough
understanding of global markets and cumulative industry experience spanning 100+
years, work relentlessly to help our clients realize their most important business goals.
Terms of Use
This report bears a contractual agreement between Scalar Market Research and the
buyer. No part of the content of this report can be shared or published to other
individuals, companies, subsidiaries, divisions, or subdivisions of any organization.
The redistribution of the report in any manner is strictly prohibited without the prior
permission of Scalar Market Research. The publisher will, in turn, regard the privacy
of the purchaser and will keep it confidential. This report is an informative material and
is not meant for managerial, legal or accounting advice. This publication in no case
should be used as an endorsement of any product, a corporate guide or business
manual.
Copyright © 2016 Scalar Market Research, Inc., USA
All Rights Reserved. This document enclosing highly confidential information is the sole
property of Scalar Market Research. No part of this document shall be reproduced, copied,
quoted, circulated, or otherwise shared without prior approval of Scalar Market Research.
SAMPLE
3
Table of Contents
1 MARKET OVERVIEW ...................................................................................................................... 18
1.1 Definitions ............................................................................................................................. 18
1.2 Research Methodology ......................................................................................................... 19
1.2.1 Primary Data ................................................................................................................. 19
1.2.2 Secondary Data ............................................................................................................. 20
1.2.3 Machine Learning .......................................................................................................... 20
1.2.4 Research Scope ............................................................................................................. 21
1.2.5 Years Considered .......................................................................................................... 22
1.2.6 Currency & Pricing......................................................................................................... 22
1.3 Market Segmentation ........................................................................................................... 23
1.4 Key Objectives & Benefits of the Report............................................................................... 24
1.4.1 Objectives of the Report ............................................................................................... 24
1.4.2 Key Benefits of the Report ............................................................................................ 25
2 Executive Summary ....................................................................................................................... 26
2.1.1 Global SCADA Market – Executive Summary ................................................................ 27
3 MARKET DYNAMICS ...................................................................................................................... 28
3.1 Introduction .......................................................................................................................... 28
3.2 Drivers ................................................................................................................................... 28
3.3 Restraints .............................................................................................................................. 29
3.4 Opportunities ........................................................................................................................ 30
3.5 Premium Industry Trends ..................................................................................................... 30
4 INDUSTRY ANALYSIS ...................................................................................................................... 31
4.1 Value Chain Analysis ............................................................................................................. 31
4.2 Evolution of SCADA ............................................................................................................... 32
5 SCADA MARKET, BY TYPE .............................................................................................................. 33
5.1 Overview ............................................................................................................................... 33
5.1.1 Global SCADA Market Share (%), By Type, 2016 & 2022 .............................................. 33
5.1.2 Global SCADA Market Size (US$ million), By Type (2014 – 2022) ................................. 34
5.1.3 Global SCADA Market Size (US$ million), By Type, 2016 & 2022 ................................. 34
SAMPLE

4
5.2 Hardware .............................................................................................................................. 35
5.2.1 Global SCADA Market Size (US$ million) for Hardware, By Region (2014 – 2022) ....... 35
5.2.2 Global SCADA Market Size (US$ million) for Hardware, By Region, 2016 & 2022 ........ 35
5.3 Software ................................................................................................................................ 36
5.3.1 Global SCADA Market Size (US$ million) for Software, By Region (2014 – 2022) ........ 36
5.3.2 Global SCADA Market Size (US$ million) for Software, By Region, 2016 & 2022 ......... 36
5.4 Service ................................................................................................................................... 37
5.4.1 Global SCADA Market Size (US$ million) for Service, By Region (2014 – 2022) ........... 37
5.4.2 Global SCADA Market Size (US$ million) for Service, By Region, 2016 & 2022 ............ 37
6 SCADA MARKET, BY HARDWARE .................................................................................................. 38
6.1 Overview ............................................................................................................................... 38
6.1.1 Global SCADA Market Share (%), By Hardware, 2016 & 2022 ...................................... 38
6.1.2 Global SCADA Market Size (US$ million), By Hardware (2014 – 2022) ........................ 39
6.1.3 Global SCADA Market Size (US$ million), By Hardware, 2016 & 2022 ......................... 39
6.2 RTU ........................................................................................................................................ 40
6.2.1 Global SCADA Market Size (US$ million) for Database RTU, By Region (2014 – 2022) 40
6.2.2 Global SCADA Market Size (US$ million) for RTU, By Region, 2016 & 2022 ................. 40
6.3 PLC ......................................................................................................................................... 41
6.3.1 Global SCADA Market Size (US$ million) for PLC, By Region (2014 – 2022) ................. 41
6.3.2 Global SCADA Market Size (US$ million) for PLC, By Region, 2016 & 2022 .................. 41
6.4 Communication Device ......................................................................................................... 42
6.4.1 Global SCADA Market Size (US$ million) for Communication Device, By Region (2014 –
2022) ....................................................................................................................................... 42
6.4.2 Global SCADA Market Size (US$ million) for Communication Device, By Region, 2016 &
2022 ....................................................................................................................................... 42
6.5 Other Hardware .................................................................................................................... 43
6.5.1 Global SCADA Market Size (US$ million) for Other Hardware, By Region (2014 – 2022)
....................................................................................................................................... 43
6.5.2 Global SCADA Market Size (US$ million) for Other Hardware, By Region, 2016 & 2022 .
....................................................................................................................................... 43
7 SCADA MARKET, BY SERVICE......................................................................................................... 44
7.1 Overview ............................................................................................................................... 44
SAMPLE

5
7.1.1 Global SCADA Market Share (%), By Service, 2016 & 2022 .......................................... 44
7.1.2 Global SCADA Market Size (US$ million), By Service (2014 – 2022) ............................. 45
7.1.3 Global SCADA Market Size (US$ million), By Service, 2016 & 2022 .............................. 45
7.2 Consulting Service ................................................................................................................. 46
7.2.1 Global SCADA Market Size (US$ million) for Consulting Service, By Region (2014 –
2022) ....................................................................................................................................... 46
7.2.2 Global SCADA Market Size (US$ million) for Consulting Service, By Region, 2016 &
2022 ....................................................................................................................................... 46
7.3 Implementation & Integration Service ................................................................................. 47
7.3.1 Global SCADA Market Size (US$ million) for Implementation & Integration Service, By
Region (2014 – 2022) .................................................................................................................... 47
7.3.2 Global SCADA Market Size (US$ million) for Implementation & Integration Service, By
Region, 2016 & 2022 ..................................................................................................................... 47
7.4 Repair & Maintenance Service .............................................................................................. 48
7.4.1 Global SCADA Market Size (US$ million) for Repair & Maintenance Service, By Region
(2014 – 2022) ................................................................................................................................ 48
7.4.2 Global SCADA Market Size (US$ million) for Repair & Maintenance Service, By Region,
2016 & 2022 .................................................................................................................................. 48
8 SCADA MARKET, BY END-USERS ................................................................................................... 49
8.1 Overview ............................................................................................................................... 49
8.1.1 Global SCADA Market Share (%), By End-users, 2016 & 2022 ...................................... 49
8.1.2 Global SCADA Market Size (US$ million), By End-users (2014 – 2022)......................... 50
8.1.3 Global SCADA Market Size (US$ million), By End-users, 2016 & 2022 ......................... 51
8.2 Public Sector ......................................................................................................................... 52
8.2.1 Global SCADA Market Size (US$ million) for Public Sector, By Region (2014 – 2022) .. 52
8.2.2 Global SCADA Market Size (US$ million) for Public Sector, By Region, 2016 & 2022 ... 52
8.3 Manufacturing ...................................................................................................................... 53
8.3.1 Global SCADA Market Size (US$ million) for Manufacturing, By Region (2014 – 2022) ...
....................................................................................................................................... 53
8.3.2 Global SCADA Market Size (US$ million) for Manufacturing, By Region, 2016 & 2022 53
8.4 Oil & Gas................................................................................................................................ 54
8.4.1 Global SCADA Market Size (US$ million) for Oil & Gas, By Region (2014 – 2022) ........ 54
8.4.2 Global SCADA Market Size (US$ million) for Oil & Gas, By Region, 2016 & 2022 ......... 54
SAMPLE

6
8.5 Energy & Utility ..................................................................................................................... 55
8.5.1 Global SCADA Market Size (US$ million) for Energy & Utility, By Region (2014 – 2022) .
....................................................................................................................................... 55
8.5.2 Global SCADA Market Size (US$ million) for Energy & Utility, By Region, 2016 & 2022 ..
....................................................................................................................................... 55
8.6 Transportation ...................................................................................................................... 56
8.6.1 Global SCADA Market Size (US$ million) for Transportation, By Region (2014 – 2022) ...
....................................................................................................................................... 56
8.6.2 Global SCADA Market Size (US$ million) for Transportation, By Region, 2016 & 2022 56
8.7 Telecom ................................................................................................................................. 57
8.7.1 Global SCADA Market Size (US$ million) for Telecom, By Region (2014 – 2022) ......... 57
8.7.2 Global SCADA Market Size (US$ million) for Telecom, By Region, 2016 & 2022 .......... 57
9 SCADA MARKET, BY GEOGRAPHY ................................................................................................. 58
9.1 Overview ............................................................................................................................... 58
9.1.1 Global SCADA Market Share (%), By Geography, 2016 & 2022 .................................... 58
9.1.2 Global SCADA Market Size (US$ million), By Geography (2014 – 2022) ....................... 59
9.1.3 Global SCADA Market Size (US$ million), By Geography, 2016 & 2022 ....................... 59
9.2 North America ....................................................................................................................... 60
9.2.1 North America SCADA Market Share (%), By Country, 2016 & 2022............................ 60
9.2.2 North America SCADA Market Size (US $million), By Country (2014 – 2022) .............. 61
9.2.3 North America SCADA Market Size (US$ million), By Country, 2016 & 2022 ............... 61
9.2.3.1 U.S. ............................................................................................................................ 62
9.2.3.1.1 SCADA Market in U.S., Market Size (US$ million) and Y-o-Y Growth (%) ........... 62
9.2.3.2 Rest of North America ............................................................................................... 62
9.2.3.2.1 SCADA Market in Rest of North America, Market Size (US$ million) and Y-o-Y
Growth (%) ............................................................................................................................ 62
9.2.4 North America SCADA Market Share (%), By Type, 2016 & 2022 ................................. 63
9.2.5 North America SCADA Market Size (US$ million), By Type (2014 – 2022) ................... 63
9.2.6 North America SCADA Market Share (%), By Hardware, 2016 & 2022 ........................ 64
9.2.7 North America SCADA Market Size (US$ million), By Hardware (2014 – 2022) ........... 64
9.2.8 North America SCADA Market Share (%), By Service, 2016 & 2022 ............................. 65
9.2.9 North America SCADA Market Size (US$ million), By Service (2014 – 2022) ................ 65
SAMPLE

7
9.2.10 North America SCADA Market Share (%), By End-users, 2016 & 2022......................... 66
9.2.11 North America SCADA Market Size (US$ million), By End-users (2014 – 2022) ........... 66
9.3 Europe ................................................................................................................................... 67
9.3.1 Europe SCADA Market Share (%), By Country, 2016 & 2022 ........................................ 67
9.3.2 Europe SCADA Market Size (US$ million), By Country (2014 – 2022) .......................... 68
9.3.3 Europe SCADA Market Size (US$ million), By Country, 2016 & 2022 ........................... 68
9.3.3.1 France ........................................................................................................................ 69
9.3.3.1.1 SCADA Market in France, Market Size (US$ million) and Y-o-Y Growth (%) ....... 69
9.3.3.2 Germany .................................................................................................................... 69
9.3.3.2.1 SCADA Market in Germany, Market Size (US$ million) and Y-o-Y Growth (%) ... 69
9.3.3.3 U.K ............................................................................................................................. 69
9.3.3.3.1 SCADA Market in U.K, Market Size (US$ million) and Y-o-Y Growth (%) ............ 69
9.3.3.4 Rest of Europe ........................................................................................................... 70
9.3.3.4.1 SCADA Market in Rest of Europe, Market Size (US$ million) and Y-o-Y Growth
(%) ............................................................................................................................ 70
9.3.4 Europe SCADA Market Share (%), By Type, 2016 & 2022 ............................................. 70
9.3.5 Europe SCADA Market Size (US$ million), By Type (2014 – 2022)................................ 71
9.3.6 Europe SCADA Market Share (%), By Hardware, 2016 & 2022 ..................................... 72
9.3.7 Europe SCADA Market Size (US$ million), By Hardware (2014 – 2022) ....................... 72
9.3.8 Europe SCADA Market Share (%), By Service, 2016 & 2022 ......................................... 73
9.3.9 Europe SCADA Market Size (US$ million), By Service (2014 – 2022) ............................ 73
9.3.10 Europe SCADA Market Share (%), By End-users, 2016 & 2022 ..................................... 74
9.3.11 Europe SCADA Market Size (US$ million), By End-users (2014 – 2022) ....................... 74
9.4 Asia-Pacific ............................................................................................................................ 75
9.4.1 Asia-Pacific SCADA Market Share (%), By Country, 2016 & 2022 ................................. 75
9.4.2 Asia-Pacific SCADA Market Size (US$ million), By Country (2014 – 2022) .................... 76
9.4.3 Asia-Pacific SCADA Market Size (US$ million), By Country, 2016 & 2022 .................... 76
9.4.3.1 China ......................................................................................................................... 77
9.4.3.1.1 SCADA Market in China, Market Size (US$ million) and Y-o-Y Growth (%) ........ 77
9.4.3.2 India........................................................................................................................... 77
9.4.3.2.1 SCADA Market in India, Market Size (US$ million) and Y-o-Y Growth (%).......... 77
SAMPLE

8
9.4.3.3 Japan ......................................................................................................................... 77
9.4.3.3.1 SCADA Market in Japan, Market Size (US$ million) and Y-o-Y Growth (%) ........ 77
9.4.3.4 Rest of Asia-Pacific .................................................................................................... 78
9.4.3.4.1 SCADA Market in Rest of Asia-Pacific, Market Size (US$ million) and Y-o-Y
Growth (%) ............................................................................................................................ 78
9.4.4 Asia-Pacific SCADA Market Share (%), By Type, 2016 & 2022 ...................................... 78
9.4.5 Asia-Pacific SCADA Market Size (US$ million), By Type (2014 – 2022) ......................... 79
9.4.6 Asia-Pacific SCADA Market Share (%), By Hardware, 2016 & 2022 .............................. 79
9.4.7 Asia-Pacific SCADA Market Size (US$ million), By Hardware (2014 – 2022) ................. 80
9.4.8 Asia-Pacific SCADA Market Share (%), By Service, 2016 & 2022 .................................. 80
9.4.9 Asia-Pacific SCADA Market Size (US$ million), By Service (2014 – 2022) ..................... 81
9.4.10 Asia-Pacific SCADA Market Share (%), By End-users, 2016 & 2022 .............................. 81
9.4.11 Asia-Pacific SCADA Market Size (US$ million), By End-users (2014 – 2022) ................. 82
9.5 Latin America ........................................................................................................................ 83
9.5.1 Latin America SCADA Market Share (%), By Country, 2016 & 2022 ............................. 83
9.5.2 Latin America SCADA Market Size (US$ million), By Country (2014 – 2022) ................ 84
9.5.3 Latin America SCADA Market Size (US$ million), By Country, 2016 & 2022 ................ 84
9.5.3.1 Brazil .......................................................................................................................... 85
9.5.3.1.1 SCADA Market in Brazil, Market Size (US$ million) and Y-o-Y Growth (%) ......... 85
9.5.3.2 Rest of Latin America ................................................................................................ 85
9.5.3.2.1 SCADA Market in Rest of Latin America, Market Size (US$ million) and Y-o-Y
Growth (%) ............................................................................................................................ 85
9.5.4 Latin America SCADA Market Share (%), By Type, 2016 & 2022 .................................. 86
9.5.5 Latin America SCADA Market Size (US$ million), By Type (2014 – 2022) ..................... 86
9.5.6 Latin America SCADA Market Share (%), By Hardware, 2016 & 2022 .......................... 87
9.5.7 Latin America SCADA Market Size (US$ million), By Hardware (2014 – 2022) ............. 87
9.5.8 Latin America SCADA Market Share (%), By Service, 2016 & 2022 .............................. 88
9.5.9 Latin America SCADA Market Size (US$ million), By Service (2014 – 2022) ................. 88
9.5.10 Latin America SCADA Market Share (%), By End-users, 2016 & 2022 .......................... 89
9.5.11 Latin America SCADA Market Size (US$ million), By End-users (2014 – 2022) ............. 89
9.6 Middle East & Africa ............................................................................................................. 90
9.6.1 Middle East & Africa SCADA Market Share (%), By Country, 2016 & 2022 .................. 90
SAMPLE

9
9.6.2 Middle East & Africa SCADA Market Size (US$ million), By Country (2014 – 2022) ..... 91
9.6.3 Middle East & Africa SCADA Market Size (US$ million), By Country, 2016 & 2022 ...... 91
9.6.3.1 GCC ............................................................................................................................ 92
9.6.3.1.1 SCADA Market in GCC, Market Size (US$ million) and Y-o-Y Growth (%) ........... 92
9.6.3.2 North Africa ............................................................................................................... 92
9.6.3.2.1 SCADA Market in North Africa, Market Size (US$ million) and Y-o-Y Growth (%) ..
............................................................................................................................ 92
9.6.3.3 South Africa ............................................................................................................... 93
9.6.3.3.1 SCADA Market in South Africa, Market Size (US$ million) and Y-o-Y Growth (%) ..
............................................................................................................................ 93
9.6.3.4 Rest of MEA ............................................................................................................... 93
9.6.3.4.1 SCADA Market in Rest of MEA, Market Size (US$ million) and Y-o-Y Growth (%) ..
............................................................................................................................ 93
9.6.4 Middle East & Africa SCADA Market Share (%), By Type, 2016 & 2022 ....................... 94
9.6.5 Middle East & Africa SCADA Market Size (US$ million), By Type (2014 – 2022) .......... 94
9.6.6 Middle East & Africa SCADA Market Share (%), By Hardware, 2016 & 2022 ............... 95
9.6.7 Middle East & Africa SCADA Market Size (US$ million), By Hardware (2014 – 2022) .. 95
9.6.8 Middle East & Africa SCADA Market Share (%), By Service, 2016 & 2022 .................... 96
9.6.9 Middle East & Africa SCADA Market Size (US$ million), By Service (2014 – 2022) ...... 96
9.6.10 Middle East & Africa SCADA Market Share (%), By End-users, 2016 & 2022 ............... 97
9.6.11 Middle East & Africa SCADA Market Size (US$ million), By End-users (2014 – 2022) .. 97
10 COMPETITIVE LANDSCAPE ............................................................................................................ 98
10.1 Key Player Positioning ........................................................................................................... 98
11 KEY MARKET PLAYERS ................................................................................................................... 99
11.1 Schneider Electric SE ............................................................................................................. 99
11.1.1 Overview ....................................................................................................................... 99
11.1.2 Key Strategies ................................................................................................................ 99
11.1.3 Recent Developments ................................................................................................... 99
11.2 Siemens AG ......................................................................................................................... 100
11.2.1 Overview ..................................................................................................................... 100
11.2.2 Key Strategies .............................................................................................................. 100
11.2.3 Recent Developments ................................................................................................. 100
SAMPLE

10
11.3 ABB Ltd. ............................................................................................................................... 101
11.3.1 Overview ..................................................................................................................... 101
11.3.2 Key Strategies .............................................................................................................. 101
11.3.3 Recent Developments ................................................................................................. 101
11.4 General Electric ................................................................................................................... 102
11.4.1 Overview ..................................................................................................................... 102
11.4.2 Key Strategies .............................................................................................................. 102
11.4.3 Recent Developments ................................................................................................. 102
11.5 IBM Corporation ................................................................................................................. 103
11.5.1 Overview ..................................................................................................................... 103
11.5.2 Key Strategies .............................................................................................................. 103
11.5.3 Recent Developments ................................................................................................. 103
11.6 Alstom ................................................................................................................................. 104
11.6.1 Overview ..................................................................................................................... 104
11.6.2 Key Strategies .............................................................................................................. 104
11.6.3 Recent Developments ................................................................................................. 104
11.7 Cisco Systems, Inc. .............................................................................................................. 105
11.7.1 Overview ..................................................................................................................... 105
11.7.2 Key Strategies .............................................................................................................. 105
11.7.3 Recent Developments ................................................................................................. 105
11.8 Rockwell Automation Inc. ................................................................................................... 106
11.8.1 Overview ..................................................................................................................... 106
11.8.2 Key Strategies .............................................................................................................. 106
11.8.3 Recent Developments ................................................................................................. 106
11.9 Omron Corporation ............................................................................................................. 107
11.9.1 Overview ..................................................................................................................... 107
11.9.2 Key Strategies .............................................................................................................. 107
11.9.3 Recent Developments ................................................................................................. 107
12 SCALAR 360 DEGREE MARKET PERSPECTIVE .............................................................................. 108
13 Appendix ..................................................................................................................................... 109
13.1 Acronyms ............................................................................................................................ 109
SAMPLE
11
13.2 Related Reports ................................................................................................................... 109
SAMPLE

12
List of Tables
Table 1. Definitions ......................................................................................................................... 18
Table 2. Global SCADA Market – Executive Summary .................................................................... 27
Table 3. Global SCADA Market Drivers ........................................................................................... 28
Table 4. Global SCADA Market Restraints ...................................................................................... 29
Table 5. Global SCADA Market Size (US$ million), By Type (2014 – 2022) ..................................... 34
Table 6. Global SCADA Market Size (US$ million) for Hardware, By Region (2014 – 2022) ........... 35
Table 7. Global SCADA Market Size (US$ million) for Software, By Region (2014 – 2022) ............ 36
Table 8. Global SCADA Market Size (US$ million) for Service, By Region (2014 – 2022) ............... 37
Table 9. Global SCADA Market Size (US$ million), By Hardware (2014 – 2022) ............................ 39
Table 10. Global SCADA Market Size (US$ million) for RTU, By Region (2014 – 2022) .................... 40
Table 11. Global SCADA Market Size (US$ million) for PLC, By Region (2014 – 2022) ..................... 41
Table 12. Global SCADA Market Size (US$ million) for Communication Device, By Region (2014 –
2022) ........................................................................................................................................... 42
Table 13. Global SCADA Market Size (US$ million) for Other Hardware, By Region (2014 – 2022) 43
Table 14. Global SCADA Market Size (US$ million), By Service (2014 – 2022) ................................. 45
Table 15. Global SCADA Market Size (US$ million) for Consulting Service, By Region (2014 – 2022) .
........................................................................................................................................... 46
Table 16. Global SCADA Market Size (US$ million) for Implementation & Integration Service, By
Region (2014 – 2022) ............................................................................................................................ 47
Table 17. Global SCADA Market Size (US$ million) for Repair & Maintenance Service, By Region
(2014 – 2022) ........................................................................................................................................ 48
Table 18. Global SCADA Market Size (US$ million), By End-users (2014 – 2022)............................. 50
Table 19. Global SCADA Market Size (US$ million) for Public Sector, By Region (2014 – 2022) ...... 52
Table 20. Global SCADA Market Size (US$ million) for Manufacturing, By Region (2014 – 2022) ... 53
Table 21. Global SCADA Market Size (US$ million) for Oil & Gas, By Region (2014 – 2022) ............ 54
Table 22. Global SCADA Market Size (US$ million) for Energy & Utility, By Region (2014 – 2022) . 55
Table 23. Global SCADA Market Size (US$ million) for Transportation, By Region (2014 – 2022) ... 56
Table 24. Global SCADA Market Size (US$ million) for Telecom, By Region (2014 – 2022) ............. 57
Table 25. Global SCADA Market Size (US$ million), By Geography (2014 – 2022) ........................... 59
Table 26. North America SCADA Market Size (US$ million), By Country (2014 – 2022) .................. 61
Table 27. SCADA Market in U.S., Market Size (US$ million) and Y-o-Y Growth (%) ......................... 62
SAMPLE
13
Table 28. SCADA Market in Rest of North America, Market Size (US$ million) and Y-o-Y Growth (%)
........................................................................................................................................... 62
Table 29. North America SCADA Market Size (US$ million), By Type (2014 – 2022) ....................... 63
Table 30. North America SCADA Market Size (US$ million), By Hardware (2014 – 2022) ............... 64
Table 31. North America SCADA Market Size (US$ million), By Service (2014 – 2022) .................... 65
Table 32. North America SCADA Market Size (US$ million), By End-users (2014 – 2022) ............... 66
Table 33. Europe SCADA Market Size (US$ million), By Country (2014 – 2022) .............................. 68
Table 34. SCADA Market in France, Market Size (US$ million) and Y-o-Y Growth (%) ..................... 69
Table 35. SCADA Market in Germany, Market Size (US$ million) and Y-o-Y Growth (%) ................. 69
Table 36. SCADA Market in U.K, Market Size (US$ million) and Y-o-Y Growth (%) .......................... 69
Table 37. SCADA Market in Rest of Europe, Market Size (US$ million) and Y-o-Y Growth (%) ........ 70
Table 38. Europe SCADA Market Size (US$ million), By Type (2014 – 2022).................................... 71
Table 39. Europe SCADA Market Size (US$ million), By Hardware (2014 – 2022) ........................... 72
Table 40. Europe SCADA Market Size (US$ million), By Service (2014 – 2022) ................................ 73
Table 41. Europe SCADA Market Size (US$ million), By End-users (2014 – 2022) ........................... 74
Table 42. Asia-Pacific SCADA Market Size (US$ million), By Country (2014 – 2022) ........................ 76
Table 43. SCADA Market in China, Market Size (US$ million) and Y-o-Y Growth (%)....................... 77
Table 44. SCADA Market in India, Market Size (US$ million) and Y-o-Y Growth (%) ........................ 77
Table 45. SCADA Market in Japan, Market Size (US$ million) and Y-o-Y Growth (%) ...................... 77
Table 46. SCADA Market in Rest of Asia-Pacific, Market Size (US$ million) and Y-o-Y Growth (%) . 78
Table 47. Asia-Pacific SCADA Market Size (US$ million), By Type (2014 – 2022) ............................. 79
Table 48. Asia-Pacific SCADA Market Size (US$ million), By Hardware (2014 – 2022) ..................... 80
Table 49. Asia-Pacific SCADA Market Size (US$ million), By Service (2014 – 2022) ......................... 81
Table 50. Asia-Pacific SCADA Market Size (US$ million), By End-users (2014 – 2022) ..................... 82
Table 51. Latin America SCADA Market Size (US$ million), By Country (2014 – 2022) .................... 84
Table 52. SCADA Market in Brazil, Market Size (US$ million) and Y-o-Y Growth (%) ....................... 85
Table 53. SCADA Market in Rest of Latin America, Market Size (US$ million) and Y-o-Y Growth (%) .
........................................................................................................................................... 85
Table 54. Latin America SCADA Market Size (US$ million), By Type (2014 – 2022) ......................... 86
Table 55. Latin America SCADA Market Size (US$ million), By Hardware (2014 – 2022) ................. 87
Table 56. Latin America SCADA Market Size (US$ million), By Service (2014 – 2022) ..................... 88
Table 57. Latin America SCADA Market Size (US$ million), By End-users (2014 – 2022) ................. 89
SAMPLE
14
Table 58. Middle East & Africa SCADA Market Size (US$ million), By Country (2014 – 2022) ......... 91
Table 59. SCADA Market in GCC, Market Size (US$ million) and Y-o-Y Growth (%) ......................... 92
Table 60. SCADA Market in North Africa, Market Size (US$ million) and Y-o-Y Growth (%) ............ 92
Table 61. SCADA Market in South Africa, Market Size (US$ million) and Y-o-Y Growth (%) ............ 93
Table 62. SCADA Market in Rest of MEA, Market Size (US$ million) and Y-o-Y Growth (%) ............ 93
Table 63. Middle East & Africa SCADA Market Size (US$ million), By Type (2014 – 2022) .............. 94
Table 64. Middle East & Africa SCADA Market Size (US$ million), By Hardware (2014 – 2022) ...... 95
Table 65. Middle East & Africa SCADA Market Size (US$ million), By Service (2014 – 2022) .......... 96
Table 66. Middle East & Africa SCADA Market Size (US$ million), By End-users (2014 – 2022) ...... 97
Table 67. List of Acronyms .............................................................................................................. 109
SAMPLE

15
List of Figures
Research Methodology ..................................................................................................... 21
SCADA Market, By Type .................................................................................................... 23
SCADA Market, By Hardware ............................................................................................ 23
SCADA Market, By Service ................................................................................................ 23
SCADA Market, By End-users ............................................................................................ 24
SCADA Market, By Region ................................................................................................. 24
SCADA Value Chain Analysis ............................................................................................. 31
Evolution of SCADA Architecture ...................................................................................... 32
Global SCADA Market Share (%), By Type, 2016 & 2022 .................................................. 33
Global SCADA Market Size (US$ million), By Type, 2016 & 2022 ................................. 34
Global SCADA Market Size (US$ million) for Hardware, By Region, 2016 & 2022 ........ 35
Global SCADA Market Size (US$ million) for Software, By Region, 2016 & 2022 ......... 36
Global SCADA Market Size (US$ million) for Service, By Region, 2016 & 2022 ............ 37
Global SCADA Market Share (%), By Hardware, 2016 & 2022 ...................................... 38
Global SCADA Market Size (US$ million), By Hardware, 2016 & 2022 ......................... 39
Global SCADA Market Size (US$ million) for RTU, By Region, 2016 & 2022 ................. 40
Global SCADA Market Size (US$ million) for PLC, By Region, 2016 & 2022 .................. 41
Global SCADA Market Size (US$ million) for Communication Device, By Region, 2016 &
2022 ....................................................................................................................................... 42
Global SCADA Market Size (US$ million) for Other Hardware, By Region, 2016 & 2022 .
....................................................................................................................................... 43
Global SCADA Market Share (%), By Service, 2016 & 2022 .......................................... 44
Global SCADA Market Size (US$ million), By Service, 2016 & 2022 .............................. 45
Global SCADA Market Size (US$ million) for Consulting Service, By Region, 2016 &
2022 ....................................................................................................................................... 46
Global SCADA Market Size (US$ million) for Implementation & Integration Service, By
Region, 2016 & 2022 ............................................................................................................................. 47
Global SCADA Market Size (US$ million) for Repair & Maintenance Service, By Region,
2016 & 2022 ....................................................................................................................................... 48
Global SCADA Market Share (%), By End-users, 2016 & 2022 ...................................... 49
Global SCADA Market Size (US$ million), By End-users, 2016 & 2022 ......................... 51
SAMPLE
16
Global SCADA Market Size (US$ million) for Public Sector, By Region, 2016 & 2022 ... 52
Global SCADA Market Size (US$ million) for Manufacturing, By Region, 2016 & 2022 53
Global SCADA Market Size (US$ million) for Oil & Gas, By Region, 2016 & 2022 ......... 54
Global SCADA Market Size (US$ million) for Energy & Utility, By Region, 2016 & 2022 ..
....................................................................................................................................... 55
Global SCADA Market Size (US$ million) for Transportation, By Region, 2016 & 2022 56
Global SCADA Market Size (US$ million) for Telecom, By Region, 2016 & 2022 .......... 57
Global SCADA Market Share (%), By Geography, 2016 & 2022 .................................... 58
Global SCADA Market Size (US$ million), By Geography, 2016 & 2022 ....................... 59
North America SCADA Market Share (%), By Country, 2016 & 2022............................ 60
North America SCADA Market Size (US$ million), By Country, 2016 & 2022 ............... 61
North America SCADA Market Share (%), By Type, 2016 & 2022) ............................... 63
North America SCADA Market Share (%), By Hardware, 2016 & 2022 ........................ 64
North America SCADA Market Share (%), By Service, 2016 & 2022 ............................. 65
North America SCADA Market Share (%), By End-users, 2016 & 2022......................... 66
Europe SCADA Market Share (%), By Country, 2016 & 2022 ........................................ 67
Europe SCADA Market Size (US$ million), By Country, 2016 & 2022 ........................... 68
Europe SCADA Market Share (%), By Type, 2016 & 2022) ............................................ 70
Europe SCADA Market Share (%), By Hardware, 2016 & 2022 ..................................... 72
Europe SCADA Market Share (%), By Service, 2016 & 2022 ......................................... 73
Europe SCADA Market Share (%), By End-users, 2016 & 2022 ..................................... 74
Asia-Pacific SCADA Market Share (%), By Country, 2016 & 2022 ................................. 75
Asia-Pacific SCADA Market Size (US$ million), By Country, 2016 & 2022 .................... 76
Asia-Pacific SCADA Market Share (%), By Type, 2016 & 2022) ..................................... 78
Asia-Pacific SCADA Market Share (%), By Hardware, 2016 & 2022 .............................. 79
Asia-Pacific SCADA Market Share (%), By Service, 2016 & 2022 .................................. 80
Asia-Pacific SCADA Market Share (%), By End-users, 2016 & 2022 .............................. 81
Latin America SCADA Market Share (%), By Country, 2016 & 2022 ............................. 83
Latin America SCADA Market Size (US$ million), By Country, 2016 & 2022 ................ 84
Latin America SCADA Market Share (%), By Type, 2016 & 2022) ................................. 86
Latin America SCADA Market Share (%), By Hardware, 2016 & 2022 .......................... 87
SAMPLE

17
Latin America SCADA Market Share (%), By Service, 2016 & 2022 .............................. 88
Latin America SCADA Market Share (%), By End-users, 2016 & 2022 .......................... 89
Middle East & Africa SCADA Market Share (%), By Country, 2016 & 2022 .................. 90
Middle East & Africa SCADA Market Size (US$ million), By Country, 2016 & 2022 ...... 91
Middle East & Africa SCADA Market Share (%), By Type, 2016 & 2022) ...................... 94
Middle East & Africa SCADA Market Share (%), By Hardware, 2016 & 2022 ............... 95
Middle East & Africa SCADA Market Share (%), By Service, 2016 & 2022 .................... 96
Middle East & Africa SCADA Market Share (%), By End-users, 2016 & 2022 ............... 97
SCADA Market Key Player Positioning .......................................................................... 98
SAMPLE

18
1 MARKET OVERVIEW
1.1 Definitions
The ‘SCADA Market – Global Revenue, Trends, Growth, Share, Size and Forecast to
2022' report includes market size and forecast estimates for the period 2014 to 2022.
The report segments the market based on type, hardware, service and regions. The
report includes market size and forecast estimates for all market segments in the study
period. The report has 2015 as the base year, 2014 as the historical year, and 2016
to 2022 as the forecast period.
Table 1. Definitions
Segment Definition
Public Sector
This sector includes local, regional and international government,
public administration, defense & military and government-owned
educational institutes and media.
Manufacturing Sector
This sector includes companies involved in construction, discrete
manufacturing, process manufacturing business. Also, it includes
resource industries such as agriculture, fuel extraction and mining
organizations.
Healthcare Sector
This sector comprises general hospitals, specialty hospitals, clinics,
physicians offering ambulatory services, and at-home services. Also, it
includes nursing and residential care units and university hospitals.
Energy & Utility Sector Organizations covering broad social necessities such as power supply,
oil & gas and water are covered in this sector.
Transportation
This sector includes air transport, pipelines, motor freight, rail and
water, transportation authorities, and courier & logistics service
providers
Source: Scalar Market Research Analysis
SAMPLE

19
1.2 Research Methodology
We utilize a mix of primary research, secondary research and machine learning
algorithms to generate comprehensive data about market sizes and revenue
forecasts. Our primary focus on continuous market tracking, rigorous fact-checking,
data-triangulation, and multiple layers of quality control ensures high-quality data that
can be leveraged for actionable research insights.
1.2.1 Primary Data
Structured interviews with industry specialists, VPs, CEOs, directors, technology
consultants were taken in order to collect the key primary data. The primary data is
focused on both the demand and supply sides of the market. Market Engineering has
been carried out from the data and excessive analysis has been done on it. Primary
data is also extensively considered while validating the secondary data.
Perspective Primary Research
Supply Side
Manufacturers
Wholesalers
Distributors
Demand Side End-users
Consumers
Report Parameters Primary Sources
Key Industry Participants (KPIs)
Suppliers
Government Agencies
Regulatory Bodies
Research & Development Companies
Investment Research Companies
Business Consulting Service Providers
Academic Institutions/Universities
Venture Capitalists
SAMPLE

20
1.2.2 Secondary Data
The data from important secondary sources is utilized to obtain industry supply chains,
company profiles and other key areas such as market drivers, opportunities, trends
from the market perspective. In addition, secondary data is gathered using paid
databases such as Bloomberg, Hoovers, Factiva, and government publishing sources.
Report Parameters Perspective Secondary Research
Market Size, Revenue,
Industry Analysis, Value
Chain Analysis,
Technology Roadmap,
Premium Industry
Trends, End-users
Analysis, Market
Segmentation,
Geographic Analysis, Key
Market Players,
Competitive Landscape
Supply Side
Company Annual Reports
SEC Filings
Financial Journals
Trade Journals
Market Journals
Press Releases
Directories
White Papers
Company Websites
Magazines
Demand Side Case Studies
Customer References
1.2.3 Machine Learning
In addition to assigning weights to all the relevant market parameters, to quantify their
market impact for generating projected market growth rate, we use advanced machine
learning algorithms to collate essential market data. The machine learning method
utilizes algorithms such as regression, correlation and decision tree, among others, to
derive the desired output.
SAMPLE

21
Perspective Advantages of Machine Learning-based Forecasts
Using Machine Learning for
Data Forecast
Unlimited Data
Highly Detailed Forecasts
Profound Knowledge of Demand
Broad applicability
Customizable Model Identifies Drivers
Analysis - Product, Value Chain, Supply Chain,
Competitor
1.2.4 Research Scope
We have utilized the top-down, bottom-up approach to study the market size, industry
dynamics, key regional markets, and major market trends. The global market has been
estimated by integrating the regional markets, estimating the market data for the base
year 2014 and annual share and revenue forecasts to 2022 in USD.
Research Methodology
Global
Market Size
Market-specific Revenues of Key Players
Total Revenues of Key Players
Global Market Size
Segment-specific Market Size
Regional
Market
Size
Bottom-up
Top-down
SAMPLE

22
1.2.5 Years Considered
Market Specifics Report Scope
Historical Year 2014
Base Year 2015
Estimated Year 2016
Forecast Period 2016-2022
Revenue Currency USD
1.2.6 Currency & Pricing
The currency used in the report is the U.S. dollar, with market size indicated in USD
million and USD billion.
Revenue is obtained from the annual company reports (For all the companies
reporting their revenue in USD)
Revenue is converted as per the annual currency exchange rate for that
particular year (For the companies reporting their revenue in currencies other
than USD)
SAMPLE
23
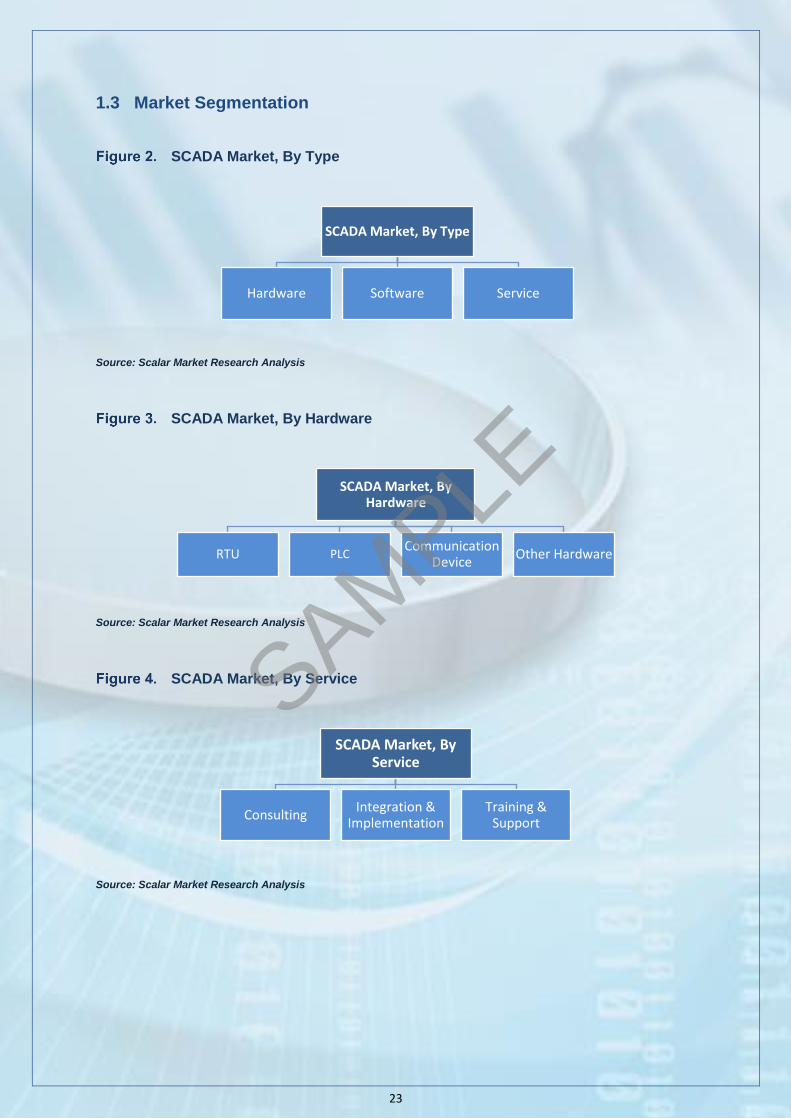
1.3 Market Segmentation
SCADA Market, By Type
Source: Scalar Market Research Analysis
SCADA Market, By Hardware
Source: Scalar Market Research Analysis
SCADA Market, By Service
Source: Scalar Market Research Analysis
SCADA Market, By Type
Hardware Software Service
SCADA Market, By Hardware
RTU PLCCommunication
DeviceOther Hardware
SCADA Market, By Service
ConsultingIntegration &
ImplementationTraining &
Support
SAMPLE

24
SCADA Market, By End-users
Source: Scalar Market Research Analysis
SCADA Market, By Region
Source: Scalar Market Research Analysis
1.4 Key Objectives & Benefits of the Report
1.4.1 Objectives of the Report
To offer in-depth information about the key market drivers and restraints
influencing the growth of this market during the forecast period
To analyze the major challenges and opportunities expected to play crucial role
in the revenue and market size growth of the key players in this market
To forecast the market size, in terms of the market size and revenue for all its
segments with respect to the major geographic regions including North
America, Europe, Asia-Pacific, Middle East & Africa, and Latin America
To comprehensively analyze the strategic developments such as mergers &
acquisitions, new product launches, business expansions, and the new
business agreements in the SCADA market
SCADA Market, By End-Users
Public Sector Oil & Gas Manufacturing HealthcareEnergy &
UtilityTransportaion Telecom
SCADA Market, By Region
North America Europe Latin America Asia-PacificMiddle East &
Africa
SAMPLE

25
To define the high-growth segments of the market and offer in-depth analysis
of the competitive landscape in the market for various key players
1.4.2 Key Benefits of the Report
In-depth analysis of the market segments that will showcase the greatest
growth potential
Deeper understanding of the behavior of the key players and innovators
influencing this market
Granular understanding of the historical market trend and the resultant market
forecast
Information about the technological advancements influencing the growth of the
global market
Extensive evaluation of all the market dynamics that will impact this market
during the forecast period
SAMPLE
26
2 EXECUTIVE SUMMARY
The objective of this report is to describe the market trends and revenue forecasts for
the SCADA market for the next six years. The report focuses on defining and
describing the key influencing factors for the growth of the market. It also offers an in-
depth analysis of the market size (revenue), market share, major market segments,
different geographic regions, key market players, and premium industry trends.
The report tracks the major market events including product launches, technological
developments, mergers & acquisitions, and the innovative business strategies opted
by key market players. Along with strategically analyzing the key micro-markets, the
report also focuses on industry-specific drivers, restraints, and opportunities in the
SCADA market. The scope of this report covers the SCADA market by its major
segments, which include the type, hardware, service, end-users, and the major
geographic regions.
The key market players profiled in this report are ABB Ltd., Rockwell Automation Inc.,
Siemens AG, Alstom, General Electric, Omron Corporation, Cisco Systems, Inc., IBM
Corporation, and Schneider Electric SE.
SAMPLE
27
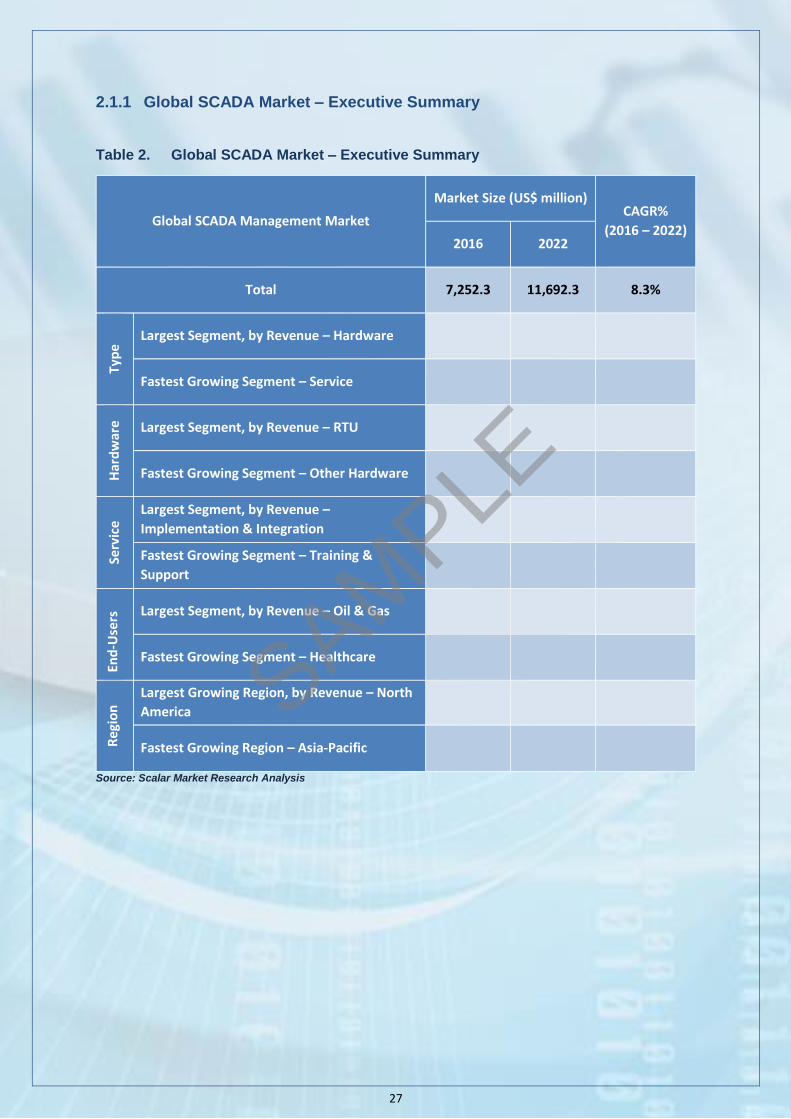
2.1.1 Global SCADA Market – Executive Summary
Table 2. Global SCADA Market – Executive Summary
Global SCADA Management Market
Market Size (US$ million) CAGR%
(2016 – 2022) 2016 2022
Total 7,252.3 11,692.3 8.3%
Typ
e
Largest Segment, by Revenue – Hardware
Fastest Growing Segment – Service
Har
dw
are Largest Segment, by Revenue – RTU
Fastest Growing Segment – Other Hardware
Serv
ice
Largest Segment, by Revenue –
Implementation & Integration
Fastest Growing Segment – Training &
Support
End
-Use
rs Largest Segment, by Revenue – Oil & Gas
Fastest Growing Segment – Healthcare
Re
gio
n
Largest Growing Region, by Revenue – North
America
Fastest Growing Region – Asia-Pacific
Source: Scalar Market Research Analysis
SAMPLE

28
3 MARKET DYNAMICS
3.1 Introduction
SCADA (supervisory control and data acquisition) is a type of control system that
includes hardware architecture, software architecture and service architecture. This
system uses networked devices, computers, RTUs, and graphical user-interface to
communicate with process machinery and plant to gather relevant data. It ensures
control and monitoring of process plant and equipment in real-time to avoid system
downtime. SCADA systems and solutions are increasingly deployed in major end-user
verticals such as oil & gas, manufacturing and public sector. Also, it is finding its
application in medical devices and transportation sector.
3.2 Drivers
Table 3. Global SCADA Market Drivers
Drivers 2014 – 16 2017 – 19 2020 – 22
Growing Demand of Renewable Energy in the
Energy & Utility Sector is Increasing the Uptake of
SCADA systems ●
◑
●
Source: Scalar Market Research Analysis
Note: ●= Very High Impact, ◕= High Impact, ◑= Medium Impact, ◔= Low Impact
SAMPLE

29
3.3 Restraints
Table 4. Global SCADA Market Restraints
Restraints 2014 –
16
2017 –
19
2020 –
22
Threat of Data Privacy and Security ◕ ◑ Source: Scalar Market Research Analysis
Note: ●= Very High Impact, ◕= High Impact, ◑= Medium Impact, ◔= Low Impact
SAMPLE

31
4 INDUSTRY ANALYSIS
4.1 Value Chain Analysis
Value chain of the global SCADA market comprises the following participants:
Hardware Providers
SCADA Solution & Service Providers
End-users
SCADA Value Chain Analysis
Source: Scalar Market Research Analysis
Hardware Provider
SCADA Software & Service Providers
End-user
Hardware providers offer communication
and other devices such as RTUs, PLCs
and other connected devices
Delivers SCADA solutions and
services such as consulting,
integration and implementation
Includes organizations
operating in oil & gas, manufacturing and public sectors
etc.
General Electric, Rockwell Automation,
AT&T etc.
IBM Corporation, Schneider Electric,
Alstom etc.SAM
PLE
33
5 SCADA MARKET, BY TYPE
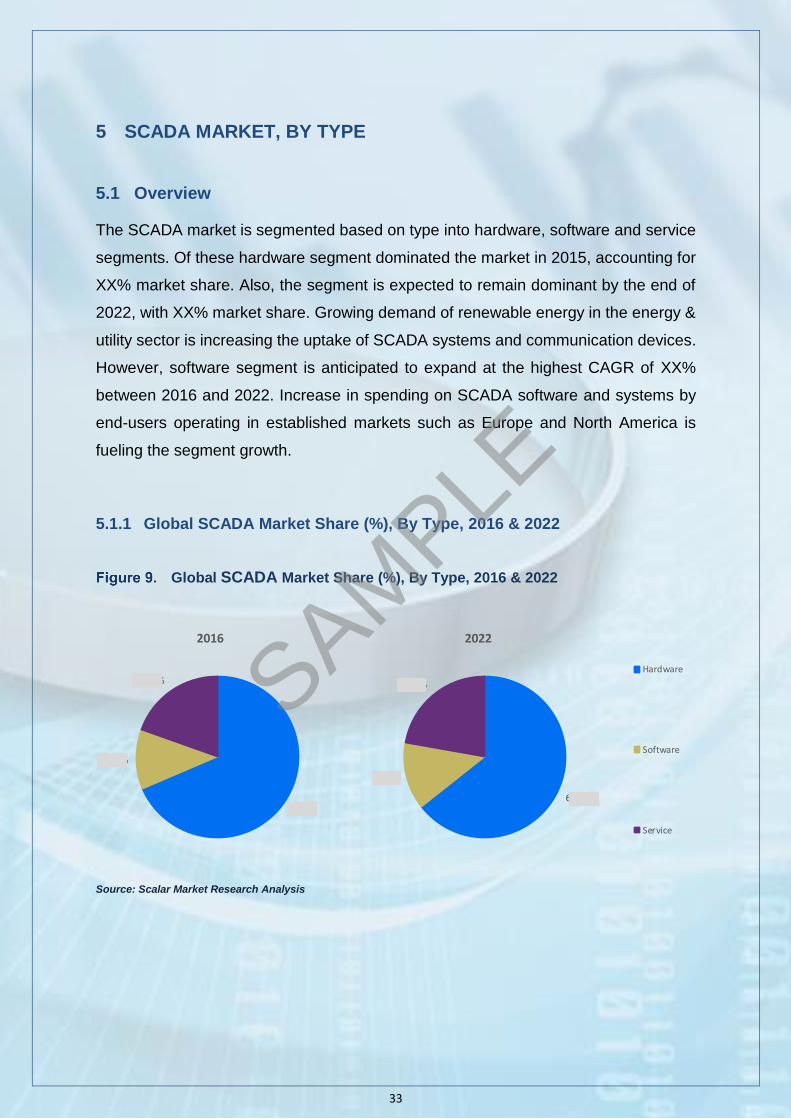
5.1 Overview
The SCADA market is segmented based on type into hardware, software and service
segments. Of these hardware segment dominated the market in 2015, accounting for
XX% market share. Also, the segment is expected to remain dominant by the end of
2022, with XX% market share. Growing demand of renewable energy in the energy &
utility sector is increasing the uptake of SCADA systems and communication devices.
However, software segment is anticipated to expand at the highest CAGR of XX%
between 2016 and 2022. Increase in spending on SCADA software and systems by
end-users operating in established markets such as Europe and North America is
fueling the segment growth.
5.1.1 Global SCADA Market Share (%), By Type, 2016 & 2022
Global SCADA Market Share (%), By Type, 2016 & 2022
Source: Scalar Market Research Analysis
68.6%
11.9%
19.5%
2016
64.4%
13.5%
22.1%
2022
Hardware
Software
Service
SAMPLE

34
5.1.2 Global SCADA Market Size (US$ million), By Type (2014 – 2022)
Table 5. Global SCADA Market Size (US$ million), By Type (2014 – 2022)
Type 2014 2015 2016 2017 2018 2019 2020 2021 2022 CAGR%
(2016 – 2022)
Hardware
Software
Service
Total 8.3%
Source: Scalar Market Research Analysis
5.1.3 Global SCADA Market Size (US$ million), By Type, 2016 & 2022
Global SCADA Market Size (US$ million), By Type, 2016 & 2022
Source: Scalar Market Research Analysis
4,973.2
864.0 1,415.1
7,529.0
1,581.0
2,582.4
Hardware Software Service
US$
Mill
ion
2016 2022
SAMPLE
38
6 SCADA MARKET, BY HARDWARE
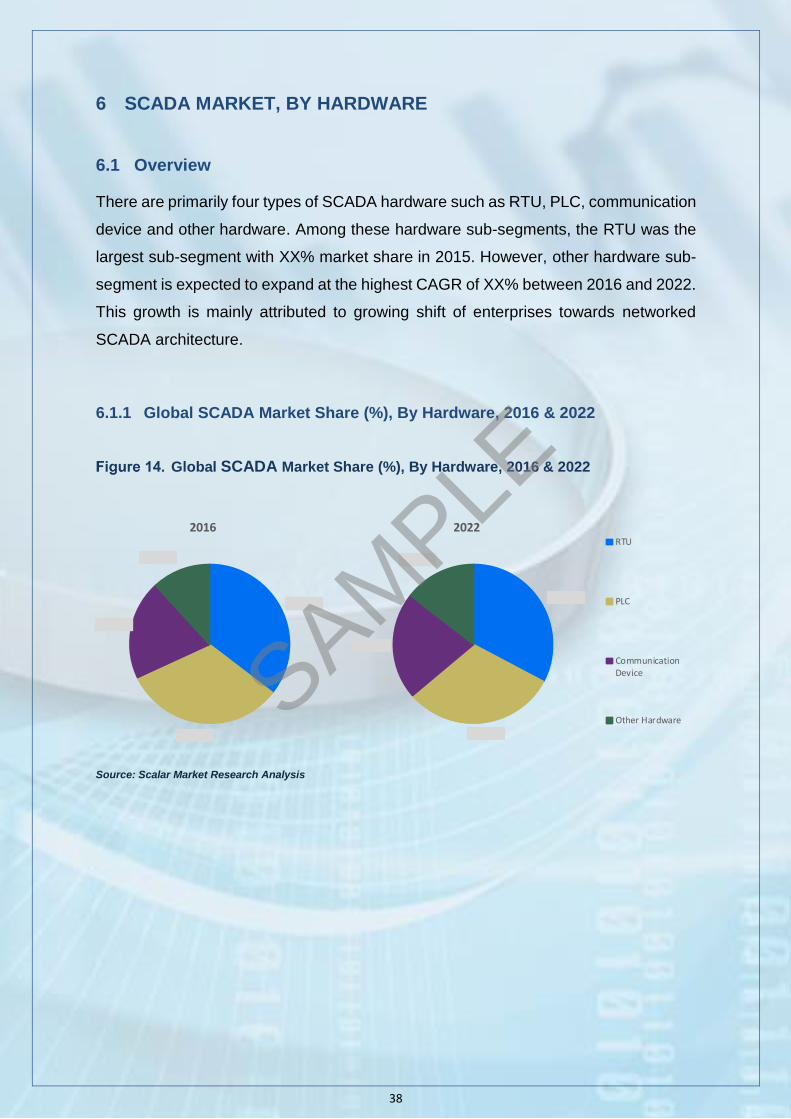
6.1 Overview
There are primarily four types of SCADA hardware such as RTU, PLC, communication
device and other hardware. Among these hardware sub-segments, the RTU was the
largest sub-segment with XX% market share in 2015. However, other hardware sub-
segment is expected to expand at the highest CAGR of XX% between 2016 and 2022.
This growth is mainly attributed to growing shift of enterprises towards networked
SCADA architecture.
6.1.1 Global SCADA Market Share (%), By Hardware, 2016 & 2022
Global SCADA Market Share (%), By Hardware, 2016 & 2022
Source: Scalar Market Research Analysis
35.5%
32.5%
20.1%
11.9%
2016
32.9%
30.8%
21.9%
14.4%
2022RTU
PLC
CommunicationDevice
Other HardwareSAMPLE
39
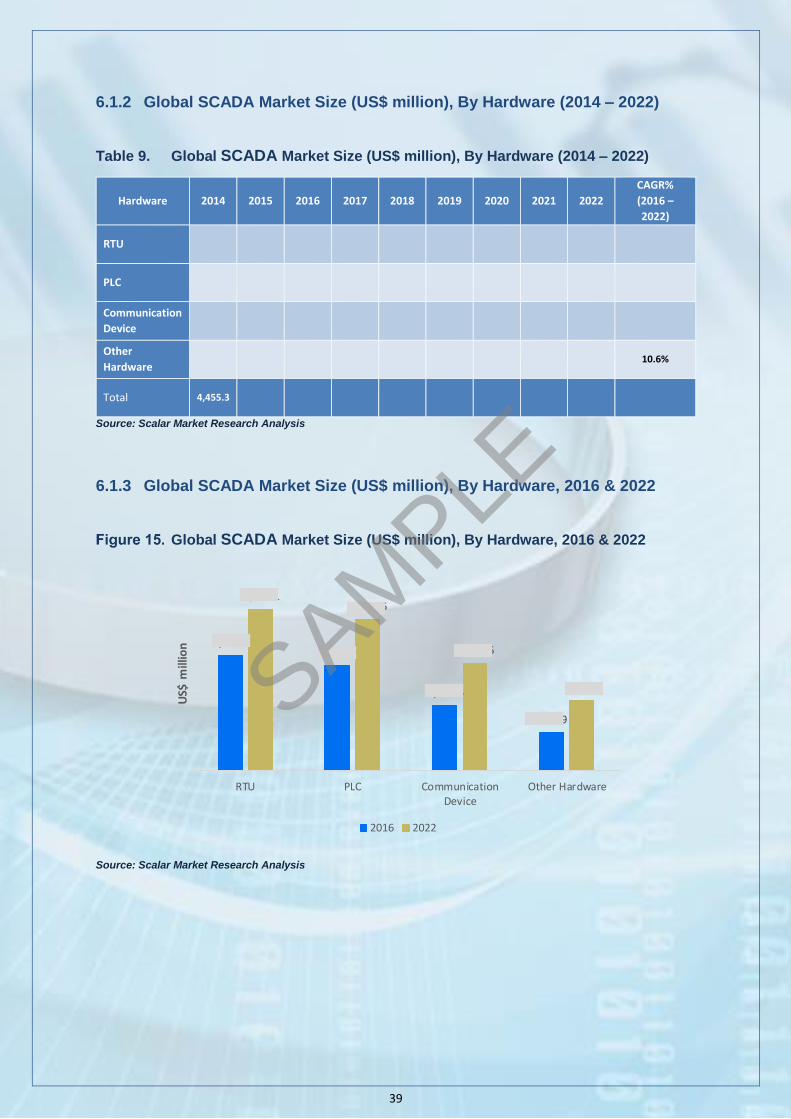
6.1.2 Global SCADA Market Size (US$ million), By Hardware (2014 – 2022)
Table 9. Global SCADA Market Size (US$ million), By Hardware (2014 – 2022)
Hardware 2014 2015 2016 2017 2018 2019 2020 2021 2022
CAGR%
(2016 –
2022)
RTU
PLC
Communication
Device
Other
Hardware 10.6%
Total 4,455.3
Source: Scalar Market Research Analysis
6.1.3 Global SCADA Market Size (US$ million), By Hardware, 2016 & 2022
Global SCADA Market Size (US$ million), By Hardware, 2016 & 2022
Source: Scalar Market Research Analysis
1,764.6 1,616.0
1,000.6
591.9
2,476.1 2,317.6
1,649.5
1,085.9
RTU PLC CommunicationDevice
Other Hardware
US$
mill
ion
2016 2022
SAMPLE

49
8 SCADA MARKET, BY END-USERS
8.1 Overview
The market is segmented based on end-users into public sector, oil & gas,
manufacturing, healthcare, energy & utility, transportation, and telecom. Among these,
oil & gas was the largest end-users segment with XX% market share in 2015, followed
by manufacturing sector, accounting for XX% market share. Oil & gas companies are
increasingly investing on advanced SCADA solutions and services to enhance real-
time tracking and management of critical process equipment and machinery, and
eliminate unscheduled equipment downtime to ensure uninterrupted production
operations. The healthcare end-users segment is expected to grow at the highest
CAGR of XX% over the forecast period.
8.1.1 Global SCADA Market Share (%), By End-users, 2016 & 2022
Global SCADA Market Share (%), By End-users, 2016 & 2022
Source: Scalar Market Research Analysis
12.6%
21.9%
30.7%
12.0%
8.9%
7.6%
6.3%
2016
12.6%
21.2%
27.7%
12.8%
9.1%
9.2%
7.4%
2022Public Sector
Manufacturing
Oil & Gas
Energy & Utility
Transportation
Healthcare
Telecom
SAMPLE

50
8.1.2 Global SCADA Market Size (US$ million), By End-users (2014 – 2022)
Table 18. Global SCADA Market Size (US$ million), By End-users (2014 – 2022)
End-users 2014 2015 2016 2017 2018 2019 2020 2021 2022
CAGR%
(2016 –
2022)
Public Sector 8.3%
Manufacturing
Oil & Gas
Energy &
Utility
Transportation
Healthcare
Telecom
Total 11,692.3
Source: Scalar Market Research Analysis
SAMPLE

58
9 SCADA MARKET, BY GEOGRAPHY
9.1 Overview
The market has been segmented by major geographies into North America, Europe,
Asia-Pacific, Latin America, and Middle East & Africa. Among these regions, North
America dominated the global SCADA market in 2015 and accounted for XX% market
share. Also, the region is anticipated to remain dominant over the forecast period.
Additionally, Asia-Pacific is projected to grow at the highest CAGR of XX% between
2016 and 2022. This is mainly attributed to the growing awareness regarding benefits
of SCADA systems and software among end-users in the region. Emerging markets
in the region are China, India and Brazil.
9.1.1 Global SCADA Market Share (%), By Geography, 2016 & 2022
Global SCADA Market Share (%), By Geography, 2016 & 2022
Source: Scalar Market Research Analysis
34.8%
28.3%
17.4%
8.5%
11.0%
2016
30.3%
27.3%
20.7%
9.3%
12.4%
2022North America
Europe
Asia-Pacific
Latin America
Middle East & Africa
SAMPLE

59
9.1.2 Global SCADA Market Size (US$ million), By Geography (2014 – 2022)
Table 25. Global SCADA Market Size (US$ million), By Geography (2014 – 2022)
Geography 2014 2015 2016 2017 2018 2019 2020 2021 2022
CAGR%
(2016 –
2022)
North
America 5.9%
Europe
Asia-
Pacific
Latin
America
Middle
East &
Africa
Total 6,762.0 11,692.3 8.3%
Source: Scalar Market Research Analysis
9.1.3 Global SCADA Market Size (US$ million), By Geography, 2016 & 2022
Global SCADA Market Size (US$ million), By Geography, 2016 & 2022
Source: Scalar Market Research Analysis
2,521.1
2,050.5
1,265.2
619.8 795.6
3,546.3
3,195.1
2,423.7
1,083.0
1,444.2
North America Europe Asia-Pacific Latin America Middle East &Africa
US$
mill
ion
2016 2022
SAMPLE
60
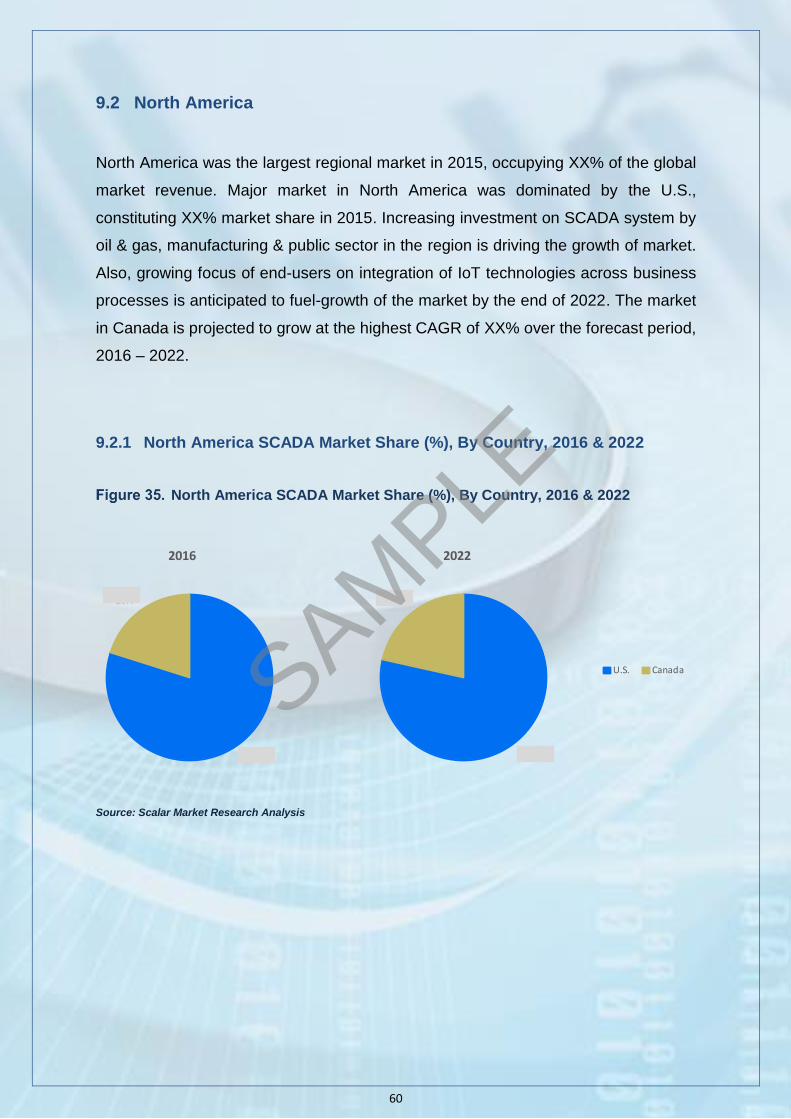
9.2 North America
North America was the largest regional market in 2015, occupying XX% of the global
market revenue. Major market in North America was dominated by the U.S.,
constituting XX% market share in 2015. Increasing investment on SCADA system by
oil & gas, manufacturing & public sector in the region is driving the growth of market.
Also, growing focus of end-users on integration of IoT technologies across business
processes is anticipated to fuel-growth of the market by the end of 2022. The market
in Canada is projected to grow at the highest CAGR of XX% over the forecast period,
2016 – 2022.
9.2.1 North America SCADA Market Share (%), By Country, 2016 & 2022
North America SCADA Market Share (%), By Country, 2016 & 2022
Source: Scalar Market Research Analysis
80%
20%
2016
79%
21%
2022
U.S. CanadaSAMPLE
61
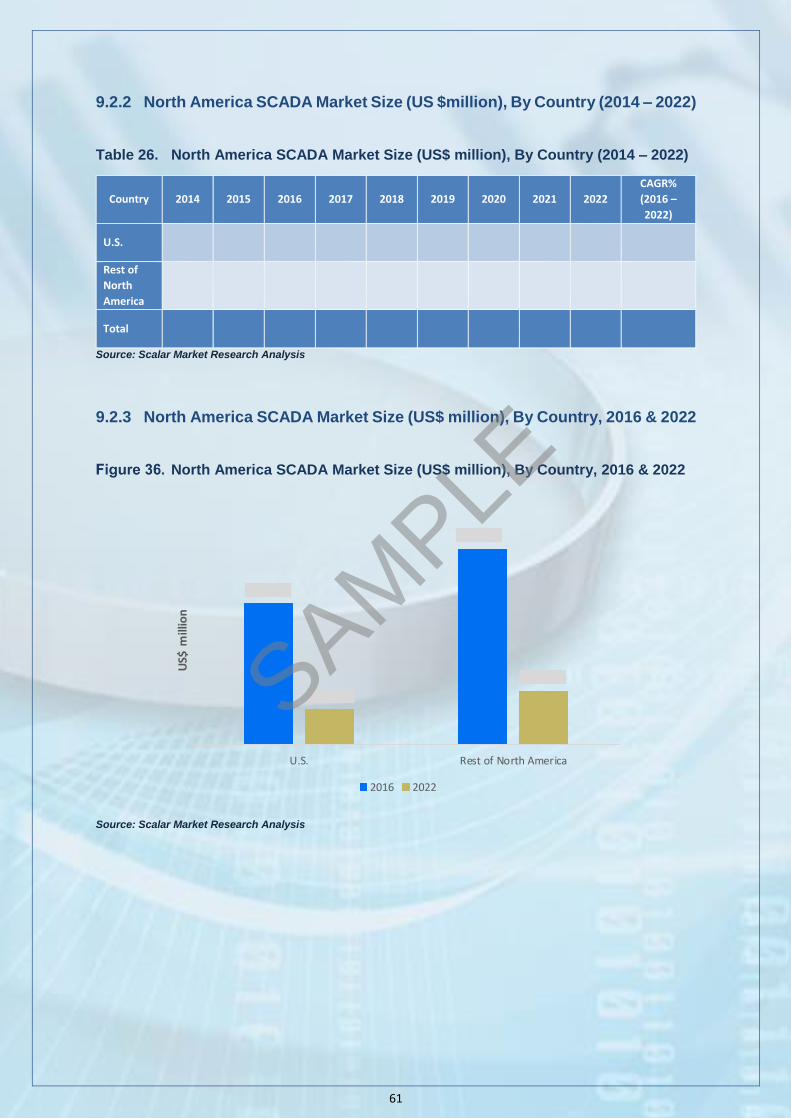
9.2.2 North America SCADA Market Size (US $million), By Country (2014 – 2022)
Table 26. North America SCADA Market Size (US$ million), By Country (2014 – 2022)
Country 2014 2015 2016 2017 2018 2019 2020 2021 2022
CAGR%
(2016 –
2022)
U.S.
Rest of
North
America
Total
Source: Scalar Market Research Analysis
9.2.3 North America SCADA Market Size (US$ million), By Country, 2016 & 2022
North America SCADA Market Size (US$ million), By Country, 2016 & 2022
Source: Scalar Market Research Analysis
2,011.9
2,785.3
509.2
761.0
U.S. Rest of North America
US$
mill
ion
2016 2022
SAMPLE

98
10 COMPETITIVE LANDSCAPE
10.1 Key Player Positioning
SCADA Market Key Player Positioning
Source: Scalar Market Research Analysis
Schneider Electric SE Siemens AG ABB Ltd.
General Electric IBM Corporation Alstom
Cisco System Inc. Rockwell Automation Inc. Omron Corporation
Medium High
Me
diu
mH
igh
Low
Low
Ma
rke
tR
ea
ch
Product Diversification
(The size of the bubble represents Strategic Investment)
SAMPLE

109
13 Appendix
13.1 Acronyms
Table 67. List of Acronyms
Acronym Expansion
CAGR Compound Annual Growth Rate
RTU Remote Terminal / Telemetry Unit
PLC Programmable Logic Controller
HMI Human Machine Interface
MEA Middle East & Africa
APAC Asia-Pacific
GCC Gulf Cooperation Council
Source: Scalar Market Research Analysis
13.2 Related Reports
Smart Grid Market, by Type (Solution, Service), Solution (Advanced Metering
Infrastructure, Smart Grid Distribution Management, Smart Grid
Communication, Grid Asset Management, Other Solutions), Service
(Consulting, Implementation & Integration, Repair & Maintenance) - Global
Revenue, Trends, Growth, Share, Size and Forecast to 2022
Smart Cities Market, by Type (Solution, Service), Application (Government &
Education, Transportation, Infrastructure, Energy, Security & Disaster
Management, Healthcare) - Global Revenue, Trends, Growth, Share, Size and
Forecast to 2022
Internet of Things (IoT) Security Market, by Types (Application, Network,
Cloud), Solutions (Threat Security, Data Loss Management, Device
Management, Service Protection, Encryption, Unified Threat Management),
Services (Specialized, Managed), End-users (Home Automation, Wearables,
Patient Monitoring Management, Energy Management, Asset Management,
Communication Management, Manufacturing Process Tracking, Supply Chain
SAMPLE