SC2.13 Saibai Island maps - Torres Strait Island Region - Schedule 2 - SC2.13... · NATURAL...
11
Torres Strait Island Regional Council Planning Scheme Page 681 Schedule 2: Mapping SC2.13 Saibai Island maps
Transcript of SC2.13 Saibai Island maps - Torres Strait Island Region - Schedule 2 - SC2.13... · NATURAL...
Torres Strait Island Regional Council
Planning SchemePage 681
Schedule 2: Mapping
SC2.13 Saibai Island maps

Torres Strait Island Regional Council
Planning SchemePage 682
This page is intentionally left blank.

Zenadth KesPlanning Scheme:
Planning Scheme forThe Torres Strait IslandRegional Council Area
BOUNDARIES AND FEATURESDirection to the nearest Island sWaterwaysRoadLGA
PAPUA NEW GUINEA
Saibai
Location Map
Strateg ic Fram ework Map – Saibai Island
´0 100 200
Kilom etres
Kuki (NW Wind s - January to April)Sag er (SE Wind s - May to Decem ber)
KUKI
SAGER
PATTERN OF LAND USETownsh ipEnv ironm ental Manag em ent and Conserv ation
NATURAL ENVIRONMENTCrabDug ongFish ing AreaTurtle
FUTURE FACILITIES, INFRASTRUCTURE AND ACTIVITIES
AquacultureInd icativ e Future Location for Sea Wall Ind icative Future Location for Bund Wall Possible Future Housing Inv estig ation AreaTownsh ip Expansion
0 1,000 2,000500Metres °
Projection:GDA 1994 MGA Zone 54 Datum:GDA 1994
Updated: 17/12/2015
1:75,000Approx. Scale @A3
EXISTING FACILITIES AND INFRASTRUCTUREGard en Sacred Site
LEGEND
Data Sources:Unless stated below all land use, road , or natural feature d ata sh ownis from the Strateg ic Land use Plan (SLUP) by th e RPS Group 2010.Com m unity Consultation 2013:Local Nam es, Places and id entified fac ilitiesQ ueensland Dept. Natural Resources and Env ironm ent:Im ag ery,LGA Bound aries, Terrain data and Flood ing layersAECOM:all strateg ic fram ework, zoning and local area plan d ata is m od ifiedfrom the SLUP and DNRM source data.Main Map Base Im ag ery:BING Serv ice (c) Harris Corp, Earth star Geog raph ic s, LLC Earth starGeog raph ic s SIO @ Microsoft Corporation 2014Location Map Base Data:World Street Map @ ESRI Online. Sources:Sources: Esri, HERE, DeLorm e,USGS, Interm ap, increm ent P Corp., NRCAN, Esri Japan, METI, Esri Ch ina(Hong Kong ), Esri (Th ailand ), Tom Tom , Mapm yInd ia, © OpenStreetMapc ontributors, and th e GIS User Com m unityDisclaimer:AECOM does not warrant the accuracy or completeness of information displayed in this mapand any person using it does so at their own risk. AECOM shall bear no responsibility orliability for any errors, faults, defects, or omissions in the information. Where not part of theDCDB, internal lot boundaries have been derived based on visible occupation of land from2011,2012 and 2013 orthorectified aerial imagery and CAD Detail Survey. They should notbe considered spatially accurate (Derived Lot Boundary)

HOLY TRINITY CHURCH(State Heritage Building)
DADAMUDH
ZARAI
SAWIKA POINT
ADADA GIZU
BoiguIsland
IamaIsland
Dauan
Island
PNG
Zenadth KesPlanning Scheme:
Planning Scheme forThe Torres Strait IslandRegional Council Area
BOUNDARIES AND FEATURESDirection to the ne are st IslandsWaterwaysRoadLGA
PAPUA NEW GUINEA
Saibai
Location Map
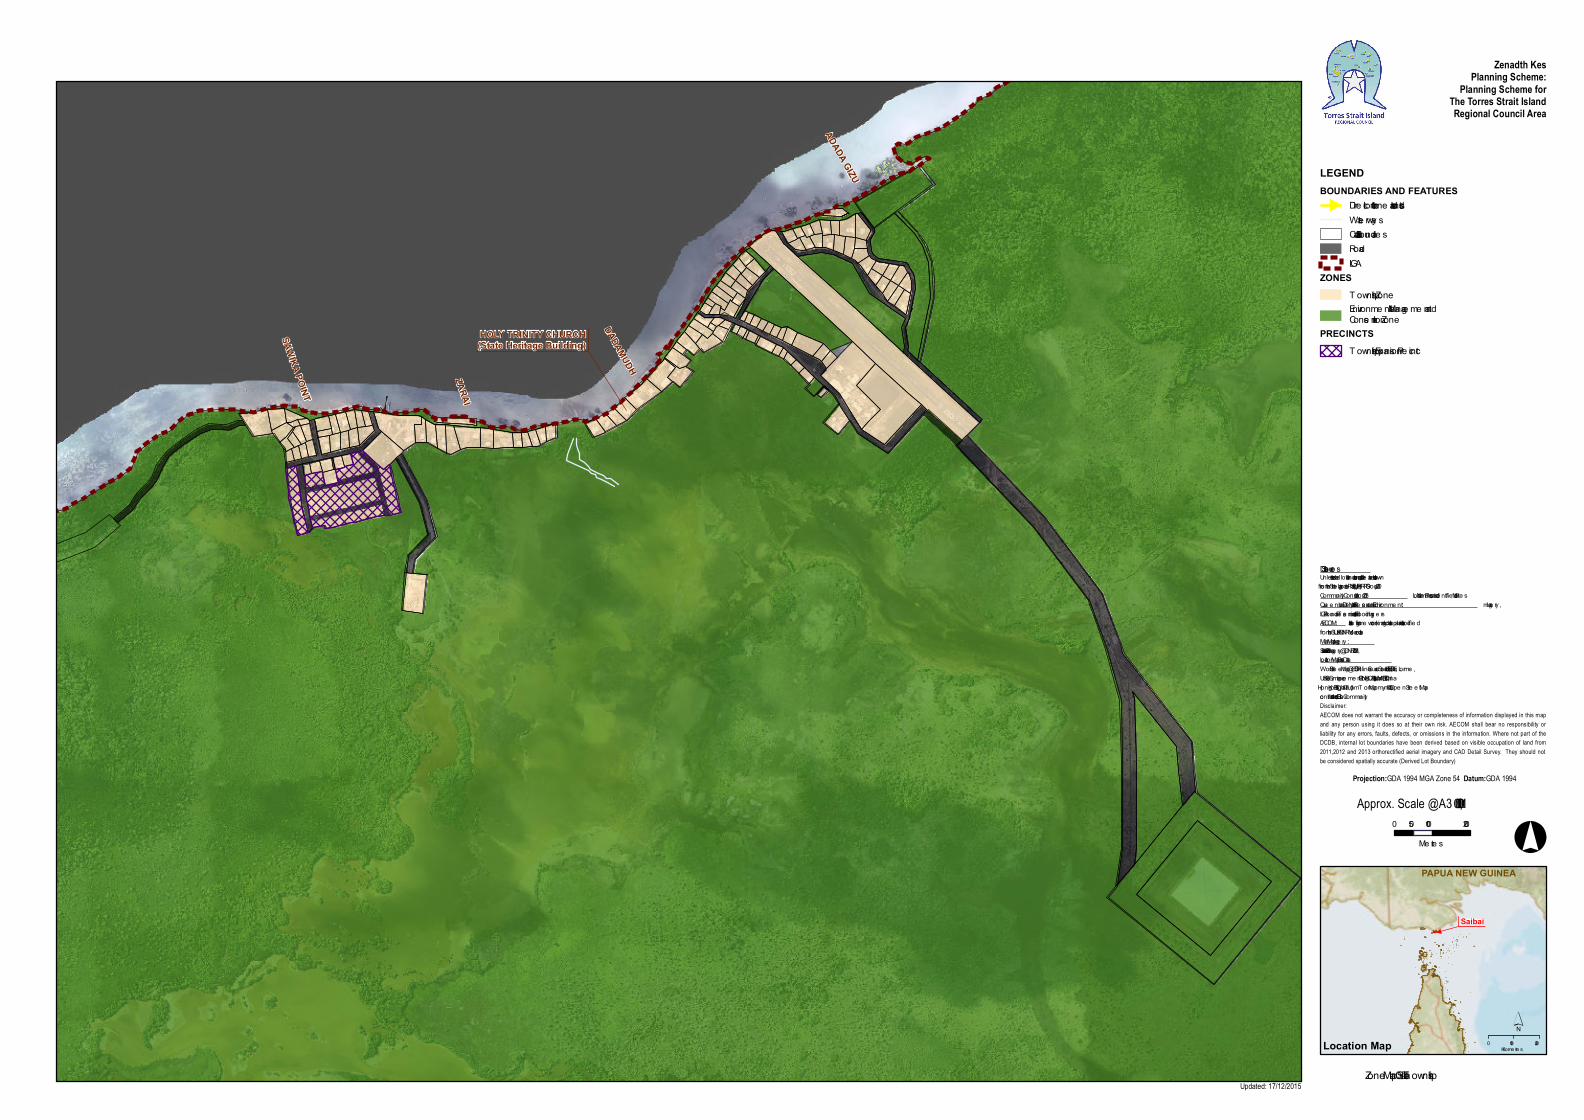
S trategic Framework Map – S aibai Township
´0 100 200
Kilometre s
Kuk i (NW Winds - January to April)S age r (S E Winds - May to Dece mber)
KUKI
SAGER
PATTERN OF LAND USETownshipEnvironme ntal Manageme nt and Conse rvation
FUTURE FACILITIES, INFRASTRUCTURE ANDACTIVITIES
AquacultureIndicative Future Location for S e a Wall Indicative Future Location for Bund Wall Possible Future Housing Inve stigation AreaTownship Ex pansion
EXISTING FACILITIES AND INFRASTRUCTUREAirstripBarge RampCeme teryChild Care FacilityChurchCommunity HallEle ctricity InfrastructureGarde n
Health Ce ntreIBIS S toreS choolS e wer InfrastructureTS IRC BuildingsWaste FacilityWater S upply Infrastructure
LEGEND
0 100 20050Metre s °
Projection:GDA 1994 MGA Zone 54 Datum:GDA 1994
Updated: 17/12/2015
1:10,000Approx. Scale @A3
NATURAL ENVIRONMENTCrab Turtle
Data S ource s:Unle ss stated be low all landuse, road, or natural feature data shownis from the S trategic Landuse Plan (S LUP) by the RPS Group 2010.Community Consultation 2013:Local Name s, Place s and ide ntifie d facilitie sQue e nsland De pt. Natural Re source s and Environme nt:Imagery,LGA Boundarie s, Terrain data and Flooding laye rsAECOM:all strate gic frame work, zoning and local area plan data is modifie dfrom the S LUP and DNRM source data.Main Map Image ry:S aibai Island 25cm Imagery @ DNRM, 2013Location Map Base Data:World S tre et Map @ ES RI Online . S ource s:S ource s: Esri, HERE, DeLorme,US GS , Inte rmap, increme nt P Corp., NRCAN, Esri Japan, METI, Esri China(Hong Kong), Esri (Thailand), TomTom, MapmyIndia, © Ope nS tre etMapcontributors, and the GIS Use r CommunityDisclaimer:AECOM does not warrant the accuracy or completeness of information displayed in this mapand any person using it does so at their own risk. AECOM shall bear no responsibility orliability for any errors, faults, defects, or omissions in the information. Where not part of theDCDB, internal lot boundaries have been derived based on visible occupation of land from2011,2012 and 2013 orthorectified aerial imagery and CAD Detail Survey. They should notbe considered spatially accurate (Derived Lot Boundary)

Zenadth KesPlanning Scheme:
Planning Scheme forThe Torres Strait IslandRegional Council Area
LEGENDBOUNDARIES AND FEATURES
Direction to th e nearest IslandsWaterwaysCadastral BoundariesRoadLGA
PAPUA NEW GUINEA
Saibai
Location Map
Zone Map – Saibai Island
´0 100 200
Kilom etres
0 1 20.5Kilom etres °
Projection:GDA 1994 MGA Zone 54 Datum:GDA 1994
Updated: 12/08/2015
1:75,000Approx. Scale @A3
ZONESTownsh ip ZoneEnv ironm ental Manag em ent and Conservation Zone
PRECINCTSTownsh ip Expansion Precinct
KUKI
SAGER
Kuki (NW Winds - January to April)Sager (SE Winds - May to Decem ber)
Data Sources:Unless stated b elow all landuse, road, or natural feature data sh ownis from th e Strategic Landuse Plan (SLUP) b y th e RPS Group 2010.Com m unity Consultation 2013:Local Nam es, Places and identified facilitiesQ ueensland Dept. Natural Resources and Env ironm ent:Im agery,LGA Boundaries, Terrain data and Flooding layersAECOM:all strateg ic fram ework, zoning and local area plan data is m odifiedfrom th e SLUP and DNRM source data.Jam es Cook Univ ersity:Coastal Hazard and Coastal Innundation wh eresh own.Erosion Prone Areas:@ State of Q ueensland (Departm ent of Env ironm entand Heritage Protection), 2014Bush fire Prone Area:@ Pub lic Safety Business Ag ency (PSBA), Q LDGovernm ent, 2014Main Map Base Im ag ery:BING Service (c) Harris Corp, Earth star Geog raph ics, LLC Earth starGeograph ic s SIO @ Microsoft Corporation 2014Location Map Base Data:World Street Map @ ESRI Online. Sources:Sources: Esri, HERE, DeLorm e,USGS, Interm ap, increm ent P Corp., NRCAN, Esri Japan, METI, Esri Ch ina(Hong Kong), Esri (Th ailand), Tom Tom , Mapm yIndia, © OpenStreetMapcontrib utors, and th e GIS User Com m unityDisclaimer:AECOM does not warrant the accuracy or completeness of information displayed in this mapand any person using it does so at their own risk. AECOM shall bear no responsibility orliability for any errors, faults, defects, or omissions in the information. Where not part of theDCDB, internal lot boundaries have been derived based on visible occupation of land from2011,2012 and 2013 orthorectified aerial imagery and CAD Detail Survey. They should notbe considered spatially accurate (Derived Lot Boundary)
HOLY TRINITY CHURCH(State Heritage Building)
DADAMUDH
ZARAI
SAWIKA POINT
ADADA GIZU
Zenadth KesPlanning Scheme:
Planning Scheme forThe Torres Strait IslandRegional Council Area
LEGENDBOUNDARIES AND FEATURES
Direction to the ne arest IslandsWate rway sCadastral Boundarie sRoadLGA
ZONEST ownship ZoneEnvironme ntal Manageme nt and Conse rvation Zone
PRECINCTST ownship Expansion Precinct
PAPUA NEW GUINEA
Saibai
Location Map
Zone Map – Saibai T ownship
´0 100 200
Kilome tre s
0 100 20050Me tre s °
Projection:GDA 1994 MGA Zone 54 Datum:GDA 1994
Updated: 17/12/2015
1:10,000Approx. Scale @A3
Data Sources:Unle ss stated be low all landuse, road, or natural fe ature data shownis from the Strategic Landuse Plan (SLUP) by the RPS Group 2010.Community Consultation 2013:Local Name s, Place s and ide ntifie d facilitie sQue e nsland De pt. Natural Re sources and Environme nt:Image ry,LGA Boundarie s, T e rrain data and Flooding lay e rsAECOM:all strate gic frame work, zoning and local area plan data is modifie dfrom the SLUP and DNRM source data.Main Map Image ry :Saibai Island 25cm Image ry @ DNRM, 2013Location Map Base Data:World Stre e t Map @ ESRI Online . Source s:Source s: Esri, HERE, DeLorme,USGS, Inte rmap, increme nt P Corp., NRCAN, Esri Japan, MET I, Esri China(Hong Kong), Esri (T hailand), T omT om, MapmyIndia, © Ope nStre e tMapcontributors, and the GIS Use r CommunityDisclaimer:AECOM does not warrant the accuracy or completeness of information displayed in this mapand any person using it does so at their own risk. AECOM shall bear no responsibility orliability for any errors, faults, defects, or omissions in the information. Where not part of theDCDB, internal lot boundaries have been derived based on visible occupation of land from2011,2012 and 2013 orthorectified aerial imagery and CAD Detail Survey. They should notbe considered spatially accurate (Derived Lot Boundary)

Zenadth KesPlanning Scheme:
Planning Scheme forThe Torres Strait IslandRegional Council Area
LEGENDBOUNDARIES AND FEATURES
Direction to th e nearest IslandsBOUNDARIES AND FEATURES
WaterwaysCadastral BoundariesRoadLGA
PAPUA NEW GUINEA
Saibai
Location MapLocal Area Plan Map: Gog ob ith iay (land, sea and sky) – Saibai Island
´0 100 200
Kilom etres
Kuki (NW Winds - January to April)Sager (SE Winds - May to Decem ber)
KUKI
SAGER
GOGOBITHIAY - LAND, SEA and SKYHig h Env ironm ental ValueModerate Env ironm ental ValueLow Env ironm ental Value
0 1 20.5Kilom etres °
Projection:GDA 1994 MGA Zone 54 Datum:GDA 1994
Updated: 12/08/2015
1:75,000Approx. Scale @A3
Data Sources:Unless stated b elow all landuse, road, or natural feature data sh ownis from th e Strategic Landuse Plan (SLUP) b y th e RPS Group 2010.Com m unity Consultation 2013:Local Nam es, Places and identified facilitiesQ ueensland Dept. Natural Resources and Env ironm ent:Im agery,LGA Boundaries, Terrain data and Flooding layersAECOM:all strateg ic fram ework, zoning and local area plan data is m odifiedfrom th e SLUP and DNRM source data.Jam es Cook Univ ersity:Coastal Hazard and Coastal Innundation wh eresh own.Erosion Prone Areas:@ State of Q ueensland (Departm ent of Env ironm entand Heritage Protection), 2014Bush fire Prone Area:@ Pub lic Safety Business Ag ency (PSBA), Q LDGovernm ent, 2014Main Map Base Im ag ery:BING Service (c) Harris Corp, Earth star Geog raph ics, LLC Earth starGeograph ic s SIO @ Microsoft Corporation 2014Location Map Base Data:World Street Map @ ESRI Online. Sources:Sources: Esri, HERE, DeLorm e,USGS, Interm ap, increm ent P Corp., NRCAN, Esri Japan, METI, Esri Ch ina(Hong Kong), Esri (Th ailand), Tom Tom , Mapm yIndia, © OpenStreetMapcontrib utors, and th e GIS User Com m unityDisclaimer:AECOM does not warrant the accuracy or completeness of information displayed in this mapand any person using it does so at their own risk. AECOM shall bear no responsibility orliability for any errors, faults, defects, or omissions in the information. Where not part of theDCDB, internal lot boundaries have been derived based on visible occupation of land from2011,2012 and 2013 orthorectified aerial imagery and CAD Detail Survey. They should notbe considered spatially accurate (Derived Lot Boundary)

Zenadth KesPlanning Scheme:
Planning Scheme forThe Torres Strait IslandRegional Council Area
LEGEND
BOUNDARIES AND FEATURES
Direction to the nearest Islands
BOUNDARIES AND FEATURES
Waterways
Cadastral Boundaries
Road
LGA
PAPUA NEW GUINEA
Saibai
Location Map
Local Area Plan Map - Natural HazardsLandslide, Acid Sulfate Soils, Bushfire
Saibai Island
´0 100 200
Kilometres
Kuki (NW Winds - January to April)
Sager (SE Winds - May to December)
KUKI
SAGER
NATURAL HAZARDS
Landslide Hazard
Bushfire Prone Areas
Medium Hazard
Potential Bushfire Impact Buffer
Potential Acid Sulphate Soils
Land Below 5m AHD
Land Above 5m and Below 20m AHD
0 1 20.5
Kilometres°
Projection:GDA 1994 MGA Zone 54 Datum:GDA 1994
Updated: 10/12/2015
Data Sources:Unless stated below all landuse, road, or natural feature data shown
is from the Strategic Landuse Plan (SLUP) by the RPS Group 2010.
Community Consultation 2013: Local Names, Places and identified facilities
Queensland Dept. Natural Resources and Environment: Imagery,
LGA Boundaries, Terrain data and Flooding layers
AECOM: all strategic framework, zoning and local area plan data is modified
from the SLUP and DNRM source data.
James Cook University: Coastal Hazard and Coastal Innundation where
shown.
Erosion Prone Areas: @ State of Queensland (Department of Environment
and Heritage Protection), 2014
Bushfire Prone Area: @ Public Safety Business Agency (PSBA), QLD
Government, 2014
Main Map Base Imagery:
BING Service (c) Harris Corp, Earthstar Geographics, LLC Earthstar
Geographics SIO @ Microsoft Corporation 2014
Location Map Base Data:
World Street Map @ ESRI Online. Sources:Sources: Esri, HERE, DeLorme,
USGS, Intermap, increment P Corp., NRCAN, Esri Japan, METI, Esri China
(Hong Kong), Esri (Thailand), TomTom, MapmyIndia, © OpenStreetMap
contributors, and the GIS User Community
Disclaimer:
AECOM does not warrant the accuracy or completeness of information displayed in this map
and any person using it does so at their own risk. AECOM shall bear no responsibility or
liability for any errors, faults, defects, or omissions in the information. Where not part of the
DCDB, internal lot boundaries have been derived based on visible occupation of land from
2011,2012 and 2013 orthorectified aerial imagery and CAD Detail Survey. They should not
be considered spatially accurate (Derived Lot Boundary)
1:75,000Approx. Scale @A3
Note:
Potential Acid Sulfate Soils and Landslide Data arelimited.

HOLY TRINITY CHURCH(State Heritage Building)
DADAMUDH
ZARAI
SAWIKA POINT
ADADA GIZU
BoiguIsland
IamaIsland
Dauan
Island
PNG
Zenadth KesPlanning Scheme:
Planning Scheme forThe Torres Strait IslandRegional Council Area
LEGENDBOUNDARIES AND FEATURES
WaterwaysDirection to the nearest IslandsCadastral BoundariesRoadLGA
PAPUA NEW GUINEA
Saibai
Location MapLocal Area Plan Map - Natural HazardsLandslide, Acid Sulfate Soils, Bushfire
Saibai Island
´0 100 200
Kilometres
Kuki (NW Winds - January to April)Sager (SE Winds - May to December)
KUKI
SAGER
NATURAL HAZARDSLandslide Hazard
Potential Acid Sulphate SoilsLand Below 5m AHDLand Above 5m and Below 20m AHD
0 100 20050Metres °
Projection:GDA 1994 MGA Zone 54 Datum:GDA 1994
Updated: 11/12/2015
Data Sources:Unless stated below all landuse, road, or natural feature data shownis from the Strategic Landuse Plan (SLUP) by the RPS Group 2010.Community Consultation 2013: Local Names, Places and identified facilitiesQueensland Dept. Natural Resources and Environment: Imagery,LGA Boundaries, Terrain data and Flooding layersAECOM: all strategic framework, zoning and local area plan data is modifiedfrom the SLUP and DNRM source data.James Cook University: Coastal Hazard and Coastal Innundation whereshown.Erosion Prone Areas: @ State of Queensland (Department of Environmentand Heritage Protection), 2014Bushfire Prone Area: @ Public Safety Business Agency (PSBA), QLDGovernment, 2014Main Map Imagery:Saibai Island 25cm Imagery @ DNRM, 2013Location Map Base Data:World Street Map @ ESRI Online. Sources:Sources: Esri, HERE, DeLorme,USGS, Intermap, increment P Corp., NRCAN, Esri Japan, METI, Esri China(Hong Kong), Esri (Thailand), TomTom, MapmyIndia, © OpenStreetMapcontributors, and the GIS User CommunityDisclaimer:AECOM does not warrant the accuracy or completeness of information displayed in this mapand any person using it does so at their own risk. AECOM shall bear no responsibility orliability for any errors, faults, defects, or omissions in the information. Where not part of theDCDB, internal lot boundaries have been derived based on visible occupation of land from2011,2012 and 2013 orthorectified aerial imagery and CAD Detail Survey. They should notbe considered spatially accurate (Derived Lot Boundary)
Note:Potential Acid Sulfate Soils and Landslide Data arelimited.
Approx. Scale @A3 1:10,000

Zenadth KesPlanning Scheme:
Planning Scheme forThe Torres Strait IslandRegional Council Area
LEGENDBOUNDARIES AND FEATURES
Direction to the nearest IslandsBOUNDARIES AND FEATURES
WaterwaysCadastral BoundariesRoadLGA
PAPUA NEW GUINEA
Saibai
Location MapLocal Area Plan Map - Natural Hazards
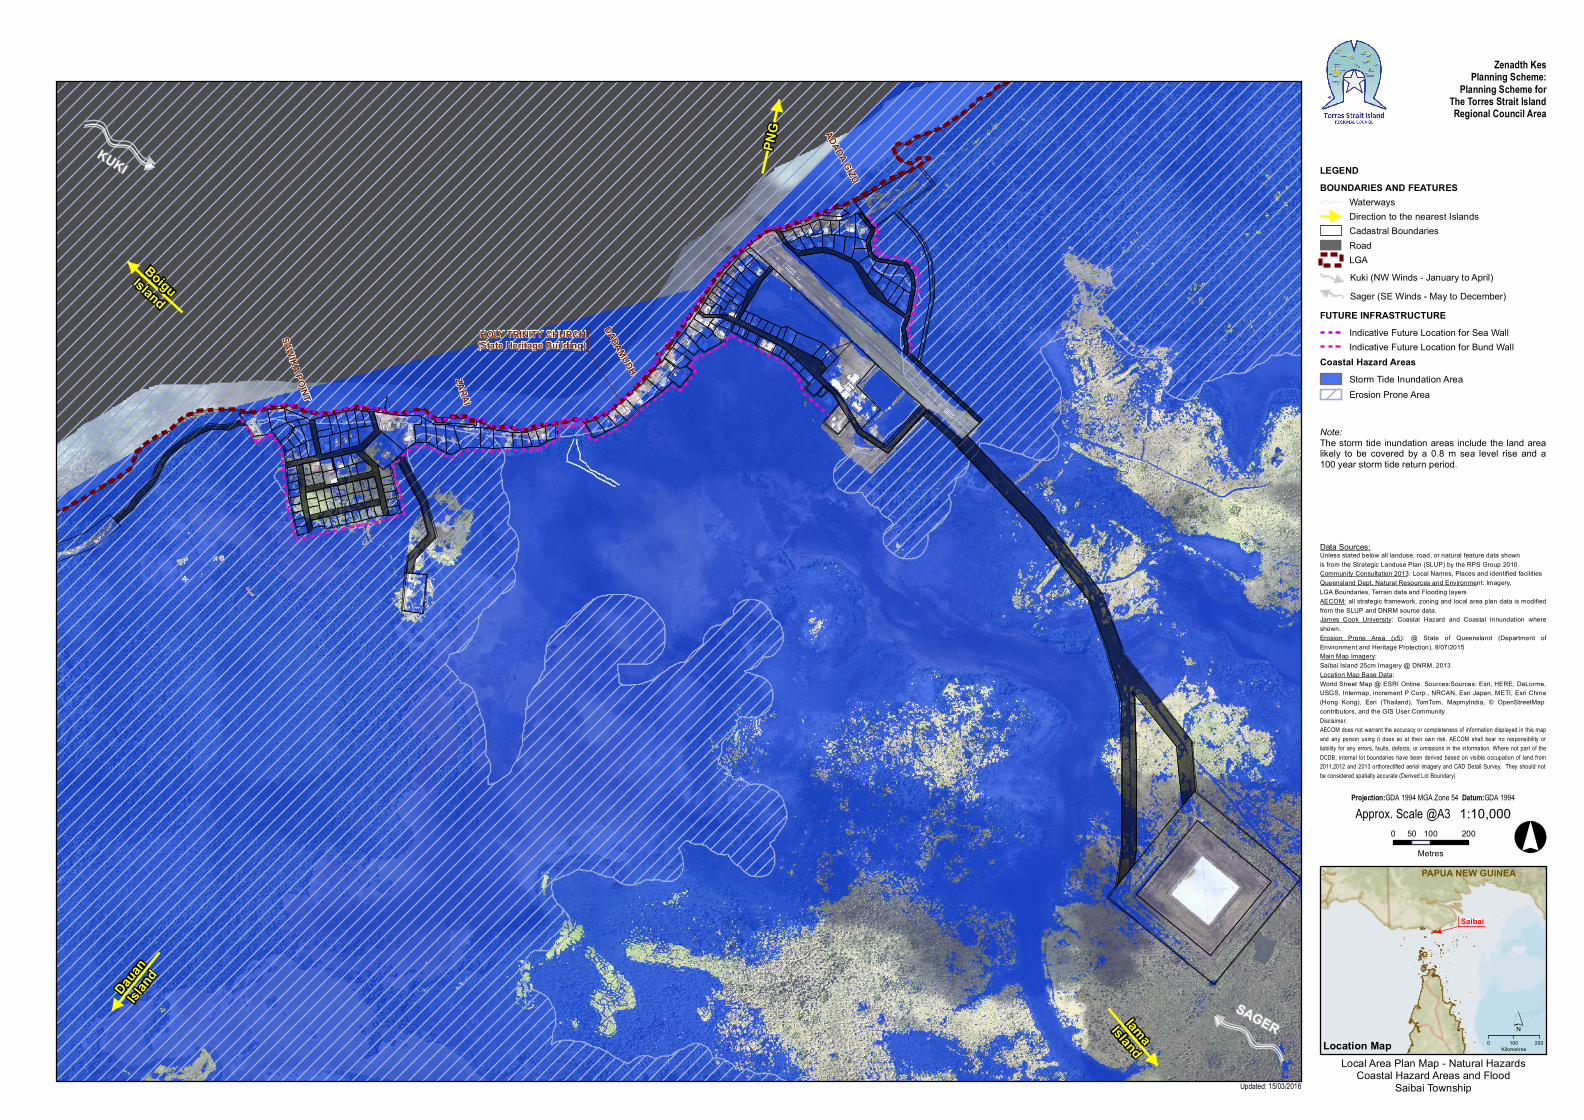
Coastal Hazard Areas and FloodSaibai Island
´0 100 200
Kilometres
Kuki (NW Winds - January to April)Sager (SE Winds - May to December)
KUKI
SAGER
0 1 20.5Kilometres °
Projection:GDA 1994 MGA Zone 54 Datum:GDA 1994
Updated: 15/03/2016
Data Sources:Unless stated below all landuse, road, or natural feature data shownis from the Strategic Landuse Plan (SLUP) by the RPS Group 2010.Community Consultation 2013: Local Names, Places and identified facilitiesQueensland Dept. Natural Resources and Environment: Imagery,LGA Boundaries, Terrain data and Flooding layersAECOM: all strategic framework, zoning and local area plan data is modifiedfrom the SLUP and DNRM source data.James Cook University: Coastal Hazard and Coastal Innundation whereshown.Erosion Prone Area (v5): @ State of Queensland (Department ofEnvironment and Heritage Protection), 8/07/2015Main Map Base Imagery:BING Service (c) Harris Corp, Earthstar Geographics, LLC EarthstarGeographics SIO @ Microsoft Corporation 2014Location Map Base Data:World Street Map @ ESRI Online. Sources:Sources: Esri, HERE, DeLorme,USGS, Intermap, increment P Corp., NRCAN, Esri Japan, METI, Esri China(Hong Kong), Esri (Thailand), TomTom, MapmyIndia, © OpenStreetMapcontributors, and the GIS User CommunityDisclaimer:AECOM does not warrant the accuracy or completeness of information displayed in this mapand any person using it does so at their own risk. AECOM shall bear no responsibility orliability for any errors, faults, defects, or omissions in the information. Where not part of theDCDB, internal lot boundaries have been derived based on visible occupation of land from2011,2012 and 2013 orthorectified aerial imagery and CAD Detail Survey. They should notbe considered spatially accurate (Derived Lot Boundary)
FUTURE INFRASTRUCTUREIndicative Future Location for Sea Wall Indicative Future Location for Bund Wall
1:75,000Approx. Scale @A3
Note:The storm tide inundation areas include the land arealikely to be covered by a 0.8 m sea level rise and a100 year storm tide return period.
Erosion Prone Area
Coastal Hazard AreasStorm Tide Inundation Area
HOLY TRINITY CHURCH(State Heritage Building)
DADAMUDH
ZARAI
SAWIKA POINT
ADADA GIZU
BoiguIsland
IamaIsland
Dauan
Island
PNG
Zenadth KesPlanning Scheme:
Planning Scheme forThe Torres Strait IslandRegional Council Area
LEGENDBOUNDARIES AND FEATURES
WaterwaysDirection to the nearest IslandsCadastral BoundariesRoadLGA
PAPUA NEW GUINEA
Saibai
Location MapLocal Area Plan Map - Natural Hazards
Coastal Hazard Areas and FloodSaibai Township
´0 100 200
Kilometres
Kuki (NW Winds - January to April)Sager (SE Winds - May to December)
KUKI
SAGER
0 100 20050Metres °
Projection:GDA 1994 MGA Zone 54 Datum:GDA 1994
Updated: 15/03/2016
Data Sources:Unless stated below all landuse, road, or natural feature data shownis from the Strategic Landuse Plan (SLUP) by the RPS Group 2010.Community Consultation 2013: Local Names, Places and identified facilitiesQueensland Dept. Natural Resources and Environment: Imagery,LGA Boundaries, Terrain data and Flooding layersAECOM: all strategic framework, zoning and local area plan data is modifiedfrom the SLUP and DNRM source data.James Cook University: Coastal Hazard and Coastal Innundation whereshown.Erosion Prone Area (v5): @ State of Queensland (Department ofEnvironment and Heritage Protection), 8/07/2015Main Map Imagery:Saibai Island 25cm Imagery @ DNRM, 2013Location Map Base Data:World Street Map @ ESRI Online. Sources:Sources: Esri, HERE, DeLorme,USGS, Intermap, increment P Corp., NRCAN, Esri Japan, METI, Esri China(Hong Kong), Esri (Thailand), TomTom, MapmyIndia, © OpenStreetMapcontributors, and the GIS User CommunityDisclaimer:AECOM does not warrant the accuracy or completeness of information displayed in this mapand any person using it does so at their own risk. AECOM shall bear no responsibility orliability for any errors, faults, defects, or omissions in the information. Where not part of theDCDB, internal lot boundaries have been derived based on visible occupation of land from2011,2012 and 2013 orthorectified aerial imagery and CAD Detail Survey. They should notbe considered spatially accurate (Derived Lot Boundary)
FUTURE INFRASTRUCTUREIndicative Future Location for Sea Wall Indicative Future Location for Bund Wall
Note:The storm tide inundation areas include the land arealikely to be covered by a 0.8 m sea level rise and a100 year storm tide return period.
Erosion Prone Area
Coastal Hazard AreasStorm Tide Inundation Area
1:10,000Approx. Scale @A3