SBI-_PO_spl_class_DI-_2013.94181859
22
1 SHAKTHII ACADEMY SHAKTHII ACADEMY SHAKTHII ACADEMY SHAKTHII ACADEMY SBI-PO Special Class Material DATA ANALYSIS AND INTERPRETATION Directions (1-5): Study the table carefully to answer the questions that follow : Number of people visiting six different super-markets and she percentage of Men, Women and Children visiting those Super-markets, Names of the Super- markets Total Number of People Percentage of Men Women Children A 34560 35 55 10 B 65900 37 43 20 C 45640 35 45 20 D 55500 41 26 33 E 42350 6 70 24 F 59650 24 62 14 1. Number of men visiting Super-market D forms approximately what percent of the total number of people visiting all the supermarkets together ? (1) 11 (2)5.5 (3)13 (4)9 (5)7.5 2. Number of children visiting Super-market c forms what percent of number of children visiting Super-market F ? (Rounded off to two digits after decimal) (1)91.49 (2)49.85 (3)121.71 (4) 109.30 (5) None of these 3. What is the total number of children visiting Super-markets B and O together ? (1) 18515 (2)28479 (3)31495 (4) 22308 (5) None of these 4. What is the average number of Women visiting all the Super-markets together ? (1)24823.6 (2) 22388.5 (3) 26432.5 (4)20988.5 (5) None of these 5. What is the respective ratio of number "of women visiting Super-markets A to those visiting Super-market C ? (1) 35:37 (2) 245 : 316 (3)352:377 (4) 1041 : 1156 (5) None of these Directions (6-10): Study the following pie-chart and answer the questions given below, Preferences of students among six beverages in terms of degree of angle in the pie-chart total No. of students = 6800
-
Upload
yashas-indalkar -
Category
Documents
-
view
5 -
download
0
description
SBI-_PO_spl_class_DI-_2013.94181859
Transcript of SBI-_PO_spl_class_DI-_2013.94181859

1
SHAKTHII ACADEMYSHAKTHII ACADEMYSHAKTHII ACADEMYSHAKTHII ACADEMY SBI-PO Special Class Material
DATA ANALYSIS AND INTERPRETATION
Directions (1-5): Study the table carefully to answer the questions that follow : Number of people visiting six different super-markets and she percentage of Men, Women and Children visiting those Super-markets,
Names of
the Super-
markets
Total Number
of People
Percentage of
Men Women Children
A 34560 35 55 10
B 65900 37 43 20
C 45640 35 45 20
D 55500 41 26 33
E 42350 6 70 24
F 59650 24 62 14
1. Number of men visiting Super-market D forms approximately what percent of the total number of people visiting all the supermarkets together ? (1) 11 (2)5.5 (3)13 (4)9 (5)7.5 2. Number of children visiting Super-market c forms what percent of number of children visiting Super-market F ? (Rounded off to two digits after decimal) (1)91.49 (2)49.85 (3)121.71 (4) 109.30 (5) None of these 3. What is the total number of children visiting Super-markets B and O together ? (1) 18515 (2)28479 (3)31495 (4) 22308 (5) None of these 4. What is the average number of Women visiting all the Super-markets together ? (1)24823.6 (2) 22388.5 (3) 26432.5 (4)20988.5 (5) None of these 5. What is the respective ratio of number "of women visiting Super-markets A to those visiting Super-market C ? (1) 35:37 (2) 245 : 316 (3)352:377 (4) 1041 : 1156 (5) None of these Directions (6-10): Study the following pie-chart and answer the questions given below, Preferences of students among six beverages in terms of degree of angle in the pie-chart total No. of students = 6800

2
6. What is the difference between the total number of students who prefer Beverage A and C together and the total number of students who prefer Beverage D and F together ? (1)959 (2) 955 (3)952 (4)954 (5) None of these 7. What is the respective ratio between the number of students who prefer Beverage F and the number of students who prefer Beverage A ? (1)3: 11 (2)3: 13 (3)6: 11 (4)5: 11 (5) None of these 8. The number of students who prefer Beverage E and F together are what percent of the total number of students? 1)18 (2)14 (3)26 (4)24 (5) None of these 9. The number of students who prefer Beverage C are approximately what percent of the number of students who prefer Beverage D? (1)7 (2)12 (3)18 (4) 22 (5)29 10. How many students prefer Beverage B and Beverage E together? (1) 2312 (2)2313 (3)2315 (4)2318 (5) None of these
Directions (11-15) : Study the table carefully to answer the questions that follow : Percentage of Marks Obtained by Different Students in different Subjects of MBA
Students
SUBJECTS (Maximum Marks)
Strategic
Management
(150)
Brand
Management
(100)
Compensation
Management
(150)
Consumer
behaviour
(125)
Service
Marketing
(75)
Training &
development
(50)
Anushka 66 75 88 56 56 90
Archit 82 76 84 96 92 88
Arpan 76 66 78 88 72 70
Garvita 90 88 96 76 84 86
Gunit 64 70 68 72 68 74
Pranita 48 56 50 64 64 58
11. How many marks did anushka get in all the Subjects together?
Beverage A
79.2°
Beverage B
57.6°
Beverage C
14.4°
Beverage D
122.4°
Beverage
E 64.8°
Beverage
F 21.6°

3
(1)369 (2)463 (3)558 (4) 496 (5) None of these 12. Marks obtained by Garvita in Brand Management are what percent of marks obtained by-Arch.it in the same Subject ? (rounded off to two digits after decimal) (1)86.36 (2)101.71 (3) 116.79 (4) 133.33 (5) None of these 13. What are the average marks obtained by all students together in Compensation Management ? (I) 116 (2)120 (3)123 (4)131 (5) None of these 14. Who has scored the highest total marks in all the subjects together ? (1) Archit (2) Gunit (3)Pranita (4) Garvita (5) Arpan 15. How many Students have scored the highest marks in more than one Subject ? (1) three (2) two (3)one (4)none (5) None of these Directions (16-20) : Study the following graph and answer the questions given below : No. of students (in thousands) who opted for three different specializations during the given five years in a University
16. Out of the total number of students who opted for the given three subjects, in the year 2009, 38% were girls. How many boys opted for Mathematics in the same year? (1) 1322 (2) 1332 (3)1312 (4) Cannot be determined (5) None of these 17. If the total number of students in the University in the year 2007 was 455030 then the total number of students who opted for the given three subjects were approximately what percent of the total students ? (1) 19 (2)9 (3)12 (4)5 (5)23 18. What is the total number of students who opted for Hindi and who opted for Mathematics in .the years 2006, 2007 and 2009 together ? (1) 97000 (2)93000 (3)85000 (4) 96000 (5) None of these 19. The total number of students who opted for Mathematics in the Years 2005 and 2008 together are approximately what percent of the total number of students who opted for all three subjects in the same years ?
0
5
10
15
20
25
30
35
40
2005 2006 2007 2008 2009
Years
Hindi
English
Mathematics

4
(1) 38 (2) 28 (3)42 (4)32 (5)48 20. What is the respective ratio between the number of students who opted for English in the years 2006 and 2008.together and the number of students who opted for Hindi in the year 2005 and 2009 together ? (1)11: 5 (2) 12 : 7 (3) 11 :7 (4) 12 : 5 (5) None of these
Directions (21-25) : Study the following graph and table carefully and answer the questions given below:
Distance Covered (In Kilometers) By Six Vehicles On Each Day
Vehicle Day 1 Day 2
A 832 864
B 516 774
C 693 810
D 552 765
E 935 546
F 703 636
21. Which of the following vehicles travelled at the same speed on both the days ? (1) Vehicle A (2) Vehicle C (3) Vehicle F (4) Vehicle B (5) None of these 22. What was the difference between the speed of vehicle A on day 1 and the speed of vehicle C on the same day? (l)7km/hr (2)12 km hr (3) 11 km/hr (4) 8 km/hr (5) None of these
0
2
4
6
8
10
12
14
16
18
20
A B C D E F
Vehicles
Tim
e (
In h
ou
rs)
Time Taken to Travel (In Hours ) By
Vehicles on two Different Days
Day 1
Day 2

5
23. What was the speed of vehicle C on day 2-in terms of meters per second ? (1) 15.3 (2) 12.8 (3)11.5 (4)13.8 (5) None of these 24. The distance travelled by vehicle F on day 2 was approximately what percent of the distance travelled by it on day 1? (1)80 (2)65 (3) 85 (4) 95 (5)90 25. What is the respective ratio between the speeds of vehicle D and vehicle E on day 2? (1)15:13 (2)17:13 (3) 13 : 11 (4) 17: 14 (5) None of these
Directions (26-30) : Study the following pie-chart and table carefully and answer the questions given below : Percentage wise Distribution of the number 6f Mobile Phones Sold By A Shopkeeper During Six Months Total number of mobile phones sold =45,000/-
The respective ratio between the number of mobile phones sold of company A and company B during six months
Month Ratio
July 8:7
August 4:5
September 3:2
October 7:5
November 7:8
December 7:9
26. What is the respective ratio between the number of mobile phones sold of company B during July and those sold during December of the same company? (1)119:145 . (2)116:135 (3)119: 135 (4)119: 130 (5) None of these 27. If 35% of the mobile phones sold by company A during November were sold at a discount, how many mobile phones of company A during that month were without a discount ? (1)882 (2) 1635 (3) 1638 (4) 885 (5) None of these
July, 17%
August, 22%
September, 25
%
October, 8%
November, 12%
December, 16%

6
28. If the shopkeeper earned a profit of? 433/- on each mobile phone, sold of company B during October, what was his total profit earned on the mobile phones of that company during the same month ? . (1) 6,49, 900/- (2)6,45,900/- (3)6,49,400/- (4)6,49,500/- (5) None of these 29. The number of mobile phones sold of company' A- during July is-approximately. what percent of the number of mobile phones sold of company A during December? (1) 110 (2)140 (3)150 (4)105 (5)130 30. What is the- total number of mobile phones sold of company B during August arid September together ?. (1) 10,000 (2)15,000 (3)10,500 (4)9,500 (5) None of these .
Directions ( 31-35): Study the following information and answer the questions that follow: The premises of a bank are to be renovated. The renovation is in terms of flooring. Certain areas are to be floored either with marble or wood. All rooms/halls and pantry are rectangular. The area to be renovated comprises of a hall for customer transaction measuring 23 m by 29 m, branch manager's room measuring 13 m by 17 m, a pantry measuring 14m by 13 m, a record keeping cum server room measuring 21m by 13m and locker area measuring 29 m by 21 m. The total area of the bank is 2000 square meters. The cost of wooden flooring is Rs.170/- per square meter, and the cost of marble flooring is Rs.190/- per square meter. The locker area, record keeping cum server room and pantry are to be floored with marble. The branch manager's room and the hall for customer transaction are to the floored with wood. No other area .is to be renovated in terms of flooring. 31. What is the respective ratio of the total cost of wooden flooring to the total cost of marble flooring ? (1) 1879: 2527 (2) 1887:2386 (3) 1887:2527 (4) 1829:2527 (5) 1887:2351 32. If die four walls and ceiling of the branch managers room (The height of the room is 12 meters) are to be painted at die cost of? 190/- per square meter. How much will be the total cost of renovation of the branch manager's room including the cost of flooring ? (I)Rs.1,36,800/- (2)Rs.2,16,660/- (3)Rs. 1,78.790/- (4)Rs.2,11,940/- (5) None of these 33. If the remaining area of the bank is to be carpeted at the rate of Rs.110/- per square meter, how much will be the increment in the total cost of renovation of bank premises ? (1)Rs.5,820/- (2)Rs.4,848/- (3)Rs.3,6S9/- (4)Rs.6,890/- (5) None of these 34. What is the percentage area of the bank that is not to be renovated ? (1)2.2 (2)2.4 (3)4.2 (4) 4.4 (5) None of these 35. What is the total cost of renovation of the hall for customer transaction and the locker area ? (1)Rs.2,29,100/- (2)Rs. 2,30,206/- (3)Rs.2,16,920/- (4)Rs.2,42,440/- (5) None of these
Directions (36-40): Study the following information and answer the questions that follow:

7
The Graph Given Below Represents The Production (In Tonnes) And Sales (In Tonnes) Of Company A From 2006-2011
The table given below represents the respective ratio of the production (in tonnes) of Company A to the production (in tonnes) of Company B, and the respective ratio of the sales (in tonnes) of Company A to the sales (in tonnes) of Company B.
36. What is the approximate percentage increase in production of Company A (in tonnes) from the year 2009 to the production of company A (in tonnes) in the year 2010 ? (1) 18 (2)38 (3)23 (4) 27 (5) 32 37. The sales of Company A in the year 2009 was approximately what percent of the production of Company A in the same year ? (1)65 (2)73 (3)79 (4)83 (5) 69 38. What is the average production of Company B (in tonnes) form the year 2006 to the year 2011 ? (1)574 (2)649 (3)675 (4)593 (5)618 39. What is the respective ratio of the total production (in tonnes) or Company A to the total sales (in tonnes) of Company A ? (I) 81 :64 (2)64:55 (3)71:81 (4)71:55 (5)81:55
0100200300400500600700800900
2006 2007 2008 2009 2010 2011
Years
Pro
du
ctio
n &
Sa
les
(In
to
nn
es)
Chart Title
Production
Sales
Year Production Sales
2006 5:4 2:3
2007 8:7 11:12
2008 3:4 9:14
2009 11:12 4:5
2010 14:13 10:9
2011 13:14 1:1

8
40. What is the respective ratio of production of Company 13 (in tonnes) in the year 2006 to production of Company B (in tonnes) in the year 2008 ? (1)2:5 . (2)4:5 (3) 3 : 4 (4)3:5 (5)1:4
Directions (41-45) : Study the following graph carefully to Answer these questions. Percent Profit Earned by Two Companies Producing Electronic Goods over the Years
Profit Percent =
Profit Earned = Total income - Total Investment in the year
41. If the profit earned in 2006 by Company B was Rs.8,12,500/-, what was the total- income of the Company in the year? (1)Rs.12,50,000/- (2)Rs.20,62,500/- (3)Rs.16,50,000/- (4)Rs.18.25,000/- (5) None of these 42. If the amount invested by the-two Companies in 2005 was equal, what was the ratio between total income in 2005 of the companies A and B respectively ? (1) 31 :33 (2) 33:31 (3)34:31 (4)14:11 (5) None of these 43. If the total amount invested by the two Companies in 2009 was Rs.27 lakhs, while the amount invested1 by Company B was 50% of the amount' invested by Company A, what was the total profit earned by the two Companies together ? (I)Rs.21.15 lakhs (2)Rs.20.70 lakhs (3)Rs.18.70 lakhs (4)Rs.20.15 lakhs (5) None of these 44. If the incomes of Company A in 2007 and 2008 were equal and the amount invested in 2007 was 12 lakhs, what was the amount invested in 2008 ? (1)Rs.10,87,500/- (2)Rs.10,85,700/- (3)Rs.12,45,000/- (4)Rs.12,85,000/- (5) None of these 45. If the amount of profit earned by Company A in 2006 was Rs.10.15 lakhs, what was the total investment? (1)Rs.13.8 lakhs (2)Rs.14.9 lakhs (3)Rs.15.4 lakhs (4)Rs.14.2 lakhs (5) None of these 46. If the amount invested by Company B in 2004 is Rs.12 lakhs and the incorne of 2004 is equal to the investment in 2005, what was the amount of profit earned in 2005 by Company B ? .
30
40
50
60
70
80
90
100
2004 2005 2006 2007 2008 2009 2010
Years
Pe
rce
nt
Pro
fit
Ea
rne
d
Company A
Company B

9
(1)Rs.6.6 lakhs (2)Rs.18.6 lakhs (3)Rs.10.23 lakhs (4)Rs.9.6 lakhs (5) None of these 47. If the investment of Company A in 2007 and 2008 were equal, what is the difference between profit earned in two years if the income in 2008 was Rs.24 lakhs ? (1)Rs.2.25 lakhs (2)Rs.3.6 lakhs (3)Rs.1.8 lakhs (4)Rs.2.6 lakhs (5) None of these 48. If each of the Company A and B invested 7 25 lakhs in 2010, what was the average profit earned by the two Companies? (1)Rs.18 lakhs (2)Rs.22.5 lakhs (3)Rs.17.5 lakhs (4)Rs.20 lakhs (5) None of those
Directions (49-55): Study the following table carefully and answer the questions which follow:- Number of Candidates found Eligible and the Number of Candidates Short-listed for Interviews for a recent Recruitment Process for Six Posts from Different States (E-Eligible, S-Short-listed)
StatedStatedStatedStated→ IIII IIIIIIII IIIIIIIIIIII IVIVIVIV VVVV VIVIVIVI
PostPostPostPost↓ EEEE SSSS EEEE SSSS EEEE SSSS EEEE SSSS EEEE SSSS EEEE SSSS
A A A A 2500 65 7200 240 5200 76 3600 200 4600 110 5400 380
BBBB 3200 220 8500 420 8400 190 6200 320 5800 180 6200 130
cccc 2800 280 4500 350 7600 160 8200 440 7300 310 3700 250
DDDD 2400 85 4800 200 2600 55 7500 350 3900 160 4800 360
EEEE 3000 120 5600 280 3800 75 6800 280 6100 260 7800 520
FFFF 4800 325 6100 320 4400 220 1700 180 4900 220 8800 610
GGGG 6500 550 7000 140 6000 325 5500 220 8100 410 2700 200
49. From, State 'B’ which post had the highest percentage of candidates short-listed ? (1)V (2) IV (3) VI (4)11 (5) None of these 50. Approximately, what is the average number of candidates found eligible from ail States for Post III ? (1)6700 (2)6200 (3)4200 (4) 4500 5) 5500 51. What is the overall percentage (rounded off to one digit after decimal) of candidates short-listed over the total number of candidates eligible from all the States together for Post I ? (1)9.5% (2)12.5% (3) 7.2% (4) 6.5% (5) None of these 52. What is the ratio between total number of candidates short-listed for all die posts together from States E and G respectively? (1) 307 : 369 (2) 73 : 79 (3) 6 : 5 (4)9:7 (5) None of these
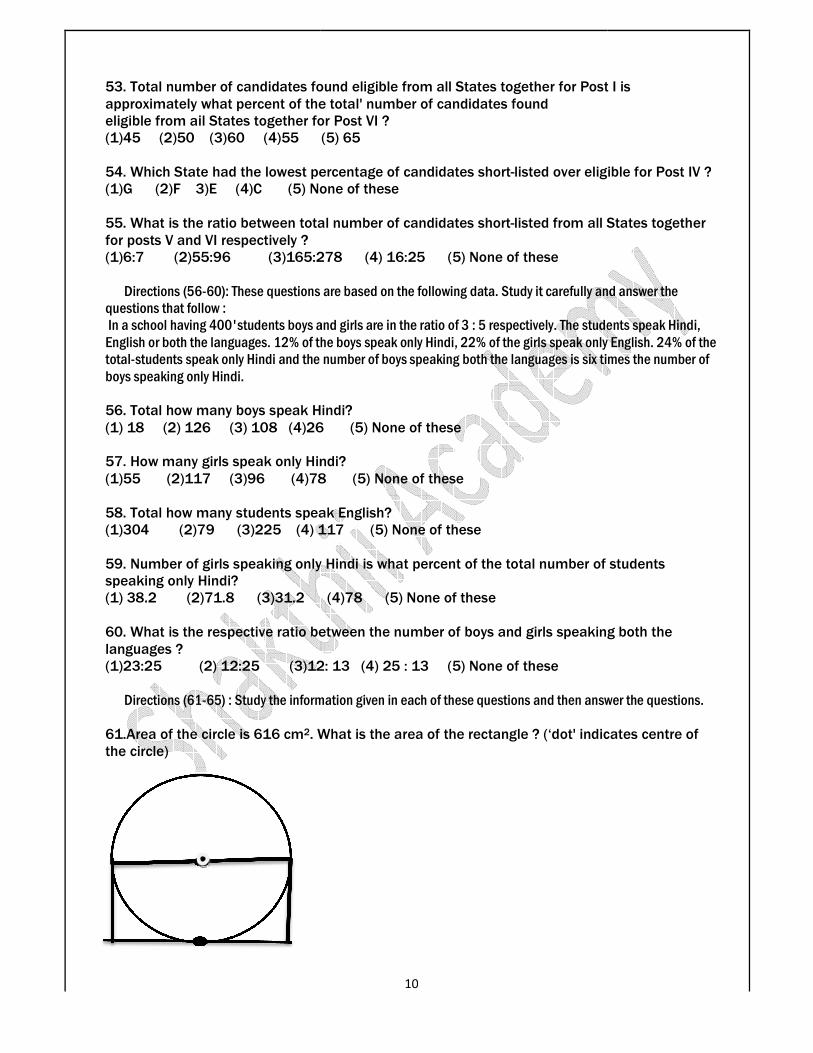
53. Total number of candidates found eligible from all States together for Post I is approximately what percent of the total' number of candidates foundeligible from ail States together for P(1)45 (2)50 (3)60 (4)55 (5) 65 54. Which State had the lowest percentage of candidates short(1)G (2)F 3)E (4)C (5) None of these 55. What is the ratio between total number of for posts V and VI respectively ? (1)6:7 (2)55:96 (3)165:278 (4) 16:25 (5) None of these Directions (56-60): These questions are based on the following data. Study it carefully and answer the questions that follow : In a school having 400'students boys and girls are in the ratio of 3 : 5 respectively. The students speak Hindi, English or both the languages. 12% of the boystotal-students speak only Hindi and the number of boys speaking both the languages is sixboys speaking only Hindi. 56. Total how many boys speak Hindi(1) 18 (2) 126 (3) 108 (4)26 (5) None of these 57. How many girls speak only Hindi(1)55 (2)117 (3)96 (4)78 (5) None of these 58. Total how many students speak English(1)304 (2)79 (3)225 (4) 117 (5) None of these 59. Number of girls speaking only Hindi is what percent of the total number of students speaking only Hindi? (1) 38.2 (2)71.8 (3)31.2 (4)78 (5) None of these 60. What is the respective ratio betlanguages ? (1)23:25 (2) 12:25 (3)12: 13 (4) 25 : 13 (5) None of these Directions (61-65) : Study the information given in each of these questions and then answer the questions 61.Area of the circle is 616 cm2. What is the area of the rectangle ? (‘dot' indicates centre of the circle)
10
53. Total number of candidates found eligible from all States together for Post I is approximately what percent of the total' number of candidates found eligible from ail States together for Post VI ? (1)45 (2)50 (3)60 (4)55 (5) 65
54. Which State had the lowest percentage of candidates short-listed over eligible for Post IV ?(1)G (2)F 3)E (4)C (5) None of these
55. What is the ratio between total number of candidates short-listed from all States together
(1)6:7 (2)55:96 (3)165:278 (4) 16:25 (5) None of these
60): These questions are based on the following data. Study it carefully and answer the
In a school having 400'students boys and girls are in the ratio of 3 : 5 respectively. The students speak Hindi, the languages. 12% of the boys speak only Hindi, 22% of the girls speak only English. 24% of the
students speak only Hindi and the number of boys speaking both the languages is six times the number of
ys speak Hindi? (1) 18 (2) 126 (3) 108 (4)26 (5) None of these
How many girls speak only Hindi? (1)55 (2)117 (3)96 (4)78 (5) None of these
how many students speak English? 5 (4) 117 (5) None of these
59. Number of girls speaking only Hindi is what percent of the total number of students
(1) 38.2 (2)71.8 (3)31.2 (4)78 (5) None of these
60. What is the respective ratio between the number of boys and girls speaking both the
(1)23:25 (2) 12:25 (3)12: 13 (4) 25 : 13 (5) None of these
65) : Study the information given in each of these questions and then answer the questions
What is the area of the rectangle ? (‘dot' indicates centre of
53. Total number of candidates found eligible from all States together for Post I is
listed over eligible for Post IV ?
listed from all States together
60): These questions are based on the following data. Study it carefully and answer the
In a school having 400'students boys and girls are in the ratio of 3 : 5 respectively. The students speak Hindi, speak only Hindi, 22% of the girls speak only English. 24% of the
times the number of
59. Number of girls speaking only Hindi is what percent of the total number of students
ween the number of boys and girls speaking both the
65) : Study the information given in each of these questions and then answer the questions.
What is the area of the rectangle ? (‘dot' indicates centre of

11
(1)784 cm2 (2) 196 cm2 (3)392cm2 (4) Cannot be determined (5) None of these 62.What is the average female population in million?
City Total Population Male Population
A 12 6.5
B 15 7.2
C 17 9.0
D 19 9.9
E 22 10.8
(1)8.32 . (2)8.86 (3)8.68 (4)9.12 (5) None of these 63. What is the percent rise in production in 2007 from 2006? (Rounded off to two digits after decimal)
(1)28.18 (2)18.18 (3)16.28 (4)26.18 (5) None of these 64. Out of the total 550 students, how many students did not prefer Maths or Economics ? Break-up of students having preference for each subject
1200
1100
1300 1300
14001350
1000
1100
1200
1300
1400
1500
2005 2006 2007 2008 2009 2010
Years
Pro
du
ctio
n
Production
Production

12
(1)462 (2) 154 (3) 196 (4) 396 (5) None of these 65.What is the difference (in Rs. lakhs) between average salary and the lowest salary ?
Person Salary in Rs. Lakhs
A 8.5
B 7.6
C 12.8
D 5.4
E 10.5
(1)4.2 (2)2.65 (3)3.65 (4)4.06 (5) None of these Directions (66-70) : Study the following table carefully to answer the questions that follow : Numbers (N) of Six types of electronic Products Sold by Six different stores in a month and the price per product (P) (price in Rs. 000) charged by each Store.
Store A B C D E F
Product N P N P N P N P N p N P
L 54 135 48 112 60 104 61 124 40 136 48 126
M 71 45 53 38 57 5.6 49 49 57 5.5 45 4.7
N 48 12 47 18 52 15 54 11.5 62 10.5 56 11
O 52 53 55 48 48 50 54 49 59 47 58 51
P 60 75 61 68 56 92 44 84 46 76 59 78
Q 43 16 44 15 45 14.5 48 15.6 55 18.2 55 14.9
66. The number of L type products sold by Store F is what, per cent of the number of the same type of products sold by Store E ? (1) 76,33 (2)124 (3)83.33 (4) 115 (5) None of these
History, 44
%
Geography,
28%
Economics,
16%
Maths, 12%

13
67. What is the ratio of the total number of N and L type products together sold by Store D and that of the same products sold by Store A ? (1) 119:104 (2) 102:115 (3)104:115 (4)117:103 (5) None of these 68. What is the average price per product charged by all the Stores together for Product Q ? (1)Rs. 14,700 (2)Rs. 15,700 (3)Rs. 15,200 (4)Rs.14,800 (5) None of these 69. What is the difference in the amount earned by Store A through the sale of P type products and that earned by Store B through the sale of Q type products? (1)Rs. 38.4 lakhs (2) Rs. 30.384 lakh (3)Rs. 3.84 lakhs (4) Rs. 384 lakhs (5) None of these 70. What is the total amount. earned by Store C through the sale of M and O type products together? (1)Rs.2719.2 lakhs , (2) Rs. 271.92 lakhs - (3)Rs. 2.7192 lakhs (4)Rs. .27.192 lakhs (5)None of these Directions (71-75): Study the given, information Carefully to answer the questions that follow:. An organisation consists of 2400 employees working in-different, departments, viz HR, Marketing, IT, production and Accounts. The ratio of male to female employees in the organisation is 5 : 3. Twelve percent of the males, work in the.HR department; Twenty four percent of the females work in the Accounts department. The ratio of males to females working in the HR department is 6: 11. One-ninth of the females work in the IT department The number of females working in the Production department is ten per cent of the males working in the same. The remaining females work in the Marketing department. The total number of employees working in the IT department is 285.Twenty- two percent of the males' work in the Marketing department id the remaining work in the Accounts department. 71. The number of males working in the IT department forms approximately what per cent of the total number of males in the organisation ? (1)5 (2)12 (3)21 (4)8 (5)18 72. .How many males work in the Accounts department ? a)170 (2)165 (3)185 (4)160 (5) None of these 73. The total number of employees working in the Accounts department forms what per cent of the total number of, employees in the organisation (rounded off to two digits after decimal) (1)19.34 . (2)16.29 (3)11.47 (4)23.15 (5) None of these 74. The.number of females working in the Production department forms what per cent of the total number of females in the organisation ? a)7 (2)2 (3)4 (4)15 (5) None of these 75. What is the total number of females working in the HR and Marketing departments together ? (1)363 (2)433 (3)545 (4)521 (5) None of these Directions (76-80): Study the graphs carefully to f answer the questions that follow: Total number of children in 6 different schools and the percentage of girls in them Number of Children:

14
Number of Girls:
76. What is the total percentage of boys in schools R and U together ? (rounded of to two digits after decimal) (1) 78.55 (2)72.45 (3)76.28 (4)75.83 (5) None of these 77. What is the total number of boys in School T ? (1) 500 (2)600 (3)750 (4)850 (5) None of these 78. The total number of students in school R is aproximately what per cent of the total number of students in school S ? (1)89 (2)75 (3)78 (4)82 (5)94 79.What is the average number of boys in schools P and Q together ? (1) 1425 (2) 1575 (3) 1450 (4) 1625 (5) None of these- 80.What is the ratio of the number of girls in school P to the number of girls in school Q ? (1) 27 : 20 (2) 17 : 21 (3)20 :27 (4) 21 : 17 (5) None of these Directions (81-85) : Study the tables carefully to answer the questions that follow : Number of candidates (in lakhs) appearing in an entrance examination from six different cities and the ratio of candidates passing and failing the same
City A B C D E F
0
500
1000
1500
2000
2500
3000
3500
P Q R S T U
School
Number of Children
Children
0
10
20
30
40
50
P Q R S T U
School
Percentage of Girls
Percentage of Girls

15
(No. of Candidates)
1.25 3.14 1.08 2.27 1.85 2.73
Ratio of candidates passing and failing within the city
City Passing Failing
A 7 3
B 5 3
C 4 5
D 1 3
E 3 2
F 7 5 81. What is the ratio of the number of candidates failing the exam from City D to that of those failing the exam from City A ? (1) 289 : 42 (2) 42 ; 289 (3) 227 : 50 (4) 50 : 227 (5) None of these 82. The number of candidates appearing for the exam from City C is what per cent of the number of candidates appearing for the exam from City B ? (rounded off to the nearest integer) (1)27 (2)34 (3)42 (4)21 (5)38 83.The number of Candidates passing in the exam from city F is what per cent of the total number of candidates appearing from all the cities together ? (rounded off to two digits alter the decimal) (1) 12.93 (2) 14.46 (3) 10.84 (4) 11.37 (5) None of these 84.Which city has the highest number of Students failing the entrance exam ? (1)F (2)C (3)B (4) D (5) None of these 85. What is the No. of candidates passing the exam from City E ? (1) 13,000 (2)11,10,000 (3)1,13,000 (4) 11,000 (5) None of these Directions (86-90) : Study the graph carefully to answer the questions that follow : Per cent profit made by two companies over the years
Profit Percent = ������������ ���
����� ��� x 100

16
86. If in the year 2004 the expenditures incurred by Company A and B were the same, what was the ratio of the income of Company A to that of company B in that year ? (1) 27:28 (2)14:23 (3) 13 : 19 (4)Cannot be determined (5) None of these 87. If the amount of profit earned by Company A in the year 2007 was Rs 1.5 lakhs, what was its expenditure in that year? (1)Rs. 1.96 lakhs (2)Rs. 2.64 lakhs (3)Rs. 1.27 lakhs (4) Rs. 3.75 lakhs (5) None of these 88. What is the average per cent profit earned by Company B over all the years together ? (1)19 (2)24 (3)12 ( 4) 37 (5) None of these 89. If in the year 2008, the incomes of both the companies A and B were the same, what was the ratio of the expenditure of Company A to the expenditure of Company B in that year ? (1)21 :25 (2)7:9 (3) 13: 15 (4) Cannot be determined (5) None of these. 90. What is the ratio of the amount of profit earned by Company A to that by company B in the year 2009 ? (1) 2:3 (2)4:7 (3)11:15 (4) Cannot be determined (5)none of these Directions (91-95): Study the given table carefully to answer the questions that follow : Percentage of marks obtained by five students in five different subjects in a school
Subject English Science Mathemaitics Social
Studies Hindi
Students (100) (125) (150) (75) (50)
Rahul 67 84 70 64 . 90
Veena 59 72 74 88 84
Sohan 66 90 84 80 76
0
10
20
30
40
50
60
2004 2005 2006 2007 2008 2009
Years
Pe
rce
nt
Pro
fit
Company A
Company B

17
Shreya 71 66 80 66 86
Varun 63 76 88 68 72
Figures in brackets indicate maximum marks for a particular subject. 91. What is the average marks obtained by all the students together in English ? (1) 64.6 (2)60.4 (3) 66.7 (4)68.4 (5) None of these 92.What is Varun's overall percentage in the examination ? (1) 81.5 (2)78.2 (3)75.4 (4)69.8 (5) None of these 93. What is the ratio of the total marks obtained by Veena and Shretya together in Mathematics to the marks obtained by Rahul in the same subject ? (1)11:5 (2)7:9 (3)5:11 (4)9:7 (5) None of these 94. If in order to pass the exam a minimum of 95 marks is needed in Science, how many students pass the exam ? (l)None (2) Three (3) One (4) Two (5) Four 95. What is the total marks obtained by Sohan in all subjects together? (1) 396 (2)408 (3)402.5 (4)398.5 (5) None of these Directions (96-100): Study the given graph carefully to answer the questions that follow : Number of people (in thousands) using three different types of mobile services over the years
96. What is the average number of people using mobile service M for all the years together ? (1) 16 2/3 (2) 14444 1/6 (3)16666 2/3 (4) 14 1/6 (5)none of these 97. The total number of people using all the three mobile services in the- year 2007 is what per cent of the total number, of people using all the three mobile services in the year 2008? (rounded off to two digits after decimal) (1) 89.72 (2)93.46 (3)88.18 (4)91.67 (5) None of these
0 10 20 30 40 50 60 70
2004
2005
2006
2007
2008
2009
No. of People in Thousands
L
M
N

18
98. The number of people using mobile service N in the year 2006 forms approximately what per cent of the total number of people using all the three mobile services in that year ? (1)18 (2)26 (3)11 (4) 23 (5) 29 99. What is the ratio of the number of people using mobile service L in the year 2005 to that of those using the same service in the year 2004 ? (1)8:7 (2)3 : 2 (3)19: 13 (4)15:11 (5) None of these 100. What is the total number of people using mobile service M in the years 2008 and 2009 together ? (1) 35,000 (2)30,000 (3)45,000 (4) 25,000 (5) None of these
Directions (101-105) : Study the table carefully answer the questions tin follow : Distance (in km) travelled by six trucks on six different days of the week
Truck→
Day ↓ P Q R S T U
Monday 240 250 320 325 330 300
Tuesday 320 264 308 314 318 314
Wednesday 324 294 330 312 310 325
Thursday 288 300 310 278 260 275
Friday 366 302 288 292 270 268
Saturday 292 284 260" 274 280 242
101. What is the average distance travelled by Truck S on the days together? (1) 198 (2)296 (3)199 (4)299 (5) None of these 102. If the speed of Truck P on Monday was 19.2 km/hr, what was the time taken by it to cover the given distance? (1)10 hours (2)11 hours (3)9 hours 30 minutes (4), 12 hours 30 minutes (5) None of these 103. If to travel the given distance, the time taken by truck Q on Friday was 8 hours, what was its speed on that day? (1)42.50 km/hr (2) 28.25 km/hr (3) 37.75 km/hr (4) 32.25 km/hr (5) None of these 104. What is the total distance travelled by all the trucks together on Saturday ? (1) 1623 km (2) 1632 km (3)1263 km (4) 1362 (5) None of these 105. If on Tuesday, Truck R and Truck T travelled at the same speed, what was the ratio of the time taken by truck R and that taken by truck T to cover their respective distances? (1) 154: 159 (2) 142: 167 (3)161 : 173 (4) Cannot be determined (5) None of these
Directions (106-110) : Study the following pie-charts carefully and answer the questions given below :

19
Discipline-wise Breakup of the Number of candidates appeared in Interview and Discipline-wise Breakup of the Number of candidates selected by an organization. Discipline-wise Breakup of Number of candidates appeared in Interview Total Number of Candidates Appeared In the Interview = 25780 Percentage Distribution:
Discipline-wise Break-up of Number of candidates selected after Interview by the organization Total Number of Candidates selected After Interview = 7390 Percentage Distribution:
Commerce, 18%
Science, 28%
Engineering, 16%
Management, 12
%
Agriculture, 14%
Others, 12%

20
106. What was the ratio of the number of candidates appeared in interview from other disciplines and the number of candidates selected from Engineering discipline respectively (founded off to the nearest integer)? (1) 3609:813 (2) 3094 : 813 (3) 3094: 1035 (4)4125 : 1035 (5) 3981 :767 107. The total number of candidates appeared in interview from Management and other discipline was what percentage of number of candidates appeared from Engineering discipline ? (1)50 (2)150 (3) 200 (4) Cannot be determined (5) None of these 108. Approximately what was the difference between the number of candidates selected from Agriculture discipline and number of candidates selected from Engineering discipline ? (1)517 (2) 665 (3)346 (4) 813 (5)296 109. For which discipline was the difference in number of candidates selected to number of candidates appeared in interview the maximum ? (1) Management (2) Engineering (3) Science (4) Agriculture (5) None of these 110. Approximately what was the total number of candidates selected from Commerce and Agricultural discipline together ? (1)1700 (2)1800 (3)2217 (4) 1996 (5)1550
Directions (111-115) : Study the following carefully to answer these questions. Number of students enrolled with five colleges over the years.
Commerce, 16%
Science, 32%
Engineering, 11%
Management, 32%
Agriculture, 7%
Others, 14%

21
College→
Year ↓ A B C D E
2004 450 320 400 480 520
2005 480 350 380 500 540
2006 420 300 410 520 460
2007 460 360 430 470 480
2008 470 340 390 530 530
111. If from college B in 2007, 80% of the students enrolled appeared in a competitive examination, out of which 75% students passed. How many students passed the examination? (1)180 (2)216 (3)270 (4)240 (5) None of these 112. In 2005, from all the colleges together an overall 40% of the students enrolled for a computer course. Total how many students enrolled for the course ? (1)800 (2)850 (3)950 (4) 900 (5) None of these 113. What is the ratio between the average number of students enrolled with all colleges together in 2007 and 2008 respectively? (1)108 : 113 (2)108 : 117 (3) 110: 113 (4) 111 : 113 (5) None of these 114. Average number of students enrolled from college B for all the years together is approximately what per cent of the average number of students enrolled from college C for all the years together ? (1)73 (2) 120 (3) 128 (4)70 (5)83 115. In 2006, from all colleges together 8% of the students enrolled went abroad. Approximately how many students went abroad ? (1)170 (2)210 (3)220 (4) 190 (5) 150 Directions (116-120) : Study the following graph carefully to answer these questions. Populations of two States (in millions) over the years
0
10
20
30
40
50
60
2003 2004 2005 2006 2007 2008
Years
Po
pu
lati
on
in
Mil
lio
n
Populations of two States (in millions)
over the years
State A
State B

22
116. For state B the per cent rise is population from the previous year was the highest in which of the following years? (I) 2008 (2) 2006 (3)2005 (4) 2004 (5) 2007 117. What was the average population of state B (in millions) tor the years together? (1)38.5 (2) 28.5 (3)35 (4) 26 (5) 37.5 118. What is the per cent rise in population of stale A in 2007 from the previous year ?
(1)25 (2) 33�
� (3)33 (4) 25
�
� (5) None of these
118. What is the ratio between the total population of states A and B respectively for all the years together? (1)37:45 (2)37:43 (3)43:37 (4)45 : 37 (5) None of these 119. What is the ratio between the total population of states A and B respectively for all the years together ? (1)37:45 (2) 37:43 (3)43:37 (4)45 : 37 (5) None of these 120. Population of stale A in 2005 is what per cent of its total population for all the years together ?
(1) 17�
�� % (2) 16
�
�� % (3) 16
�
�� % (4) 17
�
�� % (5) None of these