SBEACH High-Frequency Storm Erosion Model Study … · SBEACH High-Frequency Storm Erosion Model...
48
SBEACH High-Frequency Storm Erosion Model Study for Sarasota County Final Report by S. Y. Wang and M. Manausa Sponsored by Florida Department of Environmental Protection, Bureau of Beaches and Coastal Systems Submitted by Beaches and Shores Resource Center Florida State University March 2013
Transcript of SBEACH High-Frequency Storm Erosion Model Study … · SBEACH High-Frequency Storm Erosion Model...

SBEACH High-Frequency Storm Erosion Model Study
for Sarasota County
Final Report
by
S. Y. Wang and M. Manausa
Sponsored by
Florida Department of Environmental Protection,
Bureau of Beaches and Coastal Systems
Submitted by
Beaches and Shores Resource Center
Florida State University
March 2013
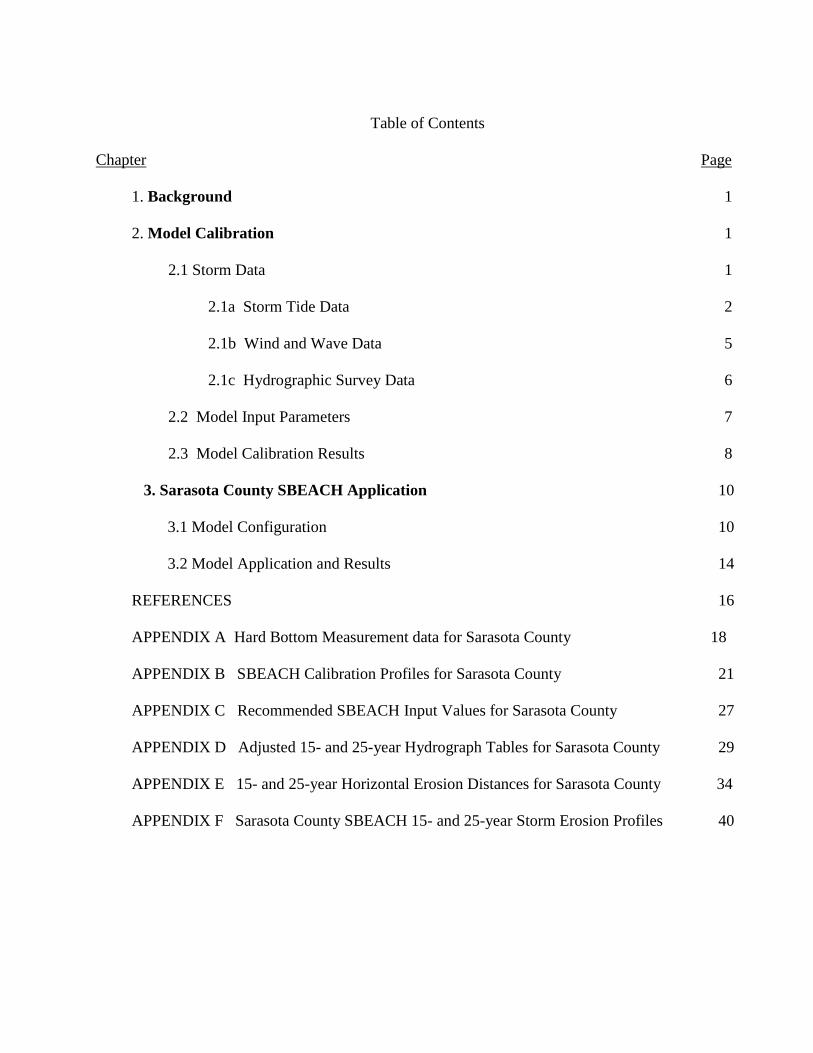
Table of Contents
Chapter Page
1. Background 1
2. Model Calibration 1
2.1 Storm Data 1
2.1a Storm Tide Data 2
2.1b Wind and Wave Data 5
2.1c Hydrographic Survey Data 6
2.2 Model Input Parameters 7
2.3 Model Calibration Results 8
3. Sarasota County SBEACH Application 10
3.1 Model Configuration 10
3.2 Model Application and Results 14
REFERENCES 16
APPENDIX A Hard Bottom Measurement data for Sarasota County 18
APPENDIX B SBEACH Calibration Profiles for Sarasota County 21
APPENDIX C Recommended SBEACH Input Values for Sarasota County 27
APPENDIX D Adjusted 15- and 25-year Hydrograph Tables for Sarasota County 29
APPENDIX E 15- and 25-year Horizontal Erosion Distances for Sarasota County 34
APPENDIX F Sarasota County SBEACH 15- and 25-year Storm Erosion Profiles 40

List of Figures
Figure Page
1 Hurricane Gabrielle track, September 2001 3
2 Comparison between measured and calculated storm tides in Naples 3
3 Peak storm tide level along the shoreline for Hurricane Gabrielle 4
4 Best estimated variable wave conditions for Hurricane Gabrielle, 2001 5
5 Locations of profiles and storm tides used in SBEACH calibration 6
6 Comparisons of average contour recessions between measured and SBEACH
model computed for Hurricanes Gabrielle 10
7 Sediment data distributions in Sarasota County 11
8 Hydrographs of 15- and 25-year for Sarasota County 12
9 15-year hydrographs for Sarasota County profiles in SBEACH application 13
10 25-year hydrographs for Sarasota County profiles in SBEACH application 13
11 FDEP profile range locations along the Sarasota County shoreline 15
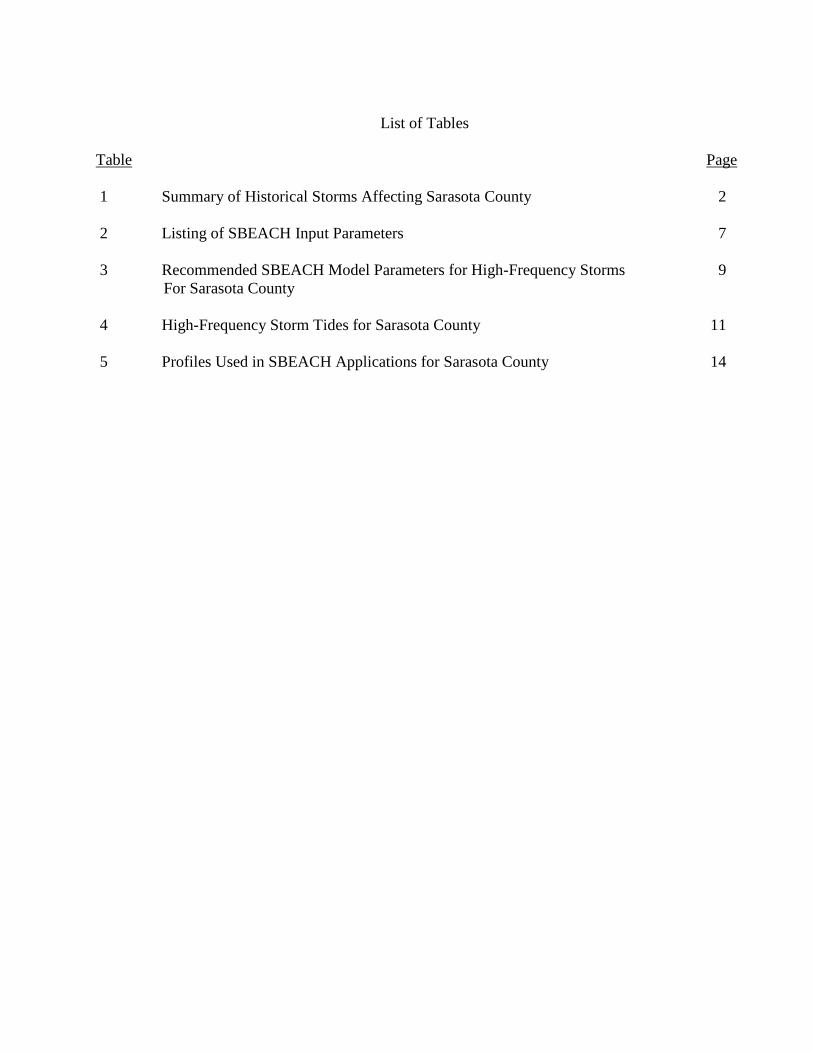
List of Tables
Table Page
1 Summary of Historical Storms Affecting Sarasota County 2
2 Listing of SBEACH Input Parameters 7
3 Recommended SBEACH Model Parameters for High-Frequency Storms 9
For Sarasota County
4 High-Frequency Storm Tides for Sarasota County 11
5 Profiles Used in SBEACH Applications for Sarasota County 14

1
1. Background
High-Frequency storm tide studies have been conducted by the Beaches and Shores Resource
Center (BSRC) for 14 of the 24 CCCL studied counties since 2009. Hydrographs with return
intervals of 15- and 25-year were developed for the application of dune erosion models and are
available through the BSRC website at: http://beach10.beaches.fsu.edu/index.html. Due to
increased usage of SBEACH (Storm-Induced BEAch CHange) by coastal engineers for coastal
projects in Florida, the Bureau of Beaches and Coastal Systems (BBCS) of Florida Department
of Environmental Protection (FDEP) has contracted with the BSRC to conduct the model
calibration and application on a county by county basis. At present, SBEACH model studies
have been completed for six counties: Walton , Okaloosa, Brevard, St. Johns, Volusia and Indian
River by Leadon and Nguyen (2009 and 2010). As a result, the SBEACH model for high-
frequency storm event is currently used in project ranking for beach management program,
verification for armoring project and shore/dune protection project permit application.
The SBEACH model developed by the U.S. Army Corps of Engineers (USACE), is an
empirically based numerical model for predicting short-term profile response to storms. The
SBEACH model calculates beach profile changes with emphasis on beach and dune erosion and
bar formation and movement. It is a cross-shore sediment transport model so the longshore
processes are considered to be uniform and neglected in the calculation of profile changes. The
model was initially formulated using data from prototype-scale laboratory experiments and
further developed and verified based on some field measurements and sensitivity testing (Larson
and Kraus 1989, 1991; Larson, Kraus and Brynes 1990).
To accurately apply the SBEACH model for a high-frequency storm event, it is essential to have
the model calibrated in the project area under the similar storm conditions. This requires detailed
pre- and post-storm beach profile surveys that represent a storm's effects upon cross-shore beach
change and coincident information regarding the wind, wave and water level conditions. This
study presents eroded dune and beach profiles due to high frequency storm events with return
intervals of 15 years and 25 years in Sarasota County using the latest version of the SBEACH
model. All data resources for calibration and input files required to run the SBEACH model are
documented.
2. Model Calibration
Searches for available surveyed beach profiles associated with a tropical storm or hurricane for
Sarasota County resulted in a limited data set with sufficient completeness and quality for model
calibration. It is found that a set of beach profiles in part of Sarasota County were surveyed
before and after Hurricane Gabrielle of 2001. The model calibration became possible with the
help of BSRC's 2-D surge model to make up for the lack of measured storm tides on the open
coast.
2.1 Storm Data
2
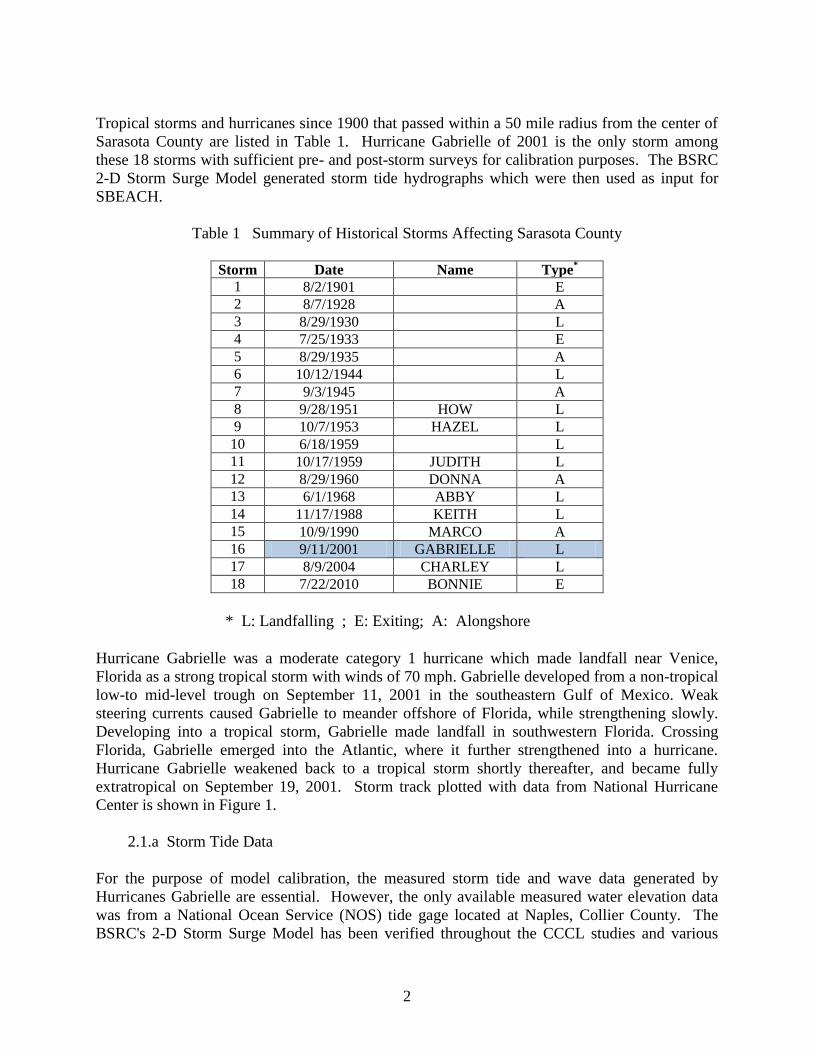
Tropical storms and hurricanes since 1900 that passed within a 50 mile radius from the center of
Sarasota County are listed in Table 1. Hurricane Gabrielle of 2001 is the only storm among
these 18 storms with sufficient pre- and post-storm surveys for calibration purposes. The BSRC
2-D Storm Surge Model generated storm tide hydrographs which were then used as input for
SBEACH.
Table 1 Summary of Historical Storms Affecting Sarasota County
Storm Date Name Type
*
1 8/2/1901 E
2 8/7/1928 A
3 8/29/1930 L
4 7/25/1933 E
5 8/29/1935 A
6 10/12/1944 L
7 9/3/1945 A
8 9/28/1951 HOW L
9 10/7/1953 HAZEL L
10 6/18/1959 L
11 10/17/1959 JUDITH L
12 8/29/1960 DONNA A
13 6/1/1968 ABBY L
14 11/17/1988 KEITH L
15 10/9/1990 MARCO A
16 9/11/2001 GABRIELLE L
17 8/9/2004 CHARLEY L
18 7/22/2010 BONNIE E
* L: Landfalling ; E: Exiting; A: Alongshore
Hurricane Gabrielle was a moderate category 1 hurricane which made landfall near Venice,
Florida as a strong tropical storm with winds of 70 mph. Gabrielle developed from a non-tropical
low-to mid-level trough on September 11, 2001 in the southeastern Gulf of Mexico. Weak
steering currents caused Gabrielle to meander offshore of Florida, while strengthening slowly.
Developing into a tropical storm, Gabrielle made landfall in southwestern Florida. Crossing
Florida, Gabrielle emerged into the Atlantic, where it further strengthened into a hurricane.
Hurricane Gabrielle weakened back to a tropical storm shortly thereafter, and became fully
extratropical on September 19, 2001. Storm track plotted with data from National Hurricane
Center is shown in Figure 1.
2.1.a Storm Tide Data
For the purpose of model calibration, the measured storm tide and wave data generated by
Hurricanes Gabrielle are essential. However, the only available measured water elevation data
was from a National Ocean Service (NOS) tide gage located at Naples, Collier County. The
BSRC's 2-D Storm Surge Model has been verified throughout the CCCL studies and various
3
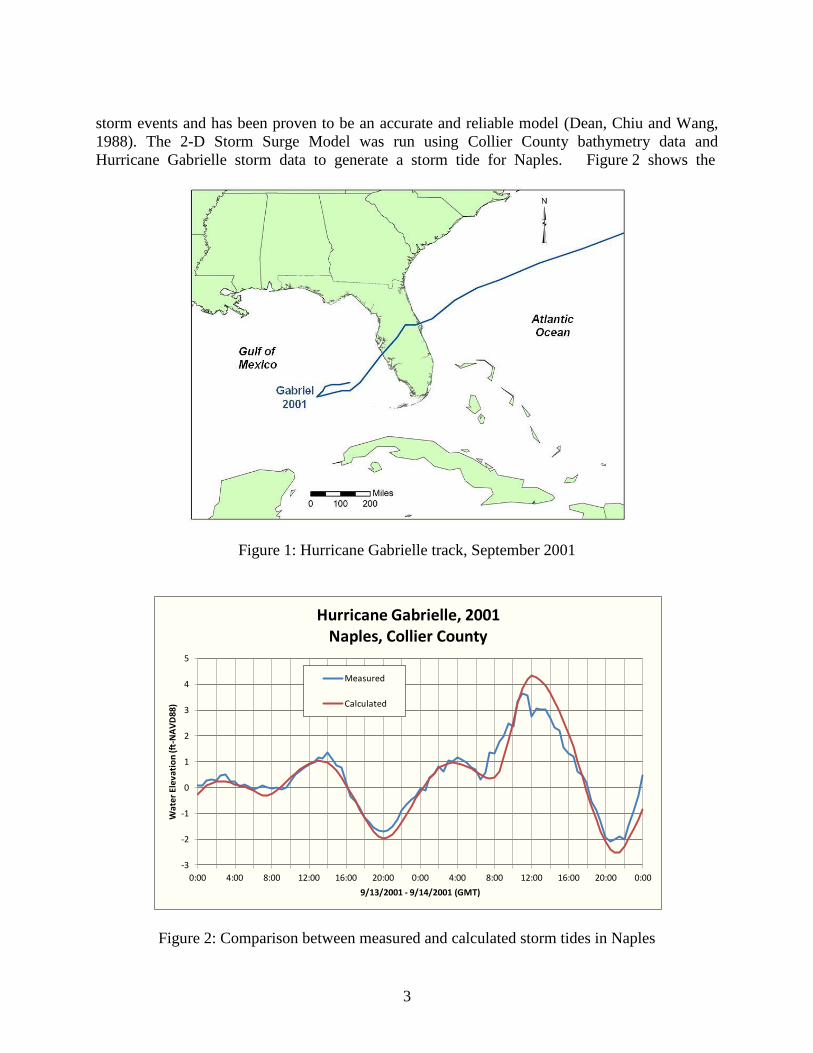
storm events and has been proven to be an accurate and reliable model (Dean, Chiu and Wang,
1988). The 2-D Storm Surge Model was run using Collier County bathymetry data and
Hurricane Gabrielle storm data to generate a storm tide for Naples. Figure 2 shows the
Figure 1: Hurricane Gabrielle track, September 2001
Figure 2: Comparison between measured and calculated storm tides in Naples
-3
-2
-1
0
1
2
3
4
5
0:00 4:00 8:00 12:00 16:00 20:00 0:00 4:00 8:00 12:00 16:00 20:00 0:00
Wat
er
Elev
atio
n (f
t-N
AV
D88
)
9/13/2001 - 9/14/2001 (GMT)
Hurricane Gabrielle, 2001Naples, Collier County
Measured
Calculated

4
comparison between model calculated and measured storm tides in Naples. The model
calculated storm tide is about 0.5 foot higher than the measured one, due to the fact that the tide
gage is located about 350 feet offshore, where only partial wave setup is recorded during
Gabrielle while the 2-D Storm Surge Model generated a storm tide with full wave setup. The 2-
D Storm Surge Model demonstrated its accuracy in post-storm tide calculations, therefore the 2-
D grid systems and associated hydrological data of Sarasota County from the CCCL study were
used to generate storm tide data from Hurricane Gabrielle for Sarasota County. Hurricane track,
pressure deficit, and radius to the maximum wind of Gabrielle were input to the 2-D Storm Surge
Model. The model then ran and calculated the total storm tide, i.e. surge from barometric
pressure deficit and wind stress plus wave dynamic setup and astronomical tide, for a total of 7
locations along the study area. Figure 3 displays the result of model calculated and measured
total storm tides.
Figure 3: Peak storm tide level along the shoreline for Hurricane Gabrielle

5
2.1.b Wind and Wave Data
No wave data was recorded in the study area during Hurricane Gabrielle in 2001. WIS stations
73277 and 73279 which are 10 miles offshore of Venice, only provided hindcast wave data from
1980 to 1999. West Florida Central buoy 42022 and NDBC buoy 42099 did not begin to record
wave data until 2004 and 2007, respectively. However, since the wind speed and direction data
were available from the National Hurricane Center (Lawrence and Blake, 2002), the significant
deep wave height, , and dominant period, can be estimated by empirical equations as shown
in the following:
where is the maximum wind speed in m/s. These equations were developed and verified
by Maynord et al (2011) and its calculated results were very close to the buoy data for
Hurricanes Lili of 2002, Claudette of 2003, Ivan of 2004, Katrina and Rita of 2005. Figure 4
shows the resulting deep water wave data by applying the measured wind speed to these
equations for Hurricane Gabrielle in 2001.
Figure 4: Best estimated variable wave conditions for Hurricane Gabrielle, 2001
0.00
1.00
2.00
3.00
4.00
5.00
6.00
7.00
8.00
0.00
1.00
2.00
3.00
4.00
5.00
6.00
7.00
8.00
9.00
10.00
Hs (ft.)
Tp(sec.)
Sign
ific
ant
Wav
e H
eigh
t. H
s (
ft.)
Do
min
ant
Wav
eP
erio
d, T
p (
sec.
)Hurricane Gabrielle, September 2001
Date/Time (UTC)
9/13 6 12 18 9/14 6 12 18 9/15 6 12 18 9/16

6
2.1.c Hydrographic Survey Data
There was no beach profile specifically surveyed for the purpose of Hurricane Gabrielle in
Sarasota County. However, some beach profile surveys were available through the FDEP
website (Reference 4) due to beach nourishment projects in the Venice area. The two phases of
Venice Beach nourishment projects started in August 1994 and ended in May 1996. A total of
1.8 million cubic yards of sand were put on the 3.3 miles of beach from R-116 to R-133. Annual
beach profile surveys after nourishment were performed for project monitoring purposes. Beach
profiles surveyed in June 2001 and May 2002 from R-121 to R-133 were selected initially as pre-
storm and post-storm profiles for model calibration, respectively. The June 2001 beach profiles
were surveyed 6 years post beach nourishment when it had reached a stable state, which is
clearly shown in the shoreline and volume changes plots at the BSRC website (Reference 2).
The May 2002 beach profiles were surveyed 7 months after Hurricane Gabrielle made impact on
the Venice Bach area in September 2001. A total of 9 profiles, R-121, R-123A, R-124, R-125,
T127, R-129, R-130, R-132, and R-133, all of which showed consistent erosions were used in
model calibrations. The map in Figure 5 shows the location of the profiles selected for the
SBEACH model calibration and the storm tides calculated with the 2-D storm surge model are
also indicated relative to the profile locations.
Figure 5: Locations of profiles and storm tides used in SBEACH calibration

7
2.2 Model Input Parameters
The SBEACH model's primary input includes profile, storm and sediment data. Profile data are
prepared according to its locations on a "reach" of shoreline. Median grain size of the beach
material is one of the primary sediment data required. Other input includes model parameters
such as grid size, time step, and the transport rate coefficient.
The beach profiles, called a reach in the SBEACH model, were represented in the model using a
constant grid scheme with grid cell spacing of 5 feet in order to generate a detailed result. Each
reach was approximately 3,400 feet long and had about 680 cells of 5 feet across, well below the
1,000 cell limit allowed by the SBEACH model. Sediment data was obtained from the beach
nourishment project in the Venice area (Reference 2). Beach surface and beach core boring
sampled for the beach nourishment project in 1994 showed the average mean grain size was
about 0.35mm.
The average eroded beach slope measured from the 9 selected May 2002 (post-storm) surveyed
profiles was found to be mild, with a range from 7 to 11 degrees. The maximum slope prior to
avalanching is the maximum slope angle, ranging from 15 to 90 degrees, that the profiles is
allowed to achieve. Different angles were tested during the calibration and erosion results were
not sensitive to this parameter. It was due to the fact that SBEACH calculated erosion slopes did
not reach the minimum angle of 15 degrees for any of the post-storm survey profiles. Other
parameters tested in the model calibration were the land ward surf zone depth, water
temperature, and the transport decay factor. The default values are shown in Table 2.
Table 2 Listing of SBEACH Input Parameters
Parameters Unit Default Value Range of Recommended Values
Transport rate coefficient, m4 /N 1.75 e-006 0.25 e-006 - 2.5 e-006
Overwash transport parameter 0.005 0.002 - 0.008
Coefficient for slope dependent term, m2/s 0.002 0.001 - 0.005
Transport rate decay coeff. multiplier, m-1 0.5 0.1 - 0.5
Landward surf zone depth ft. 1.0 0.5 - 1.6
Effective grain size (mean D50) mm 0.35 0.15 – 1.0
Maximum slope prior to avalanching degree 45 15 - 90 deg.
Water temperature degree, C 20 0 - 40

8
2.3 Model Calibration Results
The sensitivity evaluation resulted in initially setting most of the model input parameters at or
near the default values as described above. Wind speed and direction, available as options
during the model input were not included due to its insignificant effect in the model results. For
each SBEACH run, only the hydrographs without wave setup were entered since the SBEACH
model calculated and added the wave setup internally to reach the desired final water level. It
was noted the maximum water elevation values from SBEACH output at each of the calibration
profiles showed significantly lower peak storm tide elevations than values generated by the 2-D
storm surge model (Leadon and Nguyen, 2010). Therefore, the hydrographs input from the initial
calibration work were adjusted a sufficient amount, so the peak water elevation output from
SBEACH were very similar to the peak storm tide values from Hurricane Gabrielle.
For the purpose of area wide application of the SBEACH model in Sarasota County, the 9
selected profiles represented the most windward area being impacted by Hurricane Gabrielle.
The storm tide levels from 7.8 feet to 8.4 feet calculated for the 9 profiles are equivalent to a
return intervals of 30 years (BSRC, 2011), which is qualified as a high frequency storm event.
The average measured versus the SBEACH calculated erosion distance for contours from 0 to 8
feet above NAVD 88 of the 9 profiles were used as the principle basis for determining the
calibration parameters setting.
Since Sarasota County consists mainly of low level beaches and barrier islands, like Lido Key
and Longboat Key, the overwash transport parameter was scrutinized during model calibration.
The overwash algorithm in the SBEACH model was improved by the incorporation of more
advanced hydrodynamics and sediment transport considerations. The model was validated at
Ocean City, and at Assateague Island, MD, the former representing a location with a protective
dune typical of shore protection projects and the latter location representing a low and wide
barrier island in a nature condition (Larson, Wise and Kraus, 2004).
The estimated variable wave heights and periods (Figure 4) were first tested in the model
calibration. For the purpose of simpler county wide application of SBEACH, a constant wave
height and period will be used. Different constant wave heights and periods were later tested for
a good calibration result. It was found that 7 feet wave height and 7 seconds wave period
matched well with the calibration results from the estimated variable wave conditions. It is noted
that even 7 seconds wave period was higher than the estimated one, any wave periods smaller
than 7 seconds would generate unrealistic erosions.
Starting with the default values, a series of values for each calibration parameter were tested. It
was able to determine some of the parameters were insensitive during the tests as mentioned
above. The overwash parameter, the coefficient for slope dependent term, and the transport rate
coefficient, were found to be very significant to the calibration results, so they were adjusted
individually until reasonable agreement with the measured erosions were achieved.
Hard bottoms (HB) in Sarasota County consist of macroalgae, sponges, stony corals. octocorals
and other organisms exist near both nearshore and offshore. The algorithm developed for HB

9
features in SBEACH (Larson and Kraus, 1998) is applicable to HB appearing on the dune,
foreshore, and surf zoon, but not in the far offshore, beyond the influence of breaking waves.
Available HB measurements data for Sarasota County are listed in Appendix A. A series of tests
to include HB in SBEACH for the calibration profiles showed HB were so far offshore that no
difference were found in the beach erosions between the profiles with and without HB.
The final parameter values were determined as those providing the best presentation of measured
erosions for the 9 selected profiles. The final parameter values resulting from the model
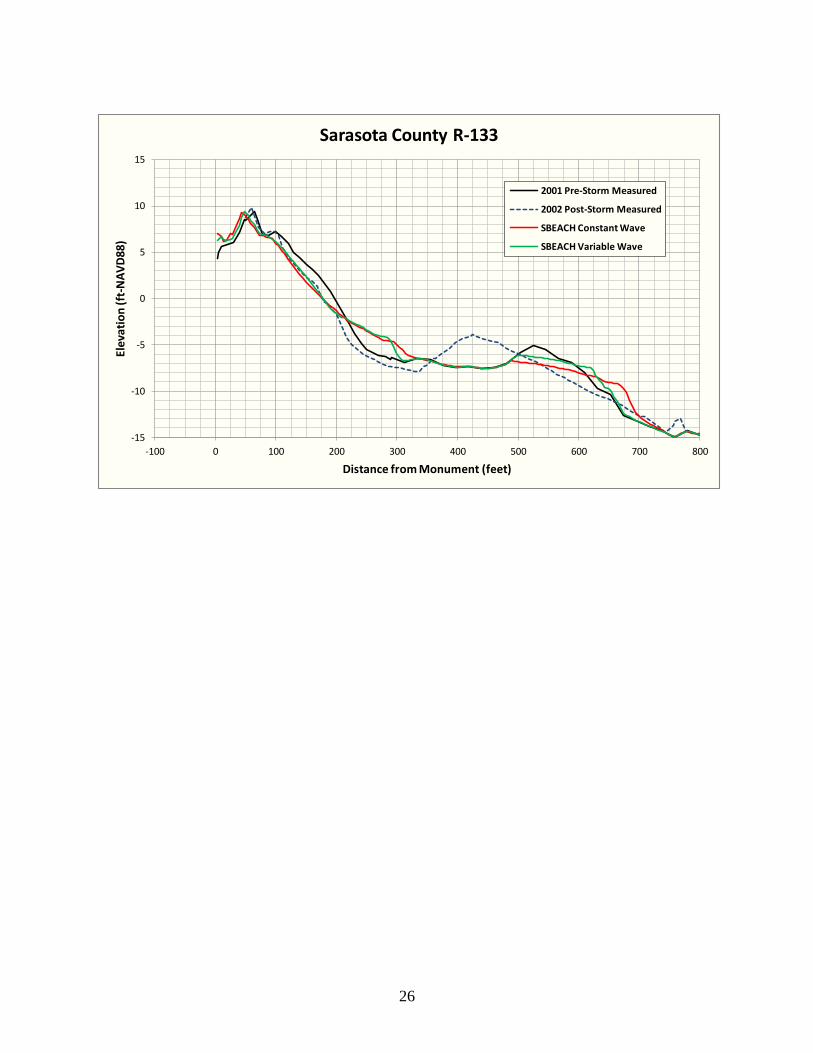
calibration are summarized in Table 3. Figure 6 shows comparisons of average contour
recessions between measured and SBEACH model computed for Hurricane Gabrielle based on
the final model parameters described above. Plots of pre-storm, post-storm, and SBEACH model
predicted profiles with the final calibration parameters for each of the 9 profiles are presented in
the Appendix B.
Table 3 Recommended SBEACH Model Parameters for Sarasota County
Parameters Unit Recommended Values for HF
Storm for Sarasota County
Transport rate coefficient, m4 /N 0.5 e-006
Overwash transport parameter 0.002
Coefficient for slope dependent term, m2/s 0.005
Transport rate decay coeff. multiplier, m-1 0.5
Landward surf zone depth ft. 1.0
Effective grain size (mean D50) mm 0.35
Maximum slope prior to avalanching degree 15
Water temperature degree, C 28
Wave Height, H ft. 7
Wave Period, Tp Sec. 7
Wave Direction, α degree 0 (shore-normal)
The 9 calibration profiles are located in the Venice area and span a distance of 2.3 miles were
selected for the SBEACH model calibration for Hurricanes Gabrielle in this study. Average
erosion distances above 0 foot NAVD88 at each foot contour were compared between the model
predicted and measured so the best SBEACH model parameters could be achieved.
It is noted from Figure 6 and Appendix B that the model predicted average erosions for constant
waves generally agreed with the variable waves. Therefore, it is reasonable to use the
recommended constant waves for the SBEACH model application in the Sarasota County area.
Differences of average erosions between model predicted with constant waves and pre- and post-

10
storm measured were within 7 feet at all contours. Therefore, the SBEACH model predicted
erosions with the calibrated parameters (Table 3) came to close agreement with the measured
ones for most profiles, especially for R-124 and R-125.
Figure 6: Comparisons of average contour recessions between measured and SBEACH model
computed for Hurricanes Gabrielle
3. Sarasota County SBEACH Application
3.1 Model Configuration
Application of SBEACH model in Sarasota County for high-frequency storm erosion was based
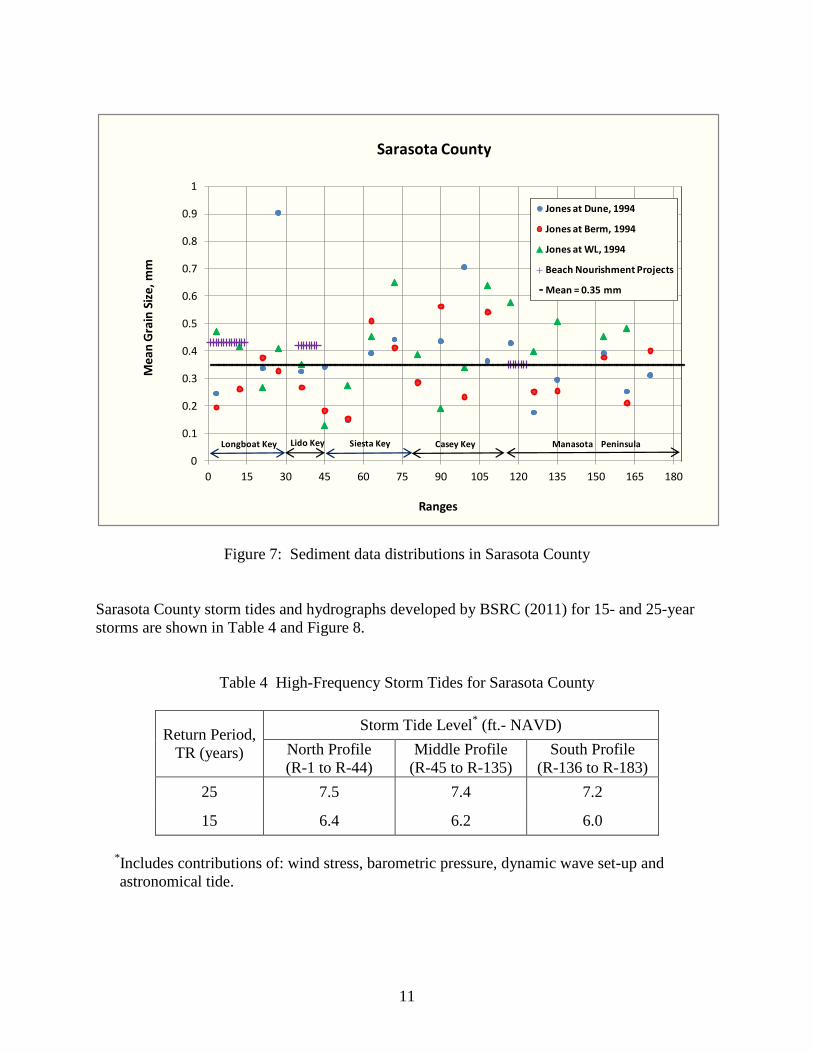
on the model calibration results, as shown in Table 3 of the previous section. Sediment data
were obtained from beach nourishment projects for Longboat Key, Lido and Venice from 1994
to 1998 (Reference 2), and from the sediment distribution analysis for every nine ranges in
Sarasota County by Jones (1994). Figure 7 summarizes these sediment data and an average
mean grain size of 0.35 mm was considered the best fit for county wide model applications.
0
1
2
3
4
5
6
7
8
9
10
11
12
0.0 5.0 10.0 15.0 20.0 25.0 30.0 35.0 40.0
Co
nto
ur E
leva
tio
n (
ft.-
NA
VD
88)
Average Erosion Distance (ft.)
Sarasota County Average Contour Changesfor Hurricane Gabrielle, 2001
Measured
SBEACH Computed W/Costant Waves
SBEACH Computed W/Variable Waves
11
Figure 7: Sediment data distributions in Sarasota County
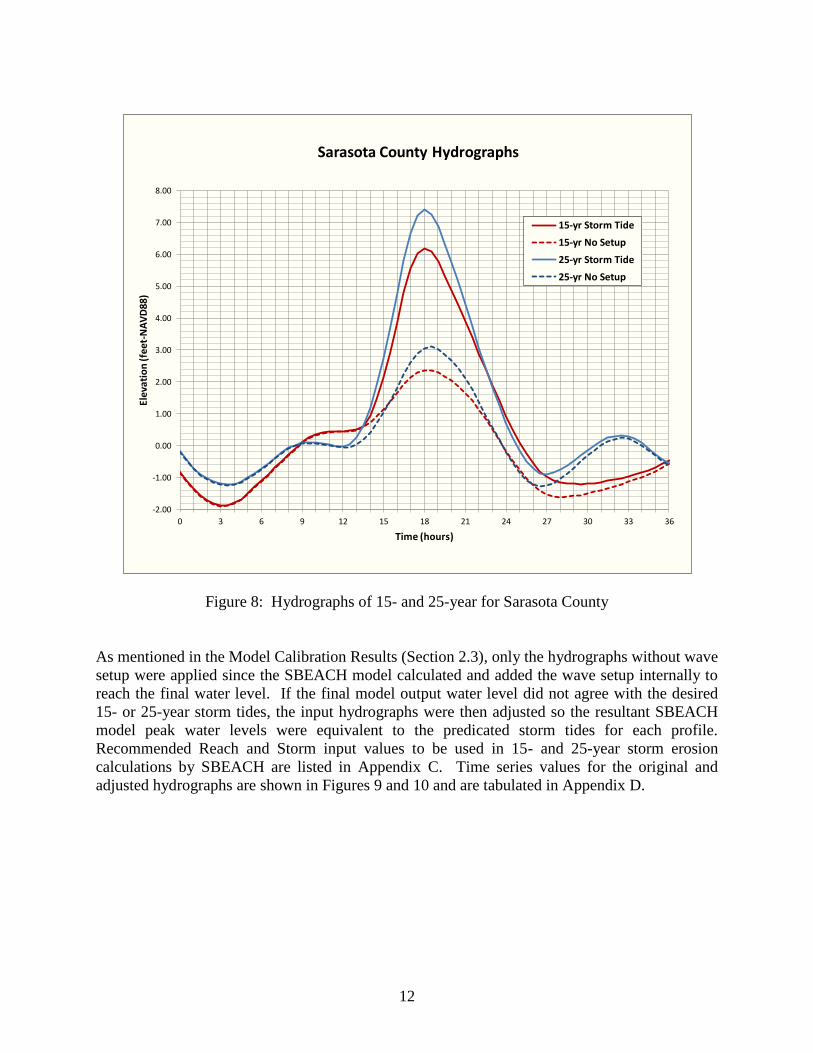
Sarasota County storm tides and hydrographs developed by BSRC (2011) for 15- and 25-year
storms are shown in Table 4 and Figure 8.
Table 4 High-Frequency Storm Tides for Sarasota County
Return Period,
TR (years)
Storm Tide Level* (ft.- NAVD)
North Profile
(R-1 to R-44)
Middle Profile
(R-45 to R-135)
South Profile
(R-136 to R-183)
25 7.5 7.4 7.2
15 6.4 6.2 6.0
*
Includes contributions of: wind stress, barometric pressure, dynamic wave set-up and
astronomical tide.
0
0.1
0.2
0.3
0.4
0.5
0.6
0.7
0.8
0.9
1
0 15 30 45 60 75 90 105 120 135 150 165 180
Jones at Dune, 1994
Jones at Berm, 1994
Jones at WL, 1994
Beach Nourishment Projects
Mean = 0.35 mm
Sarasota CountyM
ean
Gra
in S
ize,
mm
Ranges
Longboat Key Lido Key Siesta Key Casey Key Manasota Peninsula
12
Figure 8: Hydrographs of 15- and 25-year for Sarasota County
As mentioned in the Model Calibration Results (Section 2.3), only the hydrographs without wave
setup were applied since the SBEACH model calculated and added the wave setup internally to
reach the final water level. If the final model output water level did not agree with the desired
15- or 25-year storm tides, the input hydrographs were then adjusted so the resultant SBEACH
model peak water levels were equivalent to the predicated storm tides for each profile.
Recommended Reach and Storm input values to be used in 15- and 25-year storm erosion
calculations by SBEACH are listed in Appendix C. Time series values for the original and
adjusted hydrographs are shown in Figures 9 and 10 and are tabulated in Appendix D.
-2.00
-1.00
0.00
1.00
2.00
3.00
4.00
5.00
6.00
7.00
8.00
0 3 6 9 12 15 18 21 24 27 30 33 36
Elev
atio
n (f
eet-
NA
VD
88)
Time (hours)
Sarasota County Hydrographs
15-yr Storm Tide
15-yr No Setup
25-yr Storm Tide
25-yr No Setup

13
Figure 9: 15-year hydrographs for Sarasota County profiles in SBEACH application
Figure 10: 25-year hydrographs for Sarasota County profiles in SBEACH application
-2.0
-1.0
0.0
1.0
2.0
3.0
4.0
5.0
6.0
7.0
0 3 6 9 12 15 18 21 24 27 30 33 36
Wat
er E
leva
tio
n (f
t.-N
AV
D88
)
Time (hours)
Sarasota County SBEACH Hydrograph InputsFor 15-Year Return Period
R1-R44
R45-R62
R63-R159
R160-R183
15 yr - storm tide
15 yr - no setup
-2.0
-1.0
0.0
1.0
2.0
3.0
4.0
5.0
6.0
7.0
8.0
0 3 6 9 12 15 18 21 24 27 30 33 36
Wat
er E
leva
tio
n (f
t.-N
AV
D88
)
Time (hours)
Sarasota County SBEACH Hydrograph InputsFor 25-Year Return Period
R1-R44
R45-R62
R63-R159
R160-R183
25 yr - storm tide
25 yr - no setup

14
3.2 Model Application and Results
Tables showing the horizontal eroded distances between the initial profile and the eroded profiles
for specific elevation interval for 15- and 25-year storms are listed in Appendix E. Plots of the
initial profile and the associated eroded profiles generated from SBEACH for the 15- and 25-
year return periods for 181 of 183 range location profiles of Sarasota County are provided in
Appendix F. R-30 and R-45 are located by inlets were not included since the profiles were
surveyed across the inlet and SBEACH could not produce reasonable eroded profiles. In
addition to the regular runs with sandy beach profiles, some profiles with rock armor revetments,
like R-64, R-65, and R-66 were tested with a default value of scour attenuation coefficient. The
results from these profiles were not included in this study, since there is no calibration data
available for profiles with sea wall and revetment at present time. The survey profiles used as
the input profiles in SBEACH are listed in Table 5.
Table 5 Profiles Used in SBEACH Application for Sarasota County
Ranges Beach Profiles
Survey Dates
Offshore Profiles
Survey Dates
1-29 Nov. 2011 Nov. 2011
30 Sept. 1993, Aug. 2005 Sept. 2001
31-44 July 2012 July 2012
45-46 Dec. 2001 Dec. 2001
47 May 2009 Aug. 2005
48 Aug. 2005 Aug. 2005
49-61 May 2009 Aug. 2005
61A Aug. 2005 Aug. 2005
62-63 May 2009 Aug. 2005
64-83 Aug. 2010 Aug. 2010
84-108 May 2009 May 2009
109 May 2009 Aug. 2005
110-114 May 2009 May 2009
115-136 Aug. 2011 Aug. 2011
137-157 May/June 2009 May/June 2009
158 June 2009 Aug. 2005
159-163 June 2009 June 2009
164 June 2009 Sept. 2005
165-166 June 2009 June 2009
167 June 2009 Aug. 2005
168-183 June 2009 June 2009
The plots in Appendix F are shown in the NAVD88 vertical datum. The map in Figure 11 below
depicts the FDEP profile range locations along the Sarasota County shoreline.

15
Figure 11: FDEP profile range locations along the Sarasota County shoreline

16
REFERENCES
1. BSRC, “Inclusion of Tropical Storms for the Combined Total Storm Tide Frequency
Restudy for Sarasota County”, Beaches and Shores Resource Center, Florida State
University, May 2011
2. BSRC Website for Beach Nourishment, Beaches and Shores Resource Center, Florida
State University. http://beach10.beaches.fsu.edu/beach15/venice/venice.html.
3. Dear, R.G., Chiu, T.Y. and Wang, S.Y., “Combined Total Storm Tide Frequency Analysis
for Sarasota County”, Beaches and Shores Resource Center, Florida State University,
August 1988.
4. Florida DEP Bureau of Beaches and Coastal Systems, beach and offshore hydrographic
survey database, http://www.dep.state.fl.us/beaches/data.
5. Jones, V.L., "Field Evaluation of Equilibrium Beach Profile Concept: Southwest Florida",
Thesis, University of Florida, 1994.
6. Larson, M., and Kraus, N.C., “SBEACH: Numerical Model for Simulating Storm- Induced
Beach Change – Empirical Foundation and Model Development”, USACE-CERC,
Technical Report, CERC-89-9 Report 2, July 1989.
7. Larson, M., and Kraus, N.C., “SBEACH: Numerical Model for Simulating Storm- Induced
Beach Change, Representation of Non-erodible (Hard) Bottoms”, USACE-CERC,
Technical Report, CERC-89-9 ,Report 5, August 1998.
8. Larson, M., Wise, R.A. and Kraus, N.C., “Costal Overwash: Part2, Upgrade to SBEACH”,
USACE-CERC, Technical Report ERDC/CHL CHETN-VIX-14, September 2004.
9. Lawrence, M. B. and Black, E. S., "Tropical Cyclone Report, Hurricane Gabrielle, 11-19
September 2001", National Hurricane Center, April 2002.
10. Leadon, M. E. and Nguyen, N. T., “SBEACH Calibration and Erosion Analysis for Walton
County and Okaloosa County, Florida”, Beaches and Shores Resource Center, Florida
State University, June 2009.
11. Leadon, M. E. and Nguyen, N. T., “SBEACH Model Studies for the Florida Atlantic
Coast: Volume1, Model Calibration in Brevard and St. Johns Counties and Volume 2,
Model Application for Brevard, St. Johns, Volusia, and Indian River Counties”, Beaches
and Shores Resource Center, Florida State University, June 2010.
12. Maynord, S.T., Lin, L., Kraus, N.C., Webb, D.W., Lynch, G., Wahl, R. E., Leavell, D.A.,
Yule, D.E., and Dunbar, J.B., "Risks to Navigation at the Matagorda Ship Channel
Entrance, Texas, Phase 2: Evaluation of Significant Risk Factors", ERDC/CHL-TR-11-8,

17
US Army Engineer Research and Development Center, Coastal and Hydraulics
Laboratory, Vicksburg, Mississippi, August 2011.
13. U. S. Department of Commerce, National Oceanic and Atmospheric Administration,
National Hurricane Center, "Hurricane Best Track Files (HURDAT), 1851 – 2011",
http://www.nhc.noaa.gov/data/hurdat/tracks1851to2010_atl_reanal.txt.

18
APPENDIX A
Hard Bottom Measurement data for Sarasota County

19
Sarasota County Hard Bottom Offshore Distance (ft.) from Monuments
Range Start End Start End Date Resource
13 240 270 1380 1440 10/2002 CPE (2011)
14 300 390 10/2002 CPE (2011)
66 210 600 2004 - 2006 CPE (2006)
82 870 1470 2004 - 2006 CPE (2006)
83 760 1500 2004 - 2006 CPE (2006)
85 870 1670 2005 FDEP Aerials
86 1300 2100 2005 FDEP Aerials
87 1300 2100 2005 FDEP Aerials
88 1130 1930 2005 FDEP Aerials
89 825 1625 2005 FDEP Aerials
90 480 520 1000 1800 2005 FDEP Aerials
91 1040 1840 2005 FDEP Aerials
92 825 1625 2005 FDEP Aerials
93 825 1625 2005 FDEP Aerials
94 910 1710 2005 FDEP Aerials
125 100 150 2/2003 Coastal Tech (2003)
126 1400 2100 2/2003 Coastal Tech (2003)
127 700 1450 2/2003 Coastal Tech (2003)
128 1100 1550 2/2003 Coastal Tech (2003)
129a 950 1050 1400 1950 2/2003 Coastal Tech (2003)
130 900 1200 1700 1900 2/2003 Coastal Tech (2003)
131 900 1300 2/2003 Coastal Tech (2003)
132 700 1300 2/2003 Coastal Tech (2003)
133 700 1110 1600 1800 2/2003 Coastal Tech (2003)
118 2200 2500 1/2011 CSA (2011)
118a 1800 2560 1/2011 CSA (2011)
119 1980 2240 1/2011 CSA (2011)
119a 1600 2050 1/2011 CSA (2011)
120 700 1150 1660 1920 1/2011 CSA (2011)
120 2750 3140 1/2011 CSA (2011)
120a 1600 1730 2240 2950 1/2011 CSA (2011)
121 1150 1730 2500 2820 1/2011 CSA (2011)
121a 1280 1920 2570 2780 1/2011 CSA (2011)
122 960 1670 2370 2560 1/2011 CSA (2011)
122a 640 1600 1920 2430 1/2011 CSA (2011)
123a 700 1600 1990 2370 1/2011 CSA (2011)
123b 960 1090 1790 2300 1/2011 CSA (2011)
124 830 1800 1/2011 CSA (2011)
126 1470 2180 1/2011 CSA (2011)
127 580 1540 1/2011 CSA (2011)
128 770 1600 1/2011 CSA (2011)
129 700 930 1400 2000 1/2011 CSA (2011)

20
Resources:
Coastal Tech, "Plane View - Fill Area, R-125 to R-133, City of Venice Federal Beach
Maintenance Project, Shore Protection Project, Sarasota County, Florida", February 2003.
CPE, "South Siesta Key Beach Restoration Project, Nearshore Transects, R-64 to R-83", October
2006.
CPE, "2011/2012 Longboat Key beach Nourishment Project, Plan View R-12 to R-17", January,
2011
CSA International Inc., "City of Venice Beach Nourishment Project Year-5 Post Construction
Monitoring Report", Prepared for Coastal Technology Corp., January 2011.
130 770 1380 1700 2000 1/2011 CSA (2011)
131 1000 1380 1/2011 CSA (2011)
132 700 1470 1/2011 CSA (2011)
133 640 1220 1540 1860 1/2011 CSA (2011)
134 1090 1990 1/2011 CSA (2011)
135 960 1790 1/2011 CSA (2011)
136 890 1538 1/2011 CSA (2011)
137 640 1920 1/2011 CSA (2011)
138 640 1600 1/2011 CSA (2011)

21
APPENDIX B
SBEACH Calibration Profiles for Sarasota County

22
-15
-10
-5
0
5
10
15
-100 0 100 200 300 400 500 600 700
Elev
atio
n (f
t-N
AV
D88
)
Distance from Monument (feet)
Sarasota County R-121
2001 Pre-Storm Measured
2002 Post-Storm Measured
SBEACH Constant Wave
SBEACH Variable Wave
-15
-10
-5
0
5
10
15
-100 0 100 200 300 400 500 600 700 800
Elev
atio
n (f
t-N
AV
D88
)
Distance from Monument (feet)
Sarasota County R-123A
2001 Pre-Storm Measured
2002 Post-Storm Measured
SBEACH Constant Wave
SBEACH Variable Wave

23
-15
-10
-5
0
5
10
15
-100 0 100 200 300 400 500 600 700 800
Elev
atio
n (f
t-N
AV
D88
)
Distance from Monument (feet)
Sarasota County R-124
2001 Pre-Storm Measured
2002 Post-Storm Measured
SBEACH Constant Wave
SBEACH Variable Wave
-15
-10
-5
0
5
10
15
-100 0 100 200 300 400 500 600 700 800
Elev
atio
n (f
t-N
AV
D88
)
Distance from Monument (feet)
Sarasota County R-125
2001 Pre-Storm Measured
2002 Post-Storm Measured
SBEACH Constant Wave
SBEACH Variable Wave

24
-15
-10
-5
0
5
10
15
-100 0 100 200 300 400 500 600 700 800
Elev
atio
n (f
t-N
AV
D88
)
Distance from Monument (feet)
Sarasota County T-127
2001 Pre-Storm Measured
2002 Post-Storm Measured
SBEACH Constant Wave
SBEACH Variable Wave
-15
-10
-5
0
5
10
15
-100 0 100 200 300 400 500 600 700 800 900
Elev
atio
n (f
t-N
AV
D88
)
Distance from Monument (feet)
Sarasota County R-129
2001 Pre-Storm Measured
2002 Post-Storm Measured
SBEACH Constant Wave
SBEACH Variable Wave

25
-15
-10
-5
0
5
10
15
-100 0 100 200 300 400 500 600 700 800 900
Elev
atio
n (f
t-N
AV
D88
)
Distance from Monument (feet)
Sarasota County R-130
2001 Pre-Storm Measured
2002 Post-Storm Measured
SBEACH Constant Wave
SBEACH Variable Wave
-15
-10
-5
0
5
10
15
-100 0 100 200 300 400 500 600 700 800 900
Elev
atio
n (f
t-N
AV
D88
)
Distance from Monument (feet)
Sarasota County R-132
2001 Pre-Storm Measured
2002 Post-Storm Measured
SBEACH Constant Wave
SBEACH Variable Wave
26
-15
-10
-5
0
5
10
15
-100 0 100 200 300 400 500 600 700 800
Elev
atio
n (f
t-N
AV
D88
)
Distance from Monument (feet)
Sarasota County R-133
2001 Pre-Storm Measured
2002 Post-Storm Measured
SBEACH Constant Wave
SBEACH Variable Wave

27
APPENDIX C
Recommended SBEACH Input Values

28
Final SBEACH Input Settings – for 15- and 25-year storm erosions in Sarasota County.
For all Storm Tide Hydrographs - Use BSRC-generated 15- and 25-year hydrographs without
wave setup adjusted proportionally to peak elevation shown for each range location segment
shown below; storm duration for all cases is 36 hrs. All elevations listed below are in NAVD88
vertical datum. All wave input depth values were set as deep water with no wave randomization.
All storm time steps were set at 5 minutes. Water temperature is set at 28 deg. Grid cell width is
5 feet.
Final SBEACH Input Values for Range Segments
Input Parameters R1 - R44 R45 - R-62 R63 - R159 R160 - R183
Transport Rate
Coefficient, 0.5 e-006 0.5 e-006 0.5 e-006 0.5 e-006
Overwash Transport
Parameter 0.002 0.002 0.002 0.002
Coefficient for Slope
Dependent Term, 0.005 0.005 0.005 0.005
Transport Rate Decay
Coeff. M ultiplier, 0.5 0.5 0.5 0.5
Landward Surf Zone
Depth (ft.) 1.0 1.0 1.0 1.0
Maximum Slope Prior
to Avalanching 15 15 15 15
Constant Wave
Height (ft.) 7 7 7 7
Constant Wave
Period (sec.) 7 7 7 7
Grain Size (mm) 0.35 0.35 0.35 0.35
Adjusted 15-year
Hydrograph Peak
Elevation (ft.)
4.7
4.8
4.1 4.0
Adjusted 25-year
Hydrograph Peak
Elevation (ft.)
5.8
6.1
5.2 5.0

29
APPENDIX D
Adjusted 15- and 25-year Hydrograph Tables for Sarasota County

30
Sarasota County - Adjusted 15-year Storm Surge Elevation Hydrograph
Time Series Values for SBEACH (ft. - NAVD)
Time Steps (hr.)
StSteps (((((hrs
R1 - R44
R45 - R62
R63 - R159
R160 - R183
0.00 -0.85 -0.85 -0.85 -0.85
0.50 -1.12 -1.12 -1.12 -1.12
1.00 -1.38 -1.38 -1.38 -1.38
1.50 -1.60 -1.60 -1.60 -1.60
2.00 -1.76 -1.76 -1.76 -1.76
2.50 -1.85 -1.85 -1.85 -1.85
3.00 -1.90 -1.90 -1.90 -1.90
3.50 -1.88 -1.88 -1.88 -1.88
4.00 -1.82 -1.82 -1.82 -1.82
4.50 -1.70 -1.70 -1.70 -1.70
5.00 -1.53 -1.53 -1.53 -1.53
5.50 -1.33 -1.33 -1.33 -1.33
6.00 -1.14 -1.14 -1.14 -1.14
6.50 -0.93 -0.93 -0.93 -0.93
7.00 -0.72 -0.72 -0.72 -0.72
7.50 -0.51 -0.51 -0.51 -0.51
8.00 -0.31 -0.31 -0.31 -0.31
8.50 -0.11 -0.11 -0.11 -0.11
9.00 0.07 0.07 0.07 0.07
9.50 0.21 0.21 0.21 0.21
10.00 0.32 0.32 0.32 0.32
10.50 0.38 0.38 0.38 0.38
11.00 0.42 0.42 0.42 0.42
11.50 0.43 0.43 0.43 0.43
12.00 0.43 0.43 0.43 0.43
12.50 0.45 0.45 0.45 0.45
13.00 0.98 1.01 0.86 0.83
13.50 1.17 1.20 1.02 0.99
14.00 1.43 1.47 1.25 1.22
14.50 1.82 1.87 1.59 1.55
15.00 2.29 2.35 2.00 1.95
15.50 2.78 2.85 2.43 2.36
16.00 3.33 3.41 2.91 2.83
16.50 3.84 3.93 3.36 3.26
17.00 4.26 4.37 3.73 3.62
17.50 4.56 4.68 3.99 3.88
18.00 4.72 4.84 4.13 4.01
18.50 4.71 4.83 4.12 4.01
19.00 4.59 4.70 4.01 3.90
19.50 4.38 4.48 3.83 3.72

31
20.00 4.08 4.19 3.57 3.47
20.50 3.74 3.83 3.27 3.18
21.00 3.31 3.39 2.89 2.81
21.50 2.80 2.87 2.45 2.38
22.00 2.25 2.31 1.97 1.91
22.50 1.69 1.73 1.48 1.43
23.00 1.02 1.05 0.89 0.87
23.50 0.35 0.36 0.31 0.30
24.00 -0.15 -0.15 -0.15 -0.15
24.50 -0.48 -0.48 -0.48 -0.48
25.00 -0.77 -0.77 -0.77 -0.77
25.50 -1.03 -1.03 -1.03 -1.03
26.00 -1.26 -1.26 -1.26 -1.26
26.50 -1.43 -1.43 -1.43 -1.43
27.00 -1.54 -1.54 -1.54 -1.54
27.50 -1.60 -1.60 -1.60 -1.60
28.00 -1.63 -1.63 -1.63 -1.63
28.50 -1.61 -1.61 -1.61 -1.61
29.00 -1.57 -1.57 -1.57 -1.57
29.50 -1.54 -1.54 -1.54 -1.54
30.00 -1.50 -1.50 -1.50 -1.50
30.50 -1.45 -1.45 -1.45 -1.45
31.00 -1.39 -1.39 -1.39 -1.39
31.50 -1.33 -1.33 -1.33 -1.33
32.00 -1.28 -1.28 -1.28 -1.28
32.50 -1.21 -1.21 -1.21 -1.21
33.00 -1.14 -1.14 -1.14 -1.14
33.50 -1.07 -1.07 -1.07 -1.07
34.00 -1.00 -1.00 -1.00 -1.00
34.50 -0.90 -0.90 -0.90 -0.90
35.00 -0.80 -0.80 -0.80 -0.80
35.50 -0.68 -0.68 -0.68 -0.68
36.00 -0.56 -0.56 -0.56 -0.56

32
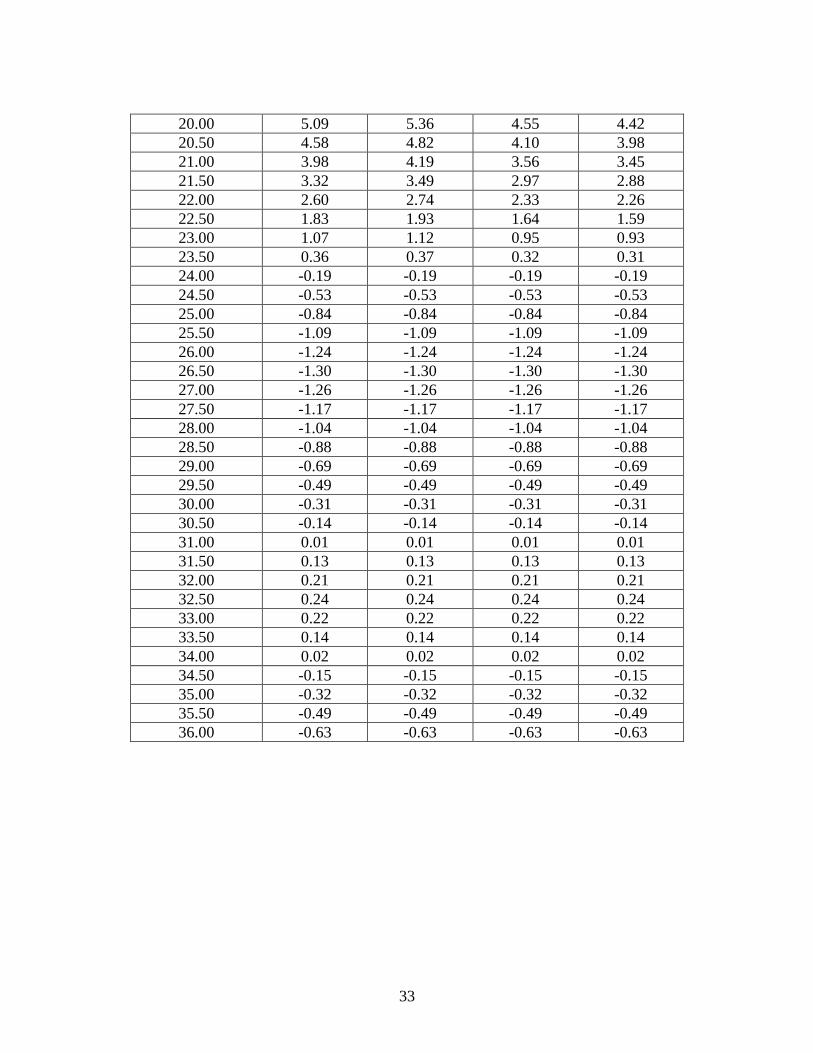
Sarasota County - Adjusted 25-year Storm Surge Elevation Hydrograph
Time Series Values for SBEACH (ft. - NAVD)
Time Steps (hr.) R1 - R44
R45 - R62
R63 - R159
R160 - R183
0.00 -0.19 -0.19 -0.19 -0.19
0.50 -0.46 -0.46 -0.46 -0.46
1.00 -0.72 -0.72 -0.72 -0.72
1.50 -0.93 -0.93 -0.93 -0.93
2.00 -1.07 -1.07 -1.07 -1.07
2.50 -1.16 -1.16 -1.16 -1.16
3.00 -1.23 -1.23 -1.23 -1.23
3.50 -1.27 -1.27 -1.27 -1.27
4.00 -1.24 -1.24 -1.24 -1.24
4.50 -1.16 -1.16 -1.16 -1.16
5.00 -1.04 -1.04 -1.04 -1.04
5.50 -0.90 -0.90 -0.90 -0.90
6.00 -0.76 -0.76 -0.76 -0.76
6.50 -0.60 -0.60 -0.60 -0.60
7.00 -0.42 -0.42 -0.42 -0.42
7.50 -0.25 -0.25 -0.25 -0.25
8.00 -0.11 -0.11 -0.11 -0.11
8.50 -0.01 -0.01 -0.01 -0.01
9.00 0.05 0.05 0.05 0.05
9.50 0.07 0.07 0.07 0.07
10.00 0.06 0.06 0.06 0.06
10.50 0.03 0.03 0.03 0.03
11.00 -0.01 -0.01 -0.01 -0.01
11.50 -0.03 -0.03 -0.03 -0.03
12.00 -0.05 -0.05 -0.05 -0.05
12.50 -0.04 -0.04 -0.04 -0.04
13.00 0.08 0.09 0.07 0.07
13.50 0.36 0.38 0.32 0.31
14.00 0.79 0.83 0.70 0.68
14.50 1.33 1.40 1.19 1.16
15.00 1.95 2.05 1.74 1.69
15.50 2.68 2.83 2.40 2.33
16.00 3.48 3.66 3.11 3.02
16.50 4.27 4.49 3.82 3.70
17.00 4.98 5.24 4.45 4.32
17.50 5.51 5.80 4.93 4.79
18.00 5.81 6.12 5.20 5.05
18.50 5.88 6.19 5.26 5.11
19.00 5.76 6.06 5.15 5.00
19.50 5.46 5.75 4.89 4.74
33
20.00 5.09 5.36 4.55 4.42
20.50 4.58 4.82 4.10 3.98
21.00 3.98 4.19 3.56 3.45
21.50 3.32 3.49 2.97 2.88
22.00 2.60 2.74 2.33 2.26
22.50 1.83 1.93 1.64 1.59
23.00 1.07 1.12 0.95 0.93
23.50 0.36 0.37 0.32 0.31
24.00 -0.19 -0.19 -0.19 -0.19
24.50 -0.53 -0.53 -0.53 -0.53
25.00 -0.84 -0.84 -0.84 -0.84
25.50 -1.09 -1.09 -1.09 -1.09
26.00 -1.24 -1.24 -1.24 -1.24
26.50 -1.30 -1.30 -1.30 -1.30
27.00 -1.26 -1.26 -1.26 -1.26
27.50 -1.17 -1.17 -1.17 -1.17
28.00 -1.04 -1.04 -1.04 -1.04
28.50 -0.88 -0.88 -0.88 -0.88
29.00 -0.69 -0.69 -0.69 -0.69
29.50 -0.49 -0.49 -0.49 -0.49
30.00 -0.31 -0.31 -0.31 -0.31
30.50 -0.14 -0.14 -0.14 -0.14
31.00 0.01 0.01 0.01 0.01
31.50 0.13 0.13 0.13 0.13
32.00 0.21 0.21 0.21 0.21
32.50 0.24 0.24 0.24 0.24
33.00 0.22 0.22 0.22 0.22
33.50 0.14 0.14 0.14 0.14
34.00 0.02 0.02 0.02 0.02
34.50 -0.15 -0.15 -0.15 -0.15
35.00 -0.32 -0.32 -0.32 -0.32
35.50 -0.49 -0.49 -0.49 -0.49
36.00 -0.63 -0.63 -0.63 -0.63

34
APPENDIX E
15- and 25-year Horizontal Erosion Distances for Sarasota County
MHW = 0.3 ft. (NAVD)
+ : Erosion
- : Accretion

35
15-year Horizontal Erosion Distances at Contours (ft. – NAVD)
Range MHW 3' 5' 7'
T1 12.6 15.6 -4.1 11.5
R2 13.5 22.7 -1.7 3.7
R3A 12.6 13.9 9.7 2.1
R4 7.3 12.4 21.3
R5A 13.4 17.3 19.6 -3.3
T6 6.9 14.8 19.5 3.9
R7 15.5 15.8 16.4 4.8
R8 8.9 13.3 18.9
R9 8.8 16.0 12.9
R10 7.7 15.7 15.8
R11 7.7 16.2 25.9
R12 5.8 12.1 22.9 15.4
R13 -5.0 16.9 -1.5 1.3
R14 1.1 11.3 17.0 7.7
T15 12.2 -3.3 14.5 0.3
R16 10.3 26.0 0.9
R17 2.7 7.7 12.1
R18 0.3 18.6 5.4
R19 4.8 21.9 0.9
R20 4.8 24.7 44.8 -16.2
R21 7.8 29.1 19.2 -6.3
T22 6.5 22.9 4.7 0.5
T23 9.7 23.9 10.1 10.5
R24 7.6 22.9 36.3
R25 14.2 8.4 21.4 16.0
R26 13.5 14.8 11.3 0.0
R27 13.3 15.1 9.6
R28 10.3 40.2 15.8
R29 7.2 29.4
R30 N/A
R31 -1.0 36.0 65.8
R32 39.9 -0.8 -6.2 4.5
R33 28.5 -1.9 1.2 3.2
R34 30.2 0.7
R35 -4.0 4.9 122.5
T36 -10.2 -1.7 37.0
R37 10.7 20.4 19.4 5.2
R38 11.0 8.2 15.5 29.9
R39 22.5 -12.4 26.4 67.8
R40 27.8 -9.7 10.1
R41 23.4 -3.6 18.1

36
R42 18.0 -2.0 2.5 -28.1
R43 15.7 10.1
R44 15.5 13.1
R45 N/A
T46 29.8 2.8
R47 23.3 -20.2 1.8
R48 2.6 105
R49 22.2 5.2
R50 11.6 30
T51 7.1 23.5
R52 18.8 3.0 6.6
R53 17.0 33.3 2.5
R54 17.2 -17.1
R55 7.8 0.0 1.8
R56 6.5 1.7 17.6
R57 17.9 -7.8 19.9
R58 24.4 -5.0 5.2
R59 14.7 -8.9
R60 16.1 -1.3 24.0
R61 10.3 1.1
R61A 3.5 3.0 46.0
R62 -20.0 9.4 29.7 46.4
R63 -30.3 -17.4 -0.4 14.4
R64 1.5 31.1 52.8
R65 3.0 45.0 80
R66 16.5 37.2 54.3 50.1
R67 5.8 16.2 8.8 17.4
R68 8.4 19.5 30.7 0.2
R69 8.5 25.9 33.4 -20.6
R70 8.4 27.2 44.3 -23.1
R71 9.5 27.1 38.1 -19.6
R72 8.0 18.3 29.3
R73 8.4 20.6 32.7 2.2
R74 8.1 16.2 24.4 2.0
R75 9.5 17.9 18.2 2.1
R76 14.7 22.1 13.5 -1.1
R77 5.1 30.4 63.4
R78 10.8 23.6 29.4 2.2
R79 8.4 27.8 5.1 -1.0
R80 4.5 29.0 3.6 0.5
R81 12.0 23.8 0.7 10.7
R82 8.2 8.1 8.2 12.9
R83 9.5 6.7 12.7 22.3
R84 10.2 13.9 14.1 15.0

37
R85 6.9 13.4 18.0 8.3
R86 9.6 19.1 22.1
R87 2.4 12.4 12.4 20.4
R88 15.7 22.9 9.5 8.3
R89 22.7 11.3 6.0 4.1
R90 10.1 9.4 8.8 9.9
R91 11.2 21.7 9.9 6.0
R92 12.4 18.0 8.1 10.4
R93 16.3 25.4 6.0 4.0
R94 13.2 21.8 7.7 6.4
R95 12.3 17.8 10.2 6.5
R96 -11.3 -1.0 -3.4 6.3
R97 -2.9 -0.3 4.5 12.1
R98 -14.7 -7.5 6.5 22.9
R99 -7.9 1.1 11.2 24.0
R100 -4.3 5.6 14.6 26.6
R101 -0.4 6.8 19.2 27.5
R102 1.1 1.6 11.8 18.3
R103 10.4 12.4 19.2 23.6
R104 16.0 24.8 14.0 13.8
R105 17.0 25.2 20.2 22.5
R106 11.4 21.2 20.3 26.5
R107 7.1 22.0 22.6 28.2
R108 13.4 25.3 22.2 18.5
R109 19.1 25.7 20.7 18.3
R110 12.8 18.6 14.3 2.4
R111 17.3 32.5 17.1 12.7
R112 14.8 23.2 11.8
T113 11.0 17.8 15.5 0.8
R114 7.6 22.0 18.5 1.1
R115 38.9 62.7
R116 -3.5 13.4 26.3 38.6
R117 5.0 15.2 27.4 24.7
R118 12.3 21.2 14.2 6.5
R119 15.3 18.2 23.2
R120 16.5 19.8 25.0 4.6
R121 17.2 19.9 7.7 10.5
T122 8.1 17.2 21.9 26.8
R123A 11.9 12.9 21.7 30.5
R124 9.2 16.0 24.4 32.2
R125 5.2 12.6 22.1 34.5
R126 18.3 20.9 23.5 0.4
T127 13.1 19.6 27.9 26.7
R128 16.4 26.7 55.0

38
R129 15.3 23.2 15.4 0.9
R130 18.3 29.8 10.6 4.1
T131 10.5 24.5 9.7 7.0
R132 16.0 19.2 14.1 18.1
R133 14.8 28.7 6.6
T134 17.6 29.6 16.5
R135 16.9 21.1 29.5
R136 10.0 22.9 40.3
R137 4.9 10.4 27.9 39.4
R138 21.7 -2.2 10.8
R139 9.4 6.0 10.4 16.2
R140 0.7 2.6 15.8
R141 -3.1 -2.2 5.6 14.0
R142 9.3 -9.2 -1.4 7.1
R143 8.1 -6.6 -7.3 6.6
R144 13.1 4.7 7.0
T145 7.1 -0.7 -3.7 8.2
R146 -4.5 -10.4 -1.1 9.2
R147 4.6 4.8 14.1 34.4
R148 2.1 -0.7 10.2 21.3
T149 9.2 7.1 28.7 46.7
R150 4.5 3.6 6.9 13.7
R151 11.9 5.1 16.3 26.4
R152 2.7 17.5 20.5 33.8
R153 13.1 20.1 12.3 19.1
R154 13.3 20.4 3.5 -0.2
R155 15.6 25.7 13.9 12.2
R156 12.4 23.0 12.3 -26.1
R157 12.2 33.8 14.6 -9.9
R158 12.1 20.1 8.6 -7.3
R159 9.4 12.3 -2.4 -2.4
R160 5.0 4.4 -1.2 6.9
R161 8.7 6.0 1.9 8.2
R162 5.5 -0.1 1.7 5.5
R163 17.2 10.9 19.0
R164 2.4 -5.9 2.2 10.6
R165 17.5 8.8 11.4 11.1
T166 20.6 9.7 9.8 7.5
R167 13.6 7.7 6.5 12.5
R168 12.2 9.9 10.8 5.3
R169 12.0 12.7 9.5 3.1
R170 6.9 10.1 6.4 18.8
R171 12.9 16.0 9.9 12.8
R172 11.2 10.5 9.7 18.7

39
R173 11.3 17.5 16.8 -8.8
R174 13.3 12.8 28.5 40.3
R175 21.8 17.8 6.9 11.1
R176 18.8 27.3 8.6
R177 16.0 30.6 4.2 1.0
R178 9.5 21.1 12.6 9.7
R179 15.4 16.6 7.4
R180 -2.7 -3.0 5.3 15.4
R181 11.1 2.7 9.2 20.5
R182 5.2 6.7 19.8 27.7
R183 -5.6 -6.8 7.9 15.9

40
25-year Horizontal Erosion Distances at Contours (ft. – NAVD)
Range MHW 3' 5' 7'
T1 10.6 14.0 -4.3 13.1
R2 14.3 21.7 3.5 21.1
R3A 10.7 13.6 16.4 38.7
R4 6.3 11.5 22.4
R5A 12.7 18.4 30.4 47.3
T6 5.8 13.9 21.4 10.8
R7 11.3 15.6 18.4 19.8
R8 7.6 14.0 20.9
R9 6.4 16.5 18.8 4.8
R10 5.2 15.1 22.8
R11 5.9 16.5 35.1
R12 3.8 12.7 34.4
R13 -5.6 17.1 -0.7 14.6
R14 -0.2 10.1 19.6 23.5
T15 11.4 0.4 15.3 3.8
R16 9.9 24.7 1.2
R17 2.0 8.1 12.8 2.2
R18 -2.1 24.2 26.2
R19 1.5 22.3 2.4 11.6
R20 2.2 31.9 42.0 10.1
R21 5.7 30.5 20.9 2.6
T22 3.5 22.9 5.3 11.3
T23 8.3 25.1 14.5 43.1
R24 7.8 22.8 27.5
R25 14.5 7.9 18.6 10.8
R26 12.4 16.2 16.0 22.0
R27 12.6 11.6 12.2
R28 8.1 40.7 14.2
R29 4.8 28.4
R30 N/A
R31 -1.1 35.0 62.7
R32 36.4 -9.5 42
R33 38.6 -4.9 -2.4 7.1
R34 29.5 -0.2
R35 -2.9 4.4 92.3
T36 -13.1 -1.7 31.3
R37 7.8 20.9 23.4 31.6
R38 10.4 8.0 20.6 64.9
R39 21.7 -12.7 25.6 66.5
R40 27.4 -5.5 15.4
R41 22.9 -1.2 16.5

41
R42 19.0 -1.6 2.5 -27.2
R43 13.8 21.9
R44 22.0 7.0
R45 N/A
T46 30.0 7.2
R47 22.6 -13.0 0.6
R48 7.0 91.2
R49 25.5 -17.6
R50 14.2 30
T51 6.4 25.0
R52 19.6 18.3 31.0
R53 16.1 43.2 -5.6
R54 11.7 0.4
R55 9.1 -0.1 -0.5
R56 6.6 1.1 16.8
R57 18.5 -5.6 20.0
R58 25.4 -8.4 6.2
R59 15.4 -8.6
R60 16.6 -1.0 37.7
R61 10.9 0.4
R61A 5.3 0.8 64.7
R62 -21.4 8.1 30.0 49.0
R63 -32.7 -18.0 -0.5 16.5
R64 0.7 31.9 53.7
R65 4.0 44.3 80
R66 15.3 40.4 76.2 50
R67 4.4 18.1 14.1 26.3
R68 7.2 20.6 35.0 3.6
R69 7.3 25.9 34.9 -11.5
R70 7.4 28.7 47.3 -13.3
R71 8.2 27.1 40.1 -8.5
R72 6.9 19.1 31.6
R73 6.8 20.4 32.4 3.5
R74 7.0 17.3 25.5 3.3
R75 8.9 20.1 24.9 14.0
R76 13.5 25.0 23.4 28.7
R77 4.1 28.7 56.7
R78 9.9 24.9 29.9 4.9
R79 6.8 28.2 8.3 4.8
R80 2.7 28.9 0.8 1.9
R81 11.0 22.0 3.8 17.9
R82 4.0 4.3 12.6 29.5
R83 9.6 7.6 13.0 25.2
R84 9.2 13.5 13.8 16.9

42
R85 5.9 13.5 17.8 10.3
R86 8.8 18.9 20.6
R87 1.7 13.2 12.6 22.8
R88 15.3 24.0 9.1 11.0
R89 22.3 11.1 9.4 16.6
R90 9.3 10.1 8.1 12.0
R91 10.4 23.0 12.9 12.6
R92 12.1 19.2 11.3 16.6
R93 16.4 26.0 5.2 6.2
R94 12.8 22.1 6.8 8.7
R95 11.5 18.1 9.8 8.1
R96 -12.1 -1.1 -3.4 8.1
R97 -3.2 -0.6 4.7 14.2
R98 -16.5 -8.7 6.7 25.1
R99 -8.0 1.2 10.9 25.4
R100 -4.9 6.0 14.1 27.7
R101 -0.8 7.7 19.1 29.7
R102 0.4 2.4 11.7 20.1
R103 9.9 14.5 24.0 34.0
R104 15.5 28.7 21.0 27.1
R105 16.3 28.3 26.3 36.2
R106 11.2 23.5 26.7 41.0
R107 6.6 24.3 25.5 38.7
R108 14.2 26.9 25.2 29.6
R109 17.8 28.8 28.0 36.3
R110 11.9 20.1 15.3 8.8
R111 16.7 34.1 27.6 46.8
R112 13.3 24.0 13.6
T113 10.1 19.3 22.0 20.7
R114 7.4 21.6 23.8 9.9
R115 37.6 63.4
R116 -4.1 13.0 27.0 40.8
R117 4.4 14.7 28.5 32.1
R118 11.5 20.9 14.4 9.8
R119 14.0 18.7 24.4
R120 14.4 21.0 25.3 7.8
R121 14.1 20.5 14.7 22.9
T122 7.4 16.4 22.1 30.3
R123A 11.2 13.8 25.8 42.7
R124 8.0 17.0 28.8 42.6
R125 3.9 12.0 23.0 38.4
R126 17.4 21.9 27.4 9.0
T127 8.8 19.6 34.1 39.2
R128 14.9 28.7 55.0

43
R129 16.6 23.2 16.6 2.6
R130 18.9 29.8 11.5 7.3
T131 9.9 23.9 10.5 12.9
R132 13.6 18.1 16.3 25.3
R133 13.9 29.5 6.8
T134 15.9 30.0 15.2
R135 15.3 22.1 32.2
R136 9.0 24.4 40.9
R137 6.3 10.8 27.4 42.6
R138 22.0 -1.9 11.3
R139 8.7 5.5 10.5 19.7
R140 -0.1 3.1 15.6
R141 -2.9 -2.2 5.5 15.9
R142 8.0 -8.7 -1.3 9.1
R143 7.7 -6.4 -7.2 8.7
R144 12.9 4.9 7.5
T145 4.1 -1.8 -3.0 12.3
R146 -4.1 -10.4 -0.9 11.3
R147 4.5 4.7 13.9 43.0
R148 1.9 -1.2 9.9 25.1
T149 8.9 7.7 39.8 66.0
R150 2.7 3.3 13.4 27.3
R151 12.7 6.1 19.8 35.7
R152 2.1 18.8 28.0 54.3
R153 12.6 21.3 17.5 34.1
R154 13.1 20.7 10.5 10.1
R155 14.8 27.7 20.2 30.4
R156 12.1 24.3 27.9 -22.8
R157 12.2 35.2 16.4 -8.4
R158 11.4 20.4 10.7 -7.2
R159 8.7 12.0 -2.0 -0.6
R160 5.3 3.8 -1.2 8.8
R161 8.2 6.7 2.3 10.7
R162 3.2 0.2 2.0 8.1
R163 17.2 12.0 26.3
R164 2.4 -4.7 2.2 12.2
R165 17.2 11.0 15.5 18.4
T166 19.8 9.8 9.1 9.5
R167 12.8 9.1 6.6 14.7
R168 11.0 9.4 10.2 8.4
R169 11.1 13.1 8.9 5.0
R170 7.2 10.5 5.7 20.2
R171 12.6 18.6 14.2 19.7
R172 8.2 11.1 11.7 25.6

44
R173 10.3 20.2 22.4 1.2
R174 12.7 14.9 33.1 51.7
R175 20.6 20.5 17.0 31.3
R176 18.6 26.6 10.4
R177 18.5 30.3 0.5 2.3
R178 7.8 20.9 15.0 15.6
R179 14.9 16.4 8.4
R180 -3.1 -2.9 5.3 17.2
R181 9.3 3.3 10.4 26.7
R182 5.3 6.4 20.3 34.5
R183 -6.7 -7.9 8.5 19.1