SBC Communications Inc. 2003 ANNUAL REPORTSBC Communications Inc. 2003 ANNUAL REPORT 0.0 0.5 1.0 1.5...
64
SBC Communications Inc. 2003 ANNUAL REPORT 0.0 0.5 1.0 1.5 2.0 2.5 3.0 3.5 2001 2002 2003 DSL Lines in millions 0 3 6 9 12 15 2001 2002 2003 Long Distance Lines in millions 0 5 10 15 20 25 2001 2002 2003 Cingular Wireless Subscribers in millions 1.3 2.2 3.5 14.4 6.1 4.9 21.6 21.9 24.0
Transcript of SBC Communications Inc. 2003 ANNUAL REPORTSBC Communications Inc. 2003 ANNUAL REPORT 0.0 0.5 1.0 1.5...

SBC Communications Inc.
2003 ANNUAL REPORT
0.0
0.5
1.0
1.5
2.0
2.5
3.0
3.5
2001 2002 2003
DSLLines in millions
0
3
6
9
12
15
2001 2002 2003
Long DistanceLines in millions
0
5
10
15
20
25
2001 2002 2003
Cingular WirelessSubscribers in millions
1.3
2.2
3.514.4
6.1
4.9
21.6 21.9
24.0

D E A R F E L L O W I N V E S T O R :
2003 was a year of significant challenge for our industry and solidachievement by our company.
Our 2003 results reaffirmed our business strategy. As thetelecom arena continually redefines how individuals andbusinesses exchange ideas and information, our opportu-nities for growth in new markets are encouraging.
Our strategy is clear: Retain and expand our customer base by offering the most complete, flexible bundle of high-quality communications solutions available anywhere in themarket, at a great value. Continually introduce new customer-friendly solutions and market them creatively. Stake out newmarkets, particularly in the large-business sector. Maintain astrong financial position. And always be on the lookout forways to be more efficient and cost effective.
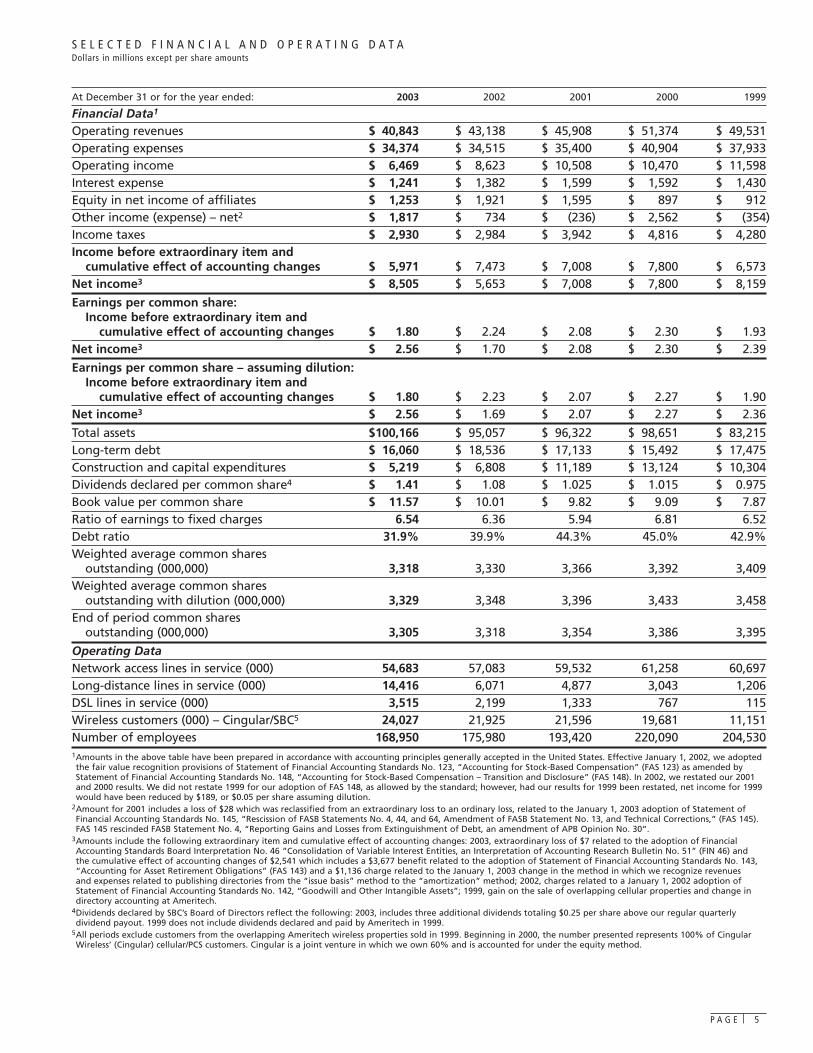
This strategy yielded solid results in 2003:• 137 percent growth in long distance lines.• 60 percent growth in DSL lines.• Strongest net adds from Cingular Wireless during
the second half of 2003 in two years.• Four consecutive quarters of improving consumer
retail access line trends.As 2004 unfolds, we have good reason to be optimistic,
which is why the Board of Directors in December increasedSBC’s dividend by nearly 16 percent. By year end, we expectrevenues to begin growing for the first time in three years. We also expect operating margins throughout 2004 to behigher than fourth-quarter 2003 reported margin levels,paving the way for increased profits in 2005.
EXISTING MARKETSBundling was the centerpiece of our consumer marketingeffort last year, and we realized significant improvements inboth access line trends and revenue per customer as a result.Consumer access line retention increased 7 percent from thefourth quarter of 2002 to thefinal quarter of 2003, spurred by increased bundled offeringsof long distance in Californiaearly in the year and in theMidwest in the fall, and by a major marketing push togrow our DSL subscriber base. Product bundlingincreased our average monthly revenue per accessline by approximately $2.25over the same period.
We’ll strengthen our bundle even further in Marchwith the introduction of SBC DISH Network satellitetelevision through anagreement with EchoStar. With this launch, we will bethe only major company in the country to offer customersa complete bundle: local and long distance calling,
broadband through SBC Yahoo! DSL, wireless through CingularWireless and entertainment through SBC DISH Network.
DSL InternetSBC Yahoo! DSL is the largest DSL provider in the country. Last year, we added 1.3 million lines for a total of 3.5 million.
A major sales channel expansion we began in late 2003 isexpected to increase our DSL momentum even more in 2004.SBC Yahoo! DSL is now available through some 2,000 storessuch as Best Buy, RadioShack and Sam’s Clubs — in addition to our own company channels and online from Yahoo!
We also expanded our DSL coverage footprint in 2003 toreach 75 percent of our customer locations at year end, and weexpect to reach nearly 80 percent in the first quarter of 2004.
SBC Yahoo! DSL is currently rolling out a groundbreakingWi-Fi initiative called FreedomLinkSM. FreedomLinkSM willconnect SBC customers to the Internet from the road via hot spots that are scheduled to be available in more than6,000 hotels, airports, convention centers and other venuesthroughout the 13-state SBC territory by the end of 2006.
Long DistanceSBC more than doubled its long distance lines in 2003, adding 8.3 million for a total of 14.4 million lines. This made SBC the fastest-growing long distance provider in the country last year. Our growth was spurred by launches in California, Nevada, Illinois, Indiana, Michigan, Ohio and Wisconsin during 2003.
Winning regulatory approvals in late 2003 to offer longdistance in the Midwest marked a crucial turning point forSBC, because the region represents more than one-third, orabout 20 million, of our total access lines. We’re already seeing the same kind of access line retention impact in theMidwest that we saw in the West and Southwest when weentered the long distance business in those regions. Now, forthe first time in SBC’s history, we can offer long distance in all 50 states.
Cingular Wireless Wireless is a top growth area for SBC, and Cingular Wireless’pending acquisition of AT&T Wireless will make SBC themajority owner of what promises to be the premier wirelessprovider in America. Coming on the heels of the strongestsubscriber growth in two years, Cingular announced in February2004 that it will buy No. 3 wireless provider AT&T Wireless. This combination will make Cingular a much stronger and moreefficient competitor in this highly competitive market.
For Cingular customers, the combination will mean expandedcoverage to 97 of the top 100 markets, plus improved reliability,enhanced call quality and a wide array of new and innovativeservices, including even faster wireless broadband services.
For our company and our stockholders, it provides muchgreater exposure to one of the most important growth oppor-tunities in the telecom market today. The strong operationalsynergies Cingular expects to realize through this combination,such as lower advertising expense, increased back-officeefficiencies and lower capital requirements, would allowCingular to provide even better service at a lower cost.
P A G E 2
$1.00
$1.10
$1.20
$1.30
$1.40
$1.50
2001 2002 2003
Annual Dividendsper Common Share(Declared)Dollars per share
$1.03
$1.08
$1.41

Cingular made some important strides during 2003, includingits conversion to the powerful GSM network technology in all itsmajor markets. This conversion is enhancing service quality andimproving customer satisfaction. GSM, or Global System forMobile Communications, is the world’s most popular wirelessnetwork technology, offering the widest variety of handsets withfeatures like color screens, camera phones and Internet access.
To further integrate wireless and wireline, Cingular last fallintroduced FastForwardTM, a first-of-its-kind cradling devicethat allows subscribers to forward wireless calls to home oroffice lines. FastForwardTM gives customers the security ofwireline, the mobility of wireless and the convenience ofcombining both into one number. This also spells greatercustomer savings, since calls to the wireless phone whilecradled don’t count against wireless minutes.
The initial impact of the much-anticipated “wireless localnumber portability” rules implemented last November —allowing customers to switch wireless carriers without changingnumbers or to move home numbers to wireless phones — wasless dramatic than many had predicted. That was certainly thecase at Cingular.
The technology and spectrum enhancements under way atCingular, combined with the unique wireless/wireline integrationcapabilities it offers, are two reasons we believe portingrepresents a potential growth opportunity for Cingular in 2004.
NEW OPPORTUNITIES — 2004 AND BEYONDOur subscriber growth in all these consumer businesses wasexceptional in 2003, and we expect another strong year in2004, as big gains in our newer offerings bring not only new revenue opportunities but greater stability in our wireline business.
In long distance, we expect continued solid growth in 2004, particularly in the West and Midwest. In wireless, we expect to build on the strong momentum Cingulargenerated last year. The conversion to GSM technology will not only improve voice quality but also allow Cingular to offer new data services. We believe continued deploymentof broadband technology will help keep the momentumbuilding in our DSL business.
But perhaps the highest-impact opportunity for the futureis in the large-business market, where we’re now able toprovide both voice and data services on a nationwide basis,providing an important new choice to business customers.
Business MarketsSBC is poised to tap the enterprise business market, whichrepresents a sizable revenue opportunity over the next fewyears. We achieved several milestones last year that position us to be a strong competitor for large-business customers.
First, we completed our national data and IP backbonescovering both our 13-state area and 30 additional majormetropolitan areas. Next, we created a national sales forcemore than 1,000 strong dedicated to developing newopportunities in the large-business market.
Finally, winning the right to sell long distance in our finalfive Midwestern states gave us the critical traction we neededin our large-business push, since those states represent such a large portion of our subscriber base.
Nearly half the Fortune 1000 companies are headquarteredwithin our traditional 13-state service area, so our existingcustomer relationships uniquely position us to compete fortheir enterprisewide needs. Large businesses with more thanhalf their locations in our 13 states will spend an estimated$34 billion on telecom services this year, and they’re a natural market for us.
There are several important industry trends driving themarket, but one of the most significant is convergence. Talk to chief information officers of major companies today andone of the first things they mention is IP services and the needto converge voice and data networks. Among the manyadvantages of convergence, it allows companies to save moneyby putting their long distance voice on a data network.
SBC is ideally positioned to serve this market by simplyexpanding our existing relationships. We stepped forward in2003 with PremierSERVSM, a powerful portfolio of managedservices that includes a new hosted Voice over InternetProtocol service (VoIP) as well as IP-VPN services — flexiblenetwork connections that can support a broad spectrum of IP applications, including VoIP.
This market offers tremendous growth opportunities forSBC, and with our early leadership position in the VoIP area,we believe large-business customers will become a moreimportant segment of our business over the next few years.
Working for the FutureWith our strong broadband customer base, we’re also well-positioned to deliver an industry-leading VoIP product toconsumers — as soon as several key regulatory and service-quality issues are resolved.
Although a number of telecom companies have announcedplans to deploy VoIP for consumers, for the near term, webelieve our current wireline offerings still provide better callquality, features and pricing.
In the meantime, we’re working to solve the shortcomingsinherent with consumer VoIP services available today, such as9-1-1 responders’ inability to locate the caller and serviceinterruptions due to power failure. As the regulatory andtechnical uncertainties are resolved, we’ll be ready to moveaggressively to provide consumers not only with reliable VoIP service but with value-added features.
Across the country, we are continuing to migrate from a circuit-switched national network to a packet-switched IPnetwork — moving from copper to fiber. This reflects theongoing shift in demand from mostly voice to mostly data,and it provides the ability to integrate wireline and wireless.
SBC has been a leader for 125 years in technologydevelopment, and be assured that we will develop and provide solutions for the future to satisfy the exploding
demand for bandwidth to handle our customers’ voice, data and video needs.
ENHANCING CUSTOMERSERVICE, IMPROVINGEFFICIENCY, REDUCING COSTProviding top-quality, on-timeservice is our heritage, and we’re investing in literallyhundreds of initiatives that will not only help us serve ourcustomers better, but do so more efficiently and at a lowercost. As a result of these projects, last year our overall on-time installation rate was up, repair times were down, field technician productivityincreased and customer evalu-ations of our service qualityshowed steady improvement.
P A G E 3
$0
$5
$10
$15
$20
$25
$30
2001 2002 2003
DebtIn billions
$26
$22
$18

These initiatives also will fundamentally transform our cost structure by standardizing, optimizing and consolidatingvarious functions. Reducing cost is critical, as competition fortelecom customers intensifies. Productivity improvementsunder way today are expected to save an estimated $1.3 billion annually in expense and capital costs by 2006.
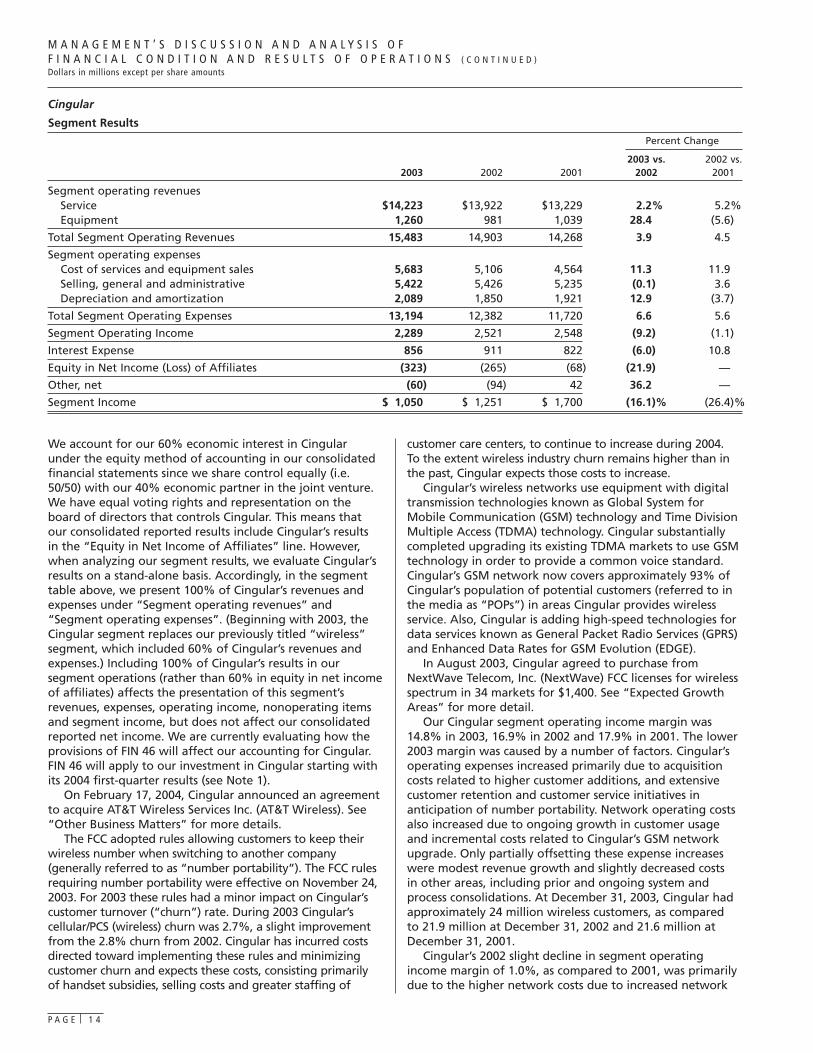
FINANCIALLY STRONG, FOCUSED ON STOCKHOLDER VALUEThanks to our disciplined financial management during one of the most difficult periods in our industry, SBC remainsfinancially very strong and well-equipped for the long term to seize opportunities in this dynamic market. Strong cash flow allowed us to cut debt from $26 billion two years ago to $18 billion at the end of 2003, and we maintain the lowestdebt ratio in our industry.
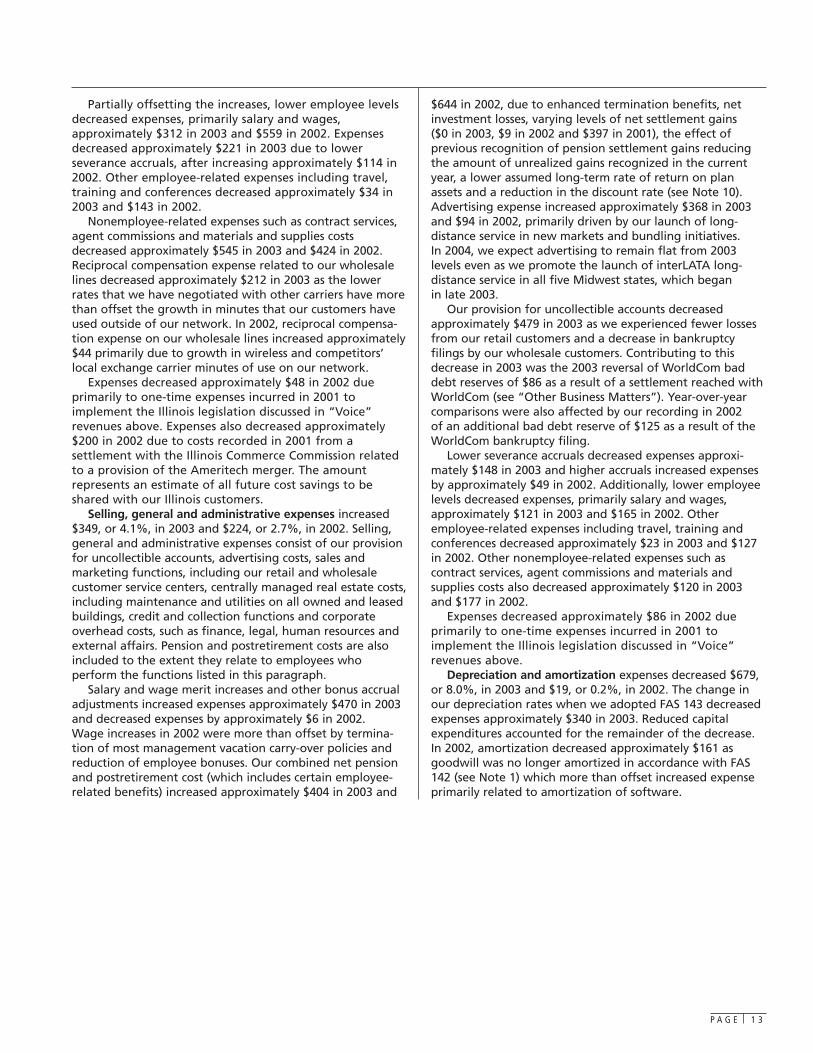
We continued to return value directly to stockholders, boththrough dividends and share repurchases. During 2003, ourBoard of Directors increased the quarterly dividend by a totalof 15.7 percent and declared three extra dividends totaling25 cents a share, in addition to the quarterly payout. This is the19th consecutive year the Board has increased the dividend,and the increase is the largest in the company’s history. At yearend, SBC had the largest dividend yield in its peer group.
In December 2003, the Board also authorized a new sharerepurchase program of 350 million shares through 2008 —about 10 percent of outstanding stock.
These decisions to reduce debt, buy back shares andincrease our dividend were made in an environment in whichburdensome and uncertain regulatory rules continued toprovide a disincentive to reinvest more of our cash into ourtraditional wireline business.
REGULATORY ENVIRONMENTThe FCC’s Triennial Review Order that came out last Augustprovided some hope for regulatory relief in broadband, andwe are optimistic that the remaining uncertainty will beclarified shortly by the FCC or the Court of Appeals. We weredisappointed, however, that onerous unbundling and pricingrequirements that were overturned twice by the courts werenot removed. At this writing, the United States Court ofAppeals for the District of Columbia Circuit is still weighingthe industry’s appeal of the order on an expedited basis. We’re hopeful this is a signal that the court intends to reformonce and for all the wholesale rules that have discouragednew investment by the whole industry and put local phonecompanies at a disadvantage.
In 2004, we will continue to press for rate reform at thefederal level. We will also participate in proceedings at thestate level to review the below-cost wholesale rates we arecurrently forced to charge our competitors and continueefforts to bring them more in line with our costs. Indiana’srecent decision to raise by approximately 30 percent thewholesale rate that competitor resellers pay us to lease ournetwork was a small step in the right direction, and we’rehopeful other states will take notice.
We will also work with federal regulators to ensure a level playing field for all companies that compete in thebroadband and VoIP markets.
A LOOK AHEADLooking ahead, I’m more optimistic about our future and ourcompetitive position than I’ve been in several years. No othertelecom company has our combination of assets:
• 55 million direct connections to homes and businessescovering one-third of the United States, including theheadquarters of one-half of the Fortune 1000.
• 3.5 million high-speed Internet lines.• 24 million wireless customers, a wireless footprint with
the industry’s largest overlap of wireline assets and apending acquisition that would make SBC a 60-percentowner of America’s premier wireless provider.
• A nationwide IP backbone covering the nation’s largest cities.
• An integrated video entertainment offering.• One of the world’s largest directory advertising
companies.• A broad set of international telecom assets.• A strong financial position.The economy finally showed some signs of turning the
corner late last year, improving our prospects for growth both in the consumer and business markets. Gains in longdistance, broadband and wireless — combined with improvingaccess line trends — are expected to yield positive revenuegrowth toward the end of this year. And the foundation we’re laying in the large-business market should yieldadditional growth in the years ahead.
In addition, we saw competition-driven pressure on marginsflatten in the first quarter of this year, and we expect pensionand post-retirement benefit costs to decline.
Amid these encouraging signs, we’re continuing to focus on building market share and operating more cost effectively.
We’ll keep running our business in a way that has won us the respect of our employees, customers, partners and the communities we serve. Last year, SBC ranked No. 1 on Fortune’s list of the “Most Admired” telecom companies and No. 7 on Fortune’s list of the top 50 companies for minorities.In addition, the company was recognized for having one ofthe most diverse work forces, management teams and Boardof Directors in corporate America.
Finally, we look forward to the safe return of the morethan 200 SBC military reservists who are currently servingaround the world. These men and women are truly “goingbeyond the call” to protect America from the threat ofinternational terrorism, and we salute their bravery andcommitment to such important work.
As we look to the rest of 2004, SBC is more confident andcommitted than ever to delivering for our stockholders. As we return to positive revenue growth, I’m confident ourstock price will be rewarded by the market. Meanwhile, we’ll work hard to build value today and in the future.
P A G E 4
Sincerely,
Edward E. Whitacre Jr.Chairman and Chief Executive Officer February 18, 2004
At December 31 or for the year ended: 2003 2002 2001 2000 1999
Financial Data1
Operating revenues $ 40,843 $ 43,138 $ 45,908 $ 51,374 $ 49,531Operating expenses $ 34,374 $ 34,515 $ 35,400 $ 40,904 $ 37,933Operating income $ 6,469 $ 8,623 $ 10,508 $ 10,470 $ 11,598Interest expense $ 1,241 $ 1,382 $ 1,599 $ 1,592 $ 1,430Equity in net income of affiliates $ 1,253 $ 1,921 $ 1,595 $ 897 $ 912Other income (expense) – net2 $ 1,817 $ 734 $ (236) $ 2,562 $ (354)Income taxes $ 2,930 $ 2,984 $ 3,942 $ 4,816 $ 4,280Income before extraordinary item and
cumulative effect of accounting changes $ 5,971 $ 7,473 $ 7,008 $ 7,800 $ 6,573Net income3 $ 8,505 $ 5,653 $ 7,008 $ 7,800 $ 8,159
Earnings per common share:Income before extraordinary item and
cumulative effect of accounting changes $ 1.80 $ 2.24 $ 2.08 $ 2.30 $ 1.93Net income3 $ 2.56 $ 1.70 $ 2.08 $ 2.30 $ 2.39
Earnings per common share – assuming dilution: Income before extraordinary item and
cumulative effect of accounting changes $ 1.80 $ 2.23 $ 2.07 $ 2.27 $ 1.90Net income3 $ 2.56 $ 1.69 $ 2.07 $ 2.27 $ 2.36
Total assets $100,166 $ 95,057 $ 96,322 $ 98,651 $ 83,215Long-term debt $ 16,060 $ 18,536 $ 17,133 $ 15,492 $ 17,475Construction and capital expenditures $ 5,219 $ 6,808 $ 11,189 $ 13,124 $ 10,304Dividends declared per common share4 $ 1.41 $ 1.08 $ 1.025 $ 1.015 $ 0.975Book value per common share $ 11.57 $ 10.01 $ 9.82 $ 9.09 $ 7.87Ratio of earnings to fixed charges 6.54 6.36 5.94 6.81 6.52Debt ratio 31.9% 39.9% 44.3% 45.0% 42.9%Weighted average common shares
outstanding (000,000) 3,318 3,330 3,366 3,392 3,409Weighted average common shares
outstanding with dilution (000,000) 3,329 3,348 3,396 3,433 3,458End of period common shares
outstanding (000,000) 3,305 3,318 3,354 3,386 3,395
Operating DataNetwork access lines in service (000) 54,683 57,083 59,532 61,258 60,697Long-distance lines in service (000) 14,416 6,071 4,877 3,043 1,206DSL lines in service (000) 3,515 2,199 1,333 767 115Wireless customers (000) – Cingular/SBC5 24,027 21,925 21,596 19,681 11,151Number of employees 168,950 175,980 193,420 220,090 204,5301Amounts in the above table have been prepared in accordance with accounting principles generally accepted in the United States. Effective January 1, 2002, we adoptedthe fair value recognition provisions of Statement of Financial Accounting Standards No. 123, “Accounting for Stock-Based Compensation” (FAS 123) as amended byStatement of Financial Accounting Standards No. 148, “Accounting for Stock-Based Compensation – Transition and Disclosure” (FAS 148). In 2002, we restated our 2001and 2000 results. We did not restate 1999 for our adoption of FAS 148, as allowed by the standard; however, had our results for 1999 been restated, net income for 1999would have been reduced by $189, or $0.05 per share assuming dilution.
2Amount for 2001 includes a loss of $28 which was reclassified from an extraordinary loss to an ordinary loss, related to the January 1, 2003 adoption of Statement ofFinancial Accounting Standards No. 145, “Rescission of FASB Statements No. 4, 44, and 64, Amendment of FASB Statement No. 13, and Technical Corrections,” (FAS 145).FAS 145 rescinded FASB Statement No. 4, “Reporting Gains and Losses from Extinguishment of Debt, an amendment of APB Opinion No. 30”.
3Amounts include the following extraordinary item and cumulative effect of accounting changes: 2003, extraordinary loss of $7 related to the adoption of FinancialAccounting Standards Board Interpretation No. 46 “Consolidation of Variable Interest Entities, an Interpretation of Accounting Research Bulletin No. 51” (FIN 46) and the cumulative effect of accounting changes of $2,541 which includes a $3,677 benefit related to the adoption of Statement of Financial Accounting Standards No. 143,“Accounting for Asset Retirement Obligations” (FAS 143) and a $1,136 charge related to the January 1, 2003 change in the method in which we recognize revenues and expenses related to publishing directories from the “issue basis” method to the “amortization” method; 2002, charges related to a January 1, 2002 adoption ofStatement of Financial Accounting Standards No. 142, “Goodwill and Other Intangible Assets”; 1999, gain on the sale of overlapping cellular properties and change indirectory accounting at Ameritech.
4Dividends declared by SBC’s Board of Directors reflect the following: 2003, includes three additional dividends totaling $0.25 per share above our regular quarterlydividend payout. 1999 does not include dividends declared and paid by Ameritech in 1999.
5All periods exclude customers from the overlapping Ameritech wireless properties sold in 1999. Beginning in 2000, the number presented represents 100% of CingularWireless’ (Cingular) cellular/PCS customers. Cingular is a joint venture in which we own 60% and is accounted for under the equity method.
P A G E 5
S E L E C T E D F I N A N C I A L A N D O P E R A T I N G D A T ADollars in millions except per share amounts

P A G E 6
M A N A G E M E N T ’ S D I S C U S S I O N A N D A N A L Y S I S O FF I N A N C I A L C O N D I T I O N A N D R E S U L T S O F O P E R A T I O N SDollars in millions except per share amounts
Throughout this document, SBC Communications Inc. isreferred to as “we” or “SBC”. We are a holding companywhose subsidiaries and affiliates operate in the communi-cations services industry. Our subsidiaries and affiliatesprovide wireline and wireless telecommunications servicesand equipment and directory advertising services bothdomestically and worldwide.
You should read this discussion in conjunction with theconsolidated financial statements and the accompanyingnotes. A reference to a Note in this section refers to theaccompanying Notes to the Consolidated FinancialStatements. In our tables throughout this section,percentage increases and decreases that exceed 100% arenot considered meaningful and are denoted with a dash.
R E S U LT S O F O P E R AT I O N SConsolidated ResultsOur financial results are summarized in the table below. We then discuss factors affecting our overall results for the past threeyears. These factors are discussed in more detail in our segment results. We also discuss our expected revenue and expensetrends for 2004 in the “Operating Environment and Trends of the Business” section.
Percent Change
2003 vs. 2002 vs. 2003 2002 2001 2002 2001
Operating revenues $40,843 $43,138 $45,908 (5.3)% (6.0)%Operating expenses 34,374 34,515 35,400 (0.4) (2.5)Operating income 6,469 8,623 10,508 (25.0) (17.9)Income before income taxes 8,901 10,457 10,950 (14.9) (4.5)Income before extraordinary item and
cumulative effect of accounting changes 5,971 7,473 7,008 (20.1) 6.6Extraordinary item1 (7) — — — —Cumulative effect of accounting changes2,3 2,541 (1,820) — — —Net income 8,505 5,653 7,008 50.5 (19.3)Diluted earnings per share 2.56 1.69 2.07 51.5 (18.4)
12003 includes an extraordinary loss on our real estate leases related to the adoption of Financial Accounting Standards Board (FASB) Interpretation No. 46 “Consolidationof Variable Interest Entities, an Interpretation of Accounting Research Bulletin No. 51” (FIN 46).
22003 includes cumulative effect of accounting changes of $2,541: a $3,677 benefit related to the adoption of Statement of Financial Accounting Standards No. 143,“Accounting for Asset Retirement Obligations” (FAS 143); and a $1,136 charge related to the January 1, 2003 change in the method in which we recognize revenues and expenses related to publishing directories from the “issue basis” method to the “amortization” method.
32002 includes a cumulative effect of accounting change related to the adoption of Statement of Financial Accounting Standards No. 142, “Goodwill and Other Intangible Assets” (FAS 142).
Overview Our operating income declined $2,154, or25.0%, in 2003, and $1,885, or 17.9%, in 2002. The declinesin both 2003 and 2002 were due primarily to an increase inour combined net pension and postretirement cost and thecontinued loss of revenues from declining retail access lines.The continuing decline in retail access lines has beenprimarily attributable to customers moving from our retaillines to competitors using our wholesale lines provided underthe Unbundled Network Element-Platform (UNE-P) rules.UNE-P rules require us to sell our lines and the end-to-endservices provided over those lines to competitors at belowcost while still absorbing the costs of deploying, provisioning,maintaining and repairing those lines. Competitors can thentake advantage of these below-cost rates to offer services at lower prices. See our “Operating Environment and Trendsof the Business” section for further discussion of UNE-P.Additional factors contributing to the declines in retail accesslines and revenues were the uncertain U.S. economy andincreased competition, including customers using wirelesstechnology and cable instead of phone lines for voice anddata. Although retail access line losses have continued, thetrend has slowed recently, reflecting our ability to now offerretail interLATA (traditional) long-distance in all of ourregions as well as the introduction of offerings combiningmultiple services for one fixed price (“bundles”).
The 2003 increase in our combined net pension andpostretirement cost of $1,917 also contributed to the declinein operating income. Because of its size, this expense isdiscussed in more detail in “Operating expenses” below. The change in our method of accounting for publishingdirectories from the “issue basis” method to the “amortization” method (see Note 1 and our “DirectorySegment Results” section) increased operating incomeapproximately $80.
Our income before income taxes declined in 2002, butthe decline was less than the decline in operating incomedue to increased gains on sales of international investmentsin 2002. In addition, a lower effective tax rate and a declinein our weighted average common shares outstandingfavorably affected our diluted earnings per share in 2002.
Operating revenues Our operating revenues decreased$2,295, or 5.3%, in 2003 and $2,770, or 6.0%, in 2002. The declines in both 2003 and 2002 were primarily due tolower voice revenues resulting from the continued loss ofretail access lines to UNE-P wholesale lines, as well as theuncertain U.S. economy and increased competition. UNE-P is discussed in greater detail in our “Wireline SegmentResults” section. Additionally, in 2003, the change indirectory accounting mentioned above also increasedrevenue approximately $47 (see Note 1).

P A G E 7
Operating expenses Our operating expenses decreased$141, or 0.4%, in 2003 and $885, or 2.5%, in 2002. The 2003decrease was due to several factors. Costs were reducedprimarily due to the decline in our workforce (down morethan 7,000 employees from 2002). Second, we recordedcharges in 2002, which favorably affected comparisons with2003. Specifically, these 2002 charges included $813 relatedto a workforce reduction program (see Note 2) andadditional bad debt reserves of $125 as a result of theWorldCom Inc. (WorldCom) bankruptcy filing. Third, theimpact of the adoption of FAS 143 decreased our operatingexpenses approximately $280 (see Note 1). Fourth, our stock option expense decreased approximately $207 (seeNote 12) primarily due to a decrease in options grantedduring 2003. Additionally, the change in directoryaccounting mentioned above decreased operating expensesapproximately $33.
The 2003 decreases were partially offset by increasing costs related to our pension and postretirement benefit plans.Our combined net pension and postretirement cost increasedoperating expenses approximately $1,917 in 2003 (see furtherdiscussion below). Also offsetting the decrease were increasedexpenses to enhance customer growth, including sales andadvertising support for digital subscriber line (DSL) and long-distance marketing initiatives. In particular, ouradvertising expense increased approximately $435 in 2003.
Operating expenses decreased in 2002 due to the declinein our workforce (down over 17,000 employees from 2001).2002 operating expenses also decreased due to our adoption of FAS 142, whereby we stopped amortizing goodwill (see Note 1).
Combined Net Pension and Postretirement Cost (Benefit)Operating expenses include our combined net pension andpostretirement cost (benefit) of $1,835, $(82) and $(436) in2003, 2002 and 2001. A decrease in our combined netpension and postretirement benefit, as happened in 2003and 2002, causes our operating expense to increase. Thisincreased expense of approximately $1,917 in 2003 wasprimarily due to net investment losses and to pension settle-ment gains recognized in 2002 and previous years, whichreduced the amount of unrealized gains recognized in 2003.
Four other factors also contributed to our increasedcombined net pension and postretirement cost in 2003. First, this cost increased approximately $343 due to ourdecision to lower our expected long-term rate of return onplan assets from 9.5% to 8.5% for 2003, based on our long-term view of future market returns. Second, the reductionof the discount rate used to calculate service and interestcost from 7.5% to 6.75%, in response to lower corporatebond interest rates, increased this cost approximately $163.Third, higher-than-expected medical and prescription drugclaims increased expense approximately $152. Fourth, inresponse to rising claim costs, we increased the assumedmedical cost trend rate in 2003 from 8.0% to 9.0% forretirees 64 and under and from 9.0% to 10.0% for retirees65 and over, trending to an expected increase of 5.0% in2009 for all retirees, prior to adjustment for cost-sharingprovisions of the medical and dental plans for certain retiredemployees. This increase in the medical cost trend rateincreased our combined net pension and postretirement costapproximately $187. See Note 10 for further detail of our
actuarial estimates of pension and postretirement benefitexpense and actuarial assumptions.
Retirement Offers Operating expenses also includeexpenses for enhanced pension and postretirement benefitsof approximately $44, $486 and $173 in 2003, 2002 and 2001in connection with voluntary enhanced retirement programsoffered to certain management and nonmanagementemployees as part of workforce reduction programs.
In September 2003, the Internal Revenue Service (IRS)increased the interest rate used to calculate pension planlump sums from 4.53% to 5.31%, effective for employeeswho retired after September 30, 2003. The increase in thisinterest rate resulted in smaller lump sum pensions for someof our employees. We chose to extend the 4.53% rate toemployees who retired before November 1, 2003. The exten-sion of this lump sum benefit rate was accounted for as aspecial termination benefit and increased our 2003 fourth-quarter pension benefit expense approximately $28.
Pension Settlement Gains/Losses Under U.S. generallyaccepted accounting principles (GAAP), on a plan-by-planbasis, if lump sum benefit payments made to employeesupon termination or retirement exceed required thresholds,we recognize a portion of previously unrecognized pensiongains or losses attributable to that plan’s assets andliabilities. Until 2002, we had an unrecognized net gain,primarily because our actual investment returns exceededour expected investment returns. During 2002 and 2001, we made lump sum benefit payments in excess of the GAAPthresholds, resulting in the recognition of net gains, referred to as “pension settlement gains”. We recognizednet pension settlement gains of approximately $29 and$1,363 in 2002 and 2001. Due to U.S. securities marketconditions, our plans experienced investment losses during2002 and 2001 resulting in a decline in pension assets,causing us to have a net unrecognized loss. Net settlementgains in 2002 include settlement losses during the latter partof the year, reflecting the continued investment lossessustained by the plan. Settlement gains for 2001 wereprimarily related to a voluntary enhanced pension andretirement program implemented in October 2000. We did not recognize any settlement gains or losses in 2003.
Medical Cost Controls As a result of the continuedincrease in our combined net pension and postretirementcost and the costs expected in 2004, discussed in “OperatingEnvironment and Trends of the Business”, we have takensteps to implement additional cost controls. To reduce theincreased medical costs mentioned above, in January 2003,we implemented cost-saving design changes in ourmanagement medical and dental plans including increasedparticipant contributions for medical and dental coverageand increased prescription drug co-payments. These changesreduced our postretirement cost approximately $229 in 2003.
In early 2004, nonmanagement retirees were notified ofmedical coverage changes that will become effective onJanuary 1, 2005. These changes include adjustments to co-pays and deductibles for prescription drugs and a choice ofmedical plan coverage between the existing plans, includingmonthly contribution provisions or a plan with higher co-paysand deductibles but no required monthly contribution fromthe retiree during 2005. We expect these changes to reduce2004 expenses in the range of $300 to $600.

P A G E 8
M A N A G E M E N T ’ S D I S C U S S I O N A N D A N A L Y S I S O FF I N A N C I A L C O N D I T I O N A N D R E S U L T S O F O P E R A T I O N S ( C O N T I N U E D )Dollars in millions except per share amounts
2003 Accounting ChangesDirectory Accounting Effective January 1, 2003, we
changed our method of recognizing revenues and expensesrelated to publishing directories from the “issue basis”method to the “amortization” method. The issue basismethod recognizes revenues and expenses at the time theinitial delivery of the related directory title is completed.Consequently, quarterly income tends to vary with thenumber and size of directory titles published during aquarter. The amortization method recognizes revenues andexpenses ratably over the life of the directory title, which istypically 12 months. Consequently, quarterly income tends tobe more consistent over the course of a year. We decided tochange methods because the amortization method has nowbecome the more prevalent method used among significantdirectory publishers. This change will allow a more meaning-ful comparison between our directory segment and otherpublishing companies (or publishing segments of largercompanies). Our directory accounting change resulted in anoncash charge of $1,136, net of an income tax benefit of$714, recorded as a cumulative effect of accounting changeon the Consolidated Statement of Income as of January 1, 2003.The effect of this change was to increase consolidated pre-tax income and our directory segment income for 2003by $80 ($49 net of tax, or $0.01 per diluted share).
FAS 143 On January 1, 2003, we adopted FAS 143,which sets forth how companies must account for the costsof removal of long-lived assets when those assets are nolonger used in a company’s business, but only if a companyis legally required to remove such assets. FAS 143 requiresthat companies record the fair value of the costs of removalin the period in which the obligations are incurred andcapitalize that amount as part of the book value of thelong-lived asset. In connection with the adoption of FAS 143on January 1, 2003, we reversed all existing accrued costs of removal for those plant accounts where our estimatedcosts of removal exceeded the estimated salvage value. The noncash gain resulting from this reversal was $3,684,net of deferred taxes of $2,249, recorded as a cumulativeeffect of accounting change on the Consolidated Statementof Income as of January 1, 2003. In addition, TDC A/S (TDC),the Danish national communications company in which wehold an investment accounted for on the equity method,recorded a loss upon adoption of FAS 143. Our share of thatloss was $7, which included no tax effect. This noncashcharge of $7 was also recorded as a cumulative effect ofaccounting change on the Consolidated Statement ofIncome as of January 1, 2003 (see Note 1).
Beginning in 2003, for those types of plant accountswhere our estimated costs of removal exceeded theestimated salvage value, we now expense all costs ofremoval as we incur them (previously those costs had beenrecorded in our depreciation rates). As a result, ourdepreciation expense will decrease immediately and ouroperations and support expense will increase as these assets are removed from service. The effect of this changewas to increase consolidated pre-tax income and ourwireline segment income for 2003 by $280 ($172 net of tax, or $0.05 per diluted share). However, over the life of the assets, total operating expenses recognized under thisnew accounting method will be approximately the same
as under the previous method (assuming the cost of removalwould be the same under both methods).
2002 Accounting Change The year 2001 includedamortization expense related to goodwill and FederalCommunications Commission (FCC) wireless licenses nowowned by Cingular Wireless (Cingular). Beginning in 2002,goodwill and these wireless licenses are no longer beingamortized under FAS 142 (see Note 1).
Interest expense decreased $141, or 10.2%, in 2003 and$217, or 13.6%, in 2002. The 2003 decrease was primarilyrelated to lower debt levels, which decreased approximately$4,102. During 2003 we called, prior to maturity,approximately $1,743 of long-term debt obligations. The 2002 decrease was due to lower composite rates, alower outstanding balance of commercial paper and theelimination of interest expense associated with payables to Cingular, which was due to a 2001 agreement to net ournotes payable with our notes receivable from Cingular.
Interest income increased $42, or 7.5%, in 2003 anddecreased $121, or 17.7%, in 2002. The increase for 2003was primarily due to an increase in average investmentbalances and from early settlement of our notes receivablerelated to our 2002 sale of our investment in Bell CanadaHoldings Inc. (Bell Canada) to BCE, Inc. (BCE), which includeda pre-payment of interest of approximately $37. Theseincreases were partially offset by a decrease in interest ratescharged to Cingular (see Note 15). The decrease in 2002 wasthe result of the reduction of interest income associatedwith the reduced balance of notes receivable from Cingularas a result of the 2001 netting agreement discussed above.
Equity in net income of affiliates decreased $668, or34.8%, in 2003 and increased $326, or 20.4%, in 2002. The 2003 decrease was due to lower results from ourinternational holdings, largely attributable to gains thatoccurred in 2002, and foregone equity income from thedisposition of investments. The decrease was also due tolower 2003 operating results from Cingular. Income from our international holdings decreased approximately $546 in 2003 compared to 2002. Our proportionate share ofCingular’s results decreased approximately $146 in 2003.
The 2002 increase was due to higher income ofapproximately $597 from our international holdings,primarily due to larger gains in 2002 than in 2001. Theincrease was partially offset by a decline in Cingular’s results. Our proportionate share of Cingular’s resultsdecreased approximately $270 in 2002.
We account for our 60% economic interest in Cingularunder the equity method of accounting and thereforeinclude our proportionate share of Cingular’s results in our equity in net income of affiliates line item in ourConsolidated Statements of Income. Results from ourinternational holdings are discussed in detail in“International Segment Results” and Cingular’s operatingresults are discussed in detail in the “Cingular SegmentResults” section. (Our accounting for Cingular is described in more detail in Note 6.)
Other income (expense) – net We had other income of$1,817 in 2003, $734 in 2002 and other expense of $236 in2001. Results for 2003 include gains of approximately $1,574on the sale of our interest in Cegetel S.A. (Cegetel) and gainsof $201 on the sales of Yahoo! Inc. (Yahoo) and BCE shares.

P A G E 9
Results for 2002 primarily include gains of approximately$603 on the redemption of our interest in Bell Canada andgains of $191 on the sale of shares in equity investments,consisting of the sale of shares of Teléfonos de Mexico, S.A.de C.V. (Telmex), América Móvil S.A. de C.V. (América Móvil)and Amdocs Limited (Amdocs). These gains and income werepartially offset by a charge of approximately $75 related tothe decrease in value of our investment in WilTelCommunications (WilTel) (formerly Williams CommunicationsGroup Inc.) combined with a loss on the sale of our web-hosting operations.
Results for 2001 included gains on the full or partial sale ofinvestments of approximately $476, including our investmentsin TransAsia Telecommunications, Smith Security, Amdocsshares and other investments. An additional increase of $120resulted from a reduction of a valuation allowance on a notereceivable related to the sale of Ameritech’s security monitor-ing business. The 2001 income and gains were more thanoffset by charges and losses, including combined expenses of approximately $401 related to valuation adjustments ofWilTel and certain other cost investments accounted for underFinancial Accounting Standards Board Statement No. 115,“Accounting for Certain Investments in Debt and EquitySecurities” (FAS 115). These valuation adjustments resultedfrom an evaluation that the decline was other thantemporary. We also recognized a charge of $341 indicated by a transaction pending as of December 31, 2001, to reducethe direct book value of our investment in Telecom Américas Ltd.The transaction closed in early 2002. Additionally werecognized a loss of approximately $61 on the sale ofAmeritech’s cable television operations.
Income taxes decreased $54, or 1.8%, in 2003 and $958,or 24.3%, in 2002. The decrease in income tax in 2003compared to 2002 was primarily due to lower income beforeincome taxes and a lower effective tax rate in 2002. Thedecrease in income taxes in 2002 compared to 2001 wasprimarily the result of lower income and also a lowereffective tax rate. The lower effective tax rate primarilyrelated to lower state taxes including reductions due to one-time changes in the legal forms of various entities, increasedrealization of foreign tax credits, adoption of FAS 142, and a tax benefit from a restructuring of certain investments.
Extraordinary item in 2003 included an extraordinary lossof $7, net of taxes of $4, related to consolidation of realestate leases under FIN 46 (see Note 1).
Cumulative effect of accounting changes EffectiveJanuary 1, 2003, we changed our method of recognizingrevenues and expenses related to publishing directories from the “issue basis” to the “amortization method”. Ourdirectory accounting change resulted in a noncash charge of $1,136, net of an income tax benefit of $714, recorded as a cumulative effect of accounting change on theConsolidated Statement of Income as of January 1, 2003 (see“2003 Accounting Changes” above and Note 1).
On January 1, 2003, we adopted FAS 143, which changedthe way we depreciate certain types of our property, plantand equipment. The noncash gain resulting from adoptionwas $3,677, net of deferred taxes of $2,249, recorded as acumulative effect of accounting change on the ConsolidatedStatement of Income as of January 1, 2003 (see “2003Accounting Changes” above and Note 1).
On January 1, 2002, we adopted FAS 142. Adoption ofFAS 142 means that we stopped amortizing goodwill, and at least annually we will test the remaining book value ofgoodwill for impairment. Our total cumulative effect ofaccounting change from adopting FAS 142 was a noncashcharge of $1,820, net of an income tax benefit of $5,recorded as of January 1, 2002 (see Note 1).
Segment ResultsOur segments represent strategic business units that offer different products and services and are managedaccordingly. As required by GAAP, our operating segmentresults presented in Note 4 and discussed below for eachsegment follow our internal management reporting. Under GAAP segment reporting rules, we analyze our various operating segments based on segment income.Interest expense, interest income, other income (expense) –net and income tax expense are managed only on a totalcompany basis and are, accordingly, reflected only inconsolidated results. Therefore, these items are not included in the calculation of each segment’s percentage of our total segment income. We have five reportablesegments that reflect the current management of ourbusiness: (1) wireline; (2) Cingular; (3) directory; (4) international; and (5) other.
The wireline segment accounted for approximately 65% of our 2003 consolidated segment operating revenuesas compared to 66% in 2002 and 46% of our 2003consolidated segment income as compared to 51% in 2002.We operate as both a retail and wholesale seller ofcommunications services providing landline telecommuni-cations services, including local and long-distance voice,switched access, data and messaging services.
The Cingular segment accounted for approximately 27%of our 2003 consolidated segment operating revenues ascompared to 26% in 2002 and 12% of our 2003 consolidatedsegment income as compared to 11% in 2002. This segmentreflects 100% of the results reported by Cingular, our wirelessjoint venture and replaces our previously titled “wireless”segment, which included 60% of Cingular’s revenues andexpenses. Although we analyze Cingular’s revenues andexpenses under the Cingular segment, we eliminate theCingular segment in our consolidated financial statements. In our consolidated financial statements, we report our 60%proportionate share of Cingular’s results as equity in netincome of affiliates. Cingular offers both wireless voice anddata communications services across most of the U.S.,providing cellular and PCS services.
The directory segment accounted for approximately 8%of our 2003 and 2002 consolidated segment operatingrevenues and 26% of our 2003 consolidated segmentincome as compared to 21% in 2002. This segment includesall directory operations, including Yellow and White Pagesadvertising and electronic publishing. In the first quarter of2003 we changed our method of accounting for revenuesand expenses in our directory segment. Results for 2003, and going forward, will be reported under the amortizationmethod. This means that revenues and direct expenses arerecognized ratably over the life of the directory title,typically 12 months. This accounting change will affect onlythe timing of the recognition of a directory title’s revenues

P A G E 1 0
M A N A G E M E N T ’ S D I S C U S S I O N A N D A N A L Y S I S O FF I N A N C I A L C O N D I T I O N A N D R E S U L T S O F O P E R A T I O N S ( C O N T I N U E D )Dollars in millions except per share amounts
and direct expenses. It will not affect the total amountsrecognized for any directory title.
All investments with primarily international operationsare included in the international segment, which accountedfor less than 1% of our 2003 and 2002 consolidated segmentoperating revenues and 7% of our 2003 consolidatedsegment income as compared to 9% in 2002. Most of ourinternational interests are accounted for under the equitymethod and therefore are reflected in segment income butnot in segment revenue or expense.
The other segment includes all corporate and otheroperations as well as the equity income from our investmentin Cingular. Although we analyze Cingular’s revenues andexpenses under the Cingular segment, we record equity innet income of affiliates (from non-international investments)in the other segment.
The following tables show components of results ofoperations by segment. We discuss significant segmentresults following each table. We discuss capital expendituresfor each segment in “Liquidity and Capital Resources”.
Wireline
Segment Results
Percent Change
2003 vs. 2002 vs. 2003 2002 2001 2002 2001
Segment operating revenuesVoice $22,077 $24,716 $26,675 (10.7)% (7.3)%Data 10,150 9,639 9,631 5.3 0.1Long-distance voice 2,561 2,324 2,436 10.2 (4.6)Other 1,616 1,713 1,948 (5.7) (12.1)
Total Segment Operating Revenues 36,404 38,392 40,690 (5.2) (5.6)
Segment operating expensesCost of sales 15,805 15,536 15,788 1.7 (1.6)Selling, general and administrative 8,794 8,445 8,221 4.1 2.7Depreciation and amortization 7,763 8,442 8,461 (8.0) (0.2)
Total Segment Operating Expenses 32,362 32,423 32,470 (0.2) (0.1)
Segment Income $ 4,042 $ 5,969 $ 8,220 (32.3)% (27.4)%
Our wireline segment operating income margin was 11.1%in 2003, compared to 15.5% in 2002 and 20.2% in 2001. The continued decline in our wireline segment operatingincome margin was due primarily to the continued loss ofrevenues from a net decline in retail access lines (as shownin the following table) from 2002 to 2003 of 3,703,000, or7.3%, and from 2001 to 2002 of 4,561,000, or 8.2%. Thisdecline was primarily caused by our providing below-costUNE-P lines to competitors. (The UNE-P rules and theirimpact are discussed in “Overview” and in “Operating
Environment and Trends of the Business”.) Additional factorscontributing to the margin decrease were loss of revenuesfrom the uncertain U.S. economy, increased competition,increased combined net pension and postretirement cost,the cost of our growth initiatives in long-distance and DSL,and an increase in customers using wireless technology andcable instead of phone lines for voice and data. Following is a summary of our access lines at December 31, 2003, 2002 and 2001:
Access Lines
Percent Change
2003 vs. 2002 vs. (in 000s) 2003 2002 2001 2002 2001
Retail – Consumer 28,842 31,359 34,517 (8.0)% (9.1)%Retail – Business 18,264 19,450 20,853 (6.1) (6.7)
Retail Sub-total 47,106 50,809 55,370 (7.3) (8.2)
Percent of total switched access lines 86.1% 89.0% 93.0%
UNE-P 6,664 4,963 2,400 34.3 —Resale 445 801 1,235 (44.4) (35.1)
Wholesale Sub-total 7,109 5,764 3,635 23.3 58.6
Percent of total switched access lines 13.0% 10.1% 6.1%
Payphones (retail and wholesale) 468 510 527 (8.2) (3.2)
Percent of total switched access lines 0.9% 0.9% 0.9%
Total Switched Access Lines 54,683 57,083 59,532 (4.2)% (4.1)%

P A G E 1 1
Total switched access lines in service at December 31, 2003,declined 4.2%, from 2002 levels. During this same period,wholesale lines increased 23.3%. The decline in total accesslines reflects the continuing reluctance of U.S. businesses toincrease their workforces, the disconnection of secondarylines and continued growth in alternative communicationtechnologies such as wireless, cable and other internet-basedsystems. As our ratio of wholesale lines to total access linescontinues to grow, additional pressure will be applied to ourwireline segment operating margin, since the wholesalerevenue we receive is significantly less due to the variousstate UNE-P rates, but our cost to service and maintainwholesale lines is essentially the same as for retail lines.
Total switched access lines in service at December 31, 2002,declined 4.1%, from 2001 levels. During this same period,wholesale lines increased by 58.6%. Wholesale linesrepresented 10.1% of total access lines at December 31, 2002,compared to 6.1% of total lines a year earlier.
While retail access lines have continued to decline, thetrend has slowed recently in our West and Southwestregions reflecting our ability to now offer retail interLATA(traditional long-distance) service in those regions and theintroduction of bundled offerings in those regions (see“Long-distance voice” below). In late 2003, we beganoffering retail interLATA service in our Midwest region (seeour “Operating Environment and Trends of the Business”).Retail access lines for the Midwest region have decreased10.1% since December 31, 2002, compared with declines of4.9% in the Southwest region and 6.7% in the West regionfor the same period. As a result of our launch of interLATAlong-distance service in the Midwest region in late 2003, weexpect that retail access line losses in this region will beginto moderate somewhat in future periods based on theexperience of our other regions. However, while weexperienced a decrease in UNE-P access line losses in thefourth quarter of 2003, the expected favorable impact fromoffering interLATA long-distance service in the Midwest maybe somewhat mitigated by the UNE-P rates in effect in thosestates, which are generally lower than in our other states.See further discussion of the details of our wireline segmentrevenue and expense fluctuations below.
Voice revenues decreased $2,639, or 10.7%, in 2003 and$1,959, or 7.3%, in 2002 due primarily to the continued lossof retail access lines caused by providing below-cost UNE-P(see the table above). The uncertain U.S. economy andincreased competition, including customers using wirelesstechnology and cable instead of phone lines for voice anddata, also contributed to the decline in revenues. The contin-ued access line declines decreased revenues approximately$1,416 in 2003 and $1,117 in 2002. A decline in demand forcalling features (e.g., Caller ID and voice mail) decreasedrevenues approximately $329 in 2003 and $238 in 2002 duein part to the access line declines and an uncertain economy.
Pricing responses to competitors’ offerings and regulatorychanges reduced revenue approximately $398 in 2003 and$7 in 2002. Billing adjustments with our wholesale customersalso decreased revenues approximately $297 in 2003.Reduced demand for inside wire service agreementsdecreased revenues approximately $138 in 2003 and $118 in2002. Revenue also decreased approximately $210 in 2003and $75 in 2002 due to an interim California regulatory
order that reduced UNE-P pricing. Revenue from “local plus”plans (expanded local calling area) declined $92 as morecustomers chose broader long-distance and other bundledofferings. Payphone revenues decreased approximately $99in 2003 and $109 in 2002 due to a continued decline inusage. Reduced demand for voice equipment located oncustomer premises decreased revenues approximately $59 in 2003 and $248 in 2002. Revenues also decreasedapproximately $34 in 2003 and $86 in 2002 due to the July 2000 Coalition for Affordable Local and Long DistanceService (CALLS) order which capped prices for certain services.Revenue was also lower in 2002 by approximately $117 dueto the June 2001 Illinois legislation which increased 2001revenues. This June 2001 legislation imposed new require-ments on Illinois telecommunications companies relating to service standards, service offerings and competitors’ access to our network. Revenue in 2002 was also lower byapproximately $66 due to the reversal of an accrual relatedto an FCC rate-related issue which increased 2001 revenue.Partially offsetting these revenue declines, demand forwholesale services, primarily UNE-P lines provided tocompetitors, increased revenues approximately $478 in 2003 and $200 in 2002.
Revenue also decreased approximately $37 in 2003 andincreased approximately $47 in 2002 due to accruals relatedto the 2002 approval by the Texas Public Utility Commission(TPUC) that allows us to collect higher local rates than wehad previously billed in 32 telephone exchanges (retroactiveto 1999). In 2002, we accrued revenue of $47 in connectionwith this issue and accrued an additional $10 in 2003. (Theseaccruals represent previously earned revenue which webegan collecting in the fourth quarter of 2003 and willcontinue to prospectively collect.) In addition to theseaccruals, beginning in the fourth quarter of 2002 we begancharging the higher local rates approved by the TPUC on a going-forward basis. As a result of these higher rates,revenue increased approximately $15 in 2003 and $3 in2002. The net effect of the TPUC’s 2002 decision was todecrease revenue approximately $22 in 2003 and increaserevenue approximately $50 in 2002.
Data revenues increased $511, or 5.3%, in 2003 and $8, or 0.1%, in 2002. The increases are primarily due tocontinued growth in DSL, our broadband internet-accessservice, which increased approximately $484 in 2003 and$326 in 2002. The number of DSL lines in service grew toapproximately 3,515,000 in 2003 as compared to 2,199,000at the end of 2002 and 1,333,000 at the end of 2001.
Our high-capacity transport services, which include DS1sand DS3s (types of dedicated high-capacity lines), and SONET(a dedicated high-speed solution for multi-site businesses),represented about 65% of our total data revenues in 2003and 69% in 2002. Revenue from these high-capacity serviceswas essentially flat in both 2003 and 2002 as increaseddemand was mostly offset by price decreases and volumediscounts to respond to competition. These price decreasesalso included the impact of the continued implementationof the 2000 federal CALLS order of approximately $82 in2003 and $78 in 2002.
2003 data revenues also increased approximately $45 as aresult of a settlement with WorldCom. This increase waspartially offset by approximately $26 related to a prior-year

P A G E 1 2
M A N A G E M E N T ’ S D I S C U S S I O N A N D A N A L Y S I S O FF I N A N C I A L C O N D I T I O N A N D R E S U L T S O F O P E R A T I O N S ( C O N T I N U E D )Dollars in millions except per share amounts
WorldCom settlement, which increased 2002 revenue. In2002, our e-commerce revenues increased approximately$152, primarily due to our acquisition of ProdigyCommunications Corp. (Prodigy) in late 2001. The 2002increases in data transport and e-commerce were virtuallyoffset by a decrease of approximately $537 in revenues fromdata equipment sales and network integration services.
Long-distance voice revenues increased $237, or 10.2%,in 2003 and decreased $112, or 4.6%, in 2002. The 2003increase was primarily driven by increased sales of combinedlong-distance and local calling fixed-fee offerings (referredto as bundling) in our West and Southwest regions as well as strong early results in the Midwest, where we launchedlong-distance service in late September and October 2003.Retail interLATA long-distance (traditional long-distance)revenues increased approximately $385 reflecting our abilityto now offer nationwide long-distance services. In additionto our previous entries into the Arkansas, Kansas, Missouri,Oklahoma and Texas (collectively, our “Southwest” region)and Connecticut long-distance markets, we entered thelong-distance markets in California in December 2002;Nevada in April 2003 (both, our “West” region); Michigan in late September 2003 and, most recently, Illinois, Indiana,Ohio and Wisconsin (all five, our “Midwest” region) in late October 2003. Also contributing to the increase wascontinuing growth in our international calling bundles and ourbusiness long-distance service. Our retail international long-distance revenue increased approximately $112 due to highercall volumes that originate or terminate internationally.
Partially offsetting these increases was a decline ofapproximately $286 in retail intraLATA long-distance (localtoll) revenues. The decrease in intraLATA revenues is due toaccess line losses, a decline in minutes of use and pricedecreases caused by increased competition and our fixed-feebundling packages. IntraLATA revenues declined approxi-mately $106 due to access line losses. Market-driven pricereductions decreased intraLATA revenues approximately $53. The remainder of the intraLATA revenue decline wasprimarily due to decreases in billed intraLATA minutes ofuse. The decline in usage mainly related to the increasedsales of our fixed-fee bundles, which do not separately bill minutes of use. We expect these declining intraLATArevenue trends to continue.
The 2002 decrease in long-distance revenue was due to adecrease of approximately $381 in retail intraLATA revenuesprimarily due to increased competition throughout our 13-state area. We were required to open our markets tocompetition in order to gain approval to offer interLATAlong-distance service. The decline in local toll revenues wasonly partially offset by increases in long-distance revenues inthe six states where we were authorized to offer interLATAlong-distance services for virtually all of 2002. In particular,intraLATA minutes of use declined approximately 19.6%,which decreased revenues approximately $171. IntraLATArevenues also decreased approximately $85 resulting fromaccess line losses. Partially offsetting the intraLATA revenuedecline was an increase in retail interLATA revenues ofapproximately $155, resulting from our 2001 entries into theArkansas, Kansas, Missouri and Oklahoma long-distancemarkets in addition to our previous entries into the Texasand Connecticut markets.
Revenue from wholesale long-distance services providedto Cingular, under a 2002 related-party agreement,increased approximately $24 in 2003 and $114 during 2002.However, this did not have a material impact on our netincome as the long-distance revenue was mostly offset whenwe recorded our share of equity income from Cingular.
Other operating revenues decreased $97, or 5.7%, in2003 and $235, or 12.1%, in 2002. Revenue from directoryand operator assistance, billing and collection servicesprovided to other carriers, wholesale and other miscella-neous products and services decreased approximately $119 in 2003 and $127 in 2002. Various one-time billingadjustments decreased revenues approximately $75 in 2003and $49 in 2002, and adjustments to our deferred activationrevenues decreased revenues $77 in 2002. Partially offsettingthese decreases, price increases, primarily in directoryassistance, increased revenue approximately $38 in 2003 and $63 in 2002. In addition, commissions paid by Cingularfor wireless sales from SBC sources increased revenueapproximately $55 in 2003 and $7 in 2002. Recognition ofwireline deferred activation fees also increased revenuesapproximately $7 in 2003.
Cost of sales expenses increased $269, or 1.7%, in 2003and decreased $252, or 1.6%, in 2002. Cost of sales consistsof costs we incur to provide our products and services,including costs of operating and maintaining our networks.Costs in this category include our repair technicians andrepair services, network planning and engineering, operatorservices, information technology, property taxes related toelements of our network, and payphone operations. Pension and postretirement costs are also included to theextent that they are allocated to our network labor forceand other employees who perform the functions listed inthis paragraph.
Our combined net pension and postretirement cost(which includes certain employee-related benefits) increasedapproximately $824 in 2003 and $1,307 in 2002 due toenhanced termination benefits, net investment losses,varying levels of net settlement gains ($0 in 2003, $19 in2002 and $807 in 2001), the effect of previous recognition of pension settlement gains reducing the amount ofunrealized gains recognized in the current year, a lowerassumed long-term rate of return on plan assets and areduction in the discount rate (see Note 10). Salary andwage merit increases and other bonus accrual adjustmentsincreased expense approximately $508 in 2003 and $175 in2002. Wage increases in 2002 were partially offset bytermination of most management vacation carry-overpolicies and reduction of employee bonuses. Reciprocalcompensation expense (fees paid to connect calls outsideour network) for our long-distance lines increasedapproximately $248 in 2003 and $134 in 2002 due to asignificant increase in minutes used from additional long-distance customers since we began service in California, andto the increased sales of fixed-fee plans with unlimitedusage. Costs associated with equipment sales and relatednetwork integration services increased approximately $77 in 2003, compared to a decrease of $652 in 2002, which was primarily due to previous efforts to de-emphasize low-margin equipment sales.
P A G E 1 3
Partially offsetting the increases, lower employee levelsdecreased expenses, primarily salary and wages,approximately $312 in 2003 and $559 in 2002. Expensesdecreased approximately $221 in 2003 due to lowerseverance accruals, after increasing approximately $114 in2002. Other employee-related expenses including travel,training and conferences decreased approximately $34 in2003 and $143 in 2002.
Nonemployee-related expenses such as contract services,agent commissions and materials and supplies costsdecreased approximately $545 in 2003 and $424 in 2002.Reciprocal compensation expense related to our wholesalelines decreased approximately $212 in 2003 as the lowerrates that we have negotiated with other carriers have morethan offset the growth in minutes that our customers haveused outside of our network. In 2002, reciprocal compensa-tion expense on our wholesale lines increased approximately$44 primarily due to growth in wireless and competitors’local exchange carrier minutes of use on our network.
Expenses decreased approximately $48 in 2002 dueprimarily to one-time expenses incurred in 2001 toimplement the Illinois legislation discussed in “Voice”revenues above. Expenses also decreased approximately$200 in 2002 due to costs recorded in 2001 from asettlement with the Illinois Commerce Commission related to a provision of the Ameritech merger. The amountrepresents an estimate of all future cost savings to be shared with our Illinois customers.
Selling, general and administrative expenses increased$349, or 4.1%, in 2003 and $224, or 2.7%, in 2002. Selling,general and administrative expenses consist of our provisionfor uncollectible accounts, advertising costs, sales andmarketing functions, including our retail and wholesalecustomer service centers, centrally managed real estate costs,including maintenance and utilities on all owned and leasedbuildings, credit and collection functions and corporateoverhead costs, such as finance, legal, human resources andexternal affairs. Pension and postretirement costs are alsoincluded to the extent they relate to employees whoperform the functions listed in this paragraph.
Salary and wage merit increases and other bonus accrualadjustments increased expenses approximately $470 in 2003and decreased expenses by approximately $6 in 2002. Wage increases in 2002 were more than offset by termina-tion of most management vacation carry-over policies andreduction of employee bonuses. Our combined net pensionand postretirement cost (which includes certain employee-related benefits) increased approximately $404 in 2003 and
$644 in 2002, due to enhanced termination benefits, netinvestment losses, varying levels of net settlement gains ($0 in 2003, $9 in 2002 and $397 in 2001), the effect ofprevious recognition of pension settlement gains reducingthe amount of unrealized gains recognized in the currentyear, a lower assumed long-term rate of return on planassets and a reduction in the discount rate (see Note 10).Advertising expense increased approximately $368 in 2003and $94 in 2002, primarily driven by our launch of long-distance service in new markets and bundling initiatives. In 2004, we expect advertising to remain flat from 2003levels even as we promote the launch of interLATA long-distance service in all five Midwest states, which began in late 2003.
Our provision for uncollectible accounts decreasedapproximately $479 in 2003 as we experienced fewer lossesfrom our retail customers and a decrease in bankruptcyfilings by our wholesale customers. Contributing to thisdecrease in 2003 was the 2003 reversal of WorldCom baddebt reserves of $86 as a result of a settlement reached withWorldCom (see “Other Business Matters”). Year-over-yearcomparisons were also affected by our recording in 2002 of an additional bad debt reserve of $125 as a result of theWorldCom bankruptcy filing.
Lower severance accruals decreased expenses approxi-mately $148 in 2003 and higher accruals increased expensesby approximately $49 in 2002. Additionally, lower employeelevels decreased expenses, primarily salary and wages,approximately $121 in 2003 and $165 in 2002. Otheremployee-related expenses including travel, training andconferences decreased approximately $23 in 2003 and $127in 2002. Other nonemployee-related expenses such ascontract services, agent commissions and materials andsupplies costs also decreased approximately $120 in 2003and $177 in 2002.
Expenses decreased approximately $86 in 2002 dueprimarily to one-time expenses incurred in 2001 toimplement the Illinois legislation discussed in “Voice”revenues above.
Depreciation and amortization expenses decreased $679,or 8.0%, in 2003 and $19, or 0.2%, in 2002. The change inour depreciation rates when we adopted FAS 143 decreasedexpenses approximately $340 in 2003. Reduced capitalexpenditures accounted for the remainder of the decrease.In 2002, amortization decreased approximately $161 asgoodwill was no longer amortized in accordance with FAS142 (see Note 1) which more than offset increased expenseprimarily related to amortization of software.
We account for our 60% economic interest in Cingularunder the equity method of accounting in our consolidatedfinancial statements since we share control equally (i.e.50/50) with our 40% economic partner in the joint venture.We have equal voting rights and representation on theboard of directors that controls Cingular. This means thatour consolidated reported results include Cingular’s results in the “Equity in Net Income of Affiliates” line. However,when analyzing our segment results, we evaluate Cingular’sresults on a stand-alone basis. Accordingly, in the segmenttable above, we present 100% of Cingular’s revenues andexpenses under “Segment operating revenues” and“Segment operating expenses”. (Beginning with 2003, theCingular segment replaces our previously titled “wireless”segment, which included 60% of Cingular’s revenues andexpenses.) Including 100% of Cingular’s results in oursegment operations (rather than 60% in equity in net incomeof affiliates) affects the presentation of this segment’srevenues, expenses, operating income, nonoperating itemsand segment income, but does not affect our consolidatedreported net income. We are currently evaluating how theprovisions of FIN 46 will affect our accounting for Cingular.FIN 46 will apply to our investment in Cingular starting withits 2004 first-quarter results (see Note 1).
On February 17, 2004, Cingular announced an agreementto acquire AT&T Wireless Services Inc. (AT&T Wireless). See“Other Business Matters” for more details.
The FCC adopted rules allowing customers to keep theirwireless number when switching to another company(generally referred to as “number portability”). The FCC rulesrequiring number portability were effective on November 24,2003. For 2003 these rules had a minor impact on Cingular’scustomer turnover (“churn”) rate. During 2003 Cingular’scellular/PCS (wireless) churn was 2.7%, a slight improvementfrom the 2.8% churn from 2002. Cingular has incurred costsdirected toward implementing these rules and minimizingcustomer churn and expects these costs, consisting primarilyof handset subsidies, selling costs and greater staffing of
P A G E 1 4
M A N A G E M E N T ’ S D I S C U S S I O N A N D A N A L Y S I S O FF I N A N C I A L C O N D I T I O N A N D R E S U L T S O F O P E R A T I O N S ( C O N T I N U E D )Dollars in millions except per share amounts
customer care centers, to continue to increase during 2004. To the extent wireless industry churn remains higher than inthe past, Cingular expects those costs to increase.
Cingular’s wireless networks use equipment with digitaltransmission technologies known as Global System forMobile Communication (GSM) technology and Time DivisionMultiple Access (TDMA) technology. Cingular substantiallycompleted upgrading its existing TDMA markets to use GSMtechnology in order to provide a common voice standard.Cingular’s GSM network now covers approximately 93% ofCingular’s population of potential customers (referred to inthe media as “POPs”) in areas Cingular provides wirelessservice. Also, Cingular is adding high-speed technologies fordata services known as General Packet Radio Services (GPRS)and Enhanced Data Rates for GSM Evolution (EDGE).
In August 2003, Cingular agreed to purchase fromNextWave Telecom, Inc. (NextWave) FCC licenses for wirelessspectrum in 34 markets for $1,400. See “Expected GrowthAreas” for more detail.
Our Cingular segment operating income margin was14.8% in 2003, 16.9% in 2002 and 17.9% in 2001. The lower2003 margin was caused by a number of factors. Cingular’soperating expenses increased primarily due to acquisitioncosts related to higher customer additions, and extensivecustomer retention and customer service initiatives inanticipation of number portability. Network operating costsalso increased due to ongoing growth in customer usageand incremental costs related to Cingular’s GSM networkupgrade. Only partially offsetting these expense increaseswere modest revenue growth and slightly decreased costs in other areas, including prior and ongoing system and process consolidations. At December 31, 2003, Cingular hadapproximately 24 million wireless customers, as compared to 21.9 million at December 31, 2002 and 21.6 million atDecember 31, 2001.
Cingular’s 2002 slight decline in segment operatingincome margin of 1.0%, as compared to 2001, was primarilydue to the higher network costs due to increased network
Cingular
Segment Results
Percent Change
2003 vs. 2002 vs. 2003 2002 2001 2002 2001
Segment operating revenuesService $14,223 $13,922 $13,229 2.2% 5.2%Equipment 1,260 981 1,039 28.4 (5.6)
Total Segment Operating Revenues 15,483 14,903 14,268 3.9 4.5
Segment operating expensesCost of services and equipment sales 5,683 5,106 4,564 11.3 11.9Selling, general and administrative 5,422 5,426 5,235 (0.1) 3.6Depreciation and amortization 2,089 1,850 1,921 12.9 (3.7)
Total Segment Operating Expenses 13,194 12,382 11,720 6.6 5.6
Segment Operating Income 2,289 2,521 2,548 (9.2) (1.1)
Interest Expense 856 911 822 (6.0) 10.8
Equity in Net Income (Loss) of Affiliates (323) (265) (68) (21.9) —
Other, net (60) (94) 42 36.2 —
Segment Income $ 1,050 $ 1,251 $ 1,700 (16.1)% (26.4)%

P A G E 1 5
minutes of use partially offset by increased revenues. Thecontinued decline in Cingular’s operating margin alsoreflects continued customer shifts to all inclusive rate plansthat include roaming, long-distance and “Rollover” minutes,which allow customers to carry over unused minutes frommonth to month for up to one year. See further discussionof the details of our Cingular segment revenues andexpenses below.
In the fourth quarter of 2003, to be consistent withemerging industry practices, Cingular changed its incomestatement presentation for the current and prior-yearperiods to record billings to customers for the UniversalService Fund and other regulatory fees as “Service revenues”and the payments by Cingular of these fees into theregulatory funds as “Cost of services and equipment sales”.This amount totaled $337 in 2003, $176 in 2002 and $160 in 2001. Operating income and net income for all periodswere not affected.
Service revenues increased $301, or 2.2%, in 2003 and$693, or 5.2%, in 2002. Cingular’s local service revenuesincreased approximately $487 in 2003 due to the significantlyhigher customer net additions and greater local minutes ofuse. Data services also increased, primarily in short messagingservices; however, data services are not yet a significantcomponent of revenues. These increases were partially offsetby decreases of approximately $172 in roaming and long-distance revenues, of which $57 were attributable toCingular customers continuing to migrate to all-inclusiveregional and national rate plans that include roaming andlong-distance. Roaming revenues from other wireless carriersfor use of Cingular’s network decreased approximately $115in 2003, primarily due to lower negotiated roaming rates,which offset the impact of increasing volumes. In addition,approximately $35 of activation revenues from Cingular’sown sales sources were reclassified from local servicerevenues to equipment sales as a result of the July 2003adoption of Emerging Issues Task Force Interpretation No. 00-21 (EITF 00-21) (see Note 1).
The 2002 increase was primarily driven by customergrowth compared to 2001 and an increase in handsetguaranty premiums. Partially offsetting the 2002 increasewere decreased long-distance and incollect roamingrevenues, as customers shifted to rate plans that includedthese features for no additional charge. 2002 revenues alsodecreased due to a 45.1% decrease in customers servedthrough reseller agreements. Reseller customers comprisedapproximately 3% of Cingular’s 2002 customer base.
Equipment revenues increased $279, or 28.4%, in 2003and decreased $58, or 5.6%, in 2002. For 2003, equipmentsales were driven by increased handset revenues primarily asa result of significantly higher customer additions andincreases in existing customers upgrading their units, partiallyoffset by lower accessory revenues. Upgrade unit salesreflect the GSM upgrade and Cingular’s efforts to increasethe number of customers under contract. In addition, 2003equipment revenues also increased $35 due to the July 2003adoption of EITF 00-21 mentioned above (see Note 1).
Cingular 2002 equipment revenues declined from 2001primarily as a result of a 5.0% decline in non-reseller grosscustomer additions from 2001.
Cost of services and equipment sales expenses increased$577, or 11.3%, in 2003 and $542, or 11.9%, in 2002. The2003 increase was primarily due to increased equipmentcosts of $496 as well as higher network costs. The increasedequipment costs were driven primarily by higher handsetunit sales associated with the significant increase incustomer additions and existing customers upgrading their units. Increased equipment costs also resulted fromhigher per-unit handset costs due to a shift to higher-endhandsets such as the dual-system TDMA/GSM handsets in use during Cingular’s GSM system conversion and newlyintroduced GSM-only handsets. In addition, Cingular soldhandsets below cost, through direct sales sources, tocustomers who committed to one-year or two-year contractsor in connection with other promotions. Network costsincreased due to a 19.1% increase in minutes of use for2003. Local network costs also increased due to systemexpansion and increased costs of redundant TDMA networksduring the current GSM system upgrade.
The 2002 increase was primarily due to significantincreases in minutes of use on the network and increasedroaming and long-distance costs, which were driven bycustomer migrations to rate plans that include these services for no additional charge. Minutes of use increasedapproximately 36% over 2001, which was primarily causedby demand for digital plans with more included minutes and off-peak promotions, which allow for a large number of free minutes.
Selling, general and administrative expenses decreased$4, or 0.1%, in 2003 and increased $191, or 3.6%, in 2002.Cingular’s 2003 expense was basically flat compared to 2002due to lower billing, administrative and bad debt expensespartially offset by increased selling expenses. The lowerbilling expenses reflect efficiencies gained from 2002 systemconversions and related consolidations. The decreasedadministrative costs were due to reduced employee-relatedcosts and decreased information technology and develop-ment expenses resulting from a 2002 workforce reorgani-zation. The decline in bad debt expense includes a $20recovery of 2002 WorldCom write-offs. Partially offsettingthese declines were increased selling expenses ofapproximately $103 driven primarily by higher advertisingcosts and commissions expense. The commissions expenseincrease reflects the nearly 14% increase in total postpaidand prepaid gross customer additions compared with 2002.
Cingular’s higher 2002 costs were driven by increases of$135 related to maintaining and supporting its customerbase, $41 in administrative costs and $15 in selling expenses.The $135 expense increase for maintenance and support ofCingular’s customer base included higher residuals andupgrade commissions, increased customer retention costsand bad debt expense. Bad debt expense increased $70,with over half of the increase attributable to WorldComwrite-offs in 2002. Partially offsetting these cost increaseswere savings related to lower billing and customer serviceexpenses, reflecting Cingular’s consolidation of call centersand billing systems.
Depreciation and amortization expenses increased $239,or 12.9%, in 2003 and decreased $71, or 3.7%, in 2002. The 2003 increase was primarily related to higher capital

P A G E 1 6
M A N A G E M E N T ’ S D I S C U S S I O N A N D A N A L Y S I S O FF I N A N C I A L C O N D I T I O N A N D R E S U L T S O F O P E R A T I O N S ( C O N T I N U E D )Dollars in millions except per share amounts
expenditures for network upgrades, including the GSM overlay, and increased depreciation on certain networkassets resulting from Cingular’s 2003 decision to shorten theestimated remaining useful life of TDMA assets. Cingulardetermined that a reduction in the useful lives of TDMAassets was warranted based on the projected transition of network traffic to GSM technology. Useful lives wereshortened to fully depreciate all TDMA equipment by the
end of 2008. As a result of the change in estimate,depreciation expense increased $91 in 2003.
The 2002 decline of $71 was primarily related to a $219decrease in amortization of goodwill and FCC licenses inaccordance with FAS 142 (see Note 1), which no longer allowsamortization of goodwill and other intangible assets. This waspartially offset by increases in depreciation expense of $148related to higher plant levels and Cingular’s GSM conversion.
Directory
Segment Results
Percent Change
2003 vs. 2002 vs. 2003 2002 2001 2002 2001
Total Segment Operating Revenues $4,254 $4,451 $4,468 (4.4)% (0.4)%
Segment operating expensesCost of sales 896 920 895 (2.6) 2.8Selling, general and administrative 1,036 1,011 1,007 2.5 0.4Depreciation and amortization 21 30 36 (30.0) (16.7)
Total Segment Operating Expenses 1,953 1,961 1,938 (0.4) 1.2
Segment Income $2,301 $2,490 $2,530 (7.6)% (1.6)%
As previously discussed, effective January 1, 2003, wechanged our method of recognizing revenues and expensesrelated to publishing directories from the “issue basis”method to the “amortization” method. As allowed by GAAP,we made this change prospectively; therefore, in the tableabove, results in 2003 are shown on the amortization basis,while results from 2002 and 2001 are shown on the issuebasis method. This corresponds to the manner in whichdirectory results are included in our consolidated results.
Our directory segment income was $2,301 with anoperating margin of 54.1% in 2003. In 2002, our directorysegment income was $2,490 with an operating margin of55.9%. If we were to eliminate the effects of the accountingchange and shifts in the schedule of directory titles
published in 2003, our directory segment income wouldhave been $2,205 and the operating margin would havebeen 52.7% in 2003, compared to $2,323, with an operatingmargin of 54.5%, in 2002. The relative decrease in segmentincome of $118 as well as the decreased operating marginwas due primarily to increased employee-related costscombined with pressure on revenues from increasedcompetition and lower demand from advertisers.
The table below shows the estimated directory segmentresults for all years as if we had adopted the amortizationmethod on January 1, 2001. This presentation allows us toisolate the underlying business changes over the last three years.
Estimated Directory Results on Amortized Basis
Percent Change
2003 vs. 2002 vs. 2003 2002 2001 2002 2001
Total Segment Operating Revenues $4,254 $4,313 $4,309 (1.4)% 0.1%
Segment operating expensesCost of sales 896 942 887 (4.9) 6.2Selling, general and administrative 1,036 1,025 1,001 1.1 2.4Depreciation and amortization 21 30 36 (30.0) (16.7)
Total Segment Operating Expenses 1,953 1,997 1,924 (2.2) 3.8
Segment Income $2,301 $2,316 $2,385 (0.6)% (2.9)%

P A G E 1 7
Our directory segment income was $2,301 with an operatingmargin of 54.1% in 2003. If we had been using theamortization method, our directory segment income wouldhave been approximately $2,316 in 2002, with an operatingmargin of 53.7% and $2,385 in 2001, with an operatingmargin of 55.3%.
Operating revenues decreased $59, or 1.4%, in 2003 andincreased $4, or 0.1%, in 2002. Revenues in 2003 decreasedprimarily as a result of competition from other publishers,other advertising media and continuing economic pressureson advertising customers. Revenues in 2002 were essentiallyflat compared to 2001.
Cost of sales decreased $46, or 4.9%, in 2003 andincreased $55, or 6.2%, in 2002. In 2003, cost of salesdecreased due to lower product related costs. Higheremployee benefit related costs increased cost of sales in 2002.
Selling, general and administrative expenses increased$11, or 1.1%, in 2003 and $24, or 2.4%, in 2002. Increasedexpenses in 2003 are primarily due to increased employee-related costs. The increase in expenses in 2002 is the result of increased costs for advertising, employee-related expenses and increased bad debt expense.
International
Segment Results
Percent Change
2003 vs. 2002 vs. 2003 2002 2001 2002 2001
Total Segment Operating Revenues $ 30 $ 35 $185 (14.3)% (81.1)%
Total Segment Operating Expenses 47 85 241 (44.7) (64.7)
Segment Operating Income (Loss) (17) (50) (56) 66.0 10.7
Equity in Net Income of Affiliates 606 1,152 555 (47.4) —
Segment Income $589 $1,102 $499 (46.6)% —
Our international segment consists almost entirely of equityinvestments in international companies, the income fromwhich we report as equity in net income of affiliates.Revenues from direct international operations are less than1% of our consolidated revenues.
Our earnings from foreign affiliates are sensitive toexchange-rate changes in the value of the respective localcurrencies. See Notes 1 and 8 for discussions of foreigncurrency translation and how we manage foreign-exchangerisk. Our foreign investments are recorded under GAAP,which include adjustments for the purchase method ofaccounting and exclude certain adjustments required forlocal reporting in specific countries. In discussing “Equity inNet Income of Affiliates”, all dollar amounts refer to theeffect on our income.
Segment operating revenues decreased $5, or 14.3%, in 2003 and $150, or 81.1%, in 2002. Revenues declined in 2003 primarily due to lower management-fee revenues. The decrease in 2002 was due to the September 2001disposition of Ameritech Global Gateway Services (AGGS),our international long-distance subsidiary, and lowermanagement-fee revenues.
Segment operating expenses decreased $38, or 44.7%, in 2003 and $156, or 64.7%, in 2002. The decrease in 2003was primarily due to lower corporate-allocated charges. The decrease in 2002 was primarily due to the disposition of AGGS.
Our equity in net income of affiliates by major investmentat December 31, are listed below:
2003 2002 2001
América Móvil $ 76 $ 60 $ (39)Belgacom 28 218 85Bell Canada1 — 53 176Cegetel1 — 88 94TDC 182 481 (157)Telkom South Africa 121 31 54Telmex 196 219 325Other 3 2 17
International Equity in NetIncome of Affiliates $ 606 $1,152 $ 555
1Investment sold

Other
Segment Results
Percent Change
2003 vs. 2002 vs. 2003 2002 2001 2002 2001
Total Segment Operating Revenues $ 263 $ 389 $ 768 (32.4)% (49.3)%
Total Segment Operating Expenses 120 175 954 (31.4) (81.7)
Segment Operating Income (Loss) 143 214 (186) (33.2) —
Equity in Net Income of Affiliates 647 769 1,040 (15.9) (26.1)
Segment Income $ 790 $ 983 $ 854 (19.6)% 15.1%
P A G E 1 8
M A N A G E M E N T ’ S D I S C U S S I O N A N D A N A L Y S I S O FF I N A N C I A L C O N D I T I O N A N D R E S U L T S O F O P E R A T I O N S ( C O N T I N U E D )Dollars in millions except per share amounts
Equity in net income of affiliates decreased $546, or 47.4%,in 2003 and increased $597 in 2002. The decrease in 2003was primarily due to transactions at Belgacom S.A.(Belgacom), including a settlement loss on the transfer ofpension liabilities in 2003 and gains on a sale by Belgacomand TDC which occurred in 2002 and affected year-over-yearcomparisons. The settlement loss in 2003 resulted from atransfer of pension liabilities by Belgacom to the Belgiangovernment and included a loss of approximately $115 fromBelgacom and TDC’s loss of $45 associated with the sametransaction (see “Other Business Matters” for a discussion of the related Belgacom agreement and our equity interestsin Belgacom and TDC). The 2002 gains included approxi-mately $180 from Belgacom, related to a sale of a portion of its Netherlands wireless operations and TDC’s gain of approximately $336 associated with that same sale.Additionally, comparisons for 2003 were affected by 2002gains of $17 from Belgacom, related to a merger involvingone of its subsidiaries and TDC’s gain of approximately $7 associated with that same transaction.
Equity income for 2003 also decreased due to restruc-turing charges of $39 at TDC and foregone equity income of approximately $88 and $53 from the sales of Cegetel and Bell Canada, respectively. Equity income from Telmexdecreased approximately $23 for 2003 due primarily to 2002deferred tax adjustments and unfavorable exchange rates,partially offset by lower financing costs.
The decrease for 2003 was partially offset by the year-over-year comparison of $101 from a 2002 restructuringcharge at Belgacom, as well as a favorable exchange rateimpact at TDC of $28. Also offsetting the 2003 decreasewere improved operating results from Belgacom of $58 primarily driven by wireline and wireless operations and $32 at TDC primarily due to improved TDC Switzerlandoperations. Additionally, equity income from América Móvilfor 2003 increased approximately $15 resulting fromimproved operating results and lower financing, partiallyoffset by tax adjustments. Equity income from Telkom for2003 increased approximately $89 resulting primarily from
a favorable exchange rate impact, improved operatingresults and a gain resulting from the significant reduction of an arbitration accrual.
The 2002 increase includes approximately $220 resultingfrom the January 1, 2002 adoption of FAS 142, whicheliminated the amortization of goodwill embedded in ourinvestments in equity affiliates. Excluding the effects ofadopting FAS 142, our equity in net income of affiliateswould have increased $377, or 67.9%, in 2002.
The 2002 increase also included gains of approximately$180 from Belgacom, related to a sale of a portion of itsNetherlands wireless operations and TDC’s gain ofapproximately $336 associated with that same sale. These2002 gains were higher than similar gains in 2001, whichwere approximately $46 and $17 from Belgacom and TDC respectively. Also contributing to the 2002 increase wasthe prior-year charge of approximately $197 related to TDC’s decision to discontinue nonwireless operations of itsTalkline subsidiary and our impairment of goodwill weallocated to Talkline at the time of our initial investment in TDC. A gain of approximately $28 from Bell Canada’s 2002 partial sale of an investment and the 2001 loss ofapproximately $32 on Belgacom’s sale of its French internetbusiness also affected year-over-year comparisons.
The 2002 increase was partially offset by the followingthree charges: approximately $101 and $58 for restructuringcosts at Belgacom and Bell Canada, respectively, andapproximately $58 related to impairments of TDC’sinvestments in Poland, Norway and the Czech Republic. 2001 gains of approximately $53 on Cegetel’s sale of AOL France and $49 on Bell Canada’s sale of Sympatico-Lycosalso affected year-over-year comparisons. Our 2002 equityincome from Bell Canada declined approximately $101 as a result of our May 2002 change from the equity method to the cost method of accounting for that investment. Our removal from day-to-day management and theprogression of negotiations to sell our interest in BellCanada resulted in this accounting change (see Note 2).
Our other segment results in 2003 and 2002 primarilyconsist of corporate and other operations. Results for 2001 include the Ameritech cable television operations,Ameritech security monitoring business, and wirelessproperties that were not contributed to Cingular. All of these assets were sold in 2001.
2003 revenues decreased as a result of lower operating
revenue from a capital leasing subsidiary. Revenue in 2002decreased approximately $379 primarily due to the sale ofassets in 2001 that contributed approximately $362 ofrevenue in 2001. Expenses also decreased as a result of thedisposition of operating companies in 2001.
Substantially all of the Equity in Net Income of Affiliatesrepresents the equity income from our investment in Cingular.

P A G E 1 9
O P E R AT I N G E N V I R O N M E N T A N D T R E N D S O F T H E B U S I N E S S
2004 Revenue Trends We expect our revenue loss trends tostabilize and, by the end of 2004, we expect year-over-yeargrowth in revenues (after including our share of Cingular’srevenues) for the following reasons. 2004 marks the firstyear in which we can offer interLATA long-distancenationwide (see “Long-Distance” in our “RegulatoryDevelopments” section). As a result, we expect bothcontinued growth in long-distance and DSL and growth inthe large business and national data market. We now havethe ability to effectively compete for national customers dueto the removal of restrictions on our providing them withnationwide long-distance. Increasing competition in thecommunications industry may pressure revenue as werespond to competitors’ pricing strategies. As discussedbelow, many of our competitors are subject to less or noregulation, have subsidized costs due to UNE-P or haveemerged from bankruptcy with minimal debt and thereforehave significant cost advantages. However, we expect con-tinued success with our bundling strategy to offset any suchpressure by improving customer retention and slowing ouraccess line losses.
2004 Expense Trends We expect continued pressure onour operating margins during much of the year, driven byinvestment in growth areas such as the large businessmarket. However, we expect these margins to stabilize bythe end of 2004, due primarily to changing revenue trendsas discussed above and continued cost control measures,including pension and postretirement benefit costs, as noted below. We also assume no change in historicalexpense trends resulting from our negotiating newcollective bargaining agreements during 2004.
2004 Pension and Retiree Medical Cost Expense TrendsWhile medical and prescription drug costs continue to rise, we expect that 2003’s improved investment returnscombined with voluntary pre-funding of plan obligations in 2003 will lower our pension and postretirement costs in2004 (see Note 10). We expect combined net pension andpostretirement cost of between $1,000 and $1,400 in 2004,compared to our combined net pension and postretirementexpense of $1,835 in 2003. Approximately 10% of theseannual costs are capitalized as part of construction labor,providing a reduction in the net expense recorded. Certainfactors, such as investment returns, depend largely on trendsin the U.S. securities market and the general U.S. economy,and we cannot control those factors. In particular, while we expect positive investment returns in 2004, uncertainty in the securities markets and U.S. economy could result ininvestment volatility and significant changes in plan assets,which under GAAP we will recognize over the next severalyears. Additionally, should actual experience differ fromactuarial assumptions, combined net pension and postretire-ment cost would be affected in future years.
For the majority of our labor contracts that contain anannual dollar value cap for the purpose of determiningcontributions required from nonmanagement retirees, wehave waived the cap during the relevant contract periodsand thus not collected contributions from those retirees.
Therefore, in accordance with the substantive plan provisionsrequired in accounting for postretirement benefits underGAAP, through 2003, we did not account for the cap in thevalue of our accumulated postretirement benefit obligation(i.e., we assumed the cap would be waived for all futurecontract periods). If we had accounted for the cap as writtenin the contracts, our postretirement benefit cost would havebeen reduced by $884, $606 and $476 in 2003, 2002 and2001. In early 2004, nonmanagement retirees were informedof changes in their medical coverage beginning in 2005. Weanticipate the changes could reduce postretirement benefitcost as much $300 to $600 during 2004. In addition, we alsoexpect to reduce our annual costs approximately $250 to $350due to recently passed Medicare legislation that partiallysubsidizes the cost to employers of providing prescriptiondrug coverage for their retirees. For a comprehensivediscussion of our pension and postretirement cost (benefit),including a discussion of the actuarial assumptions, see Note 10.
CingularOn February 17, 2004, Cingular announced an agreement to acquire AT&T Wireless. The transaction is subject toapproval by shareholders of AT&T Wireless and federalregulators. At this time we do not know if the acquisitionwill close in 2004 and cannot therefore predict the impacton Cingular’s 2004 subscriber, revenue or expense trends.Even if the acquisition does not close in 2004, we expectcontinued customer subscriber growth at Cingular since weexpect continued success from our bundling strategy andthe overall U.S. wireless market to continue to expand. We also expect that Cingular will continue to invest inimproving its network performance and customer servicewith the goal of stabilizing to improving its customerturnover rate. Assuming Cingular obtains the necessaryapprovals and the acquisition is completed, we expectCingular will incur additional integration costs to achieveoperating synergies and increased amortization expensefrom intangibles for several years. Cingular expects toachieve significant operating synergies through thisacquisition by consolidating networks, distribution, billing,procurement, marketing, advertising and other functions. As such, we expect initially a decrease in our net income as a result of the acquisition until the positive impacts of the synergies are realized. We also expect an increase infinancing costs to the extent additional debt is incurred to fund the acquisition.
Operating Environment OverviewThe Telecommunications Act of 1996 (Telecom Act) wasintended to promote competition and reduce regulation inU.S. telecommunications markets. Despite passage of theTelecom Act, the telecommunications industry, particularlyincumbent local exchange carriers such as our wirelinesubsidiaries, continue to be subject to significant regulation.The expected evolution from an industry extensivelyregulated by multiple regulatory bodies to a market-drivenindustry monitored by state and federal agencies has notoccurred as quickly or as thoroughly as anticipated.

P A G E 2 0
M A N A G E M E N T ’ S D I S C U S S I O N A N D A N A L Y S I S O FF I N A N C I A L C O N D I T I O N A N D R E S U L T S O F O P E R A T I O N S ( C O N T I N U E D )Dollars in millions except per share amounts
Our wireline subsidiaries remain subject to extensiveregulation by state regulatory commissions for intrastateservices and by the FCC for interstate services. We continueto face a number of state regulatory challenges. For example,certain state commissions, including those in California,Illinois, Michigan, Wisconsin, and Ohio have significantlylower wholesale rates, which are the rates we are allowedto charge competitors, including AT&T and MCI (formerlyknown as WorldCom) for leasing parts of our network(unbundled network elements, or UNEs) in a combined formknown as the UNE platform, or UNE-P. These mandatedrates, which range from 30% to 55% below our economiccost, are contributing to continued declines in our access linerevenues and profitability. As of December 31, 2003, wehave lost 6.7 million customer lines to competitors throughUNE-P, approximately 1.7 million of which were lost during2003, as compared to 2.6 million lost in 2002.
However, changes in the regulatory environment towardthe end of 2003 raise the possibility that the availability ofmandated below-cost priced UNE-P may be lessened.Following the FCC’s Triennial Review Order (TRO), issued inAugust 2003, we took immediate legal action at the UnitedStates Court of Appeals for the District of Columbia Circuit(D.C. Circuit) to correct the flaws that the FCC’s order main-tained. (The TRO is discussed in detail in the “RegulatoryDevelopments” section of this document.) This is one of twocourts that have already rejected the FCC’s earlierunbundling order. The court consolidated all pending law-suits into one proceeding and heard oral arguments inJanuary 2004. The D.C. Circuit is expected to issue a decisionon the TRO in the first half of 2004.
We continue to work toward UNE-P reform throughproceedings in most of our states. Those states are now inthe process of determining whether or not we must offeraccess to our central office switches, a key component ofUNE-P, to competitors in a given market at a government-mandated price. In addition, there are parallel proceedingsin several states in our 13-state area to reevaluate currentUNE-P pricing and bring it more in line with our costs. Stateproceedings could be significantly altered, or even vacatedby a D.C. Circuit ruling on UNE-P.
Despite a slightly more positive regulatory outlook, thecurrent environment continues to exert pressure on ouroperations. In 2003, we continued to eliminate full timeemployee positions and in 2004, we expect to continue tomaintain our lower capital expenditure budget, targetingbetween $5,000 and $5,500. However, unfavorableregulations imposed by the FCC or state commissions maycause us to experience additional declines in access linerevenues, which, in turn, could reduce our invested capitaland result in further reductions in capital expenditures and employment levels. Similarly, growth at higher-than-anticipated levels could increase these expenditures.
At the national level, the debate is gradually shiftingfrom regulating voice to regulating broadband. But whilethe FCC’s TRO created a potentially more positive regulatoryenvironment for broadband services, several questionsremain unanswered as to whether or to what extent oursubsidiaries will be required to unbundle their broadbandnetworks or offer these services to competitors. We areactively participating in proceedings underway at both the
federal and state level that will help define the appropriateregulatory environment for broadband services.
Once this difficult and uncertain regulatory environmentstabilizes, we expect that additional business opportunities,especially in the broadband area, would be created. At thesame time, the continued uncertainty in the U.S. economyand increasing local competition from multiple wireline andwireless providers in various markets presents significantchallenges for our business.
Expected Growth AreasWe expect our primary wireline products and wireless servicesto remain the most significant portion of our business andhave also discussed trends affecting the segment’s in whichwe report results for these products (see “Wireline SegmentResults” and “Cingular Segment Results”). Over the next fewyears we expect an increasing percentage of our revenues tocome from data, long-distance and Cingular’s wireless service.Whether, or the extent to which, growth in these areas willoffset declines in other areas of our business is not known.
Data/Broadband In October 1999, we announced plansto upgrade our network to make broadband servicesavailable to approximately 80% of our U.S. wirelinecustomers over the four years through 2003 (Project Pronto).Due to the weakening U.S. economy and an uncertain andadverse regulatory environment, in October 2001 weannounced a scale-back in our broadband deploymentplans. As discussed in greater detail below, in August 2003the FCC released its TRO, which appears to provide somerelief from unbundling requirements for broadband andnew fiber facilities and equipment used to provide data and high-speed internet access services. However, becausethe new broadband rules contain some ambiguities andhave been appealed to the D.C. Circuit, and are subject topetitions for reconsideration or clarification before the FCC,we continue to face uncertainty regarding the regulatorytreatment of our broadband investments. Nevertheless, dueto the increasing growth opportunities and competition, we have resumed Project Pronto related limited build-outand expect to have DSL available to nearly 80% of our wireline customer locations in early 2004, up from 75% atDecember 31, 2003. Our DSL lines continue to grow andwere approximately 3,515,000 at December 31, 2003,compared to 2,199,000 at the end of 2002.
The FCC has begun reviewing the rules governingbroadband services offered by cable, satellite and wirelessoperators in addition to traditional wireline offerings. TheFCC tentatively concluded that wireline broadband internetaccess services are “information” services rather than“telecommunications” services, which would result in lessregulation. In October 2003, the United States Court ofAppeals for the Ninth Circuit (9th Circuit) ruled thatbroadband internet access services provided by cableoperators involve both an “information” service and a“telecommunications” service. If this decision is upheld (theFCC has a request for rehearing pending before the 9thCircuit), the FCC may change its tentative conclusion thatwireline broadband internet access services are informationservices, not telecommunications services. It is likely that theFCC will not act in these proceedings until the 9th Circuitrules on its request for rehearing. We are not certain of the

P A G E 2 1
effect the 9th Circuit’s decision will have on our operationsor financial statements.
Cable operators have no general obligation to providethird-party Internet Service Providers (ISPs) access to theirbroadband networks at this time, although the FCC hasbegun a proceeding to consider the issue. The 9th Circuit’sdecision (discussed above) could support the imposition oncable operators of some of the same regulations applicableto wireline companies, but it is unclear at this time whetherthe decision will have a significant impact on providers ofcable modem services.
In December 2002, the FCC ruled that advanced services,such as DSL, when provided through one of our separatesubsidiaries, are not subject to tariff regulations and coststudy requirements. However, we are still required to retaincost data and offer our retail advanced services for resale at a discount. This ruling should allow us to respond morequickly to offerings by unregulated competitors. The FCC isexpected to complete its broadband review during 2004.The effect of the review on our results of operations andfinancial position cannot be determined at this time.
Long-Distance We offer landline interLATA (traditional)long-distance services to customers in our 13-state area and to customers in selected areas outside our wirelinesubsidiaries’ operating areas. We began offering interLATAlong-distance to our customers in Nevada in April 2003,Michigan in September 2003 and Illinois, Ohio, Wisconsinand Indiana in October 2003. All long-distance stateentrances were approved by the FCC. We now have approvalto offer interLATA long-distance nationwide.
We expect increased competition for our wirelinesubsidiaries in our Midwest region, in particular, as we beginoffering interLATA long-distance service. However, ultimatelywe expect that providing long-distance service in these fivestates will help to mitigate the access line losses that wehave experienced as a result of the UNE-P rates for thosestates, which are typically lower than our other eight states.We expect that our entry into the long-distance markets inour Midwest region will help to slow trends in access linelosses and may improve trends in customer winback andretention, similar to those experienced in other states in our 13-state area where we previously obtained approval to offer interLATA long-distance.
Wireless At December 31, 2003, Cingular servedapproximately 24.8 million customers and was the second-largest provider of mobile wireless voice and datacommunications services in the U.S., based on the number of wireless customers. Cingular has access to licenses toprovide wireless communications services covering anaggregate population of potential customers, referred to as “POPs”, of approximately 236 million, or approximately81% of the U.S. population, including 45 of the 50 largestU.S. metropolitan areas. Including roaming agreements with other carriers, Cingular provides GSM coverage toapproximately 90% of the U.S. As discussed in “OtherBusiness Matters”, on February 17, 2004, Cingularannounced an agreement to acquire AT&T Wireless. AtDecember 31, 2003, AT&T Wireless served approximately 22 million customers. We expect that this acquisition willenhance Cingular’s ability to compete by strengthening its network coverage and quality.
Even with this acquisition, we expect that intense indus-try competition and market saturation will likely cause thewireless industry’s customer growth rate to moderate incomparison with historical growth rates. While the wirelesstelecommunications industry does continue to grow, a highdegree of competition exists among six national carriers,their affiliates and smaller regional carriers. This competition and other factors, such as the implementation of wirelesslocal number portability, will continue to put pressure upon pricing, margins and customer turnover as the carrierscompete for potential customers. Future carrier revenuegrowth is highly dependent upon the number of netcustomer additions a carrier can achieve and the averagerevenue per customer. The effective management ofcustomer turnover is also important in minimizing customeracquisition costs and maintaining and improving margins.
Cingular faces many challenges and opportunities in thefuture and is focused on the following key initiatives:
• growing customer base profitably by offering wirelessvoice and data products and rate plans that customersdesire;
• increasing the capacity, speed and functionality of thenetwork through the completion of the GSM/ GPRS/EDGE network overlay and improving overall networkcoverage and performance;
• increasing wireless data penetration and usage throughthe development and promotion of advanced wirelessdata applications and interfaces;
• improving the Cingular reputation in the industry byfocusing on all customer-facing aspects of the businessincluding network performance, sales, billing andcustomer service;
• continuing the expansion of Cingular’s existing footprintand network capacity by obtaining access to additionalspectrum, primarily through spectrum exchanges,purchases, mergers, acquisitions and joint ventures; and
• maintaining effective cost controls by continuallyevaluating the cost structure of Cingular’s business andleveraging its large size and national scope.
In September 2003, the U.S. Bankruptcy Court for theSouthern District of New York approved the sale of certaincellular licenses held by NextWave to Cingular for $1,400.Cingular received FCC approval in February 2003, clearingthe way for Cingular to complete the license transfers. Thelicenses cover approximately 83 million potential customersin 34 markets, primarily those markets where Cingularcurrently has voice and data operations. Cingular mayfinance the purchase of these licenses with a combination of cash and debt. Cingular expects this transaction to closeduring the first half of 2004.
In March 2003, Cingular and AT&T Wireless formed ajoint venture to build out an EDGE network along a numberof major highways in order to reduce incollect roamingexpenses paid to other carriers when customers travel onthose highways. In March 2003, Cingular contributed licensesand assets having a value equal to the cash or assetscontributed by AT&T Wireless. At December 31, 2003,Cingular had an investment in the venture totaling $21.Cingular expects to spend less than $10 in 2004 for capitalexpenditures associated with the venture.

P A G E 2 2
M A N A G E M E N T ’ S D I S C U S S I O N A N D A N A L Y S I S O FF I N A N C I A L C O N D I T I O N A N D R E S U L T S O F O P E R A T I O N S ( C O N T I N U E D )Dollars in millions except per share amounts
In June 2003, Cingular completed the transfer of itslicense and operations in Kauai, Hawaii and wireless licensesin Alabama, Idaho, Oklahoma, Mississippi and Washingtonfor AT&T Wireless’ licenses in Alabama, Arkansas, Georgia,Kentucky, Louisiana, Mississippi, Tennessee and Texas.
In February 2004, Cingular acquired an operationalcellular system in Louisiana and other FCC licenses inLouisiana and Texas from Unwired Telecom Corporation for approximately $28. Also in February 2004, Cingularcompleted an exchange transaction with Dobson CellularSystems, Inc. (Dobson). Cingular transferred approximately$22 in cash and wireless property in Michigan to Dobson in exchange for wireless property in Maryland.
By the end of 2003, Cingular had launched GSM/GPRStechnology in areas covering approximately 93% of its POPsthat carry service. Cingular is in the process of upgrading itsnetwork to third generation (3G) wireless data technologyby using EDGE. EDGE technology is Cingular’s choice for a 3G wireless communications standard that will allowcustomers to access the Internet from their wireless devicesat higher speeds than even GPRS. At December 31, 2003,Cingular’s EDGE technology covered approximately 20% of its POPs. Cingular expects the GSM/GPRS/EDGE networkoverlay to be fully complete by the end of 2004.
REGULATORY DEVELOPMENTS
WirelineFederal Regulation A summary of significant 2003 federalregulatory developments follows.
Long-Distance Under the Telecom Act, before beingpermitted to offer interLATA wireline long-distance servicein any state within the 12-state region encompassed by theregulated operating areas of Southwestern Bell TexasHoldings Inc., Pacific Bell Telephone Company, Ameritechand Nevada Bell (these areas with the addition of SouthernNew England Telecommunications Corp.’s area are referredto as our 13-state area), we were required to apply for andobtain state-specific approval from the FCC. At the end of 2002, we offered long-distance service in seven of our13 states. In 2003, we received approval from the FCC tooffer long-distance service in our remaining six states. See above under “Expected Growth Areas” for additionaldetail on the status of our approvals.
Triennial Review Order On August 21, 2003, the FCCreleased its TRO establishing new rules, which becameeffective October 2, 2003, concerning the obligations ofincumbent local exchange carriers, such as our wirelinesubsidiaries, to make UNEs available. These rules areintended to replace the FCC’s previous UNE rules, whichwere vacated by the D.C. Circuit. With limited exceptions,the new rules are consistent with the FCC’s February 2003press release summarizing its review.
The TRO, rather than establishing a uniform nationalstructure for UNEs as we believe was mandated by theTelecom Act and by the D.C. Circuit, delegates key decisionson UNEs to the states, including rules for below-cost UNE-P.In addition, the TRO revised rules regarding combinations of unbundled local service (“loop”) and dedicated transportelements (see discussion of “enhanced extended links”below), which could allow competitors to access our wirelinesubsidiaries’ high-capacity lines without paying access
charges. As discussed below, numerous legal challenges tothe TRO have been filed by SBC and others with the D.C.Circuit, which is expected to rule on these challenges in thefirst half of 2004.
Set forth below is a summary of the most significantaspects of the new rules. While these rules apply only to ourwireline subsidiaries, the words “we” or “our” are used tosimplify the discussion. In addition, the following discussionis intended as a summary of issues in the TRO rather than aprecise legal description of all of those specific issues.
• UNE-P UNE-P is a combination of all of the networkelements necessary to provide complete local service toa customer. The new rules state that if we are notrequired to provide any one of those network elementsthen we will not be required to provide the below-costUNE-P itself. From a practical perspective, the “switch-ing” network element is the most relevant componentof the UNE-P, i.e., the element that routes a telephonecall or data to its destination. In its TRO, the FCCdeclined to rule whether we must provide the switch-ing element to competitors at regulated rates, insteadleaving this issue to each state commission to decide.
Although the state commissions must decide thisswitching issue, the FCC did establish two presumptionsand a timetable for states to use in reaching theirdecision. Specifically, the FCC presumed that unless we provide unbundled local switching, competitors in a particular market (1) would face economic oroperational barrier(s) to providing service to consumersand all but the larger business customers that areserved by high-capacity facilities but (2) would not face such barriers in their ability to serve these largerbusiness customers. The TRO leaves the states broaddiscretion in defining the relevant markets.
The state commissions had 90 days from October 2,2003 to challenge the FCC’s presumption that barriersdo not exist for providing service to larger businesscustomers, but no state commissions in our 13-statearea have done so. For all other customers, the stateshave nine months to complete their analysis. If a statecommission concludes that operational or economicbarriers do not exist in a market, we can stop providing below-cost UNE-P to competitors in thatmarket after a three-year transition period.
• Enhanced Extended Links We must providecombinations of unbundled high capacity loops andtransport elements (often referred to as “enhancedextended links” or EELs) to competitors in certaincircumstances. EELs are used to provide switched anddedicated services. The TRO revises the test fordetermining when EELs must be made available. As a result of this change, long-distance carriers andwireless companies may be able to purchase EELs atbelow-cost rates in place of special access services,which is a component of our wireline revenues. Weexpect that this aspect of the TRO could decrease ourwireline revenues as much as $500 until the FCC’s nexttriennial review. However, to mitigate this potentialimpact, we are developing alternatives including newproduct bundles and new contract arrangements thatcould significantly reduce the $500.

P A G E 2 3
• Dedicated Transport The TRO redefines dedicatedtransport (interoffice lines used by only a singlecustomer) to include only those transmission facilitiesconnecting our switches or central offices, thuseliminating unbundling of connections between ournetwork and competitor networks. The TRO concludesthat we must continue to provide access to dark fiber(unused fiber that must be equipped with electronicsbefore it can transmit a communications signal) andDS3 and DS1 (line classifications) capacity transport asUNEs, except where alternative wholesale facilities areavailable. State commissions are to perform route-specific analyses to determine if such alternativewholesale facilities exist for each of these services. Dark fiber and DS3 transport services are also eachsubject to review by the state commissions to identifywhether competitors are able to provide their ownfacilities. If state analysis determines that there are no barriers, we will not be required to continue toprovide below-cost transport services.
• Broadband The TRO eliminates unbundling of certaintelecommunications technology that is primarily usedfor transmitting data and high-speed internet accessacross telephone lines. For example, it eliminatesunbundling of the packet-switching capabilities (a high-ly efficient method of transmitting data) of our localloops and eliminates unbundling of certain fiber-to-the-home (FTTH) loops. FTTH loops are fiber-optic loopsthat connect directly from our network to customers’premises. Traditional telephone lines are copper; fiber-optic lines are made of glass and can carry moreinformation over far longer distances than copper.Under the new rules, packet-switching and FTTH loopsare not subject to unbundling requirements; therefore,we will not be required to sell them to competitors atbelow-cost UNE prices. However, we must continue toprovide unbundled access to copper-loop and sub-looplines. In areas where fiber-optic lines are installed inplace of copper-loop lines, we will be required toprovide our competitors access either to the existingcopper loop or a non-packetized transmission pathcapable of providing voice-grade service over the fiber-optic lines.
Under a previous FCC order, we were required to share, on an unbundled basis, the high-frequencyportion, which contains DSL, among other things, oflocal telephone lines with competitors. Under the TRO,this high-frequency portion of the telephone line is nolonger considered a UNE. Current line sharing arrange-ments are to be maintained until the FCC’s next biennialreview, which will commence in 2004. Competitors maypurchase new line sharing arrangements until October 2,2004, and will be required to pay increasing amountsfor such new line sharing arrangements over the nextthree years, at the end of which customers must betransitioned to new arrangements. The California StateRegulatory Commission has stated in a decision that ithas independent authority to decide whether the high-frequency portion of the local telephone line is a UNE in disregard of the TRO, and we are challenging thatdecision in federal court.
Although the TRO’s broadband and line sharingprovisions apparently provide some regulatory relief, we are currently in the process of evaluating them; therefore, the effects on our financial position and results of operations cannot be quantified at this time.
• UNE Pricing Rules In September 2003, the FCC opened a proceeding to review how the cost structure under-lying the UNE-pricing rules is determined. These rulesdetermine the amounts we can charge for providingUNEs and have been based on hypothetical “forward-looking costs”. The FCC tentatively concluded thatthese forward-looking costs need to “more closelyaccount for the real world attributes of the routing and topography of the incumbent’s network” ratherthan using hypothetical networks that may be morecost-efficient. The FCC will also review certainassumptions used in determining these costs, includingnetwork utilization factors.
• Notice of Proposed Rulemaking (NPRM) The TRO opened a NPRM to seek comment on whether the FCCshould modify its “pick-and-choose” rule that permitsrequesting competitors to opt into individual portions of interconnection agreements without accepting all the terms and conditions of the agreements.
As the TRO is quite complex and its implementation maybe affected by FCC rulings on petitions for reconsideration,state commission proceedings or court decisions, we cannotfully quantify the effects on our financial position or resultsof operations at this time. However, the new unbundlingrules will most likely create an even more uncertain andmore complex regulatory environment for our wirelinesubsidiaries, possibly resulting in further reductions inrevenues, capital expenditures and employment levels.Because the new rules, in many cases, give each statecommission the authority to determine which networkelements are to be unbundled, the rules will likely vary bystate. The resulting state determinations will also be subjectto implementation and federal appeal on a state-by-statebasis rather than having uniform implementation require-ments or review at the federal level. Although some reliefappears to have been provided by the broadband provisionsof the TRO, we continue to face uncertainty regarding theregulatory treatment of our broadband investments because some of those provisions are ambiguous and theyare under review by the courts and the FCC.
We have filed two legal challenges to these new ruleswith the D.C. Circuit. In August 2003, we, along with theUnited States Telecom Association (USTA), QwestCommunications Inc. (Qwest), and BellSouth Corporation(BellSouth), filed a lawsuit asking the court to vacate thoserules governing the unbundling of both high-capacityfacilities and switching serving non-large businesses. InSeptember 2003, we, along with the USTA, Qwest,BellSouth, and Verizon Communications Inc. (Verizon), filed a lawsuit asking the same court to reject portions of the new rules, including those concerning UNE-P andEELs. Other parties have challenged other aspects of theorder, including the FCC’s decision to limit unbundling ofbroadband facilities. The court consolidated all pending lawsuits into one proceeding and heard oral arguments in January 2004.

P A G E 2 4
M A N A G E M E N T ’ S D I S C U S S I O N A N D A N A L Y S I S O FF I N A N C I A L C O N D I T I O N A N D R E S U L T S O F O P E R A T I O N S ( C O N T I N U E D )Dollars in millions except per share amounts
Voice over Internet Protocol Voice over Internet Protocol(VoIP) is generally used to describe the transmission of voiceand data using internet-based technology. A company usingthis technology can provide services, although not necessarilyof the same quality, often at a lower cost because atraditional network need not be constructed and maintainedand because this technology has not been subject totraditional telephone industry regulation. In 2003, the FCCannounced its intention to open a rulemaking proceedingon VoIP in early 2004. The rulemaking is expected to addresswhether and how a wide range of regulations should beapplied to VoIP, including issues related to federal and statejurisdiction, intercarrier compensation, universal service,public safety, consumer protection and other matters.During 2003, a number of state commissions also beganproceedings to examine the regulatory treatment of VoIP.
Notwithstanding the unresolved regulatory questionsbefore the FCC and the state commissions, numerouscommunications providers began providing various forms of VoIP in 2003, or announced their intentions to do so inthe near future. These providers include both establishedcompanies as well as new entrants. While the deployment of VoIP will result in increased competition for our corewireline voice services, it also presents growth opportunitiesfor us to develop new products for our customers, bothwithin and outside of our 13-state area.
• Access Charges In October 2002, AT&T filed a petitionwith the FCC asking for a declaratory ruling that accesscharges (which are paid to telephone companies providinglocal service, including our wireline subsidiaries) do notapply to long-distance service that AT&T transports for some distance using internet-based technology.Although this service originates and terminates on thetraditional telephone network, such as those operatedby our wireline subsidiaries, and provides no newfeatures or functionality relative to AT&T’s traditionallong-distance service, AT&T claims that this service shouldbe exempt from access charges. We have vigorouslyopposed AT&T’s petition. Should the FCC rule in AT&T’sfavor, we would face a significant decrease in our accesscharge revenues, not only from AT&T but from othercarriers that would likely begin to offer similar services.At this time, however, we are not able to quantify thepotential access charge revenue decline that could resultfrom an adverse FCC ruling. We are not certain as to thetiming of an FCC response on AT&T’s petition.
Special Access Pricing Flexibility In October 2002, AT&Trequested the FCC revoke current pricing rules for specialaccess services, a component of our wireline revenues. Weand other parties have challenged AT&T’s petition, whichremains pending before the FCC. In November 2003, AT&Tand other competitors filed a petition with the D.C. Circuit,asking the court to compel the FCC, within 45 days, to issuea notice of proposed rulemaking vacating these specialaccess pricing rules. In January 2004, the FCC filed itsopposition to AT&T’s petition, and SBC and other carriersfiled a request to intervene in support of the FCC with theD.C. Circuit. The court has not yet ruled on AT&T’s petition.If AT&T’s petition is granted, it likely would have a significantadverse impact on our special access revenues.
Number Portability The FCC has adopted rules allowingcustomers to keep their wireline or wireless number whenswitching to another company (generally referred to as“number portability”). While customers have been able forseveral years to retain their numbers when switching theirlocal service between wireline companies, the rules nowrequire wireless companies to offer number portability to their customers.
In October 2003, the FCC released an order addressingmany of the issues related to the moving of customernumbers between wireless carriers. This order states thatwireless companies cannot delay switching a customer tocollect early termination fees or other amounts owed bythat customer.
In November 2003, the FCC issued an order that enabledcustomers to move wireline telephone numbers to wirelessproviders where coverage areas were overlapping. The FCChas begun a proceeding to resolve issues regarding movingwireless numbers to wireline providers. The FCC is alsoconsidering whether to allow wireline companies to recovertheir costs to implement wireless number portability (weestimate our total costs to be $55). Accordingly, we cannotcurrently determine the financial effects of all of theseissues. In addition, there are legal challenges to thesedecisions pending in federal court.
Coalition for Affordable Local and Long Distance Service(CALLS) In September 2001, the United States Court ofAppeals for the Fifth Circuit (5th Circuit) ruled on appeal of the FCC’s May 2000 CALLS order restructuring federalprice cap regulation. Although the 5th Circuit upheld theorder in most key respects, it reversed and remanded to the FCC two specific aspects of the order.
• The 5th Circuit held that the FCC failed to sufficientlyjustify an incremental $650 in universal service fundingand remanded to the FCC for further explanation ofthe amount; and
• held that the FCC failed to show a rational basis forhow it derived the 6.5% transitional mechanism, i.e.,the productivity factor used to reduce access rates until a targeted average rate is achieved, andremanded to the FCC for an explanation of how the percentage was derived.
In response to the court’s remand, in July 2003 the FCCissued an order upholding its original determinations andproviding further justification for the $650 in universalservice funding and the transitional mechanism.
Ameritech Merger In association with its approval ofthe October 1999 Ameritech merger, the FCC set specificperformance and reporting requirements and enforcementprovisions that mandate approximately $2,000 in potentialpayments through May 2004, if certain goals were not met.Associated with these conditions, we incurred approximately$14, $20 and $94 in 2003, 2002 and 2001 in additionalexpenses, including payments for failing to meet certainperformance measurements. Approximately $8 in potentialpayments could still be triggered through May 2004.
The effects of the FCC decisions on the above topics aredependent on many factors including, but not limited to,the ultimate resolution of the pending appeals; the numberand nature of competitors requesting interconnection,unbundling or resale; and the results of the state regulatory

P A G E 2 5
commissions’ review and handling of related matters withintheir jurisdictions. Accordingly, we are not able to assess the total potential impact of the FCC orders and proposedrulemakings.
State Regulation A summary of significant 2003 stateregulatory developments follows.
California Audit In August 2003, two alternate sets ofproposed findings on the 1997-1999 audit of our Californiawireline subsidiary were presented to the California PublicUtility Commission (CPUC). The two proposed sets offindings differed in many respects but both concluded thatour subsidiary should issue refunds, i.e., service credits, inamounts ranging from $162 to $661. Subsequent revisions to those proposed findings have changed the range to $0 to $466. While the subsequent revisions have decreased therange, we believe that both sets of findings still containerrors and that the refunds should be eliminated. These two alternative findings are presently before the CPUC forconsideration. The CPUC may completely or partially acceptor reject any of these proposed findings. We do not knowwhen the CPUC will make a final decision or what itsdecision will be.
Illinois UNE Legislation In May 2003, the Illinois legis-lature passed legislation concerning wholesale prices ourIllinois wireline subsidiary can charge local service competitors,such as AT&T and MCI, for leasing its local telephone network(UNE rates). The new law directed the Illinois CommerceCommission (ICC) to set wholesale rates based on actual data, including our subsidiary’s actual network capacity andactual depreciation rates shown on our financial statements.In June 2003, the United States District Court for the NorthernDistrict of Illinois Eastern Division issued a temporary orderblocking implementation of this law. The order was madefinal in July 2003. In November 2003, the United States Courtof Appeals for the Seventh Circuit (7th Circuit) affirmed thatthe law was invalid as it only addressed two of the factorsrequired by the federal standards that instruct the states how to set the UNE rates. However, the 7th Circuit also statedthat the current UNE rates in effect must be updated tocomply with federal law as of 2003. The 7th Circuit instructedthe ICC to quickly address these out-of-date rates and toreinstate the UNE rate proceeding that had been previouslyterminated by the law’s passage. The ICC UNE rate proceedingsare currently underway.
Indiana UNE-P In January 2004, the Indiana UtilityRegulatory Commission (IURC) increased some of the whole-sale prices our Indiana wireline subsidiary can charge localservice competitors, such as AT&T and MCI, for leasing itslocal telephone network (UNE rates). Although the IURCincreased UNE-P rates approximately 30%, they remainbelow our cost of providing service. AT&T and MCI haveboth indicated that they plan to appeal this decision.
COMPETITION
Competition continues to increase for telecommunicationsand information services, and regulations, such as the UNE-Prules, have increased the opportunities for alternativecommunications service providers. Technological advanceshave expanded the types and uses of services and productsavailable. In addition, lack of regulation of comparable
alternative technologies (e.g., VoIP) has lowered costs foralternative providers. As a result, we face heightenedcompetition as well as some new opportunities in significantportions of our business.
WirelineOur wireline subsidiaries expect increased competitivepressure in 2004 and beyond from multiple providers invarious markets, including facilities-based local competitors,interexchange carriers and resellers. In some markets, wecompete with large cable companies such as ComcastCorporation, Cox Communications, Inc. and Time Warner Inc.for local and high-speed internet services customers andlong-distance companies such as AT&T and MCI for bothlong-distance and local services customers. Substitution ofwireless and internet-based services for traditional localservice lines also continues to increase. At this time, we areunable to assess the effect of competition on the industry as a whole, or financially on us, but we expect both losses of market share in local service and gains resulting fromnew business initiatives, bundling of products and services,our new long-distance service areas and broadband.
Our wireline subsidiaries remain subject to extensiveregulation by state regulatory commissions for intrastateservices and by the FCC for interstate services. In contrast,our competitors are often subject to less or no regulation in providing comparable voice and data services. Statelegislative and regulatory developments over the last severalyears allow increased competition for local exchangeservices. Under the Telecom Act, companies seeking tointerconnect to our wireline subsidiaries’ networks andexchange local calls must enter into interconnectionagreements with us. These agreements are then subject toapproval by the appropriate state commission. As noted inthe “Operating Environment Overview” section above, themandated rates set by certain state commissions, includingthose in California, Illinois, Michigan, Ohio and Indiana, aresignificantly below our cost and contribute substantially to our continued decline in access line revenues and profit-ability. As of December 31, 2003 and 2002, we had approxi-mately 445,000 and 801,000 access lines (approximately 0.8%and 1.4% of our total access lines) supporting services ofresale competitors throughout our 13-state area, primarily in Texas, California and Illinois. If current UNE-P regulationsremain in place, we would expect our resale access lines tocontinue to decrease as UNE-P lines replace resale lines,mitigated by the opportunities provided us by bundling.
In addition to these wholesale rate and service regulationsnoted above, all of our wireline subsidiaries operate understate-specific elective “price cap regulation” for retail services(also referred to as “alternative regulation”) that was eitherlegislatively enacted or authorized by the appropriate stateregulatory commission. Prior to price cap regulation, ourwireline subsidiaries were under “rate of return regulation”.Under rate of return regulation, the state regulatorycommissions determined an allowable rate of return wecould earn on plant in service and set tariff rates to recoverthe associated revenues required to earn that return. Underprice cap regulation, price caps are set for regulated servicesand are not tied to the cost of providing the services or torate of return requirements. Price cap rates may be subject

P A G E 2 6
M A N A G E M E N T ’ S D I S C U S S I O N A N D A N A L Y S I S O FF I N A N C I A L C O N D I T I O N A N D R E S U L T S O F O P E R A T I O N S ( C O N T I N U E D )Dollars in millions except per share amounts
to or eligible for annual decreases or increases and also maybe eligible for deregulation or greater pricing flexibility ifthe associated service is deemed competitive under somestate regulatory commission rules. Minimum customerservice standards may also be imposed and paymentsrequired if we fail to meet the standards.
One of our responses to the multiple competitivepressures discussed above was our fourth-quarter 2002launch of a single-brand packaging strategy that rewardscustomers who consolidate their services (e.g., local andlong-distance telephone, DSL and wireless) with us. Called“SBC Connections”, the new initiative delivers integratedbundles using a single bill. During 2004, we expect tocontinue focusing on bundling wireline and wireless services, including combined packages of minutes. In addition, we also plan to add to our bundled offerings a video service through an agreement with EchoStarCommunications Corporation (EchoStar) (see “OtherBusiness Matters” below).
CingularCingular faces substantial and increasing competition in allaspects of the wireless communications industry. Undercurrent FCC rules, six or more PCS licensees, two cellularlicensees and one or more enhanced specialized mobileradio licensees may operate in each of Cingular’s markets,which has resulted in the presence of multiple competitors.Cingular’s competitors are principally five national (VerizonWireless, AT&T Wireless, Sprint PCS, Nextel Communicationsand T-Mobile) and a larger number of regional providers ofcellular, PCS and other wireless communications services. See “Other Business Matters” for details on Cingular’spending acquisition of AT&T Wireless.
Cingular may experience significant competition fromcompanies that provide similar services using othercommunications technologies and services. While some ofthese technologies and services are now operational, othersare being developed or may be developed in the future.Cingular competes for customers based principally on price,service offerings, call quality, coverage area and customerservice. See discussion of EDGE technology in “Wireless”under “Expected Growth Areas” above.
DirectoryOur directory subsidiaries face competition from over 100 publishers of printed directories in their operating areas.Direct and indirect competition also exists from otheradvertising media, including newspapers, radio, televisionand direct-mail providers, as well as from directories offeredover the Internet.
ACCOUNTING POLICIES AND STANDARDS
Significant Accounting Policies and Estimates Because ofthe size of the financial statement line items they relate to,some of our accounting policies and estimates have a moresignificant impact on our financial statements than others:
• Our depreciation of assets, including use of compositegroup depreciation and estimates of useful lives, isdescribed in Notes 1 and 5. We assign useful lives basedon periodic studies of actual asset lives. Changes inthose lives with significant impact on the financialstatements must be disclosed, but no such changes have
occurred in the three years ended December 31, 2003.However, if all other factors were to remain unchanged,we expect a one-year increase in the useful lives ofthree of the largest categories of our plant in service(which accounts for approximately 60% of our totalplant in service) would result in a decrease of between$340 and $370 in our 2004 depreciation expense and a one-year decrease would result in an increase ofbetween $420 and $450 in our 2004 depreciationexpense. Effective January 1, 2003, as required by FAS 143, we decreased our depreciation rates toexclude costs of removal in certain circumstances. This change is discussed further under “NewAccounting Standards” below.
• Our bad debt allowance is estimated primarily based onanalysis of history and future expectations of our retailand our wholesale customers in each of our operatingcompanies. For retail customers, our estimates are basedon our actual historical write-offs, net of recoveries, and the aging of accounts receivable balances. Ourassumptions are reviewed at least quarterly andadjustments are made to our bad debt allowance asappropriate. For our wholesale customers, we use astatistical model based on our aging of accountsreceivable balances. Our risk categories, risk percentagesand reserve balance assumptions built into the modelare reviewed monthly and the bad debt allowance isadjusted accordingly. If uncollectibility of our billedrevenue changes by 1%, we would expect a change in uncollectible expense of between $200 and $250.
• Our actuarial estimates of retiree benefit expense and the associated significant weighted-averageassumptions are discussed in Note 10. One of the mostsignificant of these is the return on assets assumption,which was 8.5% for the year ending December 31, 2003.This assumption will remain unchanged for 2004. If all other factors were to remain unchanged, weexpect a 1% decrease in the expected long-term rate of return would cause 2004 combined pension andpostretirement cost to increase approximately $408over 2003 (analogous change would result from a 1%increase). The 10-year returns on our pension plan were9.8% through 2003, including the adverse effects of2000 through 2002. Under GAAP, the expected long-term rate of return is calculated on the market-relatedvalue of assets (MRVA). GAAP requires that actual gainsand losses on pension and postretirement plan assetsbe recognized in the MRVA equally over a period of up to five years. We use a methodology, allowed underGAAP, under which we hold the MRVA to within 20%of the actual fair value of plan assets, which can havethe effect of accelerating the recognition of excessactual gains and losses into the MRVA in less than five years. Due to investment losses on plan assetsexperienced through 2002, this methodologycontributed approximately $605 to our combined netpension and postretirement cost in 2003 as comparedwith the methodology that recognizes gains and lossesover a full five years. This methodology did not have asignificant effect on our 2002 or 2001 combined netpension and postretirement benefit as the MRVA was

P A G E 2 7
almost equal to the fair value of plan assets. We do notexpect this methodology to have a significant impact inour combined net pension and postretirement costs in2004. Note 10 also discusses the effects of certainchanges in assumptions related to medical trend rateson retiree health care costs.
• Our estimates of income taxes and the significant itemsgiving rise to the deferred assets and liabilities areshown in Note 9 and reflect our assessment of actualfuture taxes to be paid on items reflected in the financialstatements, giving consideration to both timing andprobability of these estimates. Actual income taxes couldvary from these estimates due to future changes inincome tax law or results from final IRS review of ourtax returns. We have considered these potential changesand have provided amounts within our deferred taxassets and liabilities that reflect our judgment of theprobable outcome of tax contingencies. We continue to believe that our tax return positions are fullysupportable. Unfavorable settlement of any particularissue could require use of our cash. Favorable resolutioncould be recognized as a reduction to our tax expense.We periodically review the amounts provided and adjustthem in light of changes in facts and circumstances, suchas the progress of a tax audit.
• Our policy on valuation of intangible assets is describedin Note 1. In addition, for cost investments, we evalu-ate whether mark-to-market declines are temporaryand reflected in other comprehensive income, or otherthan temporary and recorded as an expense in theincome statement; this evaluation is based on thelength of time and the severity of decline in the invest-ment’s value. Significant asset and investment valuationadjustments we have made are discussed in Note 2.
• We use the fair value recognition provisions ofStatement of Financial Accounting Standards No. 123,“Accounting for Stock-Based Compensation” (FAS 123)to account for our stock option grants. The estimatedfair value of the options granted is amortized toexpense over the options’ vesting period. The fair valuefor these options was estimated at the date of grant,using a Black-Scholes option pricing model. Two of themore significant assumptions used in this estimate arethe expected option life and the expected volatility,which we estimate based on historical information. Had we not adopted the fair value recognitionprovisions of FAS 123 and chose to continue using theintrinsic value-based method of accounting, we wouldnot have recorded any stock option expense in all years presented. With the recent trend of reducing the number of options granted, we expect this policywill become less significant in the future.
New Accounting StandardsFSP FAS 106-1 In January 2004, in response to the recentlypassed federal Medicare Prescription Drug, Improvement andModernization Act of 2003 (Medicare Act), the FASB issuedpreliminary guidance on accounting for the Medicare Act (FSP FAS 106-1). In accordance with FSP FAS 106-1, a sponsorof a postretirement health care plan that provides aprescription drug benefit, such as us, may make a one-timeelection to defer accounting for the subsidy provided by the
Medicare Act. In order for us to receive the subsidy paymentunder the Medicare Act, the value of our offered prescrip-tion drug plan must be at least equal to the value of thestandard prescription drug coverage provided underMedicare Part D, referred to as actuarially equivalent. Dueto our lower deductibles and better coverage of drug costs,we believe that our plan is of greater value than MedicarePart D. Accordingly, we adopted FSP FAS 106-1 and account-ed for the Medicare Act as a plan amendment and recordedthe adjustment in the amortization of our liability, from thedate of enactment of the Medicare Act, December 2003.Upon adoption, this decreased our accumulated post-retirement benefit obligation by $1,629, which, because itwas enacted during 2003, was calculated using our year end2002 assumed discount rate of 6.75%. Had, at the time ofadoption, we used our year end 2003 assumed discount rate of 6.25%, we would have decreased our accumulatedpostretirement benefit obligation by $1,888. We expectfuture annual decreases in prescription drug expense of$250 to $350. Our accounting assumes that we are actuariallyequivalent to Medicare Part D, that our plan will continue tobe the primary plan for our retirees and that we will receivethe subsidy. We do not expect that the Medicare Act willhave a significant effect on our retirees’ participation in ourpostretirement benefit plan. Specific authoritative guidanceon the accounting for federal subsidy is still pending beforethe FASB and that guidance, when issued, could require us to change our estimates.
FAS 132 In December 2003, the FASB revised Statementof Financial Accounting Standards No. 132, “Employers’Disclosures about Pensions and Other PostretirementBenefits” (FAS 132). FAS 132, as revised, retains thedisclosure requirements provided by the original FAS 132and adds disclosure requirements for information describingthe types of plan assets, investment strategies, measurementdates, plan obligations, cash flows and components of netperiodic benefit costs recognized during interim periods, forstatements with fiscal years ending after December 15, 2003.FAS 132 addresses disclosure only; it does not address otheraccounting issues such as measurement and recognition ofamounts (see Note 10).
FIN 46 In January 2003, the FASB issued FASBInterpretation No. 46 “Consolidation of Variable InterestEntities, an Interpretation of Accounting Research Bulletin(ARB) No. 51” (FIN 46). FIN 46 provides guidance fordetermining whether an entity is a variable interest entity(VIE), and which equity investor of that VIE, if any, shouldinclude the VIE in its consolidated financial statements. InDecember 2003, the FASB staff revised FIN 46 to clarify someof the provisions. For certain VIEs, FIN 46 became effectivefor periods ending after December 15, 2003. In 2003, werecorded an extraordinary loss of $7, net of taxes of $4,related to consolidation of real estate leases under FIN 46. In addition, the revision delayed the effective date for appli-cation of FIN 46 by large public companies, such as us, untilperiods ending after March 15, 2004 for all types of VIEsother than special-purpose entities, including our investmentin Cingular. We are currently evaluating how the provisionsof FIN 46 will affect our accounting for Cingular.
FAS 143 On January 1, 2003, we adopted Statement of Financial Accounting Standards No. 143, “Accounting for

P A G E 2 8
M A N A G E M E N T ’ S D I S C U S S I O N A N D A N A L Y S I S O FF I N A N C I A L C O N D I T I O N A N D R E S U L T S O F O P E R A T I O N S ( C O N T I N U E D )Dollars in millions except per share amounts
Asset Retirement Obligations” (FAS 143). FAS 143 sets forthhow companies must account for the costs of removal oflong-lived assets when those assets are no longer used in acompany’s business, but only if a company is legally requiredto remove such assets. FAS 143 requires that companiesrecord the fair value of the costs of removal in the period in which the obligations are incurred and capitalize thatamount as part of the book value of the long-lived asset. To determine whether we have a legal obligation to removeour long-lived assets, we reviewed state and federal law andregulatory decisions applicable to our subsidiaries, primarilyour wireline subsidiaries, which have long-lived assets. Basedon this review, we concluded that we are not legallyrequired to remove our long-lived assets, except in a fewminor instances.
However, in November 2002 we were informed that theSecurities and Exchange Commission (SEC) staff concludedthat certain provisions of FAS 143 require that we excludecosts of removal from depreciation rates and accumulateddepreciation balances in certain circumstances uponadoption, even where no legal removal obligations exist. In our case, this means that for plant accounts where ourestimated costs of removal exceed the estimated salvagevalue, we are prohibited from accruing removal costs inthose depreciation rates and accumulated depreciationbalances in excess of the salvage value. For our other long-lived assets, where our estimated costs of removal areless than the estimated salvage value, we will continue toaccrue the costs of removal in those depreciation rates and accumulated depreciation balances.
Therefore, in connection with the adoption of FAS 143 onJanuary 1, 2003, we reversed all existing accrued costs ofremoval for those plant accounts where our estimated costsof removal exceeded the estimated salvage value. The non-cash gain resulting from this reversal was $3,684, net ofdeferred taxes of $2,249, recorded as a cumulative effect ofaccounting change on the Consolidated Statement ofIncome as of January 1, 2003. During the fourth quarter of 2003, TDC recorded a loss upon adoption of FAS 143. Our share of that loss was $7, which included no tax effect.This noncash charge of $7 was also recorded as a cumulativeeffect of accounting change on the Consolidated Statementof Income as of January 1, 2003.
Beginning in 2003, for those plant accounts where ourestimated costs of removal previously exceeded the estimatedsalvage value, we expense all costs of removal as we incurthem (previously those costs had been recorded in ourdepreciation rates). As a result, our 2003 depreciation expensedecreased and our operations and support expense increasedas these assets were removed from service. The effect of thischange was to increase consolidated pre-tax income and ourwireline segment income for 2003 by $280 ($172 net of tax, or $0.05 per diluted share). However, over the life of theassets, total operating expenses recognized under this newaccounting method will be approximately the same as underthe previous method (assuming the cost of removal would be the same under both methods).
FAS 145 On January 1, 2003, we adopted Statement of Financial Accounting Standards No. 145, “Rescission ofFASB Statements No. 4, 44, and 64, Amendment of FASBStatement No. 13, and Technical Corrections,” (FAS 145).
The standard, among other changes, rescinded FASBStatement No. 4, “Reporting Gains and Losses fromExtinguishment of Debt, an amendment of APB Opinion No. 30”. As a result, the criteria in APB Opinion No. 30,“Reporting the Results of Operations — Reporting the Effectsof Disposal of a Segment of a Business, and Extraordinary,Unusual and Infrequently Occurring Events and Trans-actions,” now will be used to classify gains and losses fromextinguishment of debt. In accordance with the provisions of FAS 145, we have reclassified our 2001 loss of $18 (net oftaxes of $10) related to the early redemption of $1,000 ofour corporation-obligated mandatorily redeemable preferredsecurities of subsidiary trusts from an extraordinary loss to anordinary loss. The effect of this reclassification was to decreaseour previously reported 2001 income before extraordinaryitem and cumulative effect of accounting change by $18, or$0.01 per share, with no impact on our net income.
OTHER BUSINESS MATTERS
WorldCom Bankruptcy In July 2002, WorldCom and morethan 170 related entities filed petitions for reorganizationunder Chapter 11 of the United States Bankruptcy Code(Bankruptcy Code). Our claims against WorldCom totalapproximately $661. Our claims include receivables, claimsfor refunds that are the subject of litigation, and a variety of contingent and unliquidated items, including unbilledcharges. At December 31, 2003, we had approximately $320 in receivables and reserves of approximately $56 related to the WorldCom bankruptcy filing.
In addition to the reserves, we are withholding paymentson amounts we owed WorldCom as of its bankruptcy filingdate that equal or exceed our remaining net receivable.These withholdings relate primarily to amounts collectedfrom WorldCom’s long-distance customers in our role asbilling agent and other general payables. We estimate ourpost-petition billing to WorldCom to be approximately $160 per month. To date, WorldCom generally has paid itspost-petition obligations to us on a timely basis.
On July 25, 2003, WorldCom agreed to pay usapproximately $107 to settle many, but not all, of theissues that arose prior to WorldCom’s bankruptcy. As ofDecember 31, 2003, WorldCom had paid us $39 andescrowed the remaining $68 of our $107 settlement sum.This settlement was approved by the bankruptcy court onAugust 5, 2003; however, most of the provisions are alsocontingent upon WorldCom implementing its approved Planof Reorganization (POR) and emerging from bankruptcy. It is anticipated that WorldCom will emerge from bankruptcyduring the first half of 2004. This settlement does notinclude issues related primarily to reciprocal compensationwe paid to WorldCom for ISP traffic and certain pre-bankruptcy switched access charges not billed to WorldCombased on usage information provided by WorldCom.
On July 26, 2003, the United States Attorney for theSouthern District of New York announced an investigationwith respect to recently disclosed information alleging that WorldCom is committing access fraud in the manner in which it routes and classifies long-distance calls. Theimpact of this investigation on WorldCom’s proposedreorganization is not yet clear.

P A G E 2 9
Belgacom Agreement Both our investment and TDC’s investment in Belgacom are held through ADSBTelecommunications B.V. (ADSB), of which we directlyowned 35%. ADSB owned one share less than 50% ofBelgacom and is a consortium of SBC, TDC, SingaporeTelecommunications and a group of Belgian financialinvestors. Through our 35% ownership of ADSB and our41.6% ownership of TDC, we had a 24.4% economicownership of Belgacom (subsequently reduced to 23.5%, as discussed below).
In October 2003, ADSB announced that it had enteredinto an agreement with the Belgian government andBelgacom to proceed with the preparations for a potentialinitial public offering (IPO) of Belgacom. As part of theagreement, ADSB will have the exclusive right from January 1, 2004 until July 31, 2005, subject to certainrestrictions, to sell shares in an IPO of Belgacom. In thefourth quarter of 2003, as a condition to the IPO and related transactions, Belgacom transferred to the Belgiangovernment certain pension liabilities related to certainemployees, proceeds from the sale of pension assets andcash sufficient to fully fund the obligations. This transferresulted in a one-time charge to our equity income fromBelgacom, which including our direct and indirect owner-ship, reduced our fourth-quarter 2003 diluted earnings per share by $0.03, determined on a GAAP basis.
In the fourth quarter of 2003, also pursuant to theagreement, Belgacom repurchased approximately 6% of the Belgacom shares held by ADSB. This fourth-quarterrepurchase decreased our economic ownership of Belgacomfrom 24.4% to 23.5%. Since the share price is subject toadjustment as explained below, GAAP prohibits us fromrecording a gain (in 2003) on the 2003 sale of our shares backto Belgacom. Based on our ADSB ownership percentage, ourportion of the proceeds, using the tentative share price,would be approximately $148 and we have estimated thatour portion of the proceeds received would exceed our carry-ing value by approximately $59. As part of the October 2003agreement, Belgacom had previously agreed to make asecond buyback offer in the event of an IPO. Should the IPOoccur, the price per share of both buybacks will be adjustedto the IPO price, which will result in our recognition of a gainor loss associated with the fourth-quarter 2003 sale and thesale associated with the IPO. If no IPO occurs before July 31,2005, there will be no adjustment to the proceeds from thefirst buyback. We cannot predict whether an IPO will occur.
EchoStar Agreement In July 2003, we announced anagreement with EchoStar that will allow us to provide multi-channel satellite television service as part of our bundledservices (local phone service, long-distance, broadband,wireless and video together) throughout our 13-state area.As part of the multi-year agreement, we will help funddevelopment of the co-branded bundled video services. We expect to launch the new “SBC DISH Network” enter-tainment service in early 2004. In a separate transaction, we also made a $500 investment in EchoStar in the form of debt convertible into EchoStar shares.
Antitrust Litigation Eight consumer antitrust classactions were filed in 2003 against us in the United StatesDistrict Court for the District of Connecticut. The primaryclaim in these suits is that our wireline subsidiaries have, in
violation of federal and state law, maintained monopolypower over local telephone service in all 13 states in whichour subsidiaries are incumbent local exchange companies.
These cases have been consolidated under the first filedcase Twombly v. SBC Communications Inc. and were stayedby agreement of the parties pending the United StatesSupreme Court’s (Supreme Court) decision in a similar caseagainst another incumbent local exchange company. In thatcase, the Supreme Court held that violations of the TelecomAct do not support an antitrust claim and that the plaintiffhad not stated an antitrust claim and affirmed dismissal ofthe plaintiff’s antitrust claims. Verizon Communications Inc.v. Law Offices of Curtis V. Trinko LLP, No. 02-682 (Jan. 13, 2004).In light of the Trinko outcome, we expect to move fordismissal or summary disposition of the complaints and tooppose class certification if the plaintiffs do not voluntarilydismiss these cases.
In addition to the Connecticut class actions describedabove, two consumer antitrust class actions were filed in the United States District Court for the Southern District ofNew York against SBC, Verizon, BellSouth and Qwest allegingthat they have violated federal and state antitrust laws byagreeing not to compete with one another and actingtogether to impede competition for local telephone services(Twombly v. Bell Atlantic Corp., et. al). In October 2003, thecourt granted the joint defendants’ motion to dismiss thesesuits on the ground that the plaintiffs’ complaints failed tostate a claim under the antitrust laws. Plaintiffs haveappealed.
We continue to believe that an adverse outcome having a material effect on our financial statements in any of thesecases is unlikely but will continue to evaluate the potentialimpact of these suits on our financial results as they progress.
Subsequent Event – Cingular Acquisition On February 17, 2004, Cingular announced an agreement to acquire AT&T Wireless. Under the terms of the agreement,shareholders of AT&T Wireless will receive cash of $15.00 percommon share or approximately $41,000. The acquisition issubject to approval by AT&T Wireless shareholders andfederal regulators. Based on our 60% equity ownership ofCingular, we expect to provide approximately $25,000 of the purchase price. As a result, equity ownership andmanagement control of Cingular will not be impacted after the acquisition. Due to the deadline for printing thisAnnual Report, additional information related to theacquisition will be included in our 2003 Form 10-K.
LIQUIDITY AND CAPITAL RESOURCES
We had $4,806 in cash and cash equivalents available atDecember 31, 2003. Cash and cash equivalents included cash of approximately $309, municipal securities of $356,variable-rate securities of $1,705, money market funds of$2,399 and other cash equivalents of $37.
In addition, at December 31, 2003 we had other short-term held-to-maturity securities of $378 and long-term held-to-maturity securities of $84.
In October 2003, we renewed our 364-day creditagreement totaling $4,250 with a syndicate of banksreplacing our credit agreement of $4,250 that expired onOctober 21, 2003. The expiration date of the current credit

P A G E 3 0
M A N A G E M E N T ’ S D I S C U S S I O N A N D A N A L Y S I S O FF I N A N C I A L C O N D I T I O N A N D R E S U L T S O F O P E R A T I O N S ( C O N T I N U E D )Dollars in millions except per share amounts
agreement is October 19, 2004. Advances under thisagreement may be used for general corporate purposes,including support of commercial paper borrowings andother short-term borrowings. Under the terms of theagreement, repayment of advances up to $1,000 may beextended two years from the termination date of theagreement. Repayment of advances up to $3,250 may beextended to one year from the termination date of theagreement. There is no material adverse change provisiongoverning the drawdown of advances under this creditagreement. We had no borrowings outstanding undercommitted lines of credit as of December 31, 2003.
Our consolidated commercial paper borrowingsdecreased $149 during 2003, and at December 31, 2003,totaled $999, all of which was due within 90 days and issuedunder a program initiated by a wholly owned subsidiary, SBC International, Inc., in the first quarter of 2002. Thisprogram was initiated in order to simplify intercompanyborrowing arrangements.
During 2003 our primary source of funds was cash fromoperating activities supplemented by cash from ourdisposition of Cegetel.
Cash from Operating ActivitiesDuring 2003 our cash flow from operations remainedrelatively stable compared to 2002 as a large portion of thedecrease in net income in 2003 was caused by the noncashincrease in pension and postretirement expenses. Ourprimary source of funds for 2002 and 2001 was cashgenerated from operating activities, as shown in theConsolidated Statements of Cash Flows.
In December of 2003 we received proceeds of approxi-mately $240, which included interest of $37, related to the redemption of notes by BCE.
Cash from Investing ActivitiesTo provide high-quality communications services to ourcustomers we must make significant investments in property,plant and equipment. The amount of capital investment isinfluenced by demand for services and products, continuedgrowth and regulatory commitments.
Our capital expenditures totaled $5,219 for 2003, $6,808for 2002 and $11,189 for 2001. Capital expenditures in thewireline segment, which represented substantially all of our total capital expenditures, decreased by 23.6% in 2003compared to 2002, due to continued pressure from theuncertain U.S. economy, continued pressure from theregulatory environment and our resulting lower revenueexpectations. The wireline segment capital expendituresdecreased by 38.9% in 2002 compared to 2001.
Substantially all of our capital expenditures are made inthe wireline segment. We expect to fund these expendituresusing cash from operations, depending on interest ratelevels and overall market conditions, and incrementalborrowings. Our international segment operations should be self-funding as it is substantially equity investments andnot direct SBC operations. We expect to fund any directorysegment capital expenditures using cash from operations.We discuss our Cingular segment below.
In response to the uncertain U.S. economy and continuedpressure from regulatory environments and our resulting
lower revenue expectations, we expect total capitalspending to be approximately $5,000 to $5,500, excludingCingular, in 2004. We expect these expenditures to relateprimarily to our wireline subsidiaries’ networks, ourbroadband initiative (DSL) and support systems for our long-distance service.
In 2003, 2002 and 2001, our cash receipts from disposi-tions exceeded cash expended on acquisitions (see Note 2).Investing activities during 2003 also include proceeds ofapproximately $2,270 relating to the sale of our interest in Cegetel, $341 from the sale of a portion of our interest in Yahoo and $364 from the sale of the remaining portionof our investment in BCE. At December 31, 2003 we heldapproximately 7 million shares of Yahoo.
Also in July 2003, we entered into a co-branded serviceagreement with EchoStar to offer satellite television serviceto our wireline customers. In July 2003, we invested $500 indebt, with a fair value of $441, which is convertible intoEchoStar shares at an appreciated price at our option.
2003 investing activities included the purchase of otherheld-to-maturity securities, with maturities greater than90 days, of $710.
Cash from Financing ActivitiesDividends declared by the Board of Directors of SBC totaled$1.41 per share in 2003, $1.08 per share in 2002 and $1.025per share in 2001. The $0.33 increase in dividends declaredduring 2003 was due to two increases in the regular quarterlydividend and three additional dividends above our regularquarterly payout. There was no additional dividend in thefourth quarter of 2003. In March 2003, our Board of Directorsapproved a 4.6% increase in the regular quarterly dividendand in December 2003 our Board of Directors approved a10.6% increase in the regular quarterly dividend to $0.3125per share. Our additional dividends declared during 2003,above our regular quarterly dividend, totaled $0.25 per share.The total dividends declared were $4,674 in 2003, $3,591 in 2002, and $3,448 in 2001. Total cash paid for dividendswere $4,539 in 2003, $3,557 in 2002, and $3,456 in 2001. Our dividend policy considers both the expectations andrequirements of shareowners, internal requirements of SBC and long-term growth opportunities and all dividendsremain subject to approval by our Board of Directors.
In July 2003, we announced our intention to resume our previously announced stock repurchase program. InDecember 2003, our Board of Directors authorized therepurchase of up to 350 million shares of SBC common stock.The new authorization, which expires at the end of 2008,replaced our two previous authorizations approved inNovember 2001 and January 2000 to repurchase up to 200 million shares. During 2003 we had repurchasedapproximately 21 million shares at a cost of $490 and as ofDecember 31, 2003 we repurchased 161 million shares of the 200 million shares authorized by our Board of Directorsin November 2001 and January 2000. At December 31, 2003we have not repurchased any shares of the 350 million sharesauthorized by our Board of Directors in December 2003.
During 2003 we called, prior to maturity, approximately$1,743 of debt obligations with maturities ranging betweenFebruary 2007 and March 2048, and interest rates rangingbetween 6.5% and 7.9%. Of the $1,743 called debt,

P A G E 3 1
approximately $264, with an average yield of 7.2% wascalled in July; $1,462, with an average yield of 7.4% wascalled in June; and $17, with an average yield of 6.9% wascalled in March. Funds from operations and dispositionswere used to pay off these notes.
During 2003, approximately $1,259 of long-term debtobligations, and $1,000 of one-year floating rate securitiesmatured. The long-term obligations carried interest ratesranging from 5.8% to 9.5%, with an average yield of 6.1%.The short-term notes paid quarterly interest based on theLondon Interbank Offer Rate (LIBOR). Funds from operationsand dispositions were used to pay off these notes.
Among the debt paid off during 2003 was all subsidiarydebt listed on public exchanges. Our subsidiaries currentlyhave no debt outstanding which would require them tomake periodic filings under the Exchange Act of 1934.
We have approximately $880 of long-term debt that isscheduled to mature in 2004. We expect to use funds fromoperations to repay these obligations.
OtherOur total capital consists of debt (long-term debt and debtmaturing within one year) and shareowners’ equity. Ourcapital structure does not include debt issued by ourinternational equity investees or Cingular. Total capitalincreased $947 in 2003 and decreased $3,845 in 2002. The 2003 total capital increase was primarily due to our net income and cumulative effect of accounting changes,which was partially offset by lower borrowings, theincreased dividend payouts previously mentioned, and therepurchase of common shares through our stock repurchase programs. These 2003 accounting changesincreased equity $2,541, which decreased our debt ratioapproximately 150 basis points (1.5%). Our debt ratio was 31.9%, 39.9% and 44.3% at December 31, 2003, 2002and 2001. The debt ratio is affected by the same factors that affect total capital.
We are currently considering a possible voluntarycontribution of assets, which may include cash and/or otherinvestments, to our pension and postretirement benefitplans totaling $2,000 or more in 2004 (see Note 10).
CingularCingular’s future capital expenditures are expected to beself-funded by Cingular since this segment is an equityinvestment and not a direct SBC operation. Cingular expects2004 capital investments for completing network upgradesand funding other ongoing expenditures and equity invest-ments will not materially differ from 2003 expenditures of $3,353. In addition, in the first half of 2004, Cingular
expects to complete the purchase of FCC licenses for wireless spectrum from NextWave for $1,400, which theymay finance with a combination of cash and debt.
As discussed in “Other Business Matters”, Cingular hasagreed to acquire AT&T Wireless for approximately $41,000in cash. Cingular expects to fund the acquisition withcontributions from us and BellSouth. Based on our 60%equity ownership, we expect to contribute approximately$25,000. We expect to pay this amount primarily withproceeds from debt, as well as cash on hand, cash to begenerated from operations and asset sales.
CONTRACTUAL OBLIGATIONS,COMMITMENTS AND CONTINGENCIES
Current accounting standards require us to disclose ourmaterial obligations and commitments to make futurepayments under contracts, such as debt and leaseagreements, and under contingent commitments, such asdebt guarantees. We occasionally enter into third-party debt guarantees, but they are not, nor are they reasonablylikely to become, material. We disclose our contractual long-term debt repayment obligations in Note 7 and ouroperating lease payments in Note 5. In the ordinary courseof business we routinely enter into commercial commit-ments for various aspects of our operations, such as plantadditions and office supplies. However, we do not believethat the commitments will have a material effect on ourfinancial condition, results of operations or cash flows.
Below is a table of our contractual obligations as ofDecember 31, 2003. The purchase obligations listed beloware those for which we have guaranteed funds and will befunded with cash provided by operations or throughincremental borrowings. Approximately 42% of our purchaseobligations relate to our directory segment for paper andprinting services and the remainder of our obligations areprimarily in our wireline segment. Due to the immaterialvalue of our capital lease obligations, they have been includedwith long-term debt. Our total capital lease obligations are$65, with approximately $32 to be paid in less than one year.The table does not include the fair value of our interest rateswaps of $90 and our other long-term liabilities because it isnot certain when our other long-term liabilities will becomedue. Our other long-term liabilities are: deferred incometaxes (see Note 9) of $15,079; postemployment benefitobligations (see Note 10) of $12,692; unamortized investmenttax credits of $220; and other noncurrent liabilities of $3,607,consisting primarily of supplemental retirement plans (seeNote 10) and deferred lease revenue from our agreementwith SpectraSite Communications, Inc. (see Note 5).
Contractual Obligations
Payments Due By Period
Less than 1-3 3-5 More thanTotal 1 Year Years Years 5 Years
Long-term debt obligations $17,009 $ 880 $3,735 $2,612 $ 9,782Commercial paper obligations 999 999 — — —Operating lease obligations 1,365 321 492 314 238Purchase obligations 2,296 901 962 232 201
Total Contractual Obligations $21,669 $3,101 $5,189 $3,158 $10,221

P A G E 3 2
M A N A G E M E N T ’ S D I S C U S S I O N A N D A N A L Y S I S O FF I N A N C I A L C O N D I T I O N A N D R E S U L T S O F O P E R A T I O N S ( C O N T I N U E D )Dollars in millions except per share amounts
MARKET RISKWe are exposed to market risks primarily from changes ininterest rates and foreign currency exchange rates. Inmanaging exposure to these fluctuations, we may engage invarious hedging transactions that have been authorizedaccording to documented policies and procedures. We donot use derivatives for trading purposes, to generate incomeor to engage in speculative activity. Our capital costs aredirectly linked to financial and business risks. We seek tomanage the potential negative effects from market volatility
QUANTITATIVE INFORMATION ABOUT MARKET RISK
Interest Rate Sensitivity The principal amounts by expected maturity, average interest rate and fair value of our liabilitiesthat are exposed to interest rate risk are described in Notes 7 and 8. Following are our interest rate derivatives subject tointerest rate risk as of December 31, 2003. The interest rates illustrated in the interest rate swaps section of the table belowrefer to the average expected rates we would receive and the average expected rates we would pay based on the contracts.The notional amount is the principal amount of the debt subject to the interest rate swap contracts. The fair value representsthe amount we would receive if we exited the contracts as of December 31, 2003.
Maturity
After Fair Value2004 2005 2006 2007 2008 2008 Total 12/31/03
Interest Rate Derivatives
Interest Rate Swaps:
Receive Fixed/Pay Variable Notional Amount — — $1,000 — — $2,500 $3,500 $90
Variable Rate Payable1 2.8% 4.2% 5.2% 6.1% 6.5% 7.0%
Weighted Average Fixed Rate Receivable 5.9% 5.9% 5.9% 6.0% 6.0% 5.9%
Lease Obligations
Variable Rate Leases2 $53 — — — — — $ 53 $53
Average Interest Rate2 1.4% — — — — —
1Interest payable based on current and implied forward rates for Three or Six Month LIBOR plus a spread ranging between approximately 64 and 170 basis points.2Average interest rate as of December 31, 2003 based on current and implied forward rates for One Month LIBOR plus 30 basis points. The lease obligations requireinterest payments only until their maturity in March 2004.
QUALITATIVE INFORMATION ABOUT MARKET RISK
Foreign Exchange Risk From time to time, we makeinvestments in businesses in foreign countries, are paiddividends, receive proceeds from sales or borrow funds inforeign currency. Before making an investment, or inanticipation of a foreign currency receipt, we often willenter into forward foreign exchange contracts. The contractsare used to provide currency at a fixed rate. Our policy is to measure the risk of adverse currency fluctuations bycalculating the potential dollar losses resulting from changesin exchange rates that have a reasonable probability ofoccurring. We cover the exposure that results from changesthat exceed acceptable amounts. We do not speculate inforeign exchange markets.
Interest Rate Risk We issue debt in fixed and floatingrate instruments. Interest rate swaps are used for thepurpose of controlling interest expense by managing themix of fixed and floating rate debt. We do not seek to makea profit from changes in interest rates. We manage interestrate sensitivity by measuring potential increases in interestexpense that would result from a probable change ininterest rates. When the potential increase in interestexpense exceeds an acceptable amount, we reduce riskthrough the issuance of fixed rate (in lieu of variable rate)instruments and purchasing derivatives.
and market risk. The majority of our financial instrumentsare medium- and long-term fixed rate notes and debentures.Fluctuations in market interest rates can lead to significantfluctuations in the fair value of these notes and debentures.It is our policy to manage our debt structure and foreignexchange exposure in order to manage capital costs, controlfinancial risks and maintain financial flexibility over the longterm. Where appropriate, we will take actions to limit thenegative effect of interest and foreign exchange rates,liquidity and counterparty risks on shareowner value.
In August 2003 we entered into $1,000 in variable interestrate swap contracts on our 5.875% fixed rate debt whichmatures in August 2012. In the fourth quarter of 2003 weentered into two variable rate swap contracts on our fixedrate debt. We entered into $1,000 in variable rate swapcontracts on our 5.875% fixed rate debt which matures inFebruary 2012 and $500 in variable rate swap contracts onour 6.25% fixed rate debt which matures in March 2011. At December 31, 2003 we had interest rate swaps with anotional value of $3,500 and a fair value of approximately$90. All of our interest rate swaps were designed withexactly matching maturity dates of the underlying debt towhich they are related, allowing for perfectly effectivehedges. At December 31, 2002, we had interest rate swapswith a notional value of $1,000 and a fair value ofapproximately $79.
In January 2004, we entered into $750 in variable interestrate swap contracts on our 6.25% fixed rate debt thatmatures in March 2011.

P A G E 3 3
CAUT IONARY LANGUAGE CONCERNING FORWARD-LOOKING STATEMENTSInformation set forth in this report contains forward-lookingstatements that are subject to risks and uncertainties. Weclaim the protection of the safe harbor for forward-lookingstatements provided by the Private Securities LitigationReform Act of 1995.
The following factors could cause our future results to differ materially from those expressed in the forward-looking statements:
• Adverse economic changes in the markets served bySBC or in countries in which SBC has significantinvestments.
• Changes in available technology and the effects of such changes including product substitutions anddeployment costs.
• Uncertainty in the U.S. securities market and adversemedical cost trends.
• The final outcome of Federal CommunicationsCommission proceedings and re-openings of suchproceedings, including the Triennial Review and otherrulemakings, and judicial review, if any, of suchproceedings, including issues relating to access charges,availability and pricing of unbundled network elementsand platforms (UNE-Ps) and unbundled loop andtransport elements (EELs).
• The final outcome of state regulatory proceedings inSBC’s 13-state area and re-openings of such proceedings,and judicial review, if any, of such proceedings,including proceedings relating to interconnection terms,access charges, universal service, UNE-Ps and resale andwholesale rates, SBC’s broadband initiative known asProject Pronto, performance measurement plans, service standards and reciprocal compensation.
• Enactment of additional state, federal and/or foreignregulatory laws and regulations pertaining to oursubsidiaries and foreign investments.
• Our ability to absorb revenue losses caused by UNE-Prequirements and increasing competition and tomaintain capital expenditures.
• The extent of competition in SBC’s 13-state area andthe resulting pressure on access line totals and wirelineand wireless operating margins.
• Our ability to develop attractive and profitable product/service offerings to offset increasing competition in ourwireline and wireless markets.
• The ability of our competitors to offer product/serviceofferings at lower prices due to adverse regulatorydecisions, including state regulatory proceedingsrelating to UNE-Ps and non-regulation of comparablealternative technologies (e.g., VoIP).
• The outcome of current labor negotiations and itseffect on operations and financial results.
• The issuance by the Financial Accounting StandardsBoard or other accounting oversight bodies of newaccounting standards or changes to existing standards.
• The impact of the wireless joint venture with BellSouth,known as Cingular, including marketing and product-development efforts, customer acquisition andretention costs, access to additional spectrum, tech-nological advancements, industry consolidation andavailability and cost of capital.
• Changes in our corporate strategies, such as changingnetwork requirements or acquisitions and dispositions,to respond to competition and regulatory andtechnology developments.
Readers are cautioned that other factors discussed in this report, although not enumerated here, also couldmaterially impact our future earnings.
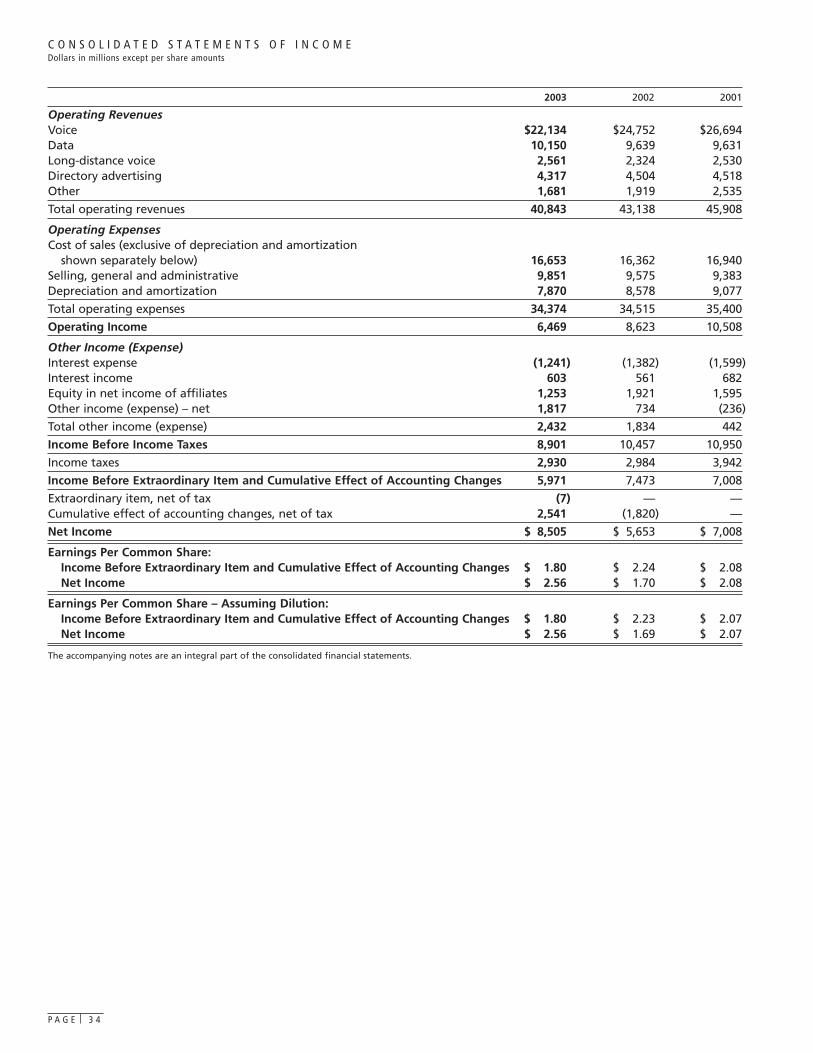
P A G E 3 4
2003 2002 2001
Operating RevenuesVoice $22,134 $24,752 $26,694Data 10,150 9,639 9,631Long-distance voice 2,561 2,324 2,530Directory advertising 4,317 4,504 4,518Other 1,681 1,919 2,535
Total operating revenues 40,843 43,138 45,908
Operating ExpensesCost of sales (exclusive of depreciation and amortization
shown separately below) 16,653 16,362 16,940Selling, general and administrative 9,851 9,575 9,383Depreciation and amortization 7,870 8,578 9,077
Total operating expenses 34,374 34,515 35,400
Operating Income 6,469 8,623 10,508
Other Income (Expense)Interest expense (1,241) (1,382) (1,599)Interest income 603 561 682Equity in net income of affiliates 1,253 1,921 1,595Other income (expense) – net 1,817 734 (236)
Total other income (expense) 2,432 1,834 442
Income Before Income Taxes 8,901 10,457 10,950
Income taxes 2,930 2,984 3,942
Income Before Extraordinary Item and Cumulative Effect of Accounting Changes 5,971 7,473 7,008
Extraordinary item, net of tax (7) — —Cumulative effect of accounting changes, net of tax 2,541 (1,820) —
Net Income $ 8,505 $ 5,653 $ 7,008
Earnings Per Common Share:Income Before Extraordinary Item and Cumulative Effect of Accounting Changes $ 1.80 $ 2.24 $ 2.08Net Income $ 2.56 $ 1.70 $ 2.08
Earnings Per Common Share – Assuming Dilution:Income Before Extraordinary Item and Cumulative Effect of Accounting Changes $ 1.80 $ 2.23 $ 2.07Net Income $ 2.56 $ 1.69 $ 2.07
The accompanying notes are an integral part of the consolidated financial statements.
C O N S O L I D A T E D S T A T E M E N T S O F I N C O M EDollars in millions except per share amounts
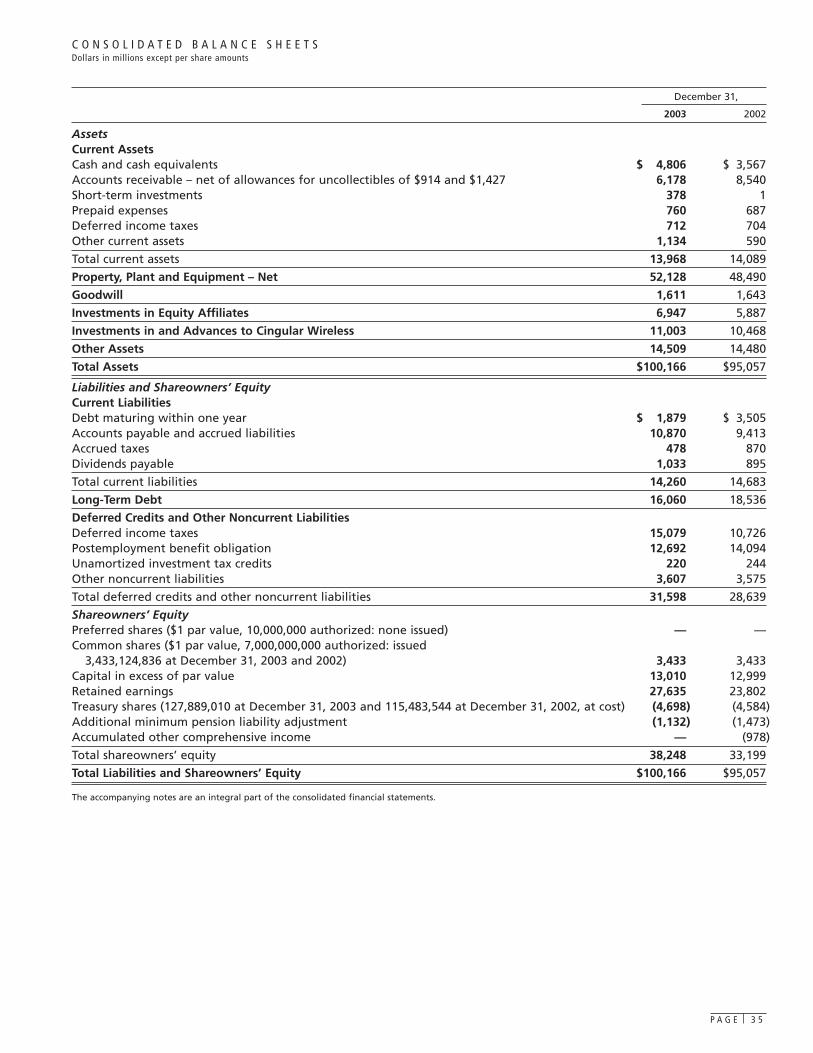
P A G E 3 5
C O N S O L I D A T E D B A L A N C E S H E E T SDollars in millions except per share amounts
December 31,
2003 2002
AssetsCurrent AssetsCash and cash equivalents $ 4,806 $ 3,567Accounts receivable – net of allowances for uncollectibles of $914 and $1,427 6,178 8,540Short-term investments 378 1Prepaid expenses 760 687Deferred income taxes 712 704Other current assets 1,134 590
Total current assets 13,968 14,089
Property, Plant and Equipment – Net 52,128 48,490
Goodwill 1,611 1,643
Investments in Equity Affiliates 6,947 5,887
Investments in and Advances to Cingular Wireless 11,003 10,468
Other Assets 14,509 14,480
Total Assets $100,166 $95,057
Liabilities and Shareowners’ EquityCurrent LiabilitiesDebt maturing within one year $ 1,879 $ 3,505Accounts payable and accrued liabilities 10,870 9,413Accrued taxes 478 870Dividends payable 1,033 895
Total current liabilities 14,260 14,683
Long-Term Debt 16,060 18,536
Deferred Credits and Other Noncurrent LiabilitiesDeferred income taxes 15,079 10,726Postemployment benefit obligation 12,692 14,094Unamortized investment tax credits 220 244Other noncurrent liabilities 3,607 3,575
Total deferred credits and other noncurrent liabilities 31,598 28,639
Shareowners’ EquityPreferred shares ($1 par value, 10,000,000 authorized: none issued) — —Common shares ($1 par value, 7,000,000,000 authorized: issued
3,433,124,836 at December 31, 2003 and 2002) 3,433 3,433Capital in excess of par value 13,010 12,999Retained earnings 27,635 23,802Treasury shares (127,889,010 at December 31, 2003 and 115,483,544 at December 31, 2002, at cost) (4,698) (4,584)Additional minimum pension liability adjustment (1,132) (1,473)Accumulated other comprehensive income — (978)
Total shareowners’ equity 38,248 33,199
Total Liabilities and Shareowners’ Equity $100,166 $95,057
The accompanying notes are an integral part of the consolidated financial statements.
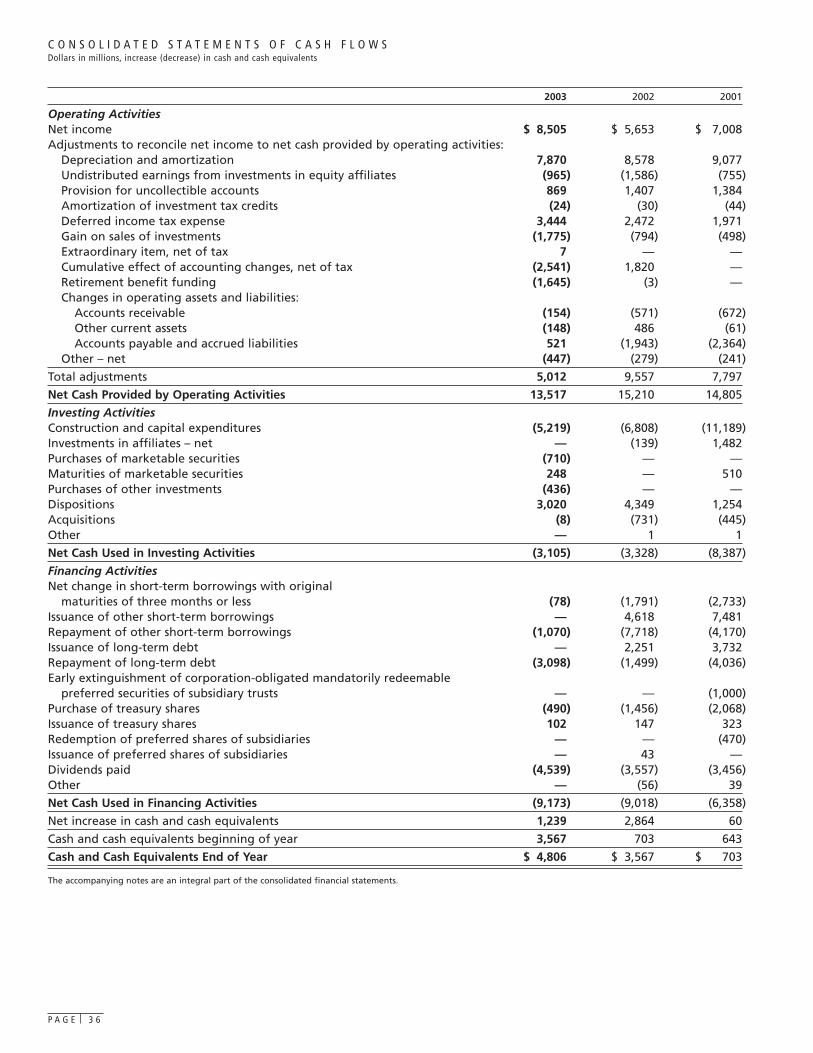
P A G E 3 6
2003 2002 2001
Operating ActivitiesNet income $ 8,505 $ 5,653 $ 7,008Adjustments to reconcile net income to net cash provided by operating activities:
Depreciation and amortization 7,870 8,578 9,077Undistributed earnings from investments in equity affiliates (965) (1,586) (755)Provision for uncollectible accounts 869 1,407 1,384Amortization of investment tax credits (24) (30) (44)Deferred income tax expense 3,444 2,472 1,971Gain on sales of investments (1,775) (794) (498)Extraordinary item, net of tax 7 — —Cumulative effect of accounting changes, net of tax (2,541) 1,820 —Retirement benefit funding (1,645) (3) —Changes in operating assets and liabilities:
Accounts receivable (154) (571) (672)Other current assets (148) 486 (61)Accounts payable and accrued liabilities 521 (1,943) (2,364)
Other – net (447) (279) (241)
Total adjustments 5,012 9,557 7,797
Net Cash Provided by Operating Activities 13,517 15,210 14,805
Investing ActivitiesConstruction and capital expenditures (5,219) (6,808) (11,189)Investments in affiliates – net — (139) 1,482Purchases of marketable securities (710) — —Maturities of marketable securities 248 — 510Purchases of other investments (436) — —Dispositions 3,020 4,349 1,254Acquisitions (8) (731) (445)Other — 1 1
Net Cash Used in Investing Activities (3,105) (3,328) (8,387)
Financing ActivitiesNet change in short-term borrowings with original
maturities of three months or less (78) (1,791) (2,733)Issuance of other short-term borrowings — 4,618 7,481Repayment of other short-term borrowings (1,070) (7,718) (4,170)Issuance of long-term debt — 2,251 3,732Repayment of long-term debt (3,098) (1,499) (4,036)Early extinguishment of corporation-obligated mandatorily redeemable
preferred securities of subsidiary trusts — — (1,000)Purchase of treasury shares (490) (1,456) (2,068)Issuance of treasury shares 102 147 323Redemption of preferred shares of subsidiaries — — (470)Issuance of preferred shares of subsidiaries — 43 —Dividends paid (4,539) (3,557) (3,456)Other — (56) 39
Net Cash Used in Financing Activities (9,173) (9,018) (6,358)
Net increase in cash and cash equivalents 1,239 2,864 60
Cash and cash equivalents beginning of year 3,567 703 643
Cash and Cash Equivalents End of Year $ 4,806 $ 3,567 $ 703
The accompanying notes are an integral part of the consolidated financial statements.
C O N S O L I D A T E D S T A T E M E N T S O F C A S H F L O W SDollars in millions, increase (decrease) in cash and cash equivalents

P A G E 3 7
2003 2002 2001
Shares Amount Shares Amount Shares Amount
Common StockBalance at beginning of year 3,433 $ 3,433 3,433 $ 3,433 3,433 $ 3,433
Balance at end of year 3,433 $ 3,433 3,433 $ 3,433 3,433 $ 3,433
Capital in Excess of Par ValueBalance at beginning of year $12,999 $12,820 $12,611Issuance of shares (181) (165) (281)Stock option expense 183 390 380Other 9 (46) 110
Balance at end of year $13,010 $12,999 $12,820
Retained EarningsBalance at beginning of year $23,802 $21,737 $18,174Net income ($2.56, $1.70 and $2.08 per share) 8,505 5,653 7,008Dividends to shareowners
($1.41, $1.08 and $1.025 per share) (4,674) (3,591) (3,448)Other 2 3 3
Balance at end of year $27,635 $23,802 $21,737
Treasury SharesBalance at beginning of year (115) $ (4,584) (79) $ (3,482) (46) $ (2,071)Purchase of shares (21) (490) (44) (1,456) (47) (2,068)Issuance of shares 8 376 8 354 14 657
Balance at end of year (128) $ (4,698) (115) $ (4,584) (79) $ (3,482)
Additional Minimum Pension Liability AdjustmentBalance at beginning of year $ (1,473) $ — $ —Required charge (net of taxes of $210 and $904) 341 (1,473) —
Balance at end of year $ (1,132) $ (1,473) $ —
Accumulated Other Comprehensive Income, net of taxBalance at beginning of year $ (978) $ (1,589) $ (1,307)Foreign currency translation adjustment,
net of taxes of $302, $309 and $(172) 561 628 (320)Unrealized gains (losses) on available-for-sale
securities, net of taxes of $264, $(19) and $(35) 536 (38) (64)Less reclassification adjustment for net (gains) losses
included in net income (119) 7 5Less reclassification adjustment for loss
included in deferred revenue — 14 97
Other comprehensive income (loss) 978 611 (282)
Balance at end of year $ — $ (978) $ (1,589)
Total Comprehensive IncomeNet income $ 8,505 $ 5,653 $ 7,008Additional minimum pension liability adjustment per above 341 (1,473) —Other comprehensive income (loss) per above 978 611 (282)
Total Comprehensive Income $ 9,824 $ 4,791 $ 6,726
The accompanying notes are an integral part of the consolidated financial statements.
C O N S O L I D A T E D S T A T E M E N T S O F S H A R E O W N E R S ’ E Q U I T YDollars and shares in millions except per share amounts
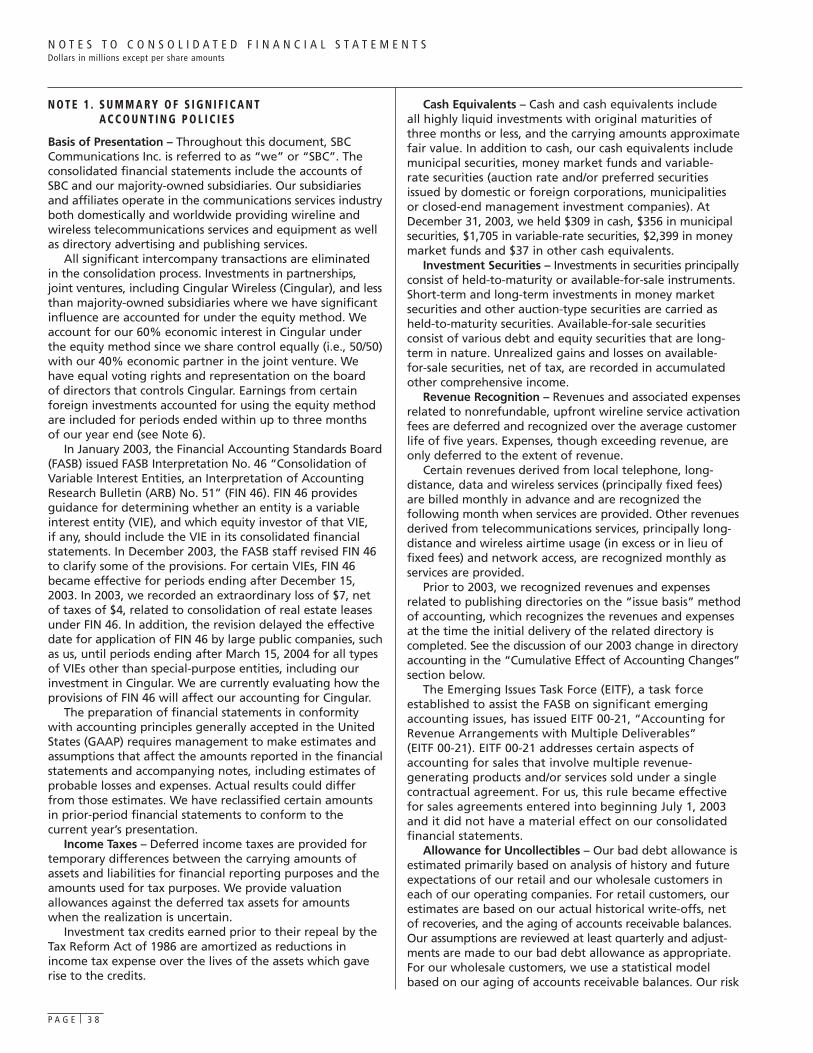
P A G E 3 8
N O T E 1 . S U M M A R Y O F S I G N I F I C A N T A C C O U N T I N G P O L I C I E S
Basis of Presentation – Throughout this document, SBCCommunications Inc. is referred to as “we” or “SBC”. Theconsolidated financial statements include the accounts ofSBC and our majority-owned subsidiaries. Our subsidiariesand affiliates operate in the communications services industryboth domestically and worldwide providing wireline andwireless telecommunications services and equipment as wellas directory advertising and publishing services.
All significant intercompany transactions are eliminatedin the consolidation process. Investments in partnerships,joint ventures, including Cingular Wireless (Cingular), and lessthan majority-owned subsidiaries where we have significantinfluence are accounted for under the equity method. Weaccount for our 60% economic interest in Cingular underthe equity method since we share control equally (i.e., 50/50)with our 40% economic partner in the joint venture. Wehave equal voting rights and representation on the board of directors that controls Cingular. Earnings from certainforeign investments accounted for using the equity methodare included for periods ended within up to three months of our year end (see Note 6).
In January 2003, the Financial Accounting Standards Board(FASB) issued FASB Interpretation No. 46 “Consolidation ofVariable Interest Entities, an Interpretation of AccountingResearch Bulletin (ARB) No. 51” (FIN 46). FIN 46 providesguidance for determining whether an entity is a variableinterest entity (VIE), and which equity investor of that VIE, if any, should include the VIE in its consolidated financialstatements. In December 2003, the FASB staff revised FIN 46to clarify some of the provisions. For certain VIEs, FIN 46became effective for periods ending after December 15,2003. In 2003, we recorded an extraordinary loss of $7, netof taxes of $4, related to consolidation of real estate leasesunder FIN 46. In addition, the revision delayed the effectivedate for application of FIN 46 by large public companies, suchas us, until periods ending after March 15, 2004 for all typesof VIEs other than special-purpose entities, including ourinvestment in Cingular. We are currently evaluating how theprovisions of FIN 46 will affect our accounting for Cingular.
The preparation of financial statements in conformitywith accounting principles generally accepted in the UnitedStates (GAAP) requires management to make estimates andassumptions that affect the amounts reported in the financialstatements and accompanying notes, including estimates ofprobable losses and expenses. Actual results could differfrom those estimates. We have reclassified certain amountsin prior-period financial statements to conform to thecurrent year’s presentation.
Income Taxes – Deferred income taxes are provided fortemporary differences between the carrying amounts ofassets and liabilities for financial reporting purposes and theamounts used for tax purposes. We provide valuationallowances against the deferred tax assets for amountswhen the realization is uncertain.
Investment tax credits earned prior to their repeal by theTax Reform Act of 1986 are amortized as reductions inincome tax expense over the lives of the assets which gaverise to the credits.
Cash Equivalents – Cash and cash equivalents include all highly liquid investments with original maturities ofthree months or less, and the carrying amounts approximatefair value. In addition to cash, our cash equivalents includemunicipal securities, money market funds and variable-rate securities (auction rate and/or preferred securitiesissued by domestic or foreign corporations, municipalities or closed-end management investment companies). AtDecember 31, 2003, we held $309 in cash, $356 in municipalsecurities, $1,705 in variable-rate securities, $2,399 in moneymarket funds and $37 in other cash equivalents.
Investment Securities – Investments in securities principallyconsist of held-to-maturity or available-for-sale instruments.Short-term and long-term investments in money marketsecurities and other auction-type securities are carried asheld-to-maturity securities. Available-for-sale securitiesconsist of various debt and equity securities that are long-term in nature. Unrealized gains and losses on available-for-sale securities, net of tax, are recorded in accumulatedother comprehensive income.
Revenue Recognition – Revenues and associated expensesrelated to nonrefundable, upfront wireline service activationfees are deferred and recognized over the average customerlife of five years. Expenses, though exceeding revenue, areonly deferred to the extent of revenue.
Certain revenues derived from local telephone, long-distance, data and wireless services (principally fixed fees)are billed monthly in advance and are recognized the following month when services are provided. Other revenuesderived from telecommunications services, principally long-distance and wireless airtime usage (in excess or in lieu offixed fees) and network access, are recognized monthly asservices are provided.
Prior to 2003, we recognized revenues and expensesrelated to publishing directories on the “issue basis” methodof accounting, which recognizes the revenues and expensesat the time the initial delivery of the related directory iscompleted. See the discussion of our 2003 change in directoryaccounting in the “Cumulative Effect of Accounting Changes”section below.
The Emerging Issues Task Force (EITF), a task forceestablished to assist the FASB on significant emergingaccounting issues, has issued EITF 00-21, “Accounting forRevenue Arrangements with Multiple Deliverables” (EITF 00-21). EITF 00-21 addresses certain aspects ofaccounting for sales that involve multiple revenue-generating products and/or services sold under a singlecontractual agreement. For us, this rule became effective for sales agreements entered into beginning July 1, 2003 and it did not have a material effect on our consolidatedfinancial statements.
Allowance for Uncollectibles – Our bad debt allowance isestimated primarily based on analysis of history and futureexpectations of our retail and our wholesale customers ineach of our operating companies. For retail customers, ourestimates are based on our actual historical write-offs, net of recoveries, and the aging of accounts receivable balances.Our assumptions are reviewed at least quarterly and adjust-ments are made to our bad debt allowance as appropriate.For our wholesale customers, we use a statistical modelbased on our aging of accounts receivable balances. Our risk
N O T E S T O C O N S O L I D A T E D F I N A N C I A L S T A T E M E N T SDollars in millions except per share amounts

P A G E 3 9
categories, risk percentages and reserve balance assumptionsbuilt into the model are reviewed monthly and the bad debtallowance is adjusted accordingly. Reporting Gains and Losses from Extinguishment of DebtOn January 1, 2003, we adopted Statement of FinancialAccounting Standards No. 145, “Rescission of FASB State-ments No. 4, 44, and 64, Amendment of FASB Statement No. 13, and Technical Corrections,” (FAS 145). The standard,among other changes, rescinded FASB Statement No. 4,“Reporting Gains and Losses from Extinguishment of Debt,an amendment of APB Opinion No. 30”. As a result, thecriteria in APB Opinion No. 30, “Reporting the Results ofOperations - Reporting the Effects of Disposal of a Segmentof a Business, and Extraordinary, Unusual and InfrequentlyOccurring Events and Transactions,” now will be used toclassify gains and losses from extinguishment of debt. Inaccordance with the provisions of FAS 145, we have reclassifiedour 2001 loss of $18 (net of taxes of $10) related to the early redemption of $1,000 of our corporation-obligatedmandatorily redeemable preferred securities of subsidiarytrusts from an extraordinary loss to an ordinary loss. Theeffect of this reclassification was to decrease our previouslyreported 2001 income before extraordinary item and cumulative effect of accounting change by $18, or $0.01 per share, with no impact on our net income.Cumulative Effect of Accounting Changes
Directory accounting Effective January 1, 2003, wechanged our method of recognizing revenues and expensesrelated to publishing directories from the “issue basis”method to the “amortization” method. The issue basismethod recognizes revenues and expenses at the time theinitial delivery of the related directory is completed.Consequently, quarterly income tends to vary with thenumber and size of directory titles published during aquarter. The amortization method recognizes revenues andexpenses ratably over the life of the directory, which is typically 12 months. Consequently, quarterly income tends to be more consistent over the course of a year. We decidedto change methods because the amortization method hasnow become the more prevalent method used among significant directory publishers. This change will allow a moremeaningful comparison between our directory segment andother publishing companies (or publishing segments oflarger companies).
Our directory accounting change resulted in a noncashcharge of $1,136, net of an income tax benefit of $714,recorded as a cumulative effect of accounting change on theConsolidated Statement of Income as of January 1, 2003.The effect of this change was to increase consolidated pre-tax income and our directory segment income for 2003by $80 ($49 net of tax, or $0.01 per diluted share). Weincluded the deferred revenue balance in the “Accountspayable and accrued liabilities” line item on our balance sheet.
Depreciation accounting On January 1, 2003, weadopted Statement of Financial Accounting Standards No. 143, “Accounting for Asset Retirement Obligations” (FAS 143). FAS 143 sets forth how companies must accountfor the costs of removal of long-lived assets when thoseassets are no longer used in a company’s business, but only ifa company is legally required to remove such assets. FAS 143requires that companies record the fair value of the costs of
removal in the period in which the obligations are incurredand capitalize that amount as part of the book value of thelong-lived asset. To determine whether we have a legal obligation to remove our long-lived assets, we reviewed state and federal law and regulatory decisions applicable to our subsidiaries, primarily our wireline subsidiaries, whichhave long-lived assets. Based on this review, we concludedthat we are not legally required to remove any of our long-lived assets, except in a few minor instances.
However, in November 2002, we were informed that theSecurities and Exchange Commission (SEC) staff concludedthat certain provisions of FAS 143 require that we excludecosts of removal from depreciation rates and accumulateddepreciation balances in certain circumstances upon adoption,even where no legal removal obligations exist. In our case,this means that for plant accounts where our estimated costsof removal exceed the estimated salvage value, we are prohibited from accruing removal costs in those depreciationrates and accumulated depreciation balances in excess of the salvage value. For our other long-lived assets, where our estimated costs of removal are less than the estimatedsalvage value, we will continue to accrue the costs ofremoval in those depreciation rates and accumulated depreciation balances.
Therefore, in connection with the adoption of FAS 143 onJanuary 1, 2003, we reversed all existing accrued costs ofremoval for those plant accounts where our estimated costsof removal exceeded the estimated salvage value. Thenoncash gain resulting from this reversal was $3,684, net ofdeferred taxes of $2,249, recorded as a cumulative effect ofaccounting change on the Consolidated Statement ofIncome as of January 1, 2003.
During the fourth quarter of 2003, TDC A/S (TDC), theDanish national communications company in which we hold an investment accounted for on the equity method,recorded a loss upon adoption of FAS 143. Our share of that loss was $7, which included no tax effect. This noncashcharge of $7 was also recorded as a cumulative effect ofaccounting change on the Consolidated Statement ofIncome as of January 1, 2003.
Beginning in 2003, for those plant accounts where ourestimated costs of removal previously exceeded the estimatedsalvage value, we expense all costs of removal as we incurthem (previously those costs had been recorded in ourdepreciation rates). As a result, our 2003 depreciationexpense decreased and our operations and support expenseincreased as these assets were removed from service. Theeffect of this change was to increase consolidated pre-taxincome and our wireline segment income for 2003 by $280($172 net of tax, or $0.05 per diluted share). However, overthe life of the assets, total operating expenses recognizedunder this new accounting method will be approximatelythe same as under the previous method (assuming the costof removal would be the same under both methods).
Goodwill and other intangible assets accountingOn January 1, 2002, we adopted Statement of FinancialAccounting Standards No. 142, “Goodwill and OtherIntangible Assets” (FAS 142). Adoption of FAS 142 meansthat we stopped amortizing goodwill, and at least annuallywe will test the remaining book value of goodwill forimpairment. Any impairments subsequent to adoption will be

P A G E 4 0
recorded in operating expenses. We also stopped amortizinggoodwill recorded on our equity investments. This embeddedgoodwill will continue to be tested for impairment under the accounting rules for equity investments, which are basedon comparisons between fair value and carrying value. Ourtotal cumulative effect of accounting change from adoptingFAS 142 was a noncash charge of $1,820, net of an incometax benefit of $5, recorded as of January 1, 2002.
Adjusted results The amounts in the following tablehave been adjusted assuming that we had retroactivelyapplied the new directory and depreciation accountingmethods, and goodwill and equity method amortization dis-cussed above. (FAS 142 did not allow retroactive applicationof the new impairment accounting method, and did notallow these adjusted results to exclude the cumulative effectof accounting change from adopting FAS 142.)
Year Ended December 31, 2003 2002 2001
Income before extraordinary item and cumulative effect of accounting changes – as reported $ 5,971 $ 7,473 $ 7,008
Directory change, net of tax — (107) (145)Depreciation change, net of tax — 172 172Goodwill amortization, net of tax — — 201Equity method amortization,
net of tax — — 258
Income before extraordinary item and cumulative effect of accounting changes – as adjusted $ 5,971 $ 7,538 $ 7,494
Basic earnings per share:Income before extraordinary item and cumulative effect of accounting changes – as reported $ 1.80 $ 2.24 $ 2.08
Directory change, net of tax — (0.03) (0.04)Depreciation change, net of tax — 0.05 0.05Goodwill amortization, net of tax — — 0.06Equity method amortization, net of tax — — 0.08
Income before extraordinary item and cumulative effect of accounting changes – as adjusted $ 1.80 $ 2.26 $ 2.23
Diluted earnings per share:Income before extraordinary item and cumulative effect of accounting changes – as reported $ 1.80 $ 2.23 $ 2.07
Directory change, net of tax — (0.03) (0.04)Depreciation change, net of tax — 0.05 0.05Goodwill amortization, net of tax — — 0.05Equity method amortization, net of tax — — 0.08
Income before extraordinary item and cumulative effect of accounting changes – as adjusted $ 1.80 $ 2.25 $ 2.21
Year Ended December 31, 2003 2002 2001
Net income – as reported $ 8,505 $ 5,653 $ 7,008Remove extraordinary item and cumulative effect of accounting changes (2,534) — —
Directory change, net of tax — (107) (145)Depreciation change, net of tax — 172 172Goodwill amortization, net of tax — — 201Equity method amortization,
net of tax — — 258
Net income – as adjusted $ 5,971 $ 5,718 $ 7,494
Basic earnings per share:Net income – as reported $ 2.56 $ 1.70 $ 2.08Remove extraordinary item and cumulative effect of accounting changes (0.76) — —
Directory change, net of tax — (0.03) (0.04)Depreciation change, net of tax — 0.05 0.05Goodwill amortization, net of tax — — 0.06Equity method amortization, net of tax — — 0.08
Net income – as adjusted $ 1.80 $ 1.72 $ 2.23
Diluted earnings per share:Net income – as reported $ 2.56 $ 1.69 $ 2.07Remove extraordinary item and cumulative effect of accounting changes (0.76) — —
Directory change, net of tax — (0.03) (0.04)Depreciation change, net of tax — 0.05 0.05Goodwill amortization, net of tax — — 0.05Equity method amortization, net of tax — — 0.08
Net income – as adjusted $ 1.80 $ 1.71 $ 2.21
N O T E S T O C O N S O L I D A T E D F I N A N C I A L S T A T E M E N T S ( C O N T I N U E D )Dollars in millions except per share amounts

P A G E 4 1
Property, Plant and Equipment – Property, plant and equip-ment is stated at cost. The cost of additions and substantialimprovements to property, plant and equipment is capitalized.The cost of maintenance and repairs of property, plant andequipment is charged to operating expenses. Property, plantand equipment are depreciated using straight-line methodsover their estimated economic lives. Certain subsidiariesfollow composite group depreciation methodology; accord-ingly, when a portion of their depreciable property, plant andequipment is retired in the ordinary course of business, thegross book value is reclassified to accumulated depreciation;no gain or loss is recognized on the disposition of this plant.
Software Costs – It is our policy to capitalize certain costsincurred in connection with developing or obtaining internaluse software. Capitalized software costs are included inProperty, Plant and Equipment and are being amortizedover three years. Software costs that do not meet capitali-zation criteria are expensed immediately.
Goodwill – Goodwill represents the excess of considerationpaid over net assets acquired in business combinations.Beginning in 2002, goodwill is not amortized, but is testedannually for impairment (see above discussion under“Cumulative Effect of Accounting Changes”). We havecompleted our annual impairment testing for 2003 anddetermined that no impairment exists. During 2003, thecarrying amount of our goodwill decreased $32 primarilydue to the third quarter 2003 sale of a division of oursubsidiary Sterling Commerce Inc. (Sterling).
Advertising Costs – Advertising costs for advertising prod-ucts and services or promoting our corporate image areexpensed as incurred.
Foreign Currency Translation – Our foreign investmentsgenerally report their earnings in their local currencies. Wetranslate our share of their foreign assets and liabilities atexchange rates in effect at the balance sheet dates. Wetranslate our share of their revenues and expenses usingaverage rates during the year. The resulting foreign currencytranslation adjustments are recorded as a separate componentof accumulated other comprehensive income in the accom-panying Consolidated Balance Sheets. Gains and lossesresulting from exchange rate changes on transactionsdenominated in a currency other than the local currency areincluded in earnings as incurred.
Derivative Financial Instruments – We record derivativeson the balance sheet at fair value. We do not invest in deriv-atives for trading purposes. We use derivatives from time totime as part of our strategy to manage risks associated withour contractual commitments. For example, we use interestrate swaps to limit exposure to changes in interest rates onour debt obligations and foreign currency forward-exchangecontracts to limit exposure to changes in foreign currencyrates for transactions related to our foreign investments (seeNote 8). We include gains or losses from interest rate swapswhen paid or received in interest expense on our ConsolidatedStatements of Income. We include gains or losses fromforeign currency forward exchange contracts as part of thetransaction to which the forward exchange contract relates.
Stock-Based Compensation – As discussed more fully inNote 12, under various plans, senior and other managementand nonmanagement employees and nonemployee directorshave received stock options, performance stock units, and
other nonvested stock units. We account for these plansusing the preferable fair value recognition provisions ofStatement of Financial Accounting Standards No. 123,“Accounting for Stock-Based Compensation” (FAS 123).Under this method, the estimated fair value of the optionsgranted is amortized to expense over the options’ vesting period.
Pension and Postretirement Benefits – See Note 10 for acomprehensive discussion of our pension and postretirementbenefit expense, including a discussion of the actuarialassumptions.
N O T E 2 . A C Q U I S I T I O N S , D I S P O S I T I O N S ,A N D VA L U AT I O N A N D O T H E R A D J U S T M E N T S
Restructuring of Investments – In the fourth quarter of2002, we internally restructured our ownership in severalinvestments, including Sterling. As part of this restructuring,a newly created subsidiary borrowed $244 from an independent party at an annual interest rate of 4.79%,repayable in five years (see Note 7). Additionally, a total of $43 of preferred securities in subsidiaries was sold toindependent parties. The preferred interests receive preferred dividends at a 5.79% annual rate, paid quarterly(see Note 8). As we remain the primary beneficiary after therestructuring, the preferred securities are classified as “Othernoncurrent liabilities” on our Consolidated Balance Sheets,and no gain or loss was recorded on the transaction. As aresult, we recognized in net income $280 of tax benefits on certain financial expenses and losses that were not previously eligible for deferred tax recognition (see Note 9).
Acquisitions – In November 2001, we acquired the sharesof Prodigy Communications Corporation (Prodigy) that wedid not already own through a cash tender offer followedby a merger of a subsidiary into Prodigy. We paid approxi-mately $470 and assumed debt of $105. This transactionresulted in approximately $589 in goodwill. The majority ofthe shares we bought in the cash tender offer were frompersons or entities affiliated with Teléfonos de México, S.A.de C.V. (Telmex), of which we own approximately 8.0%.
Dispositions – In the fourth quarter of 2002, we agreedto sell our 15% interest in Cegetel S.A. (Cegetel) toVodafone Group PLC (Vodafone). The pending sale removedour significant influence and required us to change ouraccounting for Cegetel to the cost method from the equitymethod. With this change, the value of our investment isreflected in the “Other Assets” line on our December 31,2002, Consolidated Balance Sheet. The sale was completedin January 2003, and we received cash proceeds of $2,270and recorded a pre-tax gain of approximately $1,574.
In the second quarter of 2002, we entered into twoagreements with Bell Canada Holdings Inc. (Bell Canada): (1) to redeem a portion of our ownership in Bell Canada and(2) to give BCE, Inc. (BCE) the right to purchase our remaininginterest in Bell Canada. In June 2002, we entered into anagreement to redeem a portion of our ownership in BellCanada, representing approximately 4% of the company, foran $873 short-term note, resulting in a pre-tax gain ofapproximately $148. Under the terms of the agreement, onJuly 15, 2002 when we received the proceeds from the short-term note, we purchased approximately 9 million shares ofBCE, the majority shareholder of Bell Canada, for approxi-

P A G E 4 2
mately 250 Canadian dollars (CAD) ($164 at July 15, 2002exchange rates). In the second quarter of 2003, we soldthese BCE shares for $173 in cash and recorded a pre-taxgain of approximately $9. In the fourth quarter of 2002, BCEexercised its right to purchase our remaining 16% interest inBell Canada at a price of 4,990 CAD. We received proceedsof $3,158, consisting of approximately 8.9 million shares ofBCE stock and the remainder of $2,997 in cash and recognizeda pre-tax gain of approximately $455. In the third quarter of2003, we sold the BCE stock for $191 in cash and recorded apre-tax gain of approximately $31.
In November 2001, we sold the assets of Ameritech’scable television operation for approximately $205, resultingin a pre-tax loss of $61. In the first quarter of 2001, inanticipation of the disposal of these cable operations and in accordance with FAS 121, we evaluated these operationsfor impairment. We estimated that the future undiscountedcash flows of these operations were insufficient to recovertheir related carrying values. The impairment was measuredby comparing the book value to fair value of the assets asindicated by prevailing market prices. The resulting adjust-ment of approximately $316 ($205 net of tax) to reduce thebook value of these assets, primarily writing down property,plant and equipment, was recorded in the first quarter of2001 as a charge to operating expenses.
In January 2001, we sold SecurityLink, our electronic security services operations, for approximately $479. As aresult of the pending sale, as well as a general decline in themarket value of companies in the security industry, we hadrecognized impairments to the carrying value of SecurityLinkof approximately $614 ($454 net of tax) in the fourthquarter of 2000.
Valuation Adjustments – In January 2002, we purchasedfrom América Móvil S.A. de C.V. (América Móvil) its approxi-mately 50% interest in Cellular Communications of PuertoRico (CCPR) for cash and a note redeemable for our invest-ment in Telecom Américas Ltd. (Telecom Américas). Weretained the right to settle the note by delivering TelecomAméricas shares. This represented a forward sale of ourinterest in Telecom Américas. In connection with this transaction, we reviewed the values at which we would carryCCPR and our interest in Telecom Américas and recognized acharge of $390 ($262 net of tax) for the reduction of ourdirect and indirect book values to the value indicated by thetransaction. We based this valuation on a contemporaneoustransaction involving CCPR and an independent third party.The charges were recorded in both other income (expense) –net ($341) and equity in net income of affiliates ($49).América Móvil exercised its option to acquire our shares ofTelecom Américas in July 2002.
As discussed in more detail in Note 5, in the third quarterof 2001, we recognized an other-than-temporary decline of$162 ($97 net of tax) in the value of SpectraSite Communi-cations Inc. (SpectraSite) shares we received as payment offuture rents on land and wireless towers and related equip-ment. As we were required to hold the shares, we determinedthat we needed to adjust the value of the total considerationreceived from SpectraSite for entering into the tower leasesto reflect actual realizable value. Accordingly, we reduced theamount of deferred revenue that was recorded when theseshares were originally received. This adjustment will have the
effect of reducing revenue recognized on the leases in thefuture. In June 2002, with SpectraSite stock trading atapproximately $0.18 per share, we recorded another other-than-temporary decline of $40 ($24 net of tax).
We had cost investments in WilTel Communications(WilTel) (formerly Williams Communications Group Inc.) andalternative providers of DSL services accounted for underStatement of Financial Accounting Standards No. 115,“Accounting for Certain Investments in Debt and EquitySecurities” (FAS 115). We periodically review the investmentsto determine whether an investment’s decline in value isother than temporary. If so, the cost basis of the investment iswritten down to fair value, which becomes the new cost basis.
In the second quarter of 2001, we concluded that thecontinued depressed market values for certain of our investments in other telecommunications companies, as well as difficulties experienced by many similar companies,indicated the decline in value of our investments was otherthan temporary. As a result of these reviews, we recognizeda combined charge of $401 ($261 net of tax) in the secondquarter of 2001 in other income (expense) – net, primarilyrelated to our investment in WilTel.
2002 Workforce Reduction and Related Charges – During2002, our continuing review of staffing needs led to deci-sions to further reduce our number of management andnonmanagement employees. In 2002, we recorded chargesof approximately $356 ($224 net of tax) for severance andreal estate costs related to workforce-reduction programs.As discussed in Note 10, these workforce-reduction programsalso required us to record $486 in special termination benefitsand net pension settlement gains of $29.
2001 Comprehensive Review of Operations – During thefourth quarter of 2001, we performed a comprehensivereview of operations that resulted in decisions to reduce ourworkforce, terminate certain real estate leases and shut downcertain operations. The charges related to those decisions,which we recorded as expense in 2001 are as follows:
• Workforce reduction charges Our review of staffingneeds led to decisions to reduce our number of management and nonmanagement employees. Werecorded a charge of approximately $377 ($244 net oftax), related to severance costs under our existing plansand an enhanced retirement benefit for certain nonmanagement employees.
• Lease termination charges As part of a review of realestate needs for our adjusted workforce, all company-leased facilities were evaluated for probability offuture usefulness. For each lease having no substantivefuture use or benefit to us, an accrual was made whichrepresented either the buyout provisions of the lease, a negotiated lease termination or future required payments under the lease, net of anticipated subleaserentals. We recorded a charge of approximately $138($90 net of tax) in relation to these leases.
• Asset impairments and other charges A review ofcertain nonstrategic operations indicated the need, insome cases, for either impairment or shutdown. Werecorded asset impairment and shutdown costs and othercharges of approximately $104 ($91 net of tax) for opera-tions including exiting operations at InQuent TechnologiesInc., the parent company of Webhosting.com.
N O T E S T O C O N S O L I D A T E D F I N A N C I A L S T A T E M E N T S ( C O N T I N U E D )Dollars in millions except per share amounts

N O T E 3 . E A R N I N G S P E R S H A R E
A reconciliation of the numerators and denominators ofbasic earnings per share and diluted earnings per share forincome before extraordinary item and cumulative effect ofaccounting changes for the years ended December 31, 2003,2002 and 2001 are shown in the table below:
Year Ended December 31, 2003 2002 2001
NumeratorsNumerator for basic earnings per share:Income before extraordinary item and cumulative effect of accounting changes $5,971 $7,473 $7,008
Dilutive potential common shares:Other stock-based compensation 9 7 6
Numerator for diluted earnings per share $5,980 $7,480 $7,014
DenominatorsDenominator for basic earnings per share:Weighted average number of common shares outstanding (000,000) 3,318 3,330 3,366
Dilutive potential common shares (000,000):Stock options 1 8 21Other stock-based compensation 10 10 9
Denominator for diluted earnings per share 3,329 3,348 3,396
Basic earnings per shareIncome before extraordinary item and cumulative effect of accounting changes $ 1.80 $ 2.24 $ 2.08
Extraordinary item — — —Cumulative effect of accounting changes 0.76 (0.54) —
Net income $ 2.56 $ 1.70 $ 2.08
Diluted earnings per shareIncome before extraordinary item and cumulative effect of accounting changes $ 1.80 $ 2.23 $ 2.07
Extraordinary item — — —Cumulative effect of accounting changes 0.76 (0.54) —
Net income $ 2.56 $ 1.69 $ 2.07
At December 31, 2003, 2002 and 2001, we had issuedoptions to purchase approximately 231 million, 229 millionand 207 million SBC shares. Approximately 212 million, 180 million and 62 million shares respectively were not usedto determine the dilutive potential common shares as the exercise price of these options was greater than the averagemarket price of SBC common stock during the specified periods.
P A G E 4 3
N O T E 4 . S E G M E N T I N F O R M AT I O N
Our segments are strategic business units that offer differentproducts and services and are managed accordingly. UnderGAAP segment reporting rules, we analyze our various operating segments based on segment income. Interestexpense, interest income, other income (expense) – net andincome tax expense are managed only on a total companybasis and are, accordingly, reflected only in consolidatedresults. Therefore, these items are not included in the calculation of each segment’s percentage of our consolidatedresults. We have five reportable segments that reflect thecurrent management of our business: (1) wireline; (2)Cingular; (3) directory; (4) international; and (5) other.
The wireline segment provides landline telecommunicationsservices, including local and long-distance voice, switchedaccess, data and messaging services.
The Cingular segment reflects 100% of the resultsreported by Cingular, our wireless joint venture. Beginningwith 2003, the Cingular segment replaces our previouslytitled “wireless” segment, which included 60% of Cingular’srevenues and expenses. Although we analyze Cingular’s revenues and expenses under the Cingular segment, weeliminate the Cingular segment in our consolidated financialstatements. In our consolidated financial statements, wereport our 60% proportionate share of Cingular’s results asequity in net income (loss) of affiliates. For segment reporting,we report this equity in net income (loss) of affiliates in ourother segment.
The directory segment includes all directory operations,including Yellow and White Pages advertising and electronicpublishing. In the first quarter of 2003 we changed ourmethod of accounting for revenues and expenses in ourdirectory segment. Results for 2003, and going forward, willbe shown under the amortization method. This means thatrevenues and direct expenses are recognized ratably overthe life of the directory, typically 12 months. This accountingchange will affect only the timing of the recognition of revenues and direct expenses. It will not affect the totalamounts recognized.
Our international segment includes all investments withprimarily international operations. The other segmentincludes all corporate and other operations as well as theCingular equity income (loss), as discussed above.
In the following tables, we show how our segment results are reconciled to our consolidated results reported inaccordance with GAAP. The Wireline, Cingular, Directory,International and Other columns represent the segmentresults of each such operating segment. The Consolidationand Elimination column adds in those line items that wemanage on a consolidated basis only: interest expense, interest income and other income (expense) - net. Thiscolumn also eliminates any intercompany transactionsincluded in each segment’s results. Since our 60% share ofthe results from Cingular is already included in the Othercolumn, the Cingular Elimination column removes the resultsof Cingular shown in the Cingular segment. In the balancesheet section of the tables below, our investment in Cingularis included in the “Investment in equity method investees”line item in the Other column ($5,118 in 2003, $4,583 in2002 and $3,556 in 2001).

P A G E 4 4
Segment results, including a reconciliation to SBC consolidated results, for 2003, 2002 and 2001 are as follows:
At December 31, 2003 Consolidation Cingular Consolidatedor for the year ended Wireline Cingular Directory International Other and Elimination Elimination Results
Revenues from external customers $36,372 $15,483 $4,182 $ 30 $ 259 $ — $(15,483) $ 40,843
Intersegment revenues 32 — 72 — 4 (108) — —Total segment
operating revenues 36,404 15,483 4,254 30 263 (108) (15,483) 40,843Operations and
support expenses 24,599 11,105 1,932 47 34 (108) (11,105) 26,504Depreciation and
amortization expenses 7,763 2,089 21 — 86 — (2,089) 7,870Total segment
operating expenses 32,362 13,194 1,953 47 120 (108) (13,194) 34,374Segment operating
income 4,042 2,289 2,301 (17) 143 — (2,289) 6,469Interest expense — 856 — — — 1,241 (856) 1,241Interest income — 14 — — — 603 (14) 603Equity in net income
of affiliates — (323) — 606 647 — 323 1,253Other income
(expense) – net — (74) — — — 1,817 74 1,817Segment income before
income taxes 4,042 1,050 2,301 589 790 1,179 (1,050) 8,901
Segment assets 68,434 25,526 1,515 8,550 61,067 (39,400) (25,526) 100,166Investment in equity
method investees — 2,288 22 6,747 5,296 — (2,288) 12,065Expenditures for additions
to long-lived assets 5,147 2,734 1 — 71 — (2,734) 5,219
At December 31, 2002 Consolidation Cingular Consolidatedor for the year ended Wireline Cingular Directory International Other and Elimination Elimination Results
Revenues from external customers $38,362 $14,903 $4,371 $ 35 $ 370 $ — $(14,903) $43,138
Intersegment revenues 30 — 80 — 19 (129) — —Total segment
operating revenues 38,392 14,903 4,451 35 389 (129) (14,903) 43,138Operations and
support expenses 23,981 10,532 1,931 85 69 (129) (10,532) 25,937Depreciation and
amortization expenses 8,442 1,850 30 — 106 — (1,850) 8,578Total segment
operating expenses 32,423 12,382 1,961 85 175 (129) (12,382) 34,515Segment operating income 5,969 2,521 2,490 (50) 214 — (2,521) 8,623Interest expense — 911 — — — 1,382 (911) 1,382Interest income — 29 — — — 561 (29) 561Equity in net income
of affiliates — (265) — 1,152 769 — 265 1,921Other income
(expense) – net — (123) — — — 734 123 734Segment income before
income taxes 5,969 1,251 2,490 1,102 983 (87) (1,251) 10,457
Segment assets 66,117 24,122 2,839 8,352 57,431 (39,682) (24,122) 95,057Investment in equity
method investees 124 2,316 28 5,668 4,650 — (2,316) 10,470Expenditures for additions
to long-lived assets 6,736 3,085 11 — 61 — (3,085) 6,808
N O T E S T O C O N S O L I D A T E D F I N A N C I A L S T A T E M E N T S ( C O N T I N U E D )Dollars in millions except per share amounts

P A G E 4 5
At December 31, 2001 Consolidation Cingular Consolidatedor for the year ended Wireline Cingular Directory International Other and Elimination Elimination Results
Revenues from external customers $40,660 $14,268 $4,382 $ 152 $ 714 $ — $(14,268) $45,908
Intersegment revenues 30 — 86 33 54 (203) — —Total segment
operating revenues 40,690 14,268 4,468 185 768 (203) (14,268) 45,908Operations and
support expenses 24,009 9,799 1,902 238 377 (203) (9,799) 26,323Depreciation and
amortization expenses 8,461 1,921 36 3 577 — (1,921) 9,077Total segment
operating expenses 32,470 11,720 1,938 241 954 (203) (11,720) 35,400Segment operating income 8,220 2,548 2,530 (56) (186) — (2,548) 10,508Interest expense — 822 — — — 1,599 (822) 1,599Interest income — 63 — — — 682 (63) 682Equity in net income
of affiliates — (68) — 555 1,040 — 68 1,595Other income
(expense) – net — (21) — — — (236) 21 (236)Segment income before
income taxes 8,220 1,700 2,530 499 854 (1,153) (1,700) 10,950
Segment assets 71,037 22,530 2,777 9,456 57,970 (44,918) (22,530) 96,322Investment in equity
method investees 120 2,023 21 8,196 3,630 — (2,023) 11,967Expenditures for additions
to long-lived assets 11,032 3,156 24 — 133 — (3,156) 11,189
N O T E 5 . P R O P E R T Y, P L A N T A N D E Q U I P M E N T
Property, plant and equipment is summarized as follows atDecember 31:
Lives (years) 2003 2002
Land — $ 639 $ 627Buildings 35-45 11,519 11,168Central office equipment 3-10 55,120 54,774Cable, wiring and conduit 10-50 52,076 50,665Other equipment 5-15 9,590 9,997Software 3 3,599 3,016Under construction — 1,380 1,508
133,923 131,755
Accumulated depreciation and amortization 81,795 83,265
Property, plant and equipment – net $ 52,128 $ 48,490
Our depreciation expense was $7,667 in 2003, $8,379 in 2002and $8,596 in 2001.
Certain facilities and equipment used in operations areleased under operating or capital leases. Rental expensesunder operating leases were $420 for 2003, $586 for 2002and $799 for 2001. At December 31, 2003, the futureminimum rental payments under noncancelable operatingleases for the years 2004 through 2008 were $321, $279,$213, $169 and $145 with $238 due thereafter. Capital leasesare not significant.
Geographic InformationOur investments outside of the United States are primarilyaccounted for under the equity method of accounting.Accordingly, we do not include in our operating revenuesand expenses the revenues and expenses of these individualinvestees. Therefore, less than 1% of our total operatingrevenues for all years presented are from outside the UnitedStates.
Long-lived assets consist primarily of net property, plantand equipment; goodwill; and the book value of our equityinvestments, which are shown in the table below:
December 31, 2003 2002
United States $59,056 $54,934Denmark 3,246 2,689Belgium 1,236 1,122Mexico 1,079 945South Africa 919 623Other foreign countries 268 290
Total $65,804 $60,603

P A G E 4 6
SpectraSite AgreementIn August 2000, we reached an agreement with SpectraSiteunder which we granted SpectraSite the exclusive rights tolease space on a number of our communications towers.These operating leases were scheduled to close over aperiod ending in 2002. SpectraSite would sublease space onthe towers to Cingular and also agreed to build or buy newtowers for Cingular over the next five years. Cingular’s sub-lease payments to SpectraSite reduce Cingular’s net incomeand partially offset the rental income we receive fromSpectraSite.
Under the terms of the original agreement, we received a combination of cash and stock as complete prepayment of rent with the closing of each leasing agreement. The prepayments were initially recorded as deferred revenue,and will be recognized in income as revenue over the life of the leases. In November 2001, we received $35 fromSpectraSite in consideration for amending the agreement, to reduce the maximum number of towers subject to itsterms, and to extend the schedule for tower closings untilfirst quarter of 2004.
In the third quarter of 2001, we recognized an other-than-temporary decline of $162 ($97 net of tax) in the value ofSpectraSite shares we had received as part of the prepayment.This amount reflected the decline in the stock market priceof SpectraSite shares below our carrying value. As we wererequired to hold the shares, we determined that we neededto adjust the value of the total consideration received fromentering into the leases to reflect actual realizable value.Accordingly, we reduced the amount of deferred revenuethat was recorded when these shares were originally received.A similar reduction of $40 ($24 net of tax) was made insecond quarter of 2002 with SpectraSite shares trading atapproximately $0.18 per share. These adjustments will havethe effect of reducing revenue recognized on the leases inthe future.
In late 2002, SpectraSite and certain of its senior debt holdersagreed to restructure its debt. To effect the restructuring,SpectraSite filed a “pre-arranged” plan of reorganizationunder Chapter 11 of the United States Bankruptcy Code. We agreed with SpectraSite, subject to completion of itsChapter 11 reorganization, to decrease the number oftowers to be leased to SpectraSite and to extend theschedule for tower closing until the third quarter of 2004. In addition, we exchanged all of our shares in SpectraSite for warrants to purchase shares representing less than 1% of the restructured company with no significant financialimpact on us. SpectraSite emerged from bankruptcy in 2003.
N O T E 6 . E Q U I T Y M E T H O D I N V E S T M E N T S
We account for our nationwide wireless joint venture,Cingular, and our investments in equity affiliates under theequity method of accounting.
Cingular – The following table is a reconciliation of ourinvestments in and advances to Cingular as presented on ourConsolidated Balance Sheets:
2003 2002
Beginning of year $10,468 $ 9,441Contributions — 299Equity in net income 613 759Other adjustments (78) (31)
End of year $11,003 $10,468
Undistributed earnings from Cingular were $2,481 and$1,868 at December 31, 2003 and 2002.
We account for our 60% economic interest in Cingularunder the equity method of accounting in our consolidatedfinancial statements since we share control equally (i.e.,50/50) with our 40% economic partner in the joint venture.We have equal voting rights and representation on theboard of directors that controls Cingular. Cingular servesapproximately 24 million wireless customers, is the second-largest wireless operator in the U.S. in terms of customersand has approximately 236 million potential customers in 45 states, the District of Columbia, Puerto Rico and the U.S. Virgin Islands.
The following table presents summarized financial information for Cingular at December 31, or for the periodthen ended:
2003 2002 2001
Income StatementsOperating revenues $15,483 $14,903 $14,268Operating income 2,289 2,521 2,548Net income 1,022 1,207 1,692
Balance SheetsCurrent assets $ 3,300 $ 2,731Noncurrent assets 22,226 21,391Current liabilities 3,187 2,787Noncurrent liabilities 13,855 13,794
At December 31, 2003 and 2002, we had notes receivablefrom Cingular of $5,885. In July 2003, we renegotiated the terms of these advances to reduce the interest rate from 7.5% to 6.0% and extended the maturity date of the advances from March 31, 2005, to June 30, 2008. The interest income from Cingular was approximately $397 in 2003, $441 in 2002 and $555 in 2001. This interestincome does not have a material impact on our net incomeas it is mostly offset when we record our share of equityincome in Cingular.
N O T E S T O C O N S O L I D A T E D F I N A N C I A L S T A T E M E N T S ( C O N T I N U E D )Dollars in millions except per share amounts

P A G E 4 7
Other Equity Method Investments – Our investments inequity affiliates include primarily international investments.The following table is a reconciliation of our investments inequity affiliates as presented on our Consolidated BalanceSheets:
2003 2002
Beginning of year $ 5,887 $ 8,411Additional investments — 268Equity in net income 640 1,162Dividends received (288) (335)Currency translation adjustments 867 962Dispositions (89) (867)Other adjustments (70) (3,714)
End of year $ 6,947 $ 5,887
The currency translation adjustment for 2003 primarilyreflects the effect of exchange rate fluctuations on ourinvestments in TDC, Belgacom S.A. (Belgacom) and TelkomS.A. Limited (Telkom). Dispositions for 2003 reflect thedecrease in our ownership percentage of Belgacom.
The currency translation adjustment for 2002 primarilyreflects the effect of exchange rate fluctuations on ourinvestments in TDC, Belgacom and Telkom. Dispositions for2002 reflect the sale of shares of Bell Canada of $719 (seeNote 2), Telmex L shares of $98, América Móvil L shares of$40 and Amdocs shares of $10. Other adjustments for 2002include adjustments of $2,887 and $696 resulting from ourchange from the equity method to the cost method ofaccounting for investments in Bell Canada and Cegetel,respectively (see Note 2). Other adjustments for 2002 alsoincluded a dividend from TDC that was treated as a returnof capital due to TDC’s insufficient undistributed earnings.
Undistributed earnings from equity affiliates were $2,496and $2,195 at December 31, 2003 and 2002.
As of December 31, 2003, our investments in equityaffiliates included an 8.0% interest in Telmex, Mexico’snational telecommunications company; a 7.6% interest inAmérica Móvil, primarily a wireless provider in Mexico, with telecommunications investments in the U.S. and Latin America; a 41.6% interest in TDC, the nationalcommunications provider in Denmark; a 16.9% interest in Belgacom, the national communications provider inBelgium; and an 18% interest in Telkom, a telecommuni-cations company of South Africa. TDC also holds a 15.9%interest in Belgacom, bringing our effective interest to 23.5%.
Both our investment and TDC’s investment in Belgacomare held through ADSB Telecommunications B.V. (ADSB), ofwhich we directly owned 35%. ADSB owned one share lessthan 50% of Belgacom and is a consortium of SBC, TDC,Singapore Telecommunications and a group of Belgianfinancial investors. Through our 35% ownership of ADSBand our 41.6% ownership of TDC, we had a 24.4% economicownership of Belgacom.
In October 2003, ADSB announced that it had enteredinto an agreement with the Belgian government andBelgacom to proceed with the preparations for a potentialinitial public offering (IPO) of Belgacom. As part of theagreement, ADSB will have the exclusive right from January1, 2004 until July 31, 2005, subject to certain restrictions, tosell shares in an IPO of Belgacom. In the fourth quarter of2003, as a condition to the IPO and related transactions,Belgacom transferred to the Belgian government certainpension liabilities related to certain employees, proceedsfrom the sale of pension assets and cash sufficient to fullyfund the obligations. This transfer resulted in a one-timecharge to our equity income from Belgacom which, includingour direct and indirect ownership, reduced our fourth-quarter 2003 diluted earnings per share by $0.03, determinedon a GAAP basis.
In the fourth quarter of 2003, also pursuant to the agreement, Belgacom repurchased approximately 6% of theBelgacom shares held by ADSB. This fourth-quarter repurchasedecreased our economic ownership of Belgacom from 24.4%to 23.5%. Since the share price remains subject to adjustmentas explained below, GAAP prohibits us from recording a gain(in 2003) on the 2003 sale of our shares back to Belgacom.Based on our ADSB ownership percentage, our portion ofthe proceeds, using the tentative share price, would beapproximately $148 and we have estimated that our portionof the proceeds received would exceed our carrying value byapproximately $59. As part of the October 2003 agreement,Belgacom agreed to make a second buyback offer in theevent of an IPO. Should the IPO occur, the price per share ofboth buybacks will be adjusted to the IPO price, which willresult in our recognition of a gain or loss associated with thefourth-quarter 2003 sale and the sale associated with theIPO. If no IPO occurs before July 31, 2005, there will be noadjustment to the proceeds from the first buyback.
In 2002, we entered into two agreements with BellCanada: (1) to redeem a portion of our ownership in BellCanada, representing approximately 4% of the companyand (2) to give BCE the right to purchase our remaininginterest in Bell Canada. BCE exercised its right to purchaseour remaining interest in Bell Canada during the fourthquarter of 2002. See Note 2 for a more detailed discussionon this divestiture.
In 2002, we agreed to sell to Vodafone our 15% equityinterest in Cegetel, a joint venture that owns 80% of thesecond-largest wireless provider in France. The pending saleremoved our significant influence and required us to changeour accounting for Cegetel to the cost method from theequity method. With this change, the value of our investmentis reflected in the “Other Assets” line on our December 31,2002 Consolidated Balance Sheet. This transaction closed inthe first quarter of 2003. (See Note 2)
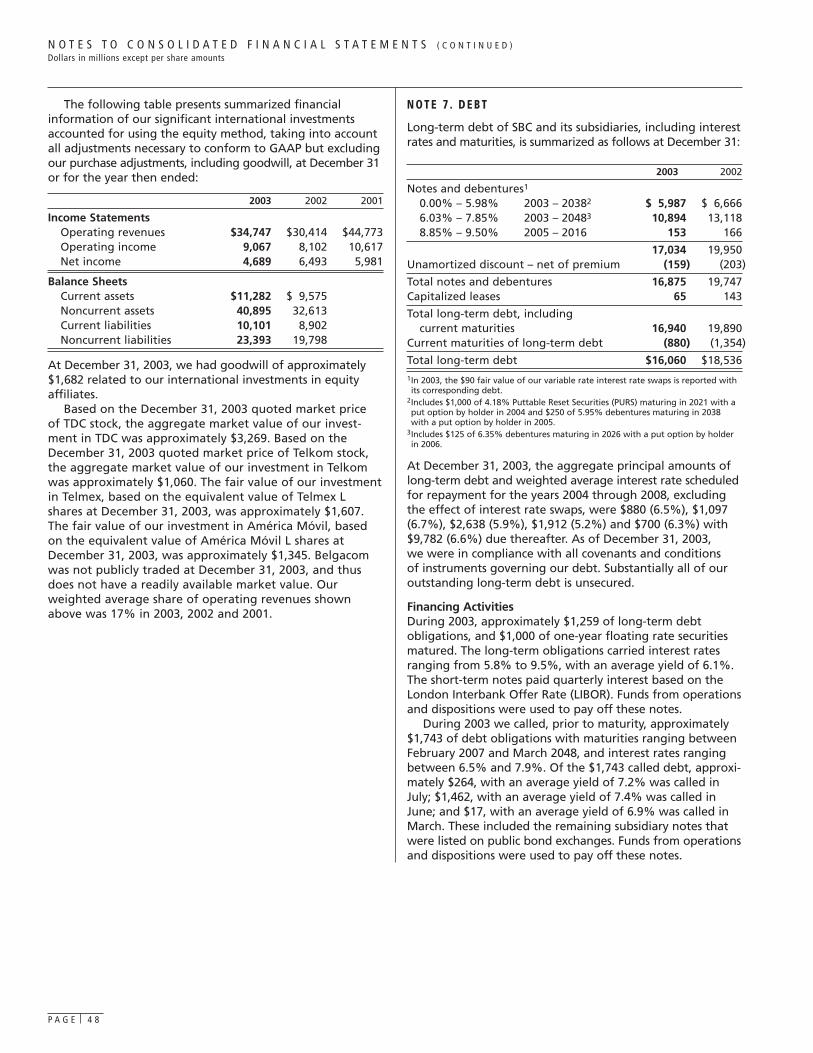
P A G E 4 8
The following table presents summarized financial information of our significant international investmentsaccounted for using the equity method, taking into accountall adjustments necessary to conform to GAAP but excludingour purchase adjustments, including goodwill, at December 31or for the year then ended:
2003 2002 2001
Income StatementsOperating revenues $34,747 $30,414 $44,773Operating income 9,067 8,102 10,617Net income 4,689 6,493 5,981
Balance SheetsCurrent assets $11,282 $ 9,575Noncurrent assets 40,895 32,613Current liabilities 10,101 8,902Noncurrent liabilities 23,393 19,798
At December 31, 2003, we had goodwill of approximately$1,682 related to our international investments in equityaffiliates.
Based on the December 31, 2003 quoted market price of TDC stock, the aggregate market value of our invest-ment in TDC was approximately $3,269. Based on theDecember 31, 2003 quoted market price of Telkom stock,the aggregate market value of our investment in Telkomwas approximately $1,060. The fair value of our investmentin Telmex, based on the equivalent value of Telmex Lshares at December 31, 2003, was approximately $1,607.The fair value of our investment in América Móvil, basedon the equivalent value of América Móvil L shares atDecember 31, 2003, was approximately $1,345. Belgacomwas not publicly traded at December 31, 2003, and thusdoes not have a readily available market value. Ourweighted average share of operating revenues shownabove was 17% in 2003, 2002 and 2001.
N O T E 7 . D E B T
Long-term debt of SBC and its subsidiaries, including interestrates and maturities, is summarized as follows at December 31:
2003 2002
Notes and debentures1
0.00% – 5.98% 2003 – 20382 $ 5,987 $ 6,6666.03% – 7.85% 2003 – 20483 10,894 13,1188.85% – 9.50% 2005 – 2016 153 166
17,034 19,950Unamortized discount – net of premium (159) (203)
Total notes and debentures 16,875 19,747Capitalized leases 65 143
Total long-term debt, including current maturities 16,940 19,890
Current maturities of long-term debt (880) (1,354)
Total long-term debt $16,060 $18,5361In 2003, the $90 fair value of our variable rate interest rate swaps is reported withits corresponding debt.
2Includes $1,000 of 4.18% Puttable Reset Securities (PURS) maturing in 2021 with aput option by holder in 2004 and $250 of 5.95% debentures maturing in 2038 with a put option by holder in 2005.
3Includes $125 of 6.35% debentures maturing in 2026 with a put option by holderin 2006.
At December 31, 2003, the aggregate principal amounts oflong-term debt and weighted average interest rate scheduledfor repayment for the years 2004 through 2008, excludingthe effect of interest rate swaps, were $880 (6.5%), $1,097(6.7%), $2,638 (5.9%), $1,912 (5.2%) and $700 (6.3%) with$9,782 (6.6%) due thereafter. As of December 31, 2003, we were in compliance with all covenants and conditions of instruments governing our debt. Substantially all of our outstanding long-term debt is unsecured.
Financing Activities During 2003, approximately $1,259 of long-term debt obligations, and $1,000 of one-year floating rate securitiesmatured. The long-term obligations carried interest ratesranging from 5.8% to 9.5%, with an average yield of 6.1%.The short-term notes paid quarterly interest based on theLondon Interbank Offer Rate (LIBOR). Funds from operationsand dispositions were used to pay off these notes.
During 2003 we called, prior to maturity, approximately$1,743 of debt obligations with maturities ranging betweenFebruary 2007 and March 2048, and interest rates rangingbetween 6.5% and 7.9%. Of the $1,743 called debt, approxi-mately $264, with an average yield of 7.2% was called inJuly; $1,462, with an average yield of 7.4% was called inJune; and $17, with an average yield of 6.9% was called inMarch. These included the remaining subsidiary notes thatwere listed on public bond exchanges. Funds from operationsand dispositions were used to pay off these notes.
N O T E S T O C O N S O L I D A T E D F I N A N C I A L S T A T E M E N T S ( C O N T I N U E D )Dollars in millions except per share amounts
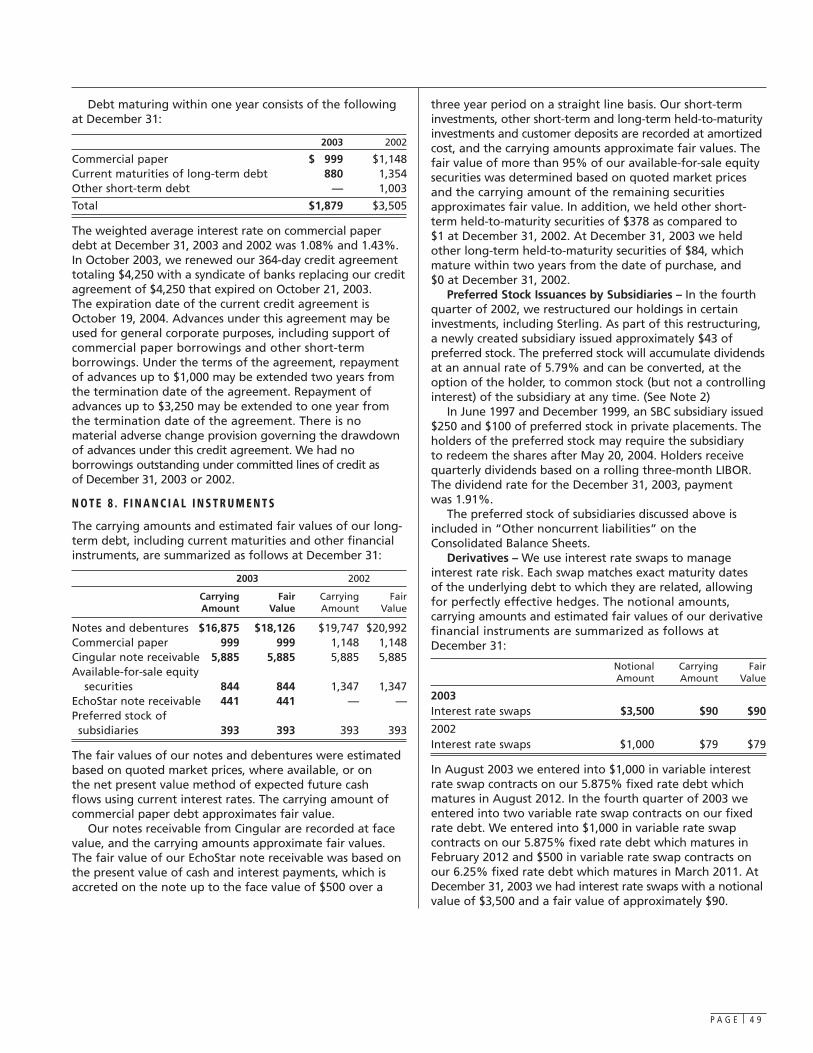
P A G E 4 9
Debt maturing within one year consists of the followingat December 31:
2003 2002
Commercial paper $ 999 $1,148Current maturities of long-term debt 880 1,354Other short-term debt — 1,003
Total $1,879 $3,505
The weighted average interest rate on commercial paperdebt at December 31, 2003 and 2002 was 1.08% and 1.43%.In October 2003, we renewed our 364-day credit agreementtotaling $4,250 with a syndicate of banks replacing our creditagreement of $4,250 that expired on October 21, 2003.The expiration date of the current credit agreement isOctober 19, 2004. Advances under this agreement may beused for general corporate purposes, including support ofcommercial paper borrowings and other short-term borrowings. Under the terms of the agreement, repaymentof advances up to $1,000 may be extended two years fromthe termination date of the agreement. Repayment ofadvances up to $3,250 may be extended to one year fromthe termination date of the agreement. There is no material adverse change provision governing the drawdownof advances under this credit agreement. We had noborrowings outstanding under committed lines of credit as of December 31, 2003 or 2002.
N O T E 8 . F I N A N C I A L I N S T R U M E N T S
The carrying amounts and estimated fair values of our long-term debt, including current maturities and other financialinstruments, are summarized as follows at December 31:
2003 2002
Carrying Fair Carrying FairAmount Value Amount Value
Notes and debentures $16,875 $18,126 $19,747 $20,992Commercial paper 999 999 1,148 1,148Cingular note receivable 5,885 5,885 5,885 5,885Available-for-sale equity
securities 844 844 1,347 1,347EchoStar note receivable 441 441 — —Preferred stock of
subsidiaries 393 393 393 393
The fair values of our notes and debentures were estimatedbased on quoted market prices, where available, or on the net present value method of expected future cash flows using current interest rates. The carrying amount ofcommercial paper debt approximates fair value.
Our notes receivable from Cingular are recorded at facevalue, and the carrying amounts approximate fair values.The fair value of our EchoStar note receivable was based onthe present value of cash and interest payments, which isaccreted on the note up to the face value of $500 over a
three year period on a straight line basis. Our short-terminvestments, other short-term and long-term held-to-maturityinvestments and customer deposits are recorded at amortizedcost, and the carrying amounts approximate fair values. Thefair value of more than 95% of our available-for-sale equitysecurities was determined based on quoted market pricesand the carrying amount of the remaining securitiesapproximates fair value. In addition, we held other short-term held-to-maturity securities of $378 as compared to $1 at December 31, 2002. At December 31, 2003 we heldother long-term held-to-maturity securities of $84, whichmature within two years from the date of purchase, and $0 at December 31, 2002.
Preferred Stock Issuances by Subsidiaries – In the fourthquarter of 2002, we restructured our holdings in certaininvestments, including Sterling. As part of this restructuring,a newly created subsidiary issued approximately $43 of preferred stock. The preferred stock will accumulate dividendsat an annual rate of 5.79% and can be converted, at theoption of the holder, to common stock (but not a controllinginterest) of the subsidiary at any time. (See Note 2)
In June 1997 and December 1999, an SBC subsidiary issued$250 and $100 of preferred stock in private placements. Theholders of the preferred stock may require the subsidiary to redeem the shares after May 20, 2004. Holders receivequarterly dividends based on a rolling three-month LIBOR.The dividend rate for the December 31, 2003, payment was 1.91%.
The preferred stock of subsidiaries discussed above isincluded in “Other noncurrent liabilities” on theConsolidated Balance Sheets.
Derivatives – We use interest rate swaps to manageinterest rate risk. Each swap matches exact maturity dates of the underlying debt to which they are related, allowingfor perfectly effective hedges. The notional amounts,carrying amounts and estimated fair values of our derivativefinancial instruments are summarized as follows atDecember 31:
Notional Carrying FairAmount Amount Value
2003Interest rate swaps $3,500 $90 $90
2002Interest rate swaps $1,000 $79 $79
In August 2003 we entered into $1,000 in variable interestrate swap contracts on our 5.875% fixed rate debt whichmatures in August 2012. In the fourth quarter of 2003 weentered into two variable rate swap contracts on our fixedrate debt. We entered into $1,000 in variable rate swapcontracts on our 5.875% fixed rate debt which matures inFebruary 2012 and $500 in variable rate swap contracts onour 6.25% fixed rate debt which matures in March 2011. AtDecember 31, 2003 we had interest rate swaps with a notionalvalue of $3,500 and a fair value of approximately $90.

P A G E 5 0
N O T E 9 . I N C O M E TA X E S
Significant components of our deferred tax liabilities andassets are as follows at December 31:
2003 2002
Depreciation and amortization $13,438 $ 9,231Equity in foreign affiliates 945 643Deferred directory expenses (93) 493Other 4,416 4,611
Deferred tax liabilities 18,706 14,978
Employee benefits 3,260 3,078Currency translation adjustments 228 519Allowance for uncollectibles 282 456Unamortized investment tax credits 86 93Other 954 1,285
Deferred tax assets 4,810 5,431
Deferred tax assets valuation allowance 144 148
Net deferred tax liabilities $14,040 $ 9,695
The decrease in the valuation allowance is the result of anevaluation of the uncertainty associated with the realizationof certain deferred tax assets. The valuation allowance ismaintained in deferred tax assets for certain unused federaland state loss carryforwards.
The components of income tax expense are as follows:
2003 2002 2001
Federal:Current $ (466) $ 377 $1,793Deferred – net 3,043 2,251 1,587Amortization of investment
tax credits (24) (30) (44)
2,553 2,598 3,336
State and local:Current (38) 116 206Deferred – net 401 219 385Foreign 14 51 15
377 386 606
Total $2,930 $2,984 $3,942
In the fourth quarter of 2002, we internally restructured ourownership in several investments, including Sterling (seeNote 2). The restructuring included the issuance of externaldebt (see Note 7), and the issuance and sale of preferredstock in subsidiaries (see Note 8). As we remain the primarybeneficiary after the restructuring, the preferred securitiesare classified as “Other noncurrent liabilities” on ourConsolidated Balance Sheet, and no gain or loss was recordedon the transaction. As a result of the sale of preferred stock,we recognized in net income $280 of tax benefits on certainfinancial expenses and losses that were not previously eligible for deferred tax recognition.
A reconciliation of income tax expense and the amountcomputed by applying the statutory federal income tax rate(35%) to income before income taxes, extraordinary itemsand cumulative effect of accounting change is as follows:
2003 2002 2001
Taxes computed at federal statutory rate $3,115 $3,660 $3,832
Increases (decreases) in income taxes resulting from:
State and local income taxes – net of federal income tax benefit 250 269 399
Restructuring/sale of preferred interest — (280) —
Effects of international operations (230) (354) (22)
Goodwill amortization — — 86Tax settlements (41) (171) —Contributions of
appreciated investments — — (208)Other – net (164) (140) (145)
Total $2,930 $2,984 $3,942
Effects of international operations include items such asforeign tax credits, sales of foreign investments and the effectsof undistributed earnings from international operations.Deferred taxes are not provided on the undistributed earningsof subsidiaries operating outside the United States that havebeen or are intended to be permanently reinvested.
N O T E 1 0 . P E N S I O N A N D P O S T R E T I R E M E N T B E N E F I T S
Pensions – Substantially all of our employees are covered byone of various noncontributory pension and death benefitplans. At December 31, 2003, management employees participated in either cash balance or defined lump sumpension plans. Additionally, all management employees participated in a traditional pension benefit formula, statedas a percentage of the employees’ adjusted career income.The pension benefit formula for most nonmanagementemployees is based on a flat dollar amount per year accordingto job classification. Most employees can elect to receivetheir pension benefits in either a lump sum payment orannuity. We use a December 31 measurement date for calculating the values reported for plan assets and benefitobligations for our plans.
Our objective in funding the plans, in combination withthe standards of the Employee Retirement Income SecurityAct of 1974, as amended (ERISA), is to accumulate assets sufficient to meet the plans’ obligations to provide benefitsto employees upon their retirement. Required funding isbased on the present value of future benefits, which issimilar to the projected benefit obligation discussed below.
N O T E S T O C O N S O L I D A T E D F I N A N C I A L S T A T E M E N T S ( C O N T I N U E D )Dollars in millions except per share amounts

P A G E 5 1
Any plan contributions, as determined by ERISA regulations,are made to a pension trust for the benefit of plan participants.In July 2003, we voluntarily contributed $500 to the pensiontrust for the benefit of plan participants. No significant cash contributions to the trust will be required under ERISAregulations during 2004; however, we may make contributionsin excess of minimum funding requirements. We are consid-ering a voluntary contribution of assets, which may includecash and/or other investments of $1,000 or more.
For defined benefit pension plans, the benefit obligationis the “projected benefit obligation”, the actuarial presentvalue, as of the measurement date, of all benefits attributedby the pension benefit formula to employee service renderedto that date. The following table presents this reconciliationand shows the change in the projected benefit obligationfor the years ended December 31:
2003 2002
Benefit obligation at beginning of year $26,148 $25,060Service cost – benefits earned
during the period 732 645Interest cost on projected benefit obligation 1,666 1,780Amendments 1 (33)Actuarial loss 1,931 2,534Special termination benefits 71 456Benefits paid (2,932) (4,294)
Benefit obligation at end of year $27,617 $26,148
The following table presents the change in the value ofpension plan assets for the years ended December 31 andthe pension plans’ funded status at December 31:
2003 2002
Fair value of plan assets at beginning of year $24,999 $32,715
Actual return on plan assets 5,584 (3,442)Employer contribution 500 —Transfer from Cingular1 — 6Benefits paid (2,929) (4,280)
Fair value of plan assets at end of year2 $28,154 $24,999
Funded (unfunded) status (fair value of plan assets less benefit obligation)3 $ 537 $ (1,149)
Unrecognized prior service cost 1,397 1,642Unrecognized net (gain) loss 6,588 7,777Unamortized transition asset (67) (218)
Net amount recognized $ 8,455 $ 8,052
1Associated with the 2002 true-up of pension assets and liabilities based on finalvaluations of the 2001 employee transfer to Cingular.
2Plan assets include SBC common stock of $6 at December 31, 2003, and $8 atDecember 31, 2002.
3Funded (unfunded) status is not indicative of our ability to pay ongoing pensionbenefits. Required pension funding is determined in accordance with ERISA regulations.
Amounts recognized in our Consolidated Balance Sheets atDecember 31 are listed below and are discussed in thefourth paragraph following these tables:
2003 2002
Prepaid pension cost1 $ 8,455 $ 8,052Additional minimum pension liability2 (2,720) (3,455)Intangible asset1 894 1,078Accumulated other comprehensive income 1,132 1,473Deferred tax asset 694 904
Net amount recognized $ 8,455 $ 8,052
1Included in “Other Assets”.2Included in “Postemployment benefit obligation”.
The following table presents the components of net pensioncost (benefit) recognized in our Consolidated Statements of Income (gains are denoted with parentheses and lossesare not):
2003 2002 2001
Service cost – benefits earned during the period $ 732 $ 645 $ 550
Interest cost on projected benefit obligation 1,666 1,780 1,847
Expected return on plan assets (2,456) (3,429) (3,515)Amortization of prior service cost
and transition asset 94 100 81Recognized actuarial gain 53 (233) (413)
Net pension cost (benefit) $ 89 $(1,137) $(1,450)
In determining the projected benefit obligation and the netpension cost (benefit), we used the following significantweighted-average assumptions:
2003 2002 2001
Discount rate for determining projected benefit obligationat December 31 6.25% 6.75% 7.50%
Discount rate in effect fordetermining net pensioncost (benefit) 6.75% 7.50% 7.75%
Long-term rate of return on plan assets 8.50% 9.50% 9.50%
Composite rate of compensation increase 4.25% 4.25% 4.25%
Our assumed discount rate of 6.25% at December 31, 2003,reflects the hypothetical rate at which the projected benefitobligation could be effectively settled, or paid out to participants, on that date. We determined our discount ratebased on a range of factors including the rates of return on high-quality, fixed-income corporate bonds available atthe measurement date. The reduction in the discount rate at December 31, 2003 and 2002, by 0.50% and by 0.75%,respectively, resulted in an increase in our pension planbenefit obligation of approximately $1,081 and $1,480 atDecember 31, 2003 and 2002. Should actual experiencediffer from actuarial assumptions, the projected benefit obligation and net pension cost (benefit) would be affected.

P A G E 5 2
Our expected long-term rate of return on plan assets of8.5% for 2003, reflects the average rate of earningsexpected on the funds invested, or to be invested, toprovide for the benefits included in the projected benefitobligations. We consider many factors that include, but arenot limited to historic returns on plan assets, current marketinformation on long-term returns (e.g., long-term bondrates) and current and target asset allocations between assetcategories. The target asset allocation is determined basedon consultations with external investment advisors.
As noted above, the projected benefit obligation is theactuarial present value of all benefits attributed by thepension benefit formula to previously rendered employeeservice. The calculation of the obligation generally consistsof estimating the amount of retirement income payments infuture years after the employee retires or terminates serviceand calculating the present value at the measurement date.The amount of benefit to be paid depends on a number offuture events incorporated into the pension benefit formula,including estimates of average life of employees/survivorsand average years of service rendered. It is measured basedon assumptions concerning future interest rates and futureemployee compensation levels.
In contrast to the projected benefit obligation, the accu-mulated benefit obligation represents the actuarial presentvalue of benefits based on employee service and compensationas of a certain date and does not include an assumptionabout future compensation levels. On a plan-by-plan basis, if the accumulated benefit obligation exceeds plan assetsand at least this amount has not been accrued, an additionalminimum liability must be recognized, partially offset by anintangible asset for unrecognized prior service cost, with theremainder a direct charge to equity net of deferred tax benefits. These items are included in the third table abovethat presents the amounts recognized in our ConsolidatedBalance Sheets at December 31. At December 31, 2003 and2002, for three of our plans, the accumulated benefit obligation (aggregate balance of $13,724 for 2003 and$13,289 for 2002) exceeded plan assets (aggregate balanceof $13,016 for 2003 and $11,525 for 2002). Because of ourincreased asset returns in 2003, during the fourth quarter of 2003 we were able to reduce our minimum liability by$735, which resulted in a direct increase to equity of $341(net of deferred taxes of $210). In 2002, our decreaseddiscount rate and lower asset returns, required us to recordan additional minimum liability of $3,455 and a directcharge to equity of $1,473 (net of deferred taxes of $904) in the fourth quarter of 2002. This reclass, while adjustingequity and comprehensive income, will not affect our future results of operations or cash flows.
Shown below is a summary of our obligations and thefair value of plan assets for the years ended December 31,2003 and 2002.
2003 2002
Projected benefit obligation $27,617 $26,148Accumulated benefit obligation 25,249 24,223Fair value of plan assets 28,154 24,999
During 2003, 2002 and 2001, as part of our workforce reduction programs, an enhanced retirement program wasoffered to eligible Pacific Telesis Group (PTG) nonmanagementemployees. This program offered eligible employees whovoluntarily decided to terminate employment an enhancedpension benefit and increased eligibility for postretirementmedical, dental and life insurance benefits. Employees thataccepted this offer and terminated employment totaledapproximately 339 before the end of December 31, 2003.Approximately 3,600 and 1,400 employees terminatedbefore the end of December 31, 2002 and 2001, respectively.In addition to the net pension cost (benefit) reported in thetables above, enhanced pension benefits related to thisprogram were recognized as an expense of $42 in 2003,$456 in 2002, and $164 in 2001.
In September 2003, the Internal Revenue Service (IRS)increased the interest rate applicable to fourth-quarterpension plan lump sum calculations from 4.53% to 5.31%.An increase in the interest rate had a negative impact onlump sum pension calculations for some of our employees.We chose to extend the 4.53% pension plan lump sumbenefit payout rate through October 31, 2003. Theextension of the lump sum benefit payout rate wasaccounted for as a special termination benefit andincreased our fourth-quarter pension benefit expenseapproximately $28 in 2003.
In October 2000, we implemented a voluntary enhancedpension and retirement program (EPR) to reduce thenumber of management employees. Approximately 7,000 of the employees who accepted this offer terminatedemployment before December 31, 2000; however, under the program, approximately 2,400 employees were retainedfor up to one year. We recognized $940 in settlement gainsin 2001 primarily associated with the EPR program.
Also, in addition to the net pension cost (benefit)reported in the table disclosing the components of our net pension cost (benefit) and the aforementioned EPRsettlement/curtailment gains, we recognized $29 in netsettlement gains in 2002 and $423 in 2001. Net settlementgains in 2002 include settlement losses during the latter part of the year, reflecting the continued investment lossessustained by the plan. We did not recognize any settlementgains or losses in 2003.
N O T E S T O C O N S O L I D A T E D F I N A N C I A L S T A T E M E N T S ( C O N T I N U E D )Dollars in millions except per share amounts
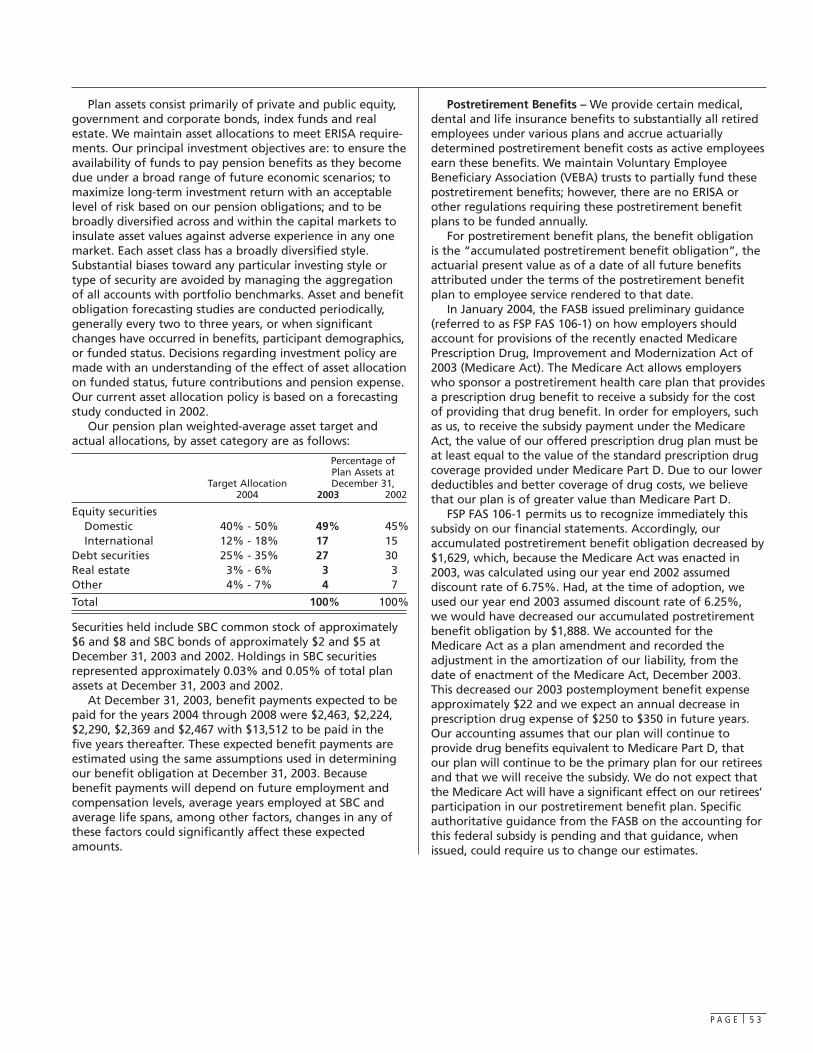
P A G E 5 3
Plan assets consist primarily of private and public equity,government and corporate bonds, index funds and realestate. We maintain asset allocations to meet ERISA require-ments. Our principal investment objectives are: to ensure theavailability of funds to pay pension benefits as they becomedue under a broad range of future economic scenarios; tomaximize long-term investment return with an acceptablelevel of risk based on our pension obligations; and to bebroadly diversified across and within the capital markets toinsulate asset values against adverse experience in any onemarket. Each asset class has a broadly diversified style.Substantial biases toward any particular investing style ortype of security are avoided by managing the aggregationof all accounts with portfolio benchmarks. Asset and benefitobligation forecasting studies are conducted periodically,generally every two to three years, or when significantchanges have occurred in benefits, participant demographics,or funded status. Decisions regarding investment policy aremade with an understanding of the effect of asset allocationon funded status, future contributions and pension expense.Our current asset allocation policy is based on a forecastingstudy conducted in 2002.
Our pension plan weighted-average asset target andactual allocations, by asset category are as follows:
Percentage of Plan Assets at
Target Allocation December 31,2004 2003 2002
Equity securitiesDomestic 40% - 50% 49% 45%International 12% - 18% 17 15
Debt securities 25% - 35% 27 30Real estate 3% - 6% 3 3Other 4% - 7% 4 7
Total 100% 100%
Securities held include SBC common stock of approximately$6 and $8 and SBC bonds of approximately $2 and $5 atDecember 31, 2003 and 2002. Holdings in SBC securities represented approximately 0.03% and 0.05% of total planassets at December 31, 2003 and 2002.
At December 31, 2003, benefit payments expected to bepaid for the years 2004 through 2008 were $2,463, $2,224,$2,290, $2,369 and $2,467 with $13,512 to be paid in thefive years thereafter. These expected benefit payments areestimated using the same assumptions used in determiningour benefit obligation at December 31, 2003. Becausebenefit payments will depend on future employment andcompensation levels, average years employed at SBC andaverage life spans, among other factors, changes in any ofthese factors could significantly affect these expectedamounts.
Postretirement Benefits – We provide certain medical,dental and life insurance benefits to substantially all retiredemployees under various plans and accrue actuarially determined postretirement benefit costs as active employeesearn these benefits. We maintain Voluntary EmployeeBeneficiary Association (VEBA) trusts to partially fund thesepostretirement benefits; however, there are no ERISA orother regulations requiring these postretirement benefitplans to be funded annually.
For postretirement benefit plans, the benefit obligation is the “accumulated postretirement benefit obligation”, theactuarial present value as of a date of all future benefitsattributed under the terms of the postretirement benefitplan to employee service rendered to that date.
In January 2004, the FASB issued preliminary guidance(referred to as FSP FAS 106-1) on how employers shouldaccount for provisions of the recently enacted MedicarePrescription Drug, Improvement and Modernization Act of2003 (Medicare Act). The Medicare Act allows employerswho sponsor a postretirement health care plan that providesa prescription drug benefit to receive a subsidy for the costof providing that drug benefit. In order for employers, suchas us, to receive the subsidy payment under the MedicareAct, the value of our offered prescription drug plan must beat least equal to the value of the standard prescription drugcoverage provided under Medicare Part D. Due to our lowerdeductibles and better coverage of drug costs, we believethat our plan is of greater value than Medicare Part D.
FSP FAS 106-1 permits us to recognize immediately thissubsidy on our financial statements. Accordingly, our accumulated postretirement benefit obligation decreased by$1,629, which, because the Medicare Act was enacted in2003, was calculated using our year end 2002 assumed discount rate of 6.75%. Had, at the time of adoption, weused our year end 2003 assumed discount rate of 6.25%, we would have decreased our accumulated postretirementbenefit obligation by $1,888. We accounted for theMedicare Act as a plan amendment and recorded the adjustment in the amortization of our liability, from thedate of enactment of the Medicare Act, December 2003.This decreased our 2003 postemployment benefit expenseapproximately $22 and we expect an annual decrease in prescription drug expense of $250 to $350 in future years.Our accounting assumes that our plan will continue toprovide drug benefits equivalent to Medicare Part D, thatour plan will continue to be the primary plan for our retireesand that we will receive the subsidy. We do not expect thatthe Medicare Act will have a significant effect on our retirees’participation in our postretirement benefit plan. Specificauthoritative guidance from the FASB on the accounting forthis federal subsidy is pending and that guidance, whenissued, could require us to change our estimates.

P A G E 5 4
The following table presents a reconciliation of thebeginning and ending balances of the benefit obligationand shows the change in the accumulated postretirementbenefit obligation for the years ended December 31:
2003 2002
Benefit obligation at beginning of year $24,564 $20,140Service cost – benefits earned
during the period 378 293Interest cost on accumulated
postretirement benefit obligation 1,602 1,430Medicare Act initial recognition (1,629) —Amendments (53) (1,110)Actuarial loss 3,552 4,932Special termination benefits 2 30Benefits paid (1,185) (1,151)
Benefit obligation at end of year $27,231 $24,564
In early 2004, nonmanagement retirees were notified ofmedical coverage changes that will become effective onJanuary 1, 2005. These changes include adjustments to co-pays and deductibles for prescription drugs and a choiceof medical plan coverage between the existing plans, includingmonthly contribution provisions or a plan with higher co-paysand deductibles but no required monthly contribution fromthe retiree during 2005. We expect this change to reducethe benefit obligation in the range of $2,000 to $3,500 in 2004.
The following table sets forth the change in the value of plan assets for the years ended December 31, the plans’funded status at December 31 and the accrued postretirementbenefit obligation liability recognized in our ConsolidatedBalance Sheets at December 31:
2003 2002
Fair value of plan assets at beginning of year $ 4,917 $ 6,275
Actual return on plan assets 1,167 (802)Employer contribution1 1,312 3Benefits paid (429) (559)
Fair value of plan assets at end of year2 $ 6,967 $ 4,917
Unfunded status (fair value of plan assets less benefit obligation)3 $(20,263) $(19,647)
Unrecognized prior service cost (benefit) (2,664) (1,109)Unrecognized net loss 12,788 10,335
Accrued postretirement benefit obligation $(10,139) $(10,421)
12003 includes reimbursements from a VEBA trust to us of $167 for qualified claimspaid by us. At the time of reimbursement we made a contribution of $167 to a different VEBA.
2Plan assets include SBC common stock of $5 at December 31, 2003 and 2002.3(Unfunded) funded status is not indicative of our ability to pay ongoing postretirement benefits. As noted above, while many companies do not, we maintain trusts to partially fund these postretirement benefits; however, there are no ERISA or other regulations requiring these postretirement benefit plans to be funded annually.
The following table presents the components of postretirementbenefit cost recognized in our Consolidated Statements ofIncome (gains are denoted with brackets and losses are not):
2003 2002 2001
Service cost – benefits earned during the period $ 378 $ 293 $ 256
Interest cost on accumulated postretirement benefit obligation 1,602 1,430 1,316
Expected return on assets (525) (689) (665)Amortization of prior service
cost (benefit) (122) (28) 94Recognized actuarial (gain) loss 413 49 13
Postretirement benefit cost1 $1,746 $1,055 $1,014
1During 2003, the Medicare Act reduced postretirement benefit cost by $22. Thiseffect is included in several line items above.
The fair value of plan assets allocated to the payment of lifeinsurance benefits was $535 and $516 at December 31, 2003and 2002. At December 31, 2003 and 2002, the accrued lifeinsurance benefits included in the accrued postretirementbenefit obligation were $1,059 and $943.
In addition to the postretirement benefit cost reported in the table above, enhanced benefits related to the PTGnonmanagement early retirement program were recognizedas an expense of $2, $30 and $9 in 2003, 2002 and 2001.
The medical cost trend rate in 2004 is 9.0% for retirees 64and under and 10.0% for retirees 65 and over, trending toan expected increase of 5.0% in 2009 for all retirees, prior toadjustment for cost-sharing provisions of the medical anddental plans for certain retired employees. The assumeddental cost trend rate in 2004 is 5.0%. A one percentage-point change in the assumed combined medical and dentalcost trend rate would have the following effects:
One Percentage- One Percentage-Point Increase Point Decrease
Increase (decrease) in total of service and interest cost components $ 301 $ (239)
Increase (decrease) in accumulated postretirement benefit obligation 3,346 (2,731)
We used the same significant assumptions for the discountrate, long-term rate of return on plan assets and compositerate of compensation increase used in calculating the accumulated postretirement benefit obligation and relatedpostretirement benefit costs that we used in developing thepension information. The reduction in the discount rate atDecember 31, 2003 and 2002 resulted in an increase in ourpostretirement benefit obligation of approximately $1,800and $2,062, respectively. Should actual experience differ fromthe actuarial assumptions, the accumulated postretirementbenefit obligation and postretirement benefit cost would beaffected in future years.
N O T E S T O C O N S O L I D A T E D F I N A N C I A L S T A T E M E N T S ( C O N T I N U E D )Dollars in millions except per share amounts

P A G E 5 5
For the majority of our labor contracts that contain anannual dollar value cap for the purpose of determining contributions required from nonmanagement retirees, wehave waived the cap during the relevant contract periodsand thus not collected contributions from those retirees.Therefore, in accordance with the substantive plan provisionsrequired in accounting for postretirement benefits underGAAP, through 2003, we did not account for the cap in thevalue of our accumulated postretirement benefit obligation(i.e., we assumed the cap would be waived for all futurecontract periods). If we had accounted for the cap as writtenin the contracts, our postretirement benefit cost would havebeen reduced by $884, $606 and $476 in 2003, 2002 and2001. As noted above, the letters sent to nonmanagementretirees informed them of changes in medical coveragebeginning in 2005. We anticipate the changes will reducepostretirement benefit cost in the range of $300 to $600during 2004.
Plan assets consist primarily of private and public equity,government and corporate bonds and index funds. Our principal investment objectives are: to ensure the availabilityof funds to pay postretirement benefits as they become due under a broad range of future economic scenarios; tomaximize long-term investment return with an acceptablelevel of risk; and to be broadly diversified across and withinthe capital markets to insulate asset values against adverseexperience in any one market.
Our postretirement benefit plan weighted-average asset target and actual allocations, by asset category are as follows:
Percentage of Plan Assets at
Target Allocation December 31,2004 2003 2002
Equity securitiesDomestic1 50% - 60% 45% 58%International 15% - 25% 16 16
Debt securities 20% - 30% 28 24Real estate none — —Other 0% - 10% 11 2
Total 100% 100%
1At December 31, 2003, Domestic equity securities did not include the funds fromour late December 2003 voluntary VEBA contribution. Our subsequent investmentin January 2004 resulted in an allocation within the target range.
Securities held include SBC common stock of approximately$5, or 0.07% of plan assets, and $5, or 0.1% of plan assets,at December 31, 2003 and 2002.
While not required, we voluntarily contributed $445 and$700 to the VEBA trusts to partially fund postretirementbenefits in the first and fourth quarters of 2003, respectively.We are currently considering a voluntary contribution ofassets, which may include cash and/or other investments of$1,000 or more.
At December 31, 2003, benefit payments expected to bepaid for the years 2004 through 2008 were $1,341, $1,443,$1,475, $1,567 and $1,651 with $9,235 to be paid in the fiveyears thereafter. These expected benefit payments are esti-mated using the same assumptions used in determining ourbenefit obligation at December 31, 2003. Because benefitpayments will depend on future employment and compen-sation levels, average years employed at SBC and averagelife spans, among other factors, changes in any of thesefactors could significantly affect these expected amounts.
Combined Net Pension and Postretirement Cost(Benefit) – The following table combines net pension cost (benefit) with postretirement benefit cost (gains aredenoted with parentheses and losses are not):
2003 2002 2001
Net pension cost (benefit) $ 89 $(1,137) $(1,450)Postretirement benefit cost 1,746 1,055 1,014
Combined net pension and postretirement cost (benefit) $1,835 $ (82) $ (436)
Our combined net pension and postretirement benefitdecreased in 2003 primarily due to net investment losses andpension settlement gains recognized in 2002 and previousyears, which reduced the amount of unrealized gains recognized in 2003. (Under GAAP, if lump sum benefits paidfrom a plan to employees upon termination or retirementexceed required thresholds, we recognize a portion of previously unrecognized pension gains or losses attributableto that plan’s assets and liabilities. Until 2002, we had unrecognized net gains, primarily because our actual investment returns exceeded our expected investmentreturns. During 2002, we made lump sum benefit payments inexcess of the GAAP thresholds, resulting in the recognitionof net gains, referred to as “pension settlement gains”.)
The following four other factors also increased our combined net pension and postretirement cost in 2003:
• Our decision to lower our expected long-term rate ofreturn on plan assets from 9.5% to 8.5% for 2003,based on our long-term view of future market returns,increased costs approximately $343.
• The reduction of the discount rates used to calculateservice and interest cost from 7.5% to 6.75%, inresponse to lower corporate bond interest rates,increased this cost approximately $163.
• Higher-than-expected medical and prescription drugclaims increased expense approximately $152.
• We increased the assumed medical cost trend rate in2003 from 8.0% to 9.0% for retirees 64 and under andfrom 9.0% to 10.0% for retirees 65 and over, trendingto an expected increase of 5.0% in 2009 for all retirees,prior to adjustment for cost-sharing provisions of themedical and dental plans for certain retired employees,in response to rising claim costs. This increase in themedical cost trend rate increased our combined netpension and postretirement cost approximately $187.

P A G E 5 6
As a result of this increase in our combined net pension and postretirement cost, we have taken steps to implementadditional cost controls. To offset some of the increases inmedical costs mentioned above, in January 2003, we implemented cost-saving design changes in our managementhealth plans including increased participant contributionsfor health coverage and increased prescription drug co-payments. These changes reduced our postretirement costapproximately $229 in 2003.
As previously discussed, in early 2004, the majority ofnonmanagement retirees were informed of medical coveragechanges. Retirees have the option of continuing coverage ontheir current plan, with the cap enforcement, or opting forcoverage on an alternative plan with no required monthlycontribution from the retiree during 2005. We expect thischange to reduce 2004 expenses in the range of $300 to$600 and the projected benefit obligation in the range of$2,000 to $3,500.
While we will continue our cost-cutting efforts discussedabove, certain factors, such as investment returns, dependlargely on trends in the U.S. securities markets and thegeneral U.S. economy, and we cannot control these factors.In particular, uncertainty in the securities markets and U.S.economy could result in investment volatility and significantchanges in plan assets, which under GAAP we will recognizeover the next several years. As a result of these economicimpacts and assumption changes discussed above, we expecta combined net pension and postretirement cost of between$1,000 and $1,400 in 2004. Approximately 10% of thesecosts will be capitalized as part of construction labor, providing a small reduction in the net expense recorded.Additionally, should actual experience differ from actuarialassumptions, combined net pension and postretirement costwould be affected in future years.
The weighted average expected return on assets assumption, which reflects our view of long-term returns, is one of the most significant of the weighted averageassumptions used to determine our actuarial estimates ofpension and postretirement benefit expense. Based on ourlong-term expectation of market returns in future years, ourlong-term rate of return on plan assets is 8.5% for 2004. If all other factors were to remain unchanged, we expect a1% decrease in the expected long-term rate of return wouldcause 2004 combined pension and postretirement cost toincrease approximately $408 over 2003 (analogous changewould result from a 1% increase).
Under GAAP, the expected long-term rate of return is calculated on the market-related value of assets (MRVA).GAAP requires that actual gains and losses on pension andpostretirement plan assets be recognized in the MRVAequally over a period of not more than five years. We use amethodology, allowed under GAAP, under which we hold theMRVA to within 20% of the actual fair value of plan assets,which can have the effect of accelerating the recognition of excess actual gains and losses into the MRVA to less than five years. Due to investment losses on plan assetsexperienced in recent years, this methodology contributed
approximately $605 to our combined net pension andpostretirement cost in 2003 as compared with not using thismethodology. This methodology did not have a significanteffect on our 2002 or 2001 combined net pension andpostretirement benefit as the MRVA was almost equal to thefair value of plan assets. Largely due to investment returns in2003, we do not expect this methodology to have a significantimpact in our combined net pension and postretirementcosts in 2004.
Supplemental Retirement Plans – We also provide senior- and middle-management employees with nonqualified,unfunded supplemental retirement and savings plans. Theseplans include supplemental pension benefits as well as compensation deferral plans, some of which include a corresponding match by us based on a percentage of thecompensation deferral. Expenses related to these plans were$142, $142 and $166 in 2003, 2002 and 2001. Liabilities of$1,718 and $1,629 related to these plans have been includedin “Other noncurrent liabilities” on our ConsolidatedBalance Sheets at December 31, 2003 and 2002.
N O T E 1 1 . E M P L OY E E S T O C K O W N E R S H I P P L A N S ( E S O P )
We maintain contributory savings plans that cover substan-tially all employees. Under the savings plans, we match astated percentage of eligible employee contributions,subject to a specified ceiling.
We extended the terms of certain ESOPs through previousinternal refinancing of the debt, which resulted in approxi-mately 75 million of allocated SBC shares and significantlyless than 1 million unallocated SBC shares remaining in one of those ESOPs at December 31, 2002. This internal refinancing of ESOP debt was paid off in December 2002with our matching contributions to the savings plan, dividendspaid on SBC shares and interest earned on funds held by theESOPs. There were no debt-financed SBC shares held by theESOPs, allocated or unallocated, at December 31, 2003.
In 2003, our match of employee contributions to thesavings plans was fulfilled with purchases of SBC’s stock onthe open market. Prior to December 31, 2002, our match ofemployee contributions to the savings plan was fulfilledwith shares of stock purchased with the proceeds of an ESOPnote and the purchases of SBC’s stock in the open market.Shares purchased with the proceeds of an ESOP note werereleased for allocation to the accounts of employees asemployer-matching contributions were earned by participantsand paid to the ESOP by us. In 2003, the benefit cost wasbased on the cost of shares allocated to participatingemployees’ accounts. Prior to December 31, 2002, benefitcost was based on a combination of the contributions to thesavings plans and the cost of shares allocated to participatingemployees’ accounts. Prior to December 31, 2002, bothbenefit cost and interest expense on the ESOP notes werereduced by dividends on SBC’s shares held by the ESOPs andinterest earned on the ESOPs’ funds.
N O T E S T O C O N S O L I D A T E D F I N A N C I A L S T A T E M E N T S ( C O N T I N U E D )Dollars in millions except per share amounts

P A G E 5 7
Information related to the ESOPs and the savings plans issummarized below:
2003 2002 2001
Benefit expense – net of dividends and interest income $300 $216 $185
Total expense $300 $216 $185
Company contributions for ESOPs $ — $165 $177
Dividends and interest income for debt service $ — $ 8 $ 58
N O T E 1 2 . S T O C K - B A S E D C O M P E N S AT I O N
Under our various plans, senior and other management andnonmanagement employees and nonemployee directorshave received stock options, performance stock units andother nonvested stock units. Stock options issued throughDecember 31, 2003 carry exercise prices equal to the marketprice of the stock at the date of grant and have maximumterms ranging from five to ten years. Beginning in 1994 andending in 1999, certain Ameritech employees were awardedgrants of nonqualified stock options with dividend equivalents.Depending upon the grant, vesting of stock options mayoccur up to five years from the date of grant, with mostoptions vesting on a graded basis over three years (1/3 ofthe grant vests after one year, another 1/3 vests after twoyears and the final 1/3 vests after three years from the grantdate). Performance stock units are granted to key employeesbased upon the common stock price at the date of grantand are awarded in the form of common stock and cash atthe end of a two- or three-year period, subject to theachievement of certain performance goals. Nonvested stockunits are valued at the market price of the stock at the dateof grant and vest over a three- to five-year period. As ofDecember 31, 2003, we were authorized to issue up to 80million shares of stock (in addition to shares that may beissued upon exercise of outstanding options or upon vestingof performance stock units or other nonvested stock units)to officers, employees and directors pursuant to thesevarious plans.
We use an accelerated method of recognizing compensa-tion cost for fixed awards with graded vesting, which essentially treats the grant as three separate awards, withvesting periods of 12, 24 and 36 months for those that vestover three years. As noted above, a majority of our optionsvest over three years and for those we recognize approximately61% of the associated compensation expense in the firstyear, 28% in the second year and the remaining 11% in thethird year. As allowed by FAS 123, we accrue compensationcost as if all options granted subject only to a servicerequirement are expected to vest. The effects of actual forfeitures of unvested options are recognized (as a reversal of expense) as they occur.
The compensation cost that has been charged againstincome for these plans and our other stock-based compensation plans is as follows:
2003 2002 2001
Stock option expense under FAS 123 $183 $390 $380
Mark-to-market effect on dividend equivalents 4 (36) (33)
Other 57 19 33
Total $244 $373 $380
The estimated fair value of the options when granted isamortized to expense over the options’ vesting period. Theweighted-average, fair value of each option granted during2003, 2002 and 2001 was $3.88, $6.57 and $8.37. The fairvalue for these options was estimated at the date of grant,using a Black-Scholes option pricing model with the followingweighted-average assumptions used for grants in 2003, 2002and 2001: risk-free interest rate of 3.64%, 4.33% and 4.51%;dividend yield of 4.40%, 3.04% and 2.37%; expected volatilityfactor of 22%, 23% and 24%; and expected option life of6.7, 4.4 and 4.0 years.
Information related to options is summarized below(shares in millions):
Weighted-Average
Number Exercise Price
Outstanding at January 1, 2001 156 $33.53Granted 76 43.41Exercised (13) 24.41Forfeited/Expired (12) 43.09
Outstanding at December 31, 2001(109 exercisable at weighted-average price of $32.36) 207 37.21
Granted 36 35.50Exercised (7) 20.80Forfeited/Expired (7) 41.20
Outstanding at December 31, 2002(154 exercisable at weighted-average price of $36.48) 229 37.31
Granted 15 24.71Exercised (6) 19.64Forfeited/Expired (7) 37.09
Outstanding at December 31, 2003(181 exercisable at weighted-average price of $37.66) 231 $36.94
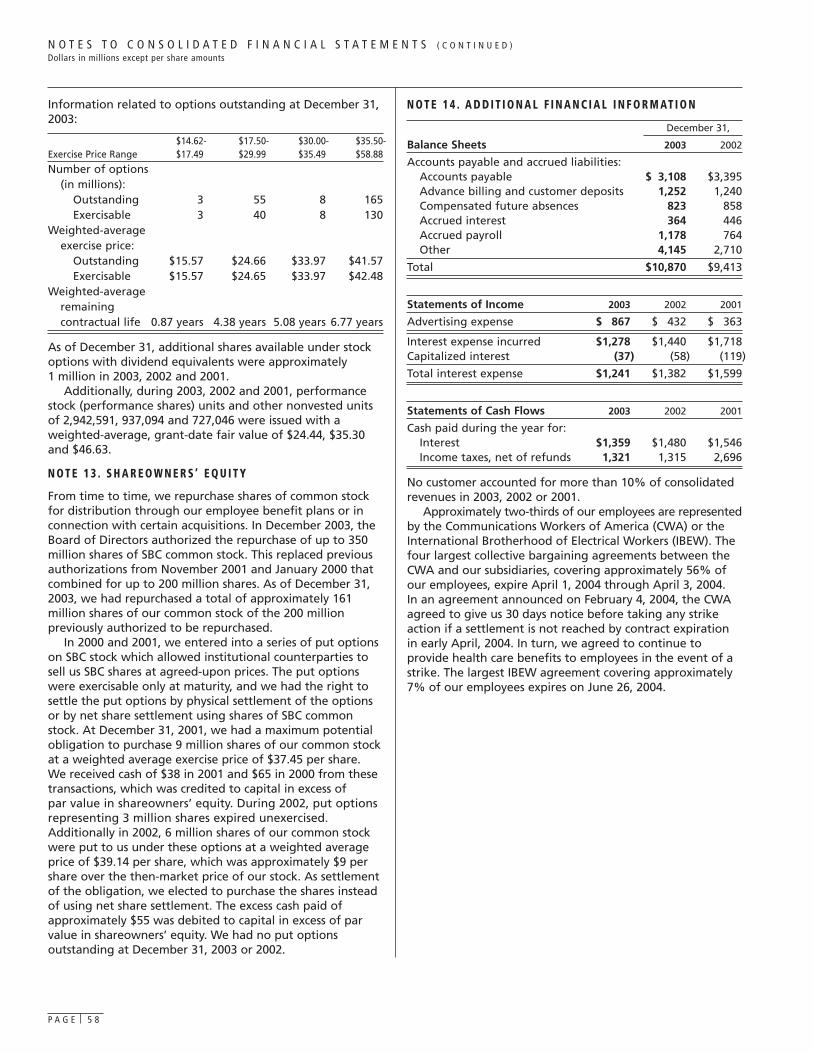
P A G E 5 8
N O T E S T O C O N S O L I D A T E D F I N A N C I A L S T A T E M E N T S ( C O N T I N U E D )Dollars in millions except per share amounts
Information related to options outstanding at December 31,2003:
$14.62- $17.50- $30.00- $35.50-Exercise Price Range $17.49 $29.99 $35.49 $58.88
Number of options(in millions):
Outstanding 3 55 8 165Exercisable 3 40 8 130
Weighted-average exercise price:
Outstanding $15.57 $24.66 $33.97 $41.57Exercisable $15.57 $24.65 $33.97 $42.48
Weighted-average remaining contractual life 0.87 years 4.38 years 5.08 years 6.77 years
As of December 31, additional shares available under stockoptions with dividend equivalents were approximately 1 million in 2003, 2002 and 2001.
Additionally, during 2003, 2002 and 2001, performancestock (performance shares) units and other nonvested unitsof 2,942,591, 937,094 and 727,046 were issued with aweighted-average, grant-date fair value of $24.44, $35.30and $46.63.
N O T E 1 3 . S H A R E O W N E R S ’ E Q U I T Y
From time to time, we repurchase shares of common stockfor distribution through our employee benefit plans or inconnection with certain acquisitions. In December 2003, theBoard of Directors authorized the repurchase of up to 350million shares of SBC common stock. This replaced previousauthorizations from November 2001 and January 2000 thatcombined for up to 200 million shares. As of December 31,2003, we had repurchased a total of approximately 161million shares of our common stock of the 200 million previously authorized to be repurchased.
In 2000 and 2001, we entered into a series of put optionson SBC stock which allowed institutional counterparties tosell us SBC shares at agreed-upon prices. The put optionswere exercisable only at maturity, and we had the right tosettle the put options by physical settlement of the optionsor by net share settlement using shares of SBC commonstock. At December 31, 2001, we had a maximum potentialobligation to purchase 9 million shares of our common stockat a weighted average exercise price of $37.45 per share. We received cash of $38 in 2001 and $65 in 2000 from thesetransactions, which was credited to capital in excess of par value in shareowners’ equity. During 2002, put optionsrepresenting 3 million shares expired unexercised.Additionally in 2002, 6 million shares of our common stockwere put to us under these options at a weighted averageprice of $39.14 per share, which was approximately $9 pershare over the then-market price of our stock. As settlementof the obligation, we elected to purchase the shares insteadof using net share settlement. The excess cash paid ofapproximately $55 was debited to capital in excess of parvalue in shareowners’ equity. We had no put options outstanding at December 31, 2003 or 2002.
N O T E 1 4 . A D D I T I O N A L F I N A N C I A L I N F O R M AT I O N
December 31,
Balance Sheets 2003 2002
Accounts payable and accrued liabilities:Accounts payable $ 3,108 $3,395Advance billing and customer deposits 1,252 1,240Compensated future absences 823 858Accrued interest 364 446Accrued payroll 1,178 764Other 4,145 2,710
Total $10,870 $9,413
Statements of Income 2003 2002 2001
Advertising expense $ 867 $ 432 $ 363
Interest expense incurred $1,278 $1,440 $1,718Capitalized interest (37) (58) (119)
Total interest expense $1,241 $1,382 $1,599
Statements of Cash Flows 2003 2002 2001
Cash paid during the year for:Interest $1,359 $1,480 $1,546Income taxes, net of refunds 1,321 1,315 2,696
No customer accounted for more than 10% of consolidatedrevenues in 2003, 2002 or 2001.
Approximately two-thirds of our employees are representedby the Communications Workers of America (CWA) or theInternational Brotherhood of Electrical Workers (IBEW). Thefour largest collective bargaining agreements between theCWA and our subsidiaries, covering approximately 56% ofour employees, expire April 1, 2004 through April 3, 2004. In an agreement announced on February 4, 2004, the CWAagreed to give us 30 days notice before taking any strikeaction if a settlement is not reached by contract expirationin early April, 2004. In turn, we agreed to continue toprovide health care benefits to employees in the event of astrike. The largest IBEW agreement covering approximately7% of our employees expires on June 26, 2004.

P A G E 5 9
N O T E 1 5 . R E L AT E D PA R T Y T R A N S A C T I O N S
We have made advances to Cingular that totaled $5,885 atDecember 31, 2003 and 2002. We earned interest income onthese advances of $397 during 2003, $441 in 2002 and $555in 2001. In July 2003, we renegotiated the terms of theseadvances with Cingular to reduce the interest rate from7.5% to 6.0% and extended the maturity date of the loanfrom March 2005 to June 2008. In addition, for access andlong-distance services sold to Cingular on a wholesale basis,we generated revenue of $476 in 2003, $343 in 2002 and$120 in 2001. Also, under a marketing agreement withCingular relating to Cingular customers added through SBCsales sources, we received commission revenue of $63 in2003, $6 in 2002 and $0 in 2001. The offsetting expenseamounts are recorded by Cingular, of which 60% flows backto us through Equity in Net Income of Affiliates.
N O T E 1 6 . C O N T I N G E N T L I A B I L I T I E S
In addition to issues specifically discussed elsewhere, we are party to numerous lawsuits, regulatory proceedings and other matters arising in the ordinary course of business.In our opinion, although the outcomes of these proceedingsare uncertain, they should not have a material adverseeffect on the company’s financial position, results of operations or cash flows.
N O T E 1 7 . S U B S E Q U E N T E V E N T
On February 17, 2004, Cingular announced an agreement to acquire AT&T Wireless Services Inc. (AT&T Wireless). Under the terms of the agreement, shareholders of AT&TWireless will receive cash of $15.00 per common share orapproximately $41,000. The acquisition is subject to approvalby AT&T Wireless shareholders and federal regulators. Based on our 60% equity ownership of Cingular, we expectto provide approximately $25,000 of the purchase price. As a result, equity ownership and management control of Cingular will not be impacted after the acquisition.
N O T E 1 8 . Q U A R T E R LY F I N A N C I A L I N F O R M AT I O N ( U N A U D I T E D )
Total Basic DilutedCalendar Operating Operating Net Earnings Earnings Stock Price
Quarter Revenues Income Income Per Share Per Share High Low Close
2003First $10,333 $1,898 $4,996 $ 1.50 $ 1.50 $31.65 $18.85 $20.06Second 10,204 1,749 1,388 0.42 0.42 27.35 19.65 25.55Third 10,239 1,610 1,216 0.37 0.37 26.88 21.65 22.25Fourth 10,067 1,212 905 0.27 0.27 26.15 21.16 26.07
Annual $40,843 $6,469 $8,505 2.56 2.56
2002First $10,522 $2,182 $ (193) $(0.06) $(0.06) $40.99 $34.29 $37.44Second 10,843 2,164 1,782 0.53 0.53 38.40 27.85 30.50Third 10,556 2,029 1,709 0.51 0.51 31.96 19.57 20.10Fourth 11,217 2,248 2,355 0.71 0.71 29.10 19.80 27.11
Annual $43,138 $8,623 $5,653 1.70 1.69
The first quarter of 2003 includes cumulative effect ofaccounting changes of $2,541 (income before cumulativeeffect of accounting changes was $2,455): a benefit of$3,677, or $1.10 per share, related to the adoption of FAS 143 and a charge of $1,136, or $0.34 per share, relatedto the change in the method in which we recognizerevenues and expenses related to publishing directories fromthe “issue basis” method to the “amortization” method (see Note 1). The benefit of $3,677 included a charge of $7representing our share of the loss related to TDC’s fourth-
quarter 2003 adoption of FAS 143. The effect of this noncash charge was to reduce our previously reported first-quarter 2003 net income by $7, or $0.01 per share. The fourth quarter of 2003 includes an extraordinary loss of $7 (income before extraordinary loss was $912) related to consolidation of real estate leases under FIN 46 (see Note 1). The first quarter of 2002 includes a cumulativeeffect of accounting change of $1,820, or $0.54 per share(income before cumulative effect of accounting change was $1,627), from the adoption of FAS 142 (see Note 1).

P A G E 6 0
The consolidated financial statements have been prepared inconformity with generally accepted accounting principles inthe United States. The integrity and objectivity of the datain these financial statements, including estimates and judg-ments relating to matters not concluded by year end, arethe responsibility of management, as is all other informationincluded in the Annual Report, unless otherwise indicated.
The financial statements of SBC Communications Inc.(SBC) have been audited by Ernst & Young LLP, independentauditors. Management has made available to Ernst & YoungLLP all of SBC’s financial records and related data, as well asthe minutes of shareowners’ and directors’ meetings.Furthermore, management believes that all representationsmade to Ernst & Young LLP during its audit were valid andappropriate.
Management has established and maintains a system of internal accounting controls that provides reasonableassurance as to the integrity and reliability of the financialstatements, the protection of assets from unauthorized use or disposition and the prevention and detection offraudulent financial reporting. The concept of reasonableassurance recognizes that the costs of an internal accountingcontrols system should not exceed, in management’s judgment, the benefits to be derived.
Management maintains disclosure controls and proceduresthat are designed to ensure that information required to bedisclosed by SBC is recorded, processed, summarized andreported within the time periods specified by the Securitiesand Exchange Commission’s rules and forms.
Management also seeks to ensure the objectivity andintegrity of its financial data by the careful selection of itsmanagers, by organizational arrangements that provide anappropriate division of responsibility and by communicationprograms aimed at ensuring that its policies, standards andmanagerial authorities are understood throughout theorganization. Management regularly monitors the system ofinternal accounting controls for compliance. SBC maintainsan internal auditing program that independently assessesthe effectiveness of the internal accounting controls and recommends improvements thereto.
The Audit Committee of the Board of Directors meetsperiodically with management, the internal auditors and theindependent auditors to review the manner in which theyare performing their respective responsibilities and to discussauditing, internal accounting controls and financial report-ing matters. Both the internal auditors and the independentauditors periodically meet alone with the Audit Committeeand have access to the Audit Committee at any time.
Edward E. Whitacre Jr.Chairman of the Board andChief Executive Officer
Randall StephensonSenior Executive Vice President andChief Financial Officer
The Board of Directors and ShareownersSBC Communications Inc.
We have audited the accompanying consolidated balancesheets of SBC Communications Inc. (the Company) as ofDecember 31, 2003 and 2002, and the related consolidatedstatements of income, shareowners’ equity, and cash flowsfor each of the three years in the period ended December31, 2003. These financial statements are the responsibility ofthe Company’s management. Our responsibility is to expressan opinion on these consolidated financial statements basedon our audits.
We conducted our audits in accordance with auditingstandards generally accepted in the United States. Thosestandards require that we plan and perform the audit toobtain reasonable assurance about whether the financialstatements are free of material misstatement. An auditincludes examining, on a test basis, evidence supporting theamounts and disclosures in the financial statements. Anaudit also includes assessing the accounting principles usedand significant estimates made by management, as well asevaluating the overall financial statement presentation. Webelieve that our audits provide a reasonable basis for ouropinion.
In our opinion, the consolidated financial statementsreferred to above present fairly, in all material respects, theconsolidated financial position of SBC Communications Inc.at December 31, 2003 and 2002, and the results of its operations and its cash flows for each of the three years inthe period ended December 31, 2003 in conformity withaccounting principles generally accepted in the UnitedStates.
As discussed in Note 1 to the consolidated financial statements, in 2003 the Company changed its method ofrecognizing revenues and expenses related to publishingdirectories, as well as the method of accounting for the costsof removal of long-term assets. Also as discussed in Note 1to the consolidated financial statements, in 2002 theCompany changed its method of accounting for goodwilland other intangibles.
San Antonio, TexasFebruary 9, 2004except for Note 17, as to which the date is February 19, 2004
R E P O R T O F M A N A G E M E N T R E P O R T O F I N D E P E N D E N T A U D I T O R S

P A G E 6 1
S B C B O A R D O F D I R E C T O R S(as of January 30, 2004)
Edward E. Whitacre Jr., 62 (2,4,5)
Chairman of the
Board and Chief
Executive Officer
SBC Communications Inc.
San Antonio, Texas
SBC Director since October 1986
Background: Telecommunications
Gilbert F. Amelio, Ph.D., 61 (6,7)
Senior Partner
Sienna Ventures
Sausalito, California
SBC Director since
February 2001
Advisory Director 1997-2001
Pacific Telesis Director 1995-1997
Background: Technology,
electronics engineering
Clarence C. Barksdale, 71 (1,4,7)
Retired Chairman of
the Board and
Chief Executive Officer
Centerre Bancorporation
St. Louis, Missouri
SBC Director since October 1983
Southwestern Bell Telephone
Director 1982-1983
Background: Banking
James E. Barnes, 70 (2,6)
Chairman of the Board
and Chief Executive
Officer (Retired)
MAPCO Inc.
Tulsa, Oklahoma
SBC Director since November 1990
Background: Diversified energy
August A. Busch III, 66 (2,3)
Chairman of the Board
Anheuser-Busch
Companies, Inc.
St. Louis, Missouri
SBC Director since October 1983
Southwestern Bell Telephone
Director 1980-1983
Background: Brewing, family
entertainment, transportation,
manufacturer of aluminum
beverage containers
The HonorableWilliam P. Clark, 72 (2,7)
Of Counsel
Clark, Cali and
Negranti, LLP
San Luis Obispo, California
SBC Director since April 1997
Pacific Telesis Director 1985-1997
Background: Law, ranching
Martin K. Eby Jr., 69 (1,6)
Chairman of the Board
The Eby Corporation
Wichita, Kansas
SBC Director since
June 1992
Background: General building
construction
Herman E. Gallegos,* 73 (7)
Independent
Management
Consultant
Galt, California
SBC Director since April 1997
Pacific Telesis Director 1983-1997
Background: Management
consulting
Jess T. Hay,* 73 (1,3,4)
Chairman
HCB Enterprises Inc
Chairman
Texas Foundation for
Higher Education
Dallas, Texas
SBC Director since April 1986
Background: Financial services
James A. Henderson, 69 (4,5,6)
Retired Chairman and
Chief Executive Officer
Cummins Inc.
Columbus, Indiana
SBC Director since October 1999
Ameritech Director 1983-1999
Background: Manufacturing
Admiral Bobby R. Inman,* 72(3,4,5)
United States Navy,
Retired
Austin, Texas
SBC Director since
March 1985
Background: Private investment,
education
Charles F. Knight, 68 (2,4,5)
Chairman of the Board
Emerson Electric Co.
St. Louis, Missouri
SBC Director since
October 1983
Southwestern Bell Telephone
Director 1974-1983
Background: Electrical
manufacturing
Lynn M. Martin, 64 (5,7)
Chair of the Council
for the Advancement
of Women
Advisor to the Firm
Deloitte & Touche LLP
Chicago, Illinois
SBC Director since October 1999
Ameritech Director 1993-1999
Background: Consulting, former
Congresswoman and
Secretary of Labor
John B. McCoy, 60 (2,3)
Retired Chairman and
Chief Executive Officer
BANK ONE CORPORATION
Columbus, Ohio
SBC Director since October 1999
Ameritech Director 1991-1999
Background: Banking
Mary S. Metz, Ph.D., 66 (3,7)
President
S. H. Cowell Foundation
San Francisco, California
SBC Director since
April 1997
Pacific Telesis Director 1986-1997
Background: Education,
administration
Toni Rembe, Esq., 67 (2,7)
Partner
Pillsbury Winthrop LLP
San Francisco, California
SBC Director since
January 1998
Advisory Director 1997-1998
Pacific Telesis Director 1991-1997
Background: Law
S. Donley Ritchey, 70 (1,3)
Managing Partner
Alpine Partners
Retired Chairman and
Chief Executive Officer
Lucky Stores, Inc.
Danville, California
SBC Director since April 1997
Pacific Telesis Director 1984-1997
Background: Diversified retail
Joyce M. Roché, 56 (5,7)
President and Chief
Executive Officer
Girls Incorporated
New York, New York
SBC Director since October 1998
Southern New England
Telecommunications
Director 1997-1998
Background: Marketing
Ing. Carlos Slim Helú, 64 (5,7)
Chairman of the Board
Carso Global Telecom,
S.A. de C.V.
Chairman of the Board
Teléfonos de México, S.A. de C.V.
Chairman of the Board
América Móvil, S.A. de C.V.
Mexico City, Mexico
SBC Director since September 1993
Background: Telecommunications,
consumer goods, automobile parts,
construction, retailing
Dr. Laura D’Andrea Tyson, 56 (2,5)
Dean
London Business School
London, England
SBC Director since
October 1999
Ameritech Director 1997-1999
Background: Economics, education
Patricia P. Upton, 65 (4,6,7)
President and
Chief Executive Officer
Aromatique, Inc.
Heber Springs, Arkansas
SBC Director since June 1993
Background: Manufacturing
and marketing of decorative
home fragrances
Committees of the Board:(1) Audit
(2) Corporate Development
(3) Corporate Governance
and Nominating
(4) Executive
(5) Finance/Pension
(6) Human Resources
(7) Public Policy and Environmental
Affairs
*Retiring effective April 30, 2004.

E X E C U T I V E S O F S B C A N D I T S S U B S I D I A R I E S
SBC Senior ExecutivesEdward E. Whitacre Jr., 62Chairman & Chief Executive OfficerSBC Communications Inc.
John H. Atterbury III, 55Group President-OperationsSBC Communications Inc.
James W. Callaway, 57Group President SBC Communications Inc.
William M. Daley, 55PresidentSBC Communications Inc.
James D. Ellis, 60Senior Executive Vice President & General CounselSBC Communications Inc.
Karen E. Jennings, 53Senior Executive Vice President-Human Resources & CommunicationsSBC Communications Inc.
James S. Kahan, 56Senior Executive Vice President-Corporate DevelopmentSBC Communications Inc.
Forrest E. Miller, 51Group President-Corporate PlanningSBC Communications Inc.
John T. Stankey, 41Senior Executive Vice President & Chief Information OfficerSBC Communications Inc.
Randall L. Stephenson, 43Senior Executive Vice President & Chief Financial OfficerSBC Communications Inc.
Rayford Wilkins, Jr., 52Group President-SBC Marketing & SalesSBC Communications Inc.
Other Executives
Dorothy T. Attwood, 44Senior Vice President-Federal Regulatory Strategy & IntegrationSBC Telecommunications, Inc.
Terry D. Bailey, 47President-Consumer MarketsSBC Southwest
William A. Blase, Jr., 48President & Chief Executive OfficerSBC Southwest
Kirk R. Brannock, 46 President-Network ServicesSBC Midwest
Cynthia J. Brinkley, 44President-MissouriSBC Missouri
Connie L. Browning, 50President-OhioSBC Ohio
Donald E. Cain, 50President-OklahomaSBC Oklahoma
Ramona S. Carlow, 41Vice President-RegulatoryAffairs & Public PolicySBC East
Louis R. Casali, 52PresidentSBC Advanced Solutions, Inc.
Margaret M. Cerrudo, 55Senior Vice President-Human Resources ServicesSBC Operations, Inc.
Lea Ann Champion, 45Senior Executive Vice President-Chief Marketing OfficerSBC Operations, Inc.
Frederick R. Chang, 48President-Technology StrategySBC Operations, Inc.
David A. Cole, 55President-Industry MarketsSBC Telecommunications, Inc.
George K. Contopoulos, 58Senior Vice President-SBC DISH NetworkSBC Operations, Inc.
Catherine M. Coughlin, 46President-Business Communications ServicesSBC Midwest
Patricia Diaz Dennis, 57Senior Vice President, General Counsel & SecretarySBC West
Richard C. Dietz, 57 President & Chief Executive OfficerSBC Data Services, Inc.
Maurice E. Drilling, 48President-ArkansasSBC Arkansas
James M. Epperson, Jr., 48Senior Vice President-StateLegislative & Political AffairsSBC Telecommunications, Inc.
Robert E. Ferguson, 44President-Global MarketsSBC Operations, Inc.
George S. Fleetwood, 50President-IndianaSBC Indiana
Andrew M. Geisse, 47Senior Vice President-Enterprise Software SolutionsSBC Services, Inc.
Michael N. Gilliam, 51Vice President-Long DistanceCompliance ReliefSBC Telecommunications, Inc.
Ynocencio Gonzalez, 46PresidentSBC Long Distance
Jose M. Gutierrez, 42Senior Vice President-Sales SBC Directory Operations
Michael Q. Hamilton, 48President-Global Markets (West)SBC Operations, Inc.
Timothy S. Harden, 50PresidentSBC Telecom, Inc.
Scott C. Helbing, 49Senior Vice President-Consumer MarketingSBC Operations, Inc.
Carrie J. Hightman, 46 President-IllinoisSBC Illinois
Priscilla L. Hill-Ardoin, 52Senior Vice President-Regulatory ComplianceSBC Telecommunications, Inc.
William C. Huber, 38President-Network ServicesSBC West
John D. Hull, 51Regional President-San DiegoSBC West
Ross K. Ireland, 57 Senior Executive Vice President-Services & Chief Technology OfficerSBC Services, Inc.
Vicki D. Jones, 42Senior Vice President-ProductManagement & DevelopmentSBC Operations, Inc.
Francis J. Jules, 47President-Global Markets (East)SBC Telecom, Inc.
Mark A. Keiffer, 43President-BusinessCommunications ServicesSBC Southwest
David D. Kerr, 51President-KansasSBC Kansas
Jonathan P. Klug, 48 Vice President-Finance SBC International, Inc.
Paul V. La Schiazza, 46President-WisconsinSBC Wisconsin
Linda S. Legg, 53Vice President, General Counsel & SecretarySBC Directory Operations
Michele M. Macauda, 47President & Chief Executive OfficerSBC East
Robin G. MacGillivray, 49President-BusinessCommunications ServicesSBC West
Paul K. Mancini, 57Senior Vice President & Assistant General CounselSBC Telecommunications, Inc.
Mary T. Manning, 53Senior Vice President-Corporate Real EstateSBC Services, Inc.
Cynthia G. Marshall, 44Senior Vice President-Regulatory& Constituency RelationsSBC California
Norma Martinez Lozano, 47President-Diversified BusinessesSBC Operations, Inc.
William B. McCullough, 52Vice President-Competitive AnalysisSBC Telecommunications, Inc.
Shawn M. McKenzie, 45President-SBCI South AfricaSBC International, Inc.
Timothy P. McKone, 39Senior Vice President-Federal RelationsSBC Telecommunications, Inc.
Maureen P. Merkle, 54President-ProcurementSBC Services, Inc.
John T. Montford, 60 President-External AffairsSBC Southwest
Melba Muscarolas, 42Senior Vice President-Legislative AffairsSBC California
Carmen P. Nava, 41President-Consumer MarketsSBC West
Jan L. Newton, 50President-TexasSBC Texas
David C. Nichols, 46Senior Vice President-External Affairs-SouthSBC California
Dennis M. Payne, 51President & Chief Executive OfficerSBC Directory Operations
T. Michael Payne, 53Senior Vice President & General CounselSBC Operations, Inc.
Richard P. Resnick, 38President-SBCI MexicoSBC International, Inc.
Christopher T. Rice, 46Senior Vice President-NetworkPlanning & EngineeringSBC Services, Inc.
Alfred G. Richter, Jr., 53Senior Vice President, General Counsel & SecretarySBC Southwest
Joy Rick, 55Vice President & SecretarySBC Communications Inc.
Peter A. Ritcher, 43Vice President-Corporate FinanceSBC Communications Inc.
A. Dale Robertson, 55Executive Vice President-StandardizationSBC Operations, Inc.
Michael A. Rodriguez, 53Senior Vice President-Human ResourcesSBC Operations, Inc.
Paul R. Roth, 45President-Consumer MarketsSBC Midwest
Mark E. Royse, 44Senior Vice President-Call CenterTransformation ProjectSBC Operations, Inc.
Charles E. Rudnick, 51Senior Vice President-Business Marketing SBC Operations, Inc.
Sylvia I. Samano, 48President-SBC NevadaSBC Nevada
James B. Shelley, 50Senior Vice President-MarketingRegulatory EnablementSBC Operations, Inc.
Charles H. Smith, 60President & Chief Executive OfficerSBC West
James C. Smith, 54Senior Vice President-FCCSBC Telecommunications, Inc.
John J. Stephens, 44Vice President & ControllerSBC Communications Inc.
Joyce M. Taylor, 46Senior Vice President-External Affairs-NorthSBC California
Van H. Taylor, 55President-Network ServicesSBC Southwest
W. Fred Taylor, 57PresidentSBC DataComm, Inc.
Randy J. Tomlin, 44Senior Vice President-Data ServicesSBC Data Services, Inc.
Gail F. Torreano, 53President-MichiganSBC Michigan
Michael J. Viola, 49Vice President-TreasurerSBC Communications Inc.
Joe W. Walkoviak, 56President & Chief Executive OfficerSBC Midwest
Judy W. Walsh, 63Senior Vice President-Government AffairsSBC Telecommunications, Inc.
D. Wayne Watts, 50Senior Vice President & Assistant General CounselSBC Operations, Inc.
Lora K. Watts, 47President-External AffairsSBC West
Stephen G. Welch, 60Senior Executive Vice President-Sales & Customer ExperienceSBC Operations, Inc.
Angiolina M. Wiskocil, 51Senior Vice President-Network Services StaffSBC Operations, Inc.
P A G E 6 2

P A G E 6 3
Toll-Free Stockholder HotlineCall us at 1-800-351-7221 between 8 a.m. and 7 p.m. Central Time Mondaythrough Friday. TDD 1-888-403-9700For help with:• Account inquiries• Requests for assistance, including
stock transfers• Information on The DirectSERVICE™
Investment Program for Shareholdersof SBC Communications Inc. (sponsoredand administered by EquiServe TrustCompany, N.A.)
Written RequestsPlease mail all account inquiries andother requests for assistance regardingyour stock ownership to:
SBC Communications Inc.c/o EquiServe Trust Company, N.A.P. O. Box 43078Providence, RI 02940-3078
Please mail requests for transactionsinvolving stock transfers or accountchanges to:
SBC Communications Inc.c/o EquiServe Trust Company, N.A.P. O. Box 43070Providence, RI 02940-3070
You also may reach the Transfer Agentfor SBC at their e-mail address: [email protected]
The DirectSERVICE™ Investment Programfor Shareholders of SBC CommunicationsInc. is sponsored and administered byEquiServe Trust Company, N.A. Theprogram allows current stockholders toreinvest dividends, purchase additionalSBC stock or enroll in an IndividualRetirement Account.
For more information, call 1-800-351-7221.
Stock Trading InformationSBC is listed on the New York, Chicagoand Pacific stock exchanges as well asThe Swiss Exchange. SBC is traded on theLondon Stock Exchange through theSEAQ International Markets facility.
Ticker symbol (NYSE): SBC
Newspaper stock listing: SBC or SBC Comm
Information on the InternetInformation about SBC is available onthe Internet. Visit our home page on theWorld Wide Web: www.sbc.com.
Annual Meeting The annual meeting of stockholders will be held at 9 a.m. Friday, April 30, 2004, at:
Hyatt on Capitol Square75 E. State St.Columbus, Ohio 43215
Independent AuditorErnst & Young LLP1900 Frost Bank Tower100 W. HoustonSan Antonio, Texas 78205
Requests for 10-K The SBC Form 10-K, filed with theSecurities and Exchange Commission, is available in paper form by request and also is available on our home page on the World Wide Web:www.sbc.com/investor_relations.
Investor RelationsSecurities analysts and other members of the professional financial communitymay call the Investor Relations Hotline:210-351-3327
General Information – Corporate OfficesSBC Communications Inc.175 E. HoustonP. O. Box 2933San Antonio, Texas 78299-2933210-821-4105
Printed on recycled paper
S T O C K H O L D E R I N F O R M A T I O N

175 E. HoustonP. O. Box 2933San Antonio, Texas 78299-2933210-821-4105
SBC Communications Inc.