SBA: Office of Advocacy Research Report - The Effect of ... Effect of Wealth and Race on Start-up...
41
The Effect of Wealth and Race on Start-up Rates by Maritza Salazar (BCT Partners, LLC) Newark, NJ 07103 for Under contract SBAHQ-05-M-0416 Release Date: July 2007 This report was developed under a contract with the Small Business Administration, Office of Advocacy, and contains information and analysis that was reviewed and edited by officials of the Office of Advocacy. However, the final conclusions of the report do not necessarily reflect the views of the Office of Advocacy.
Transcript of SBA: Office of Advocacy Research Report - The Effect of ... Effect of Wealth and Race on Start-up...
The Effect of Wealth and Race on Start-up Rates
by
Maritza Salazar (BCT Partners, LLC)
Newark, NJ 07103
for
Under contract SBAHQ-05-M-0416
Release Date: July 2007
This report was developed under a contract with the Small Business Administration, Office of Advocacy, and contains information and analysis that was reviewed and edited by officials of the Office of Advocacy. However, the final conclusions of the report do not necessarily reflect the views of the Office of Advocacy.

The Effect of Wealth and Race on Start-up RatesBy Maritza Salazar (BCT Partners, LLC), 2007. 35 pagesNewark, NJ 07103 under contract no SBAHQ-05-M-0416
This report was developed under a contract with the Small Business Administration, Office of Advocacy, and contains information and analysis that was reviewed and edited by officials of the Office of Advocacy. However, the final conclusions of the report do not necessarily reflect the views of the Office of Advocacy.
PurposeThe notion that it “takes money to make money” is commonplace in public discourse. Indeed, some researchers find that the ability to start a business would be greatly impaired without some form of financial assets or net wealth. Others, however, have found that some businesses do not require large amounts of start-up capital, and there-fore, one’s financial position has little to do with whether or not an individual is able to start their business.
Understanding the role of wealth in predicting the likelihood of becoming self-employed may be particularly relevant for nascent minority entre-preneurs.
This research uses the Panel Study of Entrepreneurial Dynamics (PSED) to uncover whether wealth affects the start-up outcomes of minorities and nonminorities differently
Overall FindingsAt first glance, net wealth is not found to be relat-ed to the likelihood that an entrepreneur will start a company. However, a more fine-grained analysis shows that net wealth is positively correlated with the probability that a nascent entrepreneur will start a new company if the nascent entrepreneur is in the top 25 percent of the wealth distribution. This research also shows that wealth affects the outcomes of minority entrepreneurs slightly dif-ferently than it influences the outcomes of their white counterparts.
Highlights• The results show that Black and Hispanic
nascent entrepreneurs face greater odds in opening a business than do their nonminority counterparts.
Race is a significant predictor of opening a busi-ness, and the odds of a minority person opening a business are found to be 55 percent lower than those for a nonminority.
• Female nascent entrepreneurs in the sample were also less likely to start a business than males.
• Having a parent who was or is an entrepreneur has no influence on the likelihood of opening a business.
• Those individuals who sought start-up dollars from financial institutions were more likely to oper-ate their business successfully than those who did not seek financial assistance.
• Nascent entrepreneurs with no experience in the industry of their start-ups were less likely to open a business than those with experience.
• Other factors for which the researcher tested hypotheses were also not as important in influenc-ing the likelihood that a nascent entrepreneur will open a business. These include the existence of a business plan, locating in a “high technology state” (California, Massachusetts, or Texas, as defined by the author), the size of the nascent entrepreneur’s household, the number of partners in the start-up, or the level of educational attainment.
• Having a parent who was or is an entrepreneur has no influence on the likelihood of opening a business.
Scope and MethodologyThe authors analyzed the impact of wealth on business creation using a multi-year sample from the PSED where nascent entrepreneurs were inter-viewed in 1998, 1999, 2000, and 2001. Several decisions were made regarding truncating the data sample for the analysis. First, any respondent who reported that a firm would be sharing over 50 percent of the start-up was removed from the
July 2007 No. 307

sample to ensure that the entrepreneurial activity of individuals (and not firms) is being assessed. In addition, based on other studies using the PSED dataset, only respondents between the ages of 25 and 45 were examined. Respondents not within this range were excluded from the sample, as very few were involved in entrepreneurial activity.
To study the relationship between the likeli-hood of opening a new business and underlying factors including race, net wealth, and other per-sonal characteristics, the author estimated a logis-tic regression specification with the binary out-come of whether or not an entrepreneur opened a business at any point during the evaluated years of the study.
This report was peer-reviewed consistent with Advocacy’s data quality guidelines. More infor-mation on this process can be obtained by con-tacting the Director of Economic Research at [email protected] or (202) 205-6533.
Ordering InformationThe full text of this report and summaries of other studies performed under contract with the U.S. Small Business Administration's Office of Advocacy are available on the Internet at www.sba.gov/advo/research. Copies are available for purchase from:
National Technical Information Service5285 Port Royal RoadSpringfield, VA 22161(800) 553-6847 or (703)605-6000TDD: (703) 487-4639www.ntis.govOrder number: PB2007-109051Paper A04 ($29.50)Microfiche A01 ($14.00)CD-ROM A00 ($22.00)Download A00 ($17.95)To receive email notices of Advocacy's news-
letter, press, regulatory news, and research, visit http://web.sba.gov/list. For really simpole syndica-tion, visit www.sba.gov/advo/rsslibrary.html.

The Effect of Wealth and Race on Start-up Rates
by
Maritza Salazar (BCT Partners, LLC)
Newark, NJ 07103
for
Under contract SBAHQ-05-M-0416
Release Date: July 2007
This report was developed under a contract with the Small Business Administration, Office of Advocacy, and contains information and analysis that was reviewed and edited by officials of the Office of Advocacy. However, the final conclusions of the report do not necessarily reflect the views of the Office of Advocacy.

Abstract
This paper, using the PSED, examines the role of net wealth in predicting whether a nascent entrepreneur will open his or her own business. Net wealth is found to increase the likelihood that a nascent entrepreneur will start a new company. The influence of wealth in predicting self-employment nearly doubles if the nascent entrepreneur is in the top 25 percent of the wealth distribution. This research also demonstrates that net wealth affects the start-up rates of minority nascent entrepreneurs and white nascent entrepreneurs differently. These results show that wealth as a predictor of the likelihood that a nascent entrepreneur will open a business may be more complex than previously thought.

INTRODUCTION
By and large, history shows that self-employment is achieved less by racial and ethnic
minorities than by nonminorities. Historical trends of self-employment across racial and
ethnic groups in America illustrate this point very well. Ethnic minorities are those
groups who have shared unique cultural traditions and a heritage that persists across
generations, and that differ from the majority population. Racial groups are determined
by visible features, such as color. White, black, and Indian are examples of racial groups
(Gibbs and Huang, 1989). Quite often, race and ethnicity may overlap (DeVos, 1982). In
any case, the differences in rates of self-employment persist today between racial and
ethnic minorities and their majority counterparts in the United States. For example, the
percentage of employed black and Hispanic people that work in their own businesses is
one-third less than the percentage of self-employed nonminorities (Fairlie, 1999).
The differences in the historical trends of self-employment between racial and
ethnic groups and in rates of entrepreneurship between minorities and nonminorities call
for further investigation. This paper begins to examine these differences by investigating
the role of net wealth in predicting self-employment among a sample of nascent
entrepreneurs, or adults who are attempting to start a new business.
Several competing theories attempt to explain the differential rates of self-
employment between blacks and whites. Some scholars argue that a higher rate of
intergenerational transmission of self-employment in one group compared with the other
may be one potential explanatory factor (Blau and Duncan,1967; Western, 1967).
However, Fairlie and Meyer (1996) show that having a parent who is an entrepreneur
does not explain the current black/white gap in the self-employment rate.

2
Another explanation is that the differences in self-employment rates among racial
and ethnic groups reflect how much disadvantage each racial or ethnic group faces in the
rest of the labor market (Aurand, 1983). The logic behind this argument is that when
faced with times of high unemployment, the discouraged worker could turn to
entrepreneurship as a way to establish financial security (Boyd, 2000). Becoming self-
employed has been proposed as a means of social and economic mobility, providing an
opportunity for people to improve their quality of life (Glazer and Moynihan, 1970;
Light, 1979). Using this explanation, theorists have explained how Asians have
compensated for low levels of education and their resulting disadvantage in the labor
market by opening their own businesses (Conley, 1999). However, this theoretical
explanation seems to hold only for particular ethnic and racial groups. For example, when
we consider that black Americans also face labor market discrimination in the form of
lower wages, we might also expect high rates of entrepreneurship, but this is not the case.
Thus, this explanation for different rates of entrepreneurship holds only for some
populations.
A third explanation offered for the differences in self-employment rates between
racial and ethnic minorities and nonminorities is that racial and ethnic minorities have
faced institutional barriers. Discrimination faced by some racial or ethnic groups in the
housing and credit markets could have a negative impact on rates of self-employment.
Moreover, the past discrimination that ethnic and racial minority groups have
experienced may explain current differences in self-employment. Prior to the civil rights
movement, ethnic and racial minorities were not allowed equal access to opportunities
(Oliver and Shapiro, 1995). Following the civil rights movement, discrimination may still
3
have been a barrier to accessing education, work, or wages (Conley, 1999; Oliver and
Shapiro, 1995). Barriers to accessing opportunities, experienced more by minorities than
by nonminorities, are likely to be part of the reason minorities have fewer businesses.
Differences in net wealth may be another explanation. Net wealth is the value of
all assets minus the liabilities, or debt owed (Conley, 1999). Understanding the role of
wealth in predicting the likelihood of becoming self-employed may be particularly
relevant for nascent minority entrepreneurs, because black Americans and other
minorities tend to have lower levels of wealth than whites, even after controlling for a
number of other socioeconomic factors (Oliver and Shapiro, 1995). Given that black and
Hispanic nascent entrepreneurs are also likely to have lower levels of net wealth than
their white counterparts, it may be expected that becoming self-employed is substantially
more difficult for them.
Net wealth is most likely to be the primary financial resource used to fund start-
ups (Conley, 1999). For this reason, net wealth is the preferred financial variable to
consider, over income, in predicting whether an aspiring entrepreneur will open a
business. It is not likely that income or the flow of money an individual has from his or
her salary, wages, or tips, will be used to start a business, because people do not tend to
figure start-up money into their household budget. Rather, a nascent entrepreneur is likely
to draw from sources of net wealth, including liquid assets from bank accounts, deposits
and stocks as potential start-up money. The importance of net wealth motivates us to
further examine how it is related to the possibilities of a nascent entrepreneur opening a
business.
4
The motivation to examine the role of wealth in determining the likelihood of
starting a business is largely drawn from the idea that it “takes money to make money.”
Without net wealth, it is likely to be very difficult for a nascent entrepreneur to
successfully start his or her own business (Conley, 1999). Difficulty securing money
from banks is one institutional barrier that has been thought to deter minority
entrepreneurs from starting their own businesses (Bates, 1997). With lower levels of
wealth, it can be argued that minority entrepreneurs have had a difficult time reaching the
credit approval standards set by banks and even some governmental business loan
initiatives (Fairlie, 1999).
In support of this argument, some researchers argue that a significant amount of
money is required to purchase the materials necessary to open a business. They argue that
without money, the start-up process will be greatly inhibited (Evans and Jovanovic 1989;
Bates 1997; Blanchflower and Oswald 1998; Fischer and Massey 2000). Support for this
liquidity-constraint perspective is also found in studies showing that individuals are more
likely to become self-employed when they have high net wealth or money from
inheritances (Evans and Leighton, 1989; Fischer and Massey, 2000).
In contrast, other researchers find that financial capital is not the critical element
in predicting the likelihood of starting a business. In particular, Meyer (1990)
demonstrates that the lack of net wealth is not an important barrier to self-employment
for blacks or whites. He reports that 63 percent of nonminority males and 78 percent of
blacks in this sample of business owners responded that they needed less than $5,000 to
start their businesses. Aldrich, Renzulli and Langlon (1998) add to this argument by
demonstrating that nascent entrepreneurs with zero or negative net wealth and nascent
5
entrepreneurs with high net wealth seem equally likely to be approved for loans. Based
on these results, these researchers argue that the credit market is willing to fund
individuals who do not have significant wealth because of the small size of the financial
investment needed to open a small business.
The two sides of the liquidity debate indicate that the role of financial resources in
determining whether or not an individual opens a business is unclear. To elucidate our
understanding of the relationship between wealth and entrepreneurship, this study selects
a different sample than has been used in previous work and also explores different ways
that wealth may influence the performance of minority and nonminority entrepreneurs.
Meyer (1990) draws strong conclusions from his results, but his analysis has
limitations because his sample consisted of individuals who had already started their own
businesses. The consequence is that his results were heavily biased by the sampling frame
of entrepreneurs with successfully opened firms. This study, in contrast, will use a sample
of nascent entrepreneurs, or individuals who are putting effort toward opening a business,
but have not yet done so. The benefit of studying nascent entrepreneurs rather than
business owners is that the influence of wealth on start-up rates can be examined during
the process of business creation.
Not using a sample of successful firms and entrepreneurs is particularly important
for uncovering the differences in performance between minority and white entrepreneurs.
Previous research using the Panel Study of Entrepreneurial Dynamics (PSED) has shown
that blacks and Hispanics express the desire and intent to start their own businesses at far
greater rates than nonminorities. However, in the PSED a larger proportion of whites
compared with blacks and Hispanics actually own their own businesses (Greene, 2004).

6
These results provide reason to believe that black and Hispanic entrepreneurs are “falling
out” during the start-up process, resulting in their much lower rate of self-employment
compared with their white counterparts. Even more startling is the fact that this finding
persists, even though most of the respondents were interested in opening small businesses
that did not require the large amount of start-up capital needed for a larger enterprise.
These findings suggest that it is important to study the effect of wealth on the
likelihood of nascent entrepreneurs opening their own businesses using a sample that
includes entrepreneurs who also drop out or do not achieve the goal of becoming an
entrepreneur. Without including these “failed” entrepreneurs in the research sample, it is
difficult to confidently explain the differences in self-employment rates between minority
and white entrepreneurs because the focus is on a biased successful sample.
We will add to previous work by examining how wealth might affect the start-up
rates of minority and nonminority nascent entrepreneurs. Examining two entrepreneurs,
one black and one white, with the same levels of wealth, will contribute to an
understanding of the effect of wealth on self-employment. It is expected that wealth will
influence the self-employment rates of black and Hispanic entrepreneurs differently from
those of white entrepreneurs. More specifically, we propose that wealth will be used
differently by minority entrepreneurs than it will be used by nonminority entrepreneurs.
The different uses of wealth may stem from the distinct historical experiences that
minority entrepreneurs and white Americans have had in trying to accumulate wealth in
the United States. While ethnic minorities have dealt with low wages and institutional
and legal barriers in their attempts to accumulate net wealth, their white counterparts
have not. Wealth may also be perceived to have different values based on whether the
7
person who possesses the wealth is a minority or nonminority, because of racial
stereotypes and biases people may have.
The analysis of the relationship between wealth and entrepreneurship will go
beyond previous work and examine this relationship using a sample of nascent
entrepreneurs who are aspiring to open their own businesses. This study will also attempt
to uncover whether wealth affects the self-employment rates of minorities and
nonminorities differently.

8
DATA AND METHODS
We conducted this research using the Panel Study of Entrepreneurial Dynamics
(PSED). The PSED is a longitudinal dataset developed by the Entrepreneurial Research
Consortium (ERC). The ERC was interested in understanding entrepreneurship and new
business creation in the United States. Over a period of four years, the ERC created and
administered the PSED, a dataset that identifies and provides insight about the
experiences of nascent entrepreneurs in the process of creating new businesses. Collected
in four different waves or time periods and generating information about the types and
amounts of resources involved in the start-up process, the PSED dataset is particularly
helpful and relevant for examining the role of wealth in the likelihood of a nascent
entrepreneur starting a business.
To identify individuals who were pursuing the creation of a new business, the
ERC researchers used random digit dialing to conduct telephone interviews and to collect
data from a representative sample of the United States population. If participants were
willing to provide their names and contact information, they were offered $25 for both
their participation in the telephone interview and the completion of a follow-up mail
survey questionnaire. After a year of phone calls from 1998 to1999, an initial sample of
31,261 individuals was established. Within this sample, the researchers working to
develop the PSED established two populations of people: nascent entrepreneurs and a
control group of nonnascent entrepreneurs.
Two questions were randomly inserted at different points in the survey and were
used by the ERC to determine whether the respondent qualified as a nascent entrepreneur.
The two questions were: (1) “Are you, alone or with others, now trying to start a
9
business?” and (2) “Are you, alone or with others, now starting a new business or new
venture for your employer?”
If the respondent answered yes to either of these questions, two additional
questions were used to determine whether the respondent was actively involved with the
start-up process, and whether he/she would share ownership in the business. Participants
in the PSED screening were also asked if the start-up had had a positive monthly cash
flow that covered expenses and owner-manager salaries for more than three months. If
the answer was yes, the respondent was considered to be engaged in activity in the infant
stages of an established business and not the start-up of a business. Consequently, this
participant was not included in the dataset used in this study to reflect nascent
entrepreneurs. Respondents who answered no to the questions were included in the study
as nascent entrepreneurs.
In total, more than 800 nascent entrepreneurs were identified through the PSED.
Each participant in the detailed interview process of the PSED was asked a single
question about ethnic identification—if they considered themselves to be white, black,
Hispanic, Native American, or other. In the second wave of data, particular efforts were
made to oversample blacks and Hispanics from the original screening of the United
States population. This oversampling effort enhanced the quality of the data in the
respective groups. The PSED data used in this study, after appropriate weighting,
included 247 respondents who identify as being white and 64 respondents who identify as
being black or Hispanic. Because of the small number of Asian and American Indian
respondents in the sample, they are not included in this analysis.
10
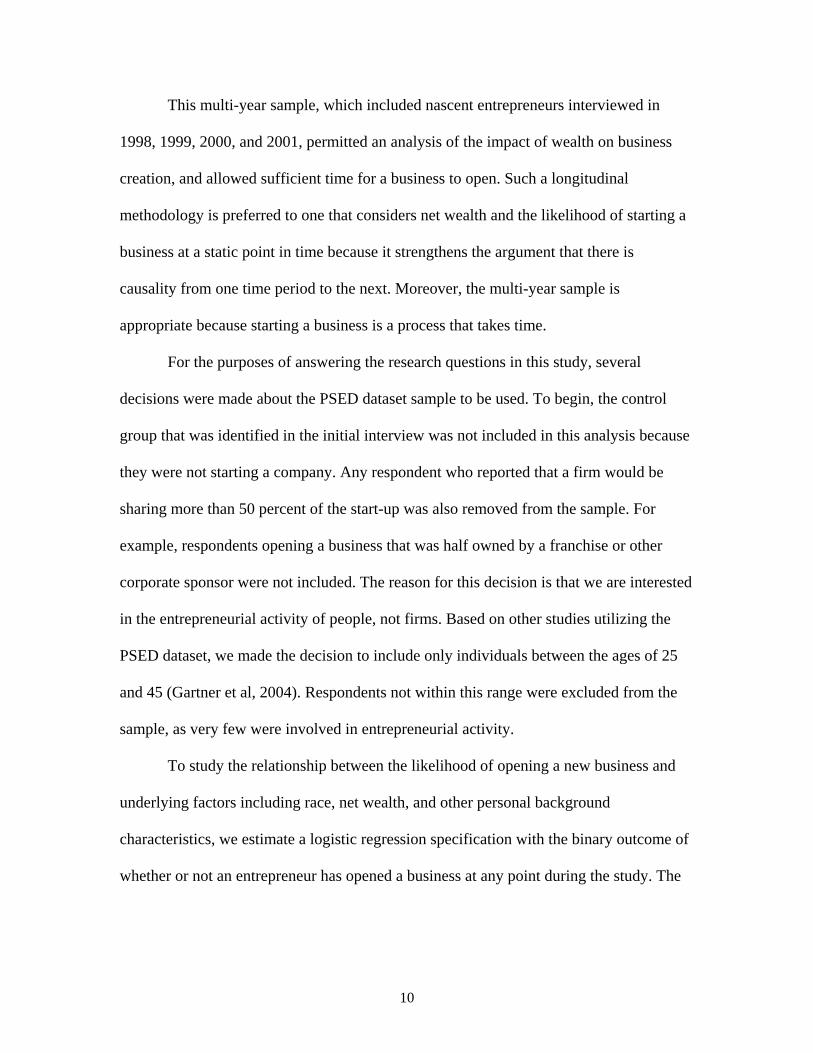
This multi-year sample, which included nascent entrepreneurs interviewed in
1998, 1999, 2000, and 2001, permitted an analysis of the impact of wealth on business
creation, and allowed sufficient time for a business to open. Such a longitudinal
methodology is preferred to one that considers net wealth and the likelihood of starting a
business at a static point in time because it strengthens the argument that there is
causality from one time period to the next. Moreover, the multi-year sample is
appropriate because starting a business is a process that takes time.
For the purposes of answering the research questions in this study, several
decisions were made about the PSED dataset sample to be used. To begin, the control
group that was identified in the initial interview was not included in this analysis because
they were not starting a company. Any respondent who reported that a firm would be
sharing more than 50 percent of the start-up was also removed from the sample. For
example, respondents opening a business that was half owned by a franchise or other
corporate sponsor were not included. The reason for this decision is that we are interested
in the entrepreneurial activity of people, not firms. Based on other studies utilizing the
PSED dataset, we made the decision to include only individuals between the ages of 25
and 45 (Gartner et al, 2004). Respondents not within this range were excluded from the
sample, as very few were involved in entrepreneurial activity.
To study the relationship between the likelihood of opening a new business and
underlying factors including race, net wealth, and other personal background
characteristics, we estimate a logistic regression specification with the binary outcome of
whether or not an entrepreneur has opened a business at any point during the study. The

11
probability of opening a business is estimated as a function of a number of
entrepreneurial characteristics.
12
VARIABLES AND HYPOTHESES
The variables used in this analysis, described below, were all analyzed using the weights
that correspond with the wave that they were asked in.
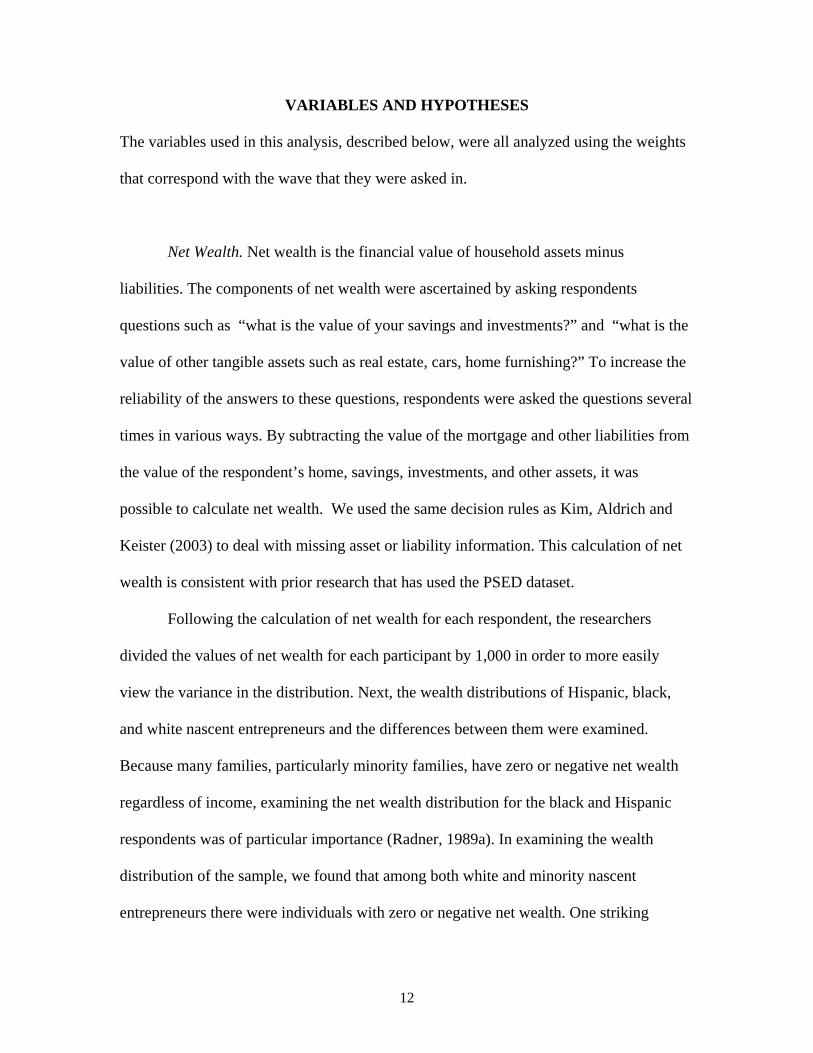
Net Wealth. Net wealth is the financial value of household assets minus
liabilities. The components of net wealth were ascertained by asking respondents
questions such as “what is the value of your savings and investments?” and “what is the
value of other tangible assets such as real estate, cars, home furnishing?” To increase the
reliability of the answers to these questions, respondents were asked the questions several
times in various ways. By subtracting the value of the mortgage and other liabilities from
the value of the respondent’s home, savings, investments, and other assets, it was
possible to calculate net wealth. We used the same decision rules as Kim, Aldrich and
Keister (2003) to deal with missing asset or liability information. This calculation of net
wealth is consistent with prior research that has used the PSED dataset.
Following the calculation of net wealth for each respondent, the researchers
divided the values of net wealth for each participant by 1,000 in order to more easily
view the variance in the distribution. Next, the wealth distributions of Hispanic, black,
and white nascent entrepreneurs and the differences between them were examined.
Because many families, particularly minority families, have zero or negative net wealth
regardless of income, examining the net wealth distribution for the black and Hispanic
respondents was of particular importance (Radner, 1989a). In examining the wealth
distribution of the sample, we found that among both white and minority nascent
entrepreneurs there were individuals with zero or negative net wealth. One striking

13
difference between these two groups is that only 7 percent of the white nascent
entrepreneurs had net wealth equal to or below zero compared with 20 percent of
minority nascent entrepreneurs. Thus, a much larger proportion of the minority
entrepreneurs were likely to have very low levels of net wealth. In analyzing the data, we
did not adjust the distribution of wealth to be greater than zero. In other words, we used
the distribution with negative wealth values for both minority and nonminority
participants.
H1: The likelihood that a nascent entrepreneur starts his or her own business will be positively related to the amount of wealth he or she possesses.
Net Wealth Quartiles. This research aims to analyse the effects of wealth on
becoming self-employed by examining the impact of wealth at all different levels of the
wealth distribution. To do this, we analyze the effect of wealth at the 25th and above the
75th percentile or the first and fourth quartile of the wealth distribution. Each quartile
variable is made by creating a dummy variable that will capture all of the values above a
particular quartile. The purpose of using the 25th and 75th percentile measurements of
wealth is to more closely understand the impact of wealth at different levels. We use the
dummy variables as indicators of wealth levels above the particular quartile breakpoints.
We are able to understand how having wealth above each of these breakpoints influences
the likelihood of becoming self-employed. The fine-grained analysis estimating how the
different levels of wealth influence the likelihood of becoming self-employed indicates
that the impact of wealth does vary depending on whether or not an individual is above
the 75th percentile in the wealth distribution. It may be possible that wealth has a stronger

14
effect in predicting self-employment when an entrepreneur is in the top quartile in the
wealth distribution (Hurst and Lasardi, 2004).
H2: Wealth in the 4th quartile, or above the 75th percentile, in the wealth distribution will have a greater influence on starting a business than lower levels of wealth.
Minority Status. The sample includes 444 white nascent entrepreneurs, 125 black
entrepreneurs and 69 Hispanic entrepreneurs. The small sample of black and Hispanic
respondents made it difficult to be confident in the results comparing these two groups
and the white group of nascent entrepreneurs. Thus, we decided to group Hispanic and
black nascent entrepreneurs together to capture the broader experience of being a
minority entrepreneur. Although grouping black and Hispanic nascent entrepreneurs
together is problematic given that these two groups vary on many different cultural and
social dimensions, the similarities between them relative to white nascent entrepreneurs
validate the decision for grouping. A dummy variable was created to identify whether a
nascent entrepreneur is a minority or a nonminority. To do this, it is necessary to
underwrite the variable and give the dummy variable the value of +1 and -1, rather than 1
and 0. Thus, a white nascent entrepreneur was coded as a -1 and a minority entrepreneur
was coded as a 1.
H3: A white entrepreneur is more likely to open a business than a minority entrepreneur.
Minority Status*Net Wealth. This independent variable is constructed by
interacting wealth with the minority dummy variable to see if wealth affects
entrepreneurship at different rates for different groups. We now show the equivalence
15
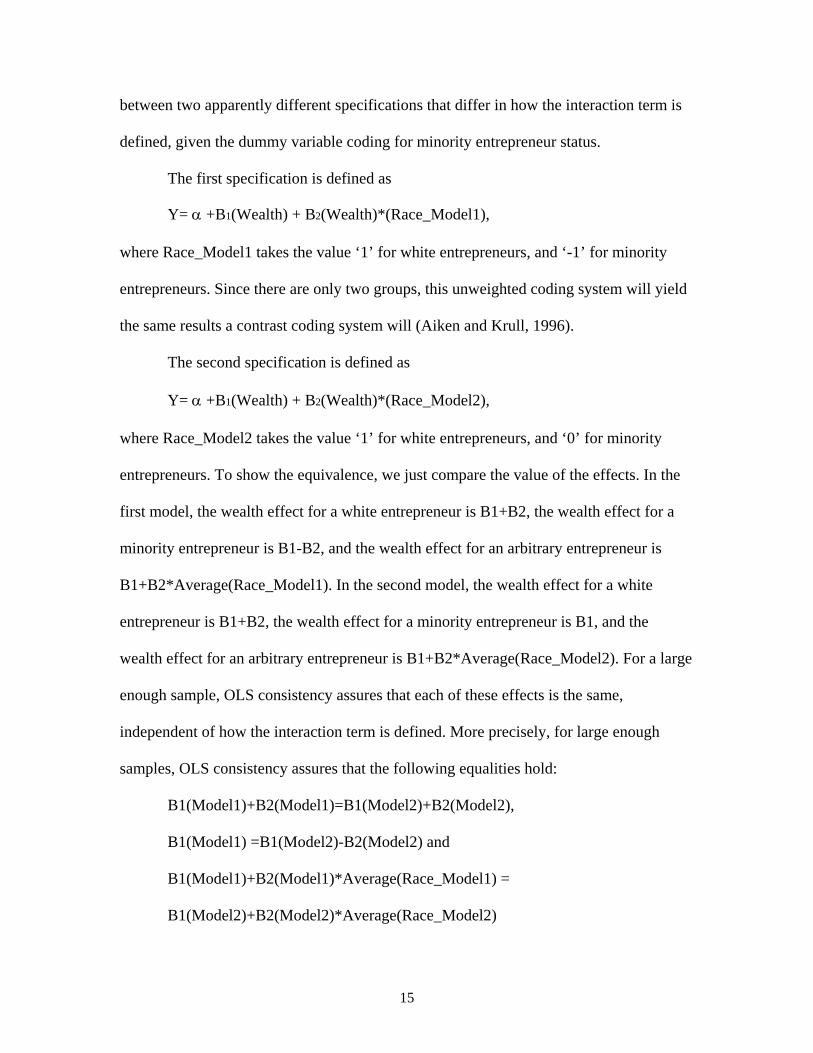
between two apparently different specifications that differ in how the interaction term is
defined, given the dummy variable coding for minority entrepreneur status.
The first specification is defined as
Y= α +B1(Wealth) + B2(Wealth)*(Race_Model1),
where Race_Model1 takes the value ‘1’ for white entrepreneurs, and ‘-1’ for minority
entrepreneurs. Since there are only two groups, this unweighted coding system will yield
the same results a contrast coding system will (Aiken and Krull, 1996).
The second specification is defined as
Y= α +B1(Wealth) + B2(Wealth)*(Race_Model2),
where Race_Model2 takes the value ‘1’ for white entrepreneurs, and ‘0’ for minority
entrepreneurs. To show the equivalence, we just compare the value of the effects. In the
first model, the wealth effect for a white entrepreneur is B1+B2, the wealth effect for a
minority entrepreneur is B1-B2, and the wealth effect for an arbitrary entrepreneur is
B1+B2*Average(Race_Model1). In the second model, the wealth effect for a white
entrepreneur is B1+B2, the wealth effect for a minority entrepreneur is B1, and the
wealth effect for an arbitrary entrepreneur is B1+B2*Average(Race_Model2). For a large
enough sample, OLS consistency assures that each of these effects is the same,
independent of how the interaction term is defined. More precisely, for large enough
samples, OLS consistency assures that the following equalities hold:
B1(Model1)+B2(Model1)=B1(Model2)+B2(Model2),
B1(Model1) =B1(Model2)-B2(Model2) and
B1(Model1)+B2(Model1)*Average(Race_Model1) =
B1(Model2)+B2(Model2)*Average(Race_Model2)

16
H4: Wealth will influence the start-up rates of minority and white nascent entrepreneurs differently.
Parent is an Entrepreneur. The family background of an individual may shape his
or her occupational choices. This basic idea is founded in the belief that the presence or
absence of an entrepreneurial role model may influence the choices an individual makes
about whether or not to pursue self-employment. The link between family influence and
occupational choices was first tested by Blau and Duncan (1967) when they measured
family background by asking respondents if their fathers were self-employed. In the
PSED, the link between family background and occupational choice was explored by
asking respondents, “Did your parents ever work for themselves or run their own
business, alone or together?”
The influence of having a parent that is self-employed may be of particular
importance in explaining the differences in self-employment between minority and white
nascent entrepreneurs. Given that fewer entrepreneurs are black and Hispanic relative to
nonminority entrepreneurs, we might expect that there are fewer entrepreneur role models
in these communities as well. The lack of “similar” role models who have successfully
opened their own businesses may be a barrier to black and Hispanic aspiring
entrepreneurs. If this difference in access to role models does exist, the findings of this
research may shed light not only on the differential rates of starting a business among
nascent entrepreneurs, but also on why there are so few minority entrepreneurs, compared
with white entrepreneurs.

17
H5: Having a parent who owns or owned their own business will increase the likelihood that a nascent entrepreneur will open his or her own business, regardless of the racial background of the individual.
Formal Business Plan. A business plan is a written document that evaluates all
aspects of the economic viability of a business venture and includes a description and
analysis of the business prospects. Having a formal business plan may increase the
likelihood that a nascent entrepreneur will establish a new business. Latham and Yukl
(1975) argue that the psychological processes of rationalizing, analyzing, and establishing
cause and effect connections underlie the process of making formal business plans. More
important, business plans entail opportunity analysis and goal-directed behavior that has
the possibility of leading to improved performance. A dummy variable will be used to
measure whether or not an entrepreneur in the sample has a business plan. Among the
minority nascent respondents in the sample, 65 percent had business plans. In
comparison, 58 percent of white nascent entrepreneurs had business plans.
H6: The relationship between having a formal business plan and opening a business will be strengthened if the nascent entrepreneur has a business plan.
High Technology States. From 1998 to 2000, particular areas around the United
States experienced an economic boom because of the performance of high technology
industries. Areas like Silicon Valley in California may have experienced more economic
growth, resulting in a higher rate of firms being established there. Entrepreneurs who
engaged in the start-up process in the states that experienced the most economic growth
may have found it easier to start their own businesses. To capture this geographic effect,
dummy variables were created for states most affected by the high technology industries.

18
States considered high technology growth states included California, Massachusetts, and
Texas. After an analysis of the PSED sample, it appears that 9 percent of minority
nascent entrepreneurs live in any of the three high technology states, compared with 14
percent of white nascent entrepreneurs.
H7: White and minority entrepreneurs will have higher rates of opening a business in California, Massachusetts, or Texas.
Household Size. The household size of respondents was measured by asking the
question, “How many people live in your household, including yourself, all your
children and any other adults?” This variable is included in the analysis because it is
expected that the structure of the household will directly influence the endowments and
resources available for starting a new business (Brush and Mandolova, 2004, p.40). In
the PSED, the smallest household had 1 person and the largest was a household of 13
people. The mean household size was 3.4 people.
H8: Nascent entrepreneurs with a smaller household size will be more likely to open a business than nascent entrepreneurs with a large household size.
Ask Other or Financial Institutions for Funds: Where nascent entrepreneurs do
not have the financial assets necessary to start a business, they may seek out both
informal and formal sources of financial start-up capital. They may ask their friends and
family for money or they may go to a bank. There may be differences between minority
and nonminority entrepreneurs in the ways capital is raised. In fact, previous research has
documented that ethnic minorities are likely to use informal sources of financial capital,
such as borrowing money from friends and family or practicing bootstrapping methods
rather than seeking formal capital (Tienda, 2001). Despite these potential differences
19
between minority and majority entrepreneurs in the sources of financial capital used, it
may be predicted that seeking funds from others or from financial institutions may
increase the likelihood of opening a business.
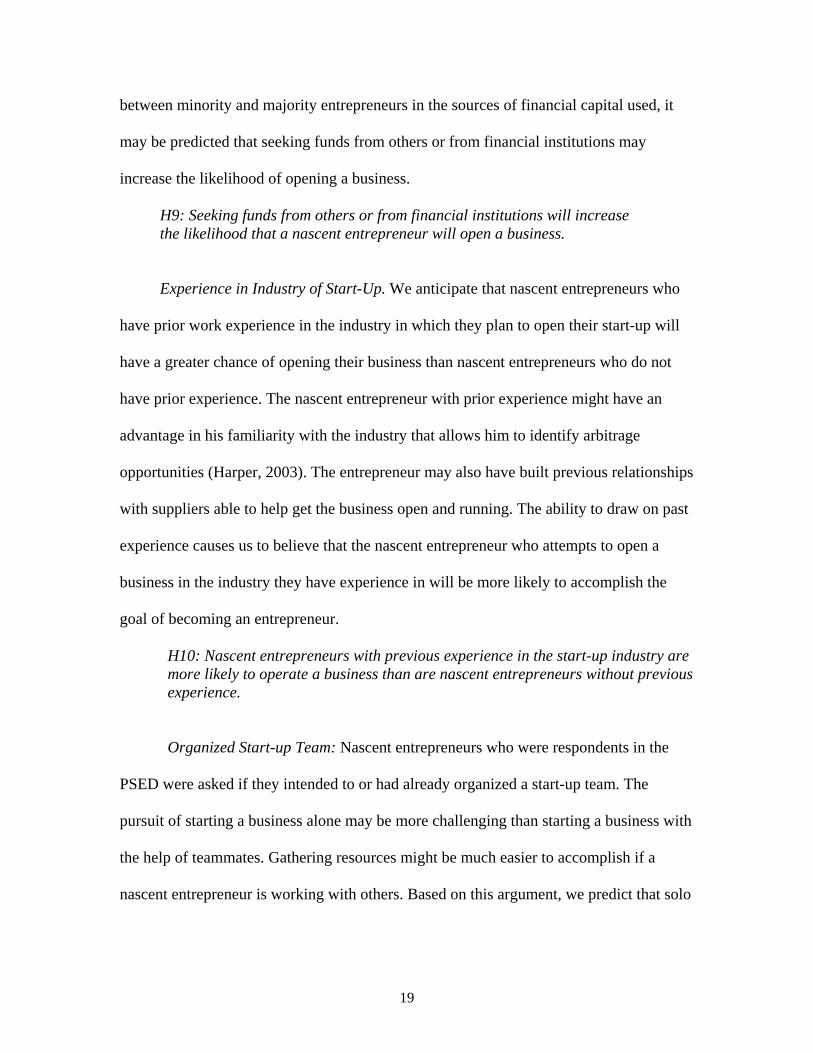
H9: Seeking funds from others or from financial institutions will increase the likelihood that a nascent entrepreneur will open a business. Experience in Industry of Start-Up. We anticipate that nascent entrepreneurs who
have prior work experience in the industry in which they plan to open their start-up will
have a greater chance of opening their business than nascent entrepreneurs who do not
have prior experience. The nascent entrepreneur with prior experience might have an
advantage in his familiarity with the industry that allows him to identify arbitrage
opportunities (Harper, 2003). The entrepreneur may also have built previous relationships
with suppliers able to help get the business open and running. The ability to draw on past
experience causes us to believe that the nascent entrepreneur who attempts to open a
business in the industry they have experience in will be more likely to accomplish the
goal of becoming an entrepreneur.
H10: Nascent entrepreneurs with previous experience in the start-up industry are more likely to operate a business than are nascent entrepreneurs without previous experience.
Organized Start-up Team: Nascent entrepreneurs who were respondents in the
PSED were asked if they intended to or had already organized a start-up team. The
pursuit of starting a business alone may be more challenging than starting a business with
the help of teammates. Gathering resources might be much easier to accomplish if a
nascent entrepreneur is working with others. Based on this argument, we predict that solo

20
nascent entrepreneurs will be less likely to operate a business than nascent entrepreneurs
who are part of a team.
H11: Solo nascent entrepreneurs are less likely to operate a business than are nascent entrepreneurs working as part of a team.
Education. Education is a form of human capital. Education has been found to be
positively correlated with the founding of new businesses (Cooper and Gimeno-Gascon,
1992). However, the influence of education on entrepreneurship is not straightforward
(Bates, 1998). In this study, we predict that having more education will increase the
likelihood of starting a business. In the PSED dataset, we used a variable that categorized
the degree of education into three different groups. Individuals were grouped as having
their highest degree of education from high school, post-high school/college, or post-
college. This result is anticipated for both minority and white nascent entrepreneurs.
H12: Starting a business will be positively related to the level of education of a nascent entrepreneur.
Gender. Differences between men and women in their likelihood of opening a
business may be related to the wealth gap that exists between them (Conley and
Ryvickes, 2005). Conley and Ryvickes (2005) demonstrate that women may have lower
net wealth because of their lower savings rate. They attribute the lower rate of savings to
the increased consumption by women. Based on this finding, it is likely that women will
have a lower rate of founding new businesses. To measure gender using the PSED, a
dummy variable, “ncgender,” was used. Female nascent entrepreneurs in the sample are
coded as a 1 and male nascent entrepreneurs in the sample are coded as a 0. There are
193 males and 118 females in the sample.
21
H13: Women will be less likely to operate a new business compared with men. Dependent Variable: Status of Business. This variable is the dependent variable
used in the binary logistic regression estimation. To complete this analysis, a
dichotomous dependent variable was formed by assessing the likelihood that a nascent
entrepreneur will go on to start a business. More specifically, if an entrepreneur reported
that he or she was opening her own business in wave r, s, or t, the status of the business
would be coded as a 1. If not, the status of the business would be coded as a 2. Again,
these categories are based on questions asked during follow-up interviews that took place
12-18 months after the initial respondent interviews.

22
RESULTS The logistic estimation is found to be statistically significant and accurately predicts a
large proportion of the outcomes correctly. The Hosmer and Lemeshow Test with
significance of p=.063 demonstrates that the model fits the data well because the
significance value is greater than .05. The pseudo r-squared value for the model based on
the Cox and Snell R Square is p=.13. This low value indicates that there is not a large
amount of variability in the dependent variable. These results of the logistic regression
are presented in Table 1. The two outcomes of the binary logistic regression were
whether a new firm had been created or that a new firm had not yet been created in any of
the waves of the PSED.
Hypothesis 1 was not supported. Net wealth is not found to influence the
likelihood that a nascent entrepreneur will become an entrepreneur. The coefficient of net
wealth in this model is not significant (p=.40). A similar coefficient is also found when
estimating the model using the 25th percentile of net wealth (p=.22). The effect of the
dummy variable separating those entrepreneurs with wealth above the 75th percentile
from those below this quartile was found to be significant (p=.00). This result supports
hypothesis 2. These results imply that a person in the top quartile in the wealth
distribution is about four times (Exp(B)=4.01)) as likely to operate a business as a person
in the lower part of the distribution, all other factors being equal. Although the effect of
wealth at the 75th percentile and above is strong, the results show that the net wealth
variable does not have a strong influence on the likelihood of opening a business.
Using the negative values of net wealth in the distribution demonstrates a
significant relationship between opening a business and minority status. The results show

23
that black and Hispanic nascent entrepreneurs are less likely to open a business than their
nonminority counterparts. The negative wealth values of black and Hispanic people in
this dataset are likely to be driving this effect.
If a nascent entrepreneur is white, the likelihood of opening up a business
increases, even when controlling for net wealth (p=.001). This result implies that among a
sample of nascent entrepreneurs, race is still a significant predictor of opening a business,
regardless of the level of wealth. Results support hypothesis 3 and show that the odds of a
minority person opening a business are 55 percent lower than those for a nonminority
individual.
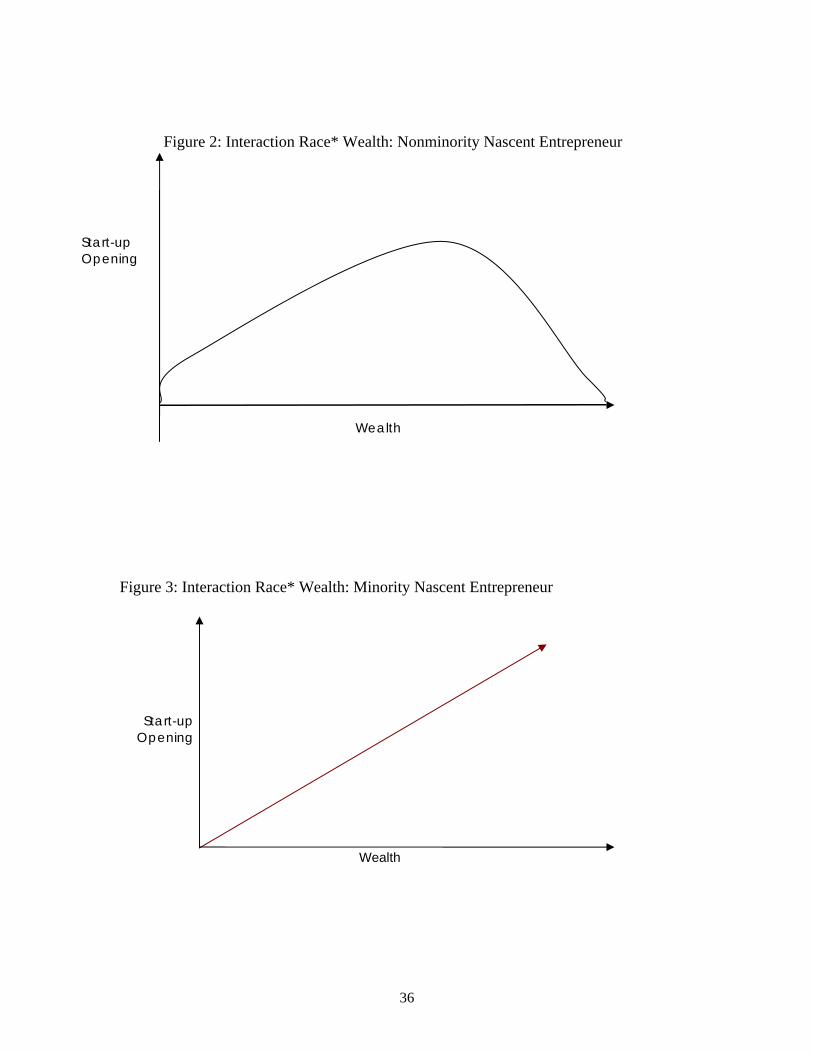
The interaction of net wealth and minority status was also found to be significant
(p=.09). The interpretation of this finding is that wealth influences the outcomes of
nonwhite nascent entrepreneurs differently than it does white nascent entrepreneurs. The
results suggest that white nascent entrepreneurs with high levels of wealth will be less
likely to open a business and that minority nascent entrepreneurs with low levels of
wealth will also have difficulty becoming self-employed. The slopes representing the
interaction between minority and nonminority people and wealth are demonstrated
graphically in Figures 2 and 3.
Among white nascent entrepreneurs, the relationship between the likelihood of
starting a business and net wealth does not appear to be monotonic. Although wealth does
help nonminority nascent entrepreneurs start a business, increasing wealth does not
predict an increase in the probability of opening a business. Rather, at high levels of
wealth the likelihood that a white entrepreneur will open a business decreases. In

24
contrast, among minority nascent entrepreneurs the association between wealth and
starting a business continues to be positive.
Hypothesis 5 was not supported. Having a parent who was or is an entrepreneur
also has no influence on the likelihood of opening a business (p=.20).
Having a business plan does not significantly influence the likelihood that an
entrepreneur will open his or her own business (p=.75). Thus, our predictions about
hypothesis 6 were not supported.
The results also demonstrate that being in a high technology state does not
significantly increase the chance that an entrepreneur is actively or inactively taking steps
to own his or her own business (p=.86).
The size of the household of a nascent entrepreneur also has no effect on whether
or not he or she would open a business (p=.93). Hypothesis 8 was not supported.
Hypothesis 9 was supported. Our results demonstrate that nascent entrepreneurs
who asked others or asked financial institutions for funds are more likely to start a
business than those who do not (p=.06). In fact, nascent entrepreneurs who ask for funds
are 54 percent more likely to start a business than nascent entrepreneurs who do not ask
for funds from others.
Contrary to what might have been expected, nascent entrepreneurs who have
experience in the industry they intend to start their firm in are less likely to open a
business (p=.06). More specifically, nascent entrepreneurs with no experience in the
industry of their start-up were 1.6 times more likely to start a business than nascent
entrepreneurs with experience in the industry of their start-up. Thus, experience does
matter, but not in the way that we had expressed in hypothesis 10.

25
An entrepreneur starting a business alone also was found to have no greater
chance of opening his or her own business than an entrepreneur who was working along
with a team (p=.86). Hypothesis 11 was not supported.
Hypothesis 12 was not supported. The level of education of the entrepreneur has
no effect on whether or not he or she will open a business (p=.386)
Gender was found to be slightly related to the likelihood that a nascent
entrepreneur would start a business during one of the waves of the PSED. Although only
significant at the 10 percent level (p=.09), the results demonstrate that a female nascent
entrepreneur will be .62 times less likely to open a business compared with a male
nascent entrepreneur. Hypothesis 13 was supported.
26
DISCUSSION
This research examined the role of wealth in in the different rates of self-employment of
minority and white nascent entrepreneurs. Previous findings about the effect of wealth on
starting a business have been inconclusive, with some researchers arguing that liquidity
constraints do not exist, even for individuals with less wealth, while others make
contradictory arguments.
This analysis found that net wealth has a statistically significant association with
being a business owner, contrary to the assertions of the proponents of liquidity constraint
theory. In addition, including wealth in the model does not eliminate the significance of
the minority status of the entrepreneur. Being a minority or a white entrepreneur
continues to influence start-up rates, regardless of net wealth.
The fine-grained analysis breaking wealth into quartiles proved to be a fruitful
exercise. By examining the effect of wealth at different levels, we are able to demonstrate
that different levels of wealth predict different start-up rates. More specifically,
entrepreneurs who have wealth in the top 25 percent of the wealth distribution are much
more likely to open a business regardless of their racial background. Wealth does not
seem to have an effect on the likelihood of opening a business, as the bottom quartile of
wealth was found to have no predictive power on the dependent variable. This finding
implies that wealth as a predictor of the likelihood of creating a business may not vary
much within the lower points in the wealth distribution.
Most surprising is the finding that wealth affects the start-up rates of minority
nascent and white nascent entrepreneurs in different ways. Among white nascent
entrepreneurs, having a low level of wealth was found to be positively associated with

27
starting a business. One might have thought that white nascent entrepreneurs with even
higher levels of wealth would be as likely to open a business. However, this was not the
case. In fact, the finding that white nascent entrepreneurs with high levels of wealth are
not likely to operate a business is not a straightforward one. One would expect that high
capital resources would directly lead to successfully opening a business.
The opposite was found to be true for minority nascent entrepreneurs. Minority
nascent entrepreneurs with low levels of wealth were found to be more likely to fail in
their attempts to start a business. However, minority entrepreneurs with higher levels of
wealth were found to be likely to open their own business.
An explanation for this counterintuitive finding may be that wealthy nonminority
nascent entrepreneurs may use their wealth during the start-up process less cautiously
than do minority entrepreneurs, because they have more financial resources to fall back
on if they encounter difficulties. In contrast, nascent minority entrepreneurs are likely to
have fewer financial resources to fall back on, and may make more careful use of the
resources they have at their disposal.
Being in a high technology state did not have a significant influence on the
likelihood that an entrepreneur would start a business. This finding may indicate that
some small business entrepreneurs may not benefit from the high levels of business
growth in these areas. The large number of new firms may have increased the
competition, thus making it more difficult for start-ups to be successful in these areas.
Having a formal business plan was not found to be related to starting a business.
One reason for this finding is that a formal business plan may serve as a symbol of intent,
but may not accurately predict actual performance. Thus, a formal business plan may

28
provide other people with an idea of whether or not the nascent entrepreneur might be
successful, but there is no guarantee. Moreover, there may be considerable variation in
the quality of business plans. This variation may make it difficult for financiers to judge
which business plans actually indicate the quality of the start-up and which do not.
Nascent entrepreneurs with parents who were entrepreneurs were no more likely
than nascent entrepreneurs whose parents were not entrepreneurs to start a business.
Previous research has suggested that education can eliminate the positive influence of
having a parent as an entrepreneur (Crosa et al, 2002). It is possible that education
eliminated the significance of having a parent who was an entrepreneur in this study as
well.
The results demonstrated in this study are not without limitations, including the
various problems encountered in the dataset. One problem was attrition. A biased
estimator can result if the reason an entrepreneur leaves the sample is correlated with
idiosyncratic error, like the unobserved factors that change over time and affect whether
an entrepreneur opens a business successfully.

29
CONCLUSION
This paper examines the role of net wealth in predicting if a nascent entrepreneur will
open a business. At first glance, net wealth is not found to be related to the likelihood that
an entrepreneur will start a company. However, a more fine-grained analysis shows that
net wealth is positively correlated with the probability that a nascent entrepreneur will
start a new company if the nascent entrepreneur is in the top 25 percent of the wealth
distribution. This research also shows that wealth affects the business rates of minority
entrepreneurs slightly differently than those of their white counterparts.
These findings imply that the experiences of white and minority nascent
entrepreneurs are different and that the presence of the same resources does not always
result in identical outcomes. Although speculations are made about what factors may
cause the interaction effect of wealth and minority status on the likelihood of opening a
business, further research is needed to uncover the drivers of this effect. In particular,
datasets with a larger sample of minority nascent entrepreneurs may be preferable to the
dataset used here, given the limited sample size. Such a dataset would provide insight
into the relationship between wealth and race that this study only begins to extrapolate.
30
BIBLIOGRAPHY Aldrich, H. E., Renzulli, L. A., & Langton, N. (1998). Passing on privilege: Resources
provided by self-employed parents to their self-employed children. Research in Social Stratification and Mobility, 16, 297-317.
Aurand, H. W. (1983). Self-employment: Last resort of the unemployed. International
Social Science Review, 58, 7-11. Bates, T. M. (1997). Race, self-employment, and upward mobility: An illusive American
dream. Baltimore: Johns Hopkins University Press. Blanchflower, D. G., & Oswald, A. J. (1998). What makes an entrepreneur? Journal of
Labor Economics, 16, 26-60. Blau, P. M., & Duncan, O. D. (1967). The American occupational structure. New York:
Wiley. Boyd, R. L. (2000). Race, labor market disadvantage, and survivalist entrepreneurship:
Black women in the urban North during the Great Depression. Sociological Forum, 15, 647-670.
Brush, C., & Mandolova, T. (2004). Household structure. In W. B. Gartner, K. G. Shaver,
N. M. Carter, & P. D. Reynolds (Eds.), Handbook of entrepreneurial dynamics: The process of business creation in contemporary America (pp. 49-61). Thousand Oaks, CA: Sage.
Conley, D. (1999). Getting into the black: Race, wealth and public policy. Political Science
Quarterly, 114, 595-612. Conley, D. (2000). The racial wealth gap: Implications for philanthropy in the black
community. Nonprofit and Volunteer Sector Quarterly, 29, 530-540. Conley, D., & Ryvicker, M. (2005). The price of female headship: Gender, inheritance
and wealth accumulation in the United States. Journal of Income Distribution, 13, 41-56.
Crosa, B., Aldrich, H., & Keister, L. (2002). Is there a wealth effect? Financial and
human capital as determinants of business startups. In Proceedings of the 22nd Annual Babson Kauffman Entrepreneurship Research Conference 2002: Frontiers of Entrepreneurship Research (pp. 1-13). Babson Park, MA: Babson College.
Dunn, T., & Holtz-Eakin, D. (2000). Financial capital, human capital, and the transition
to self-employment: Evidence from intergenerational links. Journal of Labor Economics, 18, 282-305.

31
Evans, D. S., & Jovanovic, B. (1989). An estimated model of entrepreneurial choice under liquidity constraints. The Journal of Political Economy, 97, 808-827.
Evans, D. S., & Leighton, L. (1989). Some empirical aspects of entrepreneurship.
American Economic Review, 79, 519-535. Fairlie, R. W. (1999). The absence of the African-American owned business: An analysis
of the dynamics of self-employment. Journal of Labor Economics, 17, 80-108. Fischer, M., & Massey, D. (2000). Residential segregation and ethnic enterprise in U.S.
metropolitan areas. Social Problems, 47, 410-424. Gartner, W. B., Carter, N. M., & Reynolds, P. D. (2004). Business start-up activities.
In W. B. Gartner, K. G. Shaver, N. M. Carter, & P. D. Reynolds (Eds.), Handbook of entrepreneurial dynamics: The process of business creation in contemporary America (pp. 285-298). Thousand Oaks, CA: Sage.
Gartner, W. B., Shaver, K. G., Carter, N. M., & Reynolds, P. D. (Eds.) (2004). Handbook
of entrepreneurial dynamics: The process of business creation in contemporary America. Thousand Oaks, CA: Sage.
Glazer, N., & Moynihan, D. P. (1970). Beyond the Melting Pot:The Negroes, Puerto Ricans,
Jews, Italians, and Irish of New York City. 2nd Edition. Cambridge: MIT Press. Harper, D. (2003). Foundations of entrepreneurship and economic development. London
and New York: Routledge. Holtz-Eakin, D., Joulfaian, D., & Rosen, H. S. (1994). Sticking it out: Entrepreneurial
survival and liquidity constraints. Journal of Political Economy, 102, 53-75. Hout, M., & Rosen, H. S. (2000). Self-employment, family background, and race.
Journal of Human Resources, 35, 671-694. Hurst, E., & Lusardi, A. (2004). Liquidity constraints, household wealth and
entrepreneurship. Journal of Political Economy, 112, 319-347. Keister, L. A., & Moller, S. (2000). Wealth inequality in the United States. Annual
Review of Sociology, 26, 63-81. Kim, P. H., Aldrich, H. E., & Keister, L. A. (2004). Household income and net worth. In
W. B. Gartner, K. G. Shaver, N. M. Carter, & P. D. Reynolds (Eds.), Handbook of entrepreneurial dynamics: The process of business creation in contemporary America (pp. 49-61). Thousand Oaks, CA: Sage.
Latham, G. P., & Yukl, G. A. (1975). A review of research on the application of goal
setting in organizations. Academy of Management Journal, 18, 824-845.
32
Light, I., (1979). Disadvantaged minorities in self employment. International Journal of Comparative Sociology, 20(1-2), 31-45.
Oliver, M. L., & Shapiro, T. M. (1995). Black wealth/white wealth. New York:
Routledge, Quadrini, V. (1999). The importance of entrepreneurship for wealth concentration and
mobility. Review of Income and Wealth, 45, 1-19. West, S. G., Aiken, L. S., & Krull, J. L. (1996). Experimental personality designs:
Analyzing. Categorical by continuous variable interactions. Journal of Personality, 64, 1–48.
Western, M. (1994). Class structure and intergenerational class mobility: A comparative
analysis of nation and gender. Social Forces, 73, 101–134.
33
TABLES AND FIGURES
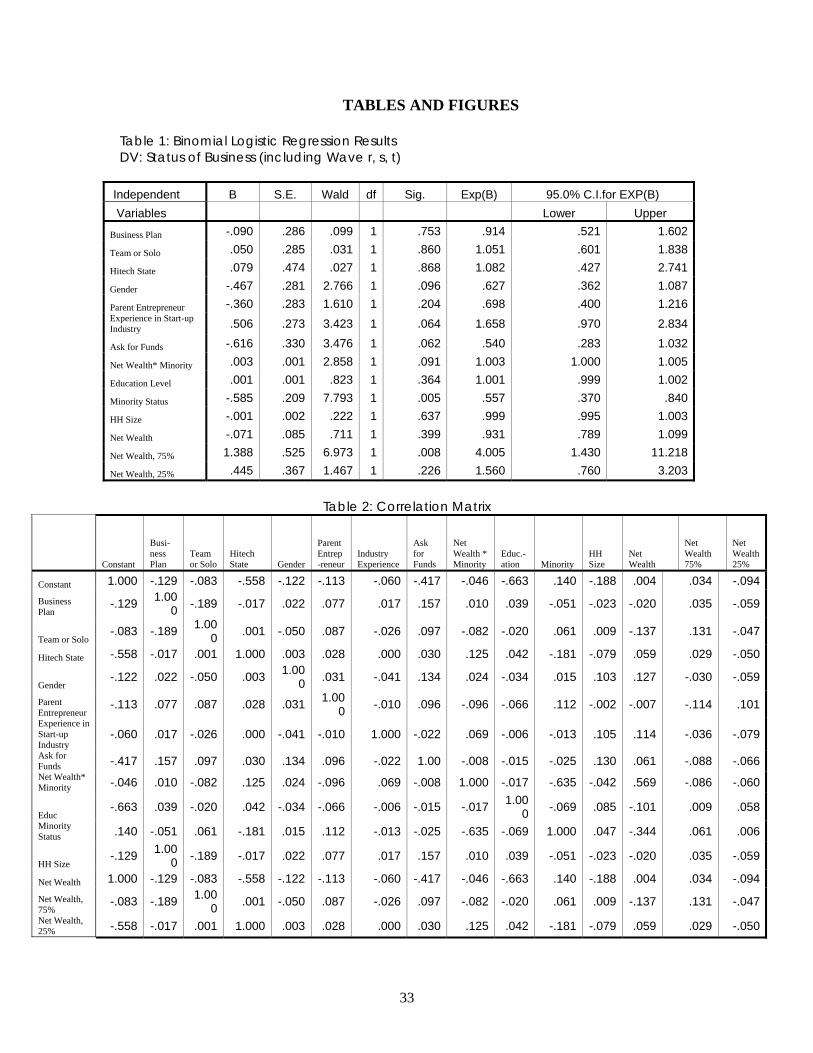
Table 1: Binomial Logistic Regression Results DV: Status of Business (including Wave r, s, t)
Independent B S.E. Wald df Sig. Exp(B) 95.0% C.I.for EXP(B) Variables Lower Upper
Business Plan -.090 .286 .099 1 .753 .914 .521 1.602
Team or Solo .050 .285 .031 1 .860 1.051 .601 1.838
Hitech State .079 .474 .027 1 .868 1.082 .427 2.741
Gender -.467 .281 2.766 1 .096 .627 .362 1.087
Parent Entrepreneur -.360 .283 1.610 1 .204 .698 .400 1.216Experience in Start-up Industry .506 .273 3.423 1 .064 1.658 .970 2.834
Ask for Funds -.616 .330 3.476 1 .062 .540 .283 1.032
Net Wealth* Minority .003 .001 2.858 1 .091 1.003 1.000 1.005
Education Level .001 .001 .823 1 .364 1.001 .999 1.002
Minority Status -.585 .209 7.793 1 .005 .557 .370 .840
HH Size -.001 .002 .222 1 .637 .999 .995 1.003
Net Wealth -.071 .085 .711 1 .399 .931 .789 1.099
Net Wealth, 75% 1.388 .525 6.973 1 .008 4.005 1.430 11.218
Net Wealth, 25% .445 .367 1.467 1 .226 1.560 .760 3.203
Table 2: Correlation Matrix
Constant
Busi-ness Plan
Team or Solo
Hitech State Gender
Parent Entrep-reneur
Industry Experience
Ask for Funds
Net Wealth * Minority
Educ.- ation Minority
HH Size
Net Wealth
Net Wealth 75%
Net Wealth 25%
Constant 1.000 -.129 -.083 -.558 -.122 -.113 -.060 -.417 -.046 -.663 .140 -.188 .004 .034 -.094Business Plan
-.129 1.000 -.189 -.017 .022 .077 .017 .157 .010 .039 -.051 -.023 -.020 .035 -.059
Team or Solo -.083 -.189 1.00
0 .001 -.050 .087 -.026 .097 -.082 -.020 .061 .009 -.137 .131 -.047
Hitech State -.558 -.017 .001 1.000 .003 .028 .000 .030 .125 .042 -.181 -.079 .059 .029 -.050
Gender -.122 .022 -.050 .003 1.00
0 .031 -.041 .134 .024 -.034 .015 .103 .127 -.030 -.059
Parent Entrepreneur
-.113 .077 .087 .028 .031 1.000 -.010 .096 -.096 -.066 .112 -.002 -.007 -.114 .101
Experience in Start-up Industry
-.060 .017 -.026 .000 -.041 -.010 1.000 -.022 .069 -.006 -.013 .105 .114 -.036 -.079
Ask for Funds -.417 .157 .097 .030 .134 .096 -.022 1.00 -.008 -.015 -.025 .130 .061 -.088 -.066Net Wealth* Minority -.046 .010 -.082 .125 .024 -.096 .069 -.008 1.000 -.017 -.635 -.042 .569 -.086 -.060
Educ -.663 .039 -.020 .042 -.034 -.066 -.006 -.015 -.017 1.00
0 -.069 .085 -.101 .009 .058Minority Status .140 -.051 .061 -.181 .015 .112 -.013 -.025 -.635 -.069 1.000 .047 -.344 .061 .006
HH Size -.129 1.00
0 -.189 -.017 .022 .077 .017 .157 .010 .039 -.051 -.023 -.020 .035 -.059
Net Wealth 1.000 -.129 -.083 -.558 -.122 -.113 -.060 -.417 -.046 -.663 .140 -.188 .004 .034 -.094Net Wealth, 75%
-.083 -.189 1.000 .001 -.050 .087 -.026 .097 -.082 -.020 .061 .009 -.137 .131 -.047
Net Wealth, 25% -.558 -.017 .001 1.000 .003 .028 .000 .030 .125 .042 -.181 -.079 .059 .029 -.050

34
Table 3: Descriptive Data
Variable Coding N
Business Status Not opening 157 Opening 134
Checked 130My experience in a particular industry o
Not checked 128
ORGANIZED START-UP TEAM
YES 135
NO 123Gender Male 193 Female 118
YES 163R PARENTS: SELF-EMP OR OWN BUSS NO 147Hi Technology State Hi Tech State 30 Low Tech State 280HAS A BUSINESS PLAN BEEN PREPARED
YES 144
NO 114Education Level UP TO HS DEGREE 83 POST HS+COLL DEGREE 187 POST COLL EXPERIENCE 40Minority No 247 Yes 64Household Structure 1 PERSON 40 (mean=3.4) 2 PEOPLE 65 3 PEOPLE 51 4 PEOPLE 73 5 PEOPLE 47 6 PEOPLE 18 7 PEOPLE 8 8 PEOPLE 2 9 PEOPLE 2 11 PEOPLE 3 13 PEOPLE 1Top Quartile of Net Wealth
Yes 75
No 224Bottom Quartile of Net Wealth
Yes 74
No 224Ask Others or Financial Institutions for Funds
No 247
Yes 64
35
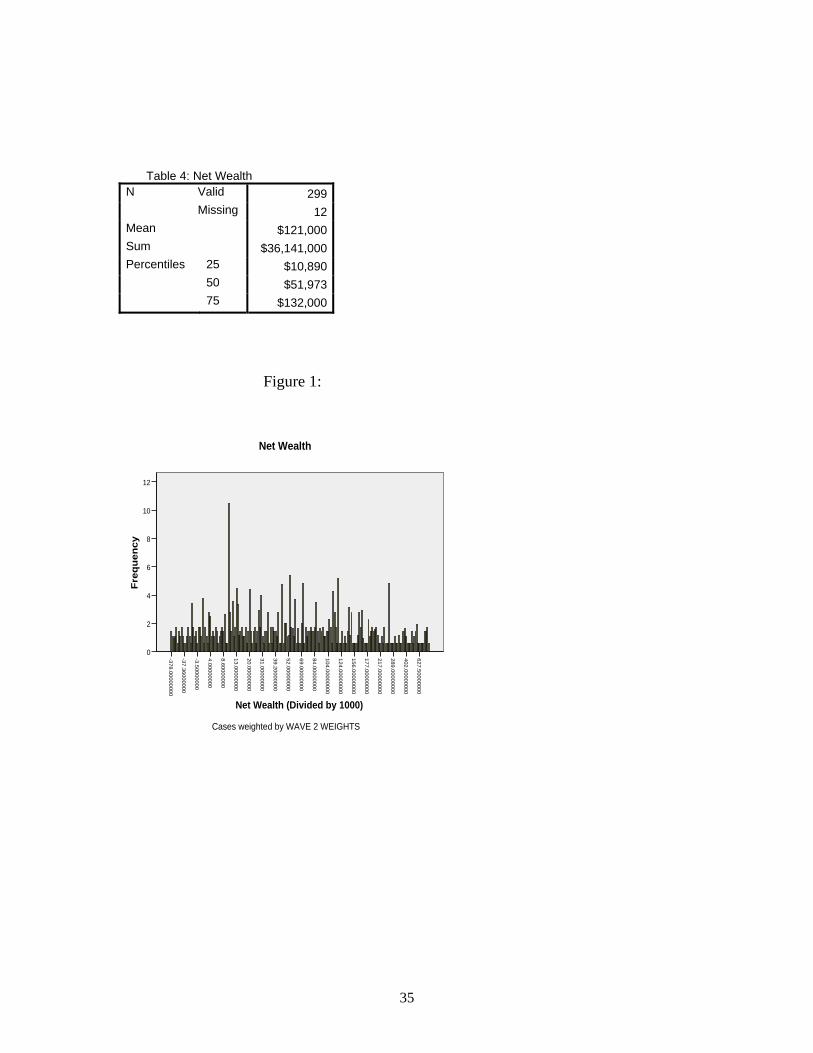
Table 4: Net Wealth N Valid 299 Missing 12Mean $121,000Sum $36,141,000Percentiles 25 $10,890 50 $51,973 75 $132,000
Figure 1: 627.50000000
402.00000000
289.00000000
217.00000000
177.00000000
156.00000000
124.00000000
104.00000000
84.00000000
69.00000000
52.00000000
39.20000000
31.00000000
20.00000000
13.00000000
8.60000000
4.00000000
-3.50000000
-37.36000000
-378.00000000
Net Wealth (Divided by 1000)
12
10
8
6
4
2
0
Freq
uenc
y
Net Wealth
Cases weighted by WAVE 2 WEIGHTS
36
Figure 2: Interaction Race* Wealth: Nonminority Nascent Entrepreneur
Figure 3: Interaction Race* Wealth: Minority Nascent Entrepreneur
Wealth
Wealth
Start-up Opening
Start-up Opening