Say.Do.Perform.ar.barco.com/2017/downloads/Barco-AR17-financial...Financial statements Barco annual...
106
Say.Do. Perform. Financial Statements 2017
Transcript of Say.Do.Perform.ar.barco.com/2017/downloads/Barco-AR17-financial...Financial statements Barco annual...
Say.Do.Perform.Financial Statements 2017

IFRS financial statements
This chapter of the Annual Report contains the IFRS audited
consolidated financial statements including the notes
thereon, prepared in accordance with the International Finan-
cial Reporting Standards as adopted by the European Union.
The chapter ‘Comments on the results’ (see page A/92)
provides an analysis of trends and results of the 2017 finan-
cial year, and is based on the IFRS consolidated financial
statements and should be read in conjunction with these
statements.
Say.Do.Perform.
C/2Barco annual report 2017Financial statements

Table of content
Income statement. . . . . . . . . . . . . . . . . . . . . . . . . . . . . . . . . . . . . . . . . . . . . . . . . . . . . . . . . . . . . . . . . . . . . . . . . . . . . . . . . . . . . . . . . . C/5
Statement of comprehensive income . . . . . . . . . . . . . . . . . . . . . . . . . . . . . . . . . . . . . . . . . . . . . . . . . . . . . . . . . . . . . . . . . . . . . . . . . C/6
Balance sheet. . . . . . . . . . . . . . . . . . . . . . . . . . . . . . . . . . . . . . . . . . . . . . . . . . . . . . . . . . . . . . . . . . . . . . . . . . . . . . . . . . . . . . . . . . . . . . C/7
Cash flow statement . . . . . . . . . . . . . . . . . . . . . . . . . . . . . . . . . . . . . . . . . . . . . . . . . . . . . . . . . . . . . . . . . . . . . . . . . . . . . . . . . . . . . . . . C/8
Changes in equity . . . . . . . . . . . . . . . . . . . . . . . . . . . . . . . . . . . . . . . . . . . . . . . . . . . . . . . . . . . . . . . . . . . . . . . . . . . . . . . . . . . . . . . . . C/10
Significant IFRS accounting principles . . . . . . . . . . . . . . . . . . . . . . . . . . . . . . . . . . . . . . . . . . . . . . . . . . . . . . . . . . . . . . . . . . . . . . . . C/12
IFRS accounting standards adopted as of 2017 . . . . . . . . . . . . . . . . . . . . . . . . . . . . . . . . . . . . . . . . . . . . . . . . . . . . . . . . . . . . . . . . C/18
IFRS accounting standards issued but not yet effective as of 2017. . . . . . . . . . . . . . . . . . . . . . . . . . . . . . . . . . . . . . . . . . . . . . . . C/19
Reclassifications of professional services and customer services overhead. . . . . . . . . . . . . . . . . . . . . . . . . . . . . . . . . . . . . . . .C/22
Critical accounting judgments and key sources of estimation uncertainty . . . . . . . . . . . . . . . . . . . . . . . . . . . . . . . . . . . . . . . .C/23
Notes to the consolidated financial statements
1. Consolidated companies . . . . . . . . . . . . . . . . . . . . . . . . . . . . . . . . . . . . . . . . . . . . . . . . . . . . . . . . . . . . . . . . . . . . . . . . . . . .C/25
2. Operating Segments information . . . . . . . . . . . . . . . . . . . . . . . . . . . . . . . . . . . . . . . . . . . . . . . . . . . . . . . . . . . . . . . . . . . . .C/33
3. Assets held for sale . . . . . . . . . . . . . . . . . . . . . . . . . . . . . . . . . . . . . . . . . . . . . . . . . . . . . . . . . . . . . . . . . . . . . . . . . . . . . . . . .C/40
4. Income from continued operations (EBIT) . . . . . . . . . . . . . . . . . . . . . . . . . . . . . . . . . . . . . . . . . . . . . . . . . . . . . . . . . . . . . C/41
5. Revenues and expenses by nature . . . . . . . . . . . . . . . . . . . . . . . . . . . . . . . . . . . . . . . . . . . . . . . . . . . . . . . . . . . . . . . . . . . .C/46
6. Restructuring and impairment costs . . . . . . . . . . . . . . . . . . . . . . . . . . . . . . . . . . . . . . . . . . . . . . . . . . . . . . . . . . . . . . . . . . C/47
7. Income taxes . . . . . . . . . . . . . . . . . . . . . . . . . . . . . . . . . . . . . . . . . . . . . . . . . . . . . . . . . . . . . . . . . . . . . . . . . . . . . . . . . . . . . .C/48
8. Earnings per share . . . . . . . . . . . . . . . . . . . . . . . . . . . . . . . . . . . . . . . . . . . . . . . . . . . . . . . . . . . . . . . . . . . . . . . . . . . . . . . . . .C/49
9. Investments. . . . . . . . . . . . . . . . . . . . . . . . . . . . . . . . . . . . . . . . . . . . . . . . . . . . . . . . . . . . . . . . . . . . . . . . . . . . . . . . . . . . . . . .C/50
10. Goodwill . . . . . . . . . . . . . . . . . . . . . . . . . . . . . . . . . . . . . . . . . . . . . . . . . . . . . . . . . . . . . . . . . . . . . . . . . . . . . . . . . . . . . . . . . . C/51
11. Capitalized development costs . . . . . . . . . . . . . . . . . . . . . . . . . . . . . . . . . . . . . . . . . . . . . . . . . . . . . . . . . . . . . . . . . . . . . . . C/55
12. Other intangible and tangible fixed assets. . . . . . . . . . . . . . . . . . . . . . . . . . . . . . . . . . . . . . . . . . . . . . . . . . . . . . . . . . . . . .C/56
13. Deferred tax assets – deferred tax liabilities. . . . . . . . . . . . . . . . . . . . . . . . . . . . . . . . . . . . . . . . . . . . . . . . . . . . . . . . . . . . .C/59
14. Inventory . . . . . . . . . . . . . . . . . . . . . . . . . . . . . . . . . . . . . . . . . . . . . . . . . . . . . . . . . . . . . . . . . . . . . . . . . . . . . . . . . . . . . . . . . . C/61
15. Amounts receivable and other non-current assets . . . . . . . . . . . . . . . . . . . . . . . . . . . . . . . . . . . . . . . . . . . . . . . . . . . . . .C/62
16. Net financial cash/debt . . . . . . . . . . . . . . . . . . . . . . . . . . . . . . . . . . . . . . . . . . . . . . . . . . . . . . . . . . . . . . . . . . . . . . . . . . . . . .C/64
17. Other long-term liabilities. . . . . . . . . . . . . . . . . . . . . . . . . . . . . . . . . . . . . . . . . . . . . . . . . . . . . . . . . . . . . . . . . . . . . . . . . . . .C/68
18. Equity attributable to equity holders of the parent. . . . . . . . . . . . . . . . . . . . . . . . . . . . . . . . . . . . . . . . . . . . . . . . . . . . . . .C/69
19. Non-controlling interest . . . . . . . . . . . . . . . . . . . . . . . . . . . . . . . . . . . . . . . . . . . . . . . . . . . . . . . . . . . . . . . . . . . . . . . . . . . . .C/72
20. Trade payables and advances received from customers. . . . . . . . . . . . . . . . . . . . . . . . . . . . . . . . . . . . . . . . . . . . . . . . . . C/74
21. Provisions . . . . . . . . . . . . . . . . . . . . . . . . . . . . . . . . . . . . . . . . . . . . . . . . . . . . . . . . . . . . . . . . . . . . . . . . . . . . . . . . . . . . . . . . . C/74
22. Risk management - derivative financial instruments . . . . . . . . . . . . . . . . . . . . . . . . . . . . . . . . . . . . . . . . . . . . . . . . . . . . .C/79
23. Operating leases . . . . . . . . . . . . . . . . . . . . . . . . . . . . . . . . . . . . . . . . . . . . . . . . . . . . . . . . . . . . . . . . . . . . . . . . . . . . . . . . . . .C/84
24. Rights and commitments not reflected in the balance sheet . . . . . . . . . . . . . . . . . . . . . . . . . . . . . . . . . . . . . . . . . . . . .C/85
C/3 Barco annual report 2017

25. Related party transactions . . . . . . . . . . . . . . . . . . . . . . . . . . . . . . . . . . . . . . . . . . . . . . . . . . . . . . . . . . . . . . . . . . . . . . . . . . . . . .C/85
26. Cash flow statement: effect of acquisitions and disposals . . . . . . . . . . . . . . . . . . . . . . . . . . . . . . . . . . . . . . . . . . . . . . . . . . .C/86
27. Events subsequent to the balance sheet date. . . . . . . . . . . . . . . . . . . . . . . . . . . . . . . . . . . . . . . . . . . . . . . . . . . . . . . . . . . . . .C/88
Auditor’s report . . . . . . . . . . . . . . . . . . . . . . . . . . . . . . . . . . . . . . . . . . . . . . . . . . . . . . . . . . . . . . . . . . . . . . . . . . . . . . . . . . . . . . . . . . .C/89
Supplementary information. . . . . . . . . . . . . . . . . . . . . . . . . . . . . . . . . . . . . . . . . . . . . . . . . . . . . . . . . . . . . . . . . . . . . . . . . . . . . . . . .C/95
Barco NV . . . . . . . . . . . . . . . . . . . . . . . . . . . . . . . . . . . . . . . . . . . . . . . . . . . . . . . . . . . . . . . . . . . . . . . . . . . . . . . . . . . . . . . . . . . . . .C/95
Balance sheet after appropriation . . . . . . . . . . . . . . . . . . . . . . . . . . . . . . . . . . . . . . . . . . . . . . . . . . . . . . . . . . . . . . . . . . . . .C/96
Income statement . . . . . . . . . . . . . . . . . . . . . . . . . . . . . . . . . . . . . . . . . . . . . . . . . . . . . . . . . . . . . . . . . . . . . . . . . . . . . . . . . .C/98
Proposed appropriation of Barco NV result . . . . . . . . . . . . . . . . . . . . . . . . . . . . . . . . . . . . . . . . . . . . . . . . . . . . . . . . . . . . .C/99
Supplementary statements . . . . . . . . . . . . . . . . . . . . . . . . . . . . . . . . . . . . . . . . . . . . . . . . . . . . . . . . . . . . . . . . . . . . . . . . . . . . .C/100
Free Cash Flow . . . . . . . . . . . . . . . . . . . . . . . . . . . . . . . . . . . . . . . . . . . . . . . . . . . . . . . . . . . . . . . . . . . . . . . . . . . . . . . . . . . .C/100
Return on operating Capital Employed. . . . . . . . . . . . . . . . . . . . . . . . . . . . . . . . . . . . . . . . . . . . . . . . . . . . . . . . . . . . . . . . C/102
Glossary. . . . . . . . . . . . . . . . . . . . . . . . . . . . . . . . . . . . . . . . . . . . . . . . . . . . . . . . . . . . . . . . . . . . . . . . . . . . . . . . . . . . . . . . . . . . . . C/103
C/4Barco annual report 2017Financial statements

IN THOUSANDS OF EURO NOTE 2017 2016 2015
Sales 4 1,084,706 1,102,342 1,028,856
Cost of goods sold 4 -680,554 -723,538 -691,091
Gross profit 4 404,152 378,804 337,765
Research and development expenses 4(a) -122,305 -143,362 -150,222
Sales and marketing expenses (a) 4(b) -146,802 -147,088 -137,829
General and administration expenses 4(c) -58,095 -55,122 -50,977
Other operating income (expense) - net 4(d) -3,710 3,325 2,960
Adjusted EBIT (b) 4 73,241 36,557 1,698
Restructuring and impairments 6 -32,404 -12,939 -29,099
Gain on sale building 12.2 - 6,866 -
Other non-operating income/(expense) - 33 35
EBIT 40,836 30,516 -27,366
Interest income 4,666 4,401 7,103
Interest expense -2,653 -3,161 -4,098
Income before taxes 42,849 31,756 -24,360
Income taxes 7 -11,355 -6,345 4,879
Result after taxes 31,494 25,411 -19,481
Share in the result of joint ventures and associates 9 1,290 263 -1,073
Net income/(loss) from continuing operations 32,784 25,674 -20,554
Net income from discontinued operations - - 47,031
Net income 32,784 25,674 26,477
Net income attributable to non-controlling interest 19 8,008 14,652 9,009
Net income attributable to the equity holder of the parent 24,776 11,023 17,468
Net income/(loss) (continuing) attributable to the equity holder of the parent 24,776 11,023 -29,563
Net income (discontinued) attributable to the equity holder of the parent - - 47,031
Earnings per share (in euro) 8 2.01 0.91 1.45
Diluted earnings per share (in euro) 8 1.99 0.88 1.41
Earnings (continuing) per share (in euro) 8 2.01 0.91 -2.45
Diluted earnings (continuing) per share (in euro) 8 1.99 0.88 -2.38
Income statement
(a) Sales and marketing expenses shown here do not correspond to the 2015
financial statements and reflect reclassifications of professional services
and customer services overhead. For more information about the reclass,
see page C/22
(b) Management considers adjusted EBIT to be a relevant performance
measure in order to compare results over the period 2015 to 2017, as it
excludes adjusting items. Adjusting items include restructuring costs and
impairments, one-time gains such as the sale of the headquarter building in
2016 and other non-operating income/(expense).
C/5 Barco annual report 2017

IN THOUSANDS OF EURO 2017 2016 2015
Net income 32,784 25,674 26,477
Exchange differences on translation of foreign operations
Continuing operations -24,201 1,165 11,539
Discontinued operations - - -1,154
Discontinued operations recycled through PL - - 1,154
(a) -24,201 1,165 11,539
Cash flow hedges
Net gain/(loss) on cash flow hedges 535 -280 735
Income tax -142 56 -147
Net gain/(loss) on cash flow hedges continuing operations, net of tax 393 -224 588
Other comprehensive income/(loss) continuing operations, recycled through retained earnings for the period - - -
Other comprehensive income/(loss) to be recycled through profit and loss in subsequent periods -23,808 941 12,127
Remeasurement gains/(losses) on defined benefit plans 5,223 -12,318 -
Deferred tax on remeasurement gains/(losses) on defined benefit plans -2,284 4,187 -
Actuarial gains or losses, net of tax 2,939 -8,131 -
Other comprehensive income/(loss) not to be reclassified to profir or loss in subsequent periods 2,939 -8,131 -
Other comprehensive income/(loss) for the period, net of tax effect -20,869 -7,190 12,127
Attributable to equity holder of the parent -19,574 -6,746 11,757
Attributable to non-controlling interest -1,294 -445 370
Total comprehensive income/(loss) (continuing), for the year, net of tax 11,915 18,484 38,604
Attributable to equity holder of the parent 5,201 4,277 29,224
Attributable to non-controlling interest 6,714 14,207 9,380
Attributable to continuing operations 11,915 18,484 -8,427
Attributable to discontinued operations 0 0 47,031
Statement of comprehensive income
(a) Translation exposure gives rise to non-cash exchange gains/losses. Examples are foreign equity and other long-term investments abroad. These long-term
investments give rise to periodic translation gains/losses that are non-cash in nature until the investment is realized or liquidated. The comprehensive income
line commonly shows a positive result in case the foreign currency appreciates versus the Euro in countries where investments were made and a negative result
in case the foreign currency depreciates.
In 2017, the negative exchange differences from continuing operations in the comprehensive income line were mainly booked on foreign operations held in US
Dollar, Chinese Yuan, Indian Rupee, Hong Kong Dollar and Norwegian Krone.
In 2016, the positive exchange differences from continuing operations in the comprehensive income line were mainly booked on foreign operations held in US
Dollar, Norwegian Krone and Taiwan dollar, partly offset by a negative exchange difference on the Chinese Yuan.
In 2015, the positive exchange differences from continuing operations in the comprehensive income line were mainly booked on foreign operations held in US
Dollar, Chinese Yuan and Indian Rupee.
The accompanying notes are an integral part of this income statement.
C/6Barco annual report 2017Financial statements

The accompanying notes are an integral part of this balance sheet.
IN THOUSANDS OF EURO NOTE 31 DEC 2017 31 DEC 2016 31 DEC 2015
Assets
Goodwill 10 105,385 124,255 132,386
Capitalized development cost 11 - - 22,846
Other intangible assets 12(1) 63,361 75,765 52,628
Land and buildings 12(2) 57,964 53,019 20,221
Other tangible assets 12(2) 47,366 50,916 72,346
Investments 9 7,906 14,460 9,031
Deferred tax assets 13 69,859 89,100 78,031
Other non-current assets 15 12,887 19,112 23,226
Non-current assets 364,729 426,627 410,715
Inventory 14 132,754 166,202 165,960
Trade debtors 15 149,438 188,561 186,910
Other amounts receivable 15 19,368 15,584 26,157
Cash and cash equivalents 16 254,130 353,549 341,277
Prepaid expenses and accrued income 5,041 8,709 9,308
Assets held for sale 3 139,536 - -
Current assets 700,267 732,605 729,612
Total assets 1,064,996 1,159,231 1,140,327
Equity and liabilities
Equity attributable to equityholders of the parent 18 579,449 590,243 597,739
Non-controlling interests 19 14,065 25,244 13,925
Equity 593,514 615,487 611,664
Long-term debts 16 41,036 66,811 79,527
Deferred tax liabilities 13 4,647 8,813 4,462
Other long-term liabilities 17 4,555 11,198 2,839
Long-term provisions (a) 21 24,607 30,824 17,992
Non-current liabilities 74,845 117,647 104,820
Current portion of long-term debts 16 10,000 11,500 10,000
Short-term debts 16 686 2,085 2,124
Trade payables 20 102,943 135,127 139,504
Advances received from customers 20 67,040 109,064 113,874
Tax payables 9,752 13,880 13,016
Employee benefit liabilities 49,983 57,050 48,757
Other current liabilities 10,586 9,684 7,690
Accrued charges and deferred income 18,074 58,050 59,967
Short-term provisions (a) 21 26,904 29,657 28,910
Liabilities directly associated with the assets held for sale 3 100,669 - -
Current liabilities 396,637 426,098 423,842
Total equity and liabilities 1,064,996 1,159,231 1,140,327
Balance sheet
(a) Long-term and short-term provisions presented here do not correspond to the 2016 and 2015 financial statements and reflect reclassifications of (i) the defined
benefit obligations and (ii) the technical warranty provisions. For more information about the long-term portion of these liabilities, see Note 21.
C/7 Barco annual report 2017
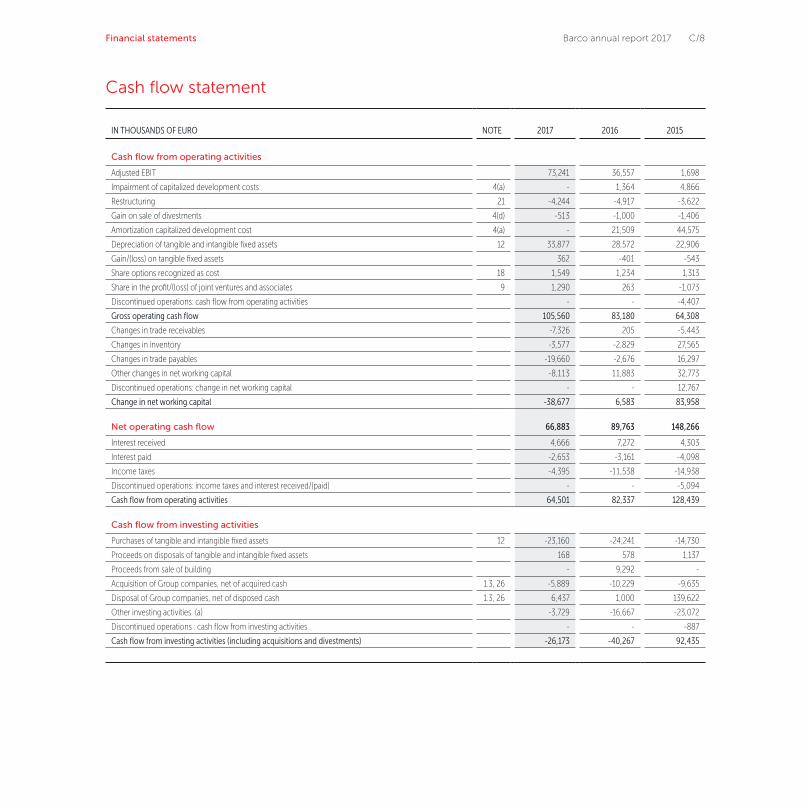
Cash flow statement
IN THOUSANDS OF EURO NOTE 2017 2016 2015
Cash flow from operating activities
Adjusted EBIT 73,241 36,557 1,698
Impairment of capitalized development costs 4(a) - 1,364 4,866
Restructuring 21 -4,244 -4,917 -3,622
Gain on sale of divestments 4(d) -513 -1,000 -1,406
Amortization capitalized development cost 4(a) - 21,509 44,575
Depreciation of tangible and intangible fixed assets 12 33,877 28,572 22,906
Gain/(loss) on tangible fixed assets 362 -401 -543
Share options recognized as cost 18 1,549 1,234 1,313
Share in the profit/(loss) of joint ventures and associates 9 1,290 263 -1,073
Discontinued operations: cash flow from operating activities - - -4,407
Gross operating cash flow 105,560 83,180 64,308
Changes in trade receivables -7,326 205 -5,443
Changes in inventory -3,577 -2,829 27,565
Changes in trade payables -19,660 -2,676 16,297
Other changes in net working capital -8,113 11,883 32,773
Discontinued operations: change in net working capital - - 12,767
Change in net working capital -38,677 6,583 83,958
Net operating cash flow 66,883 89,763 148,266
Interest received 4,666 7,272 4,303
Interest paid -2,653 -3,161 -4,098
Income taxes -4,395 -11,538 -14,938
Discontinued operations: income taxes and interest received/(paid) - - -5,094
Cash flow from operating activities 64,501 82,337 128,439
Cash flow from investing activities
Purchases of tangible and intangible fixed assets 12 -23,160 -24,241 -14,730
Proceeds on disposals of tangible and intangible fixed assets 168 578 1,137
Proceeds from sale of building - 9,292 -
Acquisition of Group companies, net of acquired cash 1.3, 26 -5,889 -10,229 -9,635
Disposal of Group companies, net of disposed cash 1.3, 26 6,437 1,000 139,622
Other investing activities (a) -3,729 -16,667 -23,072
Discontinued operations : cash flow from investing activities - - -887
Cash flow from investing activities (including acquisitions and divestments) -26,173 -40,267 92,435
C/8Barco annual report 2017Financial statements

IN THOUSANDS OF EURO NOTE 2017 2016 2015
Cash flow from financing activities
Dividends paid -23,292 -20,951 -19,364
Dividends received 8 376 -
Capital increase/(decrease) 433 2,498 895
(Acquisition)/sale of own shares 5,314 5,684 -1,744
Proceeds from (+)/Payments (-) of long-term liabilities -17,532 -11,381 8,740
Proceeds from (+), payments of (-) short-term liabilities 1,401 -2,239 -17,980
Dividend distributed to non-controlling interest -17,893 -5,707 -3,006
Capital increase from non-controlling interest - 2,912 406
Cash flow from financing activities -51,562 -28,809 -32,053
Net increase (decrease) in cash and cash equivalents -13,234 13,261 188,821
Cash and cash equivalents at beginning of period 353,549 341,277 145,340
Cash and cash equivalents (CTA) -18,801 -989 7,116
Cash and cash equivalents at end of period (b) 321,514 353,549 341,277
(a) ‘Other investing activities’ includes net effect of capital contributions in and results of other investments (3.8 million euro in 2017, 5.5 million euro in 2016, nil in
2015) (see note 9) and the investment in the One Campus project, the new headquarter building ( 2016: 9.1 million euro; 2015: 23.1 million euro).
(b) Cash and cash equivalents at the end of the period includes the 67.4 million euro cash in BarcoCFG which is classified as held for sale in the balance sheet.
Excluding BarcoCFG, cash and cash equivalents amount to 254.1 million euro (balance sheet).
C/9 Barco annual report 2017

IN THOUSANDS OF EUROShare capital
and premiumRetained earnings
Share-based payments
Cumulative translation
adjustment
Cash flow hedge
reserve Own shares
Equityattributable to equityholders of the parent
Non-controlling
interest Equity
Balance on 1 January 2015 198,083 472,822 5,942 -33,589 -1,857 -53,984 587,415 7,146 594,561
Net income (continuing) attributable to the equity holder of the parent
- -29,563 - - - - -29,563 9,009 -20,554
Net income (discontinued) attributable to the equity holder of the parent
- 47,031 - - - - 47,031 - 47,031
Net income attributable to equityholders of the parent
- 17,468 - - - - 17,468 9,009 26,477
Dividend - -19,364 - - - - -19,364 - -19,364
Dividend distributed to non-controlling interest
- - - - - - - -3,006 -3,006
Capital and share premium increase 895 - - - - - 895 406 1,301
Other comprehensive income (loss) for the period (continuing), net of tax
- - - 11,169 588 - 11,757 370 12,127
Other comprehensive income (loss) for the period, net of tax
- - - 11,169 588 - 11,757 370 12,127
Share-based payment - - 1,313 - - - 1,313 - 1,313
Exercise of options - - -1,286 - - 4,587 3,301 - 3,301
Share buy-back - - - - - -5,046 -5,046 - -5,046
Balance on 31 December 2015 198,978 470,926 5,968 -22,421 -1,269 -54,443 597,739 13,925 611,664
Balance on 1 January 2016 198,978 470,926 5,968 -22,421 -1,269 -54,443 597,739 13,925 611,664
Net income attributable to equityholders of the parent
- 11,023 - - - - 11,023 14,652 25,674
Dividend - -21,188 - - - - -21,188 - -21,188
Dividend distributed to non-controlling interest
- - - - - - - -5,707 -5,707
Capital and share premium increase 2,498 - - - - - 2,498 2,819 5,317
Other comprehensive income (loss) for the period (continuing), net of tax
- -8,131 - 1,610 -224 - -6,746 -445 -7,190
Other comprehensive income (loss) for the period, net of tax
- -8,131 - 1,610 -224 - -6,746 -445 -7,190
Share-based payment - - 1,234 - - - 1,234 - 1,234
Exercise of options - - -972 - - 6,656 5,684 - 5,684Balance on 31 December 2016 201,476 452,629 6,230 -20,811 -1,493 -47,787 590,243 25,244 615,487
Changes in equity
C/10Barco annual report 2017Financial statements

IN THOUSANDS OF EUROShare capital
and premiumRetained earnings
Share-based payments
Cumulative translation
adjustment
Cash flow hedge
reserve Own shares
Equityattributable to equityholders of the parent
Non-Controlling
interest Equity
Balance on 1 January 2017 201,476 452,629 6,230 -20,811 -1,493 -47,787 590,243 25,244 615,487
Net income attributable to equityholders of the parent
- 24,776 - - - - 24,776 8,008 32,784
Dividend - -23,292 - - - - -23,292 - -23,292
Dividend distributed to non controlling interest
- - - - - - - -17,893 -17,893
Capital and share premium increase 433 - - - - - 433 - 433
Other comprehensive income (loss) for the period (continuing), net of tax
- 2,940 - -22,907 393 - -19,573 -1,294 -20,868
Other comprehensive income (loss) for the period, net of tax
- 2,940 - -22,907 393 - -19,573 -1,294 -20,868
Share-based payment - - 1,549 - - - 1,549 - 1,549
Exercise of options - - -268 - - 5,582 5,314 - 5,314
Balance on 31 December 2017 201,908 457,053 7,511 -43,717 -1,100 -42,205 579,449 14,065 593,514
The accompanying notes are an integral part of this statement.
C/11 Barco annual report 2017

1. Accounting principles
1.1. Statement of compliance and basis of presentation
The consolidated financial statements of the Barco group
have been prepared in accordance with International Finan-
cial Reporting Standards (IFRS), as adopted for use by the EU.
All standards and interpretations issued by the International
Accounting Standards Board (IASB) and the International
Financial Reporting Interpretations Committee (IFRIC) effec-
tive year-end 2017 and adopted by the European Union are
applied by Barco.
The consolidated financial statements are presented in thou-
sands of euro and are prepared under the historical cost
convention, except for the measurement at fair value of
investments and derivative financial instruments. The finan-
cial statements were authorized for issue by the board of
directors on 5 February 2018. The chairman has the power
to amend the financial statements until the shareholders’
meeting of 26 April 2018.
1.2. Principles of consolidation
General
The consolidated financial statements comprise the financial
statements of the parent company, Barco NV (registered
office: 35 President Kennedypark, 8500, Kortrijk, Belgium),
and its controlled subsidiaries, after the elimination of all
intercompany transactions
Subsidiaries
Subsidiaries are consolidated from the date the parent obtains
control until the date control ceases. Acquisitions of sub-
sidiaries are accounted for using the purchase method of
accounting. Control exists when Barco is exposed, or has
rights, to variable returns from its involvement with the
investee and has the ability to affect those returns through
its power over the investee. The financial statements of sub-
sidiaries are prepared according to the parent’s company
reporting schedule, using consistent accounting policies.
Significant IFRS accounting principles
Non-controlling interest
Non-controlling Interests represent the portion of profit or
loss and net assets not held by the group and are presented
separately in the income statement and within equity in the
consolidated balance sheet, separately from shareholder’s
equity.
Investments in associated companies and joint ventures
The company has investment in join ventures when it shares
joint control with other investments and it has right to the
net assets of these joint ventures. Investments in associated
companies over which the company has significant influ-
ence (typically those that are 20-50% owned) are accounted
for under the equity method of accounting and are initially
recognized at cost. Thereafter the carrying amount of the
investment is adjusted to recognize changes in the Group’s
share of net assets of the associate since the acquisition date.
The statement of profit or loss reflects the Group’s share of
the results of operations of the associate. Investments in
associated companies and joint ventures are presented as
non-current asset on the face of the balance sheet on the
line ‘investments’.
2. Goodwill
Goodwill represents the excess of the cost of the acquisition
over the fair value of identifiable net assets and contingent
liabilities of a subsidiary or associated company at the date of
acquisition. Goodwill is carried at cost less any accumulated
impairment losses.
3. Research and development costs
Research and development costs are expensed as incurred,
except for development costs, which relate to the design and
testing of new or improved materials, products or techno-
logies, which are capitalized to the extent that it is expected
that such assets will generate future economic benefits and
C/12Barco annual report 2017Financial statements
the recognition criteria of IAS38 are met. Shorter life cycles,
unpredictability of which development projects will be suc-
cessful, and the volatility of technologies and the markets in
which Barco operates led the Board of Directors to conclude
that Barco’s development expenses in 2015, 2016 and 2017
no longer meet the criteria of IAS38.57. As the criteria of
IAS38.57 are no longer fulfilled, capitalization of development
expenses in 2015, 2016 and 2017 was not allowed.
Capitalized development costs are amortized on a systematic
basis over their expected useful lives. General estimate of
useful life is 2 years, unless a longer or shorter period can
be justified.
4. Other intangible assets
Intangible assets acquired separately are capitalized at cost.
Intangible assets acquired as part of a business combination
are capitalized at fair value separately from goodwill if the fair
value can be measured reliably upon initial recognition and
are amortized over their economic lifetimes. Other intangible
assets are amortized on a straight-line basis not exceeding
7 years.
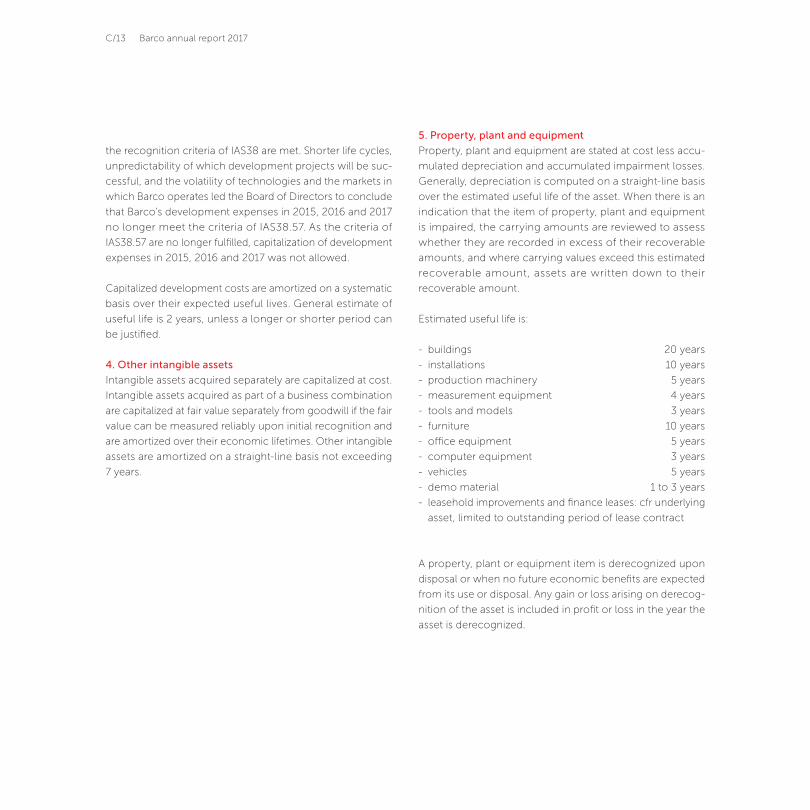
5. Property, plant and equipment
Property, plant and equipment are stated at cost less accu-
mulated depreciation and accumulated impairment losses.
Generally, depreciation is computed on a straight-line basis
over the estimated useful life of the asset. When there is an
indication that the item of property, plant and equipment
is impaired, the carrying amounts are reviewed to assess
whether they are recorded in excess of their recoverable
amounts, and where carrying values exceed this estimated
recoverable amount, assets are written down to their
recoverable amount.
Estimated useful life is:
- buildings 20 years
- installations 10 years
- production machinery 5 years
- measurement equipment 4 years
- tools and models 3 years
- furniture 10 years
- office equipment 5 years
- computer equipment 3 years
- vehicles 5 years
- demo material 1 to 3 years
- leasehold improvements and finance leases: cfr underlying
asset, limited to outstanding period of lease contract
A property, plant or equipment item is derecognized upon
disposal or when no future economic benefits are expected
from its use or disposal. Any gain or loss arising on derecog-
nition of the asset is included in profit or loss in the year the
asset is derecognized.
C/13 Barco annual report 2017
6. Leases
Finance leases, which effectively transfer to the group sub-
stantially all risks and benefits incidental to ownership of the
leased item, are capitalized as property, plant and equip-
ment at the fair value of the leased property, or, if lower,
at the present value of the minimum lease payments. The
corresponding liabilities are recorded as long-term or cur-
rent liabilities depending on the period in which they are
due. Lease interest is charged to the income statement as a
financial cost using the effective interest method. Capitalized
leased assets are depreciated over the shorter of the esti-
mated useful life of the asset and the lease term, if there is
no reasonable certainty that the Group will obtain ownership
by the end of the lease term.
Operating leases, where the lessor effectively retains sub-
stantially all the risks and benefits of ownership over the
lease term, are classified as operating leases. Operating lease
payments are expressed in the income statement on a
straight line basis over the lease term.
7. Investments in available-for-sale financial assets
Investments are treated as financial assets available for sale
and are initially recognized at cost, being the fair value of the
consideration given and including acquisition costs asso-
ciated with the investment. For investments quoted in an
active market, the quoted market price is the best measure
of fair value. For investments not quoted in an active mar-
ket, the carrying amount is the historical cost, if a reliable
estimate of the fair value cannot be made. An impairment
loss is recorded when the carrying amount exceeds the
estimated recoverable amount. These investments are
presented on the balance sheet on the line ‘Investments’.
8. Other non-current assets
Other non-current assets include long-term interest-bearing
receivables and cash guarantees. Such long-term receivables
are accounted for as loans and receivables originated by the
company and are carried at amortized cost. An impairment
loss is recorded when the carrying amount exceeds the
estimated recoverable amount.
9. Inventories
Inventories are stated at the lower of cost or net realiz-
able value. Cost is determined on a first in first out (FIFO)
or weighted average basis. Net realizable value is the
estimated selling price in the ordinary course of business
less the estimated costs of completion and the estimated
costs of completing the sale.
In addition to the cost of materials and direct labor, the
relevant proportion of production overhead is included in
the inventory values.
10. Revenue recognition
Revenue is recognized when it is probable that the econo-
mic benefits will flow to the group and the revenue can be
reliably measured.
For product sales, revenue is recognized when the significant
risks and rewards of ownership of the goods have passed to
the buyer. Sales are recognized when persuasive evidence of
an arrangement exists, delivery has occurred, the fee is fixed
and determinable, and collectability is probable.
For revenue out of projects, the percentage of completion
method is used, provided that the outcome of the project
can be assessed with reasonable certainty. These projects
generally have a lifetime of less than one year.
For sales of services, revenue is recognized by reference to
the stage of completion.
C/14Barco annual report 2017Financial statements

11. Government grants
Government grants related to development projects, for
which costs are capitalized, are classified as deferred income
and recognized as income in proportion to the depreciation
of the underlying fixed assets. Government grants related to
research projects and other forms of government assistance
are recognized as income upon irreversible achievement and
by reference to the relevant expenses incurred.
12. Trade debtors and other amounts receivable
Trade debtors and other amounts receivable are shown on
the balance sheet at nominal value (in general, the original
amount invoiced) less an allowance for doubtful debts. Such
an allowance is recorded in operating income when it is
probable that the company will not be able to collect all
amounts due. Allowances are calculated on an individual
basis, and on a portfolio basis for groups of receivables that
are not individually identified as impaired. The calculation
of the allowances is based on an aging analysis of the trade
debtors.
13. Cash and cash equivalents
Cash and cash equivalents consist of cash on hand and
balances with banks and short-term investments with an
original maturity date or notice period of three months or
less. It is the Group’s policy to hold investments to maturity.
All investments are initially recognized at fair value, which is
the cost at recognition date.
14. Provisions
Provisions are recorded when the group has a present legal
or constructive obligation as a result of a past event, it is
probable that an outflow of resources embodying economic
benefits will be required to settle the obligation and a reliable
estimate can be made to the amount of the obligation.
The group recognizes the estimated liability to repair or
replace products still under warranty at the balance sheet
date. The provision is calculated based on historical experi-
ence of the level of repairs and replacements.
A provision for restructuring is only recognized when the
group has approved a detailed and formal restructuring plan,
and the restructuring has either commenced or has been
announced to those affected by the plan before the balance
sheet date.
On the line item ‘Long-term provisions’, the company presents
the net liability relating to the post-retirement benefit
obligations which includes the Belgian defined-contribution
pension plans that are by law subject to minimum guaranteed
rates of return. Pension legislation was amended at the end
of 2015 and defines the minimum guaranteed rate of return
as a variable percentage linked to government bond yields
observed in the market as from 1 January 2016 onwards.
For 2017 the minimum guaranteed rate of return remains
as in 2016 1.75% on employer contributions and employee
contributions. The old rates (3.25% on employer contributions
and 3.75% on employee contributions) continue to apply to
the accumulated past contributions in the group insurance
as at 31 December 2015. As a consequence, the defined con-
tribution plans have been accounted for as defined benefit
plans in the course of 2016. We refer to note 21 for more
detailed information.
C/15 Barco annual report 2017

15. Equity – costs of an equity transaction
The transaction costs of an equity transaction are accounted
for as a deduction from equity, net of any related income
tax benefit.
16. Interest-bearing loans and borrowings
All loans and borrowings are initially recognized at cost, being
the fair value of the consideration received net of issue costs
associated with the loan/borrowing. Subsequent to initial
recognition, interest-bearing loans and borrowings are stated
at amortized cost using the effective interest rate method.
Amortized cost is calculated by taking into account any issue
costs and any discount or premium on settlement.
17. Trade and other payables
Trade and other payables are stated at fair value, which is the
cost at recognition date.
18. Employee benefits
Employee benefits are recognized as an expense when the
group consumes the economic benefit arising from service
provided by an employee in exchange for employee benefits,
and as a liability when an employee has provided service in
exchange for employee benefits to be paid in the future.
19. Transactions in foreign currencies
Transactions in foreign currencies are recorded at the rates of
exchange prevailing at the date of transaction or at the end
of the month before the date of the transaction. At the end
of the accounting period the unsettled balances on foreign
currency receivables and liabilities are valued at the rates of
exchange prevailing at the end of the accounting period.
Foreign exchange gains and losses are recognized in the
income statement in the period in which they arise.
20. Foreign Group companies
In the consolidated accounts, all items in the profit and loss
accounts of foreign subsidiaries are translated into euro at
the average exchange rates for the accounting period. The
balance sheets of foreign group companies are translated
into euro at the rates of exchange ruling at the year-end. The
resulting exchange differences are classified in a separate
component of ‘other comprehensive income’, until disposal
of the investment.
21. Derivative financial instruments
Derivative financial instruments are recognized initially at
cost, which is the fair value of the consideration given (in the
case of an asset) or received (in the case of a liability) for it.
Subsequent to initial recognition, derivative financial instru-
ments are stated at fair value. The fair values of derivative
interest contracts are estimated by discounting expected
future cash flows using current market interest rates and
yield curve over the remaining term of the instrument. The
fair value of forward exchange contracts is estimated using
valuation techniques which include forward pricing and swap
models at the balance sheet date.
Derivative financial instruments that are either hedging instru-
ments that are not designated or do not qualify as hedges
are carried at fair value with changes in value included in the
income statement.
Where a derivative financial instrument is designated as a hedge
of the variability in cash flows of a recognized asset or liability,
or a highly probable forecasted transaction, the effective part
of any gain or loss on the derivative financial instrument is
recognized directly in ‘other comprehensive income’ with the
ineffective part recognized directly in profit and loss.
C/16Barco annual report 2017Financial statements
22. Income taxes
Current taxes are based on the results of the group compa-
nies and are calculated according to local tax rules.
Deferred tax assets and liabilities are determined, using the
liability method, for all temporary differences arising between
the tax basis of assets and liabilities and their carrying values
for financial reporting purposes. Tax rates used are expected
to apply to the period when the asset is realized or the liability
is settled, based on tax rates and tax laws that have been
enacted or substantially enacted at the balance sheet date.
Deferred tax assets are recognized for all deductible tem-
porary differences, carry-forward of unused tax credits and
unused tax losses, to the extent that it is probable that taxable
profit will be available against which the deductible tempo-
rary differences, carry-forward of unused tax credits and
tax losses can be utilized. The carrying amount of deferred
income tax assets is reviewed at each balance sheet date
and reduced to the extent that it is no longer probable that
sufficient taxable profit will be available to allow all or part
of the deferred income tax asset to be utilized.
Deferred income tax assets and deferred income tax liabil-
ities are offset, if a legally enforceable right exists to set off
current tax assets against current income tax liabilities and
the deferred income taxes relate to the same taxable entity
and the same taxation authority.
23. Impairment of assets
Goodwill is reviewed for impairment at least annually. For
other tangible and intangible assets, at each balance sheet
date, an assessment is made as to whether any indication
exists that assets may be impaired. If any such indication
exists, an impairment test is carried out in order to determine
if and to what extent an impairment is necessary to reduce
the asset to its recoverable amount (which is the higher of (i)
value in use and (ii) fair value less costs to sell). The fair value
less costs to sell is determined as (i) the fair value (that is the
price that would be received to sell an asset in an orderly
transaction in the principal market at the measurement date
under current market conditions) less (ii) the costs to sell
while value in use is the present value of the future cash
flows expected to be derived from an asset. Recoverable
amounts are estimated for individual assets or, if this is not
possible, for the cash-generating unit (CGU) to which the
assets belong. An impairment loss is recognized whenever
the carrying amount of an asset or its cash-generating unit
exceeds its recoverable amount.
Impairment losses are recognized in the income statement.
Reversal of impairment losses recognized in prior years is
included as income when there is an indication that the
impairment losses recognized for the asset are no longer
needed or the need has decreased, except for impairment
losses on goodwill, which are never reversed.
24. Share-based payment
Barco created warrants for staff and non-executive directors
as well as for individuals who play an important role in the
company. According to the publication of IFRS2, the cost of
share-based payment transactions is reflected in the income
statement.
The warrants are measured at grant date, based on the share
price at grant date, exercise price, expected volatility, dividend
estimates, and interest rates. Warrant cost is taken into result
on a straight-line basis from the grant date until the end of
the vesting period.
25. Earnings per share
The group calculates both basic and diluted earnings per
share in accordance with IAS 33, Earnings per share. Under
IAS 33, basic earnings per share are computed using the
weighted average number of shares outstanding during the
period. Diluted earnings per share are computed using the
C/17 Barco annual report 2017

weighted average number of shares outstanding during the
period plus the dilutive effect of warrants outstanding during
the period. As diluted earnings per share cannot be higher
than basic earnings per share, diluted earnings per share are
kept equal to basic earnings per share in case of negative
net earnings.
26. Discontinued operations and non-current
assets held for sale
A discontinued operation is a component of the group that
either has been disposed of, or is classified as held for sale
and represents a separate major line of business and is part
of a single coordinated plan to dispose of a separate major
line of business or is a subsidiary acquired exclusively with
a view to resale.
The group classifies a non-current asset (or disposal group)
as held for sale if its carrying amount will be recovered
principally through a sale transaction rather than through
continuing use. The criteria for held for sale classification is
regarded as met only when the sale is highly probable and
the asset or disposal group is available for immediate sale
in its present condition. Management must be committed
to the sale expected within one year from the date of the
classification. Property, plant and equipment and intangible
assets are not depreciated or amortized once classified as
held for sale.
Immediately before classification as held for sale, the group
measures the carrying amount of the asset (or all the assets
and liabilities in the disposal group) in accordance with appli-
cable IFRSs. Then, on initial classification as held for sale,
non-current assets and disposal groups are recognized at
the lower of their carrying amounts and fair value less costs
to sell. Impairment losses are recognized for any initial or
subsequent write-down of the asset (or disposal group) to
fair value less costs to sell.
IFRS accounting standards adopted as of 2017
The Group applied for the first time certain standards and
amendments, which are effective for annual periods begin-
ning on or after 1 January 2017. The Group has not early
adopted any other standard, interpretation or amendment
that has been issued but is not yet effective.
Although these new standards and amendments apply for
the first time in 2017, they do not have a material impact on
the annual consolidated financial statements of the Group.
The nature and the impact of each of the following new
standards, amendments and/or interpretations are described
below:
• Amendments to IAS 7 Statement of Cash Flows – Disclo-
sure Initiative, effective 1 January 2017
• Amendments to IAS 12 Income Taxes – Recognition
of Deferred Tax Assets for Unrealised Losses, effective
1 January 2017
• Annual Improvements Cycle - 2014-20161, effective
1 January 2017
C/18Barco annual report 2017Financial statements

IFRS accounting standards issued but not yet effective as of 2017
Standards issued but not yet effective
The standards and interpretations that are issued, but not yet
effective, up to the date of issuance of the Group’s financial
statements are disclosed below. The Group intends to adopt
these standards and interpretations, if applicable, when they
become effective.
• Amendments to IFRS 2 Share-based Payment - Clas-
sification and Measurement of Share-based Payment
Transactions1, effective 1 January 2018
• Amendments to IFRS 4 Insurance Contracts – Applying
IFRS 9 Financial instruments with IFRS 4 Insurance Con-
tracts1, effective 1 January 2018
• IFRS 9 Financial Instruments, effective 1 January 2018
• IFRS 15 Revenue from Contracts with Customers, includ-
ing amendments to IFRS 15: Effective date of IFRS 15 and
Clarifications to IFRS 15 Revenue from Contracts with
Customers2, effective 1 January 2018
• IFRS 16 Leases1, effective 1 January 2019
• IFRS 17 Insurance Contracts1, effective 1 January 2021
• Amendments to IAS 40 Investment Property – Transfers
of Investment Property1, effective 1 January 2018
• IFRIC 22 Foreign Currency Transactions and Advance
Consideration1, effective 1 January 2018
• IFRIC 23 Uncertainty over Income Tax Treatments1,
effective 1 January 2019
• Annual Improvements Cycle - 2014-20161, effective
1 January 2018
IFRS 9 Financial Instruments
In July 2014, the IASB issued the final version of IFRS 9 Finan-
cial Instruments that replaces IAS 39 Financial Instruments:
Recognition and Measurement and all previous versions
of IFRS 9. IFRS 9 brings together all three aspects of the
accounting for financial instruments project: classification
and measurement, impairment and hedge accounting.
IFRS 9 is effective for annual periods beginning on or after
1 January 2018, with early application permitted. Except for
hedge accounting, retrospective application is required but
providing comparative information is not compulsory. For
hedge accounting, the requirements are generally applied
prospectively, with some limited exceptions.
The Group will adopt the new standard on the required
effective date and doesn’t expect a significant impact on its
balance sheet and equity.
(a) Classification and measurement
The Group does not expect a significant impact on its balance
sheet or equity on applying the classification and measure-
ment requirements of IFRS 9. It expects to continue measuring
at fair value all financial assets currently held at fair value.
The equity shares in non-listed companies are intended to
be held for the foreseeable future. At the transition date, the
Group has one investment for which it decided to present
fair value changes through profit and loss and thereafter
for every new acquisition the decision will be made on an
instrument by instrument basis.
Loans as well as trade receivables are held to collect contrac-
tual cash flows and are expected to give rise to cash flows
representing solely payments of principal and interest. Thus,
the Group expects that these will continue to be measured at
amortised cost under IFRS 9. Following the assessment of the
1 Not yet endorsed by the EU as at 31 December 2017.2 IFRS 15 including Amendments to IFRS 15: Effective date of IFRS 15
has been endorsed by the EU. The Clarifications to IFRS 15 have not
yet been endorsed by the EU as at 31 December 2017.
C/19 Barco annual report 2017

contractual cash flow characteristics of its debt instruments
the Group concluded that the loans and trade receivables can
be classified at amortised cost measurement under IFRS9.
(b) Impairment
IFRS 9 requires the Group to record expected credit losses
on all of its debt securities, loans and trade receivables, either
on a 12-month or lifetime basis. The Group expects to apply
the simplified approach and record lifetime expected losses
on all trade receivables. The Group has concluded that the
application of the expected credit loss will not have a sig-
nificant impact on equity due to secured nature of its loans
and receivables.
(c) Hedge accounting
The Group believes that all existing hedge relationships that
are currently designated in effective hedging relationships
will still qualify for hedge accounting under IFRS 9. As IFRS
9 does not change the general principles of how an entity
accounts for effective hedges, the Group does not expect a
significant impact as a result of applying IFRS 9.
IFRS 15 Revenue from Contracts with Customers
IFRS 15 was issued in May 2014 and establishes a five-step
model to account for revenue arising from contracts with
customers. Under IFRS 15, revenue is recognised at an
amount that reflects the consideration to which an entity
expects to be entitled in exchange for transferring goods or
services to a customer.
The new revenue standard will supersede all current revenue
recognition requirements under IFRS. Either a full retrospec-
tive application or a modified retrospective application is
required for annual periods beginning on or after 1 January
2018. Early adoption is permitted. The Group plans to adopt
the new standard on the required effective date using the full
retrospective method. The Group is considering the clarifi-
cations issued by the IASB in April 2016 and will monitor any
further developments. During 2017, the Group continued its
assessment started in 2016 and concluded that there will not
be an impact on revenues.
(a) Sale of goods
Contracts with customers in which equipment sale is gene-
rally expected to be the only performance obligation are not
expected to have any impact on the Group’s profit or loss.
The Group expects the revenue recognition to occur at a
point in time when control of the asset is transferred to the
customer, generally on delivery of the goods.
In preparing to IFRS 15, the Group is considering the following
warranty options: the Group provides warranties for general
repairs of which the Group determined that such warran-
ties are assurance-type warranties which will continue to be
accounted for under IAS 37 Provisions, Contingent Liabilities
and Contingent Assets consistent with its current practice.
C/20Barco annual report 2017Financial statements
(b) Rendering of services
The Group provides services within all segments. These
services are sold either on their own in contracts with the
customers or bundled together with the sale of equipment to
a customer. Currently, the Group accounts for the equipment
and service as separate deliverables of bundled sales and
allocates consideration between these deliverables using the
relative fair value approach. The Group recognises service
revenue by reference to the stage of completion. Under IFRS
15, allocation will be made based on relative stand-alone
selling prices. As a result, the allocation of the consideration
and, consequently, the timing of the amount of revenue re-
cognised in relation to these sales may be impacted. The
Group has assessed that the services are satisfied over time
given that the customer simultaneously receives and con-
sumes the benefits provided by the Group. Consequently,
the Group would continue to recognise revenue for these
service contracts/service components of bundled contracts
over time rather than at a point of time.
(c) Presentation and disclosure requirements
IFRS 15 provides presentation and disclosure requirements,
which are more detailed than under current IFRS. The presen-
tation requirements represent a significant change from
current practice and significantly increase the volume of
disclosures required in Group’s financial statements. Many
of the disclosure requirements in IFRS 15 are completely
new. In 2016, the Group developed and started, and in 2017
continued, testing of appropriate systems, internal controls,
policies and procedures necessary to collect and disclose
the required information.
IFRS 16 Leasing
IFRS 16 was issued in January 2016 and it replaces IAS 17
Leases, IFRIC 4 Determining whether an Arrangement con-
tains a Lease, SIC-15 Operating Leases-Incentives and SIC-27
Evaluating the Substance of Transactions Involving the Legal
Form of a Lease. IFRS 16 sets out the principles for the recog-
nition, measurement, presentation and disclosure of leases
and requires lessees to account for all leases under a single
on-balance sheet model similar to the accounting for finance
leases under IAS 17. The standard includes two recognition
exemptions for lessees – leases of ’low-value’ assets (e.g.,
personal computers) and short-term leases (i.e., leases with
a lease term of 12 months or less). At the commencement
date of a lease, a lessee will recognize a liability to make lease
payments (i.e., the lease liability) and an asset representing the
right to use the underlying asset during the lease term (i.e.,
the right-of-use asset). Lessees will be required to separately
recognize the interest expense on the lease liability and the
depreciation expense on the right-of-use asset.
Lessees will be also required to remeasure the lease liability
upon the occurrence of certain events (e.g., a change in
the lease term, a change in future lease payments resulting
from a change in an index or rate used to determine those
payments). The lessee will generally recognize the amount
of the remeasurement of the lease liability as an adjustment
to the right-of-use asset.
Lessor accounting under IFRS 16 is substantially unchanged
from today’s accounting under IAS 17. Lessors will continue
to classify all leases using the same classification principle
as in IAS 17 and distinguish between two types of leases:
operating and finance leases.
C/21 Barco annual report 2017
IFRS 16 also requires lessees and lessors to make more
extensive disclosures than under IAS 17.
IFRS 16 is effective for annual periods beginning on or after
1 January 2019. Early application is permitted, but not
before an entity applies IFRS 15 Revenue from Contract
with Customers. A lessee can choose to apply the standard
using either a full retrospective or a modified retrospective
approach. The standard’s transition provisions permit certain
reliefs.
During 2017, the Group performed a preliminary assessment
of IFRS 16, which is subject to changes arising from a more
detailed ongoing analysis. The Group checked the com-
pleteness of its lease contracts in its contract database and
assessed whether these contracts will meet the definition of
lease in accordance with IFRS16. Based on this analysis, the
Group expects that it will still meet all requirements of the
loan covenants on its existing credit facilities after applying
IFRS16.
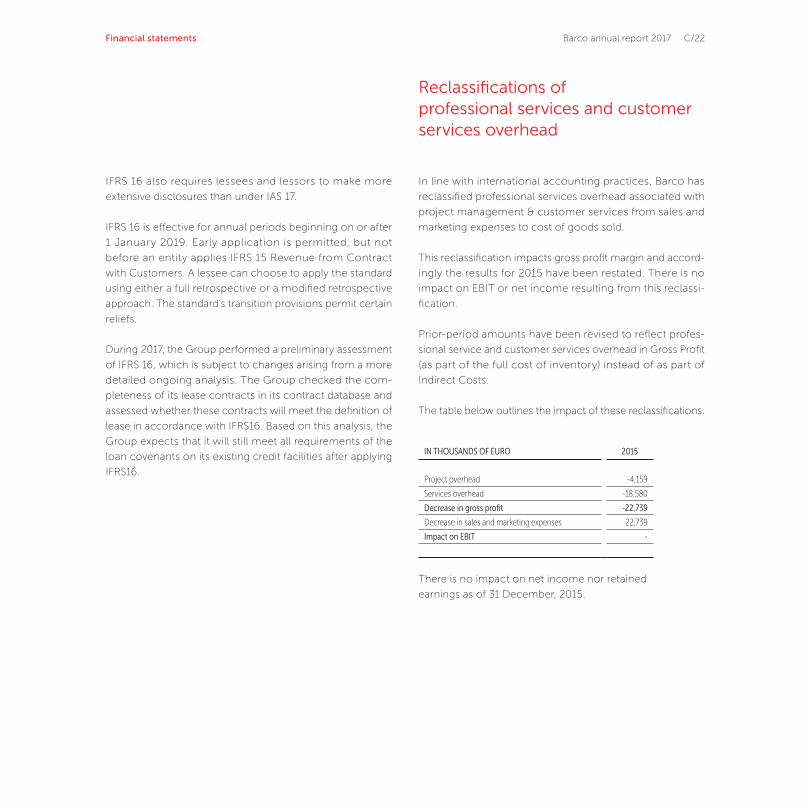
Reclassifications of professional services and customer services overhead
In line with international accounting practices, Barco has
reclassified professional services overhead associated with
project management & customer services from sales and
marketing expenses to cost of goods sold.
This reclassification impacts gross profit margin and accord-
ingly the results for 2015 have been restated. There is no
impact on EBIT or net income resulting from this reclassi-
fication.
Prior-period amounts have been revised to reflect profes-
sional service and customer services overhead in Gross Profit
(as part of the full cost of inventory) instead of as part of
Indirect Costs.
The table below outlines the impact of these reclassifications.
There is no impact on net income nor retained
earnings as of 31 December, 2015.
IN THOUSANDS OF EURO 2015
Project overhead -4,159
Services overhead -18,580
Decrease in gross profit -22,739
Decrease in sales and marketing expenses 22,739
Impact on EBIT -
C/22Barco annual report 2017Financial statements

Critical accounting judgments and key sources of estimation uncertainty
General business risks
We refer to the chapter ‘Risk factors’ on C/87 for an over-
view of the risks affecting businesses of the Barco Group.
Key sources of estimation uncertainty
• Deferred tax assets are recognized for the carry-forward
of unused tax losses and unused tax credits to the extent
that it is probable that future taxable profit will be available
against which the unused tax losses and unused tax credits
can be utilized. In making its judgment, management takes
into account elements such as long-term business strategy
and tax planning opportunities (see note 13 ‘Deferred tax
assets – deferred tax liabilities’).
• Impairment of goodwill: the Group tests the goodwill
for impairment annually or more frequently if there are
indications that goodwill might be impaired (see note
10.’Goodwill’).
• Write offs on inventories: inventories are stated at the
lower cost or net realizable value. The calculation of the
allowance for slow-moving inventory is based on consis-
tently applied write off rules, which depend on both his-
torical and future demand, of which the latter is subject
to uncertainty due to rapid technological changes.
Accounting treatment of development expenses
• Shorter life cycles, unpredictability of which development
projects will be successful, and the volatility of techno-
logies and markets in which Barco operates led the
Board of Directors to conclude that Barco’s development
expenses in 2015, 2016 and 2017 no longer meet the
criteria of IAS38.57. As the criteria of IAS38.57 are no longer
fulfilled, our accounting policy, with respect to research
and development costs, no longer allows the capitalization
of development expenses. Before 2015, development
costs were capitalized in accordance with the accounting
policy.
Capitalization of costs was based on management’s
judgment that technological and economic feasibility
was confirmed, usually when a product development
project reached a defined milestone according to an esta-
blished project management model. In determining the
amounts to be capitalized management made assump-
tions regarding the expected future cash generation of
the project, discount rates to be applied and the expected
period of benefits.
• Impairment of development costs: Barco has tested the
capitalized development for impairment if there are
indications that capitalized development might be
impaired (see note 11. ‘Capitalized development costs’).
Defined benefit obligations
• Defined benefits: the cost of the defined benefit pension
plan (see note 21) and the present value of the pension
obligation are determined using actuarial valuations. An
actuarial valuation involves making various assumptions
that may differ from actual developments in the future.
These include the determination of the discount rate,
future salary increases, mortality rates and future pension
increases. Due to the complexities involved in the
valuation, and its long-term nature, a defined obligation
is highly sensitive to changes in these assumptions.
All assumptions are reviewed on reporting date.
C/23 Barco annual report 2017

Assets held for sale
• Assets held for sale; Barco announced on 4 December
2017, that it has reached an agreement with China Film
Group (CFG) to change the ownership structure of
BarcoCFG for the Chinese cinema market.
Barco will sell 9% of its shares in the BarcoCFG to China
Film Group in exchange for 175 million CNY (or 22.4
million euro), thereby reducing its stake in the subsidiary
from 58% to 49% and by consequence will lose control
once the transaction is completed. The new ownership
structure is expected to take effect by mid-2018 pending
customary regulatory approvals after which Barco, as a
result of the change in control, will report financial results
of BarcoCFG using the equity method.
Operations of BarcoCFG are classified as a disposal group
held for sale, as this will impact the consolidation method.
Barco considered the subsidiary to meet the criteria to
be classified as held for sale at the reporting date for the
following reasons:
• The shares of BarcoCFG are available for immediate
sale and can be sold to the buyer in its current condition.
• The actions to complete the sale were initiated, subject to
Chinese government approval, which is a customary
process and there is no indication that it would stop the
disposal. Therefore the sale is considered as highly
probable.
In connection with the held for sale classification, Barco
allocated goodwill to BarcoCFG. We refer to note 10 for
the judgements applied for this allocation.
For more details on the assets held for sale,
we refer to Note 3.
C/24Barco annual report 2017Financial statements
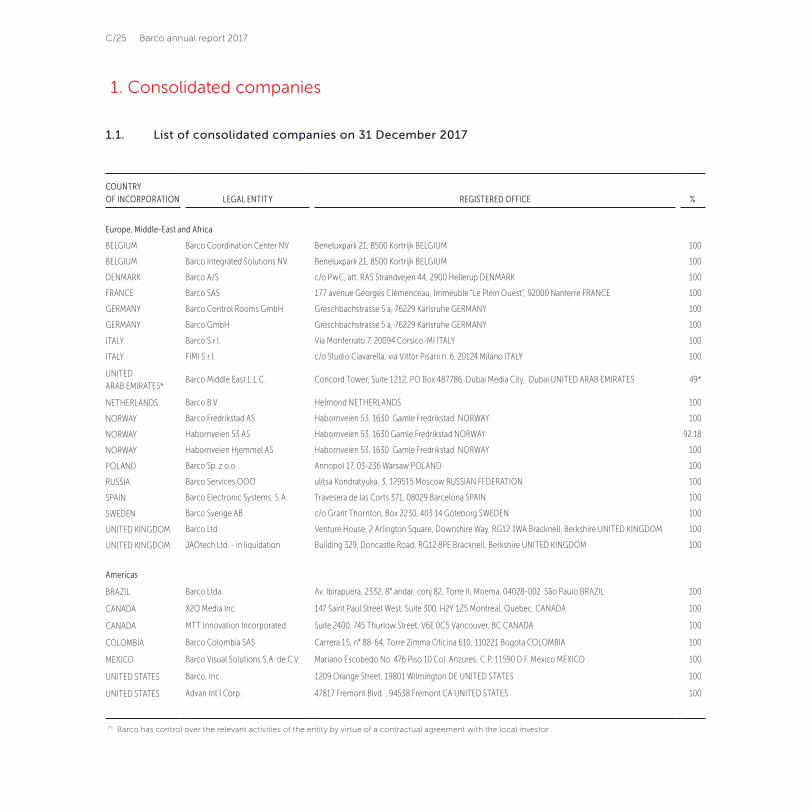
1. Consolidated companies
1.1. List of consolidated companies on 31 December 2017
COUNTRYOF INCORPORATION LEGAL ENTITY REGISTERED OFFICE %
Europe, Middle-East and Africa
BELGIUM Barco Coordination Center NV Beneluxpark 21, 8500 Kortrijk BELGIUM 100
BELGIUM Barco Integrated Solutions NV Beneluxpark 21, 8500 Kortrijk BELGIUM 100
DENMARK Barco A/S c/o PwC, att. RAS Strandvejen 44, 2900 Hellerup DENMARK 100
FRANCE Barco SAS 177 avenue Georges Clémenceau, Immeuble "Le Plein Ouest", 92000 Nanterre FRANCE 100
GERMANY Barco Control Rooms GmbH Greschbachstrasse 5 a, 76229 Karlsruhe GERMANY 100
GERMANY Barco GmbH Greschbachstrasse 5 a, 76229 Karlsruhe GERMANY 100
ITALY Barco S.r.l. Via Monferrato 7, 20094 Corsico-MI ITALY 100
ITALY FIMI S.r.l. c/o Studio Ciavarella, via Vittor Pisani n. 6, 20124 Milano ITALY 100
UNITEDARAB EMIRATES*
Barco Middle East L.L.C. Concord Tower, Suite 1212, PO Box 487786, Dubai Media City, Dubai UNITED ARAB EMIRATES 49*
NETHERLANDS Barco B.V. Helmond NETHERLANDS 100
NORWAY Barco Fredrikstad AS Habornveien 53, 1630 Gamle Fredrikstad NORWAY 100
NORWAY Habornveien 53 AS Habornveien 53, 1630 Gamle Fredrikstad NORWAY 92.18
NORWAY Habornveien Hjemmel AS Habornveien 53, 1630 Gamle Fredrikstad NORWAY 100
POLAND Barco Sp. z o.o. Annopol 17, 03-236 Warsaw POLAND 100
RUSSIA Barco Services OOO ulitsa Kondratyuka, 3, 129515 Moscow RUSSIAN FEDERATION 100
SPAIN Barco Electronic Systems, S.A. Travesera de las Corts 371, 08029 Barcelona SPAIN 100
SWEDEN Barco Sverige AB c/o Grant Thornton, Box 2230, 403 14 Göteborg SWEDEN 100
UNITED KINGDOM Barco Ltd. Venture House, 2 Arlington Square, Downshire Way, RG12 1WA Bracknell, Berkshire UNITED KINGDOM 100
UNITED KINGDOM JAOtech Ltd. - in liquidation Building 329, Doncastle Road, RG12 8PE Bracknell, Berkshire UNITED KINGDOM 100
Americas
BRAZIL Barco Ltda. Av. Ibirapuera, 2332, 8° andar, conj 82, Torre II, Moema, 04028-002 São Paulo BRAZIL 100
CANADA X2O Media Inc. 147 Saint Paul Street West, Suite 300, H2Y 1Z5 Montreal, Quebec CANADA 100
CANADA MTT Innovation Incorporated Suite 2400, 745 Thurlow Street, V6E 0C5 Vancouver, BC CANADA 100
COLOMBIA Barco Colombia SAS Carrera 15, n° 88-64, Torre Zimma Oficina 610, 110221 Bogota COLOMBIA 100
MEXICO Barco Visual Solutions S.A. de C.V. Mariano Escobedo No. 476 Piso 10 Col. Anzures, C.P. 11590 D.F. México MEXICO 100
UNITED STATES Barco, Inc. 1209 Orange Street, 19801 Wilmington DE UNITED STATES 100
UNITED STATES Advan Int'l Corp. 47817 Fremont Blvd. , 94538 Fremont CA UNITED STATES 100
(*) Barco has control over the relevant activities of the entity by virtue of a contractual agreement with the local investor .
C/25 Barco annual report 2017

COUNTRYOF INCORPORATION LEGAL ENTITY REGISTERED OFFICE %
Asia-Pacific
AUSTRALIA Barco Systems Pty. Ltd. 2 Rocklea Drive, VIC 3207 Port Melbourne AUSTRALIA 100
CHINA Barco Trading (Shanghai) Co., Ltd. Rm501, 180 Hua Shen Road, Wai Gao Qiao Free Trade Zone, 200031 Shanghai CHINA 100
CHINA Barco Visual (Beijing) Electronics Co., Ltd. No. 16 Changsheng Road, Chang Ping Park, Zhong Guan Cun Science Park, Chang Ping District, 102200 Beijing CHINA 100
CHINA Barco Visual (Beijing) Trading Co., Ltd. No. 16 Changsheng Road, Chang Ping Park, Zhong Guan Cun Science Park, Chang Ping District, 102200 Beijing CHINA 100
CHINA CFG Barco (Beijing) Electronics Co., Ltd. No. 16 Changsheng Road, Chang Ping Park, Zhong Guan Cun Science Park, Chang Ping District, 102200 Beijing CHINA 58
CHINABarco China Electronic Visualiza-tion Technology (Nanjing) Co., Ltd.
No.1, Hengtong Road, Nanjing development zone, 210038 Nanjing, Jiangsu CHINA 65
HONG KONG Barco Ltd. Suite 2607-2610, 26/F, Prosperity Center, 25 Chong Yip Street, Kwun Tong, Kowloon HONG KONG 100
HONG KONG Barco Visual Electronics Co., Ltd. Suite 2607-2610, 26/F, Prosperity Center, 25 Chong Yip Street, Kwun Tong, Kowloon HONG KONG 100
HONG KONG Barco China (Holding) Ltd. Suite 2607-2610, 26/F, Prosperity Center, 25 Chong Yip Street, Kwun Tong, Kowloon HONG KONG 100
HONG KONG Barco CEC (Hong Kong) Limited Unit 2607-10, 26/F, Prosperity Center, 25 Chong Yip Street, Kwun Tong, Kowloon HONG KONG 100
INDIA Barco Electronic Systems Pvt. Ltd.c/o Perfect Accounting & Shared Services P.Ltd., E-20, 1st & 2nd Floor, Main Market, Hauz Khas, 110016 New Delhi INDIA
100
JAPAN Barco Co., Ltd. Yamato International Bldg 8F, 5-1-1 Heiwajima, Ota-ku, 143-0006 Tokyo JAPAN 100
SOUTH KOREA Barco Ltd. 42 Youngdong-daero 106-gil, Gangnam-gu, 06172 Seoul KOREA, REPUBLIC OF 100
MALAYSIA Barco Sdn. Bhd. No. 13A, Jalan SS21/56B, Damansara Utama, 47400 Petaling Jaya, Selangor MALAYSIA 100
SINGAPORE Barco Singapore Private Limited No. 10 Changi South Lane #04-01, 486162 Singapore SINGAPORE 100
TAIWAN Barco Limited 33F., No. 16, Xinzhan Rd., Banqiao Dist., 220 New Taipei City TAIWAN, PROVINCE OF CHINA 100
TAIWAN Barco Taiwan Technology Ltd. No. 5, Ti Tang Gang Rd., Feng Hua Village, Xin Shi District, 74148 Tainan City TAIWAN, PROVINCE OF CHINA 90
C/26Barco annual report 2017Financial statements

1.2. List of equity accounted companies on 31 December 2017
Exemption of publishing Financial Statements and management report according German legislation §264 Abs. 3 HGB:
Following subsidiary-companies will be released of publishing
their financial statements and management report 2017:
• Barco GmbH
• Barco Control Rooms GmbH
These companies are included in the consolidation scope
of Barco Consolidated 2017 as listed above.
Exemption of publishing Financial Statements and management report according UK legislation section 479A of the Companies Act 2006:
Following subsidiary-companies will be released of publishing
their financial statements and management report 2017:
• Barco Ltd.
COUNTRYOF INCORPORATION LEGAL ENTITY REGISTERED OFFICE %
Americas
UNITED STATES Audience Entertainment LLC 108 West 13th Street, 19801 Wilmington, Delaware UNITED STATES 18.9
UNITED STATES CCO Barco Airport Venture LLC Corporation Trust Center, 1209 Orange Street, 19801 Wilmington-DE UNITED STATES 35
C/27 Barco annual report 2017
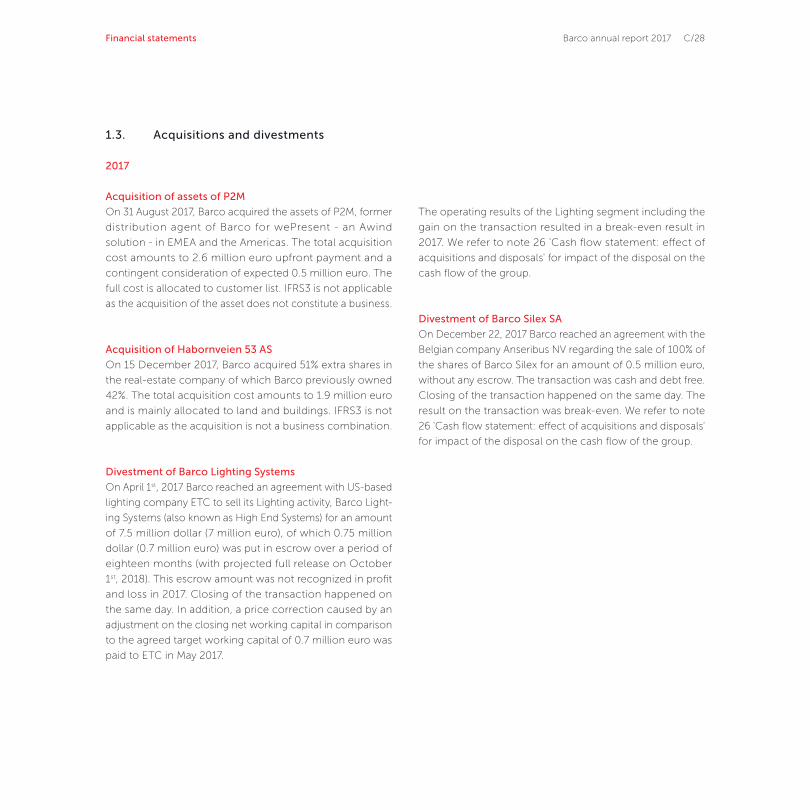
1.3. Acquisitions and divestments
2017
Acquisition of assets of P2M
On 31 August 2017, Barco acquired the assets of P2M, former
distribution agent of Barco for wePresent - an Awind
solution - in EMEA and the Americas. The total acquisition
cost amounts to 2.6 million euro upfront payment and a
contingent consideration of expected 0.5 million euro. The
full cost is allocated to customer list. IFRS3 is not applicable
as the acquisition of the asset does not constitute a business.
Acquisition of Habornveien 53 AS
On 15 December 2017, Barco acquired 51% extra shares in
the real-estate company of which Barco previously owned
42%. The total acquisition cost amounts to 1.9 million euro
and is mainly allocated to land and buildings. IFRS3 is not
applicable as the acquisition is not a business combination.
Divestment of Barco Lighting Systems
On April 1st, 2017 Barco reached an agreement with US-based
lighting company ETC to sell its Lighting activity, Barco Light-
ing Systems (also known as High End Systems) for an amount
of 7.5 million dollar (7 million euro), of which 0.75 million
dollar (0.7 million euro) was put in escrow over a period of
eighteen months (with projected full release on October
1st, 2018). This escrow amount was not recognized in profit
and loss in 2017. Closing of the transaction happened on
the same day. In addition, a price correction caused by an
adjustment on the closing net working capital in comparison
to the agreed target working capital of 0.7 million euro was
paid to ETC in May 2017.
The operating results of the Lighting segment including the
gain on the transaction resulted in a break-even result in
2017. We refer to note 26 'Cash flow statement: effect of
acquisitions and disposals' for impact of the disposal on the
cash flow of the group.
Divestment of Barco Silex SA
On December 22, 2017 Barco reached an agreement with the
Belgian company Anseribus NV regarding the sale of 100% of
the shares of Barco Silex for an amount of 0.5 million euro,
without any escrow. The transaction was cash and debt free.
Closing of the transaction happened on the same day. The
result on the transaction was break-even. We refer to note
26 'Cash flow statement: effect of acquisitions and disposals'
for impact of the disposal on the cash flow of the group.
C/28Barco annual report 2017Financial statements

2016
Acquisition of MTT and Medialon
In April 2016, Barco acquired 100% of the shares of the
US-based company Medialon Inc, for which the major part
of the consideration paid is allocated to in-process devel-
opment. On June 10, 2016, Barco announced it acquired
100% of the shares of the Canadian-based company MTT
Innovation Inc, a developer of next-generation projection
technology with expertise in high dynamic range (HDR),
applied imaging algorithms, advanced color science and
specialized hardware development. MTT’s technology is
still in a research phase and will need further de-risking
and development over the years to come. Major part of the
consideration paid is hence allocated to in-process devel-
opment. Barco continues to invest in the acquired in-process
development but as per 31 December 2016 those additional
development efforts cannot be capitalized since Barco is
unable to demonstrate that the criteria of IAS 38 are fulfilled.
The total aggregated acquisition cost paid at closing amounts
to 13.1 million dollar (11.7 million euro), of which 1.5 million
dollar was put in escrow. On an aggregate basis, the con-
tracts further provide for a deferred payment of 6 million
dollar (5.4 million euro), 2 million dollar paid in 2017, the
remaining deferred consideration is payable over the next 2
years and three earn-outs. One of the earn-outs is subject
to the filing of patents on the in-process technology and is
capped at 5 million dollar (4.5 million euro) of which one
patent was filed in 2017. The two other earn-outs are subject
to future performance and one is capped at 15 million dollar
while the other is uncapped. Barco recognized as contingent
consideration at acquisition only the earn-out related to the
patent filing. The earn-out which is capped at 15 million dollar
is linked to future results as well as to the retention of the
former shareholders while the uncapped earn-out is only
based on future results. At the time of the acquisition Barco
was unable to make a reliable estimate.
The in-process technology of MTT has been allocated to
the Entertainment division and the in-process technology
of Medialon has been allocated to the Enterprise division.
Aggregated transaction costs of 0.2 million euro have been
expensed and are included in administrative expenses in the
statement of profit or loss and are part of operating cash
flows in the statement of cash flows.
The acquisitions have been accounted for using the acquisi-
tion method conform IFRS3 Business Combinations (Revised).
The following table summarizes the aggregated consider-
ation paid for MTT and Medialon and the amounts of the
aggregated assets acquired and liabilities assumed recog-
nized at acquisition date, including the payments of 2017.
C/29 Barco annual report 2017
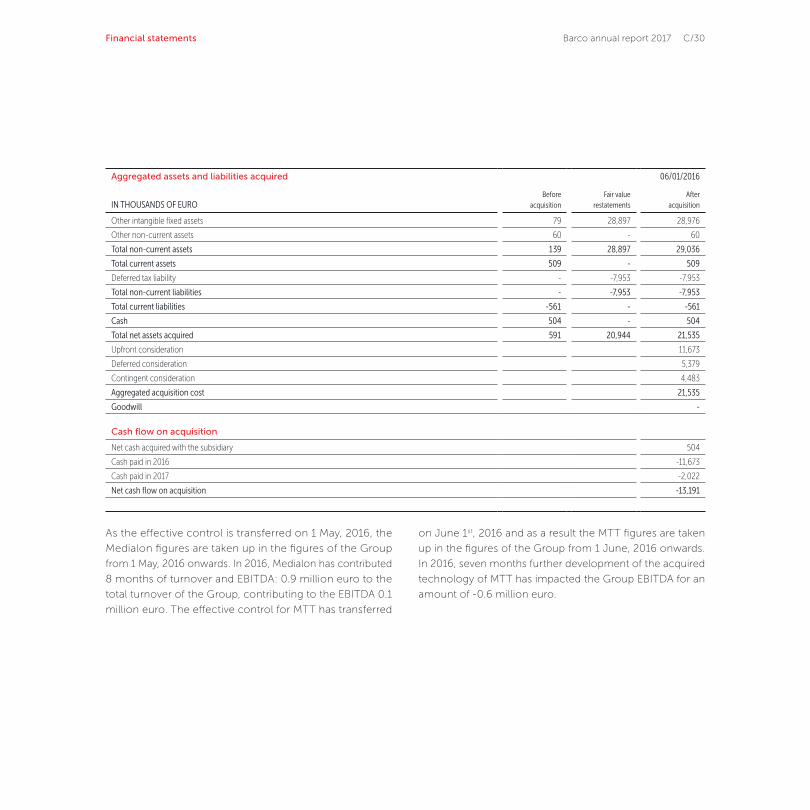
As the effective control is transferred on 1 May, 2016, the
Medialon figures are taken up in the figures of the Group
from 1 May, 2016 onwards. In 2016, Medialon has contributed
8 months of turnover and EBITDA: 0.9 million euro to the
total turnover of the Group, contributing to the EBITDA 0.1
million euro. The effective control for MTT has transferred
on June 1st, 2016 and as a result the MTT figures are taken
up in the figures of the Group from 1 June, 2016 onwards.
In 2016, seven months further development of the acquired
technology of MTT has impacted the Group EBITDA for an
amount of -0.6 million euro.
Aggregated assets and liabilities acquired 06/01/2016
IN THOUSANDS OF EUROBefore
acquisitionFair value
restatementsAfter
acquisition
Other intangible fixed assets 79 28,897 28,976
Other non-current assets 60 - 60
Total non-current assets 139 28,897 29,036
Total current assets 509 - 509
Deferred tax liability - -7,953 -7,953
Total non-current liabilities - -7,953 -7,953
Total current liabilities -561 - -561
Cash 504 - 504
Total net assets acquired 591 20,944 21,535
Upfront consideration 11,673
Deferred consideration 5,379
Contingent consideration 4,483
Aggregated acquisition cost 21,535
Goodwill -
Cash flow on acquisition
Net cash acquired with the subsidiary 504
Cash paid in 2016 -11,673
Cash paid in 2017 -2,022
Net cash flow on acquisition -13,191
C/30Barco annual report 2017Financial statements

2015
Acquisition of Advan
Per 12 June 2015, Barco acquired 100% of the shares of
the US-based company Advan Int’l Corp, a manufacturer of
high-quality LCD displays for medical modality applications.
The acquisition fits within Barco’s strategy to grow its mar-
ket share in the modality imaging segment and strengthen
its partnerships with leading medical device manufacturers
worldwide.
As the effective control was transferred on 1 July, 2015, the
Advan figures were taken up in the figures of the Barco Group
from 1 July, 2015 onwards.
In 2015 Advan contributed six months of turnover and
EBITDA: 10.7 million euro to the total turnover of the
Group, contributing positive to the net result (1.1 million
euro EBITDA).
If the acquisition had taken place at the beginning of the year,
the total turnover would have been 19.5 million euro and the
EBITDA for the period would have been 0.9 million euro.
Transaction costs of 0.1 million euro were expensed and
included in administrative expenses in the statement of profit
or loss and were part of operating cash flows in the statement
of cash flows.
The acquisition was accounted for using the acquisition
method conform IFRS3 Business Combinations (Revised).
The total acquisition cost paid at closing amounted to 13.5
million dollar (11.8 million euro), of which 3.4 million dollar
(3.0 million euro) was put in escrow. The contract further
provides for an additional earn-out, which is based on the
future performance of Advan and is capped at 5 million dollar
(4.4 million euro) over the next three years. In 2016, the earn-
out targets were not met and therefore no earn-out had to
be paid in the first year after acquisition. The earn-out liability
was not released as the earn-out could still be reached over
the remaining years of the earn-out period (which is June
2015 until May 2018) and at the end of 2016 we did not have
enough information to conclude that the earn-out could
not be reached anymore. Also in 2016 a price correction,
caused by an adjustment on the closing net working capital
in comparison to the agreed target working capital, of 0.8
million dollar (0.8 million euro) was released from escrow.
Together with a correction of the net assets, this resulted in
a decrease of the goodwill of 0.7 million dollar (0.6 million
euro). See note 10. In 2017, an earn-out of 0.5 million dollar
(0.4 million euro) is realized on the second earn-out period.
A change in the estimated earn-out resulted in 0.2 million
euro gain in other operating income. Additionally, there was
a release from escrow of 0.7 million euro under the reps
and warranties of the agreement to cover for costs incurred.
The goodwill recognized at acquisition is related to the future
cash flows Barco expects to realize based on the sale of
products to the Advan customers. The goodwill is not tax
deductible. The goodwill has been assigned to the Health-
care division.
The following table summarizes the consideration paid for
Advan and the amounts of the assets acquired and liabilities
assumed recognized at the acquisition date.
C/31 Barco annual report 2017

Advan assets and liabilities 07/01/2015
IN THOUSANDS OF EUROBefore
acquisitionFair value
restatementsAfter
acquisition
Total non-current assets 1,049 1,657 2,707
Inventory 2,427 -1,029 1,398
Trade receivables 2,815 - 2,815
Other current assets 449 211 661
Total current assets 5,692 -818 4,874
Deferred tax liability - -74 -74
Total non-current liabilities - -74 -74
Total current liabilities -2,934 -465 -3,398
Cash 2,168 - 2,168
Total net assets acquired 5,976 300 6,276
Upfront consideration 9,343
Contingent consideration 1,123
Total acquisition cost 10,466
Goodwill 4,190
Discontinued operations
On September 29th, 2014, Barco reached an agreement with
US-based aerospace and defense group Esterline Corpora-
tion to sell its Defense & Aerospace division. The sale, which
covers both shares of the legal entities Barco Singapore
Private Ltd, Barco Texen, Barco Federal Systems LLC and
Barco Electronic Systems Ltd and assets of the Defense &
Aerospace division in Belgium and the United States, is
valued at 150 million euro.
Closing was finalized on January 31st 2015.
Cash flow on acquisition
Net cash acquired with the subsidiary 2,168
Cash paid -11,044
Net cash flow on acquisition -8,876
C/32Barco annual report 2017Financial statements

2.1. Basis of operating segments information
Effective 1 January 2015, Barco streamlined its organization
into three divisions: Entertainment, Enterprise and Healthcare
which reflects the products and services that it offers to its
customers.
- Entertainment: the Entertainment division is the combi-
nation of the Cinema and Venues & Hospitality activities,
which includes Professional AV, Events and Simulation
activities.
- Enterprise: the Enterprise division is the combination of
the Control Rooms activities and the Corporate activities.
ClickShare is the main contributor to the Corporate activity
which also includes the Medialon activities.
- Healthcare: the Healthcare division includes the activities
in Diagnostic Imaging (Diagnostic and Modality Imaging)
and in Surgical.
No operating segments have been aggregated to form the
above reportable operating segments.
The CEO and his core leadership team monitor the results of
each of the three divisions separately, so as to make decisions
about resource allocation and performance assessment and
consequently, the divisions qualify as operating segments.
These operating segments do not show similar economic
characteristics and do not exhibit similar long-term finan-
cial performance and therefore cannot be aggregated into
reportable segments. Division performance is evaluated
based on EBITDA. Group financing (including finance costs
and finance revenue) and income taxes are managed on a
group basis and are not allocated to the operating divisions.
As of January 1, 2016, the remaining projector activity which
had been part of Enterprise was transferred to the Entertain-
ment division. The 2015 financial segment data have not
been restated for comparison reasons as the information is
not available and the cost to develop it is excessive. In this
case in accordance with IFRS8.30, the segment information
for the current period should be presented on both the old
and the new bases of segmentation. However the necessary
information is unavailable and the cost of developing it is
excessive, therefore Barco can also not present the current
information on the old basis of segmentation.
Transfer prices between operating segments are on an arm’s
length basis in a manner similar to transactions with third
parties.
We refer to C/18 for more explanation on the activities per-
formed by each division.
2. Operating segments information
C/33 Barco annual report 2017

IN THOUSANDS OF EURO 2017 2016 2015Variance
2017 - 2016Variance
2016-2015
Net sales 533,345 100.0% 578,151 100.0% 514,474 100.0% -7.7% 12.4%
- external sales 533,285 100.0% 578,057 100.0% 513,332 99.8% -7.7% 12.6%
- interdivision sales 61 0.0% 94 0.0% 1,142 0.2% -35.5% -91.8%
Cost of goods sold -370,428 -69.5% -416,628 -72.1% -361,097 -70.2% -11.1% 15.4%
Gross profit 162,917 30.5% 161,523 27.9% 153,377 29.8% 0.9% 5.3%
EBITDA 38,922 7.3% 30,446 5.3% 43,561 8.5% 27.8% -30.1%
Amortization capitalized development - 0.0% 10,142 1.8% 21,251 4.1% -100.0% -52.3%
Depreciation TFA and (acquired) intangibles
15,718 2.9% 14,787 2.6% 8,526 1.7% 6.3% 73.4%
Adjusted EBIT 23,205 4.4% 5,517 1.0% 13,784 2.7% 320.6% -60.0%
Capital expenditures TFA and software 10,890 2.0% 10,345 1.8% 5,184 1.0% 5.3% 99.5%
Segment assets 228,108 315,164 295,242
Segment liabilities 145,780 269,241 243,894
2.2. Entertainment
2.3. Enterprise
IN THOUSANDS OF EURO 2017 2016 2015Variance
2017 - 2016Variance
2016-2015
Net sales 308,161 100.0% 289,652 100.0% 300,391 100.0% 6.4% -3.6%
- external sales 308,161 100.0% 289,652 100.0% 299,627 99.7% 6.4% -3.3%
- interdivision sales - 0.0% - 0.0% 764 0.3% - -100.0%
Cost of goods sold -159,264 -51.7% -156,758 -54.1% -191,452 -63.7% 1.6% -18.1%
Gross profit 148,898 48.3% 132,895 45.9% 108,939 36.3% 12.0% 22.0%
EBITDA 40,662 13.2% 32,984 11.4% 11,081 3.7% 23.3% 197.7%
Amortization capitalized development - 0.0% 5,440 1.9% 15,400 5.1% -100.0% -64.7%
Depreciation TFA and (acquired) intangibles
13,295 4.3% 8,904 3.1% 9,335 3.1% 49.3% -4.6%
Adjusted EBIT 27,368 8.9% 18,640 6.4% -13,654 -4.5% 46.8% -236.5%
Capital expenditures TFA and software 7,807 2.5% 9,041 3.1% 7,307 2.4% -13.7% 23.7%
Segment assets 149,633 177,073 179,330
Segment liabilities 71,224 73,364 71,492
Segment assets and liabilities for Entertainment are excluding the assets held for sale.
C/34Barco annual report 2017Financial statements

2.4. Healthcare
IN THOUSANDS OF EURO 2017 2016 2015Variance
2017 - 2016Variance
2016-2015
Net sales 243,260 100.0% 234,633 100.0% 215,984 100.0% 3.7% 8.6%
- external sales 243,259 100.0% 234,633 100.0% 215,896 100.0% 3.7% 8.7%
- interdivision sales - 0.0% - 0.0% 88 0.0% 0.0% -100.0%
Cost of goods sold -150,922 -62.0% -150,246 -64.0% -140,535 -65.1% 0.4% 6.9%
Gross profit 92,337 38.0% 84,386 36.0% 75,449 34.9% 9.4% 11.8%
EBITDA 27,533 11.3% 24,572 10.5% 19,403 9.0% 12.1% 26.6%
Amortization capitalized development - 0.0% 7,290 3.1% 12,790 5.9% -100.0% -43.0%
Depreciation TFA and (acquired) intangibles
4,865 2.0% 4,881 2.1% 5,045 2.3% -0.3% -3.3%
Adjusted EBIT 22,668 9.3% 12,400 5.3% 1,568 0.7% 82.8% 690.7%
Capital expenditures TFA and software 4,464 1.8% 4,855 2.1% 2,239 1.0% -8.1% 116.9%
Segment assets 104,373 102,768 123,621
Segment liabilities 63,654 59,847 63,006
C/35 Barco annual report 2017

2.5. Reconciliation of segment information with group information
IN THOUSANDS OF EURO 2017 2016 2015
External sales
Entertainment 533,285 578,057 513,332
Enterprise 308,161 289,652 299,627
Healthcare 243,259 234,633 215,896
Total external sales segments 1,084,706 1,102,342 1,028,856
Net Income
EBITDA
Entertainment 38,922 30,446 43,561
Enterprise 40,662 32,984 11,081
Healthcare 27,533 24,572 19,403
Amortization
Entertainment - 10,142 21,251
Enterprise - 5,440 15,400
Healthcare - 7,290 12,790
Depreciation
Entertainment 15,718 14,787 8,526
Enterprise 13,295 8,904 9,335
Healthcare 4,865 4,881 5,045
Adjusted EBIT
Entertainment 23,205 5,517 13,784
Enterprise 27,368 18,640 -13,654
Healthcare 22,668 12,400 1,568
Total adjusted EBIT 73,241 36,557 1,698
Restructuring and impairments -32,404 -12,939 -29,099
Gain on sale building - 6,866 -
Other non-operating income (expense) - net - 33 35
C/36Barco annual report 2017Financial statements

IN THOUSANDS OF EURO 2017 2016 2015
EBIT 40,836 30.516 -27.366
Interest income (expense) - net 2,013 1.240 3.006
Income/(loss) before taxes 42,849 31,756 -24,360
Income taxes -11,355 -6,345 4,879
Result after taxes 31,494 25,411 -19,481
Share in the result of joint ventures and associates 1,290 263 -1,073
Net income from continuing operations 32,784 25,674 -20,554
Net income from discontinued operations - - 47,031
Net income 32,784 25,674 26,477
Non-controlling interest 8,008 14,652 9,009
Net Income attributable to the equity holder of the parent 24,776 11,023 17,468
Net Income (continuing) attributable to the equity holder of the parent 24,776 11,023 -29,563
Net Income (discontinued) attributable to the equity holder of the parent - - 47,031
Note: For 2015 and 2016 adjusted EBIT includes amortization on capitalized development due to the change
in accounting treatment of development expenses since 2015.
C/37 Barco annual report 2017

IN THOUSANDS OF EURO 2017 2016 2015
Assets
Segment assets
Entertainment 228,108 315,164 295,242
Enterprise 149,633 177,073 179,330
Healthcare 104,373 102,768 123,621
Total segment assets 482,114 595,005 598,193
Investments 7,906 14,460 9,031
Deferred tax assets 69,859 89,100 78,031
Cash and cash equivalents 254,130 353,549 341,277
Other non-allocated assets 111,450 107,119 113,795
Assets held for sale 139,536 - -
Total assets 1,064,996 1,159,231 1,140,327
Liabilities
Segment liabilities
Entertainment 145,780 269,241 243,894
Enterprise 71,224 73,364 71,492
Healthcare 63,654 59,847 63,006
Total segment liabilities 280,658 402,452 378,391
Equity attributable to equityholders of the parent 579,449 590,243 597,739
Non-controlling interest 14,065 25,244 13,925
Long-term debts 41,036 66,811 79,527
Deferred tax liabilities 4,647 8,813 4,462
Current portion of long-term debts 10,000 11,500 10,000
Short-term debts 686 2,085 2,124
Other non-allocated liabilities 33,787 52,083 54,158
Liabilities directly associated with the assets held for sale 100,669 - -
Total equity and liabilities 1,064,996 1,159,231 1,140,327
C/38Barco annual report 2017Financial statements

2.6. Geographic information
Management monitors sales of the Group based on the
regions to which the goods are shipped or the services are
rendered in three geographical regions Europe, Americas
(NA and LATAM) and Asia-Pacific (APAC).
We refer to the ‘Comments on the results’ on A/92 for a split
of revenue from external customers based on the geographi-
cal location of the customers to whom the invoice is issued.
There is no significant (i.e. representing more than 10% of
the Group’s revenue) concentration of Barco’s revenues with
one customer.
Sales to Belgium represent 38.3 million euro of the Group
revenues in 2017 versus 50.0 million euro in 2016 and 48.7
million in 2015.
In 2017, Belgium’s non-current assets amount to 170.6 mil-
lion euro (rest of the world 194.1 million euro); in 2016 183.6
million euro (rest of the world 243.0 million euro) and in 2015
180.8 million euro (rest of the world 229.9 million euro).
Below table gives an overview of the assets per region and
the most important capital expenditures in non-current assets
per region:
IN THOUSANDS OF EURO 2017 2016 2015
Net sales
Europe 339,526 31.3% 344,355 31.2% 332,589 32.3%
Americas 394,509 36.4% 394,634 35.8% 384,921 37.4%
Asia-Pacific 350,671 32.3% 363,354 33.0% 311,346 30.3%
Total 1,084,706 100% 1,102,342 100% 1,028,856 100%
Total assets
Europe 458,383 43.0% 494,569 42.7% 559,733 49.1%
Americas 185,006 17.4% 241,994 20.9% 220,887 19.4%
Asia-Pacific 421,607 39.6% 422,669 36.5% 359,707 31.5%
Total 1,064,995 100% 1,159,232 100% 1,140,327 100%
Purchases of tangible and intangible fixed assets
Europe 22,094 82.0% 25,251 75.7% 35,471 82.5%
Americas 1,578 5.9% 2,732 8.2% 1,030 2.4%
Asia-Pacific 3,272 12.1% 5,370 16.1% 6,484 15.1%
Total 26,944 100% 33,353 100% 42,984 100%
C/39 Barco annual report 2017

3. Assets held for sale
We refer to C/23 on the critical accounting judgements for
more background on the intended sale of 9% of Barco’s cur-
rent stake of 58% in BarcoCFG. The major classes of assets
and liabilities of BarcoCFG classified as held for sale as at 31
December are, as follows:
IN THOUSANDS OF EURO NOTE 31 DEC 2017
ASSETS
Goodwill 10 8,000
Deferred tax assets 13 10,174
Non-current assets 18,174
Inventory 14 21,309
Trade debtors 15 32,668
Cash and cash equivalents 16 67,385
Current assets 121,362
Total assets 139,536
LIABILITIES
Non-current accrued charges and deferred income 6,167
Non-current liabilities 6,167
Trade payables 20 11,605
Advances received from customers 20 21,814
Tax payables 13,600
Employee benefit liabilities 1,179
Accrued charges and deferred income 42,696
Provisions 21 3,608
Current liabilities 94,502
Total liabilities 100,669
Per end of 2017, -1.8 million euro CTA was included in equity for BarcoCFG. Once deconsolidated,
this will be recycled through profit and loss.
C/40Barco annual report 2017Financial statements

4. Income from continued operations (EBIT)
IN THOUSANDS OF EURO 2017 2016 2015
Sales 1,084,706 1,102,342 1,028,856
Cost of goods sold -680,554 -723,538 -691,091
Gross profit 404,152 378,804 337,765
Gross profit as % of sales 37.3% 34.4% 32.8%
Indirect costs -327,201 -345,573 -339,028
Other operating income (expenses) - net -3,710 3,325 2,960
Adjusted EBIT 73,241 36,557 1,698
Adjusted EBIT as % of sales 6.8% 3.3% 0.2%
Restructuring and impairments -32,404 -12,939 -29,099
Gain on sale building - 6,866 -
Other non-operating income/(expense) - 33 35
EBIT 40,836 30,516 -27,366
EBIT as % of sales 3.8% 2.8% -2.7%
After an increase in topline of 7% from 2015 to 2016, sales
remained at the same level in 2017 (-1.6%, flat excluding the
impact of the divested Lighting business).
A strong gross profit margin improvement has been realized,
from 32.8% in 2015 to 34.4% in 2016 and then up 2.9 percent-
age points to 37.3% in 2017. A positive mix effect and value
engineering efforts yielding into results across the 3 divisions
are contributors to this improvement.
The higher gross profits while keeping indirect costs under
control result in an adjusted EBIT of 6.8% in 2017, up 3.5 per-
centage points vs 2016. The decrease in indirect costs over
the period is fully explained by amortizations on capitalized
development costs still included in 2016 (see below).
EBIT in 2017 includes following adjusting items: restructuring
costs (5.2 million euro) and non-cash impairment charges
(27.2 million euro) totaling 32.4 million euro (2016: adjusting
items: 6 million euro (net after gain on sale of headquarter
building); 2015: 29.1 million euro).
For more details on adjusting items we refer to note 6.
Restructuring and impairment.
The restructuring costs in 2017 mainly relate to the announ-
ced relocation of the production of the Norway plant to
Belgium and the decision to stop loss-making activities
mainly in the Entertainment division for an amount of
5.2 million euro (in 2016: 5.8 million euro, mainly related to
Entertainment, in 2015: 8.3 million euro, mainly related to
Enterprise). We refer to note 6 for more details on restruc-
turing charges recorded.
C/41 Barco annual report 2017

The change in accounting treatment of development
expenses (see (a)), which resulted in no capitalization of
development expenses in 2016 and 2015, negatively impacts
adjusted EBIT in 2016 and 2015 due to amortizations on
the remaining capitalized development balance (2016: 22.9
million euro; 2015: 49.4 million euro). EBITDA excludes
these impacts and shows a steady improvement in EBITDA
performance of 9.9% on sales in 2017, compared to 8% in
2016 and 7.2% in 2015.
IN THOUSANDS OF EURO 2017 2016 2015
Product sales 888,753 82% 883,437 80% 793,341 77%
Project sales 96,016 9% 120,089 11% 142,237 14%
Service sales 99,936 9% 98,815 9% 93,278 9%
Sales 1,084,706 1,102,342 1,028,856
Major part of the sales relate to product sales (in 2017: 82%, in
2016: 80%, 2015: 77%). Project sales include combined sales
from products, installations and services and are declining
since 2015 as a result of declining project sales in the control
rooms business. Most of these project sales have a lifetime
of less than one year. Service sales remained stable, counting
for 9% of total sales.
We refer to note 2.Segment Information and to the chapter
‘Comments on the results’ for more explanation on sales
and income from operations (A/92).
IN THOUSANDS OF EURO NOTE 2017 2016 2015
Adjusted EBIT 73,241 36,557 1,698
Depreciations and amortizations 12 33,877 28,572 22,906
Amortizations and impairments on development expenses 4a - 11 - 22,873 49,441
EBITDA 107,118 88,002 74,080
EBITDA as % of sales 9.9% 8.0% 7.2%
C/42Barco annual report 2017Financial statements

Indirect costs and other operating income (expenses) - net
IN THOUSANDS OF EURO 2017 2016 2015
Research and development expenses (a) -122,305 -143,362 -150,222
Sales and marketing expenses (b) -146,802 -147,088 -137,829
General and administration expenses ( c ) -58,095 -55,122 -50,977
Indirect costs -327,201 -345,573 -339,028
Other operating income (expenses) - net (d) -3,710 3,325 2,960
Indirect costs and other operating income (expenses) - net -330,911 -342,247 -336,067
Indirect costs represent 30% of sales in 2017 versus 31% of sales in 2016 and 33% of sales in 2015.
(a) Research and development expenses
IN THOUSANDS OF EURO 2017 2016 2015
Research & development expenses 122,305 120,490 100,781
Amortization capitalized development expenses - 21,509 44,575
Impairment of capitalized development expenses - 1,364 4,866
Capitalized development, net - 22,873 49,441
Research and development expenses, net 122,305 143,362 150,222
In order to sustain our technological leadership, Barco
strongly invests in R&D, new technologies and innovation. We
refer to ‘Our strategy’ on page A/34 for more details. Shorter
life cycles of products, unpredictability of which development
projects will become successful together with the volatility
of technologies and the markets Barco operates in, made
the Board of Directors conclude that Barco’s development
expenses no longer fully meet the criteria of IAS38.57. As the
criteria of IAS38.57 are no longer fulfilled, our accounting
policy, with respect to research and development costs, does
no longer allow the capitalization of development expenses
since 2015.
2017 Research and development cash expenses represent
11.3% of sales in 2017, which is in line with 2016 and 9.8%
of sales in 2015.The increase from 2016 to 2015 is related
to development in new growth initiatives and acquisitions
in MTT and Medialon, by which Barco acquired in-process
development which requires additional internal development.
C/43 Barco annual report 2017
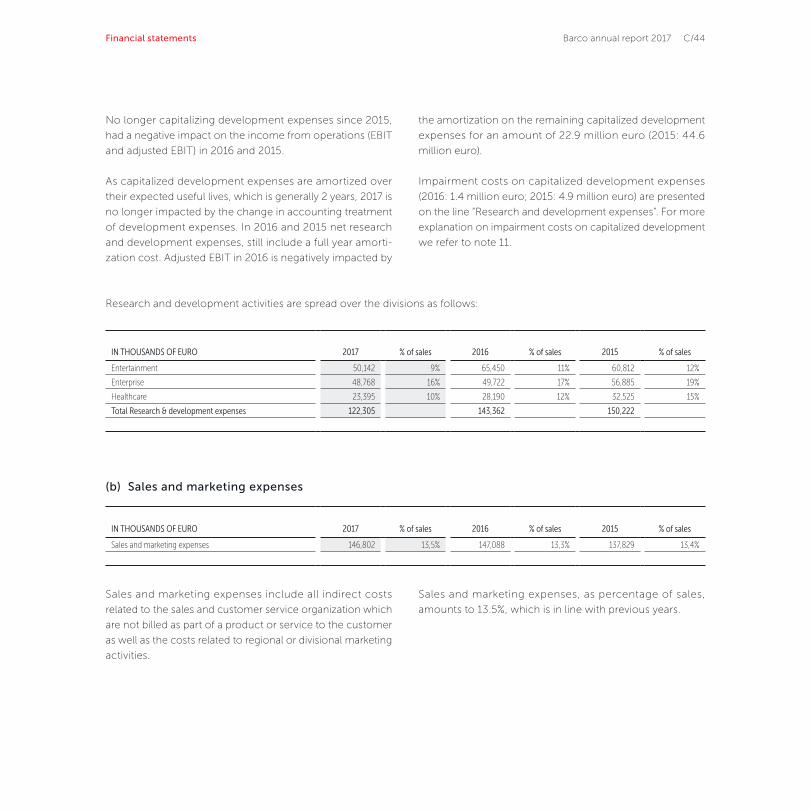
No longer capitalizing development expenses since 2015,
had a negative impact on the income from operations (EBIT
and adjusted EBIT) in 2016 and 2015.
As capitalized development expenses are amortized over
their expected useful lives, which is generally 2 years, 2017 is
no longer impacted by the change in accounting treatment
of development expenses. In 2016 and 2015 net research
and development expenses, still include a full year amorti-
zation cost. Adjusted EBIT in 2016 is negatively impacted by
the amortization on the remaining capitalized development
expenses for an amount of 22.9 million euro (2015: 44.6
million euro).
Impairment costs on capitalized development expenses
(2016: 1.4 million euro; 2015: 4.9 million euro) are presented
on the line “Research and development expenses”. For more
explanation on impairment costs on capitalized development
we refer to note 11.
Research and development activities are spread over the divisions as follows:
(b) Sales and marketing expenses
IN THOUSANDS OF EURO 2017 % of sales 2016 % of sales 2015 % of sales
Entertainment 50,142 9% 65,450 11% 60,812 12%
Enterprise 48,768 16% 49,722 17% 56,885 19%
Healthcare 23,395 10% 28,190 12% 32,525 15%
Total Research & development expenses 122,305 143,362 150,222
IN THOUSANDS OF EURO 2017 % of sales 2016 % of sales 2015 % of sales
Sales and marketing expenses 146,802 13,5% 147,088 13,3% 137,829 13,4%
Sales and marketing expenses include all indirect costs
related to the sales and customer service organization which
are not billed as part of a product or service to the customer
as well as the costs related to regional or divisional marketing
activities.
Sales and marketing expenses, as percentage of sales,
amounts to 13.5%, which is in line with previous years.
C/44Barco annual report 2017Financial statements

(c) General and administration expenses
(d) Other operating income (expense) – net
IN THOUSANDS OF EURO 2017 % of sales 2016 % of sales 2015 % of sales
General and administration expenses 58,095 5.4% 55.122 5.0% 50,977 5.0%
General and administration expenses include the costs
related to general and divisional management, finance and
accounting, information technology, human resources and
investor relations. Expenses increased to 5.4% of sales in
2017 compared to 5% in 2016 and 2015 partly the result of
increased investments in IT infrastructure (SAP and Cloud).
(a) In 2014, Barco sold its venture Orthogon. In 2015 a price correction
resulting from the contractual adjustment on the final closing
net working capital in comparison to the agreed target working capital,
of 1.4 million euro was received and recognized in other operating
income. In 2016 the remaining escrow on the sale of Orthogon was
received.
In 2017 sale of divestment mainly relates to the sold Lighting activities.
We refer to note 1.3. Acquisitions and divestments for more explanation.
(b) As of 2016 government grants and other forms of government assistance
related to research projects are recognized as income on the line
research and development expenses. In 2015 these government grants
were included in other operating income (expense) (2015: 5.6 million
euro).
(c) This concerns the loan on the former DAT business. For further
information, see note 17.
IN THOUSANDS OF EURO NOTE 2017 2016 2015
Sale divestments (a) 513 1,000 1,405
Investment grants (b) - 58 5,569
Dividend received from external investment 434 - -
Reversal other long term liability (c) 2,246 - -
Bad debt provisions (net of write-offs and reversals of write-offs) -674 2,788 -1,362
Cost of share-based payments -1,549 -1,234 -1,313
Bank charges -705 -982 -974
Other provisions (net of additions and reversals of provisions) -2,325 1,819 -669
Gains/(loss) on disposal of tangible fixed assets -362 -142 548
Other (net) -1,288 19 -243
Total -3,710 3,325 2,960
C/45 Barco annual report 2017

The table below provides information on the major items
contributing to the adjusted EBIT, categorized by nature.
Personnel cost includes the cost for temporary personnel
for an amount of 5.3 million euro (in 2016: 6.6 million euro,
in 2015: 5.7 million euro).
Average number of employees in 2017 was 3,515 (versus
3,456 in 2016; 3,298 in 2015), including 2,683 white-collars
(in 2016: 2,615, in 2015: 2,509) and 832 blue-collars (in 2016:
841, in 2015: 788).
IN THOUSANDS OF EURO 2017 2016 2015
Sales 1,084,706 1,102,342 1,028,856
Material cost -560,388 -580,142 -575,130
Services and other costs -135,309 -166,234 -128,796
Personnel cost -278,181 -271,289 -253,846
Amortizations on development - -22,873 -49,441
Depreciation property, plant, equipment and software -33,877 -28,572 -22,906
Other operating income (expense) - net (note 4) -3,710 3,325 2,960
Adjusted EBIT 73,241 36,557 1,698
5. Revenues and expenses by nature
C/46Barco annual report 2017Financial statements

The table below shows the restructuring and impairment
costs recognized in the income statement.
Please refer to note 10 for explanation on impairment on
goodwill, note 9 for explanation on the impairment on
investments and note 12 for impairment of (in)tangible fixed
assets.
Restructuring costs include lay off costs (2017: 5.2 million
euro, 2016: 2.3 million euro, 2015: 8.3 million euro). Non-
cash impairment costs relate to impairment on intangible
and tangible fixed assets (2017: 2.9 million euro), goodwill
(2017: 10.9 million euro, 2016: 7.5 million euro and 2015: 16.9
million euro), write off on inventories (2017: 4.4 million euro,
2016: 3.5 million euro) and investments (2017: 9 million euro,
2016: -0.4 million euro and 2015: 3.8 million euro).
Restructuring and impairment costs in 2017 relate to Barco’s
decision to move the production activities in Norway to
Belgium, leading to a provision for lay off costs as well as an
impairment on the building (in Entertainment division), and
to Barco’s decision to revisit the future of certain growth
initiatives (in Entertainment division) and the X2O business (in
Enterprise division). Based on the latter decision, management
assessed additional write offs on inventories (growth initia-
tives), impairment on goodwill and know-how (X2O) and
provision for lay-off costs.
At the end of 2016 Barco decided to scale down the Interactive
Patient Care business, which resulted in an impairment of the
remaining goodwill (see note 10) and additional write off on
inventories for an amount of 0.5 million euro. The decision
to revisit the future of the Lighting business, resulted in addi-
tional write offs on inventories (3 million euro).
IN THOUSANDS OF EURO NOTE 2017 2016 2015
Total restructuring (cash): -5,200 -2,297 -8,315
Lay-off costs -5,200 -2,297 -8,315
Total impairments (non-cash): -27,204 -10,642 -20,783
Impairment on goodwill 10 -10,870 -7,546 -16,940
Impairment on investments 9 -9,074 416 -3,843
Write-off on inventories -4,400 -3,512 -
Impairment (in)tangible fixed assets 12 -2,860 - -
Total restructuring and impairments -32,404 -12,939 -29,099
6. Restructuring and impairment costs
C/47 Barco annual report 2017

7. Income taxes
IN THOUSANDS OF EURO NOTE 2017 2016 2015
Current versus deferred income taxes
Current income taxes -11,779 -16,612 -17,253
Deferred income taxes 424 10,267 10,374
Income taxes -11,355 -6,345 -6,879
Income taxes continuing operations -11,355 -6,345 4,879
Income taxes discontinuing operations - - -11,758
Income taxes versus income before taxes
EBIT continuing operations 40,836 30,516 -27,366
EBIT discontinuing operations - - 58,790
Interest income (expense) - net 2,013 1,240 3,006
Income before taxes 42,849 31,756 34,430
Income taxes -11,355 -6,345 -6,879
Effective income tax rate % -26.5% -20.0% -20.0%
Income before taxes 42,849 31,756 34,430
Theoretical tax rate 34% 34% 34%
Theoretical tax credit/(cost) -14,565 -10,797 -11,706
Effect of change in expected tax rate on deferred taxes (a) -15,562 A - -
Set-up/(use) of deferred tax assets, not recognised in prior years (b) 11,063 A 1,620 -27
Innovation income deduction (IID) (c) 8,243 - -
Effect of different tax rates in foreign companies 4,463 11,542 5,867
Tax adjustments related to prior periods 1,728 -53 4,784
Non deductible expenses/non taxable income for tax purposes
Goodwill impairments non-deductible (d) -3,695 -2,423 -6,233
Impairment on investment (e) -3,364 - -
Dividends received (f) -1,523 -4,610 -
Other non-deductible expenses -1,873 -4,699 -1,873
Income not taxed
Capital loss carried back/Gain on sold share deal entities (g) 1,636 - 4,132
Government grants exempt from tax 1,726 1,995 1,156
Notional interest deduction (NID) (h) - 1,769 2,756
Investment allowances (i) 854 1,771 2,324
Deferred tax assets, derecognised in current year (j) -487 -2,460 -8,058
Taxes related to current income before taxes -11,355 -6,345 -6,879
Note: Adjusted tax rate 2017 = 16% (Taxes related to current income before taxes - non-recurring tax items (i.e. sum of A))/income before taxes =
(-11,355 – (-15,562 + 11,063 ))/42,849
Adjusted tax rate is the tax rate used in the calculation of ROCE (see page C/80).
C/48Barco annual report 2017Financial statements

8. Earnings per share
IN THOUSANDS OF EURO 2017 2016 2015
Net income/(loss) (continuing) attributable to the equity holder of the parent 24,776 11,023 -29,563
Weighted average of shares 12,328,663 12,171,969 12,065,396
Basic earnings per share (in euro) 2.01 0.91 -2.45
Net income/(loss) (discontinued) attributable to the equity holder of the parent - - 47,031
Weighted average of shares - - 12,065,396
Basic earnings per share (in euro) - - 3.90
Basic earnings per share 2.01 0.91 1.45
Net income/(loss) (continuing) attributable to the equity holder of the parent 24,776 11,023 -29,563
Weighted average of shares (diluted) 12,428,453 12,591,376 12,411,732
Diluted earnings per share (in euro) 1.99 0.88 -2.38
Net income/(loss) (discontinued) attributable to the equity holder of the parent - - 47,031
Weighted average of shares (diluted) - - 12,411,732
Diluted earnings per share (in euro) (a) - - 3.79
Diluted earnings per share (a) 1.99 0.88 1.41
(a) The difference between the weighted average of shares and weighted average of shares (diluted) is due to exercisable warrants, which are in the money (which
means that the closing rate of the Barco share was higher than the exercise price). For more detailed information concerning the shares and warrants, we refer
to note 18.
(a) (b) Impact of the change in tax regulation in Belgium and US is -4.5 million
euro cost, net of -15.6 million euro (a) reduction on deferred tax assets
in Belgium and US due to a lower enacted tax rate and 11 million euro (b)
new deferred tax assets set-up on uncapped or faster deductible tax
credits in Belgium, in combination with higher than anticipated taxable
results in Belgium.
(c) As of 2016 Innovation Income Deduction (IID) in Belgium, not used in the
tax year it is incurred, can be carried forward to the next years. This has
resulted in an extra deferred tax asset of 8.2 million euro on the IID not
used in 2016 and 2017 as management believes there will be sufficient
taxable profit in the future to be able to offset the IID carried forward.
(d) See note 10 for more details on goodwill impairment recorded in 2017, 2016
and 2015. The 2017, 2016 and major part of the 2015 goodwill impairment
is non-deductible. Only the part recorded in the US is tax deductible.
(e) See note 9 for more details on impairment on investments recorded in
2017. Impairments on investments are non-tax deductible.
(f) Net effect of deferred taxes on DBI deduction carried forward and 5%
taxable income on dividends received.
(g) Gain realized on divested share deal entities as part of the sale of the DAT
business is tax exempt in 2015. In 2017 the sale of the Lighting activities
resulted in a capital loss for which part could be carried back to the gain
realized on the sale of the assets of the DAT business in 2015 in the US.
(h) Decrease of notional interest percentage allowed over the years – no usage
of NID in 2017.
(i) Spread taxation on capital expenditure and research and development costs
of prior years.
(j) Deferred tax assets not recognized on tax losses or tax losses carried
forward when assessment shows it is not probable that these tax benefits
can be utilized in the near future. In 2016 this mainly relates to tax losses
in Belgium and Canada. In 2015 and 2014 this mainly relates to tax losses
in Belgium and Germany. See note 13.
C/49 Barco annual report 2017

The Group has no contingent liabilities or capital commitments in relation to its associates as at 31 December 2017, 2016 and 2015. For all equity accounted
investees, the parent’s or other investor’s consent is required to distribute its profits; which is not foreseen at the reporting date. The equity accounted investees
did not recognize items in other comprehensive income.
IN THOUSANDS OF EURO 2017 2016 2015
Share of the associates' balance sheets:
Current assets 3,046 3,262 269
Non-current assets 7,207 8,244 3,858
Current liabilities 2,652 2,549 451
Non-current liabilities 10 3,805 2,904
Equity 7,591 5,153 772
Share of the associates' revenue and profit:
Sales 13,460 10,207 422
Gross profit 3,095 1,676 194
EBIT 1,439 394 -873
Profit/(loss) of the year 1,290 263 -1,073
The Group’s share of the assets and liabilities as at 31 December 2017, 2016 and 2015 and income and expenses of the joint
ventures and associates for the year ended 31 December 2017, 2016 and 2015, which are accounted for using the equity method:
Investments include entities in which Barco owns less
than 20% of the shares. These are accounted for as AFS
instruments, which implies that the Group measures these
investments on a fair value basis with differences in fair value
reflected in profit and loss. Interest in associates represent
entities in which Barco owns between 20% and 50% of the
shares. The decrease from 2016 to 2017 is the net effect of
the impairment on an investment in Entertainment and an
additional capital contribution in CCO Barco Airport Venture
LLC. The impaired investment is facing cash flow problems,
for which no solution is found to date. This, together with the
return criteria no longer being met, let the Board decide to
impair the investment which is presented in the line restruc-
turing and impairment costs. In 2016, the equity instruments’
fair value is based on a binding agreement with a third party
investor (i.e. price of the last round – level 1 fair value), as
these investments are unquoted instruments.
In 2016 the balance also included the 35% interest in CCO
Barco Airport Venture LLC, as well as a 27.32% interest in
Audience Entertainment and a 41.18% interest in Habornveien
53, a Norwegian real estate company owning the building
leased by Barco Frederikstad AS in Norway. Barco has pur-
chased an additional 51% of the shares on 22 December
2017, resulting in Barco acquiring control of Habornveien
53 as per 31 December 2017. We refer to note 1.3 Acquisi-
tions and divestments. The investment in Habornveien 53
is therefore no longer included per 31 December 2017 in
the investments in associated companies. The results of the
equity investment until 31 December 2017 are included in
the share in the profit/(loss) of joint ventures and associates
in the income statement.
The Audience Entertainment results include in each year the
fourth quarter result of the previous year and the first three
quarters of the result of the current year, as the fourth quarter
figures of the current year are not yet available. In 2015 this
investment has been fully impaired (3.8 million euro impair-
ment) to zero. This impairment was recorded in the income
statement in the line restructuring and impairment costs.
In 2016 the result of Audience Entertainment from October
2015 till September 2016 amounts -0.4 million euro. This
amount is offset in the income statement in the line restruc-
turing and impairment costs in order to keep the investment
at zero. See note 6. Restructuring and impairment. In 2017,
this entity did not generate significant result.
9. Investments
C/50Barco annual report 2017Financial statements
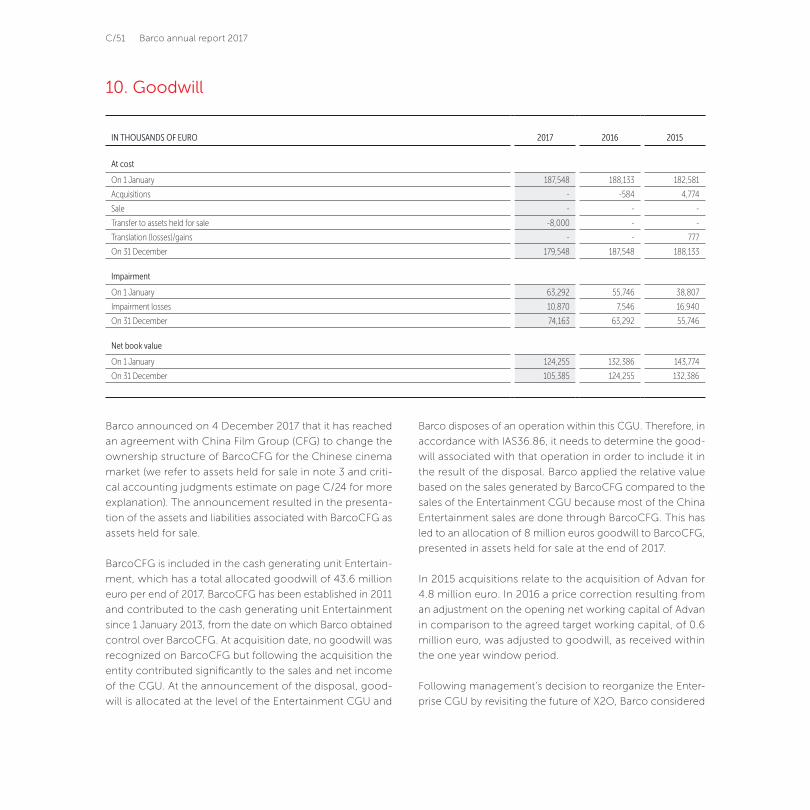
10. Goodwill
IN THOUSANDS OF EURO 2017 2016 2015
At cost
On 1 January 187,548 188,133 182,581
Acquisitions - -584 4,774
Sale - - -
Transfer to assets held for sale -8,000 - -
Translation (losses)/gains - - 777
On 31 December 179,548 187,548 188,133
Impairment
On 1 January 63,292 55,746 38,807
Impairment losses 10,870 7,546 16,940
On 31 December 74,163 63,292 55,746
Net book value
On 1 January 124,255 132,386 143,774
On 31 December 105,385 124,255 132,386
Barco announced on 4 December 2017 that it has reached
an agreement with China Film Group (CFG) to change the
ownership structure of BarcoCFG for the Chinese cinema
market (we refer to assets held for sale in note 3 and criti-
cal accounting judgments estimate on page C/24 for more
explanation). The announcement resulted in the presenta-
tion of the assets and liabilities associated with BarcoCFG as
assets held for sale.
BarcoCFG is included in the cash generating unit Entertain-
ment, which has a total allocated goodwill of 43.6 million
euro per end of 2017. BarcoCFG has been established in 2011
and contributed to the cash generating unit Entertainment
since 1 January 2013, from the date on which Barco obtained
control over BarcoCFG. At acquisition date, no goodwill was
recognized on BarcoCFG but following the acquisition the
entity contributed significantly to the sales and net income
of the CGU. At the announcement of the disposal, good-
will is allocated at the level of the Entertainment CGU and
Barco disposes of an operation within this CGU. Therefore, in
accordance with IAS36.86, it needs to determine the good-
will associated with that operation in order to include it in
the result of the disposal. Barco applied the relative value
based on the sales generated by BarcoCFG compared to the
sales of the Entertainment CGU because most of the China
Entertainment sales are done through BarcoCFG. This has
led to an allocation of 8 million euros goodwill to BarcoCFG,
presented in assets held for sale at the end of 2017.
In 2015 acquisitions relate to the acquisition of Advan for
4.8 million euro. In 2016 a price correction resulting from
an adjustment on the opening net working capital of Advan
in comparison to the agreed target working capital, of 0.6
million euro, was adjusted to goodwill, as received within
the one year window period.
Following management’s decision to reorganize the Enter-
prise CGU by revisiting the future of X2O, Barco considered
C/51 Barco annual report 2017

Goodwill by cash-generating unit
On acquisition, goodwill acquired in a business combina-
tion is allocated to the cash-generating units which are
expected to benefit from that business combination. These
cash-generating units correspond to the division level for
Entertainment and Enterprise. For Healthcare, the business
unit Interactive Patient Care (IPC) and Healthcare exclud-
ing Interactive Patient Care were monitored as separate
cash-generating units in the division Healthcare.
As in 2016 the business unit Interactive Patient Care (IPC) was
stopped, the cash-generating unit corresponds to the division
Healthcare. Therefore, impairment testing is performed at
the level of the cash-generating units as indicated below.
IAS 36.12(f) and concluded that based on this decision there
are impairment indicators. The goodwill allocated to the
cash-generating unit Enterprise has been re-allocated and
Barco believes that an arbitrary method as permitted by IAS
36.87 would better reflect the goodwill associated with the
re-organized units. In order to support, Barco considered the
facts and circumstances relating to the acquisition of X20.
The legal entity X2O has been acquired (100% of the shares)
on 18 March 2014. The acquisition reflected Barco’s strategy
to move beyond display and projection technology and
expands Barco’s portfolio with a complete solution to deliver
enhanced and cross-divisional content distribution and
workflow, based on advanced networking and connectivity
capabilities. The goodwill allocated to the cash-generating
unit Enterprise has been reallocated as permitted by IAS36.87
based on the allocation to goodwill of the total acquisition
price paid.
Of the total acquisition price of 13.3 million euro, 3.2 million
euros was allocated to intangibles (know-how; 1.5 million
euro remaining book value per end of 2017) and 10.9 million
euro was allocated to residual goodwill. Barco believes that
the method of allocating goodwill after the re-organization of
the Enterprise cash-generating unit best reflects the goodwill
associated with the remaining Enterprise cash-generating
unit, i.e. the previous goodwill of 52.7 million euro less the
goodwill associated with the X20 acquisition of 10.9 million
euro. Consequently, Barco allocates 10.9 million euro good-
will to the operations of X20 which is immediately impaired
together with the remaining book value of the acquired
know-how (1.5 million euro) because Barco estimates that
the recoverable amount of the X2O operations is insufficient
to cover.
The impairment tests on goodwill in 2017 did not result in
additional impairments for other cash-generating units.
In 2016 an impairment loss was recorded for an amount of
7.5 million euro, related to the remaining goodwill on the
cash-generating unit Interactive Patient Care, after the deci-
sion to stop this business. The impairment tests on goodwill
in 2016 did not result in additional impairments for other
cash-generating units. In 2015, an impairment charge of
16.9 million euro was booked, related to goodwill on Indus-
trial & Government (9.5 million euro) and Interactive Patient
Care (7.5 million euro). There is no remaining goodwill on
Industrial & Government and Interactive Patient Care after
the impairments were booked.
See below for explanations on the impairment testing
performed.
C/52Barco annual report 2017Financial statements

The Group performed its annual impairment test in the fourth
quarter of 2017 consistently with prior years.
The Group looks at the relationship between its market capi-
talization and its book value, amongst other factors, when
reviewing the indicators of impairment. At 31 December 2017,
the market capitalization of the group exceeded the equity
of the Group with 101%. As such, this general test does not
show an indication for impairment.
The annual impairment tests were performed for each
cash-generating unit. The recoverable amount for each
of the cash-generating units has been determined based
on a value-in-use calculation using cash flow projections
generated by divisional management covering a five year
period. Due to the level of uncertainty of future years, these
financial projections have been adjusted to more conser-
vative levels for the purpose of our impairment testing. The
pre-tax discount rate applied to projected cash flows is 8.9%
(2016: 8.8%, 2015: 9%) and cash flows beyond the five year
period are extrapolated using a conservative growth rate of
0% (2016: 0%, 2015: 0%). The amount by which the unit’s
recoverable amount exceeds its carrying amount is 95 million
euro in Entertainment, 158 million euro in Enterprise and 84
million euro in Healthcare. A sensitivity analysis is performed
on all cash-generating units with respect to the discount rate
(see Sensitivity to changes in assumptions – Discount rate).
The assumptions of the annual impairment test are consistent
with external sources.
For none of the cash-generating units management iden-
tified an impairment after the impairments' test. In 2016 an
impairment was booked on the remaining goodwill of the
business unit Interactive Patient Care (IPC) as it was decided
to stop this business because business plan targets were not
reached. As a result, an impairment loss of 7.5 million euro
was recorded.
Impairment losses recorded are shown in a separate line
‘Restructuring and impairments on the face of the income
statement. We refer to note 6 Impairment and restructuring
costs for a detailed break-down of the amounts shown in
this line of the income statement.
Cash generating units
IN THOUSANDS OF EURO 2017 2016
Entertainment 35,564 43,564
Healthcare 28,036 28,036
Enterprise 41,785 52,655
Total goodwill (net book value) 105,385 124,255
The carrying amount of goodwill (after impairment) has been
allocated to the cash-generating units as follows (in thousands
of euro):
C/53 Barco annual report 2017
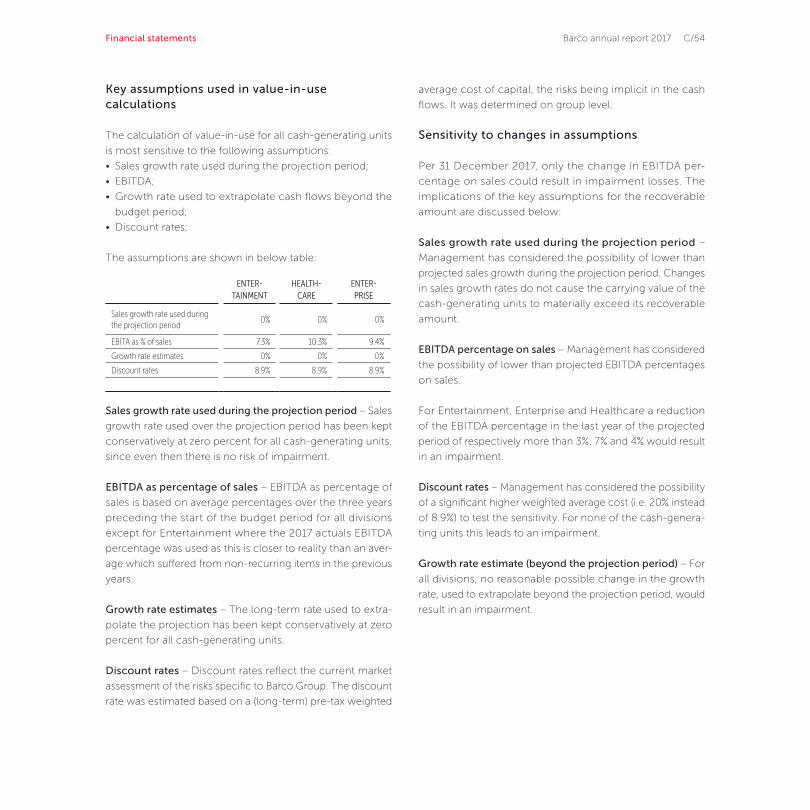
Key assumptions used in value-in-use calculations
The calculation of value-in-use for all cash-generating units
is most sensitive to the following assumptions:
• Sales growth rate used during the projection period;
• EBITDA;
• Growth rate used to extrapolate cash flows beyond the
budget period;
• Discount rates;
The assumptions are shown in below table:
Sales growth rate used during the projection period – Sales
growth rate used over the projection period has been kept
conservatively at zero percent for all cash-generating units,
since even then there is no risk of impairment.
EBITDA as percentage of sales – EBITDA as percentage of
sales is based on average percentages over the three years
preceding the start of the budget period for all divisions
except for Entertainment where the 2017 actuals EBITDA
percentage was used as this is closer to reality than an aver-
age which suffered from non-recurring items in the previous
years.
Growth rate estimates – The long-term rate used to extra-
polate the projection has been kept conservatively at zero
percent for all cash-generating units.
Discount rates – Discount rates reflect the current market
assessment of the risks specific to Barco Group. The discount
rate was estimated based on a (long-term) pre-tax weighted
average cost of capital, the risks being implicit in the cash
flows. It was determined on group level.
Sensitivity to changes in assumptions
Per 31 December 2017, only the change in EBITDA per-
centage on sales could result in impairment losses. The
implications of the key assumptions for the recoverable
amount are discussed below:
Sales growth rate used during the projection period –
Management has considered the possibility of lower than
projected sales growth during the projection period. Changes
in sales growth rates do not cause the carrying value of the
cash-generating units to materially exceed its recoverable
amount.
EBITDA percentage on sales – Management has considered
the possibility of lower than projected EBITDA percentages
on sales.
For Entertainment, Enterprise and Healthcare a reduction
of the EBITDA percentage in the last year of the projected
period of respectively more than 3%, 7% and 4% would result
in an impairment.
Discount rates – Management has considered the possibility
of a significant higher weighted average cost (i.e. 20% instead
of 8.9%) to test the sensitivity. For none of the cash-genera-
ting units this leads to an impairment.
Growth rate estimate (beyond the projection period) – For
all divisions, no reasonable possible change in the growth
rate, used to extrapolate beyond the projection period, would
result in an impairment.
ENTER- TAINMENT
HEALTH- CARE
ENTER- PRISE
Sales growth rate used during the projection period
0% 0% 0%
EBITA as % of sales 7.3% 10.3% 9.4%
Growth rate estimates 0% 0% 0%
Discount rates 8.9% 8.9% 8.9%
C/54Barco annual report 2017Financial statements
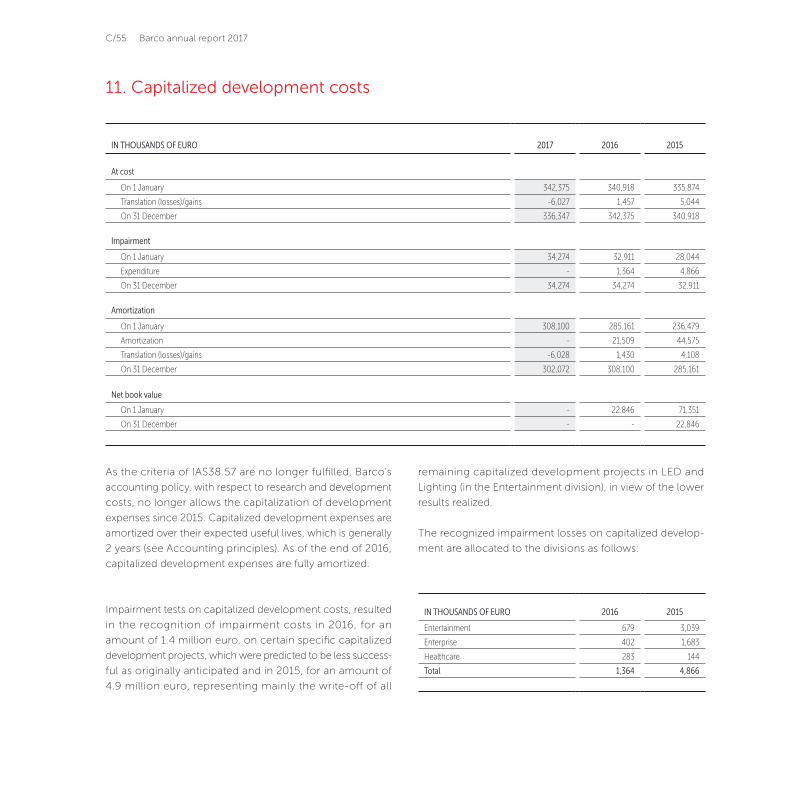
11. Capitalized development costs
IN THOUSANDS OF EURO 2017 2016 2015
At cost
On 1 January 342,375 340,918 335,874
Translation (losses)/gains -6,027 1,457 5,044
On 31 December 336,347 342,375 340,918
Impairment
On 1 January 34,274 32,911 28,044
Expenditure - 1,364 4,866
On 31 December 34,274 34,274 32,911
Amortization
On 1 January 308,100 285,161 236,479
Amortization - 21,509 44,575
Translation (losses)/gains -6,028 1,430 4,108
On 31 December 302,072 308,100 285,161
Net book value
On 1 January - 22.846 71,351
On 31 December - - 22,846
As the criteria of IAS38.57 are no longer fulfilled, Barco’s
accounting policy, with respect to research and development
costs, no longer allows the capitalization of development
expenses since 2015. Capitalized development expenses are
amortized over their expected useful lives, which is generally
2 years (see Accounting principles). As of the end of 2016,
capitalized development expenses are fully amortized.
Impairment tests on capitalized development costs, resulted
in the recognition of impairment costs in 2016, for an
amount of 1.4 million euro, on certain specific capitalized
development projects, which were predicted to be less success-
ful as originally anticipated and in 2015, for an amount of
4.9 million euro, representing mainly the write-off of all
remaining capitalized development projects in LED and
Lighting (in the Entertainment division), in view of the lower
results realized.
The recognized impairment losses on capitalized develop-
ment are allocated to the divisions as follows:
IN THOUSANDS OF EURO 2016 2015
Entertainment 679 3,039
Enterprise 402 1,683
Healthcare 283 144
Total 1,364 4,866
C/55 Barco annual report 2017

12. Other intangible assets and tangible fixed assets
IN THOUSANDS OF EURO 2017 2016 2015
SOFTWARE
CUSTOMER
RELATIONS KNOW HOW
OTHER INTAN-
GIBLE ASSETS
OTHER INTANGIBLE
ASSETS UNDER CONSTRUC-
TION TOTAL TOTAL TOTAL
At cost
On 1 January 48,329 19,000 23,817 37,366 12,151 140,663 101,874 93,640
Expenditure 2,592 - - 49 3,992 6,634 6,946 5,418
Sales and disposals -260 - -186 -16 - -462 -26 -272
Acquisition of subsidiaries - 3,036 166 - - 3,202 28,979 2,622
Disposal of subsidiaries -124 - - - - -124 - -
Transfers 10,062 - 26,429 -26,418 -10,073 - -9 17
Translation (losses)/gains -228 -1,017 -2,474 -893 - -4,612 2,897 448
On 31 December 60,372 21,019 47,752 10,087 6,071 145,300 140,663 101,874
Depreciation and impairment
On 1 January 24,326 14,719 12,808 13,045 - 64,898 49,246 37,714
Depreciation 6,783 -461 7,224 4,012 - 18,481 14,329 11,632
Impairment - - 1,536 - - 1,536 - -
Sales and disposals -260 - -186 -16 - -462 -24 -245
Acquisition of subsidiaries - - - - - - 3 325
Disposal of subsidiaries -114 - - - - -114 - -
Transfers - 2,324 4,880 -7,204 - - 96 -
Translation (losses)/gains -181 -807 -1,265 -146 - -2,400 1,246 -180
On 31 December 30,555 16,697 24,997 9,690 - 81,939 64,898 49,246
Carrying amount
On 1 January 24,003 4,281 11,009 24,321 12,151 75,765 52,628 55,926
On 31 December 29,817 4,322 22,755 397 6,071 63,361 75,765 52,628
In 2017, capital expenditures for intangible assets amount
to 6.6 million euro (2016: 6.9 million euro; 2015: 5.4 million
euro). Expenditures in 2017 include the implementation
cost of SAP ERP software for 5.4 million euro. The customer
list from the P2M asset deal (3.0 million euro) is included
in ‘acquisition of subsidiaries’. In 2016, total intangible
assets include the investment in in-process development
acquired through the MTT and Medialon acquisitions (29.0
million euro) which are amortized between four and six years
over their useful life and the SAP ERP system (4.6 million euro).
In 2015, acquisition of subsidiaries related for the major part to
the customer list acquired through the acquisition of Advan.
The SAP capital expenditures are depreciated as roll out is
performed successfully pro rata the amount of licenses used.
12.1 Other intangible assets
C/56Barco annual report 2017Financial statements
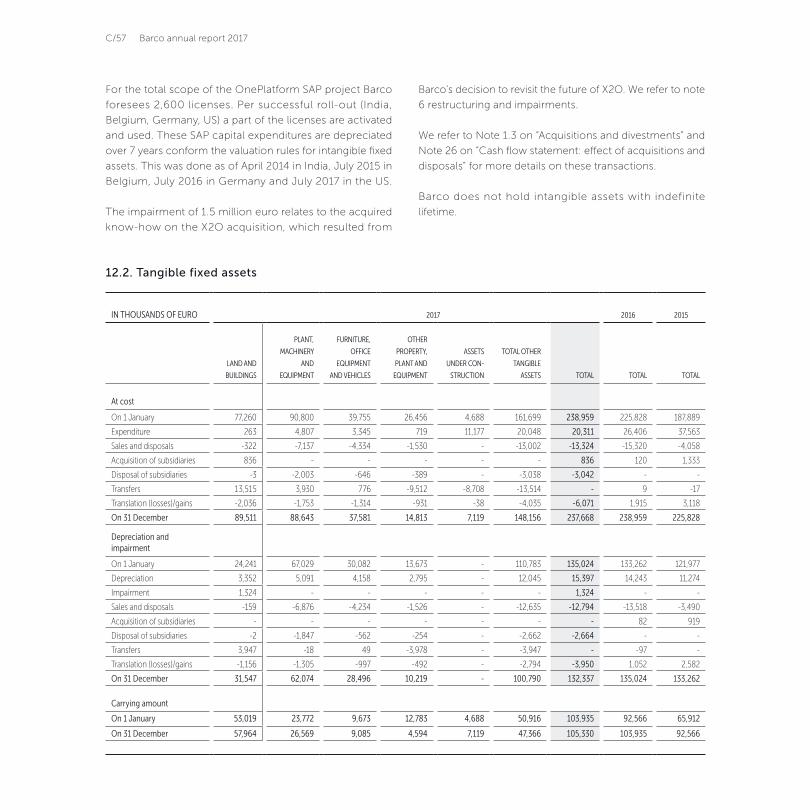
For the total scope of the OnePlatform SAP project Barco
foresees 2,600 licenses. Per successful roll-out (India,
Belgium, Germany, US) a part of the licenses are activated
and used. These SAP capital expenditures are depreciated
over 7 years conform the valuation rules for intangible fixed
assets. This was done as of April 2014 in India, July 2015 in
Belgium, July 2016 in Germany and July 2017 in the US.
The impairment of 1.5 million euro relates to the acquired
know-how on the X2O acquisition, which resulted from
Barco’s decision to revisit the future of X2O. We refer to note
6 restructuring and impairments.
We refer to Note 1.3 on “Acquisitions and divestments” and
Note 26 on “Cash flow statement: effect of acquisitions and
disposals” for more details on these transactions.
Barco does not hold intangible assets with indefinite
lifetime.
12.2. Tangible fixed assets
IN THOUSANDS OF EURO 2017 2016 2015
LAND AND
BUILDINGS
PLANT,
MACHINERY
AND
EQUIPMENT
FURNITURE,
OFFICE
EQUIPMENT
AND VEHICLES
OTHER
PROPERTY,
PLANT AND
EQUIPMENT
ASSETS
UNDER CON-
STRUCTION
TOTAL OTHER
TANGIBLE
ASSETS TOTAL TOTAL TOTAL
At cost
On 1 January 77,260 90,800 39,755 26,456 4,688 161,699 238,959 225,828 187,889
Expenditure 263 4,807 3,345 719 11,177 20,048 20,311 26,406 37,563
Sales and disposals -322 -7,137 -4,334 -1,530 - -13,002 -13,324 -15,320 -4,058
Acquisition of subsidiaries 836 - - - - - 836 120 1,333
Disposal of subsidiaries -3 -2,003 -646 -389 - -3,038 -3,042 - -
Transfers 13,515 3,930 776 -9,512 -8,708 -13,514 - 9 -17
Translation (losses)/gains -2,036 -1,753 -1,314 -931 -38 -4,035 -6,071 1,915 3,118
On 31 December 89,511 88,643 37,581 14,813 7,119 148,156 237,668 238,959 225,828
Depreciation and impairment
On 1 January 24,241 67,029 30,082 13,673 - 110,783 135,024 133,262 121,977
Depreciation 3,352 5,091 4,158 2,795 - 12,045 15,397 14,243 11,274
Impairment 1,324 - - - - - 1,324 - -
Sales and disposals -159 -6,876 -4,234 -1,526 - -12,635 -12,794 -13,518 -3,490
Acquisition of subsidiaries - - - - - - - 82 919
Disposal of subsidiaries -2 -1,847 -562 -254 - -2,662 -2,664 - -
Transfers 3,947 -18 49 -3,978 - -3,947 - -97 -
Translation (losses)/gains -1,156 -1,305 -997 -492 - -2,794 -3,950 1,052 2,582
On 31 December 31,547 62,074 28,496 10,219 - 100,790 132,337 135,024 133,262
Carrying amount
On 1 January 53,019 23,772 9,673 12,783 4,688 50,916 103,935 92,566 65,912
On 31 December 57,964 26,569 9,085 4,594 7,119 47,366 105,330 103,935 92,566
C/57 Barco annual report 2017

In 2017, capital expenditures amount to 20.3 million euro
(26.4 million euro in 2016; 37.6 million euro in 2015) and
relate mainly to an extended operations facility at the new
headquarters of Barco (12.2 million euro) which started in
2016. Per end of 2017, 6.9 million euro is included in assets
under construction for this extended operations. Capital
expenditure in 2016 (26.4 million euro) mainly relates to plant,
machinery, equipment, furniture and hardware at the new
headquarters of Barco (14.2 million euro). Abroad, 1.6 million
euro in new machinery and R&D equipment was deployed
in Barco Taiwan Technology Ltd. in 2017 (2.1 million euro
in 2016).
Per end of 2015, the new headquarter building was included
in the assets under construction for a total amount of 44.2
million euro. This was reclassified to mainly land and build-
ings and to plant, machinery and equipment in 2016. The
depreciations started as of 1 February, 2016, as the building
was finished and people moved into the new building.
In 2017, following the acquisition of the additional 51% share
in Habornveien 53 AS, Barco transferred the building (Barco
Frederikstad AS) from assets under finance lease to building
of net 5.6 million euro. An impairment of 1.3 million euro
related to this building in Barco Frederikstad AS was recorded
in 2017 (see note 6). In 2017, disposal of subsidiaries relates
to the sale of Barco Lighting Systems and Barco Silex SA.
More information can be found in note 1.3 and 26. In 2017
also, large disposals were booked on the move from the
old production building to the new headquarters building.
In 2016, sales and disposals contains the sale of the former
headquarters building on which a gain of 6.9 million euro
was realized.
The main capex realized in the period 2015 – 2017 relate to
the new headquarters of Barco 70.6 million euro (spread over
2017: 12.2 million euro; 2016: 14.2 million euro; 2015: 44.2
million euro) and to the new factory in Taiwan 3.7 million
euro (spread over 2017: 1.6 million euro; 2016: 2.1 million
euro).
C/58Barco annual report 2017Financial statements
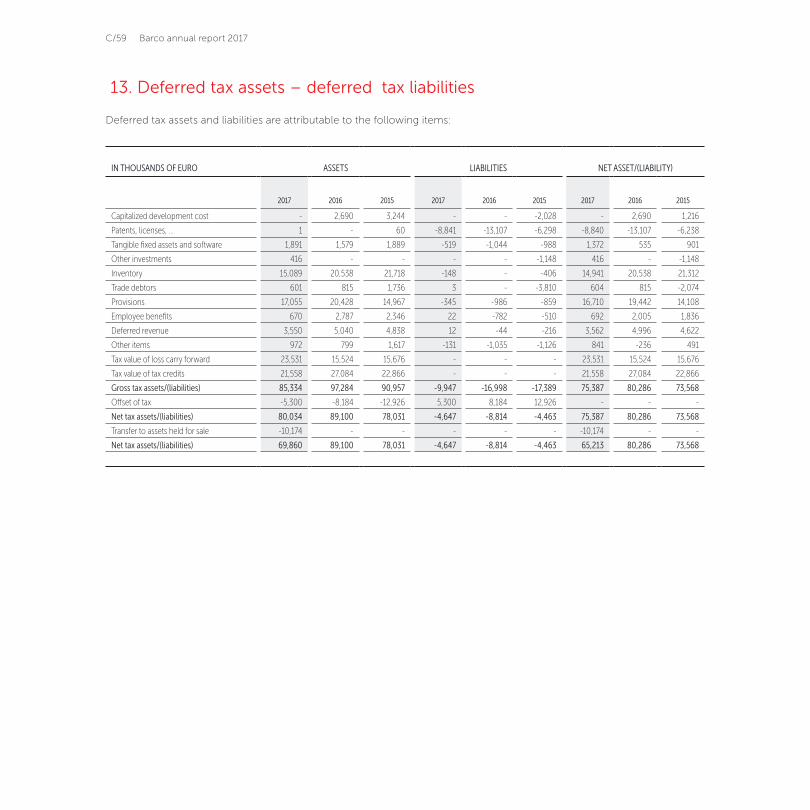
13. Deferred tax assets – deferred tax liabilities
IN THOUSANDS OF EURO ASSETS LIABILITIES NET ASSET/(LIABILITY)
2017 2016 2015 2017 2016 2015 2017 2016 2015
Capitalized development cost - 2,690 3,244 - - -2,028 - 2,690 1,216
Patents, licenses, ... 1 - 60 -8,841 -13,107 -6,298 -8,840 -13,107 -6,238
Tangible fixed assets and software 1,891 1,579 1,889 -519 -1,044 -988 1,372 535 901
Other investments 416 - - - - -1,148 416 - -1,148
Inventory 15,089 20,538 21,718 -148 - -406 14,941 20,538 21,312
Trade debtors 601 815 1,736 3 - -3,810 604 815 -2,074
Provisions 17,055 20,428 14,967 -345 -986 -859 16,710 19,442 14,108
Employee benefits 670 2,787 2,346 22 -782 -510 692 2,005 1,836
Deferred revenue 3,550 5,040 4,838 12 -44 -216 3,562 4,996 4,622
Other items 972 799 1,617 -131 -1,035 -1,126 841 -236 491
Tax value of loss carry forward 23,531 15,524 15,676 - - - 23,531 15,524 15,676
Tax value of tax credits 21,558 27,084 22,866 - - - 21,558 27,084 22,866
Gross tax assets/(liabilities) 85,334 97,284 90,957 -9,947 -16,998 -17,389 75,387 80,286 73,568
Offset of tax -5,300 -8,184 -12,926 5,300 8,184 12,926 - - -
Net tax assets/(liabilities) 80,034 89,100 78,031 -4,647 -8,814 -4,463 75,387 80,286 73,568
Transfer to assets held for sale -10,174 - - - - - -10,174 - -
Net tax assets/(liabilities) 69,860 89,100 78,031 -4,647 -8,814 -4,463 65,213 80,286 73,568
Deferred tax assets and liabilities are attributable to the following items:
C/59 Barco annual report 2017

Movements in the deferred tax assets/(liabilities) arise from the following:
IN THOUSANDS OF EUROAS AT
1 JANUARY
RECOGNIZED THROUGH
INCOMESTATEMENT
RECOGNIZED THROUGH
OCI
ACQUISITIONS AND
DISPOSALS
EXCHANGE GAINS AND
LOSSES
TRANSFER TO ASSETS HELD
FOR SALEAS AT
31 DECEMBER
Capitalized development cost 2,690 -2,690 - - - - -
Patents, licenses, ... -13,107 3,623 - -41 686 - -8,840
Tangible fixed assets and software 535 1,090 - -156 -97 - 1,372
Other investments - 442 - - -26 - 416
Inventory 20,538 -4,278 - -93 -1,226 -1,592 13,349
Trade debtors 815 -151 - - -60 -255 349
Provisions 19,442 575 -2,336 - -971 -8,327 8,383
Employee benefits 2,005 -1,169 - - -144 - 692
Deferred revenue 4,996 -889 - - -545 - 3,562
Other items -236 1,122 - - -46 - 840
Tax value of loss carry forward 15,524 8,271 - - -264 - 23,531
Tax value of tax credits 27,084 -5,522 - - -4 - 21,558
Total 80,286 425 -2,336 -290 -2,697 -10,174 65,213
On top of the tax losses and tax credits for which a net
deferred tax is recognized (net deferred tax asset of respec-
tively 23.5 million euro and 21.6 million euro), the Group
owns tax losses carried forward and other temporary dif-
ferences on which no deferred tax asset is recognized
amounting to 70.2 million euro as of 31 December 2017
(resulting in a non-recognized deferred tax asset of rounded
18.8 million euro) and unutilized capital losses carried forward
on which no deferred tax asset is recognized amounting to
31.4 million euro (resulting in a non-recognized deferred
tax asset of rounded 8.0 million euro). Deferred tax assets
have not been recognized on these items because it is not
probable that taxable profit will be available in the near future
against which the benefits can be utilized. The tax losses
carried forward and other temporary differences on which
no deferred tax asset is recognized have no expiration date.
Deferred tax assets relate for the major part to the tax value
of loss carry forwards and tax credits and almost fully relate
to Belgium. We refer to note 7 for impact of changes in tax
regulations in Belgium and US. In assessing the realization
of deferred tax assets, management considers whether
it is probable that some portion or all of the deferred tax
assets will be realized within the foreseeable future. The ulti-
mate realization of deferred tax assets is dependent upon
the generation of future taxable profit during the periods
in which those temporary differences become deductible.
Management considers the scheduled reversal of deferred
tax liabilities, projected future taxable profit and tax plan-
ning strategies in making this assessment. A time period of
5 years is considered. In order to fully realize the deferred tax
asset, the group will need to generate future taxable profit in
the countries where the net operating losses were incurred.
Based upon the level of historical taxable income and pro-
jections for future taxable profit over the periods in which
the deferred tax assets are deductible, management believes
as at 31 December 2017, it is probable that the group will
be able to recover these deductible temporary differences.
C/60Barco annual report 2017Financial statements

14. Inventory
The amount of write-offs recognized as expense in 2017
amounts to 8.4 million euro or 0.8% of sales (2016: 10.8 mil-
lion euro; 1% of sales, 2015: 14.2 million euro; 1.4% of sales).
In 2017 4.4 million euro write-offs resulting from the decision
to phase out certain businesses are included in restructuring
and impairment costs (in 2016 3.5 million euro). See note 6.
The inventory turns, including BarcoCFG, remained stable
at 3.6.
IN THOUSANDS OF EURO 2017 2016 2015
Raw materials and consumables 73,456 80,922 77,092
Work in progress 50,133 65,288 61,390
Finished goods 100,951 128,835 129,620
Write-off on inventories -91,786 -108,843 -102,142
Inventory 132,754 166,202 165,960
Inventory turns 3.6 3.6 3.6
Barco has not recognized income taxes on undistributed
earnings of its subsidiaries, joint ventures and associates,
as the undistributed earnings will not be distributed in the
foreseeable future. The cumulative amount of undistributed
earnings on which the Group has not recognized income
taxes was approximately 457 million euro at 31 December
2017; 529 million euro at 31 December 2016 and 747 million
euro at 31 December 2015.
C/61 Barco annual report 2017

15. Amounts receivable and other non-current assets
(a) Movement in bad debt reserve:
IN THOUSANDS OF EURO 2017 2016 2015
Trade debtors - gross 153,920 194,119 196,262
Trade debtors - bad debt reserve ( a ) -4,481 -5,558 -9,351
Trade debtors - net ( b ) 149,439 188,561 186,910
V.A.T. receivable 7,461 7,461 6,376
Taxes receivable 4,787 3,074 10,881
Interest receivable 777 1 2,800
Currency rate swap (note 21) 677 858 1,750
Guarantees paid 74 60 51
Other 5,592 4,130 4,299
Other amounts receivable 19,368 15,584 26,157
Other non-current assets ( c ) 12,887 19,112 23,226
Number of days sales outstanding (DSO) incl CFG 55 55 58
IN THOUSANDS OF EURO 2017 2016 2015
On 1 January -5,558 -9,351 -8,711
Acquisition of subsidiaries - - -121
Sale of subsidiary 43 - -
Additional provisions -3,913 -1,329 -2,850
Amounts used 199 928 1,350
Amounts unused 3,472 4,117 1,488
Transfer to assets held for sale 1,021 - -
Translation (losses) / gains 256 78 -507
On 31 December -4,481 -5,558 -9,351
Per 31 December 2017, the number of days sales outstanding
(including trade debtors of BarcoCFG, presented in assets
held for sale) are 55 days or equal to 2016 (58 days at the end
of 2015). Decrease in trade debtors, is mainly the result of
the presentation of the trade debtors in BarcoCFG as assets
held for sale. Excluding this impact, trade debtors are 3%
lower than last year. At constant currencies, trade debtors
have increased (see Free CashFlow on C/100).
The bad debt reserve in proportion to the gross amount
of trade debtors has remained stable at 2.9% (2016: 2.9%,
2015: 4.8%).
C/62Barco annual report 2017Financial statements

(b) At 31 December 2017, the aging analysis of trade receivables is as follows:
IN THOUSANDS OF EURO 2017 2016 2015
Not due 120,603 152,402 144,412
Overdue less than 30 days 19,426 18,121 23,177
Overdue between 30 and 90 days 8,184 13,358 16,375
Overdue between 90 days and 180 days 2,331 5,308 4,816
Overdue more than 180 days 3,376 4,930 7,482
Total gross 153,920 194,119 196,262
Bad debt reserve -4,481 -5,558 -9,351
Total 149,439 188,561 186,910
In 2017, total overdue amounts decreased to a total amount
of 33.3 million euro compared to 41.7 million euro in 2016
(2015: 51.9 million euro).
The bad debt reserve in 2017 amounts to 133% of the trade
receivables overdue more than 180 days (2016: 113%, 2015:
125%).
(c) Other non-current assets
The non-current assets include long-term receivables in
the frame of vendor financing programs, amounting to 8.3
million euro per 31 December 2017, of which 8.3 million euro
(see note 16) offset by long term debt of the same amount
(2016: 13.5 million euro, of which 13.5 million euro offset
by a long-term debt; 2015: 15.4 million euro, of which 15.4
million euro offset by a long-term debt) and cash guarantees
for an amount of 3.6 million euro (2016: 3.7 million euro,
2015: 5.1 million euro)).
C/63 Barco annual report 2017

The net financial cash position decreased with 76.0 million
euro in 2017, mainly explained by the exclusion of the cash
of BarcoCFG of 67.4 million euro (see note 3: assets held for
sale). We refer to the cash flow note for explanation on the
cash movements.
The net financial cash in BarcoCFG amounted to 100 million
euro in 2016 and 77 million euro in 2015. The decrease in
2017 versus 2016 mainly relates to dividend payments and
currency translation impact.
(a) DepositsDeposits are short-term, highly liquid investments, which
are readily convertible to known amounts of cash. The
short-term deposits do not carry a material risk of change
in valuation.
16. Net financial cash/debt
IN THOUSANDS OF EURO 2017 2016 2015
Deposits (a) 88,043 108,349 123,814
Cash at bank (b) 166,016 245,177 217,374
Cash in hand 71 22 90
Cash and cash equivalents 254,130 353,549 341,277
Long-term financial receivables (c) 8,267 13,485 15,430
Long-term debts (c) (d) -41,036 -66,811 -79,527
Current portion of long-term debts (d) -10,000 -11,500 -10,000
Short-term debts (e) -686 -2,085 -2,124
Net financial cash/(debt) 210,676 286,638 265,056
Cash held for sale 67,385
Total net financial cash / (debt) 278,061
IN THOUSANDS OF EURO 2017 2016 2015
- deposits in INR, with an average interest rate of 6.98% 15,950 11,060 5,202
- deposits in USD, with an average interest rate of 1.37% 5,469 14,475 23,560
- deposits in CNY, with an average interest rate of 4.03% 64,728 75,978 81,144
- deposits in other currencies 1,895 6,837 13,907
Total deposits 88,043 108,349 123,814
C/64Barco annual report 2017Financial statements

(b) Cash at bank
Cash at bank is immediately available, except for the cash
held in BarcoCFG (in CNY) (taken Barco only holds an own-
ership of 58% in this entity). In 2017 the cash at bank in
BarcoCFG is included in the assets held for sale (see note 3).
Most of the cash is held on accounts with higher interest-yield
compared to classical cash accounts. It is denominated in
the following currencies:
(c) Long-term financial receivables
Barco entered into a number of vendor financing programs
granted to a selective number of international customers. The
purpose of vendor financing is to grant extended payment
terms to such customers, while Barco continues to bene-
fit from prompt payment of the open accounts receivable
position, e.g. by having a financial institution or other third-
party in the middle. The third-party will directly or following
a receivable sale by Barco open a credit in favor of the cus-
tomer, thereby assuming the risk of non-payment on the
spread payment plan in all material respect.
In the case of a supplier credit, Barco continues to serve as
collection agent after the sale of the accounts receivable on
a non-recourse basis, which leads to a long-term financial
receivable from the customer (in line “Other non-current
assets”) this being offset by a long-term financial debt posi-
tion towards the third-party for the same amount (in line
“Long-term debts”). Due to its non-recourse character, both
positions are being eliminated in the net financial cash/(debt).
Per end of 2017, the outstanding long-term financial receiv-
ables have decreased to 8.3 million euro compared to 13.5
million euro in 2016.
When the vendor financing takes the form of a buyer credit
(direct financial contract between customer and financial
institution, and no role for Barco as collection agent), no
positions are being reflected in the balance sheet.
Where Barco assumes a small residual risk on the custom-
er’s payment behavior with recourse character (either in the
form of supplier credit or buyer credit), provisions are being
account for.
(d) Long-term financial debts
Besides a specific real estate credit facility in the US, the
Barco Group has a total of 116.0 million euro committed
credit facilities available. The portfolio consists of 3 major
tranches:
- Barco NV received a research, development and innovation
(RDI) credit facility from the European Investment Bank. The
aim of the facility is to finance RDI activities for networked
visualization connectivity and software. Drawings under
the facility have a long-term tenor of minimum 4 years.
2017 2016 2015
- EUR 47.7% 43.3% 59.7%
- USD 25.8% 14.3% 7.9%
- CNY 12.8% 34.8% 18.6%
- INR 0.4% 1.3% 2.7%
- Others 13.4% 6.3% 11.1%
C/65 Barco annual report 2017

An amount of 15.0 million euro is available and drawn under
the RDI credit facility, noting that the credit line is closed
going forward for new drawings.
- Barco NV and Barco Coordination Center NV (as co-
obligors) signed a number of bilateral committed credit
facilities with a selected group of commercial banks for a
total amount of 75 million euro. The credit facilities have
an availability period till December 2020. Drawings under
the facilities have a short-term tenor.
- Barco NV signed a number of bilateral committed credit
facilities aiming at financing Barco’s headquarter campus.
Drawings have a long-term tenor of 15 years following
the end of the availability period (as of the end of 2015).
An amount of 26 million euro is available and drawn under
this long-term real estate financing. These commitments
carry either a variable interest rate, or have been swapped via
derivatives into fixed rate character.
Barco is meeting all requirements of the loan covenants on
its available credit facilities.
The below table gives an overview of the long-term financial debts including the current portion of long-term financial debts,
per type of interest rate:
The below table summarizes the long-term financial debts, including the current portion of long-term financial debts,
per currency:
IN THOUSANDS OF EURO 2017 2016 2015
- EUR 41,000 52,500 61,000
- USD 2,745 4,961 5,893
- NOK - 9,365 8,999
- Other 7,291 11,486 13,634
Total 51,036 78,311 89,527
TYPE OF INTEREST RATE MATURITY 31 DEC 2017 31 DEC 2016 31 DEC 2015
Real estate financing:
- variable, swapped into fixed (EU) Later than 2022 14,663 15,938 17,213
- variable (EU) Later than 2022 11,338 12,063 12,788
- variable, swapped into fixed (US) Later than 2022 1,666 2,844 3,672
- fixed, financial leasing (Norway) ( 1 ) Later than 2022 - 9,365 8,999
RDI financing:
- fixed, European Investment Bank 2020 15,000 24,500 31,000
Vendor financing (offset by long-term receivable) 8,268 13,485 15,430
Other 103 118 425
Total long-term financial debts 51,036 78,311 89,527
(1) The financial leasing in Norway becomes zero due to the purchase of the shares of Habornveien 53, the entity owning the building leased by Barco Frederikstad AS (see note 9. Investments). This results in a transfer of fixed assets held under leasing to buildings (see note 12b. Tangible fixed assets).
C/66Barco annual report 2017Financial statements

The long-term debts (including interests due), excluding
the current portion of the long-term debts, are payable as
follows:
(e) Short-term financial debts
The below table gives an overview of the short-term financial debts on 31 December 2017:
The available 75 million euro bilateral credit facilities are
undrawn per end of December 2017.
PER 31 DECEMBER 2017 PER 31 DECEMBER 2016 PER 31 DECEMBER 2015
Payable in 2019 16,592 Payable in 2018 14,101 Payable in 2017 15,558
Payable in 2020 4,129 Payable in 2019 20,638 Payable in 2018 11,923
Payable in 2021 2,561 Payable in 2020 5,115 Payable in 2019 22,422
Payable in 2022 4,184 Payable in 2021 3,585 Payable in 2020 5,119
Later 17,802 Later 35,156 Later 39,072
Total long-term debts 45,267 Total long-term debts 78,596 Total long-term debts 94,095
IN THOUSANDS OF EURO 2017 2016 2015
EFFECTIVE INTEREST RATE
BALANCEEFFECTIVE
INTEREST RATEBALANCE
EFFECTIVE INTEREST RATE
BALANCE
- Other 0.0% 686 2.4% 2,085 2.3% 2,124
Total 686 2,085 2,124
C/67 Barco annual report 2017

PER 31 DECEMBER 2017 PER 31 DECEMBER 2016 PER 31 DECEMBER 2015
Payable in 2019 4,555 Payable in 2018 5,599 Payable in 2017 946
Payable in 2020 - Payable in 2019 5,599 Payable in 2018 946
Payable in 2021 - Payable in 2020 - Payable in 2019 946
Payable in 2022 - Payable in 2021 - Payable in 2020 -
Later - Later - Later -
Other long-term liabilities 4,555 Other long-term liabilities 11,198 Other long-term liabilities 2,839
17. Other long-term liabilities
IN THOUSANDS OF EURO 2017 2016 2015
Loan former DAT business (a) 310 2,666 2,839
MTT long-term liability (b) 3,745 8.533
Contingent consideration (c) 500
Other long-term liabilities 4,555 11.198 2,839
(a) Following the divestment of the Defense & Aerospace division, a govern-
mental loan in the amount of 2.8 million euro was formally transferred to
Esterline BVBA, whilst the payment obligation though (based on the sales
agreement) remains with Barco in a back-to-back structure. In 2017 Barco
refunded 0.1 million euro on this loan (2016: 0.2 million euro). The remaining
pay-outs for 2018 and 2019 are expected to amount to 0.3 million euro.
The resulting revenue amounting to 2.2 million euro was booked in other
operating income (see note 4d). The amount is repayable in 2019 as shown
in the below table.
(b) The MTT long-term liability consists of a deferred payment (1.7 million euro)
and an earn-out subject to filing of patents on the in-process technology of
2.1 million euro (capped at 5 million dollar (4.7 million euro)), linked to the
MTT acquisition. The deferred payment originally amounted to 6 million
dollar (5.7 million euro), of which 2 million dollar (1.8 million euro) was paid
in 2017. 2 million dollar (1.8 million euro) becomes payable in 2018 and
is included in other current liabilities. The remaining 2 million dollar (1.8
million euro) shown in other long-term liabilities is payable in 2019. The
remaining decrease in the MTT long-term liability is linked to the earn-out
payable: one patent got filed in 2017, another two are expected to be filed
in 2018 (total amount of 2.5 million dollar or 2.1 million euro for the three
patents), all included in other current liabilities. The timing of the remaining
patent filings is difficult to predict and are therefore shown as payable in
2019 in the below table.
(c) The contingent consideration of 0.5 million euro is linked to the P2M
acquisition and based on a revenue target, payable in 2019.
The other long-term liabilities, excluding the current portion
of the long-term liabilities, are repayable as follows:
C/68Barco annual report 2017Financial statements

18. Equity attributable to equity holders of the parent
IN THOUSANDS OF EURO 2017 2016 2015
Share capital 55,857 55,823 55,648
Share premium 146,051 145,653 143,330
Share-based payments 7,511 6,230 5,968
Acquired own shares -42,205 -47,787 -54,443
Retained earnings 457,053 452,629 470,926
Cumulative translation adjustment -43,717 -20,811 -22,421
Derivatives -1,100 -1,493 -1,269
Equity attributable to equity holders of the parent 579,449 590,243 597,739
1. Share capital, share premium and own shares
The following capital increases took place in 2017:
- Through the exercise of 6,027 warrants into the same num-
ber of new shares on 26 June 2017 with a resulting increase
of the statutory capital of 26 (‘000) euro and an increase
of the share premium account of 308 (‘000) euro.
- Through the exercise of 1,070 warrants into the same num-
ber of new shares on 25 September 2017 with a resulting
increase of the statutory capital of 5 (‘000) euro and an
increase of the share premium account of 47 (‘000) euro.
- Through the exercise of 760 warrants into the same num-
ber of new shares on 22 December 2017 with a resulting
increase of the statutory capital of 3 (‘000) euro and an
increase of the share premium account of 43 (‘000) euro.
As a result thereof the company’s share capital amounts
to 55.9 million euro on 31 December 2017, consisting of
13,064,464 fully paid shares.
Barco acquired own shares in 2015, based on the share-
holder authorization granted by the Extraordinary General
Meeting of 24 April 2014 and the announcement on May 7th,
2014 that the company would launch a first share buy-back
program, for a period of 6 months, starting on 8 May, 2014
and a second announcement on 7 November, 2014 to extend
the share buy-back period with another 6 months, starting
10 November. Barco acquired 89,410 own shares for a total
amount of 5,046 (000) Euro in 2015. In 2016 and 2017, Barco
did not acquire own shares. In total, Barco now owns 704,949
own shares.
Barco sold 77,843 own shares upon the exercise of 77,843
stock options per 21 June 2017 with a resulting decrease
of the own shares of 4,680 (000) euro and a decrease of
the share based payment account of 216 (000) euro, 9,872
own shares through the exercise of 9,872 stock options per
20 September 2017 with a resulting decrease of the own
shares of 594 (‘000) euro and a decrease of the share based
payment account of 31 (000) and 5,125 own shares through
the exercise of 5,125 stock options per 21 December 2017
with a resulting decrease of the own shares of 308 (‘000)
euro and a decrease of the share based payment account
of 22 (‘000) euro.
C/69 Barco annual report 2017
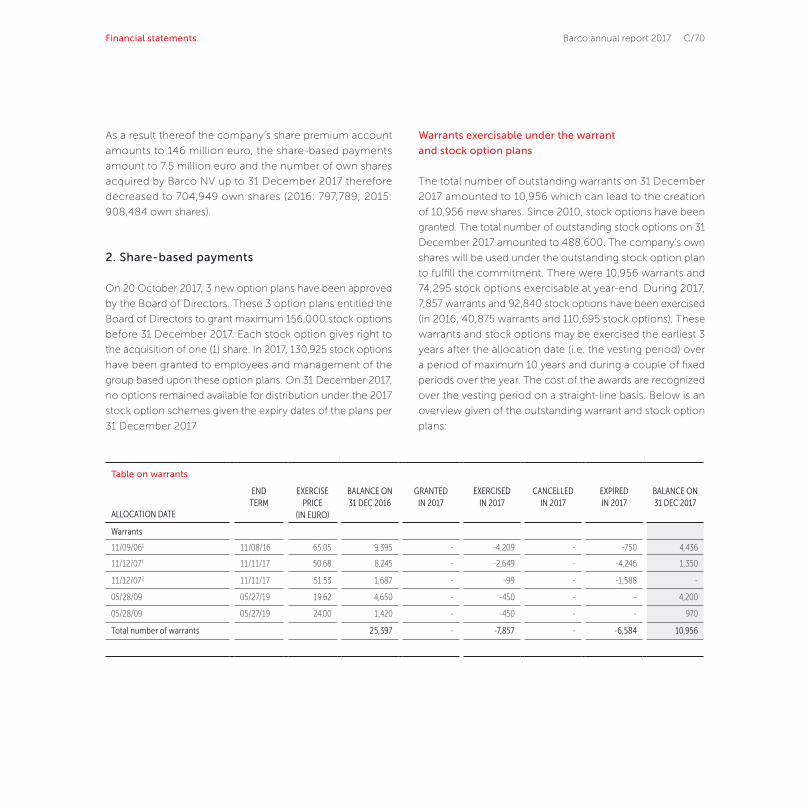
As a result thereof the company’s share premium account
amounts to 146 million euro, the share-based payments
amount to 7.5 million euro and the number of own shares
acquired by Barco NV up to 31 December 2017 therefore
decreased to 704,949 own shares (2016: 797,789; 2015:
908,484 own shares).
2. Share-based payments
On 20 October 2017, 3 new option plans have been approved
by the Board of Directors. These 3 option plans entitled the
Board of Directors to grant maximum 156,000 stock options
before 31 December 2017. Each stock option gives right to
the acquisition of one (1) share. In 2017, 130,925 stock options
have been granted to employees and management of the
group based upon these option plans. On 31 December 2017,
no options remained available for distribution under the 2017
stock option schemes given the expiry dates of the plans per
31 December 2017.
Warrants exercisable under the warrant
and stock option plans
The total number of outstanding warrants on 31 December
2017 amounted to 10,956 which can lead to the creation
of 10,956 new shares. Since 2010, stock options have been
granted. The total number of outstanding stock options on 31
December 2017 amounted to 488,600. The company’s own
shares will be used under the outstanding stock option plan
to fulfill the commitment. There were 10,956 warrants and
74,295 stock options exercisable at year-end. During 2017,
7,857 warrants and 92,840 stock options have been exercised
(in 2016, 40,875 warrants and 110,695 stock options). These
warrants and stock options may be exercised the earliest 3
years after the allocation date (i.e. the vesting period) over
a period of maximum 10 years and during a couple of fixed
periods over the year. The cost of the awards are recognized
over the vesting period on a straight-line basis. Below is an
overview given of the outstanding warrant and stock option
plans:
Table on warrants
ALLOCATION DATE
ENDTERM
EXERCISE PRICE
(IN EURO)
BALANCE ON 31 DEC 2016
GRANTED IN 2017
EXERCISED IN 2017
CANCELLED IN 2017
EXPIRED IN 2017
BALANCE ON 31 DEC 2017
Warrants
11/09/061 11/08/16 65.05 9,395 - -4,209 - -750 4,436
11/12/071 11/11/17 50.68 8,245 - -2,649 - -4,246 1,350
11/12/072 11/11/17 51.53 1,687 - -99 - -1,588 -
05/28/09 05/27/19 19.62 4,650 - -450 - - 4,200
05/28/09 05/27/19 24.00 1,420 - -450 - - 970
Total number of warrants 25,397 - -7,857 - -6,584 10,956
C/70Barco annual report 2017Financial statements

The cost of these warrant/stock option plans is included
in the income statement in other operating expense. The
warrants/stock options are measured at grant date, based
on the share price at grant date, exercise price, expected
volatility, dividend estimates and interest rates. The warrant/
stock option cost is taken into result on a straight-line basis
from the grant date until the first exercise date. The share-
based payment expenses amounted to 1.5 million euro in
2017 (2016: 1.2 million euro; 2015: 1.3 million euro).
(1) For a number of warrants this last exercise date was extended with three (3) years according to article 407 of the law of 24 December 2002
(2) Deviation of exercise price as a result of the implementation of the UK sub plan
(3) Deviation of exercise price as a result of the implementation of the US sub plan
Table on warrants
ALLOCATION DATE
ENDTERM
EXERCISE PRICE
(IN EURO)
BALANCE ON 31 DEC 2016
GRANTED IN 2017
EXERCISED IN 2017
CANCELLED IN 2017
EXPIRED IN 2017
BALANCE ON 31 DEC 2017
Stock options
10/28/10 10/27/20 35.85 1,400 - - - - 1,400
10/28/11 10/27/21 36.65 5,150 - -750 - - 4,400
10/31/12 10/30/22 52.37 8,100 - -2,325 - -800 4,975
10/31/12 10/30/20 52.37 6,100 - -1,750 -150 - 4,200
10/31/123 10/30/20 53.00 12,735 - -4,050 - - 8,685
10/21/13 10/20/23 59.03 56,650 - -48,400 -250 -1,000 7,000
10/21/13 10/20/21 59.03 11,200 - -3,625 -150 -250 7,175
10/21/133 10/20/21 60.94 17,200 - -4,350 - -200 12,650
10/23/14 10/22/24 55.00 53,040 - - -950 - 52,090
10/23/14 10/22/22 55.00 30,650 - -16,490 -1,150 -250 12,760
10/23/143 10/22/22 55.40 22,500 - -11,100 -150 -200 11,050
10/22/15 10/21/25 57.10 54,825 - - -2,450 - 52,375
10/22/15 10/21/23 57.10 31,550 - - -3,500 - 28,050
10/22/153 10/21/23 57.85 24,550 - - -1,850 - 22,700
10/24/16 10/23/26 72.80 74,205 - - - - 74,205
10/24/16 10/23/24 72.80 20,110 - - -1,000 - 19,110
10/24/163 10/23/24 74.24 35,750 - - -900 - 34,850
10/20/17 10/19/27 87.75 - 87,625 - - - 87,625
10/20/17 10/19/25 87.75 - 12,600 - - - 12,600
10/20/173 10/19/25 88.70 - 30,700 - - - 30,700
Total number of stockoptions 465,715 130,925 -92,840 -12,500 -2,700 488,600
C/71 Barco annual report 2017

3. Retained earnings
The change in retained earnings includes the net income of
2017, 2.9 million euro of actuarial gains and losses and the
distribution of 23.3 million euro dividend, as approved by the
general shareholders meeting of 27 April 2017. The board of
directors of Barco NV proposed a gross dividend of 2.1 euro
per share relating to the result as of 31 December 2017. In
2017 a gross dividend of 1.9 euro per share was paid out on
the results of 2016; in 2016 1.75 euro was paid out.
4. Cumulative translation adjustment
In 2017, the exchange differences on translation of foreign
operations have a negative impact of 22.9 million euro,
19. Non-controlling interest
mainly relating to foreign operations held in US Dollar
(-9.5 million euro), Chinese Yuan (-8.6 million euro),
Indian Rupee (-2.8 million euro), Hong Kong Dollar
(-1 million euro) and Norway Krone (-1 million euro). On
the divestment of Barco Lighting Systems, -2.0 million
euro is recycled through profit and loss.
5. Derivatives
Derivative financial instruments are disclosed in note 22.
NAME
COUNTRY OFINCORPORATION AND OPERATION 2017 2016 2015
CFG Barco (Beijing) Electronics Co., Ltd China 42% 42% 42%
Barco Taiwan Technology Ltd. Taiwan 10% 10% 10%
Barco China Electronic Visualization Technology China 35% 35% 0%
IN THOUSANDS OF EURO 2017 2016 2015
CFG Barco (Beijing) Electronics Co., Ltd 11,793 22,415 13,614
Barco Taiwan Technology Ltd. -374 78 310
Barco China Electronic Visualization Technology 2,646 2,751 -
Total equity attributable to non-controlling interest 14,065 25,244 13,925
The below table represents the proportion of equity interest held by non-controlling interests:
Overview of the equity attributable to non-controlling interest:
C/72Barco annual report 2017Financial statements

IN THOUSANDS OF EURO 2017 2016 2015
Total non-current assets 10,827 7,881 5,883
Total current assets 129,047 164,987 123,088
Total assets 139,874 172,868 128,971
Equity attributable to equityholders of the parent 16,326 31,031 18,848
Equity attributable to non-controlling interest 11,793 22,415 13,614
Total equity 28,118 53,447 32,462
Total current liabilities 111,755 119,422 96,509
Total liabilities 139,874 172,868 128,971
The main contributor to the non-controlling interest is CFG Barco (Beijing) Electronics Co., Ltd. Below is its balance sheet as at 31 December
2017, 2016 and 2015. This information is based on amounts before intercompany eliminations. In 2017 assets and liabilities of BarcoCFG are
included in assets held for sale (note 3).
IN THOUSANDS OF EURO% non-
controlling 2017 2016 2015
CFG Barco (Beijing) Electronics Co., Ltd 20,025 35,628 21,666
Barco Taiwan Technology Ltd. -4,650 -2,369 -903
Barco China Electronic Visualization Technology 178 -215 0
Net income 15,553 33,044 20,762
CFG Barco (Beijing) Electronics Co., Ltd 42% 8,411 14,964 9,100
Barco Taiwan Technology Ltd. 10% -465 -237 -90
Barco China Electronic Visualization Technology 35% 62 -75 0
Net income attributable to non-controlling interest 8,008 14,652 9,009
Overview of the net income attributable to non-controlling interest:
Other comprehensive income / (loss) for the period, net of tax effect, part attributable to non-controlling interest amounts to -1.3 million euro in 2017, -0.4 million
euro in 2016 and 0.4 million euro in 2015.
Total comprehensive income for the year, net of tax, part attributable to non-controlling interest amounts to 6.7 million euro in 2017, 14.2 million euro in 2016 and
9.4 million euro in 2015.
C/73 Barco annual report 2017

20. Trade payables and advances received from customers
IN THOUSANDS OF EURO 2017 2016 2015
Trade payables 102,943 135,127 139,504
Days payable outstanding (DPO) 58 63 69
Advances received from customers (a) 67,040 109,064 113,874
(a) Most payment terms of customers define that 30% of the total invoice needs to be prepaid before delivery of the goods. The decrease in advances received in
2017 compared to 2016 is partly caused by the advances received in BarcoCFG (21.8 million euro), which are in 2017 shown as part of the assets held for sale
(see note 3) and partly by lower advances received in Entertainment, mainly linked to lower cinema sales. The decrease in advances in 2016 compared to 2015
is mainly caused by lower advances received in in BarcoCFG.
21. Provisions
IN THOUSANDS OF EURO
BALANCESHEET2017
SALE OF SUBSI-DIARY
(-)
ADDITIONALPROVISIONS
MADE
AMOUNTSUSED
UNUSEDAMOUNTSREVERSED
REMEASURE-MENT GAINS /
(LOSSES)ON DBO
TRANSFER TO ASSETS HELD FOR
SALE
TRANS-LATION
(LOSSES) / GAINS
BALANCESHEET2016
BALANCE SHEET2015
Total long-term provision 24,607 -100 3,135 -974 -2,349 -5,224 - -704 30,824 17,992
Defined benefit obligations (b) 12,596 -100 1,034 -974 -102 -5,224 - 27 17,936 5,811
Technical warranty (a) 12,011 - 2,101 - -2,247 - - -731 12,888 12,181
Total short-term provision 26,904 -231 11,087 -6,370 -2,579 - -3,608 -1,052 29,657 28,910
Technical warranty (a) 12,011 -231 2,101 -1,739 - - -3,608 -731 16,219 12,181
Restructuring provision (c) 6,596 - 5,200 -4,244 - - - - 5,640 8,260
Other claims and risks (d) 8,297 - 3,785 -386 -2,579 - - -321 7,798 8,469
Provisions 51,512 -331 14,221 -7,345 -4,928 -5,224 -3,608 -1,755 60,481 46,903
(a) Technical warranty
Provisions for technical warranty are based on historical expe-
rience of the level of repairs and replacements. Additional
provisions are set up when a technical problem is detected.
There are three different technical warranty provisions:
The amounts shown in the balance sheet on employee benefit liabilities are short term obligations and consist mainly of salaries, bonuses
and holiday payments.
provisions related to ‘normal’ (mostly 2 years) warranty period,
provisions related to extended warranty periods and provi-
sions for specific claims/issues.
C/74Barco annual report 2017Financial statements
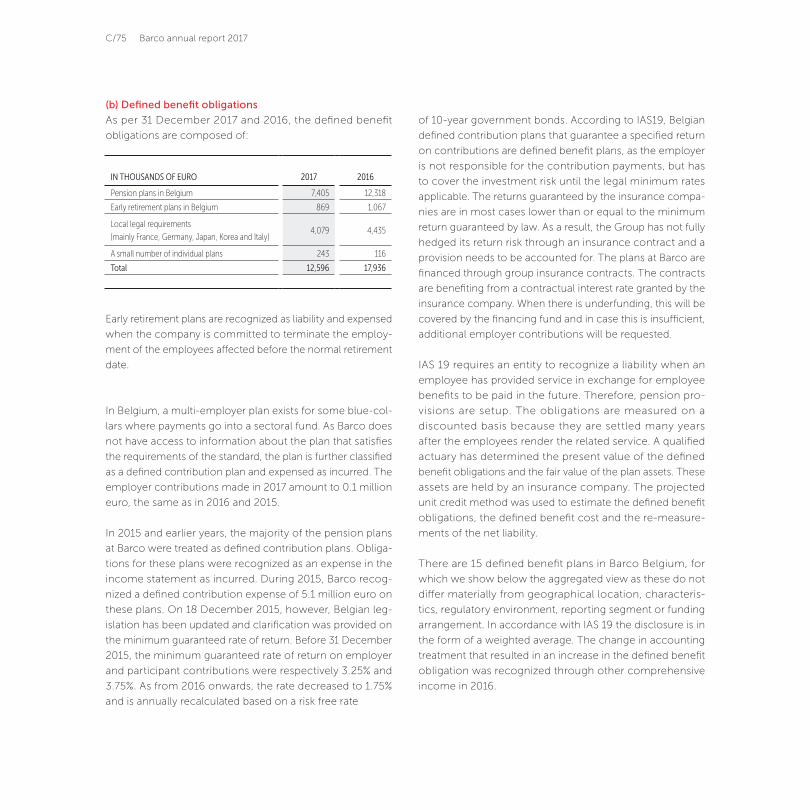
of 10-year government bonds. According to IAS19, Belgian
defined contribution plans that guarantee a specified return
on contributions are defined benefit plans, as the employer
is not responsible for the contribution payments, but has
to cover the investment risk until the legal minimum rates
applicable. The returns guaranteed by the insurance compa-
nies are in most cases lower than or equal to the minimum
return guaranteed by law. As a result, the Group has not fully
hedged its return risk through an insurance contract and a
provision needs to be accounted for. The plans at Barco are
financed through group insurance contracts. The contracts
are benefiting from a contractual interest rate granted by the
insurance company. When there is underfunding, this will be
covered by the financing fund and in case this is insufficient,
additional employer contributions will be requested.
IAS 19 requires an entity to recognize a liability when an
employee has provided service in exchange for employee
benefits to be paid in the future. Therefore, pension pro-
visions are setup. The obligations are measured on a
discounted basis because they are settled many years
after the employees render the related service. A qualified
actuary has determined the present value of the defined
benefit obligations and the fair value of the plan assets. These
assets are held by an insurance company. The projected
unit credit method was used to estimate the defined benefit
obligations, the defined benefit cost and the re-measure-
ments of the net liability.
There are 15 defined benefit plans in Barco Belgium, for
which we show below the aggregated view as these do not
differ materially from geographical location, characteris-
tics, regulatory environment, reporting segment or funding
arrangement. In accordance with IAS 19 the disclosure is in
the form of a weighted average. The change in accounting
treatment that resulted in an increase in the defined benefit
obligation was recognized through other comprehensive
income in 2016.
(b) Defined benefit obligations
As per 31 December 2017 and 2016, the defined benefit
obligations are composed of:
Early retirement plans are recognized as liability and expensed
when the company is committed to terminate the employ-
ment of the employees affected before the normal retirement
date.
IN THOUSANDS OF EURO 2017 2016
Pension plans in Belgium 7,405 12,318
Early retirement plans in Belgium 869 1,067
Local legal requirements
(mainly France, Germany, Japan, Korea and Italy) 4,079 4,435
A small number of individual plans 243 116
Total 12,596 17,936
In Belgium, a multi-employer plan exists for some blue-col-
lars where payments go into a sectoral fund. As Barco does
not have access to information about the plan that satisfies
the requirements of the standard, the plan is further classified
as a defined contribution plan and expensed as incurred. The
employer contributions made in 2017 amount to 0.1 million
euro, the same as in 2016 and 2015.
In 2015 and earlier years, the majority of the pension plans
at Barco were treated as defined contribution plans. Obliga-
tions for these plans were recognized as an expense in the
income statement as incurred. During 2015, Barco recog-
nized a defined contribution expense of 5.1 million euro on
these plans. On 18 December 2015, however, Belgian leg-
islation has been updated and clarification was provided on
the minimum guaranteed rate of return. Before 31 December
2015, the minimum guaranteed rate of return on employer
and participant contributions were respectively 3.25% and
3.75%. As from 2016 onwards, the rate decreased to 1.75%
and is annually recalculated based on a risk free rate
C/75 Barco annual report 2017

2017 changes in the Belgian defined benefit obligation and fair value of plan assets:
2016 changes in the Belgian defined benefit obligation and fair value of plan assets:
IN THOUSANDS OF EURO 2017
DEFINED BENEFIT OBLIGATION
FAIR VALUE OF PLAN ASSETS
NET DEFINED BENEFIT LIABILITY
On 1 January 92,041 -79,722 12.318
Pension cost charged to P/L
Service cost 6,556 - 6.556
Net interest expense 1,047 -944 104
Sub-total included in profit or loss 7,603 -944 6.660
Benefits paid -484 484 -
Remeasurement gains/losses in OCI
Increase due to effect of transfers - - -
Return on plan assets (excluding amounts included in net interest expense) - -1,882 -1,882
Actuarial changes arising from changes in demographic assumptions - - -
Actuarial changes arising from changes in financial assumptions -3,567 - -3,567
Experience adjustments 226 - 226
Sub-total included in OCI -3,341 -1,882 -5,223
Contributions by employer - -6,198 -6,198
Disposal of subsidiaries -1,743 1,591 -152
On 31 December 94,077 -86,672 7,405
IN THOUSANDS OF EUROBALANCE SHEET
2015REMEAUSUREMENT
GAINS/LOSSES IN OCIBALANCE SHEET
2016
INCREASE DUETO EFFECT OF TRANSFERS
SUBTOTALINCLUDED
IN OCI
Defined benefit obligations - 92,041 92,041
Fair value of plan assets - -79,722 -79,722
Net defined benefit liability - 12,318 12,318
C/76Barco annual report 2017Financial statements

The fair value of the plan assets (86.9 million euro) are fully
invested in insurance policies. The target asset mix consists
of 65.3% government bonds, 16% real estate, 9.2% corporate
bonds, 5.5% corporate loans and 4% shares.
The principal assumptions used in determining pension
obligations for the Group's plans are shown below:
The following overview summarizes the sensitivity analysis
performed for significant assumptions as at 31 December.
The figures show the impact on the defined benefit
obligation.
2017 2016
Discount rate 1.51% 1.16%
Future salary increases 2.58% 2.59%
Future consumer price index increases 1.90% 1.90%
IN THOUSANDS OF EURO 2017 2016
Discount rate:
0.25% decrease 2,032 2,361
0.25% increase -2,019 -2,605
Future salary change:
0.25% decrease -564 -494
0.25% increase 762 478
Future consumer price index change:
0.25% decrease -253 -901
0.25% increase 557 836
IN THOUSANDS OF EURO 2017 2016
Within the next 12 months 3,684 2,408
Between 2 and 5 years 16,393 13,947
Between 5 and 10 years 29,748 23,614
Total expected payments 49,826 39,969
The sensitivity analyses above have been determined based
on a method that extrapolates the impact on the defined
benefit obligation as a result of reasonable changes in key
assumptions occurring at the end of the reporting period.
The sensitivity analyses are based on a change in a significant
assumption, keeping all other assumptions constant. These
may not be representative for an actual change in the defined
benefit obligation, as it is unlikely that changes in assumptions
would occur in isolation of one another.
The following payments are the expected benefit payments
from the plan assets:
The average duration of the defined benefit plan obligation at
the end of the reporting period is 13.8 years (same in 2016).
The expected employer contributions to the plan for the
next annual reporting period amounts to 6.6 million euro (6.3
million euro in 2016); the expected employee contributions
1.1 million euro (1.0 million euro in 2016).
C/77 Barco annual report 2017

(c) Restructuring provision
See note 6 Restructuring and impairments.
(d) Other claims and risks
This provision relates to disputes with suppliers and specific
customer warranty disputes. Barco cannot provide details on
the specific cases, as this could cause considerable harm to
Barco in the particular disputes.
On December 2nd, 2014, Barco has communicated that
an enquiry is ongoing with the authorities of the People’s
Republic of China regarding the importation of large video
walls. These import transactions were managed via custom
brokers on behalf of local distributors and the investigation
relates to the period between 1997 and 2009, prior to the
local assembly of such video walls in China. No provision has
been set up related to this investigation, as no formal claim
has been made towards Barco.
With respect to the contingent liabilities related to the MTT
and Medialon acquisitions, there is one earn-out capped at
15 million euro linked to the retention of the former share-
holders and one uncapped for which the future results could
not be reliably estimated at acquisition. The earn-outs would
flow through profit and loss at moment of payment over the
earn-out period, i.e. per end of 2021 for the capped one and
per end of June 2018 for the uncapped one.
C/78Barco annual report 2017Financial statements

22. Risk management - derivative financial instruments
General risk factors are described in the director’s report
“Risk Factors”.
Derivative financial instruments are used to reduce the expo-
sure to fluctuations in foreign exchange rates and interest
rates. These instruments are subject to the risk of market rates
changing subsequent to acquisition. These changes are ge-
nerally offset by opposite effects on the item being hedged.
Foreign currency risk
Recognized assets and liabilities
Barco incurs foreign currency risk on recognized assets and
liabilities when they are denominated in a currency other
than the company’s local currency. Such risks may be natu-
rally covered when a monetary item at the asset side (such
as a trade receivable or cash deposit) in a given currency is
matched with a monetary item at the liability side (such as a
trade payable or loan) in the same currency.
Forward exchange contracts and selectively option contracts
are used to manage the currency risk arising from recognized
receivables and payables, which are not naturally hedged.
The balances on foreign currency monetary items are valued
at the rates of exchange prevailing at the end of the account-
ing period. Derivative financial instruments that are used
to reduce the exposure of these balances are rated in the
balance sheet at fair value. Both changes in foreign currency
balances and in fair value of derivative financial instruments
are recognized in the income statement.
Forecasted transactions
Barco selectively designates forward contracts to forecasted
sales. Hedge accounting is applied to these contracts. The
portion of the gain or loss on the hedging instrument that will
be determined as an effective hedge is recognized directly in
comprehensive income. As at 31 December 2017, there were
no forward contracts outstanding under hedge accounting
treatment.
Estimated sensitivity to currency fluctuations
Sensitivity to currency fluctuations is mainly related to the
evolution of a portfolio of foreign currencies (mainly USD
and CNY) versus the euro. This sensitivity is caused by the
following factors:
- The fair value of foreign currency monetary items is
impacted by currency fluctuations. In order to eliminate
most of these effects in foreign currencies, Barco uses
monetary items and/or derivative financial instruments as
described above, which are meant to offset the impact of
such results to a major extent.
- As the company has no cash flow hedges in place that aim
at hedging forecasted transactions, a similar fluctuation in
foreign currencies would not have any effect on the equity
position of Barco.
- Profit margins may be negatively affected because an
important part of sales are realized in foreign currencies,
while costs are incurred for a smaller part in these cur-
rencies. Barco has done great efforts in recent years to
increase its natural hedging ratio in USD (being its main
foreign currency in terms of sales) by increasing its ope-
rational costs and by purchasing more components in this
currency. Impact on adjusted EBIT is currently estimated at
18 million euro when the weighted average rate of a foreign
currency basket that has an overall overweight of CNY and
a heavily reduced weight of USD changes by 10% versus
the euro in a year. The overall natural hedge ratio of for-
eign currencies reached a level of more than 70% in 2017.
- Another impact is the fact that some of Barco’s main com-
petitors are USD-based. Whenever the USD decreases in
value against the euro, these competitors have a world-
wide competitive advantage over Barco. This impact on
operating result cannot be measured reliably.
C/79 Barco annual report 2017

Interest rate risk
Barco uses following hedging instruments to manage its
interest rate risk:
Swap on outstanding or anticipated borrowing
Barco has an outstanding variable loan of 2.0 million US dollar
(1.7 million euro equivalent) in place, of which variable interest
rate conditions have been swapped into a fixed 3.86%. The
fair value of the interest rate swap with a notional amount
of 9.4 million US dollar or 7.8 million euro equivalent is fully
recognized in the income statement.
Barco also concluded a series of interest rate swaps with an
outstanding notional amount of 14.7 million euro by means
of a partial hedge for the bilateral committed Credit Facili-
ties (currently outstanding at 26.0 million euro) that aim at
financing Barco's new HQ campus. This instrument swaps
the variable interest rate into a fixed 1.76%. These swaps are
determined as an effective hedge of outstanding or anti-
cipated borrowings and meet the hedging requirements of
IAS 39. The fair values of the effective portion of the hedging
instrument are therefore recognized directly in comprehen-
sive income under hedge accounting treatment.
Estimated sensitivity to interest rate fluctuations
Management doesn’t expect the short-term interest rate to
increase significantly in the immediate foreseeable future,
which limits the interest exposure on the short-term debt
portfolio.
With reference to the Fair Values table below, just over 20%
of Barco’s outstanding long-term debt portfolio has a fixed
interest rate character, which again limits the exposure of the
company to interest rate fluctuations. This ratio increases to
close to 60% when including the swap instruments disclosed
above.
Credit risk
Credit risk on accounts receivable
Credit evaluations are performed on all customers requiring
credit over a certain amount. The credit risk is monitored on
a continuous basis. In a number of cases collateral is being
requested before a credit risk is accepted. Specific trade
finance instruments such as letters of credit and bills of
exchange are regularly used in order to minimize the credit
risk.
In 2017, Barco continued to conclude credit insurances in
order to cover credit risks on specific customers with whom
Barco entered into vendor financing agreements. Such ven-
dor financing agreements are concluded and monitored on
a case by case basis.
Credit risk on liquid securities and short-term
investments
A policy defining acceptable counter parties and the
maximum risk per counter party is in place. Short-term invest-
ments are made in marketable securities, cash holdings or
in fixed term deposits with reputable banks.
C/80Barco annual report 2017Financial statements

IN THOUSANDS OF EURO 2017 2016 2015
Carrying amount/Fair value (approx.)
Financial assets
Trade receivables 149,438 188,561 186,910
Other receivables 19,368 15,584 26,157
Loan and other receivables 17,913 14,725 22,315
Interest rate receivable 777 1 2,800
Currency rate swap 677 858 1,042
Other non-current assets 12,887 19,112 23,226
Cash and short-term deposits 254,130 353,549 341,277
Total 435,822 576,806 577,570
Financial liabilities
Financial debts 39,302 61,862 69,390
Floating rate borrowings 31,159 36,671 37,211
Fixed rate borrowings 8,143 25,191 32,179
Other long-term liabilities 4,555 11,198 2,839
Short-term debts 686 2,085 2,124
Trade payables 102,943 135,127 139,504
Other current liabilities 10,586 9,684 7,690
Other short term amounts payable 5,771 3,625 1,991
Dividends payable 2,347 2,368 2,134
Currency rate Swap 515 932 809
Interest rate swap 1,953 2,759 2,756
Total 158,072 219,956 221,547
Fair values
Set out below is an overview of the carrying amounts of
the group’s financial instruments that are showing in the
financial statements.
In general, the carrying amounts are assumed to be a close
approximation of the fair value.
The fair value of the financial assets and liabilities is defined
as the price that would be received to sell an asset or paid
to transfer a liability in orderly transaction in the principal
market at the measurement date under current market
conditions which are other than in a forced or liquidation
sale.
The following methods and assumptions were used to
estimate the fair values:
- Cash and short-term deposits, trade receivables, trade
payables, and other current liabilities approximate their
carrying amounts largely due to the short-term maturities
of these instruments.
- Long term fixed rate and variable rate other assets are eval-
uated by the Group based on parameters such as interest
C/81 Barco annual report 2017

rates, specific country risk factors, individual creditwor-
thiness of the customer and the risk characteristics of the
financed project. Based on this evaluation, allowances are
made to account for the expected losses of these receiv-
ables. As at 31 December 2017, the carrying amounts of
such receivables, net of allowances, are assumed not to
be materially different from their calculated fair values.
- The fair value of unquoted instruments, loans from banks
and other financial liabilities, obligations under finance
leases as well as other non-current financial liabilities is esti-
mated by discounting future cash flows using the effective
interest rates currently available for debt on similar terms,
credit risk and remaining maturities. As of 31 December
2017, the effective interest rate is not materially different
from the nominal interest rate of the financial obligation.
- The group enters into derivative financial instruments with
various counterparties, principally financial institutions with
investment grade credit ratings. Derivatives valued using
valuation techniques with market observable inputs are
mainly interest rate (cap/floor) swaps and foreign exchange
forward contracts. The most frequently applied valuation
techniques include forward pricing and swap models, using
present value calculations. The models incorporate various
inputs including foreign exchange spot and forward rates
and interest rate curves.
IN THOUSANDS OF EURO 2017 2016 2015
Assets measured at fair value
Financial assets at fair value through profit or loss
Foreign exchange contracts - non-hedged 677 858 1,042
Financial assets at fair value through equity
AFS investments - 9,074 8,000
Liabilities measured at fair value
Financial liabilities at fair value through profit or loss
Foreign exchange contracts - non-hedged 515 932 809
Interest rate swap 884 1,297 658
Financial liabilities at fair value through equity
Interest rate swap 1,069 1,462 2,098
Fair value hierarchy
As at 31 December 2017, the Group held the following financial instruments measured at fair value::
C/82Barco annual report 2017Financial statements
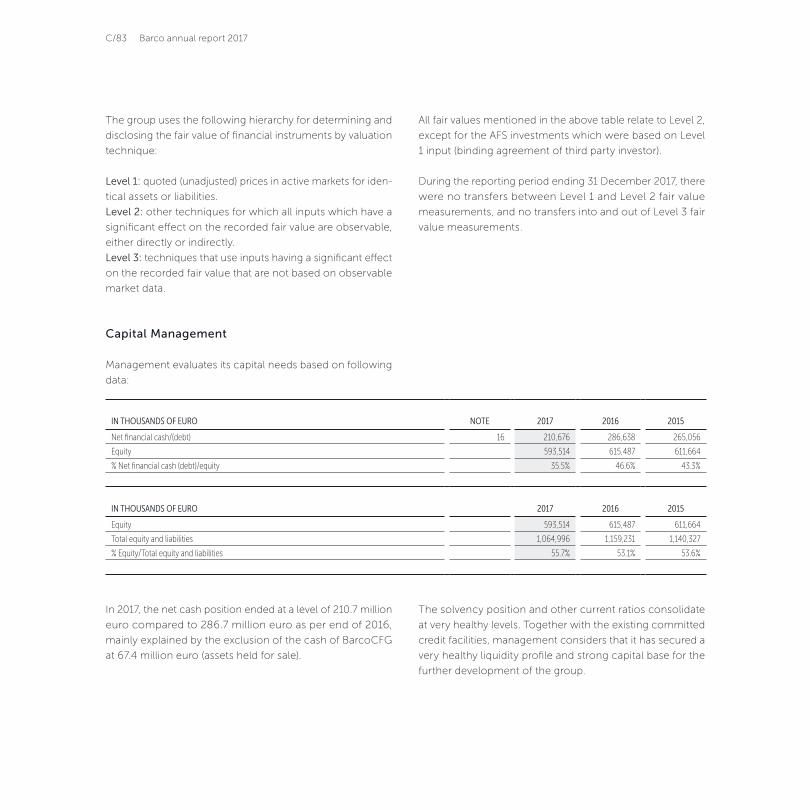
The group uses the following hierarchy for determining and
disclosing the fair value of financial instruments by valuation
technique:
Level 1: quoted (unadjusted) prices in active markets for iden-
tical assets or liabilities.
Level 2: other techniques for which all inputs which have a
significant effect on the recorded fair value are observable,
either directly or indirectly.
Level 3: techniques that use inputs having a significant effect
on the recorded fair value that are not based on observable
market data.
All fair values mentioned in the above table relate to Level 2,
except for the AFS investments which were based on Level
1 input (binding agreement of third party investor).
During the reporting period ending 31 December 2017, there
were no transfers between Level 1 and Level 2 fair value
measurements, and no transfers into and out of Level 3 fair
value measurements.
IN THOUSANDS OF EURO NOTE 2017 2016 2015
Net financial cash/(debt) 16 210,676 286,638 265,056
Equity 593,514 615,487 611,664
% Net financial cash (debt)/equity 35.5% 46.6% 43.3%
IN THOUSANDS OF EURO 2017 2016 2015
Equity 593,514 615,487 611,664
Total equity and liabilities 1,064,996 1,159,231 1,140,327
% Equity/Total equity and liabilities 55.7% 53.1% 53.6%
Capital Management
Management evaluates its capital needs based on following
data:
In 2017, the net cash position ended at a level of 210.7 million
euro compared to 286.7 million euro as per end of 2016,
mainly explained by the exclusion of the cash of BarcoCFG
at 67.4 million euro (assets held for sale).
The solvency position and other current ratios consolidate
at very healthy levels. Together with the existing committed
credit facilities, management considers that it has secured a
very healthy liquidity profile and strong capital base for the
further development of the group.
C/83 Barco annual report 2017

23. Operating leases
IN THOUSANDS OF EURO 2017 2016 2015
Non-cancellable operating leases are payable as follows:
Less than one year 7,457 7,335 6,628
Between one and five years 11,281 11,018 12,426
More than five years 3,202 3,834 5,208
Total 21,941 22,187 24,262
Non-cancellable operating leases mainly relate to leases
of factory facilities, warehouses and sales offices. During
the current year, the total rent expenses recognized in the
income statement amounted to 18 million euro (2016: 17.8
million euro, 2015: 15.7 million euro), of which 9.3 million
euro relating to rent of buildings (2016: 10.2 million euro,
2015: 10.2 million euro).
Changes in liabilities arising from financing activities
IN THOUSANDS OF EURO NON-CASH CHANGES
1 January2017 Cash flows
Foreign exhange
movementsVendor
financing1 Other31 December,
2017
Long-term borrowings 45,961 -8,401 -746 -1,038 -2,031 33,745
Short-term borrowings 13,585 1,401 -4,299 - - 10,686
Lease liabilities 20,850 -9,131 -1,519 -2,910 - 7,291
Total liabilities from financing activities 80,396 -16,131 -6,565 -3,948 -2,031 51,722
(1) The long-term borrowings include long-term payables in the frame of vendor financing programs,
of which the offset is included in the long-term receivables.
The long-term borrowings and lease liabilities are together the long-term debts as shown in the balance sheet. The short-term borrowings are the total of current
portion of long-term debts and short-term debts, as shown in the balance sheet.
C/84Barco annual report 2017Financial statements

25. Related party transactions
Barco NV has entered into arrangements with a number of its subsidiaries and affiliated companies in the course of its busi-
ness. These arrangements relate to service transactions and financing agreements and were conducted at market prices.
Transactions between the Company and its subsidiaries, which are related parties, have been eliminated in the consolidation
and are accordingly not disclosed in this note. None of the related parties have entered into any other transactions with the
Group that meet the requirements of IAS 24, ‘Related party disclosures’.
We refer to note 1 Consolidated companies for an overview of the consolidated and equity accounted companies.
We refer to the ‘Corporate Governance Chapter’ on page A/71 for information with respect to remuneration of directors and
members of the core leadership team.
24. Rights and commitments not reflected in the balance sheet
IN THOUSANDS OF EURO 2017 2016 2015
Guarantees given to third parties (a) 2,567 3,009 3,662
Mortgage obligations given as security (b) 30,000 32,844 33,672
- book value of the relevant assets 48,152 57,115 46,376
Buy back obligations (c) 996 3,486 3,565
Purchase commitment (d) 7,507 2,002 2,723
Sales commitment (e) 1,151
(a) Guarantees given to third parties mainly relate to guarantees given to cus-
tomers for ongoing projects, guarantees given to suppliers for investment
projects and to authorities for commitments related to VAT, duties, etc.
(b) The total mortgage includes three loans of 10 million euro each to fund
the headquarter Campus project. The increase in the book value in 2015,
2016 relates to the new building at the headquarters of Barco; decrease as
of 2017 due to depreciation.
(c) Barco appeals on a vendor-lease program with the obligation to take back
sold goods, in case of insolvency of the client. No buy-back provision is set
up for this risk as all risks and rewards are transferred upon the sale. Total
possible value of the obligation to take back sold goods amounts to 1 million
euro in 2017 (2016: 3.5 million euro, 2015: 3.6 million euro).
(d) This relates to the extended production facility at the headquarter in
Belgium in 2017. In 2015 and 2016, this relates to the new headquarters in
Belgium. There are no purchase commitments on intangible fixed assets.
(e) This relates to preliminary sales agreements of parts of the land on the
Poperinge site in Belgium.
On 4 December 2017, Barco announced that it has reached
an agreement to enter into a strategic joint venture with
China Film Group, Appotronics and CITIC. This new cinema
JV will focus on commercializing cinema solutions based on
each company’s products and services for the global cinema
market excluding mainland China.
The joint venture is expected to become effective during the
second quarter of 2018 after customary regulatory appro-
vals have been obtained and following consultation with the
relevant social and governmental entities.
C/85 Barco annual report 2017
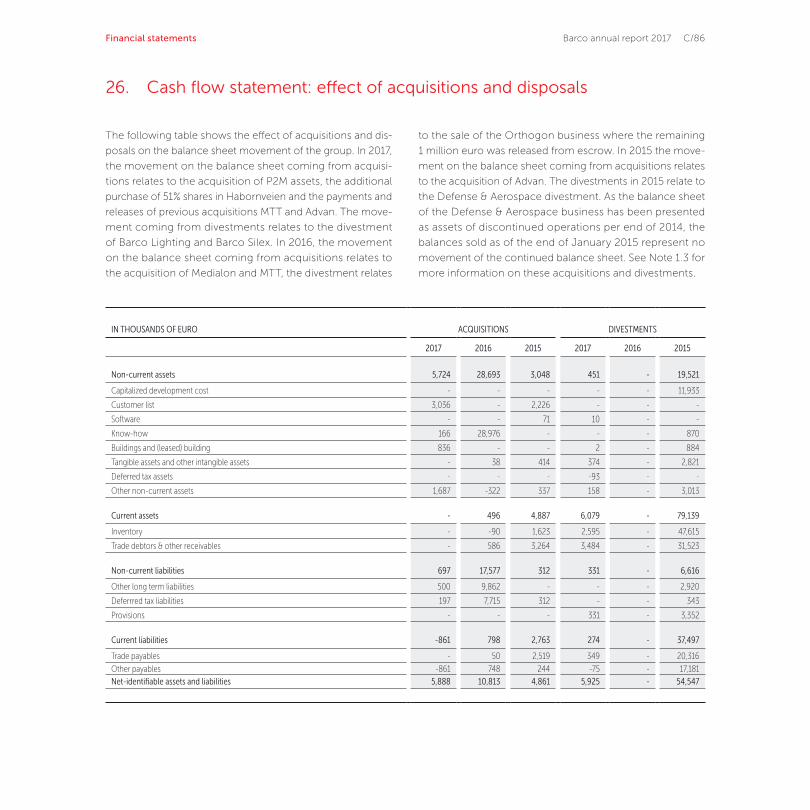
26. Cash flow statement: effect of acquisitions and disposals
The following table shows the effect of acquisitions and dis-
posals on the balance sheet movement of the group. In 2017,
the movement on the balance sheet coming from acquisi-
tions relates to the acquisition of P2M assets, the additional
purchase of 51% shares in Habornveien and the payments and
releases of previous acquisitions MTT and Advan. The move-
ment coming from divestments relates to the divestment
of Barco Lighting and Barco Silex. In 2016, the movement
on the balance sheet coming from acquisitions relates to
the acquisition of Medialon and MTT, the divestment relates
to the sale of the Orthogon business where the remaining
1 million euro was released from escrow. In 2015 the move-
ment on the balance sheet coming from acquisitions relates
to the acquisition of Advan. The divestments in 2015 relate to
the Defense & Aerospace divestment. As the balance sheet
of the Defense & Aerospace business has been presented
as assets of discontinued operations per end of 2014, the
balances sold as of the end of January 2015 represent no
movement of the continued balance sheet. See Note 1.3 for
more information on these acquisitions and divestments.
IN THOUSANDS OF EURO ACQUISITIONS DIVESTMENTS
2017 2016 2015 2017 2016 2015
Non-current assets 5,724 28,693 3,048 451 - 19,521
Capitalized development cost - - - - - 11,933
Customer list 3,036 - 2,226 - - -
Software - - 71 10 - -
Know-how 166 28,976 - - - 870
Buildings and (leased) building 836 - - 2 - 884
Tangible assets and other intangible assets - 38 414 374 - 2,821
Deferred tax assets - - - -93 - -
Other non-current assets 1,687 -322 337 158 - 3,013
Current assets - 496 4,887 6,079 - 79,139
Inventory - -90 1,623 2,595 - 47,615
Trade debtors & other receivables - 586 3,264 3,484 - 31,523
Non-current liabilities 697 17,577 312 331 - 6,616
Other long term liabilities 500 9,862 - - - 2,920
Deferrred tax liabilities 197 7,715 312 - - 343
Provisions - - - 331 - 3,352
Current liabilities -861 798 2,763 274 - 37,497
Trade payables - 50 2,519 349 - 20,316
Other payables -861 748 244 -75 - 17,181
Net-identifiable assets and liabilities 5,888 10,813 4,861 5,925 - 54,547
C/86Barco annual report 2017Financial statements

The total purchase price in 2017 relates to the acquisition of
the P2M assets for 2.6 million euro, the first deferred consi-
deration of 2.0 million euro on the MTT/Medialon acquisition
and the increased investment in Habornveien for 1.9 million
euro. On the other hand, 0.7 million euro was released from
escrow to cover reps and warranties. The 2017 divestment
relates to the sale of the Lighting business and Barco Silex
for respectively an amount of 6.2 million euro and 1.1 mil-
lion euro.
The total purchase price in 2016 relates to the acquisition of
Medialon and MTT of 11.7 million euro, minus the purchase
price correction on Advan of 0.8 million euro and a release
from escrow on the Awind acquisition of 2013. The cash
flow statement acquisition of group companies show net of
acquired cash of Medialon and MTT as the acquisition was
cash and debt free.
The total purchase price in 2015 relates to the acquisition of
Advan of 11.8 million euro. The cash flow statement acquisi-
tion of group companies show net of acquired cash of Advan
as the acquisition was cash and debt free.
The 2016 divestment relates to the remaining escrow on the
sale of the Orthogon business of 1 million euro. The 2015
divestment relates to the sale of the Defense & Aerospace
business for an amount of 146.1 million euro and the escrow
and net working capital adjustment received on the sale of
the Orthogon business for an amount of 1.4 million euro. The
cash flow statement disposal of group companies shows net
of sold cash of the business for an amount of 7.9 million euro.
We refer to the Cash flow statement and note 1.3 on acqui-
sitions and divestments.
Goodwill and fair value adjustments arising on the acquisition
of a foreign entity are carried in terms of historical cost using
the exchange rate at the date of the acquisition.
IN THOUSANDS OF EURO ACQUISITIONS DIVESTMENTS
2017 2016 2015 2017 2016 2015
Non-operating profit (losses) on disposals - - - - - -
Goodwill on acquisitions/disposals - -584 4,774 - - 13,048
Gain on sale of divestments - - - 513 - 64,102
Acquired/(sold) cash 6 504 2,168 727 - 7,924
Received consideration - - - 7,165 1,000 146,146
Purchase price 5,894 10,732 11,803 - - -
C/87 Barco annual report 2017

27. Events subsequent to the balance sheet date
There are no major events subsequent to the balance sheet
date which have a major impact on the further evolution of
the company.
C/88Barco annual report 2017Financial statements

Auditor’s report
INDEPENDENT AUDITOR’S REPORT TO THE GENERAL MEETING OF BARCO NV FOR THE YEAR ENDED 31 DECEMBER 2017
As required by law and the Company’s by-laws, we report to
you as statutory auditor of Barco NV (“the Company”) and its
subsidiaries (together “the Group”). This report includes our
opinion on the consolidated balance sheet as at 31 Decem-
ber 2017, the consolidated statement of comprehensive
income, the consolidated statement of changes in equity and
the consolidated statement of cash flows for the year ended
31 December 2017 and the disclosures (all elements together
“the Consolidated Financial Statements”), and includes as well
our report on other legal and regulatory requirements. These
two reports are considered as one report and are inseparable.
We have been appointed as statutory auditor by the share-
holders meeting held on 30 April 2015, in accordance with
the proposition by the Board of Directors following recom-
mendation of the Audit Committee and on recommendation
of the workers council. Our mandate expires at the share-
holders meeting that will deliberate on the annual accounts
for the year ending 31 December 2017. We have been per-
forming the audit of the Consolidated Financial Statements
of the Group since before 1990.
REPORT ON THE AUDIT OF THE CONSOLIDATED FINANCIAL STATEMENTS 2017
Unqualified Opinion
We have audited the Consolidated Financial Statements of
Barco NV, which consists of the consolidated balance sheet
as at 31 December 2017, the consolidated income statement,
the consolidated statement of comprehensive income, the
consolidated statement of changes in equity and the consol-
idated cash flow statement for the year ended 31 December
2017 and the disclosures, which show a consolidated
balance sheet total of € 1.064.996 thousands and of which
the consolidated income statement shows a profit for the
year of € 32.784 thousands.
In our opinion the Consolidated Financial Statements of the
Group as at 31 December 2017 give a true and fair view of the
consolidated net equity and financial position, as well as its
consolidated results and its consolidated cash flows for the
year then ended in accordance with the International Finan-
cial Reporting Standards as adopted by the European Union
(“IFRS”), and with applicable legal and regulatory requirements
in Belgium.
Basis for the unqualified opinion
We conducted our audit in accordance with International
Standards on Auditing (“ISAs”). Our responsibilities under
those standards are further described in the section “Our
responsibilities for the audit of the consolidated financial
statements” of our report.
C/89 Barco annual report 2017
We have complied with all ethical requirements that are rel-
evant to our audit of the Consolidated Financial Statements
in Belgium, including those with respect of independence.
We have obtained from the Board of Directors and the Com-
pany's officials the explanations and information necessary
for the performance of our audit and we believe that the audit
evidence we have obtained is sufficient and appropriate to
provide a basis for our opinion.
Key audit matters
Key audit matters are those matters that, in our professional
judgment, were of most significance in our audit of the
Consolidated Financial Statements.
The key audit matters were addressed in the context of our
audit of the Consolidated Financial Statements as a whole
and in forming our opinion thereon, and we do not provide
a separate opinion on these matters.
Impairment of goodwill
Description of the matter
Goodwill amounts to € 105.4 million or 10% of the consoli-
dated balance sheet at 31 December 2017. In accordance with
IFRS, the Group is required to annually test for impairments
on goodwill. As described in Note 10 of the Consolidated
Financial Statements, the test resulted in an impairment loss
of € 10.9 million.
The valuation of goodwill is significant to our audit because
the assessment process thereof by the Group’s management
is complex, contains various judgmental decisions, and is
strongly affected by assumptions with regard to expected
future cash flows and market conditions.
Procedures performed
Our audit procedures included, among others, the following:
• We have analyzed the Company’s impairment model
including the significant underlying assumptions (sales
growth rate during the 5-year projection period, EBITDA
percentage on sales, long term growth rate beyond the
projection period, discount rate).
• We have assessed whether the cash generating units were
defined in accordance with IFRS.
• We made an assessment of the historical accuracy of
management’s estimates and compared forecasted sales
growth and EBITDA percentages on sales for all cash
generating units with the Group’s business plan as adopted
and approved by the Board of Directors.
• We used a valuation expert in our firm to assess the
methodology, clerical accuracy, long term growth rate and
discount rate by comparison to market practice, past
performance, the Group’s cost of capital and relevant risk
factors.
• We analyzed the sensitivity analyses prepared by
management to understand the impact of reasonable
changes in the key assumptions.
• We considered additional impairment triggers by reading
board minutes, and holding regular discussions with
management.
• We assessed the adequacy of the Group’s disclosures in
Note 10 to the Consolidated Financial Statements.
C/90Barco annual report 2017Financial statements

Valuation of deferred tax assets
Description of the matter
Deferred tax assets on tax carry-forward losses and tax credits
amount to € 45.1 million or 4% of the consolidated balance
sheet at 31 December 2017, (as described in Note 13 of the
Consolidated Financial Statements). The Group recognizes
deferred tax assets on unused tax carry-forward losses and
tax credits to the extent that it is probable that future taxable
profits will be realized against which unused tax losses and
tax credits can be utilized.
The valuation and recoverability of deferred tax assets is sig-
nificant to our audit due to the magnitude of the amount
recognized for these assets and because the Group’s assess-
ment process requires management estimates, in particular
on the assumptions regarding expected future market and
economic conditions and tax laws and regulations.
Procedures performed
Our audit procedures included, among others, the following:
• We have evaluated the amounts and local expiry periods
of unused tax carry-forward losses and tax credits together
with any other applicable restrictions in recovery for each
relevant jurisdiction.
• We assessed and discussed management’s forecasts of
taxable income including the underlying assumptions such
as revenue growth, gross margin, cost developments, the
applicable tax legislation and tax planning assumptions.
• We used a tax expert in our firm to assist us in these audit
procedures.
• We assessed the adequacy of the Group’s disclosures in
Note 13 of the Consolidated Financial Statements.
Allowance for inventory
Description of the matter
The allowance for slow-moving inventory amounts to € 91.8
million as at 31 December 2017 and comprises allowances on
raw materials, work in progress and finished products that are
considered excess or obsolete. The Group states inventory at
the lower of cost or net realizable value. The allowance for
slow-moving inventory is calculated based on the age and
the expected turnover of the inventory.
The allowance for slow-moving inventory is important to our
audit due to the magnitude of the gross inventory amount
(€ 224.5 million) and related allowance, and because the
calculation of the slow-moving inventory items involves
management’s judgment and is subject to uncertainty due
to rapid technological changes.
Procedures performed
Our audit procedures included, among others, the following:
• We have assessed the design and operating effectiveness
of the Group’s internal controls on the inventory allowan-
ce and write-off process, including relevant IT application
controls.
• We evaluated and discussed the analyses and assessments
made by management with respect to slow-moving and
obsolete stock items and related sales forecasts.
• We have evaluated the historic accuracy of the assess-
ments made by management.
• We tested the net realizable value of a sample of inventory
items by comparing their actual sales price with inventory
unit value.
• We assessed the adequacy of the Group’s disclosures in
Note 14 of the Consolidated Financial Statements.
C/91 Barco annual report 2017

Responsibilities of the Board of Directors and Audit
Committee for the preparation of the Consolidated
Financial Statements
The Board of Directors is responsible for the preparation of
the Consolidated Financial Statements that give a true and
fair view in accordance with IFRS and with applicable legal
and regulatory requirements in Belgium. This responsibility
includes: designing, implementing and maintaining internal
control relevant to the preparation of the Consolidated Finan-
cial Statements that give a true and fair view and that are free
from material misstatement, whether due to fraud or error.
As part of the preparation of the Consolidated Financial State-
ments, the Board of Directors is responsible for assessing
the Group’s ability to continue as a going concern. Based
on the financial reporting framework mentioned, the Board
of Directors should prepare the financial statements using
the going concern basis of accounting unless the Board of
Directors either intends to liquidate the Company or to cease
operations, or has no realistic alternative but to do so.
Our responsibilities for the audit of the Consolidated
Financial Statements
Our objectives are to obtain reasonable assurance about
whether the Consolidated Financial Statements are free
from material misstatement, whether due to fraud or error
and to express an opinion on these Consolidated Financial
Statements based on our audit. Reasonable assurance is a
high level of assurance, but not a guarantee that an audit
conducted in accordance with the ISAs will always detect a
material misstatement when it exists. Misstatements can arise
from fraud or error and are considered material if, individually
or in the aggregate, they could reasonably be expected to
influence the economic decisions of users taken on the basis
of these Consolidated Financial Statements.
As part of an audit in accordance with ISAs, we apply profes-
sional judgment and we maintain professional scepticism
throughout the audit. We also perform the following tasks:
• Identification and assessment of the risks of material
misstatement of the Consolidated Financial Statements,
whether due to fraud or error, the planning and execu-
tion of audit procedures to respond to these risks, and
obtain audit evidence which is sufficient and appropriate
to provide a basis for our audit opinion. The risk of not
detecting material misstatements is larger when these mis-
statements are due to fraud, since fraud can be the result
of conspiracy, forgery, deliberate failure to record trans-
actions, deliberate misrepresentation or breaking through
the internal control system;
• Obtaining insight in the system of internal controls that
are relevant for the audit and with the objective to design
audit procedures that are appropriate in the circumstances,
but not for the purpose of expressing an opinion on the
effectiveness of the Group’s internal control;
• Evaluate the selected and applied accounting policies, and
evaluating the reasonability of the accounting estimates
and disclosures in the given circumstances;
• Conclude on the appropriateness of the Board of Direc-
tor’s use of the going-concern basis of accounting, and
based on the audit evidence obtained, whether a material
uncertainty exists related to events or conditions that may
cast significant doubt on the Company or Group’s ability
to continue as a going concern.
C/92Barco annual report 2017Financial statements
If we conclude that a material uncertainty exists, we are
required to draw attention in our auditor’s report to the
related disclosures in the Consolidated Financial State-
ments or, if such disclosures are inadequate, to modify
our opinion. Our conclusions are based on audit evidence
obtained up to the date of the auditor’s report. However,
future events or conditions may cause the Company or
Group to cease to continue as a going-concern.
• Evaluating the overall presentation, structure and content
of the Consolidated Financial Statements, and whether
these financial statements reflect the underlying trans-
actions and events in a true and fair view.
We communicate with the Audit Committee within the Board
of Directors regarding, among other matters, the planned
scope and timing of the audit and significant audit findings,
including any significant findings in internal control that we
identify during our audit.
Because we are ultimately responsible for the opinion, we
are also responsible for directing, supervising and
performing the audits of the subsidiaries. In this respect
we have determined the nature and extent of the audit
procedures to be carried out for group entities.
We provide the Audit Committee within the Board of
Directors with a statement that we have complied with
relevant ethical requirements regarding independence,
and communicate with them all relationships and other
matters that may reasonably be thought to bear on our
independence, and where applicable, related safeguards.
From the matters communicated with the Audit Commit-
tee within the Board of Directors, we determine those
matters that were of most significance in the audit of the
Consolidated Financial Statements of the current period
and are therefore the key audit matters. We describe these
matters in our report, unless the law or regulations prohibit
this.
REPORT ON OTHER LEGALAND REGULATORY REQUIREMENT
Responsibilities of the Board of Directors
The Board of Directors is responsible for the preparation
and the content of the Board of Director’s report and other
information included in the annual report, the compliance
with the legal and regulatory requirements regarding book-
keeping, as well as compliance with the Belgian Companies
Code (“BCC”) and with the Company’s by-laws.
Responsibilities of the auditor
In the context of our mandate and in accordance with the
additional standard to the ISA’s applicable in Belgium, it is
our responsibility to verify, in all material respects, the Board
of Director’s report and other information included in the
annual report, as well as compliance with certain legal and
regulatory requirements and to report any matters.
C/93 Barco annual report 2017

Aspects relating to Board of Director’s report and other
information included in the annual report
In our opinion, after carrying out specific procedures on the
Board of Director’s report, the Board of Director’s report is
consistent with the Consolidated Financial Statements and
has been prepared in accordance with article 119 of the BCC.
In the context of our audit of the Consolidated Financial
Statements, we are also responsible to consider whether,
based on the information that we became aware of during
the performance of our audit, the Board of Director’s report
and other information included in the annual report, being:
• Letter from the CEO (section A page 4-7)
• Key Figures (section A page 8-9)
• Financial Highlights (section A page 10-11)
contain any material inconsistencies or contains informa-
tion that is inaccurate or otherwise misleading. In light of
the work performed, we do not need to report any material
inconsistencies. In addition, we do not express any form of
assurance regarding the individual elements included in the
Board of Director’s report and other information included
in the annual report.
The non-financial information required by article 119 §2 of
the BCC has been included in the Board of Director’s report
on the Consolidated Financial Statements, which is part of
section B of the annual report. The Group has prepared this
non-financial information based on the Global Reporting
Initiative standards (hereafter “GRI”). However, we do not com-
ment on whether this non-financial information has been
prepared, in all material respects, in accordance with GRI.
Independence matters
We have not performed any assignments that are not com-
patible with the legal audit of the Consolidated Financial
Statements and during the course of our mandate we have
remained independent of the Company and the Group.
The fees for additional assignments that are compatible with
the legal audit of the Consolidated Financial Statements
intended by article 134 of the BCC have been correctly dis-
closed and detailed in the notes to the Consolidated Financial
Statements.
Other communications
• This report is consistent with our
supplementary declaration to the Audit
Committee as specified in article 11 of the
regulation (EU) nr. 537/2014.
Ghent, 8 February 2018
Ernst & Young Bedrijfsrevisoren BCVBA
Statutory auditor
Represented by
Marnix Van Dooren
Partner*
* Acting on behalf of a BVBA/SPRL
C/94Barco annual report 2017Financial statements

Supplementary information
Barco NV
Summary version of statutory accounts Barco NV
The financial statements of the parent company, Barco NV,
are presented below in a condensed form.
The accounting principles used for the statutory annual
accounts of Barco NV differ from the accounting principles
used for the consolidated annual accounts: the statutory
annual accounts follow the Belgian legal requirements,
while the consolidated annual accounts follow the Interna-
tional Financial Reporting Standards. Only the consolidated
annual financial statements as set forth in the preceding
pages present a true and fair view of the financial position
and performance of the Barco Group.
The management report of the Board of Directors to the
Annual General Meeting of Shareholders and the annual
accounts of Barco NV, as well as the Auditor’s Report,
will be filed with the National Bank of Belgium within the
statutory periods. These documents are available upon
request from Barco’s Investor Relations department, and at
www.barco.com.
The statutory auditor’s report is unqualified and certifies that
the non-consolidated financial statements of Barco NV for
the year ended 31 December 2017 gives a true and fair view
of the financial position and results of the company in accor-
dance with all legal and regulatory dispositions.
C/95 Barco annual report 2017

Balance sheet after appropriation
IN THOUSANDS OF EURO 2017 2016 2015
Non-current assets 451,277 655,445 978,420
Intangible fixed assets 42,113 49,931 63,496
Tangible fixed assets 71,094 64,284 55,427
Financial fixed assets 336,991 539,113 856,736
Amounts receivable after more than one year 1,079 2,117 2,761
Current assets 239,454 255,985 254,590
Stocks and contracts in progress 69,326 72,617 69,314
Amounts receivable within one year 112,564 118,758 114,537
Investments (own shares) 42,386 47,968 54,624
Cash at bank and in hand 524 503 370
Deferred charges and accrued income 14,654 16,139 15,745
Total assets 690,731 911,430 1,233,010
Capital and reserves 328,165 365,156 409,524
Capital 55,858 55,824 55,649
Share premium account 146,543 146,144 143,821
Reserves 48,599 54,181 60,837
Accumulated profits 76,480 108,164 148,627
Investment grants 685 843 590
Provisions and deferred taxes 21,506 20,177 17,432
Provisions for liabilities and charges 21,506 20,177 17,432
Creditors 341,060 526,097 806,054
Amounts payable after more than one year 36,641 54,321 365,936
Amounts payable within one year 304,419 471,776 440,116
Total Iiabilities 690,731 911,430 1,233,010
Barco NV’s balance sheet further strengthened as a result of
a capital decrease in Barco Coordination Center (168 million
euro) of which 140 million euro has been used to reimburse
the short term loan to Barco Coordination Center in 2017.
The financial fixed assets further decreased because of an
impairment on Projection Design (24.7 million euro) because
of the announced transfer of business from Norway to
Belgium.
C/96Barco annual report 2017Financial statements

In 2016 financial fixed assets decreased with 318 million euro
mainly as the result of a capital decrease in Barco Coordina-
tion Center (232 million euro) and Barco Integrated Solutions
(95 million euro). A long term loan to Barco Coordination
Center was reimbursed for an amount of 308 million euro.
The increase of 92 million euro of financial fixed assets in
2015 consists of the intercompany acquisition of the shares
of Barco Integrated Systems (106 million euro net), partly
offset by the impairment of the shares of X2O Media Inc (12.8
million euro) and the sale of the participation in Barco Texen
(-4.3 million euro) and Barco Singapore (-1.3 million euro) to
Esterline (as part of the Defense & Aerospace divestment).
The intangible fixed assets relate mainly to the implementa-
tion cost of SAP ERP software (increase in 2017: 5.4 million
euro, increase in 2016: 4.6 million euro, 2015: 3.6 million
euro). The total gross value of the SAP ERP software imple-
mentation cost per December 2017 amounts 44.4 million
euro.
The SAP capital expenditures are depreciated as roll out
is performed successfully (April 2014 in India, July 2015 in
Belgium, July 2016 in Germany and July 2017 in US). Per roll-
out a part of the licenses are taken into use. Pro rata these
licenses in use, the SAP capital expenditures are taken into
use and amortized over 7 years. The amortization in 2017
amounts to 4.7 million euro compared to 4.3 million euro
in 2016 and 1.7 million euro in 2015.
Next to this, the decrease of the intangible fixed assets in
2017 is the result of further amortizing the capitalized devel-
opment, ending in 2017, after the change in accounting
treatment in 2015, which resulted in no longer capitalizing
development expenses.
The increase of the tangible fixed assets with 7 million euro in
2017, 11.4 million in 2016 and 25 million euro in 2015, relates
to the new headquarter building in Kortrijk, which has been
taken in use as of February 2016. The total gross value of
the new building is 45 million euro. An extended operations
facility is currently under construction (6.8 million euro in
2017 compared to 2.8 million euro in 2016).
In 2017 and 2016, the inventory remained stable (-3 million
euro in 2017 and + 3 million euro in 2016) while in 2015,
the stocks and contracts in progress decreased due to the
divestment of Defense and Aerospace (-37.7 million euro).
C/97 Barco annual report 2017

IN THOUSANDS OF EURO 2017 2016 2015
Sales 634.306 569,504 520,910
Operating income/(loss) 18,673 -25,280 -36,390
Financial result 2.581 4,218 -5,795
Extraordinary result -32,437 -3,368 33,460
Income taxes -128 601 2,627
Profit/(loss) for the year -11,311 -23,829 -6,098
Income statement
Barco NV sales in 2017 increased to 634 million euro, up
11%, compared to 569.5 million euro in 2016. The operating
income in 2017 is a profit of 18.7 million euro, compared to
a loss of -25.3 million euro in 2016. Higher sales combined
with a gross profit margin improvement, as result of a positive
mix effect and value engineering efforts, results in a higher
operating income. All years are negatively impacted by the
change in accounting treatment of development expenses
as from 2015 there was no capitalization of development
expenses anymore while amortizations on the capitalized
development expenses were still included (2017 : 7.9 million
euro, 2016: 17.7million euro, 2015: 29.2 million euro).
In 2017 the financial income decreased as a result of lower
intercompany dividends received of 6.1 million euro (Barco
Taiwan), while in 2016 the financial income increased with
10 million mainly as a result of 14.5 million euro dividends
received (no dividends received in 2015), although no interest
income from Intercompany loans was received (3.7 million
euro in 2015).
The extra-ordinary result in 2017 and 2016 consists of impair-
ments booked on financial fixed assets explained above and
in 2017 a loss on the realization of an intercompany receiv-
able from X2O of -7.2 million euro. In 2015 the extra- ordinary
result mainly relates to the gain realized on the divestment of
the Defense and Aerospace division for an amount of 50.4
million euro, impairments on intercompany participations
(-15.6 million euro) and -1.3 million euro realisation loss on
own shares.
The income tax in 2017 shows a small cost of 0.1 million
euro. This is the total of a withholding tax cost on received
dividends of 0.7 million euro and a tax credit on research
and development expenses. The latter was 0.5 million euro
in 2017, 1.3 million euro in 2016 and 2.6 million euro in 2015.
There was also a withholding tax cost on received dividends
of 0.7 million euro in 2016.
C/98Barco annual report 2017Financial statements

IN THOUSANDS OF EURO 2017 2016 2015
Profit/(loss) for the year for appropriation -11,311 -23,829 -6,099
Profit brought forward 108,164 148,628 176,373
Profit to be appropriated 96,853 124,799 170,273
Transfer from other reserves -5,582 -6,656 458
Profit to be carried forward 76,480 108,164 148,628
Gross dividends 25,955 23,292 21,188
Total 96,853 124,800 170,273
Proposed appropriation of Barco NV result
The board of directors of Barco NV proposed a gross
dividend of 2.1 euro per share relating to the result as of 31
December 2017. In 2017 a gross dividend of 1.9 euro per
share was paid out on the results of 2016; in 2016 1.75 euro
was paid out.
C/99 Barco annual report 2017
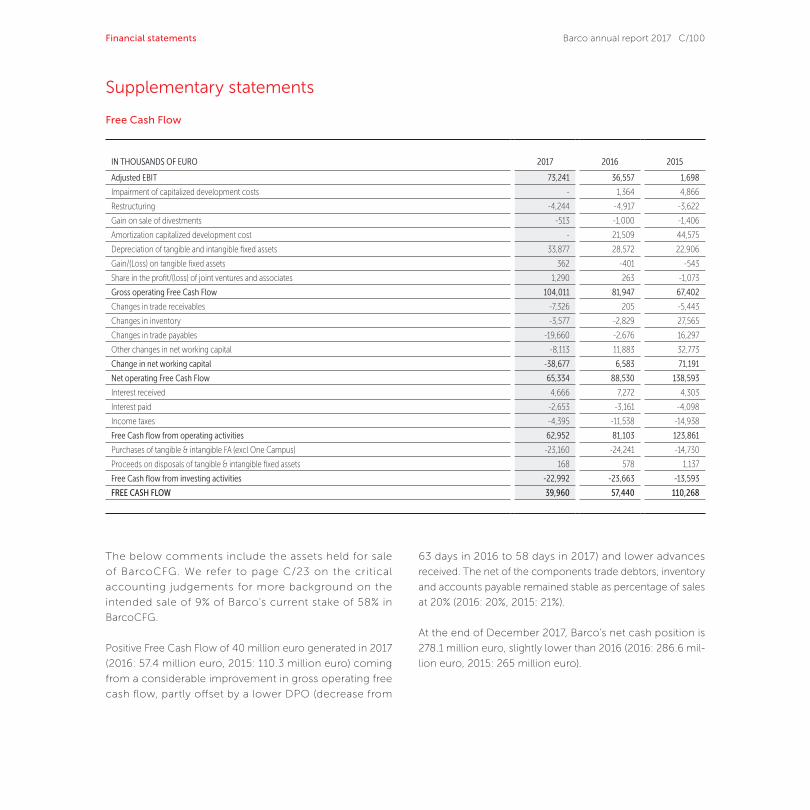
IN THOUSANDS OF EURO 2017 2016 2015
Adjusted EBIT 73,241 36,557 1,698
Impairment of capitalized development costs - 1,364 4,866
Restructuring -4,244 -4,917 -3,622
Gain on sale of divestments -513 -1,000 -1,406
Amortization capitalized development cost - 21,509 44,575
Depreciation of tangible and intangible fixed assets 33,877 28,572 22,906
Gain/(Loss) on tangible fixed assets 362 -401 -543
Share in the profit/(loss) of joint ventures and associates 1,290 263 -1,073
Gross operating Free Cash Flow 104,011 81,947 67,402
Changes in trade receivables -7,326 205 -5,443
Changes in inventory -3,577 -2,829 27,565
Changes in trade payables -19,660 -2,676 16,297
Other changes in net working capital -8,113 11,883 32,773
Change in net working capital -38,677 6,583 71,191
Net operating Free Cash Flow 65,334 88,530 138,593
Interest received 4,666 7,272 4,303
Interest paid -2,653 -3,161 -4,098
Income taxes -4,395 -11,538 -14,938
Free Cash flow from operating activities 62,952 81,103 123,861
Purchases of tangible & intangible FA (excl One Campus) -23,160 -24,241 -14,730
Proceeds on disposals of tangible & intangible fixed assets 168 578 1,137
Free Cash flow from investing activities -22,992 -23,663 -13,593
FREE CASH FLOW 39,960 57,440 110,268
Supplementary statements
The below comments include the assets held for sale
of BarcoCFG. We refer to page C/23 on the critical
accounting judgements for more background on the
intended sale of 9% of Barco’s current stake of 58% in
BarcoCFG.
Positive Free Cash Flow of 40 million euro generated in 2017
(2016: 57.4 million euro, 2015: 110.3 million euro) coming
from a considerable improvement in gross operating free
cash flow, partly offset by a lower DPO (decrease from
Free Cash Flow
63 days in 2016 to 58 days in 2017) and lower advances
received. The net of the components trade debtors, inventory
and accounts payable remained stable as percentage of sales
at 20% (2016: 20%, 2015: 21%).
At the end of December 2017, Barco’s net cash position is
278.1 million euro, slightly lower than 2016 (2016: 286.6 mil-
lion euro, 2015: 265 million euro).
C/100Barco annual report 2017Financial statements

Balance Sheet
The below comments include assets held for sale of
BarcoCFG. We refer to page C/23 on the critical accounting
judgements for more background on the intended sale of
9% of Barco’s current stake of 58% in BarcoCFG.
On 31 December 2017, trade receivables ended at 182.1
million euro. DSO remained at the same level of 2016 at 55
days (2016: 55 days; 2015: 58 days).
Inventory ended (excluding acquisitions, disposals and cur-
rency impact) at 154 million euro, slightly lower than previous
year, resulting in turns of 3.6. This is at the same level as per
end of 2016 and 2015.
Trade payables decreased to 114.5 million euro from 135.1
million euro at the end of 2016 (2015: 139.5 million euro).
Decrease is the result of paying suppliers sooner, on average
after 58 days in 2017 compared to 63 days in 2016.
C/101 Barco annual report 2017

IN THOUSANDS OF EURO 2017 2016 2015
Trade debtors 182,106 188,561 186,910
Inventory 154,063 166,202 165,960
Trade payables -114,548 -135,127 -139,504
Other working capital -263,270 -276,004 -234,358
Working capital -41,649 -56,368 -20,991
Capitalized development - - 22,847
Other long term assets & liabilities 244,079 259,987 218,762
Operating capital employed 202,430 203,618 220,618
Goodwill 113,385 124,255 132,386
Operating capital employed (incl goodwill) 315,815 327,874 353,004
Adjusted EBIT 73,241 36,557 1,698
ROCE after tax (%) (a) 19% 9% 0%
Return on operating Capital Employed
(a) Tax rate used is the adjusted tax rate in 2017(16%), the effective tax rate in 2016 and 2015 (both at 20%). See note 7 for the calculation of the adjusted tax rate.
Note: The operating capital employed includes the assets
held for sale of BarcoCFG.
Total working capital remained low, negative at -3.8% of sales
versus -5.1% at year-end 2016. Difference is mainly related
to lower outstanding trade payables and lower advances on
customer contracts.
In 2016 and 2015 adjusted EBIT was negatively impacted by
the decision to no longer capitalize development expenses;
excluding the impact of the amortization on capitalized
development, return on capital employed stood at 15%
in 2016, 11% in 2015. Return on capital employed further
improved in 2017 to 19%, as a result of a higher adjusted
EBIT, lower capital employed and a lower adjusted tax rate.
C/102Barco annual report 2017Financial statements

Glossary
Financial term or APM Explanation
Adjusted EBIT
EBIT excluding restructuring costs and impairments relating to reorienting or stopping certain activities, business or product lines, as well as impairments on goodwill and revenues resulting from a single material transaction not linked to current business activities (e.g. sales building headquarters) and other non-operating income/(expense). Results out of divestments or acquisitions are included in EBIT(DA).
Adjusted return on operating capital employed (ROCE)Adjusted EBIT after tax relative to operating capital employed (including goodwill), including the assets held for sale. ROCE = Adjusted EBIT*(1- adjusted tax rate)/Operating capital employed (including goodwill)
Adjusted tax rate(Taxes related to current income before taxes - non current items of 2017 (effect of change in expected tax rate on deferred taxes+ set up of deferred tax assets, not recognized in prior years))/Income before taxes.
Associates Companies in which Barco has a significant influence, generally reflected by an interest of at least 20%. Associates are accounted for using the equity method.
BarcoCFGFull name is CFG Barco (Beijing) Electronics Co, Ltd. Barco CFG is the entity where Barco joined forces with China Film Group to address the Chinese cinema market. Barco holds a 58 % stake in this entity at end of 2017.
Book value per share Equity attributable to the Group divided by number of shares outstanding at balance sheet date.
Capital ratio Equity relative to total assets.
Dividend yield Gross dividend as a percentage of the share price on 31 December.
DPODays payable outstanding calculated as Trade Payables / (Material cost + Services and other costs) x 365; including assets held for sale.
DSODays sales outstanding calculated as ((Trade debtors + trade debtors Barco CFG (see note 3 assets held for sale), net) / (sales past quarter)) * 90; including assets held for sale.
EBIT
Operating result (earnings before interest and taxes), calculated as gross profit less research & development
expenses, sales and merketing expenses, general and administration expenses, other operating income
(expense)-net and plus or minus adjusting items.
EBITDA Adjusted EBIT + depreciation, amortization and impairments (if any).
Equity methodMethod of accounting whereby an investment (in a joint venture or an associate) is initially recognized at cost and subsequently adjusted for any changes in the investor’s share of the joint venture's or associate’s net assets (i.e. equity). The income statement reflects the investor’s share in the net result of the investee.
Free cashflowGross operating cash flow excluding share options recognized as cost + change in networking capital + Interest (expense)/income + income taxes + purchase of tangible and intangible fixed assets (excl. One Campus) +proceeds on disposals of tangible and intangible fixed assets.
Indirect costs / expensesResearch & development expenses, sales and marketing expenses and general andadministration expenses including depreciations and amortizations.
Inventory turnsInventory turns = 12 / [Inventory / (average monthly sales last 12 months x material cost of goods sold %)],including assets held for sale.
C/103 Barco annual report 2017

Financial term or APM Explanation
Net financial cash/(debt)Cash and cash equivalents + long-term financial receivables - long-term debts - current portion of long-term debts - short-term debts.
Non-recurring tax itemsEffect of change in expected tax rate on deferred taxes + innovation income deduction (IID) + tax adjustments related to prior periods + capital loss carried back/gain on sold share deal entities.
Operating capital employed (including goodwill) Operating capital employed + goodwill including assets held for sale.
Operating capital employed (OCE) Working capital + other long term assets and liabilities, including assets held for sale.
Operating expenses (OPEX)Research & development expenses, sales and marketing expenses and general andadministration expenses excluding depreciations and amortizations.
Order
An order can only be recognized if a valid purchase order has been received from the invoice-to customer. An order is only valid if it is: - In writing. This includes e-mail and electronic version of the purchase order out of the customer’s ERP system. The e-mail needs to originate from the customer’s mail server and not from a personal mail account. - The contract needs to be signed by an authorized person from the business partner. Next to this, a minimum number of fields need to be mentioned on the order like customer name, address, etc.
OrderbookOrderbook are previously received orders, which still fulfill all the conditions of an order, but are not deliverd yet
and hence not taken in revenue.
Other long term assets and liabilitiesOther long term assets & liabilities include the sum of other intangible assets, land and buildings, other tangible assets, deferred tax assets (net). We refer to note 11, 12 and 13 for the amounts.
Other working capital
Other working capital include the net of other non-current assets, other amounts receivable, prepaid expenses and accrued income, other long term liabilities, advances received from customers, tax payables, employee benefits liabilities, other current liabilities, accrued charges and deferred income and provisions, includings assets held for sale.
Subsidiaries Companies in which Barco exercises control.
Working capital (net) Trade debtors + inventory - trade payables - other working capital.
C/104Barco annual report 2017Financial statements

Group management
Beneluxpark 21
BE-8500 Kortrijk
Tel.: +32 (0)56 23 32 11
Registered office
President Kennedypark 35
BE-8500 Kortrijk
Tel.: +32 (0)56 23 32 11
Stock exchange
Euronext Brussels
Financial information
More information is available from the
Group’s Investor Relations Department:
Carl Vanden Bussche
Vice President Investor Relations
Tel.: +32 (0)56 26 23 22
E-mail: [email protected]
Copyright © 2018 Barco NV
All rights reserved
Realization
Barco Corporate Marketing & Investor Relations Office
Focus Advertising
Barco
Beneluxpark 21
8500 Kortrijk – Belgium
C/105Barco annual report 2017Financial statements