SAVORING NEW CHALLENGE...SAVORING NEW CHALLENGE Nissin’s corporate image is now represented by...
62
2 ANNUAL REPORT 2007 Year ended March 31,2007 SAVORING NEW CHALLENGE
Transcript of SAVORING NEW CHALLENGE...SAVORING NEW CHALLENGE Nissin’s corporate image is now represented by...

2
ANNUAL REPORT 2007 Year ended March 31,2007
SAVORING NEW CHALLENGE

PROFILE
Forward-looking StatementsThis report contains forward-looking statements regarding the Company’s plans, outlook,strategies and results for the future that are based on management's estimates, assump-tions and projections at the time of publication. Certain risks and uncertainties could causethe Company’s actual results to differ materially from any projections presented in thisreport. These risks and uncertainties include, but are not limited to, the domestic and inter-national economic circumstances surrounding the Company’s businesses, competitiveactivity, related laws and regulations, product development programs and changes inexchange fluctuations.
FINANCIAL HIGHLIGHTS 1
PRESIDENT’S LETTER 8
A TRIBUTE TO OUR FOUNDER 11
MYOJO FOODS JOINS GROUP 14
REVIEW OF OPERATIONS 15
QUALITY AND SAFETY 22
ENVIRONMENTAL ACTIVITIES 24
CORPORATE GOVERNANCE 25
BOARD OF DIRECTORSAND OFFICERS 26
FINANCIAL SECTION 27
WORLDWIDE NETWORK 56
CORPORATE DATA 58
INVESTOR INFORMATION 59
CONTENTS
DRIVING FURTHER FOR OUR CUSTOMERSNissin Foods was first off the tee, with the world’s original instant noodles in1958. In 1971, Nissin Foods leapt further ahead, with the world’s first cup-type noodles—combining soup, toppings and noodles in a single containerfor storage, preparation and serving. We continue to out-distance the com-petition not only in innovation, but also in our quest for the ultimate in foodsafety and customer enjoyment. And we communicate this in a simple mes-sage for the whole world that tells about the basic wholesome goodnessand fun of instant noodles.
In 2007, Nissin Foods savors the challenge of surpassing itself in food safety,customer enjoyment and global appeal.

1
INSTANT NOODLE MARKET PROFILE(Calendar year 2005)
Asia 75,150 3,160 23.8
North America *3 4,080 329 12.4
Latin America 2,280 310 7.4
Europe *4 500 253 2.0
Others 3,650 — —
Total 85,660 — —
NISSIN FOODS CONSOLIDATED SALES BY CATEGORY (Years ended March 31)
(Millions of yen) 2007 2006 2005
Instant Noodles
Pillow-type Instant Noodles ¥ 57,871 ¥ 48,919 ¥ 44,023
Cup-type Instant Noodles 226,315 204,864 203,689
Chilled and Frozen Foods 41,282 40,727 39,859
Other Business 32,770 27,190 29,402
Total 358,238 321,700 316,973
NISSIN FOODS CONSOLIDATED SALES BY GEOGRAPHIC AREA (Excluding Intersegment Sales)(Years ended March 31)
(Millions of yen) 2007 2006 2005
Japan ¥ 303,718 ¥ 269,765 ¥ 273,936
North America 30,505 29,903 23,911
Others 24,015 22,032 19,126
Total 358,238 321,700 316,973
FINANCIAL HIGHLIGHTS
BASIC DATA
(Years ended March 31) 2007 2006 2005 2007 (%)
FOR THE YEAR
Net sales ¥ 358,238 ¥ 321,700 ¥ 316,973 $ 3,034,629 11.4Operating income 33,735 31,979 28,963 285,769 5.5Net income 18,969 15,389 16,612 160,686 23.3
AT YEAR-END
Total assets ¥ 410,407 ¥ 366,801 ¥ 361,105 $ 3,476,552 11.9Net assets *2 288,476 263,199 258,139 2,443,676 9.6
PER SHARE
Net income ¥ 156.12 ¥ 125.09 ¥ 134.36 $ 1.32 24.8Cash dividends applicable to earnings of the year 50.00 30.00 30.00 0.42 66.7Net assets 2,304.40 2,167.81 2,091.16 19.52 6.3
VALUE & PERFORMANCE INDICATORS
Operating margin (%) *3 9.4 9.9 9.1Return on assets (%) *4 4.9 4.2 4.7Return on equity (%) *5 7.0 5.9 6.6Inventory turnover (Times) *6 12.9 12.6 12.9
Thousands of U.S. dollars*1Millions of yen Percent
change
Yen U.S. dollarsPercentchange
Notes:1. U.S. dollar amounts represent translations of yen, for convenience only, at US$1 = ¥118.05, the approximate rate prevailing on March 31, 2007.2. Net assets = In compliance with the Corporate Law, from fiscal 2007, the amount of net assets includes the amount of minority interests (¥6,725 million).3. Operating margin = Operating income/Net sales4. Return on assets = Net income/Average total assets5. Return on equity = Net income/Average total net assets6. Inventory turnover = Cost of sales/Average total inventory
Notes:1. Source: 2005, International Ramen Manufacturers Association
[recently renamed World Instant Noodle Association (WINA)]2. Source: 2007, World Economic Information Services3. U.S.A., Canada4. Excluding Russia
Annual demand for instant noodles total *1
(Millions of servings)Population *2
(Millions)Units per capita
(Servings)

2
We believe in honoring our customers’ concerns about every aspect of
food safety, from the purity of raw materials to the method of manufacture.
We are continually working to strengthen our quality control systems, and
we have gained the ISO 9001 certification of international quality control
and quality assurance standards at our four domestic plants, the Food
Safety Research Institute, 19 group companies (including MYOJO FOODS
Co., Ltd.) in Japan, and our 10 related overseas companies.
GOING THE EXTRA DISTANCE FOR CUSTOMERWELL-BEING, THROUGH STRICT INGREDIENTSOURCING, TECHNICAL INNOVATION ANDADVANCED PRODUCT QUALITY ASSURANCE.
FOOD SAFETY
2

3
FOOD SAFETY EVALUATION & RESEACHINSTITUTE CO, LTD. (Nissin Shanghai FoodSafety Research Institute) opened in March2007 to monitor raw materials for quality, purityand traceability prior to manufacturing or export.The Institute will also raise the quality of rawmaterials by providing process management andtechnical guidance to suppliers in China.
MAINTAINING A GLOBAL STANDARD OFQUALITY, SAFETY AND GOODNESS
3

4
CUSTOMERENJOYMENT
Beyond the essentials of safety, nutrition and flavor, a major appeal of
instant noodles has always been how fun they are to eat. That is why we
go to extra lengths to make the last bite as memorable as the first. To
assure lasting customer enjoyment, Nissin Foods works constantly to
develop new needs by creating novel product categories that make
meals more convenient and enjoyable.
“FUN TO EAT” IS A MAJOR APPEAL OF INSTANTNOODLES. WE PACK MAXIMUM POWER INTO NUTRITION, FLAVOR AND ENJOYMENT IN EVERY BITE.

5
Sustainable manufacturing and merchandisingis serious business, but that does not mean itshould not be fun for the customer. Our newCup Noodle Refill system combines minimal-packaging noodle packs with a sturdy, reusableand user-customizable serving cup—meaninghigher resource savings and more fun.
ENSURING GREATER CUSTOMER ENJOYMENT FOR FUTURE GENERATIONS

6
GLOBALA P P E A L
In 36 years of global marketing, we have learned to tie in the seemingly uni-
versal appeal of noodles with refinements and unique varieties to suit local
taste and culture, and that extends to our advertising. Utilizing the knowl-
edge gained through global marketing, we are aggressively expanding our
activities in overseas consumer markets with high growth prospects.
WE COMPETE BY PLAYING TO LOCAL CONDITIONS, DEVELOPING NEW FLAVORS AND VARIETIES AND FINDING FRESH WAYS TO PRESENT THEM.
Right: Sample advertising from around the world

Nissin Foods has steadily expanded its interna-tional presence since the establishment of NissinFoods (U.S.A.) Co., Inc. in 1970. Our founderMomofuku Ando was inspired to create theworld’s first cup-type instant noodle, Cup Noodle,during a U.S. tour with Nissin Foods (U.S.A.) pro-moting Chicken Ramen. With its convenience,Cup Noodle has become a source of enjoyment.
OUR GLOBAL NETWORK ENCOMPASSES54 COMPANIES IN 11 COUNTRIES
7

8
PRESIDENT’S LETTER
PRESIDENT Koki Ando
RECOGNITION AS A “WORLD FOOD”
True recognition of instant noodles as a “world food” came with the
adoption of a Codex Alimentarius standard in July 2006 under the
Joint FAO/WHO Food Standards Programme. Instant noodles offer a
highly efficient way to obtain a balanced mix of the basic food
groups—protein, fat and carbohydrates (PFC). Another advantage is
flexibility. Instant noodles can be modified to suit the flavor prefer-
ences in every country. As consumers become more affluent, their
preferences become more diverse. Our continuing challenge is to
respond to these changing needs by supplying tailor-made noodles.
ENHANCING BRAND VALUE
Nissin Foods has many long-selling products. In the current year
we celebrated the 35th anniversary of Cup Noodle and the 30th
anniversary of Nissin-no-Donbei and Nissin Yakisoba U.F.O. by
launching limited-edition commemorative products. These initia-
tives attracted widespread interest from retailers and consumers.
They also contributed to sales growth.
MYOJO FOODS, which recently joined the Nissin Group, has
also built long-selling brands and will help to strengthen our brand
business. This acquisition has also given us a foothold in the food
service business, and we anticipate important synergy benefits on
many levels, including procurement, production and distribution.
Nissin Foods has always sought challenge,beginning with how to make, and then how tomarket a product nobody had heard of. In thepast year, we faced the challenge of globalgrowth, food safety, product innovation andbuilding synergy with major new companies.We savor the challenge ahead.In the year ended March 31, 2007, Nissin Foods achieved consoli-
dated net sales of ¥358,238 million (US$3,035 million), an increase
of 11.4% over the previous year. Reasons include the acquisition of
MYOJO FOODS as a subsidiary. Operating income was also higher,
with a 5.5% increase to ¥33,735 million (US$286 million), in part
because of a major reduction in retirement benefit expenses. A
reduction in asset impairment losses helped to lift net income by
23.3% year on year to ¥18,969 million (US$161 million).
TO OUR SHAREHOLDERS:

9
When companies with different cultures merge, the result is some-
times called a “hybrid.” Just as the DNA of hybrids combines the
strengths of both parents, we aim to build the Nissin Group into
one of the world’s leading integrated noodle manufacturers by
integrating the best from our respective management systems.
SAVORING NEW CHALLENGE
Nissin’s corporate image is now represented by Michelle Wie, a
young woman who has gained international fame as a professional
golfer. Our new slogan is “Oishii, no sono saki e” (“Savoring new
challenge”). These words express our determination to go beyond
the basic criterion of delicious flavor to provide value that also
encompasses safety, security, health, the environment and fun.
Our first new product under this concept is the Cup Noodle
Refill series of environment-friendly products. The volume of the
noodles has been compressed to about 80% compared with con-
ventional products to avoid wasteful packaging, and the hard plas-
tic cup is reusable.
We also expect health to be a major focus of consumer
demand. For example, products containing psyllium, which is made
from the seed husk of the Indian plantago, are rich in natural edi-
ble fiber and are beneficial for the digestive system. Our psyllium-
based products have been certified by the Japanese Ministry of
Health, Labour and Welfare as Foods for Specified Health Use,
and we will continue to develop related nutrients and ingredients.
Another new product is Nissin Chin, which was launched in
May. This product requires no water and can be prepared simply
by heating in a microwave oven.
OVERSEAS ACTIVITIES
Our North American operations unfortunately showed a larger loss
than predicted because of higher raw material costs, especially in
the United States. However, there was substantial growth in sales of
high-priced items, such as CHOW MEIN, Noodle Soup and Souper
Meal, which make a substantial contribution to earnings, and we
expect profitability to improve.
In China, the world’s largest market for instant noodles, we
recorded strong sales of both pillow-type and cup-type products in
Hong Kong. We aim to strengthen our presence in urban areas,
especially Shanghai, by developing high-quality products targeted
toward the large affluent populations in these areas.
In Thailand, we increased our shareholding in the country’s
biggest manufacturer of noodles, THAI PRESIDENT FOODS PUBLIC
COMPANY LIMITED, by 20%. THAI PRESIDENT FOODS is now an
affiliated company and will contribute to consolidated earnings from
the year to March 2008 onwards.
FOOD SAFETY OUR GREATEST PRIORITY
As a food manufacturer, we recognize that food safety must be our
first priority at all times. Our Food Safety Research Institute in Japan
has developed its own testing systems for residual agricultural
chemicals and veterinary pharmaceuticals and uses these systems
to ensure the safety of raw materials. Our plants in Japan and the
Food Safety Research Institute have been accredited under ISO
9001, the international quality management standard, and our over-
seas plants also have quality management systems based on the
same standard. In March 2007 we opened the Nissin Shanghai
Cup Noodle
Launched in 1971, Cup Noodle (as it is stillknown in Japan) has grown to be thelargest and most recognized instant noodlebrand in the world.
Nissin-no-Donbei
The 30th anniversary edition of Nissin-no-
Donbei, a popular variation featuring thick-er, udon-style noodles, stimulated con-sumer interest and increased sales.
Nissin Yakisoba U.F.O.
The 30th anniversary edition of Nissin
Yakisoba U.F.O., that features a rich saucein place of soup, was another big hit withconsumers, who enjoy its authentic flavor.
35 th 30 th 30 th

10
Food Safety Research Institute in China. This new facility has further
enhanced the efficiency of safety systems, since we are now able to
check imported materials in both China and Japan.
OUR ENVIRONMENTAL MISSION
We aim to achieve harmonious coexistence with the natural environ-
ment by considering environmental protection and resource conser-
vation in our business activities. Specific initiatives have focused on
the reduction of CO2 emissions from our main plants. We have also
implemented a “zero waste” program designed to reduce plant
waste volumes to negligible levels. In addition, 19 of our plants in
Japan and overseas have been accredited under ISO 14001, the
international standard for environmental management systems.
The environment will remain a key focus in our future activities.
Goals include the development of biodegradable packaging that will
break down in the soil.
IMPROVING CORPORATE VALUE—TRANSPARENT
MANAGEMENT AND HUMAN RESOURCE DEVELOPMENT
Nissin Foods regards the maintenance of high standards of objectiv-
ity and transparency as one of its most important management pri-
orities. Internal checks and balances have been further enhanced
through the establishment of systems that allow all employees to
access corporate data on a day-to-day basis. We have also adopted
internal ethical rules to guide individual employees in their activities.
Our corporate culture encourages internal competition while also
emphasizing the effective sharing of internal resources. We aim to
maximize employee motivation by achieving a healthy balance
between cooperation and competition.
PRESIDENT’S LETTER
When companies with different cultures merge, theresult is sometimes called a ‘hybrid.’ Just as the DNAof hybrids combines the strengths of both parents, weaim to build the Nissin Group into one of the world’sleading integrated noodle manufacturers by integratingthe best from our respective management systems.
CONSIDERATION FOR ALL STAKEHOLDERS
Our top management priorities are to provide appropriate returns
to shareholders and increase the corporate value of Nissin Foods.
We already have a non-consolidated dividend payout ratio guide-
line of 30%, and from the current year, the same target will be
applied to the consolidated ratio. On this basis, we plan to pay an
annual dividend of ¥50 (US$0.42).
We remain determined to live up to the trust and expectations
of all stakeholders by developing our brand business as the core of
a business structure capable of adapting to any change, and by
increasing our efforts to build our global business activities.
We should like to take this opportunity to express our sincere
gratitude for the support of our shareholders, investors, suppliers
and customers. We look forward to your continuing support and
guidance in the future.
Momofuku Ando, my father and founder of Nissin Foods, passed away
on January 5, 2007. However, his legacy lives on in the corporate DNA
of the Nissin Foods Group in the form of his founding principles, which
can be loosely translated as “People can only be content when there is
enough food,” and “Creating foods to serve society.”
PRESIDENT Koki Ando
“
”
11
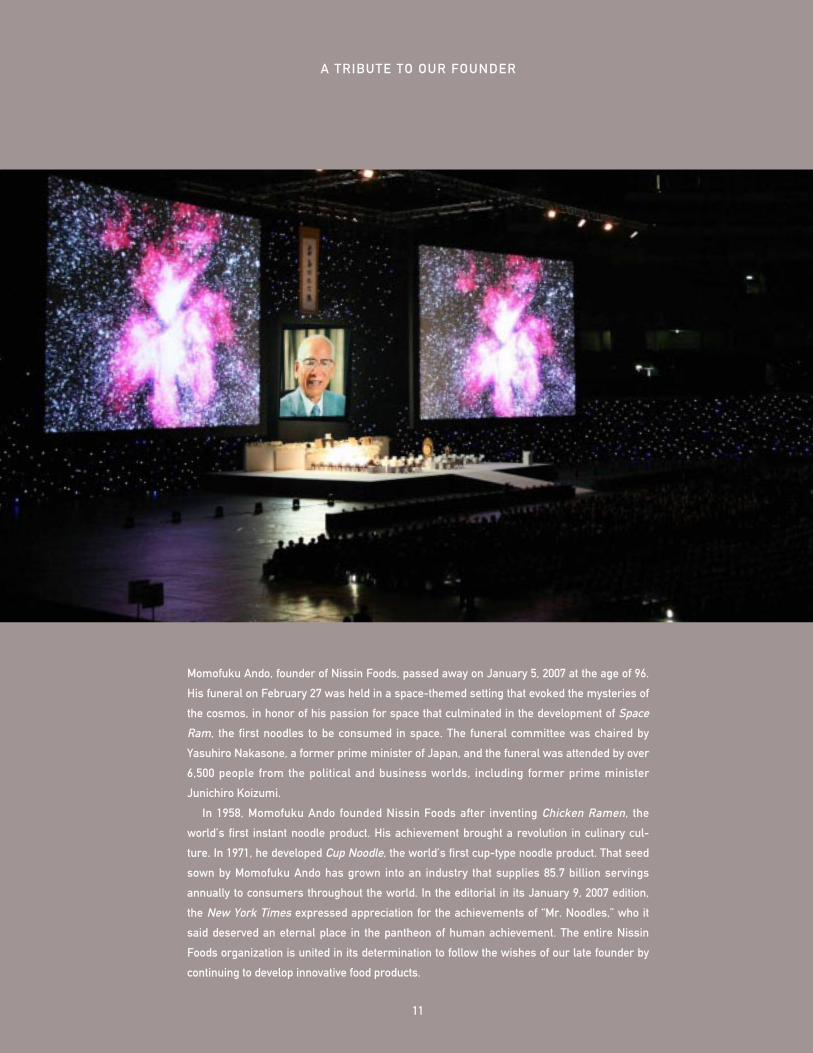
Momofuku Ando, founder of Nissin Foods, passed away on January 5, 2007 at the age of 96.
His funeral on February 27 was held in a space-themed setting that evoked the mysteries of
the cosmos, in honor of his passion for space that culminated in the development of Space
Ram, the first noodles to be consumed in space. The funeral committee was chaired by
Yasuhiro Nakasone, a former prime minister of Japan, and the funeral was attended by over
6,500 people from the political and business worlds, including former prime minister
Junichiro Koizumi.
In 1958, Momofuku Ando founded Nissin Foods after inventing Chicken Ramen, the
world’s first instant noodle product. His achievement brought a revolution in culinary cul-
ture. In 1971, he developed Cup Noodle, the world’s first cup-type noodle product. That seed
sown by Momofuku Ando has grown into an industry that supplies 85.7 billion servings
annually to consumers throughout the world. In the editorial in its January 9, 2007 edition,
the New York Times expressed appreciation for the achievements of “Mr. Noodles,” who it
said deserved an eternal place in the pantheon of human achievement. The entire Nissin
Foods organization is united in its determination to follow the wishes of our late founder by
continuing to develop innovative food products.
A TRIBUTE TO OUR FOUNDER
12
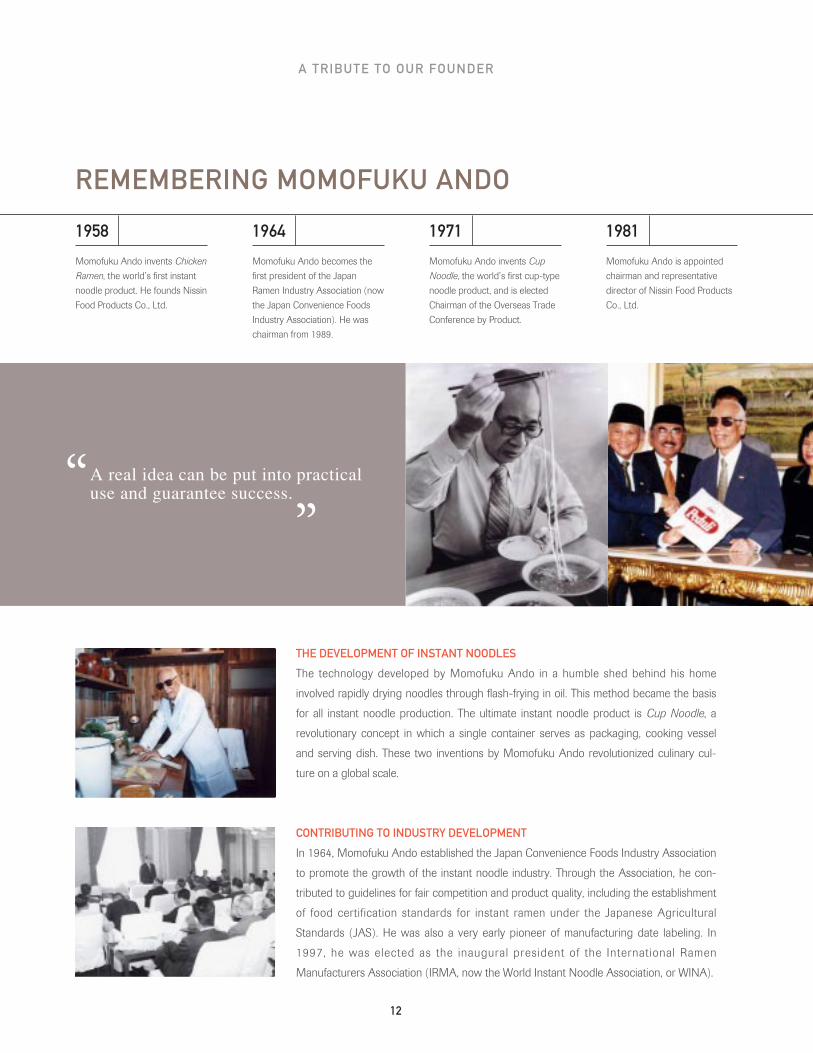
THE DEVELOPMENT OF INSTANT NOODLES
The technology developed by Momofuku Ando in a humble shed behind his home
involved rapidly drying noodles through flash-frying in oil. This method became the basis
for all instant noodle production. The ultimate instant noodle product is Cup Noodle, a
revolutionary concept in which a single container serves as packaging, cooking vessel
and serving dish. These two inventions by Momofuku Ando revolutionized culinary cul-
ture on a global scale.
CONTRIBUTING TO INDUSTRY DEVELOPMENT
In 1964, Momofuku Ando established the Japan Convenience Foods Industry Association
to promote the growth of the instant noodle industry. Through the Association, he con-
tributed to guidelines for fair competition and product quality, including the establishment
of food certification standards for instant ramen under the Japanese Agricultural
Standards (JAS). He was also a very early pioneer of manufacturing date labeling. In
1997, he was elected as the inaugural president of the International Ramen
Manufacturers Association (IRMA, now the World Instant Noodle Association, or WINA).
REMEMBERING MOMOFUKU ANDO
A TRIBUTE TO OUR FOUNDER
Momofuku Ando invents Chicken
Ramen, the world’s first instant
noodle product. He founds Nissin
Food Products Co., Ltd.
Momofuku Ando becomes the
first president of the Japan
Ramen Industry Association (now
the Japan Convenience Foods
Industry Association). He was
chairman from 1989.
Momofuku Ando invents Cup
Noodle, the world’s first cup-type
noodle product, and is elected
Chairman of the Overseas Trade
Conference by Product.
Momofuku Ando is appointed
chairman and representative
director of Nissin Food Products
Co., Ltd.
1958 1964 1971 1981
A real idea can be put into practicaluse and guarantee success.“
”

13
CONTRIBUTIONS TO YOUTH DEVELOPMENT AND CULINARY CULTURE
Momofuku Ando believed that food and sports were the two fundamental requirements for
good health. In 1983, he personally endowed the Nissin Sports Advancement Foundation
(now the Ando Foundation). The Foundation has contributed to the healthy development of
young people by supporting athletics and outdoor activities. The Foundation also runs the
Shokusokai, or Food Innovation Society, which encourages venture businesses and food
innovation by presenting an annual award named after Momofuku Ando in recognition of
creative achievements by food scientists.
DEVELOPMENT OF RAMEN FOR SPACE
Another of Momofuku Ando’s achievements was the development of Space Ram, the first
noodles to be consumed in space. After NASA’s stringent quality and safety check, the
product was carried into space by Japanese astronaut Soichi Noguchi aboard the Space
Shuttle Discovery in July 2005. Space Ram are based on technology developed by Nissin
Foods over many years, including systems to prevent the noodles and soup from escap-
ing in zero gravity. Having spread throughout the world, instant noodles have now carried
the ideals of our founder into space.
Momofuku Ando establishes and
becomes chairman of the Nissin
Sports Advancement Foundation
(now the Ando Foundation).
The Shokusokai (Food Innovation
Society) is established with
Momofuku Ando as senior advisor.
Momofuku Ando is elected as the
inaugural president of the
International Ramen
Manufacturers Association (IRMA,
now the World Instant Noodle
Association, or WINA).
Momofuku Ando becomes
Founder and Chairman of Nissin
Food Products Co., Ltd.
1983 1996 1997 2005
Stunning products will sell because they will create their own sales channels.
“”

14
noodles, frozen noodles, cooked noodles and dried noodles.
Boundaries between these segments are now disappearing, as is
the dividing line between the consumer noodle market and the
restaurant business. Nissin Foods is preparing for this new era by
becoming a truly integrated noodle manufacturer capable of
responding to the increasingly diverse needs of consumers. The
first step along that path was the capital tie-up with MYOJO
FOODS, which has advantages different from those enjoyed by
Nissin Foods and is involved in product categories that Nissin
Foods has not previously targeted.
The capital tie-up between Nissin Foods and MYOJO FOODS is
expected to produce many synergy benefits for both companies,
including improved governance, increased effectiveness in initia-
tives relating to overseas expansion, environment protection and
food safety, and efficiency improvements in the areas of production,
distribution and procurement. The two companies aim to maintain
their respective strengths by continuing to compete in marketing
and sales. We believe that by sharing management resources, we
can maximize the shareholder value of the Nissin Group.
The market for consumer noodle products has been traditionally
divided into several segments, including instant noodles, chilled
MYOJO FOODS CO. , LTD. JOINS THE NISSIN FOODS GROUP
Between November 16 and December 14, 2006, Nissin Foods implemented a friendly takeoverbid for MYOJO FOODS Co., Ltd. On March 31, 2007, MYOJO FOODS became a wholly ownedsubsidiary of Nissin Foods through the exchange of Nissin Foods shares for MYOJO FOODSshares owned by shareholders who did not accept the takeover bid.
COMBINING STABLE EARNING STREAMS(Proforma sales data, billions of yen)
’03 76.9308.5
75.6315.3’04
77.5320.0’05
76.1317.0’06
358.2 *’07
407.0 *’08(projected)
Nissin FoodsMYOJO FOODS
Note: Half year contribution from MYOJOFOODS in FY2007 and full year fromFY2008.
Hironobu Nagano (left), President of MYOJO FOODS, and Koki Ando (right),President of Nissin Foods, meet on November 15, 2006.

15
REVIEW OF OPERATIONS
sel
16.2%9.1%
11.5%
63.2%
Nissin Foods’ Consolidated Sales by Category(Year ended March 31, 2007)
The Group’s instant noodle category, comprising pillow-type and cup-
type products, brought in 79.4% of net sales. While strengthening its
other lines, Nissin Foods continues to develop and supply instant noo-
dle products that reflect consumer preferences and needs.
In the year ended March 31, 2007, net sales increased by 11.4%year on year to ¥358,238 million (US$3,035 million). This substan-tial growth resulted in part from the addition of MYOJO FOODS tothe consolidation. A reduction in retirement benefit expenseshelped to lift operating income by 5.5% to ¥33,735 million (US$286million). Net income increased by 23.3% to ¥18,969 million(US$161 million), thanks to a reduction in extraordinary losses.
■ Pillow-type Instant Noodles
■ Cup-type Instant Noodles
■ Chilled and Frozen Foods
■ Other Business
Instant Noodles
Total: ¥358,238 million

REVIEW OF OPERATIONS
INSTANTNOODLES
> REVIEW OF PERFORMANCE
The Japanese instant noodle market faces structural change from
such factors as a shrinking youth market caused by a falling
birthrate and demographic aging. Diversification of the retail sec-
tor, the growth of cut-price selling, and growing competition from
non-noodle convenience food products are also changing the
market. As the originator of instant noodles, Nissin Foods is
adapting to this environment by emphasizing food safety and reli-
ability. Our goal is to provide great taste and a solid assurance of
safety, reliability and dependability.
The noodle industry is affected by the continuing diversifica-
tion of consumer needs. In the year under review, we enhanced
our ability to satisfy these changing needs by acquiring MYOJO
FOODS Co., Ltd. as a consolidated subsidiary. This move gives us
an even better ability to supply attractive products to meet the
needs of a wide spectrum of consumers in Japan and overseas.
Sales promotion efforts for the year ended March 2007 cen-
tered on mainstay products. Marketing events included summer
and spring launches of limited-edition commemorative products to
mark the 35th anniversary of Cup Noodle and the 30th anniver-
saries of Nissin-no-Donbei and Nissin Yakisoba U.F.O. We also
launched the new Cup Noodle Refill series of environment-friendly
products and began to promote ideas for new food enjoyment
styles and scenarios. At the same time, we implemented aggressive
marketing strategies designed to maintain and enhance the value of
our brands. Despite the negative impact of mild winter weather,
these initiatives, combined with the contribution made by MYOJO
FOODS’ acquisition, allowed us to achieve increased sales of noo-
dles in both the pillow-type and cup-type categories.
PILLOW-TYPE INSTANT NOODLES
To boost sales of our mainstay Chicken Ramen range, we
launched a limited-edition set consisting of Chicken Ramen and a
IPPEI-CHAN
Cup Noodle
Nissin-no-Donbei Niku Udon
226.3
’03 43.3202.6
45.5203.3’04
44.0203.7’05
48.9204.9’06
57.9’07
Pillow-type noodlesCup-type noodles
79.4%
Pillow-type and cup-type instant noodles are Nissin Foods’
mainstay product categories and account for around 80% of its
consolidated net sales. Products supplied to consumers by
Nissin Foods today include long-selling lines, such as
Chicken Ramen (a favorite for almost half-a-century), Cup
Noodle (the world’s first cup-type product), Nissin-no-Donbei
and Nissin Yakisoba U.F.O.
CONSOLIDATED SALES
CONSOLIDATED SALES (Billions of yen)
16
CHUKAZANMAI

white bowl with a lid by ceramics maker Tachikichi. Unfortunately,
the hoped for sales recovery did not materialize, and sales were
below the previous year’s level. However, with the addition of
products manufactured by MYOJO FOODS, including
CHARUMERA and CHUKAZANMAI, sales of pillow-type products
rose by 18.3% year on year to ¥57,871 million (US$490 million).
CUP-TYPE INSTANT NOODLES
We adjusted sales promotion expenditure with the aim of enhanc-
ing the value of the Cup Noodle brand. Sales were marginally lower
year on year. In the Nissin-no-Donbei category, we extended sales
of Nissin-no-Donbei Niku Udon into eastern Japan from its original
launch in the western region. Also popular were 30th anniversary
versions of Nissin-no-Donbei Natsu no Karakuchi Umakara
Chanpon Udon and Nissin-no-Donbei Dokkan Kitsune Udon
Yuzukosho Fumi and an updated version of Nissin-no-Donbei
Kakiage Tempura Udon. Sales were similar to the previous year’s
level. Sales growth came from a 30th anniversary edition of Nissin
Yakisoba U.F.O. Gochujang Sauce and Nissin Yakisoba U.F.O.
Amakara Garlic Sauce Kyabetsu Oiri. Overall sales were moderately
higher than the previous year’s total.
Nissin Menshokunin, a non-fried noodle product developed in
response to consumer demand, and Nissin Deka-O, which fea-
tures an extra-large portion, were popular throughout the year.
Health-conscious consumers flocked to low-calorie Nissin Yasai
Soup Noodle, introduced in the current year. This segment gained
additional domestic market revenues from the addition of MYOJO
FOODS products, including IPPEI-CHAN, IPPEI-CHAN YOMISE
NO YAKISOBA and MOCHI! TO WAN-TAN MEN.
Total sales of cup-type instant noodle products reached ¥226,315
million (US$1,917 million), a year-on-year increase of 10.5%.
> FUTURE DIRECTION
Our business environment will continue to be heavily influenced by
demographic changes and the diversification of consumer prefer-
ences. One of our key strengths in this situation is a full product
line-up, which is now largely complete, following the addition of
the MYOJO FOODS range, but we must not become complacent.
We will continue to introduce high-value added products and
products with a health emphasis. Specifically, we will push for
higher sales of our mainstay products, including Chicken Ramen,
Cup Noodle and CHARUMERA, while using our technology to
develop attractive, high-value products that appeal to consumers.
Our aim is to create new demand, build a reliable long-term
growth track, and generate stable, long-term cash flows.
We are strengthening our marketing potential with “category
top management” that establishes order-made categories based
on comprehensive collaboration between marketing and distribu-
tion for rapid adaptation to changes in consumer values.
> NEW PRODUCTS
In March 2007, we launched the Cup Noodle Refill series of envi-
ronment-friendly products, based on an original concept combin-
ing the fun of eating with consideration for the environment. We
are now selling the Cup-Noodle Seafood Noodle Refill and the
Cup Noodle Refill Starter Pack that includes an original Refill
series cup and two refills, in Tokyo and nine Kanto region cities,
and by mail order.
In May 2007, we introduced Nissin Chin, a box-type microwav-
able noodle product that does not require hot water. Designed to
combine great taste, fashionability, fun and convenience, Nissin
Chin was developed as a new concept in cup-type instant noo-
dles aimed at the growing preference for gourmet foods and a
trend toward solo eating. Though it can be cooked simply by
placing it in a microwave oven, Nissin Chin provides the satisfying
texture of fresh noodles. Based on advanced Nissin Foods’ tech-
nology, this new concept in take-out food allows consumers to
enjoy real noodle flavor anytime, anywhere.
Nissin Chin
Nissin Deka-O
MOCHI! TO WAN-TAN MEN
17

18
REVIEW OF OPERATIONS
CHILLED AND
FROZENFOODS
> REVIEW OF PERFORMANCE
During fiscal 2007, ending March 2007, abnormal weather patterns
caused a decline in total demand for chilled noodles in the domestic
market. Despite this, Nissin Foods was able to increase its sales of
chilled foods by 16.8% to ¥16,130 million (US$137 million), thanks
to robust sales of the mainstay Nissin Yakisoba range, strong contri-
butions from Japanese-style products that included Nissin Yakiudon
and Nissin-no-Donbei, and the addition of products manufactured
by MYOJO FOODS.
In the frozen food segment, we exploited our advanced freezing
technology to create products with high added value, such as Reito
Nissin Spa-O, which can be prepared simply in a microwave oven,
and Reito Nissin GooTa, a noodle product with premium toppings.
While these products sold strongly throughout the year, overall
results were affected by the sale of a North American subsidiary. As
a consequence, total sales of frozen foods declined by 6.6% to
¥25,152 million (US$213 million).
Total sales of chilled and frozen foods were 1.4% above the pre-
vious year’s level at ¥41,282 million (US$350 million).
> FUTURE DIRECTION
CHILLED FOODS
In fiscal 2007, we aim to enhance the added value and competitive-
ness of our products by focusing on quality and cost reductions at
all stages, from development and production through to distribution.
In our marketing activities, we will aim for a good balance between
sales and income.
FROZEN FOODS
Our goal for fiscal 2007 is to strengthen our positioning in the
frozen noodle market, including Reito Nissin Spa-O and Reito
Nissin GooTa, by making effective use of brand assets based on
our core competences.
’03 39.1
39.7’04
39.9’05
40.7’06
41.3’07
11.5%
Nissin Foods develops and sells both chilled and frozen foods.
Our products are based on clearly defined concepts and are
designed to combine simplicity of preparation with excellent
taste. Our products offer superior cost performance and are
enjoyed by consumers in a wide spectrum of age groups.
CONSOLIDATED SALES
CONSOLIDATED SALES (Billions of yen)
Nissin Yakiudon
Nissin Yakisoba
Frozen version of Nissin Goota
Gyoretsu-no-Dekiru-Mise-no-Ramen
Frozen version ofNissin Spa-O

> REVIEW OF PERFORMANCE
Our marketing strategy was based on the development of a richly
varied range of products for health-conscious consumers. Core
products, such as the lactobacillus beverage Pilkul, which has
been approved as a Food for Specified Health Use, and Tokachi
Nomu Yogurt, continued to sell well. New products included
Pilkul Calorie 1/2 (not classed as a Food for Specified Health
Use), which combines good taste with reduced calories, and
Shokubutsusei Nyusankin Ringo, a lactobacillus beverage. We also
expanded our range of soft drinks and other products for sale in
convenience stores.
In the confectionery category, the launch of a grape-flavored
version of the Ciscorn Big cereal range for a limited period was
reflected in sustained growth and a double-digit year-on-year
increase in sales. Other successful new products included sable
cookies in coconut, butter and sesame flavors. The addition of the
restaurant operations of MYOJO FOODS to this segment also
contributed. Sales in this segment increased by 20.5% year on
year to ¥32,770 million (US$278 million).
> FUTURE DIRECTION
Our product strategy for this segment focuses on the enjoyment
of food under the concept of “food and health.” We aim to meet
consumer expectations by creating new value based on
enhanced competitiveness and collaboration across all of our
value chains. Within the Nissin Group, we have strengthened col-
laboration among our product development, manufacturing and
marketing organizations. The result is a highly competitive busi-
ness structure capable of achieving revolutionary advances in
product development and marketing activities. We have identified
health foods as a priority area, and we have established a new
Health Food Marketing Department to strengthen our business
base in this market.
OTHERBUSINESS
’03 30.3
31.5’04
29.4’05
27.2’06
32.8’07
9.1%
In this segment, Nissin Foods manufactures and sells cere-
al foods, confectionery and dairy products through group
companies. We are also diversifying into related business
areas, such as the manufacture and sale of containers, and
distribution.
CONSOLIDATED SALES
CONSOLIDATED SALES (Billions of yen)
Tokachi Nomu Yogurt
Shokubutsusei Nyusankin Ringo
Pilkul Calorie 1/2 Cereal, confectionary and dairy products
19

20
> THE AMERICAS
U.S.A.
In volume terms, sales increased by 13% year on year, reflecting
robust sales of our mainstay Top Ramen and Cup Noodles series, as
well as the contribution from the high-added-value lines CHOW
MEIN and Souper Meal series. We anticipate continuing challenges
in our business environment, including substantial increases in the
prices of raw materials and distribution costs. Our strategy in this
environment calls for the ongoing development of products that
offer enhanced added-value and for further improvement in our
income structure through changes to our production, procurement,
and distribution systems.
MEXICO
Our income structure improved dramatically following the start of
full-scale local production by Nissin Foods de Mexico S.A. de C.V.,
which eliminated the risk of exchange rate fluctuations and brought
substantial reductions in distribution costs. We will continue to
strengthen our income structure through further improvements in
the efficiency of production and sales operations. Market expansion
strategies include the expected sales of our mainstay Cup Noodles
series and the introduction of products offering new ideas.
BRAZIL
We are actively expanding into new product areas in Brazil, and in
fiscal 2007, we launched the three-product Pasta Pronta series, with
the aim of displaying and selling our products in the pasta sections
of stores as well as the noodle sections. Annual demand in the
Brazilian market is 1.4 billion servings. Though competition continues
to intensify, Nissin-Ajinomoto Alimentos Ltda., a joint venture
between Nissin Foods and Ajinomoto Co., Inc., has a market share
of approximately 60%.
> EUROPE
The start-up of full-scale production operations by Nissin Foods
Kft. in Hungary has strengthened our capacity to achieve full cov-
erage of Europe by expanding our presence in the rapidly grow-
ing markets of Eastern and Central Europe. We plan to expand
our business base in readiness for this new era by aggressively
introducing new products.
OVERSEASOPERATIONSSince the establishment of Nissin Foods (U.S.A.) Co., Inc. in
1970, Nissin Foods has continually worked to popularize
instant noodles in international markets. Overseas, the
Nissin Foods Group includes 30 companies in 10 countries.
In fiscal 2007, our overseas sales increased by 5.0% year
on year to ¥54,520 million (US$462 million), excluding inter-
segment sales (see “Information by geographic area,” P.52).
Factors contributing to the increase included higher sales
volumes in North America, sales expansion in Hong Kong,
and the effects of a weaker yen.
REVIEW OF OPERATIONS
EuropeanCup Noodles
IndianCup Noodles and
Top Ramen
ThaiCup Noodles and
YAKISOBA
PhilippineCup Noodles and
Pancit Canton

21
> ASIA
PEOPLE’S REPUBLIC OF CHINA
The Chinese market for instant noodles continues to show steady
growth, with demand expanding from 21.2 billion servings in
2001 to 44.3 billion in 2005 (source: WINA [formerly IRMA]).
Nissin Foods supplies products mainly to northern and north-
eastern China through a Chinese joint venture, Nissin Hualong
Foods Co., Ltd. (Jinmailang Foods Co., Ltd. until January 2007). In
fiscal 2007, Nissin Hualong Foods sold a total of 7.2 billion serv-
ings in China.
Also with subsidiaries in Shanghai and Guangdong, we are
working to raise our profile and market share in China through mar-
keting and R&D, and by supplying high-quality foods, including new
products. China is our most important market, and a priority for busi-
ness structure development. The Nissin and Winner Groups have a
75% share of the instant noodle market in Hong Kong, and both
sales and income from this business continue to show strong growth.
INDIA
Noodles are a relatively new addition to the diets of Indians.
However, the use of processed foods is expanding in this nation of
1.1 billion people, and there is potential for major expansion of the
instant noodle market. Indo Nissin Foods Ltd. has already achieved
substantial sales growth through marketing strategies designed to
expand the range of purchasers. It has focused in particular on low-
priced instant noodles costing 5 rupees (around ¥14) per serving,
as well as pillow-type MUG SMOODLES, which can be prepared
simply by adding hot water.
INDONESIA
Indonesia is a major market with yearly instant noodle demand of
14.0 billion servings. Though competition is extremely fierce, PT.
NISSINMAS was able to expand its sales by 10% year on year. Its
mainstay is a low-priced instant noodle flavored with baso sapi (beef
ball soup). As a manufacturer of halal products, NISSINMAS is
developing export markets among the Muslim populations of many
countries, including Singapore, in addition to its sales in Indonesia.
THAILAND
Demand for cup noodles has expanded dramatically in Thailand due
to convenience stores. Nissin Foods (Thailand) Co., Ltd. is differenti-
ating itself through new products such as the YAKISOBA series in
Japanese sauce and Thai curry flavors, and an extra-large KING
CUP version with a creamy seafood flavor.
THAI PRESIDENT FOODS PUBLIC COMPANY LIMITED,
Thailand’s leading manufacturer of instant noodles, became an affili-
ated company, with 20% Nissin Foods ownership. Its “Mama” brand
holds over a 50% market share, or 1.2 billion servings in 2006.
PRESIDENT FOODS’ version of tom yam kung (spicy shrimp) noo-
dles is the most popular in Thailand.
THE PHILIPPINES
The Cup Noodle seafood flavors developed in Japan have been
extremely popular in the Philippines, and products based on these
flavors account for over 30% of the total sales of Nissin-Universal
Robina Corporation. Pillow-type products make up 94% of the
Philippine instant noodle market. Nissin has expanded its market
share by introducing new products. These include Nissin Sotanghon,
a pillow-type version of harusame (bean-starch vermicelli), in
response to a growing consumer preference for healthy foods, and
Nissin Pancit Canton, a new yakisoba product.
U.S. Cup Noodlesand CHOW MEIN
MexicanCup Noodles
BrazilianCup Noodles
Hong Kong Cup Noodles
IndonesianCup Noodles and
Top Ramen

FOOD SAFETY RESEARCH INSTITUTE
We established the Food Safety Research Institute in June 2002. It
applies scientific methods to ensure the quality and safety of prod-
ucts supplied to consumers. It plays an important role at every
level: safety checks at the product development level, including the
development of new inspection and analysis methods, quality test-
ing of raw materials procured from suppliers, inspection of suppli-
ers’ facilities, and the management of quality assurance systems in
Nissin Group production facilities.
Another important task for the Food Safety Research Institute
is the provision of the information needed by management to
make decisions relating to food safety, which is our most important
social responsibility. The Institute is independent of other organiza-
tional units and reports directly to the President.
We have further strengthened our raw material quality man-
agement systems in China with the establishment of the Nissin
Shanghai Food Safety Research Institute, which became fully oper-
ational in May 2007.
FOOD SAFETY AUDITS
All processes are subject to safety audits under Nissin’s Inspection
Standards for Food Safety (NISFOS). This system, which was for-
mulated by the Food Safety Research Institute in April 2004, cov-
ers food safety management systems, general countermeasures
against hazardous substances, manufacturing standards, facility
maintenance, and sanitation in plants that supply Nissin Foods
with raw materials. Assessments are carried out objectively using
audit checklists, and results from inspections in the five categories
are quantified under a points system. If a plant receives a low
score, Nissin Foods provides guidance on remedial measures.
ANALYSIS OF RESIDUAL AGRICULTURAL CHEMICALS AND
VETERINARY PHARMACEUTICALS
In November 2001, the Food Safety Research Institute developed
a system that could simultaneously analyze 60 types of agricultur-
al chemicals and began to accumulate data through this system.
This work resulted in the development of the NASRAD-550
detection system for residual agricultural chemicals and veterinary
pharmaceuticals.
The NASRAD-550 system consists of three high-speed analysis
systems: NASRAC-450, which can analyze around 450 chemical
substances in general agricultural products, the NASRAC-G250,
which can detect approximately 250 different substances in cereals,
As a food manufacturer dedicated to qualityand safety, Nissin Foods is determined tosupply only products that merit the confidenceof consumers. We implement this philosophyby working from various perspectives toensure food safety under a unique qualityassurance structure centering on the FoodSafety Research Institute. Safety is a unifyingtheme in every process from product devel-opment through to production in our plants,and every system is designed to supportintensive quality assurance programs.
22
QUALITY AND SAFETY

23
and the NASVED-100, which is designed to detect about 100 ani-
mal feed additives and veterinary pharmaceuticals in livestock and
marine products.
DETECTION METHOD FOR CARCINOGENIC
In June 2003, the Food Safety Research Institute established
Nissin Food’s Evaluation Systems for Mammalian GenoToxicity
(NESMAGET) and filed a patent application. The indicator for this
simplified mutagen detection method is the expression of a DNA
repair gene (p53R2).
Initially the test used human breast cancer cells, but the method
was subsequently expanded, and now uses human cell cultures
from the liver, lungs, digestive system and other organs, to encom-
pass the various routes through which chemicals are absorbed into
the body. The result is a technology that can be used to assess a
broad spectrum of effects on internal organs. The method is also
likely to be effective in detecting serious DNA damage (double-
strand breakage), which is invariably associated with the onset of
cancer. This research finding was presented at the annual meeting
of the Pharmaceutical Society of Japan in March 2007.
DEVELOPMENT OF AN ALLERGEN DETECTION METHOD
In January 2006, the Food Safety Research Institute introduced a
method for detecting 12 of the 20 substances for which allergy
labeling is recommended. This method is based on the amplifica-
tion of substances in the 12 ingredients that include specific DNA
arrays. It is now being used to ascertain whether these sub-
stances are contained in food products. A patent application is
currently pending. In May 2006 a licensee of the technology
began to provide contract testing services for some of the sub-
stances for food manufacturers and other companies.
ALLERGEN LABELING
Since April 2001, allergy labeling has been compulsory for eggs,
milk, buckwheat, wheat, and peanuts—all of which are classed as
“specified ingredients” that have the potential to cause allergic
reactions when consumed. Labeling is recommended for another
20 ingredients. Nissin Foods lists ingredients in both categories
on its packaging if any are used in its products.
Nissin and plantsConsumers
�
BreedersInspection of the surroundings and veterinary-use pharmaceuticals, management of animal growth status and water control
�
Feed plantsManagement of hygiene and manufacturing process, and safety inspection, improvement and instruction
�
FarmsInspection of the surroundings and residual agricultural chemicals
Fishing grounds
�
Inspection of the surroundings and veterinary-use pharmaceuticals
Ingredient plants
Food Safety Research Institute
Inspection of residual agricultural chemicals, veterinary-use pharmaceuticals, cancer-causing substances, genetically modified organisms and microbe levels in ingredients
Quality control between plants and inspection of analysis gap and correction

24
Raw Materials
DistributionDistribution
INPUT
OUTPUT
FuelPackaging Water Resources
General WasteCO2
��
ProductionProduction ConsumptionConsumption
Final Disposal
RecyclingRecycling
Energy
Effluent
� �
CO2
Waste
HARMONIOUS COEXISTENCE
The Environmental Charter adopted by Nissin Foods in March
1999 was a declaration of our commitment to environmental pro-
tection and resource conservation in the context of our business
activities, to harmonious coexistence with society, and to the
improvement of the global environment. Since then, we have con-
tinuously sought to contribute to the realization of a sustainable,
recycling-based society through activities that include resource
and energy conservation and waste reduction.
One of the ways in which we are reducing the environmental
footprint of our business activities is through the achievement of
certification under the ISO 14001 standard. We have also estab-
lished an Environmental Committee and task-specific action teams
made up of representatives from various organizational units. In
addition, we are continuously implementing and improving our
environment-related systems and initiatives, including environmen-
tal audits, environment-related educational programs, environmen-
tal risk countermeasures, and emergency drills.
CONSIDERING THE ENVIRONMENT IN ALL PROCESSES
Specific environmental initiatives in fiscal 2007, ending March
2007, include zero-emission activities designed to reduce the vol-
ume of waste from plants to zero. We have succeeded in recycling
98.5% of byproducts and waste from four domestic plants directly
operated by Nissin Foods and Sapporo Nissin’s plant. We have
also reduced CO2 emissions by using natural gas instead of fuel oil
in boilers at our main production sites in Japan.
We consider the environment in all facets of our business activi-
ties, including efforts to reduce the volume of containers and packag-
ing used, the rationalization of materials procurement, and the reduc-
tion of environmental loads resulting from distribution activities. Nissin
Foods is also an active participant in Team Minus 6%, a private sector
global warming prevention campaign launched under the auspices of
the government’s Global Warming Prevention Headquarters, which
was established under the provisions of the Kyoto Protocol.
Nissin Foods aims to promote harmoniouscoexistence with the natural environment byworking to protect the environment and con-serve resources through its business activi-ties. To date, we have achieved certificationunder the ISO 14001 environmental man-agement standard at 19 sites in Japan andoverseas. We also publish environmentalaccounts as a way of quantifying and moni-toring the cost of environmental protection.
1. We will comply with all environment-related laws, regulations andagreements and all applicable international standards. We will showproper consideration for the environment in our activities in other coun-tries as well as in Japan.
2. We will develop environmentally sound products through prior assess-ments of the environmental impact at each stage, from the procure-ment of raw materials through to production, distribution, consumptionand disposal.
3. Our first priority in relation to the raw materials, additives, containers,packaging materials and other items used in our products will be theprotection of human health and safety.
4. We will strive to conserve energy and resources by reducing and recy-cling waste products.
5. We will actively participate in efforts to create social frameworks forenvironmental protection and foster awareness and understanding.
6. As a good corporate citizen, we will work to achieve harmonious coex-istence with local communities and support environmental protectionactivities beyond our corporate organization. We will also support volun-tary activities by employees.
7. We will inform all executives and employees about this EnvironmentalCharter and publish it within and beyond the Nissin Foods organization.
PROCESS FLOW
NISSIN FOODS ENVIRONMENTAL CHARTER — CODE OF CONDUCT
ENVIRONMENTAL ACTIVITIES

25
General Meeting of Shareholders
Board of Directors
Internal AuditingOffice
Board of Corporate Auditors
Business Divisions
Management Committee
Consultation/Recommendation
Selection andAppointment
Selection andAppointment
Direction/ReportDirection/
SupervisionReport
Audit Report
AuditReport
Selection andAppointment
Advice andGuidance
Selection andAppointment
Liaison
Liaison
Liaison
Audit
Audit Audit
Liaison
Report
Audit Report
Report
Business Execution
Internal Activities
Audit
Internal Control System
Investment and LoanStrategy Committee
Lawyers,Tax Accountants
and OtherProfessionals
Business Ethics CommitteeEnvironmental Committee
Information Security CommitteeExecutive Committee
Independent Auditors
Representative Director
Risk Management Committee
BASIC STANCE ON GOVERNANCE
Corporate governance demands highly objective and transparent
management. For many years we have appointed outside directors
and consulted outside experts to energize business and maintain
management transparency. In June 1998, we introduced an exec-
utive officer system to speed up decision-making and create a
clear line between governance and executive functions.
The 15-member Board of Directors–eleven directors (two out-
side), and four corporate auditors (two outside) meets monthly,
with special meetings as necessary. The Board makes important
business decisions including defining basic management policies,
and also supervises director activities.
The Board of Directors is advised by two committees of full-
time directors and standing corporate auditors. The Management
Committee meets twice monthly to discuss matters to be decided
by the Board, and those matters delegated to it by the Board. The
Investment and Loan Strategy Committee meets monthly to dis-
cuss and conduct preliminary assessments of important matters.
The Executive Committee meets every month and consists of
full-time directors, standing corporate auditors and executive offi-
cers. It applies management policies issued by the Board of
Directors. Executive officers implement operations in their units
according to directives from the Board of Directors, and report the
results to the Executive Committee.
Nissin Foods is a company with auditors. The four-member
Board of Corporate Auditors has two outside auditors. The corpo-
rate auditors adopt audit policies and plans, and discuss audit
activities. The Board of Corporate Auditors meets on alternate
months, with special meetings convened when needed.
Since 2006, a reserve auditor is retained for two years in case
of a vacant outside auditor position.
STATUS OF INTERNAL CONTROL SYSTEMS
The smooth operation of internal control systems is a critical man-
agement task. The entire company is working to achieve this under
the policy on internal control systems development, adopted by the
Board of Directors in May 2006.
The corporate auditors monitor internal control system effective-
ness in all areas. Along with the Internal Auditing Office they also
audit and verify the operations of individual business departments
through operational audits. If necessary, they provide remedial
measure guidance.
We are also developing internal control systems for financial
reporting, as required under Japan’s new Law on Sales of Financial
Products. We will establish systems that provide checks and bal-
ances within and between organizational units, in all business areas.
The mission of Nissin Foods is to maximizethe interests of all stakeholders, includingshareholders, consumers, employees andcommunities, by supplying safe, high-qualityfoods and enhancing corporate governance.
CORPORATE GOVERNANCE

BOARD OF DIRECTORS AND OFFICERS (As of June 28, 2007)
26
President & Representative Director
Koki Ando
Senior Managing Director & Representative Director
Susumu NakagawaIn Charge of Sales
Managing Directors
Akihide MatsuoGeneral Manager of Corporate Production PlanningDivision and in Charge of Corporate Purchasing
Takayuki NarutoPresident of Nissin Foods (U.S.A.) Co., Inc.
Directors
Taiji MatsumuraGeneral Manager of Central Research Institute
Ken SasaharaGeneral Manager of International Division
Takahisa YanagidaGeneral Manager of Financial Division and in Chargeof Corporate Strategy & Management
Osamu TetsubayashiGeneral Manager of Personnel Division
Yoshinori MiuraGeneral Manager of Sales Division
Hironobu Nagano *President of MYOJO FOODS Co., Ltd.
Yorihiko Kojima *President & CEO, Mitsubishi Corp.
Eizo Kobayashi *President & CEO, ITOCHU Corp.
Note: Non-executive director
Standing Corporate Auditors
Yuichi Terada
Syunsaku Makizono
Corporate Auditors
Toru Horinouchi
Hiroshi Takano
Corporate Executive Officers
Masami NishioGeneral Manager of Corporate Management Division
Toshihiro YamadaGeneral Manager of Food Safety Research Institute
Takashi TakahashiGeneral Manager of Shizuoka Plant
Takashi YokogoshiGeneral Manager of Shiga Plant
Kazumasa SantoGeneral Manager of Osaka Sales Division
Hideki HattoriGeneral Manager of Corporate Communications Division
Masafumi MiyataGeneral Manager of CVS Sales Division
Katsumi TomomasaGeneral Manager of Tokyo Sales Division
Takashi HirotaGeneral Manager of Marketing Division
Hiroki MorimotoGeneral Manager of Sales Planning & Control Division
Koji SakaiGeneral Manager of Technical Engineering Division
Mitsuru TanakaDeputy General Manager of Central Research Institute
From left: Yoshinori Miura, Takahisa Yanagida, Taiji Matsumura, Akihide Matsuo, Koki Ando, Susumu Nakagawa, Takayuki Naruto, Ken Sasahara,Osamu Tetsubayashi, Hironobu Nagano

27
FINANCIAL SECTION
For the year
Net sales
Cost of sales
Gross profit
Selling, general and administrative expenses
Operating income
Other income (expenses)
Income before income taxes and minority interests
Income taxes
Minority interests in earnings of consolidated subsidiaries
Net income
Per share
Net income
Cash dividends
Net assets *1
At year-end
Working capital *2
Property, plant and equipment, net
Total assets
Long-term liabilities
Net assets *3
R&D expenses
Capital expenditures
Value & performance indicators
Operating margin (%) *4
Return on assets (%) *5
Return on equity (%) *6
Inventory turnover (times) *7
Notes: 1. Net assets per share = (Net assets – minority interests) / number of shares outstanding as of the year end (excluding treasury stocks)2. Working capital = Total current assets – Total current liabilities3. Net assets: In compliance with the Corporate Law, from fiscal 2007, the amount of net assets includes the amount of minority interests (¥6,725 million). For year prior to 2007,
minority interests are not included in net assets.4. Operating margin = Operating income / Net sales5. Return on assets = Net income / Average total assets6. Return on equity = Net income / Average total net assets7. Inventory turnover = Cost of sales / Average total inventory
¥ 308,463
157,663
150,800
125,984
24,816
(4,741)
20,075
7,613
526
11,936
¥ 93.91
30.00
1,835.03
¥ 71,086
82,444
326,913
11,118
230,582
¥ 2,579
6,312
8.0
3.7
5.2
14.1
¥ 315,279
160,258
155,021
128,621
26,400
(880)
25,520
10,901
197
14,422
¥ 115.65
30.00
1,892.89
¥ 60,044
87,537
331,994
11,739
233,708
¥ 2,757
6,965
8.4
4.4
6.2
13.6
¥ 320,033
161,979
158,054
134,851
23,203
1,502
24,705
10,437
217
14,051
¥ 113.61
30.00
1,980.14
¥ 62,017
81,243
343,645
16,175
244,439
¥ 2,762
6,766
7.3
4.2
5.9
13.6
¥ 316,973
156,877
160,096
131,133
28,963
(1,891)
27,072
10,244
216
16,612
¥ 134.36
30.00
2,091.16
¥ 56,332
75,332
361,105
19,414
258,139
¥ 2,697
3,251
9.1
4.7
6.6
12.9
Millions of yen(except per share information)
Years ended March 31 2007 2006 2005 2004 2003 2002
N i s s i n F o o d P r o d u c t s C o . , L t d .
C o n s o l i d a t e d S i x - Y e a r S u m m a r y o f S e l e c t e d F i n a n c i a l D a t a
¥ 321,700
158,209
163,491
131,512
31,979
(2,167)
29,812
14,469
(46)
15,389
¥ 125.09
30.00
2,167.81
¥ 82,404
69,019
366,801
18,975
263,199
¥ 2,727
3,517
9.9
4.2
5.9
12.6
¥ 358,238
175,296
182,942
149,207
33,735
(157)
33,578
14,547
62
18,969
¥ 156.12
50.00
2,304.40
¥ 63,703
93,634
410,407
26,094
288,476
¥ 3,164
6,152
9.4
4.9
7.0
12.9

28
Net Income
Consolidated net sales of the Group for fiscal 2007 grew by 11.4%
from ¥321,700 million in the previous fiscal year to ¥358,238 million
(US$3,035 million) in the year under review. The biggest contribution
to this increase was made by the newly consolidated subsidiary
MYOJO FOODS CO., LTD. (“MYOJO FOODS”).
Net sales in Japan, excluding intersegment sales, increased by
12.6% from ¥269,765 million in the previous fiscal year to ¥303,718
million (US$2,573 million). The contribution from Japan to total consol-
idated net sales rose by 0.9 percentage point to 84.8%.
The domestic instant noodle industry was faced with changing
customer demographics, such as the decrease in the number of
young consumers as the birth rate declines and the population ages.
It also faced loss leader discounting by large retailers and a severe
competition from neighboring business sectors. Each instant noodle
manufacturer tried hard to stay ahead by raising its market share
through efforts to develop and launch new products that better meet
customer needs.
In the face of this business environment, the Company rededi-
cated itself to its fundamental business policy of supplying safe and
reliable products that earn the trust of consumers. The Company
went all out to ensure the safety of raw materials through its own
inspection systems capable of detecting residual pesticides and
chemicals contained in animal products. During the current fiscal
year, to better meet diversifying customer needs, the Company
acquired MYOJO FOODS and included it among its consolidated
subsidiaries, thereby becoming better able to supply attractive
products to satisfy broader customer needs, both in Japan and
overseas. On top of this, the Company launched an environment-
friendly refill product dubbed Cup Noodle Refill, introducing a new
style and food scene.
On the sales front, the Company focused on its mainstay prod-
ucts, such as Cup Noodle, which marked its 35th anniversary, and
Nissin-no-Donbei and Nissin Yakisoba U.F.O., both marking their 30th
anniversaries. There was some downward sales pressure from fac-
tors that included a warm winter and a sales strategy to maintain and
enhance the Nissin brand value. Despite this, the Company saw
increased domestic sales of both pillow-type instant noodles and
cup-type instant noodles, contributed by the inclusion of MYOJO
FOODS in consolidation.
In chilled and frozen foods, the Company grew its sales in chilled
noodle products Nissin Yakiudon, easy-to-prepare, microwave-and-
serve frozen products Reito Nissin Spa O, and premium-grade ingredi-
ent frozen products Reito Nissin GooTa. The Company registered
increased sales in chilled and frozen foods, driven in part by the sales
of products of MYOJO FOODS, which joined the Company as a con-
solidated subsidiary starting from the current fiscal year.
Looking at the global market for instant noodles, we anticipate
continuous growth in the aggregate demand. According to the
International Ramen Manufacturers Association (IRMA) (recently
renamed the World Instant Noodle Association (WINA)), the average
annual growth rate of product consumption has been 13% since
2000, and the aggregate demand for instant noodles, which was 85.7
billion servings in calendar year 2005, is expected to reach 100 billion
servings in 2009. The overseas businesses of the Company continued
to focus on market development in the major markets, particularly in
North America and in the People’s Republic of China (PRC). In the
North America market, reflecting stable growth in the aggregate con-
The scope of consolidation for this review of fiscal 2007, ended March 31, 2007, covers Nissin Food Products Co., Ltd. (the “Company”), 33 con-solidated subsidiaries-18 in Japan and 15 overseas and two affiliate companies accounted for by the equity method (together, the “Group”).
I N C O M E A N A LY S I S
’03
’04
’05
’06
’07
315.320.0
19.7
19.2
22.0
24.0 30.5
29.9
23.9
23.9
26.4276.4
269.8
273.9
303.7
320.0
317.0
321.7
358.2
268.9
SALES BY GEOGRAPHIC AREA(excluding intersegment sales)(Billions of yen)
■Other Areas ■North America ■Japan
’03
’04
’05
’06
’07
315.330.3
31.5
29.4
27.2
32.7 41.3
40.7
39.9
39.7
39.1
45.5203.3
48.9204.9
44.0203.7
57.9226.3
320.0
317.0
321.7
358.2
43.3202.6
NET SALES BY CATEGORY(Billions of yen)
■Others ■Chilled and frozen foods ■Cup-type noodles ■Pillow-type noodles
FINANCIAL REVIEW

29
sumption of instant noodles, as well as customers’ strong support
throughout the year for premium-priced lines, like CHOW MEIN and
the Souper Meal series, the number of servings sold during calendar
year 2006 surged ahead. In the PRC market, the Hong Kong area, in
particular, showed strong growth. It recorded a 1% year-on-year
increase in the aggregate number of servings of pillow-type and cup-
type instant noodles sold, as well as a 4% increase in the sales
amount. As a result, total sales in North America and other areas,
excluding intersegment sales, increased by 5.0% from the previous
year to ¥54,520 million (US$462 million). The breakdown shows the
sales in North America as ¥30,505 million (US$258 million), a 2.0%
year-on-year increase, and the sales in other areas as ¥24,015 million
(US$203 million), a 9.0% year-on-year increase.
Analysis of net sales by business segment show that the
Company’s mainstay business, comprising instant noodles and associ-
ated business, (pillow-type instant noodles, cup-type instant noodles
and chilled and frozen foods) excluding intersegment sales, amounted
to ¥325,468 million (US$2,757 million) and accounted for 90.9% of
total net sales.
Net sales of the Other Business segment, on the other hand,
was ¥32,770 million (US$278 million), which was 9.1% of the total
net sales.
Breaking down the results for instant noodles and associated
business, pillow-type instant noodles experienced a decrease in sales
of mainstay products such as Chicken Ramen and Nissin-no-
Ramenyasan in comparison with the previous year’s performance.
However, the Japanese domestic market registered an increase in
net sales that was largely attributable to new contributions from
MYOJO FOODS’ products. Sales of existing cup-type instant noodle
mainstay products, were negatively influenced by a warm winter in
Japan and by the Company’s decision to pursue a sales strategy that
maintains and enhances brand value. On the other hand, sales of
Nissin Menshokunin non-fried noodles, which captured consumer
attention, and Nissin Deka-O, which features a larger serving of noo-
dles, continued to be strong throughout the year. Also, Nissin Yasai
Soup Noodle, a low-calorie product launched during the year under
review, received strong support from health- and diet-conscious con-
sumers, and sales remained consistently high. The addition of
MYOJO FOODS’ product lines also contributed to the sales increase
in the domestic market.
Looking at overseas markets, existing products recorded buoyant
sales, especially in the United States. In particular, sales of premium-
priced products developed for sale in the United States grew remark-
ably. (Please refer to Review of Operation on P. 15–19 for details of
performance by product category.)
Cost of Sales and Selling, General and Administrative Expenses
Although cost of sales increased by 10.8% year on year to ¥175,296
million (US$1,485 million), paralleling the growth in net sales, the cost
of sales ratio slightly improved from 49.2% in the previous fiscal year
to 48.9%, mainly due to a decline in expenses relating to retirement
benefits.
Selling, general and administrative expenses amounted to
¥149,207 million (US$1,264 million), resulting in a 13.5% increase from
the previous fiscal year’s ¥131,512 million. The ratio of SG&A expenses
to net sales also rose by 0.8 percentage point to 41.7%. These increas-
es are attributable to the growth in variable expenses such as promo-
tional and distribution expenses. Among SG&A items, promotional
expenses increased by 16.6% compared with the previous fiscal year
to ¥87,209 million, and the ratio to net sales rose by 1.1 percentage
point to 24.3%. Distribution expenses, as well, grew by 16.6% year on
year to ¥20,305 million, with a 0.3 percentage point rise in the ratio to
net sales. On the other hand, while advertising expenses (fixed
expenses) edged up by 0.8% from the previous fiscal year to ¥12,423
million, their ratio to net sales dropped by 0.3 percentage point.
Operating Income, Other Income (Expenses) and Net Income
The increase in net sales and the improvement in the cost of sales
ratio largely absorbed the negative effect brought by the rise in SG&A
expenses (which increased in both amount and in the ratio to net
sales). As a result, consolidated operating income for fiscal 2007 grew
to ¥33,735 million (US$286 million), a 5.5% increase on the previous
’03
’04
’05
’06
’07
26.48.4
23.2
29.0
32.0
33.7
7.3
9.1
9.9
9.4
OPERATING INCOME ANDOPERATING MARGIN(Billions of yen)
■Operating income Operating margin
’03
’04
’05
’06
’07
471.5
412.6
688.7
653.5
557.9
INTEREST COVERAGE RATIO(Times)
*Interest coverage ratio = operating cash flow/interest payments

30
Cash Flows
Cash and cash equivalents as of March 31, 2007 stood at ¥76,695
million (US$650 million), an increase of ¥15,125 million from the
¥61,570 million recorded in the previous fiscal year.
Net cash provided by operating activities increased by ¥338 mil-
lion to ¥26,974 million (US$228 million) from the previous year’s
¥26,636 million. Major cash in-flow items included a ¥3,766 million
increase in income before income taxes and minority interests and a
¥2,760 million decrease in gain on sales of marketable securities and
investments in securities and others. Another item affecting cash in-
flow was a ¥464 million (US$4 million) increase from accrued retire-
ment benefits to directors and statutory auditors, reversing a decrease
of ¥3,718 million in the previous fiscal year. On the other hand, major
cash out-flows included a ¥4,503 million decrease in loss on impair-
fiscal year’s ¥31,979 million. However, due to a rise in the ratio of
SG&A expenses to net sales, the operating margin declined by 0.5
percentage point to 9.4%.
Net other expenses showed a sizable decrease of ¥2,010 million,
from ¥2,167 million in the previous fiscal year to ¥157 million (US$1
million). Among other income items, gain on sales of marketable secu-
rities decreased by ¥2,969 million to ¥104 million (US$1 million).
However, this decrease in income was offset by decreases in expens-
es. One such expense was loss on impairment of fixed assets, which
was initially posted in the previous year in accordance with newly
adopted accounting standards, and decreased by ¥4,503 million to
¥1,129 million (US$10 million). Another large decrease was in loss on
revaluation of investments in companies in the PRC, which decreased
by ¥1,178 million to ¥1,379 million (US$12 million).
As a result, income before income taxes and minority interests
amounted to ¥33,578 million (US$284 million), a 12.6% increase from
¥29,812 million in the previous fiscal year.
Net income was ¥18,969 million (US$161 million), marking a
23.3% increase from the previous fiscal year’s ¥15,389 million. The
ratio of net income to net sales rose by 0.5 percentage point year on
year from 4.8% to 5.3%. Net income per share rose by ¥31.03, from
¥125.09 in the previous fiscal year to ¥156.12 (US$1.32).
L I Q U I D I T Y A N D C A P I TA L R E S O U R C E S
’03
’04
’05
’06
’07
4.4
4.2
4.7
4.2
4.9
332.0
343.6
361.1
366.8
410.4
TOTAL ASSETS AND ROA(Billions of yen) / (%)
■Total assets ROA
’03
’04
’05
’06
’07
175.3
181.2
173.3
205.5
166.5
60.0
62.0
56.3
82.4
63.7
WORKING CAPITAL AND CURRENT RATIO(Billions of yen) / (%)
■Working capital Current ratio
Working capital =Total current assets - Total current liabilitiesCurrent ratio =Total current assets / Total current liabilities
’03
’04
’05
’06
’07
6.2
5.9
6.6
5.9
7.0
233.7
244.4
258.1
263.2
288.5
SHAREHOLDERS’ EQUITY AND ROE(Billions of yen) / (%)
■Shareholders’ equity ROE
Costs and Expenses, and Net Sales Ratio
Millions of yen
2007 2006
Year ended March 31, 2007 and 2006 Net Sales Ratio Net Sales Ratio
Cost of sales ¥175,296 48.9% ¥158,209 49.2%
SG&A expenses 149,207 41.7 131,512 40.9
Promotional expenses 87,209 24.3 74,781 23.2
Advertising expenses 12,423 3.5 12,328 3.8
Distribution expenses 20,305 5.7 17,418 5.4
Other expenses 29,270 8.2 26,985 8.5

31
ment of fixed assets, a ¥1,944 million decrease in loss on valuation of
marketable securities and investments in securities and others, a
¥3,390 million decrease in decrease in accrued retirement benefits to
employees and trade notes and accounts receivable-which moved
from a decrease of ¥2,052 million to an increase of ¥1,746 million
(US$15 million) in the year under review.
Net cash used in investing activities decreased by ¥15,297 million
year on year, from ¥20,068 million to ¥4,771 million (US$40 million).
This decrease was mainly due to sales of securities and decreased
purchases of securities in order to secure financing for a takeover bid
for shares of MYOJO FOODS. As a result of the takeover bid, ¥23,763
million (US$201 million) was recorded as payment for purchases of
additional shares of consolidated subsidiaries and others. On the
other hand, proceeds from sales and redemption of marketable secu-
rities increased by ¥31,355 million and payment for purchases of mar-
ketable securities decreased by ¥26,073 million.
Other major in-flow factors included a ¥18,688 million decrease in
payment for purchases of investments in securities, and an additional
major out-flow factor was a ¥37,780 million decrease in proceeds
from sales and redemption of investments in securities.
Net cash used in financing activities dropped by ¥5,519 million
year on year from ¥12,940 million to ¥7,421 million (US$63 million).
This large decrease was mainly due to repurchase of treasury stocks,
which amounted to ¥205 million (US$2 million) in net proceeds in the
year under review, compared with a ¥6,925 million net payment in the
previous fiscal year.
Assets, Liabilities and Net Assets
Total assets as of March 31, 2007 amounted to ¥410,407 million
(US$3,477 million), a 11.9% rise from ¥366,801 million in the previous
fiscal year. Return on assets (ROA) also rose by 0.7 percentage point
to 4.9% from 4.2% in the previous fiscal year, reflecting the fact that
net income grew faster than total assets.
Total current assets declined moderately by 0.6% from ¥160,496
million in the previous year to ¥159,540 million (US$1,351 million).
Mainly due to the acquisition of MYOJO FOODS, both cash and
deposits and the trade account increased by ¥16,573 million and
¥15,703 million, respectively. However, marketable securities
decreased by ¥35,377 million as the company sold off holdings in
order to secure financing for the purchase of MYOJO FOODS shares.
Net property, plant and equipment jumped from ¥69,019 million
to ¥93,634 million (US$793 million), a 35.7% year-on-year increase
that was mainly due to acquisition of MYOJO FOODS.
Investments and other assets increased by 11.2% from ¥136,841
million in the previous fiscal year to ¥152,210 million (US$1,289
million). This increase was caused mainly by a ¥16,649 million
increase in investments in securities. Intangible fixed assets increased
to ¥5,023 million (US$43 million), mainly due to ¥4,352 million (US$37
million) in goodwill.
Total liabilities recorded a sizable increase of 25.6% year on year,
from ¥97,067 million to ¥121,931 million (US$1,033 million). Among
’03
’04
’05
’06
’07
70.4
71.1
71.5
71.8
68.7
EQUITY RATIO(%)
’03
’04
’05
’06
’07
1,892.89
1,980.14
2,091.16
2,167.81
2,304.40
NET ASSETS PER SHARE(Yen)
Cash Flow Highlights
Millions of yen
Year ended March 31 2007 2006 2005
Net cash provided by operating activities ¥26,974 ¥26,636 ¥30,259
Net cash used in investing activities (4,771) (20,068) (30,348)Net cash used in financing activities (7,421) (12,940) (5,709)Cash and cash equivalents at end of the year ¥76,695 ¥61,570 ¥66,326

32
Significant Business Agreements
(1) With regard to the Company’s capital participation in Hebei
Hualong F&N Industry Group Co., Ltd., a major manufacturer of
instant noodles and flour in the PRC (hereafter “Hebei Hualong”),
which was undertaken to expand and thereby reinforce the
Company’s instant noodle operations in the PRC, the Company con-
cluded on May 12, 2004, a joint-venture agreement with Hebei
Jinmailang Mianye Co., Ltd., the parent company of Hebei Hualong.
Hebei Jinmailang Mianye split Hebei Hualong into two new com-
panies-Nissin Hualong Foods Co., Ltd. (now renamed Jinmailang Foods
Co., Ltd.), and Hebei Nissin Hualong Paper Products Co., Ltd. (now
renamed Hebei Jinmailang Paper Products Co., Ltd.) Through capital
increases subscribed by its Hong Kong-based subsidiary, Nissin Foods
Co., Ltd., the Company had acquired 14.9% of registered equity in each
newly established company as of March 31, 2005.
The Company plans to eventually acquire an equity stake equiva-
lent to 33.4% of registered equity in each company. The investment is
expected to reach about ¥20 billion.
(2) On November 15, 2006, the board of directors of the Company
resolved to make a takeover bid for the shares of MYOJO FOODS
and to form a capital and business alliance with MYOJO FOODS.
In accordance with this resolution, the Company signed on the
same day a memorandum, which provides the said takeover bid
and alliance.
On February 6, 2007, the board of directors of the Company
resolved to acquire the shares of MYOJO FOODS by way of share
exchange to make MYOJO FOODS a wholly owned subsidiary of the
Company. In accordance with this resolution, the Company concluded
the share exchange contract.
Details of the takeover bid and the share exchange are described
in Note 21 (Business Combination and Other) of the consolidated
financial statements.
Risk Information
Conditions that have the potential to significantly influence the deci-
sions of investors are presented below. Any conditions with reference
to the future are based on information available at the time of publica-
tion. The Company acknowledges the possibility that these risks can
arise and will make every effort to prevent such risks from appearing
and will address resulting situations if such risks do appear.
(1) Food Safety Issues
The Company’s basic philosophy is to provide safe foods that con-
sumers can enjoy without worry. In recent years, a high incidence of
disquieting developments, such as bovine spongiform encephalopa-
thy, the problem of residual pesticides in foods and avian influenza,
have threatened to undermine food safety. The needs of consumers in
regard to food safety have become more sophisticated. To enhance
its ability to meet this need, the Company established the Food Safety
Research Institute and continues to strengthen its quality control sys-
tem. However, the Company’s financial position and fiscal perform-
ance could be unfavorably influenced if unusual health-related situa-
tions arise in the future that are beyond the Company’s conjecture, or
if rumors mar the image of the Company’s products, even though
such rumors were based on incidents not directly affecting the
Company’s products.
(2) Reduced Brand Value
The Company’s mainstay products, particularly Chicken Ramen and
the Cup Noodle series, have become household items to most con-
sumers, thanks to years of accumulated technical expertise and prod-
uct development activities. The Company emphasizes the establish-
ment and protection of its brands. However, new products flood the
instant noodle market every year, and the relative brand value of the
Company’s products could decline if another company were to
achieve a revolutionary breakthrough in instant noodle development.
liabilities, total current liabilities increased by 22.7% to ¥95,837 million
(US$812 million), mainly due to acquisition of MYOJO FOODS, which
brought a ¥8,658 million increase in the trade account and a ¥ 8,602
million increase in other payables. As a result of the increase in total
current liabilities exceeding the increase in current assets, working
capital declined by 22.7% to ¥63,703 million (US$540 million) from
¥82,404 million in the previous fiscal year. The current ratio, as well,
dropped from 205.5% to 166.5%.
Total net assets amounted to ¥288,476 million (US$2,444 million).
This amount now includes minority interests (a separate item in the
consolidated balance sheet in the previous year) in accordance with
“Accounting Standard for Presentation of Net Assets in the Balance
Sheet,” which was newly adopted from fiscal 2007. Therefore, the
amount for fiscal 2007 corresponding to the previous year’s total
shareholders’ equity of ¥263,199 million, was ¥281,751 million, an
increase of 7.0% year on year. This increase was mainly contributed
by a ¥12,756 million increase in retained earnings due to posting of
net income.
As a result of the increase in total net assets (less minority
interests), net assets par share increased by 6.3% from ¥2,167.81 in the
previous year to ¥2,304.40. Return on equity (ROE) rose by 1.1 percent-
age points from 5.9% to 7.0%, reflecting a large increase in net income.
A D D I T I O N A L I N F O R M AT I O N

33
(3) Risk of Product Liability
As a food maker, the Company believes its mission is to provide safe,
worry-free products to consumers and therefore applies strict quality con-
trol standards to its manufacturing activities. In addition, the Food Safety
Research Institute studies ways to ensure the safety of raw materials and
strives to reinforce quality control systems at each manufacturing facility.
The Company also endeavors to lessen the potential of product liability
claims to affect its financial position, and therefore is insured against prod-
uct liability. However, if an accident occurs through product liability and a
situation arises wherein the Company must recall certain products, the
insurance carried by the Company may not be sufficient to cover all claims.
A tarnished reputation in society and a weakened corporate image could
erode consumers’ willingness to buy the Company’s products. This situa-
tion could hurt the Company’s financial position and its fiscal performance.
(4) Increases in Prices of Raw Materials
The primary raw materials used for the Company’s products are agricultur-
al commodities, such as flour and palm oil, and petroleum-based items for
packaging and wrappers. The Company’s fiscal performance could be
adversely impacted if political unrest or international disputes occur in the
countries that produce these raw materials, or if the price of raw materials
skyrockets because of crop failures caused by abnormal weather and
other reasons.
(5) Risk of Natural Disasters
The Company has manufacturing facilities both in Japan and overseas. If a
natural disaster, such as a large-scale earthquake or flooding from a
typhoon, were to occur and manufacturing facilities incurred damage, the
Company’s production structure as well as its financial position and fiscal
performance could suffer because, for example, an interruption in opera-
tions would reduce output and repairs to facilities and equipment would
raise expenses.
(6) Subsidiary and Affiliate Risks
The Company’s overseas operations comprise local production and local
marketing companies, which produce food products including instant noo-
dles, and are run by subsidiaries and affiliates. If political unrest or interna-
tional disputes arise in the regions where the Company’s subsidiaries and
affiliates operate, or if issues threaten to undermine food safety, or if legal
controls in certain countries create a situation that hinders production
activities, then the financial position and fiscal performance of the
Company could suffer.
(7) Risk Related to Information Systems
The Company uses computers to process and store information on pro-
duction, sales and administration. The Company adopted all possible
measures to safeguard these information systems from computer virus-
induced crashes, damage by hackers, and the risk of a breach in informa-
tion security. However, the Company’s financial position and fiscal per-
formance could be adversely affected if the Company’s systems were
damaged and/or if data were leaked outside the organization, due to ille-
gal access to the systems by unauthorized individuals through technolo-
gies that the Company has not envisioned, or unknown computer virus
getting through established safeguards.
(8) Risk Related to Retirement Benefits Accounting
Costs and obligations pertaining to retirement benefits are determined
based on discount rates and other predetermined criteria used in actuarial
calculations, and expected rate of return on pension assets. If actual
results differ from predetermined criteria, or if predetermined criteria are
amended, the actuarial difference is charged to the income of the fiscal
year following the one in which the difference occurred. Although the
actual return on pension assets has shown its trend of recovery, if a
decline in discount rates and/or returns on the pension assets persists, the
Company will have to carry a higher burden of pension-related costs, and
this could hurt the Company’s financial position and its fiscal performance.
(9) Risk of Declining Market Values on Marketable Securities
The Company invests in marketable securities to ensure efficient applica-
tion of funds and thereby maintain the integrity of principal. However, the
Company’s financial position and fiscal performance could be adversely
affected if worsening market conditions cause market values to decline or
sluggish performances by equity investments force the Company to apply
the accounting for impairment.
(10) Risk Related to Accounting for Impairment of Fixed Assets
The Company owns various tangible fixed assets for the purpose of its
businesses. These fixed assets could face in the future a substantial
decline in their fair value and/or the future cash flows they were to gener-
ate, and thus would have the possibility of impairment loss recognition in
conformity with accounting for impairment of fixed assets. Such circum-
stances could negatively affect the Company’s financial position and its fis-
cal performance.
(11) Reliance on Certain Business Clients
Mitsubishi Corporation and ITOCHU Corporation are the primary buyers of
the Company’s products. Reliance on these specific business clients con-
centrates transactions among highly creditworthy companies and thereby
reduces the effort expended on credit control and minimizes credit risk.
However, the Company’s own financial position could be negatively affect-
ed if the business activities of these sales agents failed, because the
Company would have difficulty collecting accounts receivable.

34
N i s s i n F o o d P r o d u c t s C o . , L t d .
C o n s o l i d a t e d B a l a n c e S h e e t sAs of March 31, 2007 and 2006
ASSETS
Current assets:
Cash and deposits (Notes 4 and 19)
Marketable securities (Note 7)
Receivables:
Trade
Other
Less: Allowance for doubtful receivables
Inventories (Note 8)
Deferred income taxes (Note 12)
Other current assets
Total current assets
Property, plant and equipment:
Land (Note 9)
Buildings and structures
Machinery, equipment and vehicles
Construction in progress
Other
Less: Accumulated depreciation
Property, plant and equipment, net
Intangible fixed assets:
Goodwill
Other
Total intangible fixed assets
Investments and other assets:
Investments in securities (Note 7)
Other investments
Long-term loans
Deferred income taxes (Note 12)
Other assets
Less: Allowance for doubtful receivables
Total investments and other assets
Total assets
¥ 45,116
56,995
37,655
1,356
(259)
12,709
6,390
534
160,496
25,882
65,622
81,705
720
585
174,514
(105,495)
69,019
—
445
445
120,494
10,043
181
275
6,017
(169)
136,841
¥ 366,801
¥ 61,689
21,618
53,358
1,828
(259)
14,489
6,128
689
159,540
43,835
80,097
88,896
1,837
617
215,282
(121,648)
93,634
4,352
671
5,023
137,143
8,507
488
271
5,849
(48)
152,210
¥ 410,407
Thousands ofMillions of yen U.S. dollars (Note 1)
2007 2006 2007
$ 522,567
183,126
451,995
15,485
(2,194)
122,736
51,910
5,836
1,351,461
371,326
678,501
753,037
15,561
5,226
1,823,651
(1,030,479)
793,172
36,866
5,684
42,550
1,161,737
72,063
4,133
2,296
49,547
(407)
1,289,369
$ 3,476,552

35
LIABILITIES AND NET ASSETS
Current liabilities:
Short-term borrowings (Note 10)
Payables:
Trade
Other
Accrued income taxes (Note 12)
Other current liabilities
Total current liabilities
Long-term liabilities:
Deferred income taxes on land revaluation (Note 9)
Accrued retirement benefits to employees (Note 11)
Accrued retirement benefits to directors and statutory auditors
Deferred income taxes (Note 12)
Other long-term liabilities
Total long-term liabilities
Net assets:
Ⅰ Shareholders’ equity (Note 13)
Common stock:
Authorized—500,000,000 shares;Issued—127,463,685 shares at March 31, 2007 and 2006
Capital surplus
Retained earnings (Note 22)
Less: Treasury stock, at cost—5,197,203 shares at March 31, 2007and 6,061,522 shares at March 31, 2006
Ⅱ Valuation, translation adjustments and other:
Net unrealized holding gain on securities (Note 7)
Land revaluation reserve (Note 9)
Translation adjustments
Ⅲ Minority interests
Total net assets
Contingent liability (Note 19)
Total liabilities and net assets
See accompanying notes to consolidated financial statements.
¥ 2,854
34,667
20,107
8,186
12,278
78,092
3,511
11,660
1,800
1,871
133
18,975
25,123
48,385
203,797
(16,679)
9,899
(7,568)
242
6,535
269,734
¥ 366,801
Thousands ofMillions of yen U.S. dollars (Note 1)
2007 2006 2007
$ 32,113
367,006
243,194
66,836
102,685
811,834
29,742
75,781
19,178
89,462
6,879
221,042
212,817
421,465
1,834,418
(121,296)
92,511
(63,812)
10,606
56,967
2,443,676
$ 3,476,552
¥ 3,791
43,325
28,709
7,890
12,122
95,837
3,511
8,946
2,264
10,561
812
26,094
25,123
49,754
216,553
(14,319)
10,921
(7,533)
1,252
6,725
288,476
¥ 410,407

36
Net sales
Cost of sales (Note 14)
Gross profit
Selling, general and administrative expenses (Note 14)
Operating income
Other income (expenses) (Note 15):
Interest and dividend income
Interest expense
Equity in earnings of affiliates
Loss on impairment of fixed assets (Notes 3 and 15(a))
Loss on devaluation of investments in securities
Loss on revaluation of investments (Note 15(b))
Provision for accrued retirement benefits to directorsand statutory auditors (Note 15(c))
Gain on sales of marketable securities
Gain on sales of investments in securities
Other, net
Income before income taxes and minority interests
Income taxes (Note 12):
Current
Deferred
Income before minority interests
Minority interests in earnings (loss) of consolidated subsidiaries
Net income
See accompanying notes to consolidated financial statements.
¥ 321,700
158,209
163,491
131,512
31,979
3,065
(41)
485
(5,632)
(425)
(2,557)
—
3,073
194
(329)
29,812
11,569
2,900
14,469
15,343
(46)
¥ 15,389
¥ 358,238
175,296
182,942
149,207
33,735
3,112
(48)
476
(1,129)
(8)
(1,379)
—
104
573
(1,858)
33,578
11,018
3,529
14,547
19,031
62
¥ 18,969
¥ 316,973
156,877
160,096
131,133
28,963
2,538
(44)
427
—
(112)
—
(3,569)
375
—
(1,506)
27,072
11,629
(1,385)
10,244
16,828
216
¥ 16,612
$ 3,034,629
1,484,930
1,549,699
1,263,930
285,769
26,362
(407)
4,032
(9,564)
(68)
(11,681)
—
881
4,854
(15,739)
284,439
93,334
29,894
123,228
161,211
525
$ 160,686
N i s s i n F o o d P r o d u c t s C o . , L t d .
C o n s o l i d a t e d S t a t e m e n t s o f I n c o m eFor the years ended March 31, 2007, 2006 and 2005
Thousands ofMillions of yen U.S. dollars (Note 1)
2007 2006 2005 2007

37
Thousands ofMillions of yen U.S. dollars (Note 1)
2007 2006 2005 2007
Common stock:Balance at beginning and end of the year
Capital surplus:Balance at beginning of the year
Add:
Merger reserve
Balance at end of the year
Retained earnings:Balance at beginning of the year
Add:
Net income
Reversal of land revaluation reserve due to adjustment to deferred tax assets
Other
Deduct:
Cash dividends paid
Bonuses to directors
Other
Balance at end of the year
Treasury stock, at cost:Balance at beginning of the year
Net change during the year
Balance at end of the year
Net unrealized holding gain on securities:Balance at beginning of the year
Net change during the year
Balance at end of the year
Land revaluation reserve (Note 9):Balance at beginning of the year
Net change during the year
Balance at end of the year
Translation adjustments:Balance at beginning of the year
Net change during the year
Balance at end of the year
Minority interests:Balance at beginning of the year
Net change during the year
Balance at end of the year
Total net assets
See accompanying notes to consolidated financial statements.
¥ 25,123
¥ 48,370
—¥ 48,370
¥ 180,877
16,612
167—
(3,702)(27)—
¥ 193,927
¥ (9,747)(7)
¥ (9,754)
¥ 4,6311,483
¥ 6,114
¥ (2,192)(167)
¥ (2,359)
¥ (2,623)(659)
¥ (3,282)
¥ 6,680(56)
¥ 6,736
¥ 264,875
$ 212,817
$ 409,869
11,596421,465
$ 1,726,362
160,686
—745
(51,427)(186)
(1,762)$ 1,834,418
$ (141,288)19,992
$ (121,296)
$ 83,8548,657
$ 92,511
$ (64,108)296
$ (63,812)
$ 2,050 8,556
$ 10,606
$ 55,3581,609
$ 56,967
$ 2,443,676
¥ 25,123
¥ 48,370
15¥ 48,385
¥ 193,927
15,389
61—
(5,553)(27)—
¥ 203,797
¥ (9,754)(6,925)
¥ (16,679)
¥ 6,1143,785
¥ 9,899
¥ (2,359)(5,209)
¥ (7,568)
¥ (3,282)3,524
¥ 242
¥ 6,736(201)
¥ 6,535
¥ 269,734
N i s s i n F o o d P r o d u c t s C o . , L t d .
C o n s o l i d a t e d S t a t e m e n t s o f C h a n g e s i n N e t A s s e t sFor the years ended March 31, 2007, 2006 and 2005
¥ 25,123
¥ 48,385
1,369 ¥ 49,754
¥ 203,797
18,969
—88
(6,071)(22)
(208)¥ 216,553
¥ (16,679)2,360
¥ (14,319)
¥ 9,899 1,022
¥ 10,921
¥ (7,568)35
¥ (7,533)
¥ 242 1,010
¥ 1,252
¥ 6,535190
¥ 6,725
¥ 288,476

38
Thousands ofMillions of yen U.S. dollars (Note 1)
2007 2006 2005 2007
Cash flows from operating activities:Income before income taxes and minority interestsDepreciation and amortizationLoss on impairment of fixed assets(Decrease) increase in allowance for doubtful receivables(Decrease) in accrued retirement benefits to employeesIncrease (decrease) in accrued retirement benefits
to directors and statutory auditorsInterest and dividend incomeInterest expenseForeign currency exchange (gain) lossEquity in earnings of affiliatesLoss on disposal and sales of property, plant and equipmentGain on sales of marketable securities and
investments in securities and otherLoss on valuation of marketable securities and
investments in securities and other(Increase) decrease in trade notes and accounts receivable(Increase) decrease in inventories(Decrease) increase in trade notes and accounts payableIncrease in other payables(Decrease) increase in accrued consumption taxesBonuses to directorsOther, net
SubtotalInterest and dividends receivedInterest paidCollection of receivables written-offIncome taxes paid
Net cash provided by operating activities
Cash flows from investing activities:Decrease (increase) in time depositsPayments for purchases of marketable securitiesProceeds from sales and redemption of marketable securitiesPayments for purchases of property, plant and equipment and otherProceeds from sales of property, plant and equipment and otherPayments for purchases of investments in securitiesProceeds from sales and redemption of investments in securitiesPayments for purchases of additional shares of
consolidated subsidiaries and others(Increase) decrease in loans receivable
Net cash used in investing activities
Cash flows from financing activities:Proceeds from short-term borrowingsRepayment of short-term borrowingsProceeds from issuance of long-term debtRepayment of long-term debtNet decrease (increase) in treasury stocksCash dividends paidCash dividends paid to minority shareholders
Net cash used in financing activitiesEffect of exchange rate changes on cash and cash equivalentsNet increase (decrease) in cash and cash equivalentsCash and cash equivalents at beginning of the yearIncrease in cash and cash equivalents arising from
initial consolidation of subsidiariesIncrease in cash and cash equivalents resulting from merger
of a consolidated subsidiary with an unconsolidated subsidiaryCash and cash equivalents at end of the year (Note 4)
See accompanying notes to consolidated financial statements.
¥ 27,0726,675
—122
(644)
3,877(2,538)
441
(427)238
(349)
1,192560
(502)(497)
—(424)
(27)704
35,0772,683
(44)1
(7,458)30,259
(1,646)(1,000)3,790
(3,062)1,502
(38,006)8,308
(265)31
(30,348)
—(2,071)
87—(9)
(3,702)(14)
(5,709)(16)
(5,814)72,140
—
—¥ 66,326
$ 284,439 52,418
9,564 (1,474)
(46,878)
3,930 (26,362)
407 (712)
(4,032)3,032
(2,702)
15,646 (14,790)
(1,889)(330)
16,781(1,550)
(186)11,622
296,934 26,853
(373)—
(94,918)228,496
6,252 (42,279)371,097 (46,921)
136 (229,954)103,795
(201,296)(1,245)
(40,415)
3,676 (8,386)
—(2,592)1,737
(51,419)(5,879)
(62,863)771
125,989 521,559
2,134
—$ 649,682
¥ 29,8125,9775,632
(93)(2,144)
(3,718)(3,065)
41(103)(485)280
(3,079)
3,7912,052
322233
—156(27)
(644)34,9382,740
(41)—
(11,001)26,636
(2,615)(31,064)12,453(3,125)
50(45,834)50,033
—34
(20,068)
839(1,204)
—(84)
(6,925)(5,553)
(13)(12,940)
1,500(4,872)66,326
110
6¥ 61,570
¥ 33,578 6,188 1,129 (174)
(5,534)
464 (3,112)
48 (84)
(476)358
(319)
1,847 (1,746)
(223)(39)
1,981(183)
(22)1,372
35,053 3,170
(44)—
(11,205)26,974
738 (4,991)43,808 (5,539)
16 (27,146)12,253
(23,763)(147)
(4,771)
434 (990)
—(306)205
(6,070)(694)
(7,421)91
14,873 61,570
252
—¥ 76,695
N i s s i n F o o d P r o d u c t s C o . , L t d .
C o n s o l i d a t e d S t a t e m e n t s o f C a s h F l o w sFor the years ended March 31, 2007, 2006 and 2005

39
The accompanying consolidated financial statements of Nissin Food
Products Co., Ltd. (the “Company”) and consolidated subsidiaries (col-
lectively, the “Group”) are prepared on the basis of accounting princi-
ples generally accepted in Japan, which are different in certain respects
as to the application and disclosure requirements of International
Financial Reporting Standards, and are compiled from the consolidated
financial statements prepared by the Company as required by the
Securities and Exchange Law of Japan.
The translation of yen amounts into U.S. dollars is included
solely for the convenience of readers outside Japan and has been
made at ¥118.05 = U.S.$1.00, the exchange rate prevailing on
March 31, 2007. This translation should not be construed as a rep-
resentation that yen can be converted into U.S. dollars at the above
or any other rate.
Certain amounts in the consolidated balance sheet as of March
31, 2006 have been reclassified to conform to the 2007 presentation.
These reclassifications had no effect on consolidated net income.
(a) Principles of consolidation and accounting for investments in
unconsolidated subsidiaries and affiliates
The accompanying consolidated financial statements include the
accounts of the Company and the significant companies which it
controls directly or indirectly. Companies over which the Company
exercises significant influence in terms of their operating and finan-
cial policies have been included in the consolidated financial state-
ments on an equity basis. The assets and liabilities of the newly con-
solidated subsidiaries are stated at fair value as of their respective
dates of acquisition.
The balance sheet date of overseas subsidiaries is December 31.
Any significant differences in intercompany accounts and transactions
arising from intervening intercompany transactions during the period
from January 1 through March 31 have been adjusted, if necessary.
The fiscal years of MYOJO FOODS CO., LTD. and eight other
subsidiaries end on September 30. For these subsidiaries, the pro-
forma financial statements prepared as of March 31 are used in
preparation of the consolidated financial statements.
The differences between the cost and the underlying net equity in
the net assets at the dates of acquisition of the consolidated sub-
sidiaries and companies accounted for by the equity method have
been amortized by the straight-line method over periods not exceed-
ing 20 years. Minor differences have been charged to and credited to
income as incurred.
The number of consolidated subsidiaries and affiliates accounted
for by the equity method for the years ended March 31, 2007, 2006
and 2005 are as follows:
2007 2006 2005
Consolidated subsidiaries 33 23 22
Affiliates accounted for by the
equity method 2 1 1
(b) Cash and cash equivalents
For the purposes of the consolidated statements of cash flows, cash
and cash equivalents comprise cash on hand, deposits held at call
with banks and all highly liquid investments with insignificant risk of
changes in value and with maturities of three months or less.
(c) Securities
The accounting standard for financial instruments requires that securities
be classified into three categories: trading, held-to-maturity or other
securities. Trading securities are carried at fair value and held-to-maturity
debt securities are carried at amortized cost. Marketable securities classi-
fied as other securities are carried at fair value with any changes in unre-
alized holding gain or loss, net of the applicable income taxes, included
directly in net assets. Cost of securities sold is determined by the moving
average method. Non-marketable securities classified as other securities
are carried at cost based on the moving average method.
(d) Inventories
Finished goods and merchandise are principally stated at cost by the
periodic average method. Raw materials and supplies are principally
stated at cost by the last purchase price method.
(e) Hedging activities
Receivables and payables hedged by forward foreign exchange con-
tracts which meet certain conditions are translated at the correspon-
ding foreign exchange contract rates.
(f) Property, plant and equipment
Depreciation is computed principally by the declining-balance method
over the useful lives of the respective assets in conformity with the
Corporation Tax Law of Japan. Certain consolidated subsidiaries apply
the straight-line method. The straight-line method is also applied to
the head office building of the Company (Osaka) and the buildings
and structures of the Central Research Institute. In addition, the
straight-line method is applied to buildings (except for the attach-
ments to the buildings) acquired on or after April 1, 1998.
N i s s i n F o o d P r o d u c t s C o . , L t d . a n d i t s C o n s o l i d a t e d S u b s i d i a r i e s
N o t e s t o C o n s o l i d a t e d F i n a n c i a l S t a t e m e n t s
1 . B a s i s o f P r e p a r a t i o n
2 . S u m m a r y o f S i g n i f i c a n t A c c o u n t i n g P o l i c i e s

40
(g) Impairment of fixed assets
Effective the year ended March 31, 2006, the Group adopted an
accounting standard for the impairment of fixed assets that requires
that tangible and intangible fixed assets be carried at cost less depre-
ciation and be reviewed for impairment whenever events or changes
in circumstances indicate that the carrying amount of an asset may
not be recoverable. The Group is required to recognize an impairment
loss in its statement of income if certain indicators of asset impairment
exist and if the book value of an asset exceeds the undiscounted sum
of its future cash flows. The standard states that impairment losses are
to be measured as the excess of the book value over the higher of (1)
the fair market value of the asset, net of disposition costs, or (2) the
present value of future cash flows arising from ongoing utilization of
the asset and from its disposal after use. The standard covers land,
factories, buildings and other forms of property, plant and equipment
as well as intangible assets. The future cash flows have been dis-
counted by 3%. Fixed assets are to be grouped at the lowest levels for
which there are identifiable cash flows that are independent of the
cash flows from other groups of assets.
As a result of the adoption of this accounting standard loss on
impairment of fixed assets in the amount of ¥1,129 million (US$9,564
thousand) for the year ended March 31, 2007 and ¥5,632 million for the
year ended March 31, 2006 was recognized. Income before income taxes
and minority interests was also decreased by the same amount from the
amount that would have been recorded under the previous method.
(h) Intangible assets
Intangible assets are amortized by the straight-line method. Purchased
software is amortized by the straight-line method over a five-year peri-
od, the estimated useful life used by the Group.
(i) Accrued retirement benefits to employees
Accrued retirement benefits to employees have been provided princi-
pally at an amount calculated based on the retirement benefit obligation
and the fair value of the pension plan assets, as adjusted for net unrec-
ognized actuarial gain or loss and unrecognized prior service cost. The
estimated benefit is attributed to each period by the straight-line
method over the estimated years of service of the eligible employees.
Net unrecognized actuarial gain or loss is charged or credited
to income in the year following the year in which the gain or loss
was incurred.
Effective Apri l 1, 2005, the Company adopted “Partial
Amendments to the Accounting Standard for Retirement Benefits”
(Financial Accounting Standard No. 3 of March 16, 2005) and
“Application Guidelines for Partial Amendment to Accounting
Standard for Retirement Benefits” (Application Guidelines for Financial
Accounting Standard No. 7 of March 16, 2005). The effects of the
adoption of these standards on operating income and income before
income taxes and minority interests for the years ended March 31,
2007 and 2006 were not material.
(j) Accrued retirement benefits to directors and statutory auditors
Subject to approval at a shareholders’ meeting, directors and statutory
auditors of the Company were entitled to lump-sum payments under
unfunded retirement benefit plans. The provision for retirement bene-
fits for directors and statutory auditors has been made at an estimated
amount based on the Company’s internal rules.
(k) Allowance for doubtful receivables
The allowance for doubtful receivables is calculated based on the his-
torical experience with bad debts and an estimate of certain uncol-
lectible amounts determined after an analysis of specific individual
doubtful receivables.
(l) Income taxes
Deferred income taxes are provided for temporary differences
between the balances of assets and liabilities reported for financial
reporting purposes and the corresponding balances for tax reporting
purposes.
(m) Amortization of goodwill and negative goodwill
Goodwill and negative goodwill are amortized by the straight-line
method over a certain period reasonably determined for each invest-
ment on a case-by-case basis, but no longer than 20 years, or charged
to income as incurred if the amount is deemed to be immaterial.
(n) Leases
Finance leases other than those which transfer the ownership of the
leased property to the lessee are accounted for as operating leases.
(o) Appropriation of retained earnings
Under the Corporation Law of Japan, the appropriation of retained
earnings with respect to a given financial period is made by resolution
of the shareholders at a general meeting held subsequent to the close
of the financial period. The accounts for that period, therefore, do not
reflect such appropriations.
3 . C h a n g e s i n M e t h o d o f A c c o u n t i n g
(a) Accounting standard for presentation of net assets in the bal-
ance sheet
Effective the year ended March 31, 2007, “Accounting Standard
for Presentation of Net Assets in the Balance Sheet” and
“Guidance on Accounting Standard for Presentation of Net
Assets in the Balance Sheet” have been adopted. The amount
corresponding to total shareholders’ equity at March 31, 2007
under the previous method of presentation is ¥281,751 million
(US$2,836,709 thousand). In addition, effective the year ended
March 31, 2007, the Company has been required to prepare con-

41
solidated statements of changes in net assets. In this connection,
the previously reported consolidated balance sheet as of March
31, 2006 and consolidated statements of shareholders’ equity for
the years ended March 31, 2006 and 2005 have been restated to
conform to the presentation and disclosure of the consolidated
financial statements for the year ended March 31, 2007.
Through March 31, 2006, the Company voluntarily prepared
the consolidated statements of shareholders' equity for the con-
venience of readers outside Japan.
(b) Accounting standards for business combinations and business divestitures
Effective the year ended March 31, 2007, “Accounting Standard
for Business Combinations,” “Accounting Standard for Business
Divestitures,” and “Guidance on Accounting Standard for Business
Combinations and Accounting Standard for Business Divestitures”
have been adopted.
(c) Since “Deferred income taxes,” which had been included in
“Other long-term liabilities” until the year ended March 31, 2006,
exceeded 1/100 of total liabilities and net assets, it has been
shown as a separate component of “Long-term liabilities” effec-
tive the year ended March 31, 2007. “Deferred income taxes”
included in “Other long-term liabilities” at March 31, 2006
amounted to ¥1,871 million.
(d) Since “Goodwill,” which had been included in “Intangible fixed
assets” until the year ended March 31, 2006, exceeded 1/100 of
total assets, it has been shown as a separate component of
“Intangible fixed assets” effective the fiscal year ended March 31,
2007. “Goodwill” included in “Intangible fixed assets” at March
31, 2006 amounted to ¥142 million.
4 . C a s h a n d C a s h E q u i v a l e n t s
A reconciliation of cash and deposits in the consolidated balance sheets and cash and cash equivalents in the consolidated statements of cash
flows at March 31, 2007 and 2006 is as follows:
Thousands of Millions of yen U.S. dollars
2007 2006 2007
Cash and deposits ¥ 61,689 ¥ 45,116 $ 522,567
Time deposits with maturities exceeding three months (3,580) (2,645) (30,326)
Marketable securities redeemable within three months 18,586 19,099 157,441
Cash and cash equivalents ¥ 76,695 ¥ 61,570 $ 649,682
5 . A c q u i s i t i o n s o f N e w l y C o n s o l i d a t e d S u b s i d i a r i e s
During the year ended March 31, 2007, the Company acquired MYOJO FOODS CO., LTD. whose assets and liabilities, cost of shares acquired
and payments for the acquisition of shares are summarized as follows:
MYOJO FOODS CO., LTD.
And its 8 subsidiaries
Thousands of Millions of yen U.S. dollars
Current assets ¥ 26,279 $ 222,609
Fixed assets 33,928 287,404
Goodwill 3,693 31,283
Current liabilities (17,206) (145,752)
Non-current liabilities (9,752) (82,609)
Minority interests (4,256) (36,052)
Cost of acquired shares 32,686 276,883
Cash and cash equivalents (9,428) (79,865)
Payments for acquisition of shares ¥ 23,258 $ 197,018

42
7 . S e c u r i t i e s
(a) Information regarding marketable securities classified as other securities at March 31, 2007 and 2006 is summarized as follows:
Millions of yen Thousands of U.S. dollars
Acquisition Carrying Unrealized Acquisition Carrying UnrealizedMarch 31, 2007 costs value gain (loss) costs value gain (loss)
Securities whose carrying value exceeds their acquisition costs:
I. Equity securities
II. Bonds
National government
Corporate
Other
III. Other
Subtotal
Securities whose carrying value does not exceed their acquisition costs:
I. Equity securities
II. Bonds
National government
Corporate
Other
III. Other
Subtotal
Total
$ 191,020
8
238
212
178
$ 191,656
$ (3,151)
(77)
(7,903)
(34)
—
$ (11,165)
$ 180,491
$ 463,964
3,371
57,697
24,091
8,581
$ 557,704
$ 61,271
100,669
397,247
830
—
$ 560,017
$ 1,117,721
$ 272,944
3,363
57,459
23,879
8,403
$ 366,048
$ 64,422
100,746
405,150
864
—
$ 571,182
$ 937,230
¥ 22,550
1
28
25
21
¥ 22,625
¥ (372)
(9)
(933)
(4)
—
¥ (1,318)
¥ 21,307
¥ 54,771
398
6,811
2,844
1,013
¥ 65,837
¥ 7,233
11,884
46,895
98
—
¥ 66,110
¥ 131,947
¥ 32,221
397
6,783
2,819
992
¥ 43,212
¥ 7,605
11,893
47,828
102
—
¥ 67,428
¥ 110,640
6 . S i g n i f i c a n t N o n - c a s h Tr a n s a c t i o n
Allotment of treasury stock related to a share exchange
Thousands of Millions of yen U.S. dollars
Decrease in treasury stock ¥2,310 $ 19,568
Gain on allotment of treasury stock 1,338 11,334
3,648 30,902
In addition to the above acquisition cost of the shares, costs related to the acquisition of shares incurred amounted to ¥104 million (US$881 thousand).

43
Millions of yen
Acquisition Carrying UnrealizedMarch 31, 2006 costs value gain (loss)
Securities whose carrying value exceeds their acquisition costs:
I. Equity securities
II. Bonds
National government
Corporate
Other
III. Other
Subtotal
Securities whose carrying value does not exceed their acquisition costs:
I. Equity securities
II. Bonds
National government
Corporate
Other
III. Other
Subtotal
Total
¥ 26,550
—
7,602
—
113
¥ 34,265
¥ 9,396
21,077
58,002
102
880
¥ 89,457
¥ 123,722
¥ 45,548
—
7,620
—
130
¥ 53,298
¥ 8,734
21,051
56,361
96
879
¥ 87,121
¥ 140,419
¥ 18,998
—
18
—
17
¥ 19,033
¥ (662)
(26)
(1,641)
(6)
(1)
¥ (2,336)
¥ 16,697
(b) Sales of investments in securities classified as other securities for the years ended March 31, 2007, 2006 and 2005 are summarized as follows:
Thousands ofMillions of yen U.S. dollars
March 31, 2007 2006 2005 2007
Proceeds from sales
Aggregate gain
Aggregate loss
(c) The carrying value of principal non-marketable other securities at March 31, 2007 and 2006 is summarized as follows:
Thousands ofMillions of yen U.S. dollars
March 31, 2007 2006 2007
Other securities
Unlisted equity securities
Beneficial interests in trade receivable trust
Jointly-operated designated money trust
Commercial paper
Preferred equity securities
Other
¥ 26,802
615
39
¥ 43,206
3,267
188
¥ 8,179
375
25
$ 227,039
5,210
330
¥ 3,585
1,000
3,000
3,995
11,000
483
$ 30,368
8,471
25,413
33,842
93,181
4,091
¥ 3,486
6,499
7,000
6,241
11,000
510

44
(d) The redemption schedule for securities with maturity dates classified as other securities as of March 31, 2007 is summarized as follows:
Millions of yen
Due within Due after one year Due after five years Due afterone year through five years through ten years ten years
I. Bonds
National government
Corporate
Other
II. Other
Total
Thousands of U.S. dollars
Due within Due after one year Due after five years Due afterone year through five years through ten years ten years
I. Bonds
National government
Corporate
Other
II. Other
Total
¥ —
10,465
—
—
¥ 10,465
¥ —
11,379
—
—
¥ 11,379
¥ 1,193
29,275
2,942
437
¥ 33,847
¥ 11,090
1,501
—
9,027
¥ 21,618
$ —
88,649
—
—
$ 88,649
$ —
96,391
—
—
$ 96,391
$ 10,106
247,988
24,922
3,701
$ 286,717
$ 93,943
12,715
—
76,468
$ 183,126
8 . I n v e n t o r i e s
Inventories as of March 31, 2007 and 2006 are summarized as follows:
Thousands ofMillions of yen U.S. dollars
2007 2006 2007
Finished goods and merchandise
Raw materials and supplies
Total
$ 71,554
51,182
$ 122,736
¥ 8,447
6,042
¥ 14,489
¥ 7,500
5,209
¥ 12,709
9 . L a n d R e v a l u a t i o n R e s e r v e
Based on the Land Revaluation Law and the Amended Land
Revaluation Law, the Company revalued the land it holds for use in
the course of ongoing operations at March 31, 2002. The resulting
land revaluation difference represents an unrealized devaluation of
land and has been debited directly, net of income taxes, under “Land
revaluation reserve” in net assets. There was no effect on the state-
ment of income. Deferred income taxes on land revaluation were
shown in the accounts up to the year ended March 31, 2005.
Analysis indicated that there was an opportunity to recover these
deferred tax assets in the years ended March 31, 2006 and there
after, and the amount was not therefore liquidated and shown in the
accounts as Land revaluation reserve.
The market value of the land as of March 31, 2007 and 2006
declined by ¥6,922 million (US$58,636 thousand) and ¥6,522 million
respectively compared with the carrying value of the land revalued as
of March 31, 2002.

45
1 0 . S h o r t - t e r m B o r r o w i n g s
Short-term borrowings, which amounted to ¥3,791 mil l ion
(US$32,113 thousand) and ¥2,854 million as of March 31, 2007 and
2006, respectively, generally represent notes payable to banks.
The average interest rates on these borrowings were 1.31% and
0.955% at March 31, 2007 and 2006, respectively.
The assumptions used in accounting for the above plans were a discount rate that was principally 2.5% and an expected rate of return on plan
assets of 2.5% for the years ended March 31, 2007, 2006 and 2005.
$ 13,266
7,734
(6,159)
(39,314)
(24,473)
¥ 1,760
801
(454)
584
2,691
¥ 1,201
841
(540)
(668)
834
¥ 1,566
913
(727)
(4,641)
(2,889)
Thousands ofMillions of yen U.S. dollars
2007 2006 2007
(a) Retirement benefit obligation (Note 2)
(b) Plan assets at fair value
(c) Unfunded retirement benefit obligation (a+b)
(d) Unrecognized actuarial gain
(e) Accrued retirement benefits to employees, net (c+d)
(f) Prepaid pension cost
(g) Accrued retirement benefits for employees (e-f)
Notes: 1. The above amounts include a substitutional portion of the employees’ pension fund.2. Domestic consolidated subsidiaries apply a simplified method to calculate retirement benefit obligation.
The components of retirement benefit costs for the years ended March 31, 2007, 2006 and 2005 were as follows:
Thousands ofMillions of yen U.S. dollars
2007 2006 2005 2007
(a) Service cost (Notes 1 and 2)
(b) Interest cost
(c) Expected return on pension assets
(d) Amortization of actuarial (gain) loss
Total net periodic pension cost
Notes: 1. Employees’ contributions to the welfare pension fund have been excluded.2. Retirement benefit costs of certain domestic consolidated subsidiaries, which have been calculated by a simplified method are included in service cost in the above table.
¥ (42,359)
34,696
(7,663)
(1,016)
(8,679)
267
(8,946)
$ (358,822)
293,909
(64,913)
(8,607)
(73,520)
2,261
(75,781)
¥ (38,481)
31,682
(6,799)
(4,637)
(11,436)
224
(11,660)
1 1 . A c c r u e d R e t i r e m e n t B e n e f i t s t o E m p l o y e e s
The Company and domestic consolidated subsidiaries have defined
benefit plans, i.e., welfare pension fund plans, tax qualified pension
plans and lump-sum payment plans, covering substantially all employ-
ees who are entitled to lump-sum or annuity payments, the amounts
of which are determined by reference to their basic rates of pay,
length of service, and the conditions under which termination occurs.
The Company converted its tax qualified pension plans to welfare
pension fund plans in 1989.
The following table sets forth the funded and accrued status of
the plans and the amounts recognized in the consolidated balance
sheets at March 31, 2007 and 2006 for the Company’s and the con-
solidated subsidiaries’ defined benefit plans:

46
1 2 . I n c o m e Ta x e s
Income taxes applicable to the Company and its domestic subsidiaries
comprise corporate taxes, inhabitants’ taxes and enterprise tax which, in
the aggregate, resulted in a statutory tax rate of 40.33% for the years
ended March 31, 2007 and 2006. Overseas subsidiaries are subject to
the income taxes of the respective countries in which they operate.
The effective tax rates for the years ended March 31, 2007
and 2006 differ from the Company’s statutory tax rate for the fol-
lowing reasons:
2007 2006
Statutory tax rate 40.33% 40.33%
Corporate tax credit (1.10) (1.48)
Equity in earnings of an affiliate (0.57) (0.66)
Loss on revaluation of investments in affiliates — 6.28
Tax loss carryforward recorded by consolidated subsidiaries 4.19 —
Loss on impairment of fixed assets — 5.93
Difference in consolidated subsidiaries’ applicable tax rate 0.12 (1.76)
Other 0.35 (0.11)
Effective tax rates 43.32 48.53
Reconciliation of the statutory tax rate to the effective tax rate for the year ended March 31, 2005, has not been presented, since the difference
was less than five percent of the statutory tax rate. The tax effects of temporary differences which gave rise to significant portions of the deferred
tax assets and liabilities at March 31, 2007 and 2006 are presented below:
Thousands ofMillions of yen U.S. dollars
2007 2006 2007
Deferred tax assets:
Unrealized losses on securities
Accrued retirement benefits to employees
Accounts payable
Loss on impairment of fixed assets
Accrued retirement benefits to directors and statutory auditors
Accrued bonuses
Allowance for doubtful receivables
Depreciation and amortization
Tax loss carryforwards of consolidated subsidiaries
Other
Gross deferred tax assets
Less: valuation allowance
Total deferred tax assets
Deferred tax liabilities:
Deferred capital gain on properties
Unrealized holding gain on securities
Revaluation gain recognized upon consolidation
Other
Total deferred tax liabilities
Net deferred tax (liabilities) assets
$ 61,508
31,622
33,401
12,994
6,989
9,869
—
8,911
65,659
14,723
245,676
(137,035)
108,641
(19,373)
(64,862)
(49,573)
(10,089)
(143,897)
$ (35,256)
¥ 7,261
3,733
3,943
1,534
825
1,165
—
1,052
7,751
1,738
29,002
(16,177)
12,825
(2,287)
(7,657)
(5,852)
(1,191)
(16,987)
¥ (4,162)
¥ 6,084
4,701
3,263
1,208
726
1,134
1,062
627
6,080
1,318
26,203
(12,196)
14,007
(1,984)
(6,746)
—
(483)
(9,213)
¥ 4,794

47
1 3 . S h a r e h o l d e r s ’ E q u i t y
The new Corporation Law of Japan (the “Law”), which superseded
most of the provisions of the Commercial Code of Japan, went into
effect on May 1, 2006. The Law provides that an amount equal to
10% of the amount to be disbursed as distributions of capital surplus
(other than the capital reserve) and retained earnings (other than the
legal reserve) be transferred to the capital reserve and the legal
reserve, respectively, until the sum of the capital reserve and the legal
reserve equals 25% of the capital stock account. Such distributions
can be made at any time by resolution of the shareholders, or by the
Board of Directors if certain conditions are met.
The Company’s legal reserve included in retained earnings at
March 31, 2007 and 2006 amounted to ¥6,280 million (US$53,198
thousand).
Under the Law, upon the issuance and sale of new shares of cap-
ital stock, the entire amount of the proceeds is required to be
accounted for as capital stock, although a company may, by resolution
of the Board of Directors, account for an amount not exceeding one-
half of the proceeds of the sale of new shares as additional paid-in
capital included in capital surplus.
1 4 . R e s e a r c h a n d D e v e l o p m e n t E x p e n s e s
Expenses relating to research and development activities are
charged to income as incurred. Research and development expens-
es included in cost of sales and selling, general and administrative
expenses totaled ¥3,164 million (US$26,802 thousand), ¥2,727 mil-
lion and ¥2,697 million for the years ended March 31, 2007, 2006
and 2005, respectively.
1 5 . O t h e r I n c o m e ( E x p e n s e s )
(a) Loss on impairment of fixed assets
The Group recognized loss on impairment of fixed assets for the year
ended March 31, 2007 as follows:
The Group groups fixed assets by manufacturing unit or usage. The
Group also groups idle fixed assets individually.
Consequently, the Group has written down the carrying value of
operating fixed assets whose profitability declined and idle fixed
assets whose fair value declined values to their respective net recov-
erable value or reminder price and the Group recorded loss on impair-
ment of fixed assets of ¥1,129 million (US$9,564 thousand) in the
consolidated statement of income for the year ended March 31, 2007.
This impairment loss consisted of losses on buildings and structures
of ¥504 million (US$4,269 thousand), machinery, equipment and vehi-
cles of ¥555 million (US$4,702 thousand), tools and fixtures of ¥6 mil-
lion (US$51 thousand), land of ¥43 million (US$364 thousand) and
intangible fixed assets of ¥21 million (US$178 thousand).
Location Usage Asset type
Hanyu City, Saitama Business Buildings, machineryPrefecture assets and equipment
Toride City, Ibaraki Prefecture Buildings, machineryand two other locations
Idle assetsand equipment
MYOJO FOODSERVICE CO., LTD. Business Buildings, machineryand three other companies assets and equipment
Movements in issued common stock and treasury stock for the year ended March 31, 2007 are summarized as follows:
Number of shares
2007
March 31, 2006 Increase Decrease March 31, 2007
Common stock and treasury stock:
Common stock
Treasury stock
127,463,685
51,922
—
8,652
—
9
127,463,685
60,615

48
1 6 . L e a s e s
The following pro-forma amounts represent the acquisition cost, accu-
mulated depreciation and net book value of the property leased to the
Group at March 31, 2007 and 2006, which would have been reflected
in the consolidated balance sheets if finance leases accounted for as
operating leases had been capitalized:
Millions of yen Thousands of U.S. dollars
Acquisition Accumulated Net book Acquisition Accumulated Net book2007 cost depreciation value cost depreciation value
Machinery and vehicles
Equipment
Intangible fixed assets and other
Total
Millions of yen
Acquisition Accumulated Net book2006 cost depreciation value
Machinery
Equipment
Total
Future minimum lease payments subsequent to March 31, 2007 for finance leases accounted for as operating leases are summarized as follows:
Thousands of Year ending March 31, Millions of yen U.S. dollars
2008 ¥ 355 $ 3,007
2009 and thereafter 628 5,320
Total ¥ 983 $ 8,327
Note: The acquisition cost and future minimum lease payments under finance leases presented in the above tables include the imputed interest expense.
Lease payments relating to finance leases accounted for as operating
leases in the accompanying consolidated financial statements
amounted to ¥367 million (US$3,109 thousand), ¥338 million and
¥346 million, which were approximately equal to the depreciation of
the leased assets computed by the straight-line method over the
respective lease terms assuming nil residual value for the years ended
March 31, 2007, 2006 and 2005, respectively.
¥ 1,327
620
102
¥ 2,049
¥ 660
384
22
¥ 1,066
¥ 667
236
80
¥ 983
$ 11,241
5,252
864
$ 17,357
$ 5,591
3,253
186
$ 9,030
$ 5,650
1,999
678
$ 8,327
¥ 1,259
448
¥ 1,707
¥ 662
265
¥ 927
¥ 597
183
¥ 780
The recoverable value of the fixed assets presented in the above
table has been measured primarily at net realizable value based on
appraisals conducted by real estate appraisers for the significant
assets and tax assessment value after reasonable adjustments for
other assets.
(b) Loss on revaluation of investments
Loss on revaluation of investments recognized in the consolidated
statement of income for the year ended March 31, 2007 represented
revaluation losses on investments in Jinmailang Foods Co., Ltd. (previ-
ously Nissin Hualong Foods Co., Ltd.) and Hebei Jinmailang Paper
Products Co., Ltd. (previously Heibai Nissin Hualong Paper Products
Co., Ltd.)
(c) Provision for accrued retirement benefits to directors and statu-
tory auditors
Provision for accrued retirement benefits to directors and statutory
auditors represented an additional provision due to the revision of the
internal rules for retirement benefits to directors, which was made
during the year ended March 31, 2005.

49
2 0 . S e g m e n t I n f o r m a t i o n
The Group classifies its business into two segments principally based
on product types and characteristics: the instant noodle and associat-
ed business and other business. The instant noodle and associated
business includes pillow-type instant noodles, cup-type instant noo-
dles, chilled foods and frozen foods. Other business includes confec-
tionary, beverages and food service business.
The following tables present the business and geographic seg-
ment information and the overseas sales of the Group for the years
ended March 31, 2007, 2006 and 2005:
The amounts per share of net assets have been computed based on
the net assets available for distribution to shareholders of common
stock and the number of shares of common stock outstanding at the
year end. Net income per share has been computed based on the net
income available for distribution to shareholders of common stock and
the weighted-average number of shares of common stock outstand-
ing during the year. Diluted net income per share has not been pre-
sented because there were no potentially dilutive shares at March 31,
2007, 2006 and 2005.
Cash dividends per share represent the cash dividends proposed
by the Board of Directors as applicable to the respective years togeth-
er with the interim cash dividends paid.
1 8 . A m o u n t s p e r S h a r e
Amounts per share at March 31, 2007, 2006 and 2005 and for the years then ended were as follows:
Yen U.S. dollars
2007 2006 2005 2007
Net assets ¥2,304.40 ¥2,167.81 ¥2,091.16 $19.52
Net income
Basic 156.12 125.09 134.36 1.32
Cash dividends applicable to the year 50.00 30.00 30.00 0.42
1 9 . C o n t i n g e n t L i a b i l i t y
In the year ended March 31, 2007, for workers’ compensation of
Camino Real Foods, Inc., which was formerly a consolidated sub-
sidiary, a debt guarantee with a maximum obligation of US$762,900
(¥90 million) has been arranged with a financial institution. Also, a
total of ¥90 million of cash in hand and on deposit was pledged as
collateral for the said workers’ compensation as of March 31, 2007.
The Group utilizes forward foreign exchange contracts to manage risk
arising from adverse fluctuations in foreign currency exchange rates.
The Group does not enter into derivatives contracts for speculative or
short-term trading purposes.
The Group has established policies which were approved at a
management meeting of the Company. In accordance with these poli-
cies, the Financial Division controls and executes the forward foreign
exchange contracts. An evaluation of hedge effectiveness has been
omitted since the significant conditions of the hedging instruments
and hedged items were the same and the risk of changes in cash
flows was completely avoided.
The Group enters into forward foreign exchange contracts with finan-
cial institutions with high credit ratings to reduce the risk of credit loss in
the event of non-performance by the counterparties to the contracts.
Disclosure of fair value information on derivatives has been omit-
ted because all open positions qualified for hedge accounting at
March 31, 2007 and 2006.
1 7 . D e r i v a t i v e F i n a n c i a l I n s t r u m e n t s

50
(a) Information by business segment
Millions of yen
Instant noodle and OtherYear ended March 31, 2007 associated business business Eliminations Consolidated
I. Sales and operating income
Sales to third parties
Intersegment sales
Total
Operating expenses
Operating income
II. Assets, depreciation and amortization, loss on impairment
of fixed assets and capital investment
Assets
Depreciation and amortization
Loss on impairment of fixed assets
Capital investment
Thousands of U.S. dollars
Instant noodle and OtherYear ended March 31, 2007 associated business business Eliminations Consolidated
I. Sales and operating income
Sales to third parties
Intersegment sales
Total
Operating expenses
Operating income
II. Assets, depreciation and amortization, loss on impairment
of fixed assets and capital investment
Assets
Depreciation and amortization
Loss on impairment of fixed assets
Capital investment
¥ 325,468
—
325,468
293,115
¥ 32,353
¥ 375,446
5,338
973
5,051
¥ 32,770
6,091
38,861
36,609
¥ 2,252
¥ 31,824
850
156
1,096
¥ —
(6,091)
(6,091)
(5,221)
¥ (870)
¥ 3,137
—
—
—
¥ 358,238
—
358,238
324,503
¥ 33,735
¥ 410,407
6,188
1,129
6,147
$ 2,757,035
—
2,757,035
2,482,973
$ 274,062
$ 3,180,398
45,218
8,242
42,787
$ 277,594
51,597
329,191
310,114
$ 19,077
$ 269,581
7,200
1,322
9,284
$ —
(51,597)
(51,597)
(44,227)
$ (7,370)
$ 26,573
—
—
—
$ 3,034,629
—
3,034,629
2,748,860
$ 285,769
$ 3,476,552
52,418
9,564
52,071
Millions of yen
Instant noodle and OtherYear ended March 31, 2006 associated business business Eliminations Consolidated
I. Sales and operating income
Sales to third parties
Intersegment sales
Total
Operating expenses
Operating income
II. Assets, depreciation and amortization, loss on impairment
of fixed assets and capital investment
Assets
Depreciation and amortization
Loss on impairment of fixed assets
Capital investment
Note: Business segment information for the year ended March 31, 2005 has not been shown since instant noodle and associated business accounted for more than 90% of consolidated netsales, consolidated operating income and consolidated total assets.
¥ 294,510
7
294,517
264,428
¥ 30,089
¥ 350,864
5,476
760
3,120
¥ 27,190
5,586
32,776
30,886
¥ 1,890
¥ 17,137
501
4,872
397
¥ —
(5,593)
(5,593)
(5,593)
¥ —
¥ (1,200)
—
—
—
¥ 321,700
—
321,700
289,721
¥ 31,979
¥ 366,801
5,977
5,632
3,517

51
Millions of yen
North OtherYear ended March 31, 2006 Japan America areas Eliminations Consolidated
I. Sales and operating income (loss)
Sales to third parties
Intersegment sales
Total
Operating expenses
Operating income (loss)
II. Assets
Millions of yen
North OtherYear ended March 31, 2005 Japan America areas Eliminations Consolidated
I. Sales and operating income (loss)
Sales to third parties
Intersegment sales
Total
Operating expenses
Operating income (loss)
II. Assets
¥ 269,765
1,172
270,937
240,279
¥ 30,658
¥ 344,531
¥ 29,903
—
29,903
30,367
¥ (464)
¥ 16,188
¥ 22,032
394
22,426
20,548
¥ 1,878
¥ 28,794
¥ —
(1,566)
(1,566)
(1,473)
¥ (93)
¥ (22,712)
¥ 321,700
—
321,700
289,721
¥ 31,979
¥ 366,801
¥ 273,936
1,109
275,045
246,629
¥ 28,416
¥ 342,079
¥ 23,911
—
23,911
24,890
¥ (979)
¥ 15,356
¥ 19,126
173
19,299
18,500
¥ 799
¥ 25,754
¥ —
(1,282)
(1,282)
(2,009)
¥ 727
¥ (22,084)
¥ 316,973
—
316,973
288,010
¥ 28,963
¥ 361,105
¥ 303,718
1,277
304,995
270,749
¥ 34,246
¥ 382,317
¥ 30,505
—
30,505
32,770
¥ (2,265)
¥ 16,805
¥ 24,015
656
24,671
22,434
¥ 2,237
¥ 31,499
¥ —
(1,933)
(1,933)
(1,450)
¥ (483)
¥ (20,214)
¥ 358,238
—
358,238
324,503
¥ 33,735
¥ 410,407
(b) Information by geographic area
Millions of yen
North OtherYear ended March 31, 2007 Japan America areas Eliminations Consolidated
I. Sales and operating income (loss)
Sales to third parties
Intersegment sales
Total
Operating expenses
Operating income (loss)
II. Assets
Thousands of U.S. dollars
North OtherYear ended March 31, 2007 Japan America areas Eliminations Consolidated
I. Sales and operating income (loss)
Sales to third parties
Intersegment sales
Total
Operating expenses
Operating income (loss)
II. Assets
$ 2,572,791
10,817
2,583,608
2,293,511
$ 290,097
$ 3,238,602
$ 258,407
—
258,407
277,594
$ (19,187)
$ 142,355
$ 203,431
5,557
208,988
190,038
$ 18,950
$ 266,828
$ —
(16,374)
(16,374)
(12,282)
$ (4,092)
$ (171,233)
$ 3,034,629
—
3,034,629
2,748,860
$ 285,769
$ 3,476,552

52
Thousands ofMillions of yen U.S. dollars
North Other North OtherYear ended March 31, 2007 America areas Total America areas Total
Overseas sales
Consolidated sales
Overseas sales as a percentage of consolidated sales
Millions of yen
North OtherYear ended March 31, 2006 America areas Total
Overseas sales
Consolidated sales
Overseas sales as a percentage of consolidated sales
Millions of yen
North OtherYear ended March 31, 2005 America areas Total
Overseas sales
Consolidated sales
Overseas sales as a percentage of consolidated sales
Notes: 1. Classification of the above countries or regions is based on geographical proximity.2. Principal countries classified in the above regions
North America: U.S.A. and MexicoOther areas: China and Germany
3. Overseas sales represent the sum total of sales to the overseas market outside Japan by the Company and its consolidated subsidiaries.(Sales between consolidated subsidiaries are not included.)
(c) Overseas sales
Overseas sales, which include export sales of the Company and its
domestic subsidiaries and sales (other than exports to Japan) of the
overseas consolidated subsidiaries, for the years ended March 31,
2007, 2006 and 2005 are summarized as follows:
¥ 24,177
—
7.6%
¥ 19,553
—
6.2%
¥ 43,730
316,973
13.8%
¥ 30,226
—
9.4%
¥ 22,471
—
7.0%
¥ 52,697
321,700
16.4%
¥ 30,831
—
8.6%
¥ 25,075
—
7.0%
¥ 55,906
358,238
15.6%
$ 261,169 $ 212,410 $ 473,579
3,034,629
2 1 . B u s i n e s s C o m b i n a t i o n a n d O t h e r
(Application of purchase method and transactions under common control)
1. Summary of business combination
(1) Name of acquired entity....................................................MYOJO FOODS CO., LTD.
(2) Major businesses of the acquired entity.......................Instant noodle business and food service business
(3) Major reasons for business combination
1. To provide maximum support to MYOJO FOODS CO., LTD. so that it is able to maintain and develop its management policy from
medium- and long-term viewpoints.
2. To realize enhancement of corporate values of both the Company and MYOJO FOODS CO., LTD. by creating synergy through the busi-
ness alliance, such as supplying attractive products that meet the needs of a broader range of consumers, including those overseas.
(4) Business combination date .............................................December 22, 2006
(5) Legal form of business combination
Establishment of a wholly-owned subsidiary through a takeover bid for shares and a share exchange
(6) Name of the entity after business combination .........Nissin Food Products Co., Ltd.
(7) Percentage of voting rights acquired.............................100%
2. Period for which the operating results of the acquired entity were included in the consolidated financial statements
From October 1, 2006 to March 31, 2007

53
3. Details of acquisition cost of the acquired entity
(1) Takeover bid for shares
1. Details of acquisition cost
Acquisition cost of shares: ................................................................................. ¥31,985 million (US$270,945 thousand)
Total acquisition cost: .......................................................................................... ¥32,686 million (US$276,883 thousand)
(2) Share exchange
1. Summary of accounting treatment applied
Upon the said share exchange, the Company allotted 838,623 shares of common stock held in treasury on March 31, 2007.
Accordingly, capital surplus increased by ¥1,338 million (US$11,334 thousand).
2. Acquisition cost
¥3,752 million (US$31,783 thousand) (including ¥104 million (US$881 thousand) of direct expenses for the share exchange)
3. Share exchange ratio
0.195 shares of the Company allotted to one share of MYOJO FOODS CO., LTD.
4. Method of calculation
In order to calculate the fair value of shares of the Company and of MYOJO FOODS CO., LTD., the Company adopted several meth-
ods, including the market share price averaging method, which is considered highly objective as a share value calculation method for
listed companies, and the DCF (discounted cash flow) method, which is generally adopted, while referring to the takeover bid price.
MYOJO FOODS CO., LTD. adopted the market share price averaging method and the DCF method. After discussions based on the
results of application of these methods of calculation, as well as referring to the takeover bid price, the Company and MYOJO
FOODS CO., LTD. agreed on the share exchange ratio stated in 3, above.
5. Number of shares issued
838,623 shares
6. Valuation amount
¥4,350 per share (US$36.8) (same as to the closing price on the Tokyo Stock Exchange of the day prior to the day when the share
exchange contract was concluded)
4. Amount of goodwill incurred, causes of goodwill method of amortization and period
(1) Amount of goodwill incurred
Incurred from takeover bid: .................................... ¥3,693 million (US$31,283 thousand)
Incurred from share exchange: ............................. ¥ 286 million (US$ 2,423 thousand)
(2) Causes of goodwill
Goodwill incurred in relation to the future profitability of MYOJO FOODS CO., LTD. expected as a result of its business development.
(3) Amortization method and period
Goodwill is amortized by the straight-line method over 10 years.
5. Amounts and details of assets acquired and liabilities assumed on the business combination date
Assets: ¥60,207 million (US$510,013 thousand) (current assets ¥26,279 million (US$222,609 thousand),
fixed assets ¥33,928 million (US$287,404 thousand))
Liabilities: ¥26,958 million (US$228,361 thousand) (current liabilities ¥17,206 million (US$145,752 thousand),
long-term liabilities ¥9,752 million (US$82,609 thousand))
* Other than the above, ¥4,256 million of minority interests were also acquired on the business combination date.
6. Estimated impact on the consolidated statement of income for the current fiscal year if the business combination was assumed to
have been completed at the beginning of the current fiscal year
Net sales: ..................................... ¥397.2 billion (US$3,365 million)
Operating income:......................... ¥34.7 billion (US$ 294 million)
Net income: ................................... ¥19.2 billion (US$ 163 million)
Net income per share: ....................................... ¥158.23 (US$1.34)*The above estimated amounts, after adjustments for amortization of goodwill and other, are calculated based on the assumption that the takeover bid and the share exchange had beenconducted and that MYOJO FOODS CO., LTD. had become a wholly-owned subsidiary at the beginning of the current fiscal year (April 1, 2006). Note that these four estimates havenot been certified by auditors.

5454
Report of Independent Auditors
The Board of Directors Nissin Food Products Co., Ltd.
We have audited the accompanying consolidated balance sheets of Nissin Food Products Co., Ltd. and consolidated subsidiariesas of March 31, 2007 and 2006, and the related consolidated statements of income, changes in net assets, and cash flows foreach of the three years in the period ended March 31, 2007, all expressed in yen. These financial statements are the responsibilityof the Company’s management. Our responsibility is to express an opinion on these financial statements based on our audits.
We conducted our audits in accordance with auditing standards generally accepted in Japan. Those standards require that weplan and perform the audit to obtain reasonable assurance about whether the financial statements are free of material misstate-ment. An audit includes examining, on a test basis, evidence supporting the amounts and disclosures in the financial statements.An audit also includes assessing the accounting principles used and significant estimates made by management, as well as evalu-ating the overall financial statement presentation. We believe that our audits provide a reasonable basis for our opinion.
In our opinion, the financial statements referred to above present fairly, in all material respects, the consolidated financial position ofNissin Food Products Co., Ltd. and consolidated subsidiaries at March 31, 2007 and 2006, and the consolidated results of theiroperations and their cash flows for each of the three years in the period ended March 31, 2007 in conformity with accounting prin-ciples generally accepted in Japan.
Supplemental Information
As described in Note 2 (g), effective the year ended March 31, 2006, the Company and consolidated subsidiaries adopted anaccounting standard for the impairment of fixed assets.
The U.S. dollar amounts in the accompanying consolidated financial statements with respect to the year ended March 31, 2007 arepresented solely for convenience. Our audit also included the translation of yen amounts into U.S. dollar amounts and, in our opin-ion, such translation has been made on the basis described in Note 1.
June 28, 2007
2 2 . S u b s e q u e n t E v e n t
The following appropriation of retained earnings of the Company, which has not been reflected in the accompanying consolidated financial state-
ments for the year ended March 31, 2007, was approved at a meeting of the shareholders of the Company held on June 28, 2007:
Thousands of Millions of yen U.S. dollars
Cash dividends (¥15 = US$0.13 per share) ¥ 1,834 $ 15,536

55
B u s i n e s s A r e a s o f C o n s o l i d a t e d S u b s i d i a r i e s a n d A f f i l i a t e s
Business Equity Company Capital Area Ownership (%)
Consolidated Subsidiaries
Sapporo Nissin Co., Ltd. ¥250 million Cup- and pillow-type noodle manufacturing and marketing 100.0
Nissin F.D. Foods Co., Ltd. ¥100 million Freeze-dried food manufacturing and marketing 100.0 (20.0)
Nissin Plastics Co., Ltd. ¥450 million Container manufacturing and marketing 100.0
Nissin Frozen Foods Co., Ltd. ¥98 million Frozen food manufacturing and marketing 100.0
Gran Foods Co., Ltd. ¥80 million Frozen food manufacturing and marketing 100.0 (100.0)
Fine Foods Corporation ¥100 million Cup-type noodle topping manufacturing and marketing 100.0 (100.0)
Nissin York Co., Ltd. ¥870 million Beverage and dairy product manufacturing and marketing 72.8
Nissin Enterprise Corporation ¥300 million Shipping and warehousing 100.0
Nissin Cisco Co., Ltd.(2) ¥2,600 million Confectionery manufacturing and marketing 80.0
Uji Kaihatsu Development Co., Ltd. ¥850 million Golf course management 70.7 (5.7)
Ajinihon Co., Ltd.(1) ¥95 million Soup manufacturing and marketing 46.4
MYOJO FOODS CO., LTD.(2) ¥3,143 million Cup- and pillow- type noodle manufacturing and marketing 100.0
MYOJO FOODSERVICE CO., LTD. ¥365 million Food service 74.0 (74.0)
NISHINIHON MYOJO CO., LTD. ¥90 million Cup- and pillow- type noodle manufacturing and marketing 100.0 (100.0)
UNI-STAR CO., LTD. ¥150 million Soup manufacturing and marketing 100.0 (100.0)
MYOJO FRESH CO., LTD. ¥400 million Chilled food manufacturing and marketing 100.0 (100.0)
MYOJO SUPPLY SERVICE. CO., LTD. ¥90 million Contracted manufacturing 100.0 (100.0)
GENBU CO., LTD. ¥10 million Food service 100.0 (100.0)
Nissin Foods (U.S.A.) Co., Inc.(2) US$83,500 thousand Cup- and pillow-type noodle manufacturing and marketing 90.0
Nissin Foods de Mexico S.A. de C.V. MXN 143,731 thousand Cup-type noodle manufacturing and marketing 100.0
Nissin Foods Kft. HUF 1,000,000 thousand Cup- and pillow-type noodle manufacturing and marketing 100.0
Nissin Foods GmbH EUR 25 thousand Cup- and pillow-type noodle marketing 100.0 (99.0)
Nissin Foods Co., Ltd.(2) HK$671,600 thousand Cup- and pillow-type noodle manufacturing and marketing 100.0
Miracle Foods Co., Ltd. HK$21,000 thousand Container manufacturing and marketing 100.0 (100.0)
Guangdong Shunde Nissin Foods Co., Ltd. HK$130,000 thousand Cup- and pillow-type noodle manufacturing and marketing 100.0 (100.0)
Winner Food Products Ltd. HK$29,975 thousand Cup- and pillow-type noodle and frozen food manufacturing 74.0and marketing
Zhuhai Golden Coast Winner Food Products Ltd. HK$84,000 thousand Cup- and pillow-type noodle manufacturing and marketing 70.5 (70.5)
Guangyougnan Food Products (Shenzhen) Co., Ltd. HK$11,000 thousand Frozen food manufacturing and marketing 100.0 (100.0)
Shanghai Nissin Foods Co., Ltd.(2) US$25,000 thousand Cup- and pillow-type noodle manufacturing and marketing 100.0 (100.0)
Nissin Foods (China) Holding Co., Ltd.(2) US$40,500 thousand Invests in businesses in the PRC 100.0 (100.0)
Indo Nissin Foods Ltd. INR 697,500 thousand Cup- and pillow-type noodle manufacturing and marketing 74.8
MYOJO U.S.A., INC. US$5,000 thousand Chilled food manufacturing and marketing 96.0 (96.0)
MYOJO FOODS CO. (S) PTE. LTD. SG$1,000 thousand Cup- and pillow- type noodle manufacturing and marketing 100.0 (100.0)
Affiliates Accounted for by the Equity Method
Nissin-Ajinomoto Alimentos Ltda. BRL 12,688 thousand Cup- and pillow-type noodle manufacturing and marketing 50.0
THAI PRESIDENT FOODS PUBLIC COMPANY LIMITED THB 180,000 thousand Cup- and pillow- type noodle manufacturing and marketing 20.1
Notes: 1. While the equity ownership is less than 50%, Nissin Foods substantially controls the company as a consolidated subsidiary.2. Special subsidiaries3. The figures in ( ) of equity ownership show percentage of indirect ownership.
(As of March 31, 2007)

5656
WORLDWIDE NETWORK
[Americas]
Nissin Foods (U.S.A.) Co., Inc.
(Corporate Office & Gardena Plant)2001 West Rosecrans Avenue, Gardena, CA 90249 U.S.A.
Telephone: 1-323-321-6453 Fax: 1-310-515-3751
(Lancaster Plant)Masako Place 2901, Hempland Road, Lancaster, PA 17601 U.S.A.
Telephone: 1-717-291-5901 Fax: 1-717-291-9737
MYOJO U.S.A., INC.
6220 Prescott Court, Chino, CA 91710 U.S.A.
Telephone: 1-909-464-1411 Fax: 1-909-464-1415
Nissin Foods de Mexico S.A. de C.V.
(Corporate Office & Plant)Av. de las Partidas S/N
Fracc. Industrial Cerrillo ll
lerma, edo. de mexico 52000 Mexico
Telephone: 52-728-282-8950 Fax: 52-728-285-0703
(Sales Office)Georgia 120 Despacho 3A.
Col. Napoles Deleg. Benito Juarez
Mexico D.F., C.P. 03810 Mexico
Telephone: 52-55-5543-2364 Fax: 52-55-5543-8807
Nissin-Ajinomoto Alimentos Ltda.
(Head Office)Rua Alves Guimaraes, 1297
Jardim America CEP 05410-926
Sao Paulo, SP Capital Brazil
Telephone: 55-11-3094-5900 Fax: 55-11-3094-5901
(Ibiuna Plant)Rodovia Bunjiro Nakao, Km 57 - Bairro Votorantim,
Caixa Postal No. 57, Ibiúna - SP - Brazil CEP 18 150-000
Telephone: 55-15-3249-1100 Fax: 55-15-3249-1255
[Asia]
Nissin Foods (HK) Management Co., Ltd.
9-13, Dai Cheong Street, Tai Po Industrial Estate,
Tai Po, N.T. Hong Kong
Telephone: 852-3406-6888 Fax: 852-2666-5173
Nissin Foods Co., Ltd.
(Head Office & Main Plant)21-23, Dai Shing Street, Tai Po Industrial Estate,
Tai Po, N.T. Hong Kong
Telephone: 852-2665-0032 Fax: 852-2664-4189
(Wing On Plant)9-13, Dai Cheong Street, Tai Po Industrial Estate,
Tai Po, N.T. Hong Kong
Telephone: 852-2664-6818 Fax: 852-2664-2201
(Singapore Branch)31 Jurong Port Road #02-11M,
Jurong Logistics Hub, Singapore 619115
Telephone: 65-6-2681309 Fax: 65-6-2682758
MYOJO FOODS CO. (S) PTE. LTD.
16 Chin Bee Road, Jurong Town, Singapore 619826
Telephone: 65-6-2652447 Fax: 65-6-2652753
Winner Food Products Ltd.
(Winner Plant)11-13, Dai Shun Street, Tai Po Industrial Estate,
Tai Po, N.T. Hong Kong
Telephone: 852-2667-3766 Fax: 852-2666-5173
(Wintai Plant)20, Dai Kwai Street, Tai Po Industrial Estate,
Tai Po, N.T. Hong Kong
Telephone: 852-2663-3992 Fax: 852-2664-7559
Miracle Foods Co., Ltd.
19, Dai Shing Street, Tai Po Industrial Estate, Tai Po, N.T. Hong Kong
Telephone: 852-2666-0812 Fax: 852-2666-0600
Nissin Foods (China) Holding Co., Ltd.
10F, Dongying Bld. 2570 Xietu Road, Xuhui District,
Shanghai, 200030 The People’s Republic of China
Telephone: 86-21-6468-7176 Fax: 86-21-6468-3295
Jinmailang Foods Co., Ltd.
(Head Office)Hualong Food Market of Longyao, Hebei,
055350 The People’s Republic of China
Telephone: 86-319-6598866 Fax: 86-319-6591358
(Beijing Office)17F, Blue Castle International Centre, Xi Dawang Road, Chaoyang District,
Beijing, 10026 The People’s Republic of China
Telephone: 86-10-8599-9898 Fax: 86-10-8599-9898
Shanghai Nissin Foods Co., Ltd.
(Head Office & Plant)No. 1, Xinqiao Zhen,
Songjiang District, Shanghai, 201612 The People’s Republic of China
Telephone: 86-21-5764-4070 Fax: 86-21-5764-4073

57
WORLDWIDE NETWORK
FOOD SAFETY EVALUATION & RESEARCH INSTITUTE CO., LTD.
No. 619, ZiRi Road,
Minhang District, Shanghai, 200241 The People’s Republic of China
Telephone: 86-21-6145-0565 Fax: 86-21-6145-0572
(Shanghai Office)11F, Dongying Bldg., 2570 Xietu Road,
Xuhui District, Shanghai, 200030 The People’s Republic of China
Telephone: 86-21-6468-8476 Fax: 86-21-6468-3325
Guangdong Shunde Nissin Foods Co., Ltd.
(Head Office & Plant)13, Gang Qian Road, Beijiao Industrial Park, Beijiao County,
Shunde District, Foshan City, Guangdong Province, 528311
The People’s Republic of China
Telephone: 86-757-2633-0482 Fax: 86-757-2665-2778
(Guangzhou Office)7th Floor, Golden Lake Building, No. 2, Dong Hu Road, West,
Guangzhou, 510100 The People’s Republic of China
Telephone: 86-20-8384-4362 Fax: 86-20-8385-6181
Zhuhai Golden Coast Winner Food Products Ltd.
Golden Coast Food Industry City, Zhuhai,
Guangdong, 519040 The People’s Republic of China
Telephone: 86-756-776-4138 Fax: 86-756-776-4198
Guangyougnan Food Products (Shenzhen) Co., Ltd.
3rd Floor, No. 8, Road 5, Qingshuihe,
Shenzhen, Guangdong Province, The People’s Republic of China
Telephone: 86-755-244-5649 Fax: 86-755-244-5649
Nissin-Universal Robina Corporation
(Head Office)2nd Floor, CFC Administration Building,
E. Rodriguez Jr. Ave., Bagong Ilog, Pasig City, 1600 Philippines
Telephone: 63-2-671-7176 Fax: 63-2-671-3978
(Cavite Plant)Block 7, Lot 8, First Cavite Industrial Estate,
Bo. Langkaan, Dasmariñas Cavite, 4140 Philippines
Telephone: 63-46-402-0662/1241 Fax: 63-46-402-0824
Indo Nissin Foods Ltd.(Head Office)3rd Floor, Centenary Building, 28, M.G. Road, Bangalore 560 001, India
Telephone: 91-80-2532-7900 Fax: 91-80-2559-9087
(Delhi Plant)91 Kms, Delhi-Jaipur Road, Village Deodhai, Tehsil Bawal,
District Rewari-123401 Haryana, India
Telephone: 91-1284-264032 Fax: 91-1284-264032
Accelerated Freeze Drying Co., Ltd.(Head Office)Amalgam House, Bristow Road,
Willingdon Island, Cochin-682 003, Kerala, India
Telephone: 91-484-2668680 Fax: 91-484-2668130
(Cochin Plant)EP/IV/513, Ezhupunna P.O. Alleppey District-688 548, Kerala, India
Telephone: 91-478-2872012 Fax: 91-478-2873016
(Bangalore Plant)Plot No. 18-A1, Jigani Industrial Area, Anekal Taluk,
Bangalore-562 106 Karnataka, India
Telephone: 91-8078-25282 Fax: 91-8078-25283
PT. NISSINMASJl. Jababeka Raya Blok N/1, Cikarang Bekasi, 17530 Indonesia
Telephone: 62-21-893-4130 Fax: 62-21-893-4129
Nissin Foods (Thailand) Co., Ltd.(Head Office & Plant)631 Moo 11, Sukapiban 8, Sriracha Chonburi 20280, Thailand
Telephone: 66-38-481-351 Fax: 66-38-481-353
(Bangkok Office)802 Bangkok Tower, 2170 New Petchburi Road,
Bangkok 10320, Thailand
Telephone: 66-2-308-0360 Fax: 66-2-308-0363
THAI PRESIDENT FOODS PUBLIC COMPANY LIMITED
304 TF Buildings, Srinakarin Rd., Huamark, Bangkapi,
Bangkok 10240, Thailand
Telephone: 66-2-374-4730 Fax: 66-2-374-7743
[Europe]
Nissin Foods Kft.
H-6000 Kecskemet, Buzakalasz ut20., Hungary
Telephone:36-76-485-702 Fax:36-76-485-704
Nissin Foods GmbHAm Hohenstein 3-5
65779 Kelkheim, Germany
Telephone: 49-6195-6927 Fax: 49-6195-910019

5858
CORPORATE DATA
Nissin Food Products Co., Ltd. (Parent company)
Head Office
1-1, 4-chome, Nishinakajima, Yodogawa-ku
Osaka 532-8524, Japan
Telephone: 81-6-6305-7711
Fax: 81-6-6304-1288
Web Site: http://www.nissinfoods.co.jp
Tokyo Head Office
28-1, 6-chome, Shinjuku, Shinjuku-ku
Tokyo 160-8524, Japan
Telephone: 81-3-3205-5111
Fax: 81-3-3205-5059
Branches
Hokkaido (Sapporo), Tohoku (Sendai),
Chubu (Nagoya), Chugoku (Hiroshima),
Shikoku (Takamatsu), Kyushu (Fukuoka)
Local Offices
Aomori, Morioka, Akita, Koriyama, Kita-kanto, Chiba,
Yokohama, Niigata, Nagano, Kanazawa, Shizuoka, Tsu,
Kyoto, Osaka-minami, Kobe, Yonago, Okayama,
Yamaguchi, Matsuyama, Kochi, Kita-kyushu, Kumamoto,
Kagoshima, Okinawa, Obihiro
Plants
Kanto, Shizuoka, Shiga, Shimonoseki
Research Institutes
Central Research Institute, Food Safety Research Institute
(As of March 31, 2007)
History
1948 Chukososha Co., Ltd., established.
1958 Chicken Ramen, the world’s first instant noodle product, introduced;Company name changed to Nissin Food Products Co., Ltd.
1963 Listed on the Second Section of the Tokyo and Osaka Stock Exchanges.
1970 Nissin Foods (U.S.A.) Co., Inc., the Company’s first overseas operation,established in Gardena, California.
1971 Cup Noodle introduced; Kanto Plant begins operation.
1972 Listed on the First Section of the Tokyo, Osaka and Nagoya StockExchanges.
1973 Shiga Plant and General Research Center begin operation.
1975 Shimonoseki Plant begins operation;Nissin-Ajinomoto Alimentos Ltda. established in São Paulo, Brazil.
1977 Construction of new headquarters completed; main office moved to its present location in Yodogawa-ku, Osaka.
1984 Nissin Foods Co., Ltd., established in Hong Kong.
1988 Construction of Tokyo Head Office building completed; Central Research Institute begins operation.
1990 Capital participation in Yoke Co., Ltd. (now Nissin York Co., Ltd.).1991 Capital participation in Cisco Co., Ltd. (now Nissin Cisco Co., Ltd.).
Bangalore Plant of Indo Nissin Foods Ltd. begins operation.
1992 Long-life fresh noodles developed; Nissin Rao introduced.
1993 Nissin Foods Kft. established in Germany; PT. NISSINMAS begins operation.
1994 Nissin Foods (Thailand) Co., Ltd. begins operation.
1995 Nissin Spa-O introduced.
1996 Guangdong Shunde Nissin Foods Co., Ltd., Nissin-Universal RobinaCorporation, Shizuoka Plant, and Shanghai Nissin Foods Co., Ltd.begin operation.
1997 Nissin’s “hungry?” series win the International Advertising Festival(CANNES LIONS).
1999 Share unit (minimum trading unit) reduced from 1,000 shares to 100shares.
The Momofuku Ando Instant Ramen Museum in Ikeda City, OsakaPrefecture, the world’s first instant noodle museum, opened.
2001 Consolidated net sales exceeded ¥300 billion for the first time; contract-ed as official supplier to the 2002 FIFA World CupTM.
2002 Food Safety Research Institute established; Nissin GooTa series introduced.
2003 Aggregate sales of Cup Noodle brand since launch in 1971 top 20 bil-lion servings.
2004 Capital alliance with Hebei Hualong F&N Industry Group Co., Ltd., givesNissin Food Group the No. 1 global share.
2005 Nissin Foods marks a world first with its Space Ram, developed for thespace shuttle Discovery.
2006 Aggregate sales of Cup Noodle brand 25 billion servings in the world.
2007 MYOJO FOODS becomes a wholly owned subsidiary of Nissin Foods;Nissin Shanghai Food Safety Research Institute begins operation.

59
INVESTOR INFORMATION (PARENT COMPANY)As of March 31, 2007 (US$1=¥118.05)
Date of EstablishmentSeptember 1948
Number of Employees6,955 (consolidated basis)1,378 (parent company)
Common StockAuthorized: 500,000,000 sharesIssued: 127,463,685 sharesNumber of Shareholders: 20,394(Excluding owners of odd-lot shares)
Paid-in Capital¥25,123 million ($213 million)
Stock ListingsTokyo and Osaka stock exchanges
Ticker Code2897
Independent AuditorsErnst & Young ShinNihon
Transfer AgentMizuho Trust & Banking Co., Ltd.2-1, Yaesu 1-chome, Chuo-ku, Tokyo, Japan
Further InformationFor further information, please contact:
Corporate Communications Division (Tokyo Head Office)
Tel.: 81-3-3205-5252 Fax: 81-3-3205-5259
Regularly updated IR information in English is also
available on Nissin Foods’
web site at http://www.nissinfoods.co.jp
Principal Shareholders Number of Percentage of
Shares Held Total SharesName (Thousands) Outstanding
Steel Partners Japan Strategic Fund (Offshore), LP 12,150 9.53%
Ando Foundation 7,904 6.20
Mitsubishi Corp. 6,400 5.02
ITOCHU Corporation 6,400 5.02
Ando International Y.K. 4,100 3.22
Mizuho Corporate Bank, Ltd. 4,000 3.14
Japan Trustee Services Bank, Ltd. (trust account) 3,673 2.88
The Bank of Tokyo-Mitsubishi UFJ, Ltd. 3,650 2.86
The Master Trust Bank of Japan, Ltd. (trust account) 3,400 2.67
ONO PHARMACEUTICAL CO., LTD. 2,460 1.93
Note: In addtion to the above, the Company holds 5,197,200 shares of treasury stock.
Distribution of Ownership among Shareholders*
Financial Institutions 29.26%
Other Corporations 35.18%
Foreign Corporations 21.92%
Individuals and Other 12.64%
Securities Companies 1.00%
Share Price Range and Trading Volume on Tokyo Stock Exchange
0
3,000,000
6,000,000
9,000,000
12,000,000
15,000,000
2,000
3,000
4,000
5,000 (Shares)(Yen)
42006
5 6 7 8 9 10 11 12 12007
2 3 4 5 6
Share Price (Left)Trading Volume (Right)
Per Share Data (Years ended March 31)
2003 2004 2005 2006 2007
EPS (Earnings Per Share) (Yen) ¥ 99.67 ¥ 101.61 ¥ 114.38 ¥ 130.23 ¥ 150.93
BPS (Book-value Per Share) (Yen) ¥1,770.26 ¥1,867.97 ¥1,964.30 ¥2,012.48 ¥2,139.30
PER (Price Earnings Ratio)* (Times) 24.7 26.1 24.5 28.0 28.6
PBR (Price Book-value Ratio)* (Times) 1.4 1.4 1.4 1.8 2.0
Dividend (Yen) 30.00 30.00 30.00 30.00 50.00
Payout Ratio (%) 30.1 29.5 26.2 23.0 33.1
Notes: 1. From the fiscal year ended March 31, 2003, number of issued shares excludes the numbers of treasury stocks at term-end.2. PER and PBR are calculated based on the stock price at year-end.

1
28-1, 6-chome, Shinjuku, Shinjuku-ku, Tokyo 160-8524, Japan
Telephone : 81-3-3205-5111Fax : 81-3-3205-5059
http://www.nissinfoods.co.jp
This Report is Printed on recycled paper with soy-based ink for waterless printing.Printed in Japan