Savings in Transition (Final) - Sanlam Shared Documents... · Savings in Transition ... Birla...
24
Savings in Transition UBS Financial Services Conference 2007 Johan van Zyl Savings in Utopia y Savings in Utopia ~ Insights into the following questions: | Where does Sanlam see the future growth potential in respect of the various savings markets in which it operates? | What is the group’s associated strategies to penetrate these markets, and grow its market share? | And lastly, what are the associated opportunities and risks? y At Sanlam, we see the current savings environment in transition, and are gearing up our capabilities to make the most of these anticipated changes y To understand our outlook for savings, and answers to the above- mentioned questions, one needs to understand our strategy…
Transcript of Savings in Transition (Final) - Sanlam Shared Documents... · Savings in Transition ... Birla...

Savings in TransitionUBS Financial Services Conference 2007
Johan van Zyl
Savings in Utopia
Savings in Utopia ~ Insights into the following questions:Where does Sanlam see the future growth potential in respect of the various savings markets in which it operates? What is the group’s associated strategies to penetrate these markets, and grow its market share?And lastly, what are the associated opportunities and risks?
At Sanlam, we see the current savings environment in transition, and are gearing up our capabilities to make the most of these anticipated changes
To understand our outlook for savings, and answers to the above-mentioned questions, one needs to understand our strategy…

Agenda
Strategy — Client centricity
Changing savings environment
Retail Savings SolutionsLower-income market (NSSS)Middle-income MarketAffluent Market
Institutional Savings Solutions
Conclusion
1. Client Centricity

Strategy: Client Centricity
Client centricity:-Know who our clients are,Understand their needs,Design solutions to meet their needs (confirm appropriateness of particular solution set)Continue to satisfy expectations (through operational efficiencies and continuous advice)
Strategically, we do not intend to grow market share predominantly through product superiority, but mainly through client centricity
However, if we focus on the client, innovation in respect of superior products/solutions will surely follow
Understanding and adapting to the clientUnderstanding and adapting to the client’’s needs,s needs, through a broader through a broader distribution network, supported by a wider array of service/proddistribution network, supported by a wider array of service/product uct
offerings and capable talent, and offerings and capable talent, and ‘‘statestate--ofof--thethe--artart’’ technology systemstechnology systems

Understanding and adapting to the clientUnderstanding and adapting to the client’’s needs,s needs, through a broader through a broader distribution network,distribution network, supported by a wider array of service/product supported by a wider array of service/product
offerings and capable talent, and offerings and capable talent, and ‘‘statestate--ofof--thethe--artart’’ technology systemstechnology systems
Understanding and adapting to the clientUnderstanding and adapting to the client’’s needs, through a broader s needs, through a broader distribution network,distribution network, supported by a wider array of service/product supported by a wider array of service/product
offerings and capable talent,offerings and capable talent, and and ‘‘statestate--ofof--thethe--artart’’ technology systemstechnology systems

Understanding and adapting to the clientUnderstanding and adapting to the client’’s needs, through a broader s needs, through a broader distribution network, supported by a wider array of service/proddistribution network, supported by a wider array of service/product uct
offerings and capable talent,offerings and capable talent, and and ‘‘statestate--ofof--thethe--artart’’ technology systemstechnology systems
Wealth Management
Life-style
PersonalCover
FinancialEducation
Sanlam Personal FinanceElsewhere in Sanlam Group
Edu-cation provi-sion
Savings & Invest-
ment
Home loan
Car & house-hold cover
Banking / Trans-
actionalMedium
term credit
Finan-cial
Educa-tion
Wills & trusts
Medical
Risk cover
Retirement
ClientClient
Competitive advantage:Interact with clientsUnderstand their needsProvide adviceDesign solutionsFeedback - Maintain relationship
Comprehensive offering:
Client focus also provides various cross-sell opportunitiesThereby enhancing overall value proposition for client

Cross-sell Potential at SPF: Clients with a Single Provider and % Untapped
56%51%
44%
36%41%
30%
77%
0.0
0.2
0.4
0.6
0.8
1.0
1.2
1.4
1.6
SPF (Life only) SCI Santam Wills Glacier SPL Home Loans
mil
lion
0%
10%
20%
30%
40%
50%
60%
70%
80%
90%
100%
no. of clients with a single provider - lhs As a % of provider's base (ie untapped potential) - rhs
SPF’s life clients have the largest untapped potential of 1.4m clients
Despite Significant Future Potential, our Progress to Date
Accelerated success towards providing a wide range of client-centric solutions
Group net operating profit (Rm)
Otherfinancialservices
0
200
400
600
800
1 000
1 200
1 400
1 600
1H03 1H04 1H05 1H06 1H07
SPF SDM SEB SIM SCM SNT IFS
Life
CAGR: 19%pa

2. Savings Environment
South Africa, a Country of Rapid Change
Increased freedom ↔ increased personal responsibility:
Catalyst behind changing realities in South AfricaSocio-economic realities
Transparency / Access to informationConsumerism / Protection of the individual → Increased regulationEmpowerment
Economic realitiesLow inflation environmentIncreased market volatilityShorter time horizons → Flexibility and mobility
Other influencesProliferation of technologyExpectations created by other industriesExpectations from Government (FAIS, FICA, SOI, NSSS)

Current Savings Environment in SA
Overall a strong improvement in household wealth, driven by:Strong growth in disposable income (CAGR of 11% over past 3 yrs)Increasing tax reliefLower inflationary environmentStrong GDP growthHigher stock market levelsEscalating house prices
However, not reflected in the official macro statistics (-0.5% savings rate of personal disposable income - PDI) due to aggregation impacts (ie unemployed and lower wage earners)
Despite a sharp rate of growth in household consumption expenditure, a recent survey commissioned by Credit Suisse Standard Securities (TNS Survey — March 2007) paints a very different picture…
Current Savings Environment in SA — Higher Savings Rate
After stripping out aggregation impacts, survey showed a higher propensity to save amongst households (savings from 4%-10% of PDI)
Suggests higher income households are not consuming out of savings
Savings as a % of Disposable Income (by household income groupinSavings as a % of Disposable Income (by household income grouping)g)
0%
2%
4%
6%
8%
10%
12%
7000-7999 8000-8999 9000-10999
11000-13999
14000-19999
20000-24999
25000-41999
>42000
Source : CSSS

Current Savings Environment in SA — Savings Diversified
63% of households use more than one savings productLower income groups typically use a large number of funeral plansHigher income households use a larger array of savings products
Savings products usedSavings products used
0%
20%
40%
60%
80%
100%
7000-7999
8000-8999
9000-10999
11000-13999
14000-19999
20000-24999
25000-41999
>42000
other
shares on the stock exchange
Money marke t account o r 30/60 daynot ice accountsInvestment in o ther your own orsomeone e lse 's businessUnit t rusts
Stokve ls o r o ther savings c lubs o rburia l soc ie t iesEducat ion po licy/s
Endowment po licy/s
Pension or provident fund/s o rre t irement annuity/sFunera l po l icy/s
Source : CSSS
Current Savings Environment in SA — Black Diamonds
Number of people in the middle market will grow by approximately37% from 2006 to 2011
Blacks and Indians have a growth rate of more than 50% (Coloureds —72%), whereas the White population has a mere 19% growth rate
0
200
400
600
800
1 000
1 200
1 400
1 600
1 800
2002 2003 2004 2005 2006 2007 2008 2009 2010 2011
'00
0
B lack Co loured Indian WhiteSource : AMPS 2006
Growth in race groups Growth in race groups —— Middle income marketMiddle income market

3. Retail Businesses — Savings Solutions
3. Retail Savings Solutions - Summary
Low incomeCurrently low savings penetration, limited mainly to risk solutionsRoll-out of NSSS should fill the gap (limited private sector opportunities)RoA, India and other emerging markets provide the biggest savings-related opportunities in the lower-income market
Middle incomeHigher level of savings penetrationOpportunities in respect of new distribution models
Affluent marketNew commission dispensation will change structure of marketRelaxation (or abolishment) of foreign exchange controlsCapturing share of ‘Baby Boomers’ marketAddressing trend of backward integration by IFAs

Lower Income Market
Regulatory Environment in SA
National Social Security Scheme (NSSS):Supportive of government’s initiative for a collective scheme with its resultant cost advantages and compulsory participation
We expect a (at least a partially) funded scheme:Funded schemes give people a greater sense of control over theirown financial positions (rather than feeling that they are cross-subsidizing)The amount of assets available for investment will be substantial —difficult to manage without splitting up assets / partnering with the private sector
We see the NSSS as meeting only a very specific need for our clients:Still exists a wide array of ‘other’ financial services which we can offer this market (e.g. there will still be a need for shorter-term savings)A focus on direct marketing channels, also provides a lower-cost avenue to tap into this market

Overview — Rest of Africa
OverviewSanlam operates in African countries with under-developed investment marketsLife insurance products give clients access to participate in these investment marketsLeverage off our existing expertise to expand into otherwise unavailable products (e.g. annuities)
DriversHuge drive in Africa for education - since educated people can take better advantage of developing economiesDemand for savings products is primarily driven by educational savings, which we see as a huge growth area
Growth Potential — Presence in Rest of Africa
Why we should be in rest of Africa?Low industry penetration + competitionStrong economic growthHigher margins availableDoes not consume excessive management time
5 00036 million2005Tanzania
24 00010 million2002Zambia
45 00020 million2000Ghana
85 00032 million2000Kenya
200 0001.7 million1995Botswana
810 00045 million1930South Africa (ELM)
PoliciesPopulationCommencedKey

Rest of Africa — Key Risks & Challenges
Restore image of industry — legacy of state insurance companies
Skill shortages — management, technical, operational
Premium collection capabilities — many countries cash driven
Evolution of legislation — revision of Insurance Acts
Increase in competition — more appetite for Africa
But opportunity to help shape the industries…
Rest of Africa — Key Focus Areas
Maintain dominant market position in Botswana, but:More focus on bancassurance / group businessBenefits from annuity matchingUtilization of excess capital
Focus on operational efficienciesDistribution capabilitiesQuality of business (lapses, NTU’s)Cost efficiencies
Partnerships with other credit providers
Improved support out of South Africa
Further expansion into Africa — Nigeria?

Growth Potential — India
The country is looking at an annual GDP growth of 9.2%
Insurance penetration of 3,1% following entry of foreign players
High expected growth in personal income and aspirations
Need for strong financial planning
Markets in most developed countries have saturated
This makes the Indian market more attractive for global insurance majors
Huge opportunity to tap semi-urban and rural markets
There exists a strong urban and rural divide with regard to savings
Over 1 Billion Indians – Strong economic growth
Majority of the population does not have adequate financial protection
Example : The advantage of India — Insurance linkages
Shriram — New Business Premium YTD growth (Sorted by APE Growth)
30%26%Tata AIG22/%24%Aviva
24%32%ING Vysya42%42%ICICI Prudential48%56%Kotak Mahindra Old Mutual71%60%SBI Life55%60%Birla Sunlife91%63%Max New York61%78%HDFC Standard
117%106%Met Life48%106%Bajaj Allianz
120%140%Reliance Life342%187%Shriram Life253%610%Sahara Life1391%1356%Bharti Axa Life55%64%Total Private9%41%LIC19%48%Grand Total
Unweighted GrowthYTD F2008
APE GrowthYTD
Life Insurer
Source : IRDA, JP Morgan* unweighted as data for single premiums were not available prior to Feb06

Middle Income Market
Some of our Challenges
Need for better communication between parties involved in solution:ClientIntermediaryProvider
Providers differentiate through “product innovation” (difficult to answer to a call for simplification)
Difficult to introduce technology into the entire process
Advice increasingly provided only to the wealthy
International experience — UKDesertion of the middle marketInterventions so far failed — protection gap

Existing Distribution Space
Experimental / NewOpportunities
% o
f bus
ines
s →
Exis
ting
mod
el%
of business →N
SSS
Lower Income Middle Income Higher Income
Existing distribution models
NSSS
Shift towards Higher Average Recurring Premiums
Unit costs of sale too high: FAIS, FICA and new commission dispensation likely to push advisors up-market
Since 2005, average recurring premium file-sizes grew by 14%pa in SFA and 18%pa in broker channel (vs. inflation of 4.8%)
Cumulative growth in gross average recurring premiun size vs inflation (indexed)
90100110120130140150160170180190200
2000 2001 2002 2003 2004 2005 2006 2007
Ave CPIX SFA (incl wealth) Broker
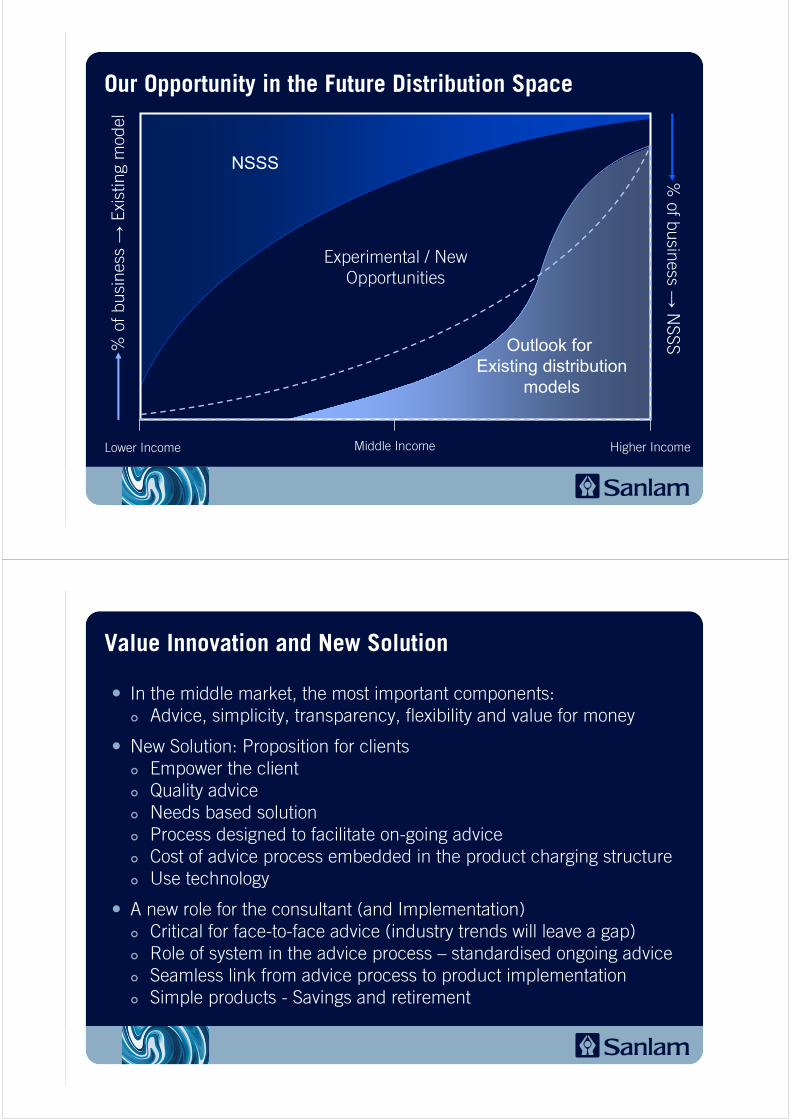
Our Opportunity in the Future Distribution Space
Experimental / NewOpportunities
% o
f bus
ines
s →
Exis
ting
mod
el%
of business →N
SSS
Lower Income Middle Income Higher Income
NSSS
Outlook for Existing distribution
models
Value Innovation and New Solution
In the middle market, the most important components:Advice, simplicity, transparency, flexibility and value for money
New Solution: Proposition for clientsEmpower the clientQuality adviceNeeds based solutionProcess designed to facilitate on-going adviceCost of advice process embedded in the product charging structureUse technology
A new role for the consultant (and Implementation)Critical for face-to-face advice (industry trends will leave a gap)Role of system in the advice process — standardised ongoing adviceSeamless link from advice process to product implementationSimple products - Savings and retirement

Benefits to Sanlam
Consistent with brand proposition
New growth opportunities (target new clients and grow market share)
Tight control over legal liabilities arising from the provision of advice
In line with thought process of National Treasury
Pro-active initiative against potential fall-out of traditional business model
Improved client retention
Reduced acquisition cost — improved margins and value for moneyImproved productivity (FC)Reduced new business support per financial plan (automated)Reduced management requirements
A streamlined, high-volume process
Affluent Market

Funds under management
Building on a very successful LISP Business
79
12
16
23
30
35
0
5
10
15
20
25
30
35
40
2001 2002 2003 2004 2005 2006 2007
R b
'n
0
50
100
150
200
250
2002 2003 2004 2005 2006 2007 2008 2009 2010 2011
'000
65+ yrs 50 - 64 yrs 35 - 49 yrs 25 - 34 yrs 16 - 24 yrs
Growth in age groups — Affluent Market
Future growth profile of Affluent Market
Population size of affluent market will grow by 59% from 2006 to 2011
The 16-24 age group will show the highest growth rate over the period of 63%, but growth from all the age groups will >50%
By 2011, age group 35-49 will make up half of the Affluent market
All race groups will grow by between 53% (Whites) and 86% (Coloureds)
Source : AMPS 2006

Changing Market Conditions
Commoditisation of LISP business
Arrival of new competitors (Coronation, Allan Gray and Discovery)
Increased competition from existing players
LISPs increasingly competing on price
Relaxation (abolishment) of foreign exchange controls provides opportunities for offshore long-only asset management opportunities
Backward integration from advisors:Likely to put further pressure on marginsLose independence from the client’s perspectiveIFA’s will increasingly compete directly against private banksHowever, appears to be a bull-market trend
ProductProductPackagesPackages
IFAIFA
Asset Asset ManagerManager
Bac
kwar
dB
ackw
ard
Inte
grat
ion
Inte
grat
ion
C L I E N T S
50 — 75 bps 50 bps
85 bps65 — 150 bps
75 — 100 bps 100 bps
Current Future

Affluent Market — Strategic Outlook
Offering a wider set of financial solutions to affluent clients, as well as assisting intermediaries to diversify their practices across a wider solution set
Diversify income streams away from pure administrative profits
Partnering with key intermediaries in the market
New commission proposals and early termination proposals likely to push more IFAs up-market
Establishing a relationship with clients earlier in their life
Scale advantages are still important in this business
Potential for IFA aggregation opportunities both locally and abroad
Sustainable superior investment returns is key to playing across the value chain
4. Institutional Businesses — Savings Solutions

Sanlam Adapting to Changing Consumer Demands
1310 11 11 14
7
18
27
43
51
66
38
1.41
2.72
3.81
4.554.74
5.26
0
10
20
30
40
50
60
70
80
90
100
2002 2003 2004 2005 2006 1H07
Rb
n
-0.5
0.5
1.5
2.5
3.5
4.5
5.5
tim
es
Life Non-life Ratio of non-life to life
Grow alternative revenue sources: Sanlam Group New business flowsCAGR 2002-2007 (+24%)
Following off-balance sheet trend & Countering Disintermediation
Making sure that Sanlam has the capabilities in place to capture the shift in savings off-balance sheetDiversification strategy: In part, a response to an increasing trend of disintermediation in the savings industry
New product providers and platforms “eating” into the existing value chain
ClientProduct
platformsDistribution
Network
Traditional LT savings firms
Asset managers
Unit Trusts, LISPs, Multi-
managers
“If you can’t beat them – then join them” (or own them)!

Profile of Sanlam Investments — Available Capacity
Sanlam Sanlam Investment Investment
ManagementManagement
OctaneOctaneHoldingsHoldingsLimitedLimited
Sanlam Sanlam Collective Collective
InvestmentsInvestments
SanlamSanlamPrivatePrivateEquityEquity
Sanlam Asset Sanlam Asset Management Management
(Ireland)(Ireland)
Sanlam MultiSanlam Multi--Managers Managers
InternationalInternational
Sanlam Sanlam PropertiesProperties
Sanlam Sanlam InvestmentsInvestments
SanlamSanlamPrivate Private
InvestmentsInvestments
SIM Emerging SIM Emerging Markets Markets
SanlamSanlamCapitalCapitalMarketsMarkets
SIM GlobalSIM Global Hedgehog Hedgehog CapitalCapital
Sanlam Sanlam Structured Structured SolutionsSolutions
SimekaSimeka
Sanlam Sanlam Employee Employee BenefitsBenefits
Increased Diversity (leads to Increased Focus)
209227
286
327
406430
150
200
250
300
350
400
450
500
2002 2003 2004 2005 2006 Jun-07
SIM - AUM (Rbn)CAGR 2002-2007 (+16%)
SCI - AUM (Rbn)55
22 2631
41
53
0
15
30
45
60
2002 2003 2004 2005 2006 Jun-07
Retail InstitutionalWhite Label
CAGR 2002-2007 (+20%)
Multi-Manager - AUM (Rbn)
25 2338
59
97
0
20
40
60
80
100
120
2002 2003 2004 2005 2006
Consulting SADiscretionary GlobalDiscretionary SA
CAGR 2002-2006 (+40%)
0
200
400
600
800
1,000
1,200
2002 2003 2004 2005 2006 Jun-07
InternationalSA
CAGR 2002-2007 (+36%)
Profit before tax (Rm)
243 270419
699
1 077
560

Conclusion
The current savings market in South Africa is healthier than expected, and is continuing to grow
There is also sizeable growth potential in the savings market in the rest of Africa as well as other emerging markets
We see the need for alternative distribution models in the middle-income market which offers a needs based solution, with (or without) on-going advice. Cost of advice could be embedded in the product charging structure
We see a strong underpin to growth in savings in the form of the black emerging market (black diamond), as well as the unwind of the ‘Baby Boomers’ phenomenon
Increased regulation will continue to shift the IFAs up-market
Given the current success in diversification of the group, Sanlam is well placed to capture these savings trends
Thank You