The Seven Sacraments and The Gospel According to John Rev. Mr. David Skillman.
date post
22-Dec-2015Category
view
216download
0
Savings & Financial Services for Low- and Moderate-Income
Households: Evidence from the Detroit Area Survey
Skillman Good Neighborhood CommunitiesEconomic Development Forum
University of MichiganDetroit Center
January 11, 2008
Michael S. BarrUniversity of Michigan Law School & Brookings Institution

2
Introduction LMI households need range of services to receive
their income, store its value & pay bills
LMI HH need opportunities for saving Short-term (emergencies, asset purchase) Longer-term (housing, education)
LMI HH are underinsured for key events
LMI HH often pay high costs to borrow
The financial services system is not well organized to serve LMI HH

3
The Financial Services Mismatch The financial services lives of low- and moderate-
income households—living on the financial edge.
The financial system is not designed to serve low- and moderate income households
Supply: High bank account fees, high minimum balances, overdraft & NSF fees, check-writing delays & fees, Chexsystem for past account problems
Demand: Low income, low savings, immediate needs
Alternative financial services sector serves poor
Check cashers, payday lenders, refund anticipation lenders, pawnshops, title loans, etc.
Often costly, inefficient & dead-end

4
Detroit Area Household Financial Services Survey Survey of 1,003 households in Detroit metro area
conducted with Survey Research Center
Random, stratified sample. HH area median = 49,000 (census definitions) 0-60% of area median (up to $29,000) 61-80% of area median ($29,000-$39,000) 81-120% of area median ($39,000-59,000)
Over sample low-income census tracts
Ask randomly selected individual from household about own & household’s financial service use
In-person, computer assisted. Average interview length 76 minutes. Production hrs/interview: 8.8
65% response rate

5
Description of Sample More socio-economically disadvantaged
than average US household
Mostly black, 2/3 female, mostly unmarried
$20,000 median household income
33% live below federal poverty line
30% have less than a HS Diploma or GED
56% currently employed

6
Bank & AFS 29% of LMI individuals (23% of households) do
not have a bank account.
The unbanked are younger, less educated, less likely to be employed, and poorer than banked individuals.
But being “unbanked” is a not a permanent state of the world. Among the unbanked, 70% previously had a bank
account. 12% of the “banked” respondents previously were
“unbanked” because their bank closed one or more of their accounts

7
Unbanked 70% previously banked
70% closed it b/c moved, high fees, NSF 30% bank closed b/c overdrafts
75% want to open a bank account
33% have looked into opening an account
17% report that a bank has denied an application to open a bank account

8
Reasons Why Unbanked
Reasons Why Unbanked
15%
10%
7%
3%
6%
16%
8%
8%
4%
5%
5%
13%
Don't have enough money
Unemployed
Can't save
Bad credit
Don't trust banks
Don't need one
High bank fees
Owes bank money
Inconvenient
Bank accounts are not secure
Easier without bank account; morecontrol
Other reasons

9
What would make you open an account?
All Respondents
29%
16%
14%
10%
20%
11%
Lower Fees
Less Confusing Fees
Lower Min Balance
Get Money Faster
Convenience
If volunteered; None; Nothing

10
Banking and Payment Cards Traditional checking accounts don’t work for LMI
households
Payment cards (debit & prepaid) are a potentially attractive financial product for LMI households and for financial institutions: a win-win.
Conjoint analysis to test what types of bank/payment card features do different LMI households find attractive Many unbanked HH would like a bank account & payment
cards
LMI HH’s value low monthly cost & federal protection
Automatic savings plan positive (8% of decision-weight)
Policy Implications

11
Quick Highlights: Tax Prep & RALs 66% of low- and moderate-income tax filers used
a paid preparer to file.
About 38% of all LMI taxpayers using a paid preparer took out a RAL.
51% of unbanked use RAL vs. 31% others
50% of EITC filers use RAL vs. 14% others
RAL users paid $177 for tax preparation & RALs, which represents 7% of the average refund of such households ($2,505).

12
Quick Highlights: Home Mortgages Broker Usage
58% used a mortgage broker Of those using a broker, only 33% were offered loans
from more than one lender
29% paid points or fees up front Blacks pay 2.5-3 times the points & fees whites pay
“High Cost” mortgages held by 55% of HH Include high APR, balloon payment, prepayment penalty 63% for blacks, 46% for whites
When “high cost” mortgages also include ARM, 62% of LMI HH hold such mortgages 70% for blacks, 51% for whites

13
Quick Highlights: Home Mortgages (2) Roughly 13% of LMI HH have “D” class subprime
loans (APR = 10% or greater).
29% have ARMs 32% of blacks and 22% of whites
23% face prepayment penalty 29% blacks face prepayment penalty but only 13% of
whites Median APR on loans with prepayment penalty higher
than loans without penalty (7% vs. 6.5%).
11% have balloon payment 15% blacks, 5% whites

14
Quick Highlights: Payday loans 3.4% of LMI HH used payday loan in last year.
Why? 60% to pay for everyday expenses, 11% to pay down credit card or bank debt, 8% for transportation expenses.
Why payday lender? Convenient hours/locations (24%), expected to be approved for loan (22%), needed a small amount to pay a bill (19%).

15
Quick Highlights: Payday loans (2) Common risks associated with payday loans are
to delay/rollover payment, which 40% did.
On average, borrowers rolled over 4 times.
14% took a loan from one payday lender to pay back a loan to another payday lender.
Payday borrowers have lower asset levels (especially homes) than non-borrowers

16
AFS Complementary Products
AFS What % of users use payday?
What % of non-users use payday?
Pawnshop* 16% 3%
Cash Advance* 14% 4%
RAL* 9% 3%
Rent-to-Own* 16% 4%
Cash out Pension* 12% 4%
Overdraft* 13% 2%
Among those using other AFS/not using other AFS, what % use payday?
*Significant difference at 10% level after controlling for age, race, gender, and income

17
Credit Policy Implications? Savings cushions
Direct deposit programs Automatic savings plans Tax refund savings programs
Short-term loan alternatives Direct debit, longer-term, self-amortizing
consumer loans provided by banks.
Develop new “opt-out” regulations for model credit card or mortgage plans
18
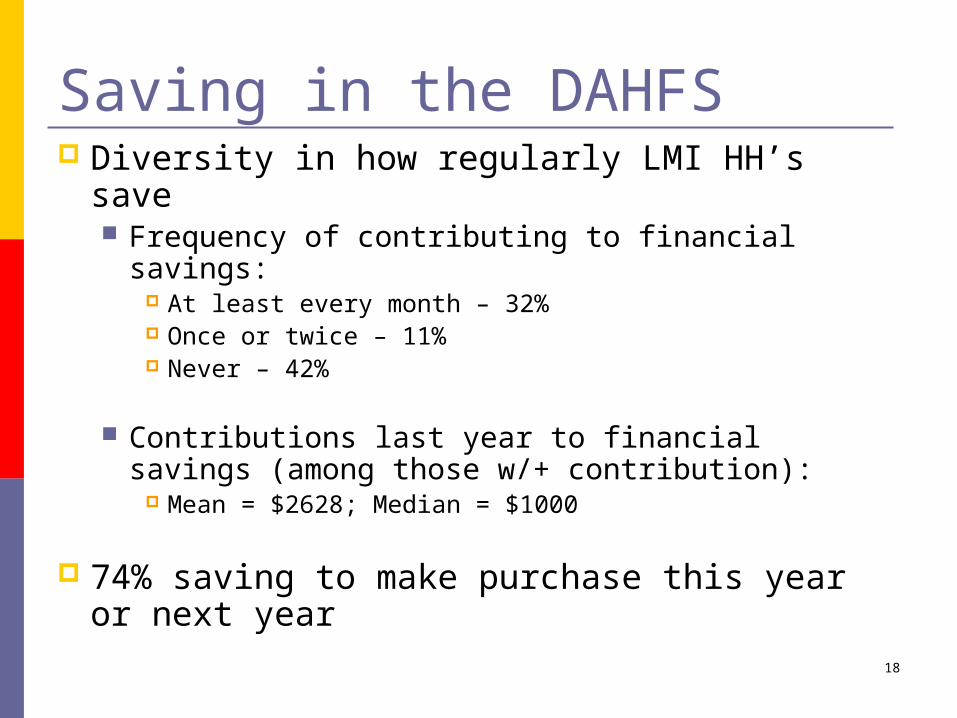
Saving in the DAHFS Diversity in how regularly LMI HH’s save
Frequency of contributing to financial savings: At least every month – 32% Once or twice – 11% Never – 42%
Contributions last year to financial savings (among those w/+ contribution):
Mean = $2628; Median = $1000
74% saving to make purchase this year or next year
19
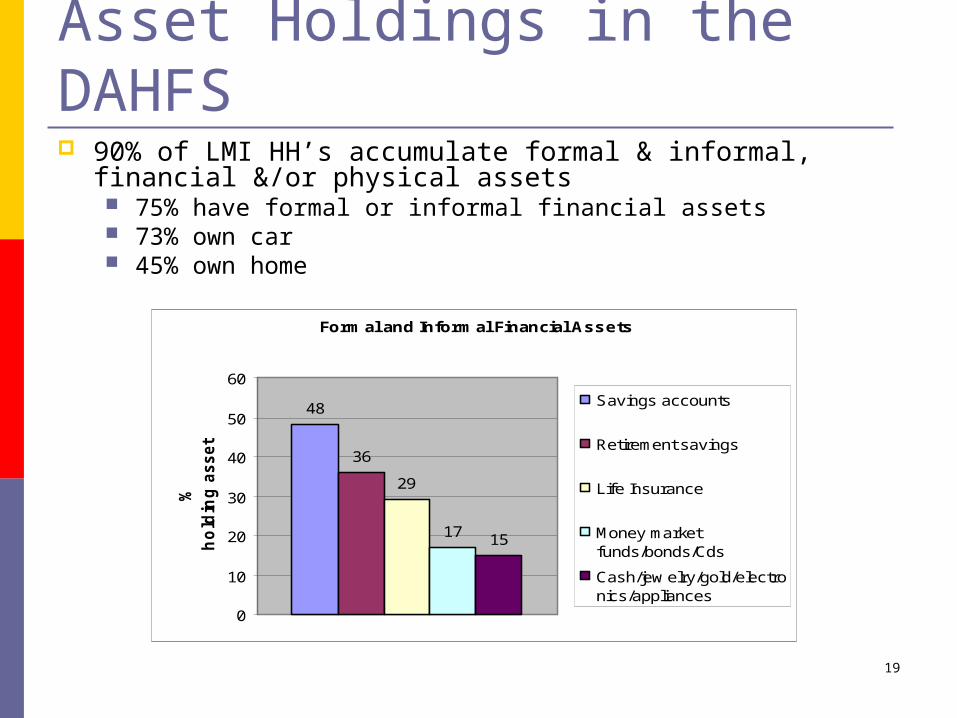
Asset Holdings in the DAHFS 90% of LMI HH’s accumulate formal & informal, financial
&/or physical assets 75% have formal or informal financial assets 73% own car 45% own home
Formal and Informal Financial Assets
48
36
29
17 15
0
10
20
30
40
50
60
%
ho
ldin
g a
ssets
Savings accounts
Retirement savings
Life Insurance
Money marketfunds/bonds/Cds
Cash/jew elry/gold/electronics/appliances

20
Asset Levels are Low* Checking, savings, money market accounts, cds, mutual funds, stocks, bonds, IRAs, thrift type plans, savings bonds, treasury bonds, other financial assets. (cash, money orders, uncashed checks) All in gross value. ** Vehicles, houses, other residential real estate, business interests, other non-financial. All in gross value. Assets Median value excluding home & auto Median value including home & auto Assets- Conditional Median value excluding home & auto Median value including home & auto
$2,050 $34,500 $15,000 $60,200
Financial Assets* Median Value Financial Assets*- Conditional Median Value
$1,500 $13,000
Non-Financial Assets** Median Value Non-Financial Assets** -Conditional Median Value
$13,000 $46,000

21
Median Net Worth = $14,000 Assets =
Checking and Savings + Primary Residence + Other Real Estate +
Vehicles + Business or Farm +
Stocks, Bonds, Mutual Funds, Investment Trusts +
IRAs, Private Annuities, Pension, Retirement Plan through Employer +
Other Retirement Plan + Money market funds, Government savings bonds, CDs, Treasury bonds
Cash, Money orders, Uncashed checks, Jewelry, Gold, Appliances, Electronics +
Other savings or assets (thrift plan, 529 college plan, savings in bank deposit) +
Other savings not mentioned
Liabilities = Credit Card Debt + Mortgage + Home Equity Line of Credit + Second Mortgage + Other Home Loans + Vehicle Loans + Title Loans + Student Loans + Unpaid Medical Bills +
Unpaid Legal Bills + Other Loans

22
Reasons for Saving Precautionary/Buffer Stock reasons
To feel financially secure: 78% Emergency/Medical costs: 70% Lose job: 51%
Future consumption Special event (wedding, funeral, vacation): 53% House or home improvements: 49% Retirement: 48% Furniture or HH appliance: 33%
Investment Education or training: 40% Self-employment: 16%
Debt: 47% save to make payments on existing debt
Can we better frame the saving decision for LMI HH’s?

23
Attitudes towards Saving 41% strongly agreed that it was hard to resist the
temptation to spend money
68% strongly disagreed that savings just isn’t worth it
8% strongly agreed that savings just isn’t worth it
For those who have a bank account, 48% believe that it helps them to save
For those who don’t have a bank account, 67% agree that it will help them to save

24
Current Savers* vs. Non Current Savers*Defined as respondent who has contributed to savings over the past 12 months**Significant after controlling for race, income, education and working status.
All DAHFS Sample
Current Saver* Non- Current Saver
53.64 % 46.36 %
Income Median
$20,000
$30,000
$12,000
Education
Less Than High School
29.6% 19.53% 41.26%
High School Diploma or Equiv
23% 20.16% 26.27%
More than High School Diploma
47.4% 60.31% 32.48%
Working Status
Employed 54.28% 65.61% 41.18% Unemployed 28.98% 19.49% 39.96%
Out of Labor Force 16.74% 14.91% 18.86%
Bank Account Ownership**
71.25%
82.56%
58.17%

25
Challenges to Saving: Low Income 71% find it very or somewhat difficult to live on
current HH income
Hardships
24%
17%
6%
18%
4%
27%
8%
27%
0%
5%
10%
15%
20%
25%
30%

26
Challenges to Saving: Low Income (2) For 29% of LMI HH’s, monthly expenses exceed
income during most of year To make up difference:
50% rely on family/friends 23% spend assets 13% borrow from bank/use credit card
45% always able to cover expenses
Should LMI HH’s save? If so, which ones? Lifecycle view: if current income is low relative to
expected future income, HH’s should not save But buffer stock needs & pre-commitment potential

27
Challenges to Saving: Many Needs 86% find it hard to save because most of their
money goes toward necessities
37% expect to face a big expense in next 5-10 years for which unable to save
During year prior to interview: 23% lose job 27% face major illness or have major medical expense
28% have health condition inhibiting work
86% of those with a credit card owe money 40% of all LMI

28
Challenges to Asset Accumulation Income is volatile—in year prior to survey:
17% - income went down 29% - income went up & down Lifecycle view: 46% should draw down their assets
Debt-service burden (excluding house & auto) Median debt outstanding = $500 Mean debt outstanding = $5,667
Informal financial obligations 45% save in order to help family/friend in need

29
Challenges to Saving & Asset Accumulation: Credit & Insurance Market Imperfections High cost of credit & insurance:
Reduces ability to use credit & insurance to smooth consumption
Higher debt-service burden crowds out current consumption & saving
Cannot pool risk to mitigate income volatility
How can credit & insurance markets & government policy serve HH’s that experience downward shocks to income?

30
Tax Refunds: Saving Opportunity? 15% state that they have employer withhold
extra from paycheck to save
80% tax filers receive federal refund Mean refund = $1700
69% tax filers want to over-withhold income Related to dynamic inconsistency & wanting to use
withholding system as pre-commitment device against over-consumption (Barr & Dokko, 2007)
With tax refund: 24% spend all of refund 76% save some or all of refund 62% pay bills or debt (positive net saving)
79% of those who spend all pay bills or debt

31
Tax Refunds: What Type of Opportunity? Only 27% of LMI HHs purchase durable goods.
Contrasts with middle & high income HH’s (Souleles, 1999)
Given self-control problems related to dynamic inconsistency: Illiquid saving enables pre-commitment Pre-commitment finances future consumption
Given that 76% of LMI tax filers save some or part of refund: Marketing & framing during tax season Simplify fee structure & minimum balance requirement Opt-out savings products for LMI tax-filers

32
Tax Policy Implications Tax filing may be an important opportunity for savings (see
Barr, Rhine, Duflo, Tufano, etc.) Short-term savings more likely than long-term
Paying down debt as form of savings, together with preference for lump sum, suggests tax over-withholding as precommitment device (Barr & Dokko 2007).
Split refunds can be used for savings policy
Tax preparation & RALs consume non-trivial portion of refund, so optimal income redistribution policy would suggest Reduce tax complexity (see McCubbin & Holtzblatt)
Alter unbanked status (see Barr, Banking the Poor)
IRS direct deposit into “opt out” bank accounts for unbanked
Inclusive national savings policy

33
Financial Services Policy Encourage low-cost, electronically-based bank accounts with
a new tax credit Pay for performance, fixed cost per account
Administered by IRS & FMS using adjustments to quarterly withholding payments
Can include incentive for matched savings plans provided by financial institutions, funded by Treasury
Can include option of self-amortizing, 6 month credit product with direct debit after seasoning period
No overdraft, no check-writing, no chexsystem screen
IRS should deposit tax refund to default, privately offered bank accounts for the unbanked
States should use EBT to move beneficiaries into banking system

34
Conclusion The Financial Services Mismatch
The financial services system is not designed to serve low- and moderate-income households.
The Costs of Financial Exclusion Inefficient for national economy Costly for low-income households Promotes dis-saving
The Need for Inclusive Financial Policy Low-cost banking & payment systems reforms Inclusive national savings policy

35
Funders & Advisory Board of the Detroit Area Household Financial Services Study Funders
Ford Foundation Fannie Mae Foundation MacArthur Foundation Mott Foundation Casey Foundation Community Foundation of Southeast Michigan National Poverty Center CLOSUP University of Michigan Provost, OVPR, Law School
Advisory Board
James Carr (Fannie Mae Foundation), John Caskey (Swarthmore), Phoebe Ellsworth (Michigan), Reynolds Farley (ISR), Jeane Hogarth (Federal Reserve Board), Rochelle Lento (Michigan), Sherrie Rhine (Federal Reserve Board), Bob Schoeni (ISR), & Michael Stegman (University of North Carolina, Chapel Hill).
For further information see http://www-personal.umich.edu/~msbarr/ and click on “Detroit Area Study”