Deficits and Control of Deficits in Spanish Local Governments
Upload
meagan-wolffeCategory
view
216download
3
SavingsDeficits
Links between the Domestic and the International
Sectors
Econ 102Winter 2001Mr. Smitka
The 1993 Turnaround
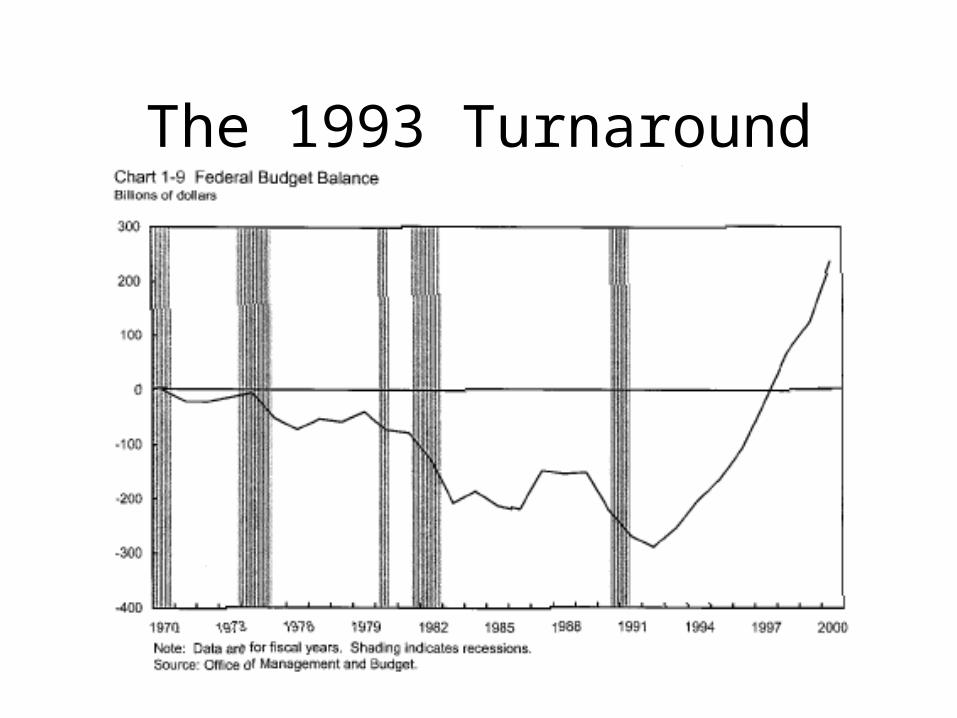
Structural Balances up, tooThe Government is Saving
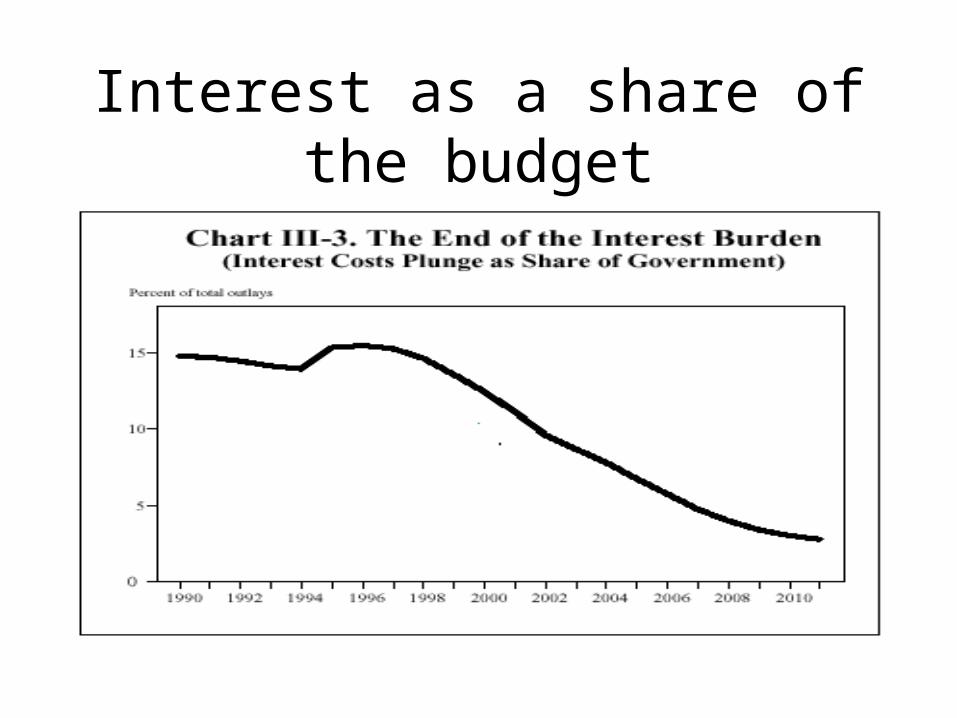
Interest as a share of the budget
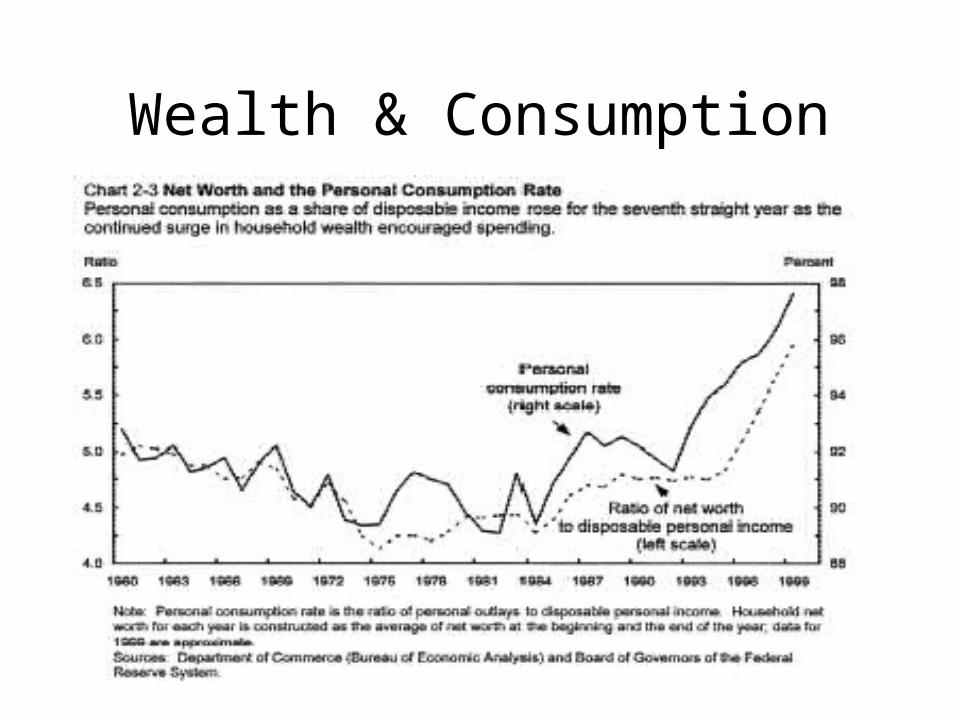
Wealth & Consumption
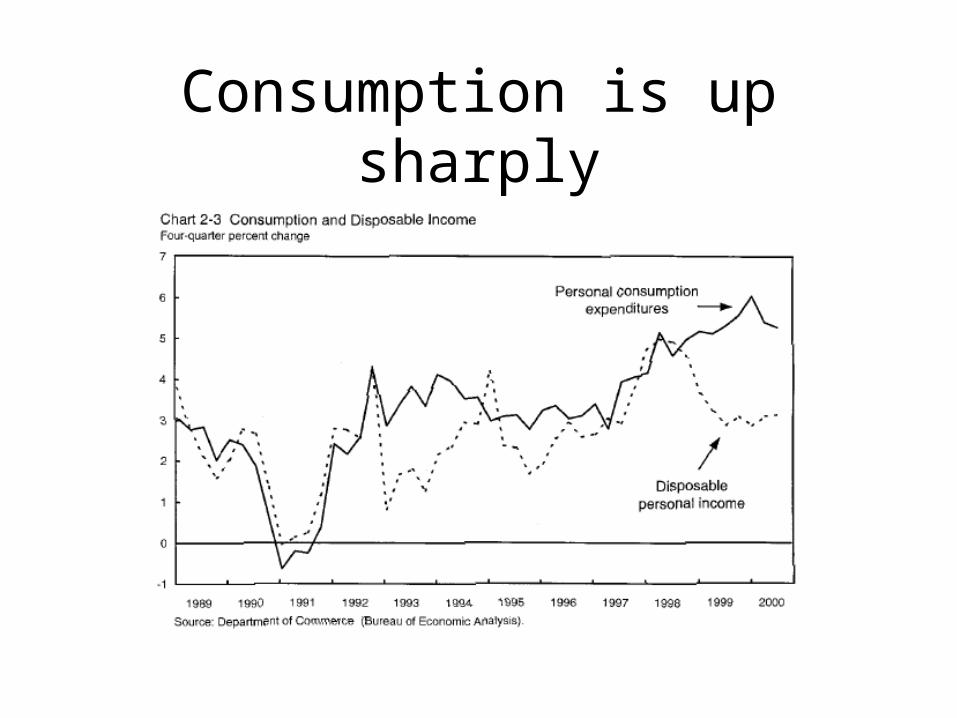
Consumption is up sharply
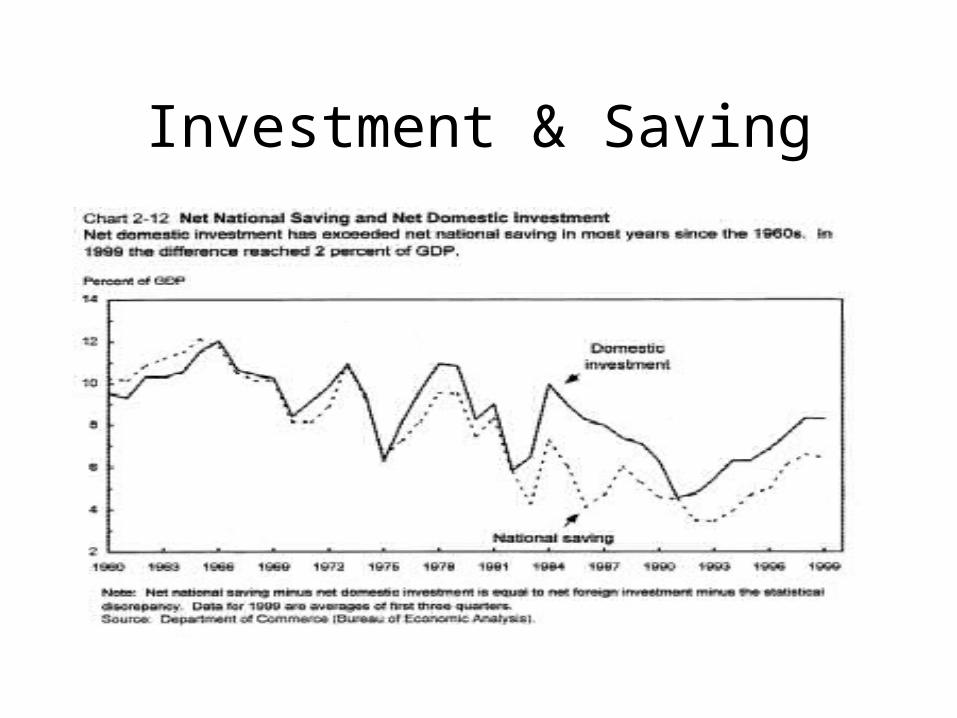
Investment & Saving
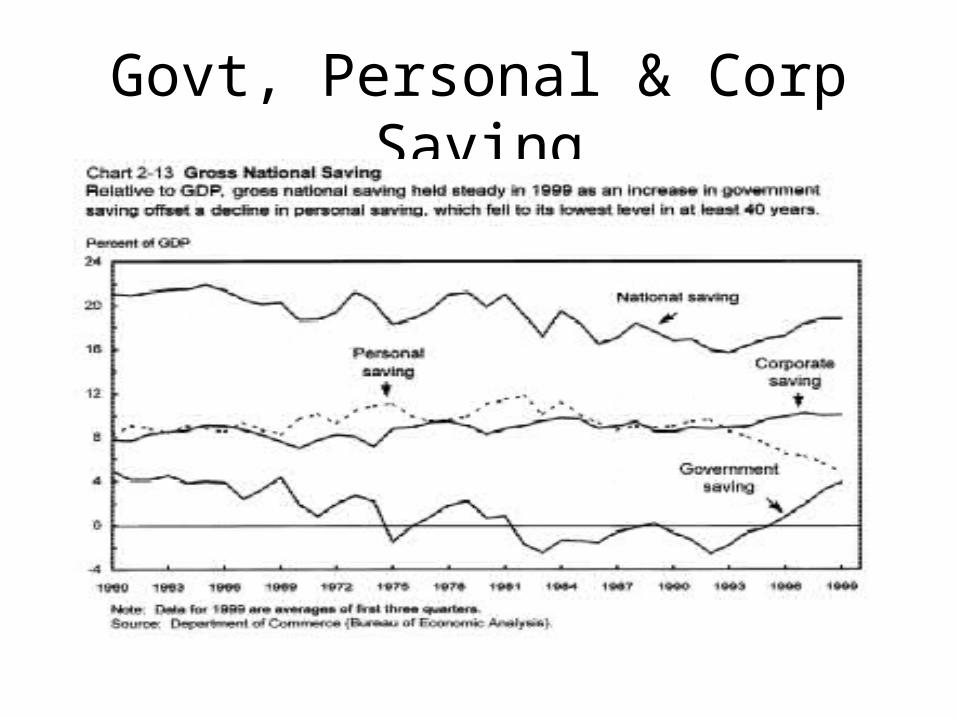
Govt, Personal & Corp Saving
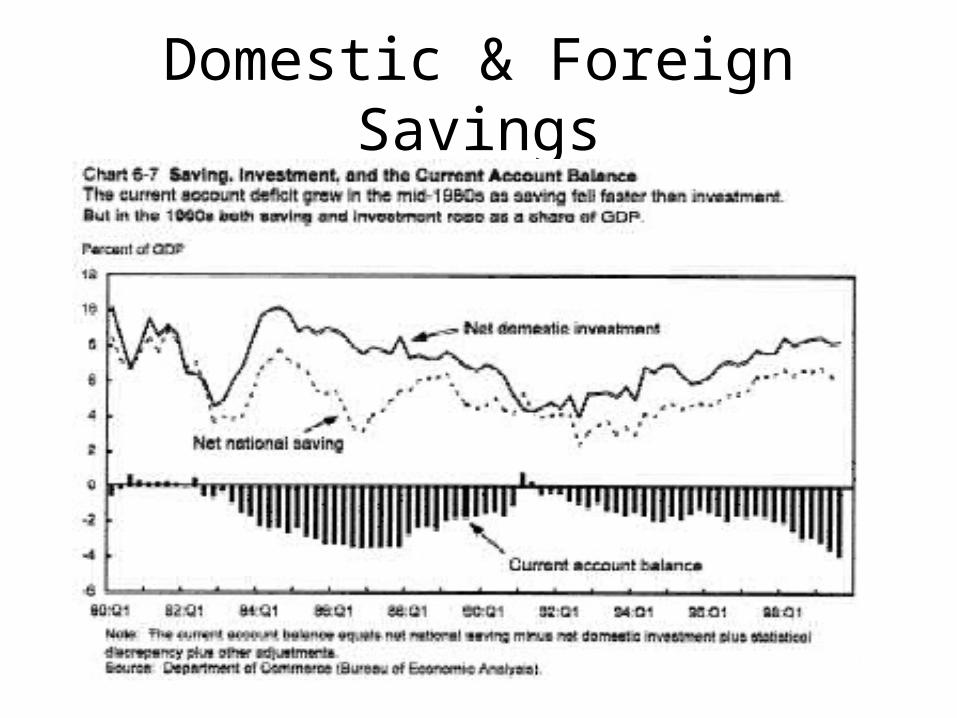
Domestic & Foreign Savings
If everyone is consuming ...
• Then where do we get the goods?– (T-G) was negative– (S-I) is negative
• So C is high
• But I is also high
• AS - real GDP - can’t expand overnight– Can all of this happen simultaneously?
• What gives?? … inflation?
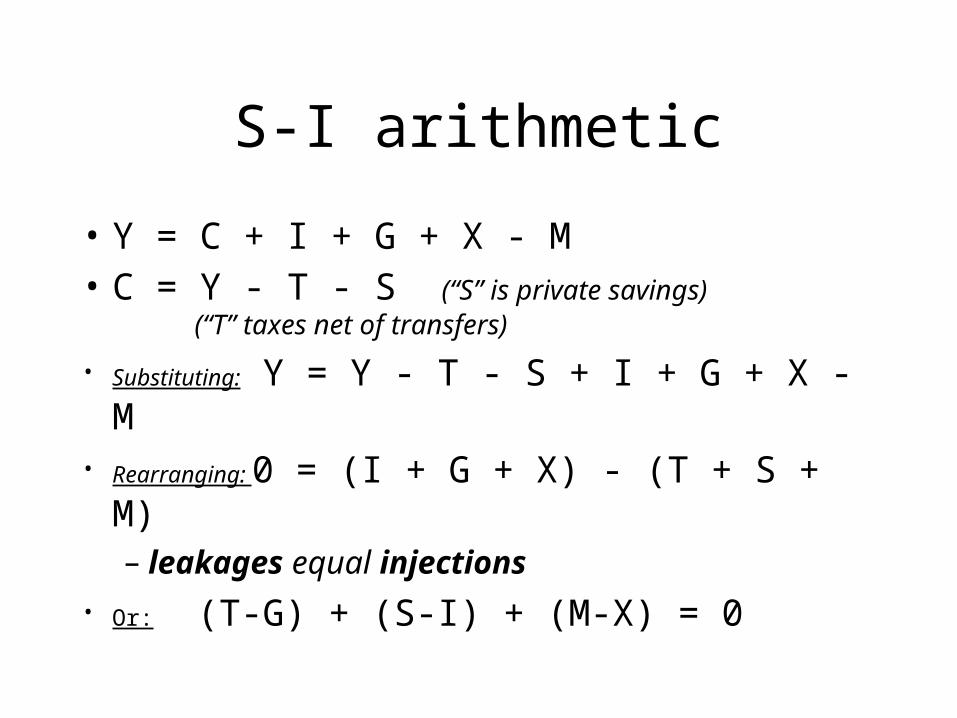
S-I arithmetic
• Y = C + I + G + X - M• C = Y - T - S (“S” is private savings)
(“T” taxes net of transfers)
• Substituting: Y = Y - T - S + I + G + X - M• Rearranging: 0 = (I + G + X) - (T + S + M)
– leakages equal injections
• Or: (T-G) + (S-I) + (M-X) = 0
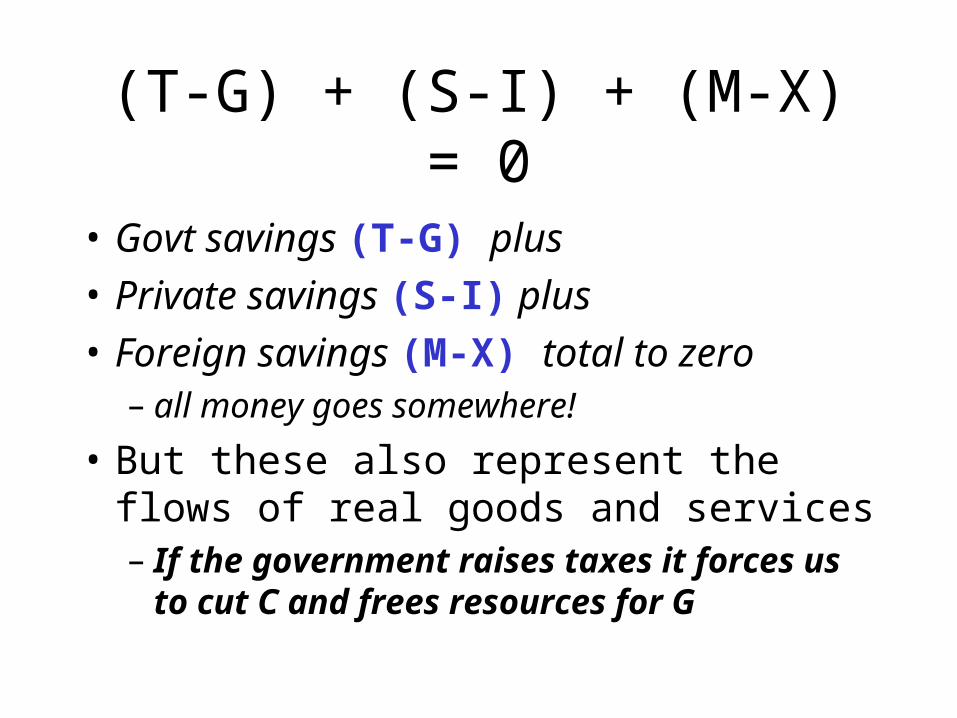
(T-G) + (S-I) + (M-X) = 0
• Govt savings (T-G) plus
• Private savings (S-I) plus
• Foreign savings (M-X) total to zero– all money goes somewhere!
• But these also represent the flows of real goods and services– If the government raises taxes it forces us to cut
C and frees resources for G

Case Study: 1980s US
• Initial change: Reagonomics– Lower taxes– Increase G (“Star Wars”), don’t cut elsewhere– Let transfers continue their increasing trend (rising health
care costs & an aging population)
• Despite “voodoo economics” claims during the primaries, this did increase budget deficits – the initial deficits were due to recession, not Reagan &
the Democratic Congress that passed his budget– remember “structural” vs “cyclical” deficits

Federal Deficits & Surpluses
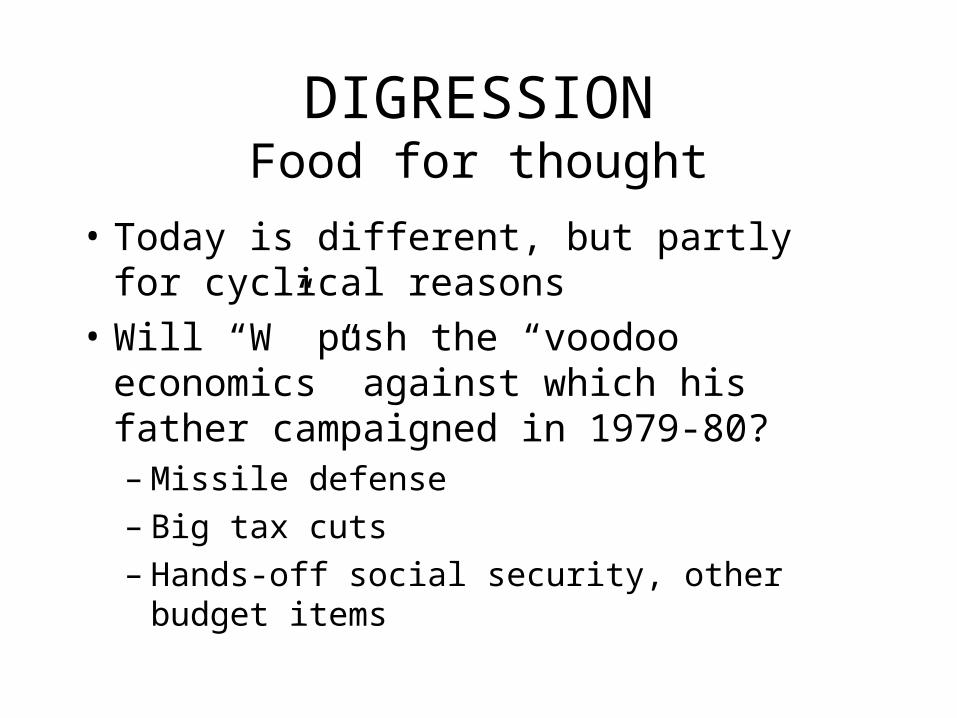
DIGRESSIONFood for thought
• Today is different, but partly for cyclical reasons
• Will “W” push the “voodoo economics” against which his father campaigned in 1979-80?– Missile defense– Big tax cuts– Hands-off social security, other budget items

The 1993 Turnaround
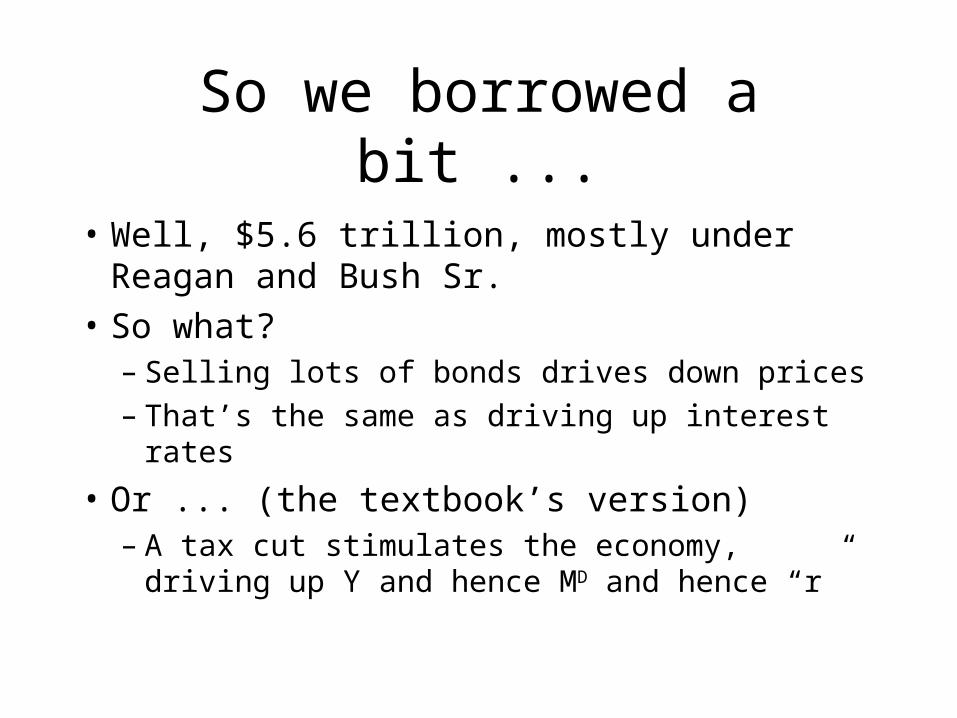
So we borrowed a bit ...
• Well, $5.6 trillion, mostly under Reagan and Bush Sr.
• So what?– Selling lots of bonds drives down prices– That’s the same as driving up interest rates
• Or ... (the textbook’s version)– A tax cut stimulates the economy, driving up Y
and hence MD and hence “r”
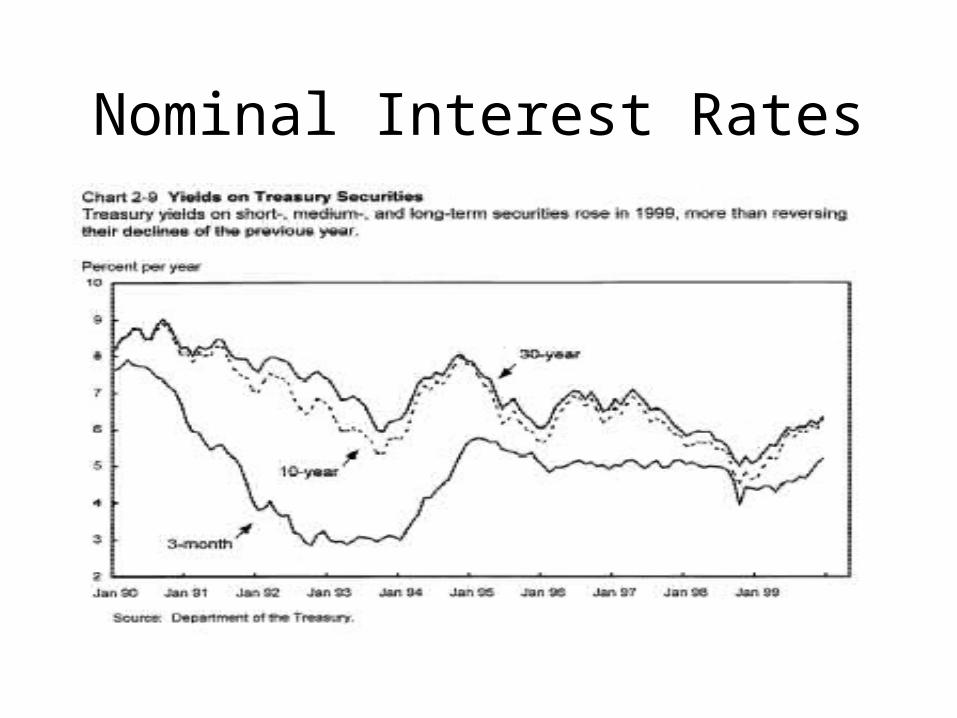
Nominal Interest Rates
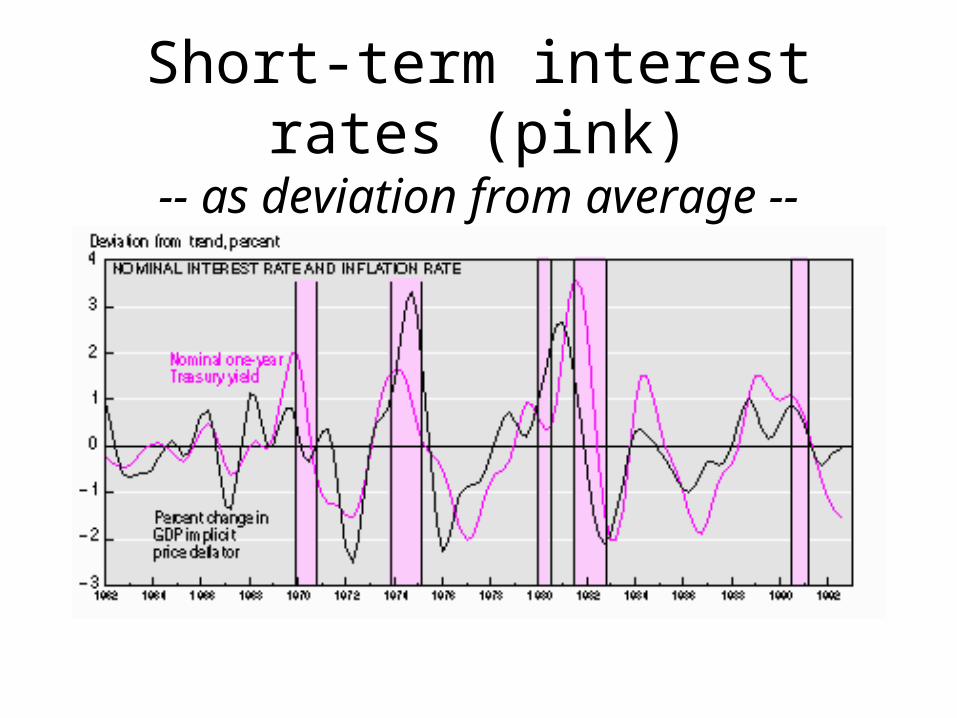
Short-term interest rates (pink)-- as deviation from average --
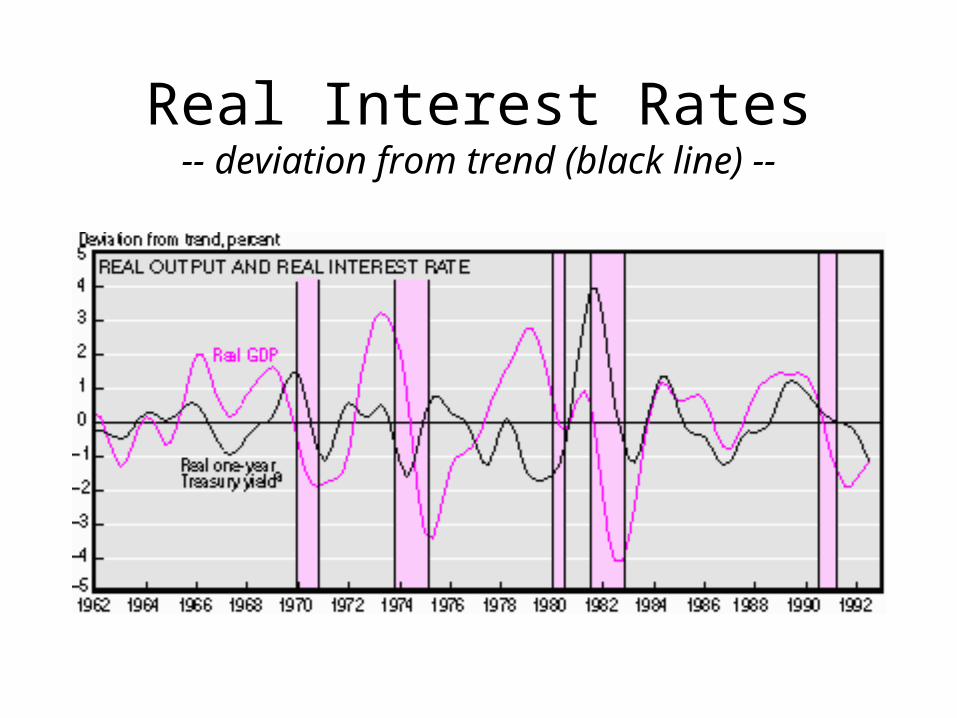
Real Interest Rates-- deviation from trend (black line) --
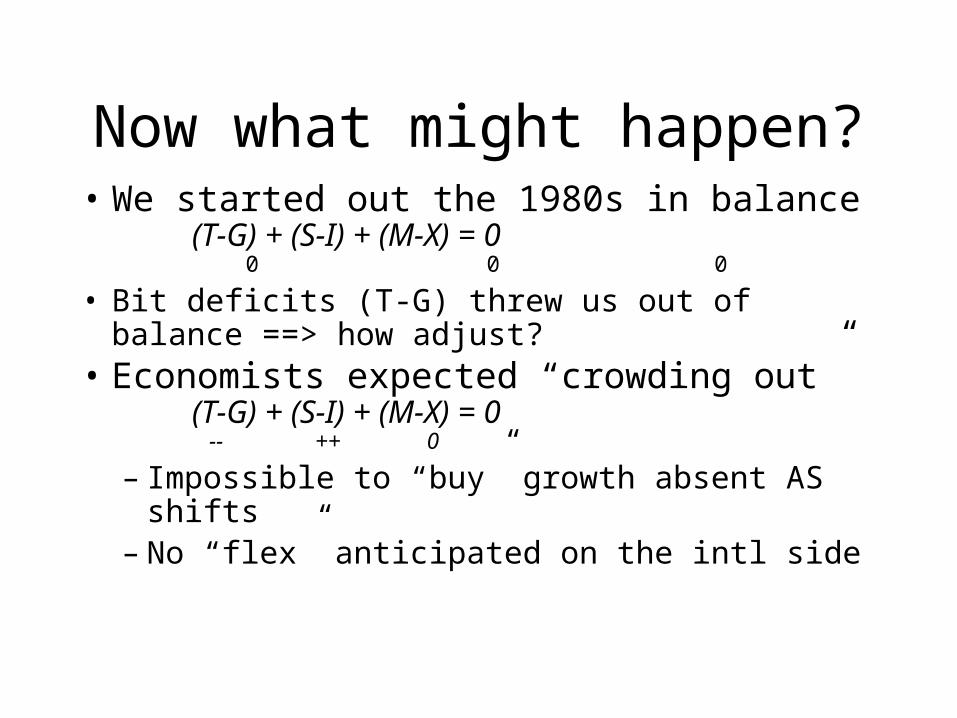
Now what might happen?• We started out the 1980s in balance
(T-G) + (S-I) + (M-X) = 0 0 0 0
• Bit deficits (T-G) threw us out of balance ==> how adjust?
• Economists expected “crowding out”(T-G) + (S-I) + (M-X) = 0
-- ++ 0
– Impossible to “buy” growth absent AS shifts– No “flex” anticipated on the intl side
But in fact ...
• Real interest rates rose
• Attracting foreign capital
• And if everyone buys US$ their price rises
• We ended up with a very strong dollar
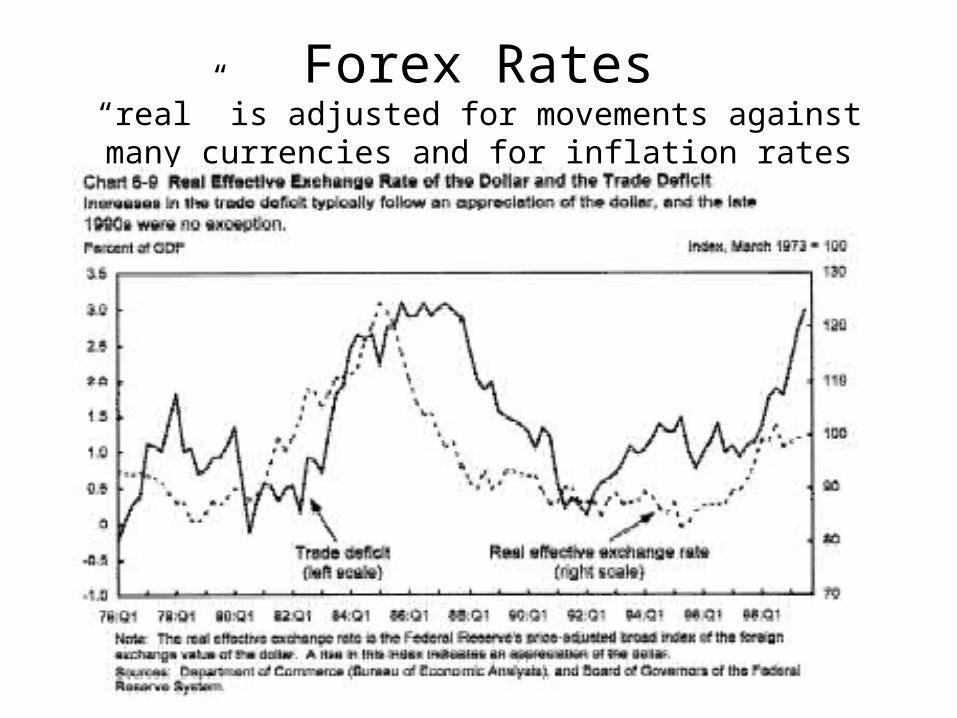
Forex Rates“real” is adjusted for movements against many currencies and
for inflation rates
Reflecting ...
• Large capital inflows
• The US went from being the world’s banker===>
• To the biggest customer of the world’s banks
• All during a period of just 8 years
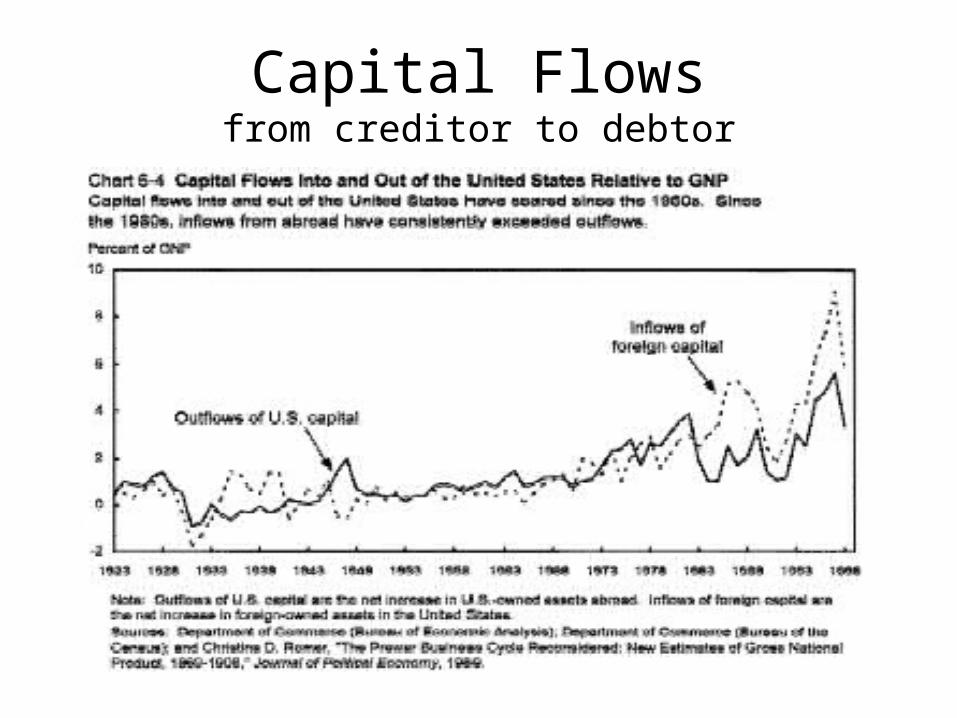
Capital Flowsfrom creditor to debtor
Money flows … and goods?
• The strong dollar made imports cheap
• US trade moved to big deficits
• These deficits however let us keep growing– If used for investment, future growth will let us
keep our creditors happy without tightening our belts
– If used for consumption…..– Which do you think is the case? (check data!)
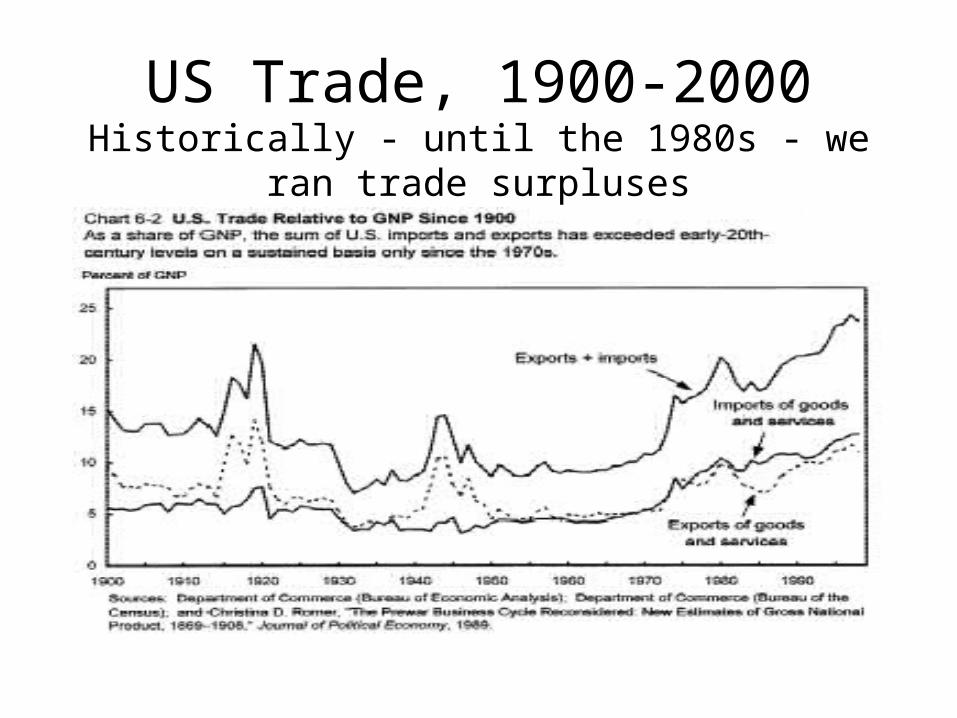
US Trade, 1900-2000Historically - until the 1980s - we ran trade surpluses
But others must adjust, too!
• If we “want” to run a deficit and borrow from abroad
• Others must “want” to run surpluses and lend overseas
• In fact, Japan and Germany both suffered from surplus savings– They avoided the paradox of thrift– We could have our cake (I) and eat it too (C)

International Savings (CA) Balances-- Europe and Japan offset the US --
Current Account Balance(Percent of GDP )
1977- 1980- 1983- 1986- 1989- 1979 1982 1985 1988 1991 1992 1993 1994 --------------------------------------------------------------U.S. -0.7 0.0 -2.3 -3.2 -1.2 -1.1 -1.6 -2.3
Japan 0.8 0.0 2.8 3.5 1.8 3.2 3.1 2.8
Germany 0.5 -0.5 1.7 4.3 2.2 -1.2 -0.8 -1.1
France 0.8 -1.2 -0.6 -0.2 -0.8 0.3 0.8 0.7
Italy 1.6 -2.2 -0.5 -0.2 -1.7 -2.3 1.2 1.3
U.K. 0.2 1.9 0.7 -1.6 -3.0 -1.7 -1.9 -0.1
Canada -1.9 -0.7 0.1 -2.3 -3.9 -4.0 -4.3 -3.3 kG10 average -0.2 -0.8 0.5 0.5 -0.3 -0.5 0.5 0.8
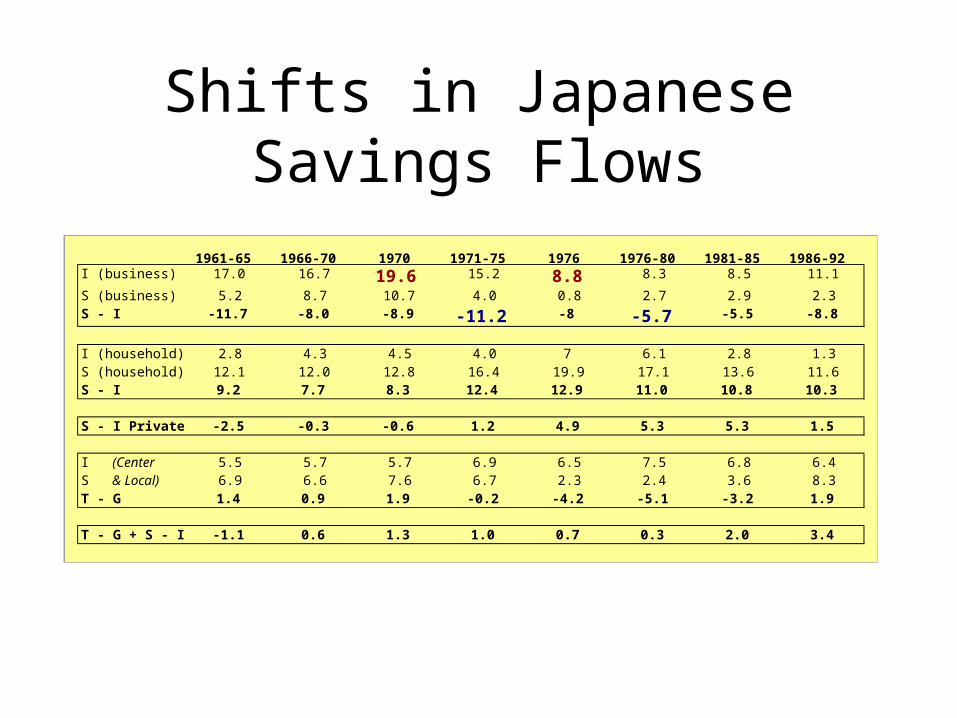
Shifts in Japanese Savings Flows
1961-65 1966-70 1970 1971-75 1976 1976-80 1981-85 1986-92I (business) 17.0 16.7 19.6 15.2 8.8 8.3 8.5 11.1
S (business) 5.2 8.7 10.7 4.0 0.8 2.7 2.9 2.3S - I -11.7 -8.0 -8.9 -11.2 -8 -5.7 -5.5 -8.8
I (household) 2.8 4.3 4.5 4.0 7 6.1 2.8 1.3S (household) 12.1 12.0 12.8 16.4 19.9 17.1 13.6 11.6S - I 9.2 7.7 8.3 12.4 12.9 11.0 10.8 10.3
S - I Private -2.5 -0.3 -0.6 1.2 4.9 5.3 5.3 1.5
I (Center 5.5 5.7 5.7 6.9 6.5 7.5 6.8 6.4S & Local) 6.9 6.6 7.6 6.7 2.3 2.4 3.6 8.3T - G 1.4 0.9 1.9 -0.2 -4.2 -5.1 -3.2 1.9
T - G + S - I -1.1 0.6 1.3 1.0 0.7 0.3 2.0 3.4
Swings in Japan were v. large- one source of savings for the US -
• Investment plummeted with the transition from high growth (postwar reconstruction, convergence with the US) to “normal” growth c. 1971-73
• But the Japanese were still poor and kept saving• So a potential “paradox of thrift” developed
– Keynesian budget deficits bailed them out 1975-81
– Exports to the US bailed them out from 1982-1986
– And a “bubble” during 1987-91
– But slow growth since then
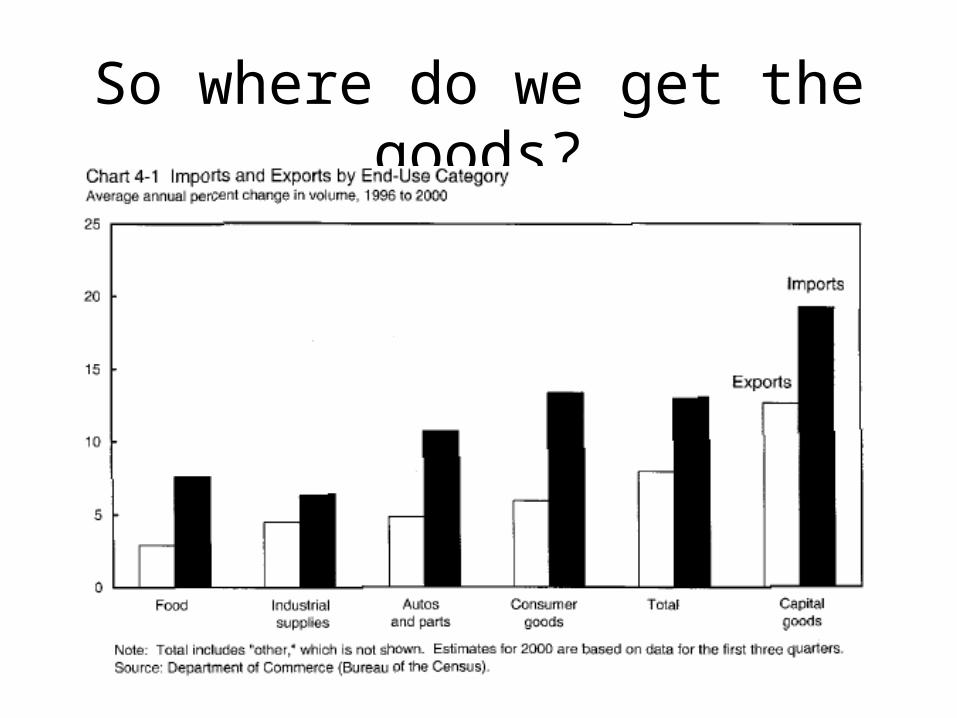
So where do we get the goods?
Macro, not micro!
• As the previous chart shows, we import everything!!
• Aggregate trade is a “macro” issue,not a micro one
• Indeed, developing countries’ experience suggests protectionism exacerbates deficits
• Intermediate goods imports dominate, and a small “burp” in trade thus kills all production
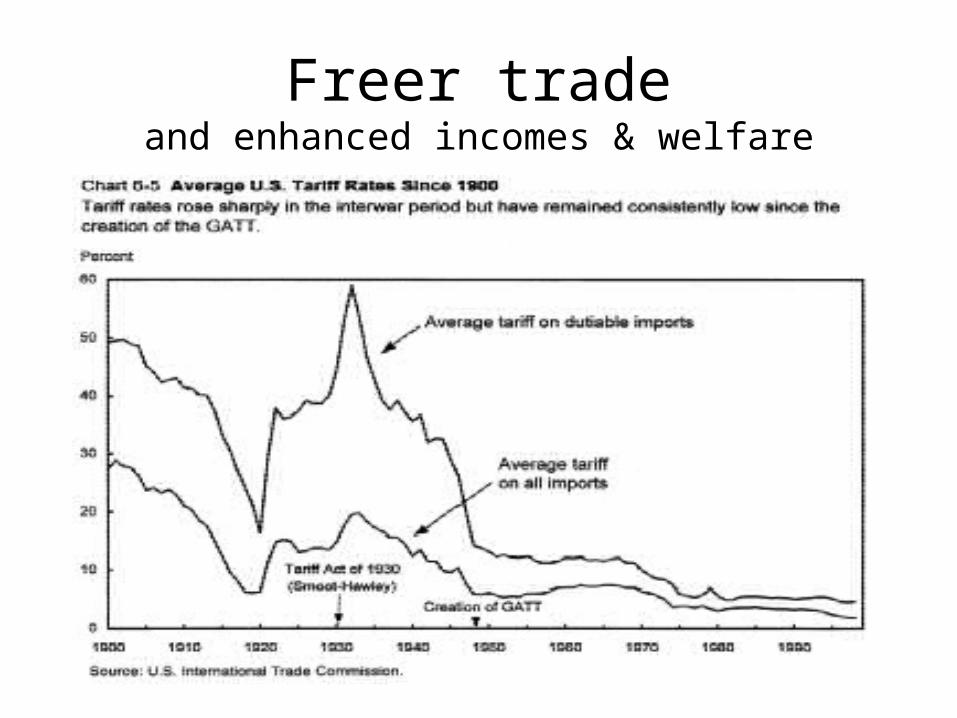
Freer tradeand enhanced incomes & welfare
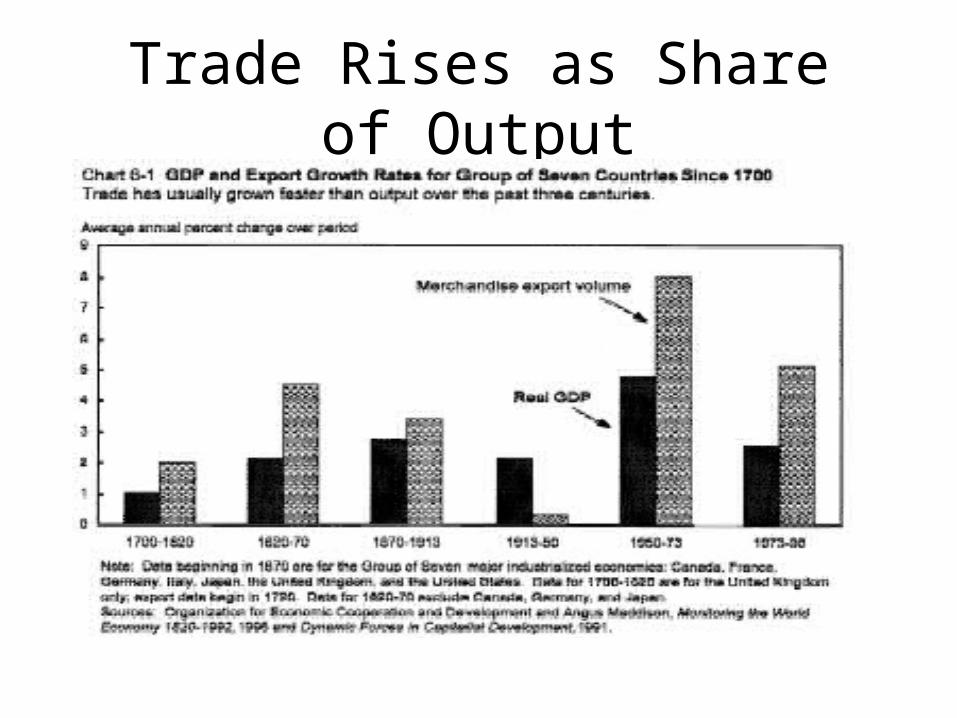
Trade Rises as Share of Output
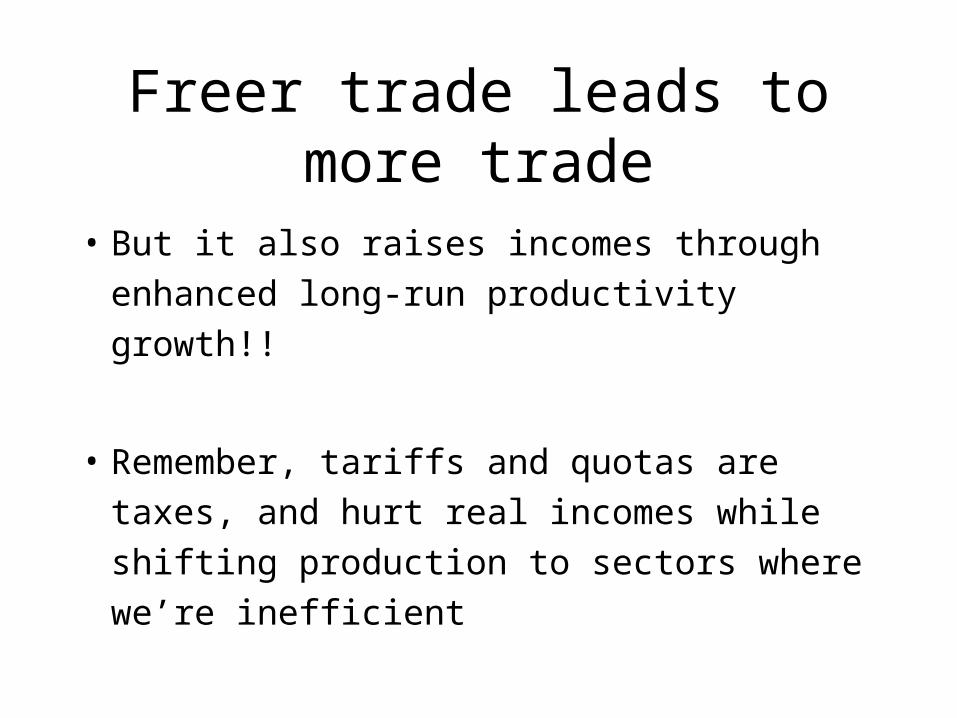
Freer trade leads to more trade
• But it also raises incomes through enhanced
long-run productivity growth!!
• Remember, tariffs and quotas are taxes, and
hurt real incomes while shifting production
to sectors where we’re inefficient
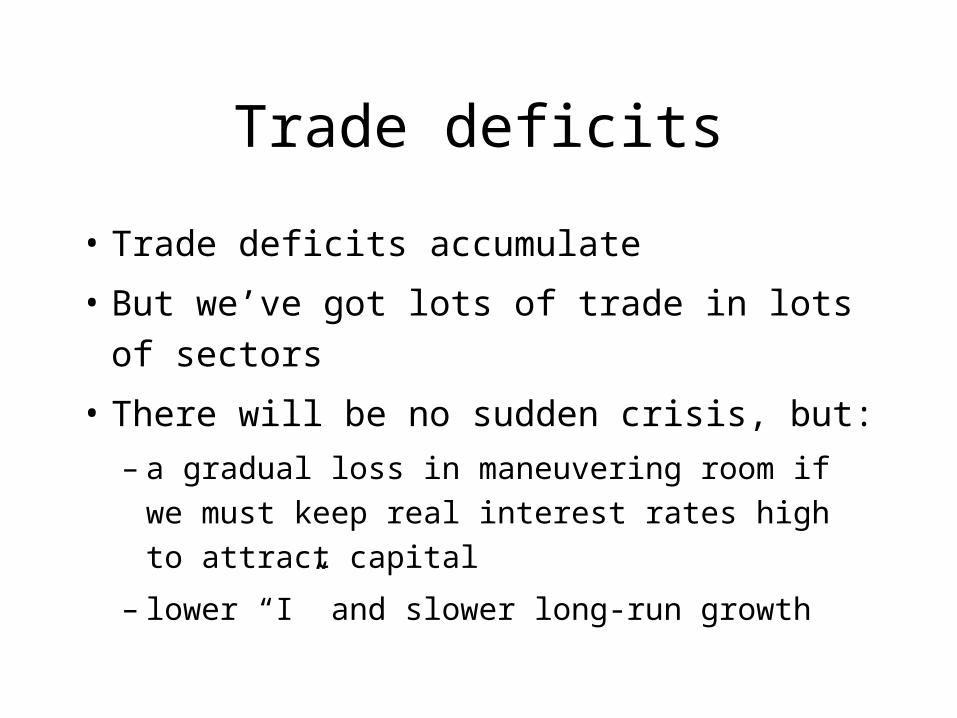
Trade deficits
• Trade deficits accumulate
• But we’ve got lots of trade in lots of sectors
• There will be no sudden crisis, but:
– a gradual loss in maneuvering room if we must
keep real interest rates high to attract capital
– lower “I” and slower long-run growth
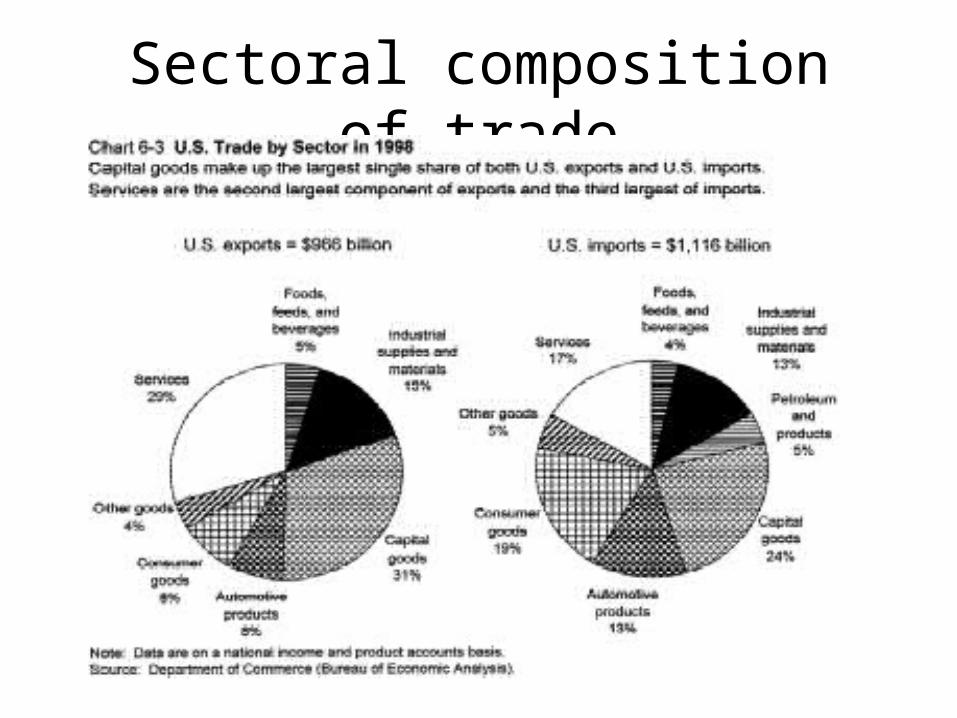
Sectoral composition of trade

The End
Economics 102
Prof. Smitka
Winter 2001
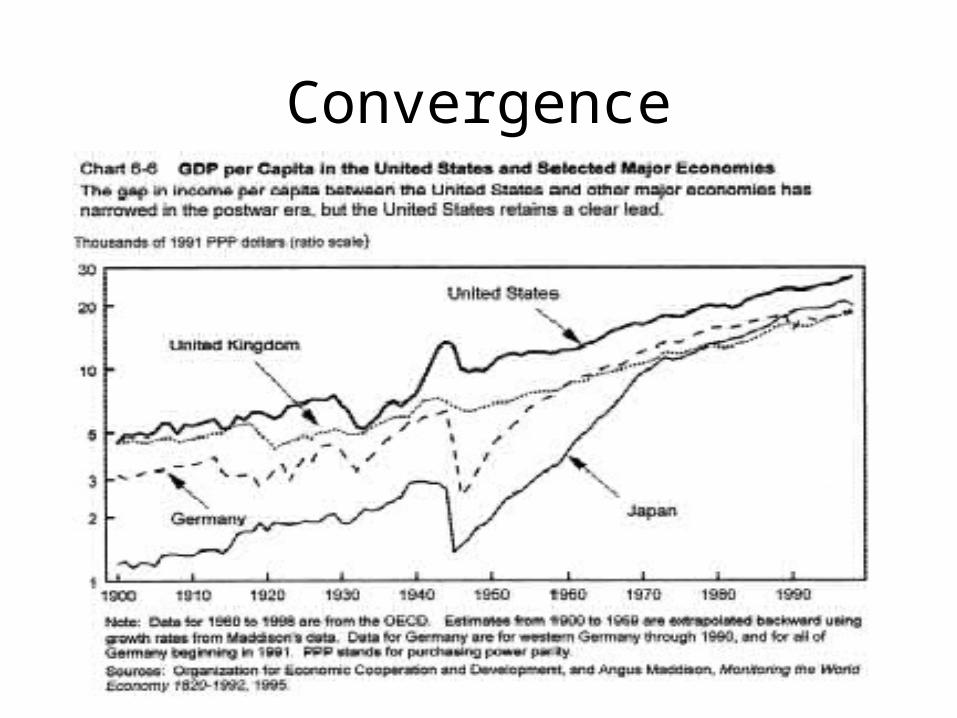
Convergence
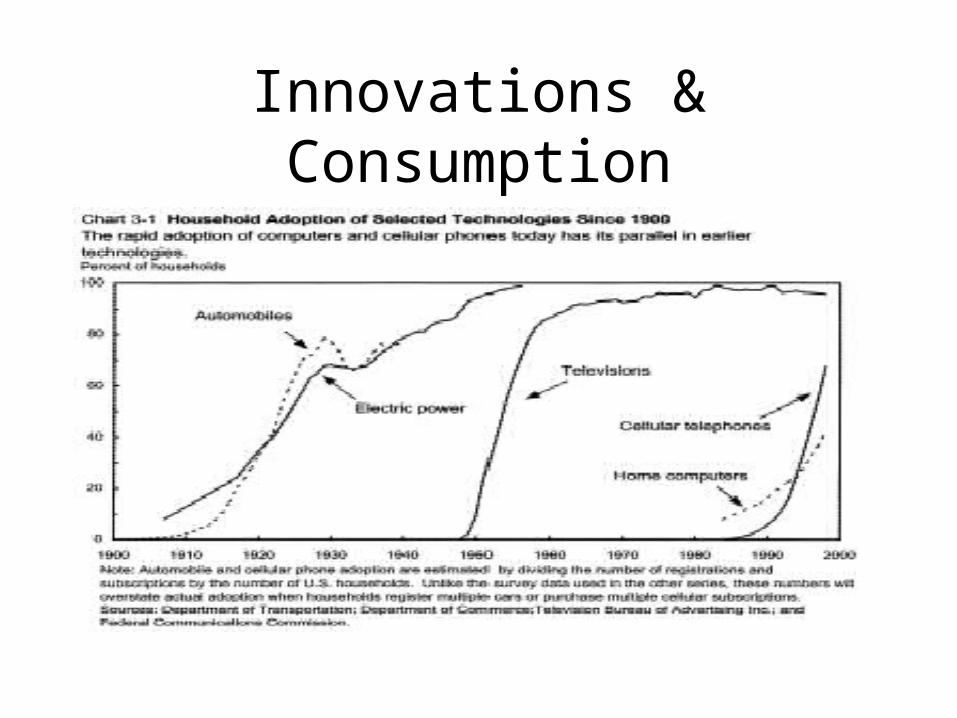
Innovations & Consumption