SAVING THE RAINFORESTS - Environmental … THE RAINFORESTS: CIVIL SOCIETY MAPPING A project for the...
28
SAVING THE RAINFORESTS: CIVIL SOCIETY MAPPING A project for the UK Environmental Funders Network Harriet Williams and Jon Cracknell MARCH 2010
-
Upload
vuongtuyen -
Category
Documents
-
view
214 -
download
1
Transcript of SAVING THE RAINFORESTS - Environmental … THE RAINFORESTS: CIVIL SOCIETY MAPPING A project for the...

SAVING THE RAINFORESTS: CIVIL SOCIETY MAPPING A project for the UK Environmental Funders Network
Harriet Williams and Jon Cracknell
mArch 2010
“Very inspiring. It is very useful to see clear
gaps and the ‘missing segments of the pie.’”
Pedro Tarak,
Representative, International Bridge
Building, Avina Foundation
“Fascinating and very useful material – a
great effort at beginning to disaggregate
the confusing world of forest related NGOs
out there, and show the range of different
perspectives and entry points of these
actors.”
Jeffrey Campbell,
Director of Grantmaking,
The Christensen Fund
“Provides a fascinating overview of the
different ‘pieces’ in the forest protection
puzzle. Could be a useful tool to aid blue-
sky thinking about new approaches to
tackling deforestation, and highlighting
vital elements of the policy landscape that
are under-represented by the NGO sector.”
Abigail Entwistle,
Director of Science,
Fauna & Flora International
“Although there is broad consensus on the
urgency of protecting tropical forests, and
the critical role of NGOs in the collective
effort, we actually know very little about
the non-profit landscape: what are the
specialisations, and who is doing what? This
mapping project is a terrific contribution
for funders who want to support work in
this area but are perplexed on where the
challenges and opportunities lie.”
Bernard Mercer,
Forests Philanthropy Action Network
“With so many different approaches
and roles among forest focused NGOs,
it is wonderful to have a useful map of
some of the players and approaches. The
presentation encourages strategic thinking
about many of the inputs needed for
increased impact, and how we are going to
get there.”
David Rothschild,
Senior Programme Officer,
Skoll Foundation
ABOuT THE AuTHORS AND THE EFN
Harriet Williams and Jon Cracknell work for the JMG Foundation, an environmental grant-making foundation supported by the family of the late Sir James Goldsmith.
Harriet joined the JMG Foundation in 2005. She previously worked as a journalist and has a MSc in Environmental Change and Management from the university of Oxford. Jon is director of the JMG Foundation, and has worked on environmental issues since 1992.
Jon co-ordinates the Environmental Funders Network (www.greenfunders.org) on a part-time basis. The EFN was set up in July 2003 to provide a networking mechanism for staff and trustees of environmental grant-making organisations in the uK and other European countries. More than 85 trusts and foundations have participated inEFN events.
The Network does not, collectively, have any capacity to assess applications for grants.PLEASE DO NOT SEND FuNDING REQuESTS TO THE EFN WEBSITE AS WE CANNOT RESPOND TO THEM.
To enquire about the work of the EFN, or to make comments on this report, please contact [email protected]
P L E A S E R E A D T H I S R E P O R T A L O N G S I D E T H E A C C O M PA N Y I N G F O R E S T S _ M A P. P D F
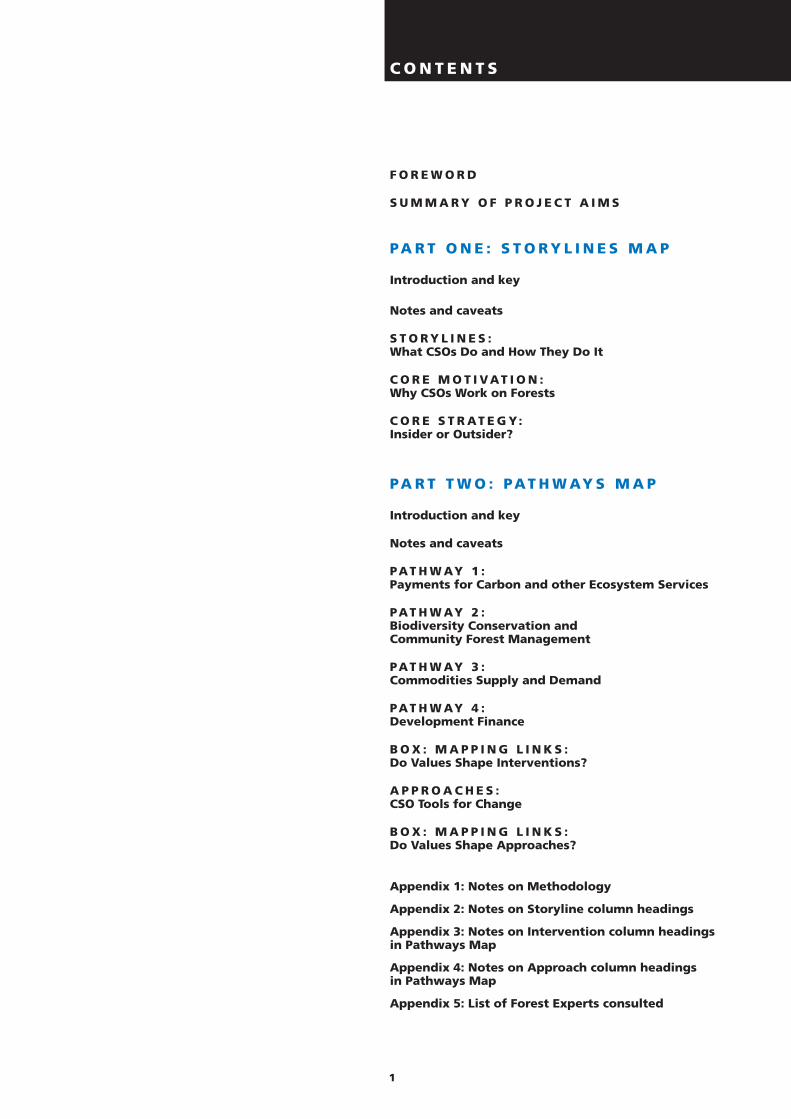
C O N T E N T S
F O R E W O R D
S u M M A R Y O F P R O J E C T A I M S
PA R T O N E : S T O R Y L I N E S M A P
Introduction and key
Notes and caveats
S T O R Y L I N E S : What CSOs Do and How They Do It
C O R E M O T I VAT I O N : Why CSOs Work on Forests
C O R E S T R AT E G Y: Insider or Outsider?
PA R T T W O : PAT H W AY S M A P
Introduction and key
Notes and caveats
PAT H W AY 1 : Payments for Carbon and other Ecosystem Services
PAT H W AY 2 : Biodiversity Conservation and Community Forest Management
PAT H W AY 3 : Commodities Supply and Demand
PAT H W AY 4 : Development Finance
B O X : M A P P I N G L I N K S : Do Values Shape Interventions?
A P P R O A C H E S :CSO Tools for Change
B O X : M A P P I N G L I N K S : Do Values Shape Approaches?
Appendix 1: Notes on Methodology
Appendix 2: Notes on Storyline column headings
Appendix 3: Notes on Intervention column headings in Pathways Map
Appendix 4: Notes on Approach column headings in Pathways Map
Appendix 5: List of Forest Experts consulted
1
S AV I N G T H E R A I N F O R E S T S : C I V I L S O C I E T Y M A P P I N G
2
F O R E W O R D
It is widely understood that the clearance of tropical forests has catastrophic impacts both in terms of biodiversity and global climate systems. After several decades of largely unsuccessful attempts to curb deforestation it is also clear that tackling these negative impacts is no easy task.
Every few years the issue rises up the international agenda, leading to a concerted push to save the rainforest, involving governments, UN agencies, businesses, investors and civil society.
The latest of these efforts is coming of age via the REDD (Reducing Emissions from Deforestation and Degradation) process, which introduces the concept of payments for carbon stored within trees, thus connecting the climate change and forest conservation agendas.
When we started scoping out a grants strategy on tropical deforestation in early 2008, we were struck by the diversity of opinion on how best to protect forests. It became clear there are no ‘silver bullet’ solutions. Rather, multiple approaches are being pursued simultaneously. The sense is of a complex machine with many turning parts, including policy, market and social solutions.
We were also struck by the force with which differing views were held. Some parts of civil society seemed convinced that REDD is the answer, others that the forests will continue to fall, carbon payments or not, unless additional action is taken on the underlying drivers of deforestation.
As a funder we were being asked to judge between a number of perspectives – which were sometimes
in conflict – without the benefit of a framework for comparing them.
The mapping project was developed by the JMG Foundation and fellow forest funders as a way of creating this framework, an attempt to sketch out the big picture and start to identify gaps in capacity.
The maps have been several months in the making, and we would like to thank everyone who has helped bring the project this far. This includes the forest experts within civil society, academia and philanthropy, who provided invaluable feedback on the project methodology. We would like to extend special thanks to the Waterloo Foundation and the Schroder Foundation for providing financial support.
Deforestation is a complex issue, and it is not possible to capture all the nuances of civil society in a single mapping project. We recognise there is scope for improving these tools, and our hope is that the maps will serve as a living resource.
One commentator responded that the maps “help to ask the right questions”. In an area where everyone, and no one, seems to have all the answers, we see this as a good start.
We welcome all feedback on the project, and would be delighted to hear from anyone else with an interest in mapping environmental problems and their solutions.
Harriet Williams and Jon Cracknell, March 2010
S AV I N G T H E R A I N F O R E S T S : C I V I L S O C I E T Y M A P P I N G
3
S u M M A R Y O F P R O J E C T A I M S
There are numerous strategies for reducing tropical deforestation. This project aims to identify major pathways to forest protection, and to map the capacity associated with each one among civil society.
The project was principally conceived as a tool for grantmakers, but we hope it will be of wider interest as well.
Besides looking at what individual Civil Society Organisations (CSOs) do, the project asks why they do it, unpacking the value sets that motivate different groups of CSOs, and their modus operandi.
Why are these things relevant to grantmaking strategy? First and foremost, the maps are designed to help funders make informed choices between different approaches, and bring their own values and theories of change to bear on these choices. They can be thought of as a rough guide to avoided deforestation, and we hope they will help readers to home in on strategies that appeal to them.
Grantmakers and the world at large tend to hear more about some solutions to deforestation than others. Unless funders have time to gain specialist knowledge and to be very proactive in their outreach, there is a risk that promising approaches may get overlooked.
By teasing out some of the complexity of avoided deforestation, and laying different approaches side by side, the maps help readers to locate individual strategies within the bigger picture.
Notes on CSO list and classification
The project profiles 65 CSO groups headquartered in Europe, North America and Australia, all working to curb deforestation in the humid tropics. The CSOs are nearly all environmental groups, with the exception of a couple of development charities.
The final sample is representative of forests CSOs in the developed world. It does not include the many national and local CSOs based in forest nations themselves.
Early on, it was decided to make one person responsible for classifying all CSOs in the interests of consistency. Thus the CSO classification represents that person’s (best) judgement, rather than self-reporting by CSOs.
A group of forests experts, from academia, philanthropy and civil society was consulted throughout the project in order to determine which groups should be included in the CSO list, to develop the mapping categories, and to refine the CSO classification (see Appendix 5 for a list of names).
The maps are not intended as a ‘shopping list’ of which CSOs to support, and anyone interested in a specific approach to deforestation will need to explore CSO capacity beyond these grids.
Please see Appendix 1 for more notes on methodology.

S AV I N G T H E R A I N F O R E S T S : C I V I L S O C I E T Y M A P P I N G
4
Introduction and key
The following commentary refers to Part One of the accompanying Forest_Maps.pdf and the two documents should be read together. The Storylines Map presents an overview of the forests CSO movement. It looks at what organisations do and why, classifying groups according to their core motivations, core strategy and primary functions.
In this grid the forests movement is categorised using nine ‘storylines’ that capture the different organisational cultures of CSOs working in this space. Each relates to a distinct role within the overall CSO community, similar to niches in an ecosystem. The storyline headings are intended to provide a few simple entry points into the complex world of forest conservation. See Appendix 2 for additional explanation of each heading.
Sixty-three CSOs are listed down the left hand axis of the grid1. A single sphere • is used to indicate a CSO’s presence in each column.
The total number of spheres in each column is an approximate indicator of civil society capacity associated with different motivations, strategies and storylines, bearing in mind the caveats throughout this text.
The Storylines and Pathways Maps (see Part 2) are complementary, each giving a different perspective
on the forests CSO movement. The Storylines Map provides context for the Pathways Map, helping readers to ‘ground’ specific interventions within a set of broader organisational roles and values. These connections are explored more in the ‘Mapping Links’ boxes in Part 2 of this report.
Notes and caveats
Mapping even a sub-sector of the overall environmental movement is a difficult exercise, and we are open about the challenges involved. We don’t believe that these caveats detract from the value of the exercise, nor from the need to undertake more mapping of this kind in the future. As a broad brush analysis, the storylines do not capture the nuances of every CSO. To enable meaningful comparison, the number of storylines to which each CSO can be assigned has been capped at three. In some cases this is more than adequate. In others it belies the complexity of CSO activities, particularly in large organisations that fulfil several roles simultaneously.
Storyline headings are relatively permanent. Individual CSOs generally stick with ‘their’ storylines and do not switch to others over time.
See also notes and caveats for Pathways Map (Part 2).
1 The development groups included in the full list of 65 cSOs were taken out of this analysis
PA R T 1 : S T O R Y L I N E S M A P

S AV I N G T H E R A I N F O R E S T S : C I V I L S O C I E T Y M A P P I N G
5
Comment
On average, each CSO was assigned to two storylines. The distribution of CSOs among the storylines is shown in the graph below.
The most popular storylines are ‘Institution Watchers’, referring to groups that monitor the integrity of forest governance; and ‘Knowledge Builders’, groups which research and define tools for forest conservation (for a more complete explanation of the storyline headings see Appendix 2).
‘Critical Friends’, groups which collaborate with business and government, are also well-represented – there are more CSOs working in this storyline than as ‘Brand Attackers’, the name given to groups that publicly expose corporate bad practice and campaign for change.
Some correlation can be surmised between the type of organisation and the storylines it tends to operate in. For instance, ‘Parks Rangers’ are usually large conservation groups engaged in forest management. These organisations are typically found in the ‘Critical Friends’ storyline too, whilst out-and-out campaigning organisations are more likely to be ‘Brand Attackers’.
The maps do not contain data on CSO income or staff numbers, but it is safe to say that some storylines are associated with a much larger resource base than others. Although there are nearly equal numbers of ‘Critical Friends’ as there are ‘Peoples Heroes’ (groups that focus on protecting the rights and interests of forest peoples) the former tend to be much larger organisations in terms of budgets and staffing.
S T O R Y L I N E S : W H AT C S O S D O A N D H O W T H E Y D O I T (see orange column headings, p1 of Forest_maps.pdf)
Knowledge Builders
Peoples Heroes
Institution Watchers
Finance Pioneers
Standard Setters
Parks Rangers
Brand Attackers
Critical friends
Consumer Guides
0 5 10 15 20 25
S AV I N G T H E R A I N F O R E S T S : C I V I L S O C I E T Y M A P P I N G
6
Comment
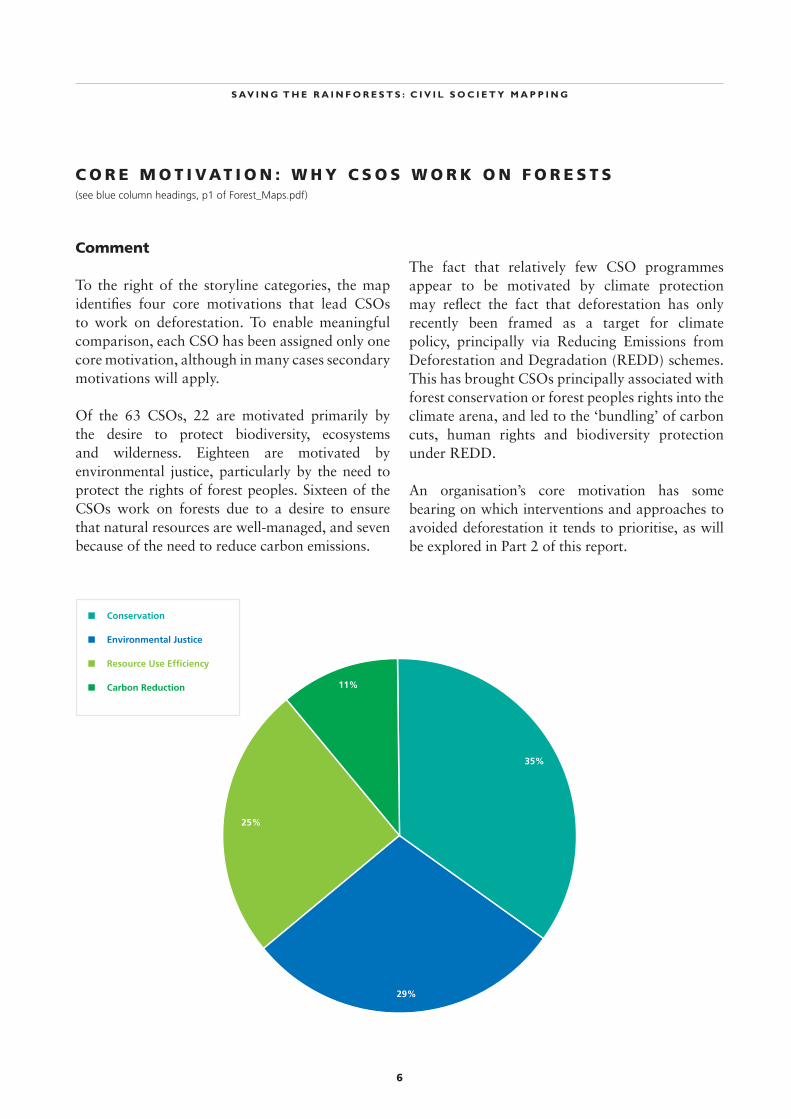
To the right of the storyline categories, the map identifies four core motivations that lead CSOs to work on deforestation. To enable meaningful comparison, each CSO has been assigned only one core motivation, although in many cases secondary motivations will apply.
Of the 63 CSOs, 22 are motivated primarily by the desire to protect biodiversity, ecosystems and wilderness. Eighteen are motivated by environmental justice, particularly by the need to protect the rights of forest peoples. Sixteen of the CSOs work on forests due to a desire to ensure that natural resources are well-managed, and seven because of the need to reduce carbon emissions.
The fact that relatively few CSO programmes appear to be motivated by climate protection may reflect the fact that deforestation has only recently been framed as a target for climate policy, principally via Reducing Emissions from Deforestation and Degradation (REDD) schemes. This has brought CSOs principally associated with forest conservation or forest peoples rights into the climate arena, and led to the ‘bundling’ of carbon cuts, human rights and biodiversity protection under REDD.
An organisation’s core motivation has some bearing on which interventions and approaches to avoided deforestation it tends to prioritise, as will be explored in Part 2 of this report.
C O R E M O T I VAT I O N : W H Y C S O S W O R K O N F O R E S T S (see blue column headings, p1 of Forest_maps.pdf)
29%
n Conservation
n Environmental Justice
n Resource Use Efficiency
n Carbon Reduction 11%
35%
25%
S AV I N G T H E R A I N F O R E S T S : C I V I L S O C I E T Y M A P P I N G
7
n Insiders
n Outsiders
59%
41%
Comment
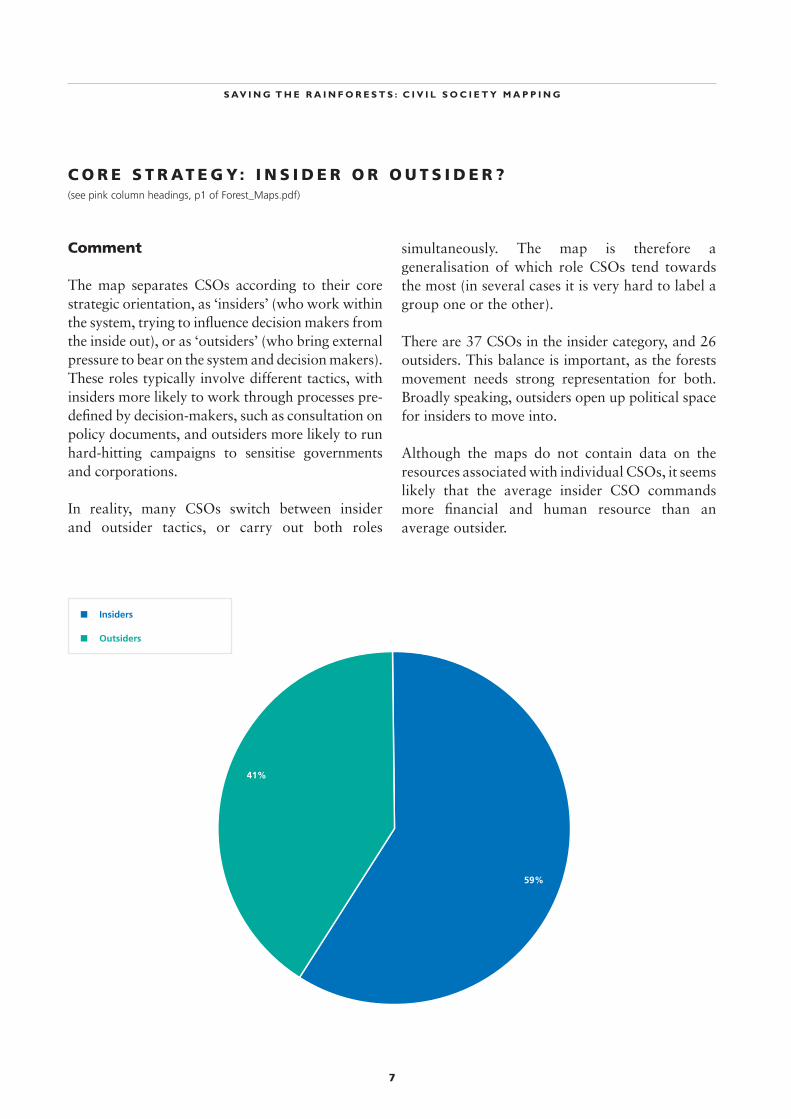
The map separates CSOs according to their core strategic orientation, as ‘insiders’ (who work within the system, trying to influence decision makers from the inside out), or as ‘outsiders’ (who bring external pressure to bear on the system and decision makers). These roles typically involve different tactics, with insiders more likely to work through processes pre-defined by decision-makers, such as consultation on policy documents, and outsiders more likely to run hard-hitting campaigns to sensitise governments and corporations.
In reality, many CSOs switch between insider and outsider tactics, or carry out both roles
simultaneously. The map is therefore a generalisation of which role CSOs tend towards the most (in several cases it is very hard to label a group one or the other).
There are 37 CSOs in the insider category, and 26 outsiders. This balance is important, as the forests movement needs strong representation for both. Broadly speaking, outsiders open up political space for insiders to move into.
Although the maps do not contain data on the resources associated with individual CSOs, it seems likely that the average insider CSO commands more financial and human resource than an average outsider.
C O R E S T R AT E G Y: I N S I D E R O R O u T S I D E R ? (see pink column headings, p1 of Forest_maps.pdf)
S AV I N G T H E R A I N F O R E S T S : C I V I L S O C I E T Y M A P P I N G
8
Introduction and key
The following commentary refers to Part Two of the accompanying Forests_Map.pdf and the two documents should be read together. While the Storylines Map takes a top-level view of the CSO community, the Pathways Map zooms in to focus on the day-to-day interventions that each group prioritises. The Map comprises four spreadsheets, each describing a different theory, or pathway, of change. These are:
The pathway sheets contain pink and green column headings. The pink columns describe ‘Interventions’ – processes, institutions and trends which CSOs may seek to direct or intervene within. These relate to
policy and government, to finance and investment, market and business, and to forest communities. Green columns describe CSO ‘Approaches’ – the way they go about working on the set of interventions described along each pathway.
Additional explanation of each intervention and approach heading is contained in Appendix 3.
The 65 CSOs are listed down the left hand axis of the grid. The number of spheres in each cell indicate the level of engagement of a CSO in a given intervention or approach, from • for low level engagement, to ••• for strong engagement.
The total number of spheres in each column is an approximate indicator of civil society capacity associated with different interventions, bearing in mind the caveats throughout this text.
The grid also flags up areas of significant disagreement among CSOs; forest carbon trading (Pathway 1), biofuels (Pathway 3), and methods used to engage large corporations (Pathway 4) among them. These are important faultlines to be aware of, and are indicated with orange column headings in the grid. The faultlines relate back to the underlying differences in organisational values described in the Storylines Map. The position taken by CSOs on all interventions is moderated by these storylines.
The chart opposite summarises total CSO capacity recorded in each pathway, by adding up the numbers of spheres in the Intervention columns.
Carbon payments (Pathway 1) are the area of greatest activity for forests CSOs, which have responded rapidly to this fast-moving policy area – a few years ago this intervention category would barely have been in existence. Conservation and community forest management (Pathway 2) and commodities supply and demand (Pathway 3) are
PA R T 2 : PAT H W AY S M A P
PATHWAY 1: Payments for carbon and other
ecosystem services
Theory of change: “Deforestation will decrease if nations are able to
earn income from living trees”
PATHWAY 2: Biodiversity Conservation and Community
Forest Management
Theory of change: “Deforestation will decrease through protecting
areas of high biodiversity value, and by aligning the economic
interests of local communities with forest conservation”
PATHWAY 3: Commodities Supply and Demand
Theory of change: “Deforestation will decrease if investors,
shareholders, trading partners and consumers demand supply chain
reform”
PATHWAY 4: Development Finance
Theory of change: “Deforestation will decrease if environmental
and social impacts are worked into assessments of large-scale
infrastructure projects”
PATHWAY 5: A fifth pathway relates to Rights and
Governance. The question of who controls forest resources and
how they are managed underpins all the other pathways. For this
reason, rights and Governance issues are interwoven across other
pathways (indicated as blue columns).

S AV I N G T H E R A I N F O R E S T S : C I V I L S O C I E T Y M A P P I N G
9
n PW1: Carbon Payments
n PW2: Conservation and Community Management
n PW3: Commodities Supply
n PW4: Development Finance19%
30%
24%
27%
Notes and caveats
Capacity is not necessarily an indication of effectiveness. The presence of large amounts of CSO effort around a specific intervention/approach does not necessarily indicate high potential for achieving change. Equally the absence of effort does not indicate an intervention/approach is a non-starter (or conversely, a ‘gap’ in need of filling). Readers are invited to draw their own conclusions on whether interventions are under-resourced or over-resourced, with regard to their potential for delivering change.
Level of engagement is a judgement of how effort is apportioned within the forests programme of each CSO. It does not reflect the resources associated with this effort – for instance, a high level of engagement from a large CSO might entail a dedicated staff team with a substantial budget, but much less for a small CSO.
associated with similar levels of activity, although more financial resources are likely to be associated with interventions under Pathway 2.
Development and project finance (Pathway 4) has the least capacity of the pathways to change presented here. It finishes well behind Pathway 1, although the amounts of money proposed for forest carbon payments are smaller than the sums associated with developing new industrial, energy and agricultural infrastructure in forested countries. Arguably, the good work done by carbon payments could be undermined unless project finance is reformed to take better account of environmental sustainability.
Capacity in Pathway 4 has probably shrunk in recent years, following a peak in civil society mobilisation around trade and other issues associated with globalisation in the early 2000s.

S AV I N G T H E R A I N F O R E S T S : C I V I L S O C I E T Y M A P P I N G
10
evolving, so the range of possible interventions can be expected to change over time. Equally, the intervention headings are not an exhaustive list of every possible action that could be taken under each pathway to change.
CSO positions are nuanced and subject to change. It is not possible to draw out every subtlety in a simple grid.
Interventions are not directly comparable. For instance, one CSO may try to save orangutans by re-homing individual animals. Another might do it indirectly, by reforming palm oil supply chains. Which intervention is the more ‘effective’ depends on your value system, timeframe and attitude to risk, among other variables.
Intervention headings are not fixed in time. The dynamics of deforestation are constantly

S AV I N G T H E R A I N F O R E S T S : C I V I L S O C I E T Y M A P P I N G
11
Comment
Out of the 65 CSOs, 51 are engaged in this pathway to some extent. The greatest concentration of CSO effort relates to the overall structure of REDD (Reducing Emissions from Deforestation and Degradation) agreements.
Within this overarching concern, CSOs specialise in one or more aspect of REDD agreements. A lot of attention is paid to World Bank funds that are being used to pilot REDD projects, but less to other sources of forest funds (although it was difficult to assess CSO capacity in this column).
A number of CSOs are working to make REDD agreements consistent with international law on biodiversity and/or on human rights, with conservation groups prevailing on the former and forest peoples groups on the latter.
Nearly half of the 65 CSOs work on land rights and quality of governance, questions of who controls REDD schemes, and how benefits are shared and how processes are managed. Of these, eight are classified as placing maximum priority on this intervention. These tend to be groups strongly concerned with forest peoples rights (e.g. Forest Peoples Programme) and groups that specialise in sustainable management of natural resources (e.g. World Resources Institute).
The CSO community is sharply divided on the issue of forest carbon trading and offsets. Fourteen groups are shown as being in support of rapidly integrating REDD credits into carbon markets (these tend to be large conservation CSOs), with 20 groups against, and nine conditionally in favour, as long as rigorous environmental and social safeguards are in place.
None of the eight CSOs strongly engaged on land rights and governance are in favour of rapidly creating a market for REDD credits (whereby developed nations can offset their own emissions targets).
Another 14 CSOs are working on payments for non-carbon ecological services. This is likely to be an area of increasing activity in the future, as efforts are made to quantify and price the role of forests in protecting soil, water tables and biodiversity.
Nine CSOs work directly on developing standards and certification for forest carbon credits. Of these, two thirds strongly prioritise this intervention among their work in this pathway. This includes groups which specialise in designing such schemes (e.g. Rainforest Alliance), and groups that have developed their own ‘in-house’ schemes (e.g. Conservation International).
PAT H W AY 1: Payments For Carbon And Other Ecosystem Services (p2 of Forest_maps.pdf)
S AV I N G T H E R A I N F O R E S T S : C I V I L S O C I E T Y M A P P I N G
12
Comment
Only 37 out of the 65 CSOs are engaged in this pathway, making it the least populated in terms of CSO numbers. However, the resources associated with their effort are likely to be substantial, as the pathway involves a lot of practical forest management (for instance managing protected areas and community-led conservation schemes), which is relatively capital and time-intensive.
The greatest concentrations of CSO effort relate to rights and governance issues: strengthening the institutions involved in forest management, and clarifying community rights. This reflects the trend for conservation programmes to bring forest communities into the heart of their activities.
Of the 65 groups, 20 are involved in some way in the management of protected areas and national parks, and 22 in community conservation, where the focus is on decision-making by local communities leading to the growth of ‘bottom-
up’ incentives for conservation. Many groups are active in both issues.
A further 18 groups are involved in innovative conservation finance – generating new revenues for conservation from the public or private sector (separate to REDD payments), for instance via debt-for-nature swaps.
Groups involved in developing or monitoring standards for certifying ‘forest friendly’ products and services are broadly the same as the groups involved in certification in Pathways 1 and 3.
Work focused on local communities tends to relate to developing sustainable, secure income sources. Less civil society capacity is associated with the broader needs of forest communities. Fourteen groups work directly on sustainable sources of fuel, food and fibre, and 12 on adaptation to environmental change. These issues are not a top priority for any group, although elements of them may be embedded in other intervention categories.
PAT H W AY 2: Biodiversity Conservation and Community Forest Management (p3 of Forest_maps.pdf)

S AV I N G T H E R A I N F O R E S T S : C I V I L S O C I E T Y M A P P I N G
13
Comment
Out of the 65 CSOs, 55 are engaged in this pathway to some extent, the largest number for any pathway. All of these work directly on one or more forest commodities, around half of them approaching the issue from a perspective of strengthening land rights and quality of governance.
More CSO capacity is associated with some commodities than others. The reform of industrial logging receives the most attention, closely followed by efforts to combat illegal logging. Fifteen groups strongly prioritise one or more timber interventions in their work.
Less capacity is associated with the production of agricultural commodities. Of these palm oil has the most associated CSO capacity, followed by soya production, with cattle ranching trailing in last. Relatively few CSOs focus directly on the trade and agricultural policies that fuel demand for commodities from deforested land.
Whereas the timber trade offers many policy opportunities (such as programmes of governance
reform, or trade restrictions on illegal timber), regulation of other commodities associated with deforestation is primarily driven by the market. This has led to a raft of industry ‘roundtables’ designed to agree sustainable standards for commodity production.
Roundtables are proving controversial within the CSO community. Of the 24 CSOs working on product certification, 15 tend to speak out against what they perceive as weak or poorly enforced standards. This can create tensions with a further nine CSOs who take an active role in convening roundtables or designing standards. These nine groups are mostly large conservation organisations or specialists in product certification.
Biofuels have both a policy and a market component. Much more CSO capacity is related to the former, particularly towards EU and US biofuels targets. All CSOs involved are concerned that biofuels could spur deforestation. Of the 34 CSOs working on biofuels, none support existing policy unconditionally, and only 12 might support more biofuel production, if the right safeguards were in place.
PAT H W AY 3: Commodities Supply and Demand (p4 of Forest_maps.pdf)
S AV I N G T H E R A I N F O R E S T S : C I V I L S O C I E T Y M A P P I N G
14
Comment
Out of the 65 CSOs, 43 work on this pathway, making it the second least populated pathway in terms of total CSO numbers. However, this effort is spread quite thinly, and the pathway has the lowest overall CSO capacity as measured by average levels of engagement by individual CSOs. Although large infrastructure schemes are often associated with forest loss, the reform of project and development finance is a difficult, long-term undertaking, leading to challenges in maintaining CSO capacity (and grantmaker interest).
One large concentration of CSO effort relates to public sector lending by institutions such as Export Credit Agencies and the World Bank (separate to REDD). Thirty-one CSOs are working to improve the environmental and social conditions attached to public lending, and more than half of these also work on lending by commercial banks. As time goes on, more ‘exotic’ types of finance are likely to become important, including sovereign wealth funds and land purchase in the developing world by richer states. Our assessment is that there is currently very little CSO capacity available to anticipate these trends.
Many CSOs working on public and private finance focus on increasing transparency and accountability, which they tend to link back to concerns about land rights, governance and the treatment of local communities.
Beyond policy, the greatest concentration of CSO effort relates directly to the energy, mining and agricultural corporations involved in infrastructure development. This group of 32 CSOs is divided along ‘stick’ and ‘carrot’ lines – 18 groups aim to promote higher standards by exposing bad practice, while 14 take a more collaborative approach, working with large companies from within.
Relatively little capacity is associated with specific infrastructure projects, although it is important to bear in mind that the maps do not try and record the capacity of local civil society groups in forest nations. Among the 65 groups considered for this report, the most capacity is associated with mineral and fossil fuel projects (like the Camisea pipeline in Peru), followed by logging and agriculture facilities (such as those used to crush soybeans), dams (such as on the Madeira river in Brazil), and finally roads and waterways.
PAT H W AY 4: Development Finance (p5 of Forest_maps.pdf)

S AV I N G T H E R A I N F O R E S T S : C I V I L S O C I E T Y M A P P I N G
15
Mapping links: do values shape interventions?
The two parts of this mapping project tell us something about the
various roles and values that forests cSOs organise around (Part 1:
Storylines map), and about the specifics of what cSOs do in their
day-to-day forests work (Part 2: Pathways map). Do different roles and
values have a bearing on which practical interventions cSOs prioritise?
In the Interventions part of the Pathways map cSOs were separated
into four groups according to the core motivations described in the
Storylines map – namely biodiversity conservation, environmental
justice, resource use efficiency and carbon reduction. The capacity
associated with each of these groups was analysed across the four
pathways, by adding up the total number of spheres used to indicate
levels of engagement under each Intervention column.
If all groups placed equal priority on each pathway to change –
regardless of core motivation – we would expect to see capacity
allocated between pathways in proportion to the number of groups
assigned to each of the four motivation categories.
But the chart below shows that some groups appear to account for more
capacity than their total numbers might predict, and others for less.
For instance, groups motivated primarily by biodiversity conservation
account for 35% of the cSOs sampled, but for 42% of capacity
in Pathway 1 (carbon payments), and 58% of capacity in Pathway
2 (conservation and community forest management). however, at
24%, they account for less than their predicted shared of capacity in
Pathway 4 (development finance).
Groups motivated by environmental justice (particularly by
the rights of forest peoples) and by resource use efficiency
(management and governance of natural resources) account for
29% and 25% of cSOs by number respectively. They account for
similar shares of capacity in most pathways, with the exception
of Pathway 4, where justice-oriented groups account for 48% of
capacity.
Throughout, groups motivated primarily by reducing carbon
emissions have lower capacity than their numbers suggest, although
the small number of groups in this category (seven out of 65) makes
this analysis less robust.
It appears that different organisational values are associated
more or less strongly with different pathways to change. It is
not surprising to see conservation-oriented groups focused
strongly on interventions involving practical forest management.
Or to see justice-oriented groups strongly concerned about the
terms of development finance and the impact of commodity
demand – both pathways that directly and adversely affect forest
communities.
Note also that some cSOs will have to prioritise more strictly than
others. Large, well-funded groups may well be able to field capacity
across all pathways, whereas smaller groups may be forced to focus
only on areas most closely aligned to their core mission and aims.
In part, this relates back to the distribution of philanthropic funding
across different forms of environmentalism.
%
60
50
40
30
20
10
0
CSO Numbers PW1: Carbon Payments PW2: Conservation PW3: Commodities PW4: Dev Finance
35%
29%25%
11%
42%
26%22%
9%
58%
22%
17%
4%
34%
28% 27%
11%
24%
48%
26%
2%
n Conservation
n Environmental Justice
n Resource Use Efficiency
n Carbon Reduction
S AV I N G T H E R A I N F O R E S T S : C I V I L S O C I E T Y M A P P I N G
16
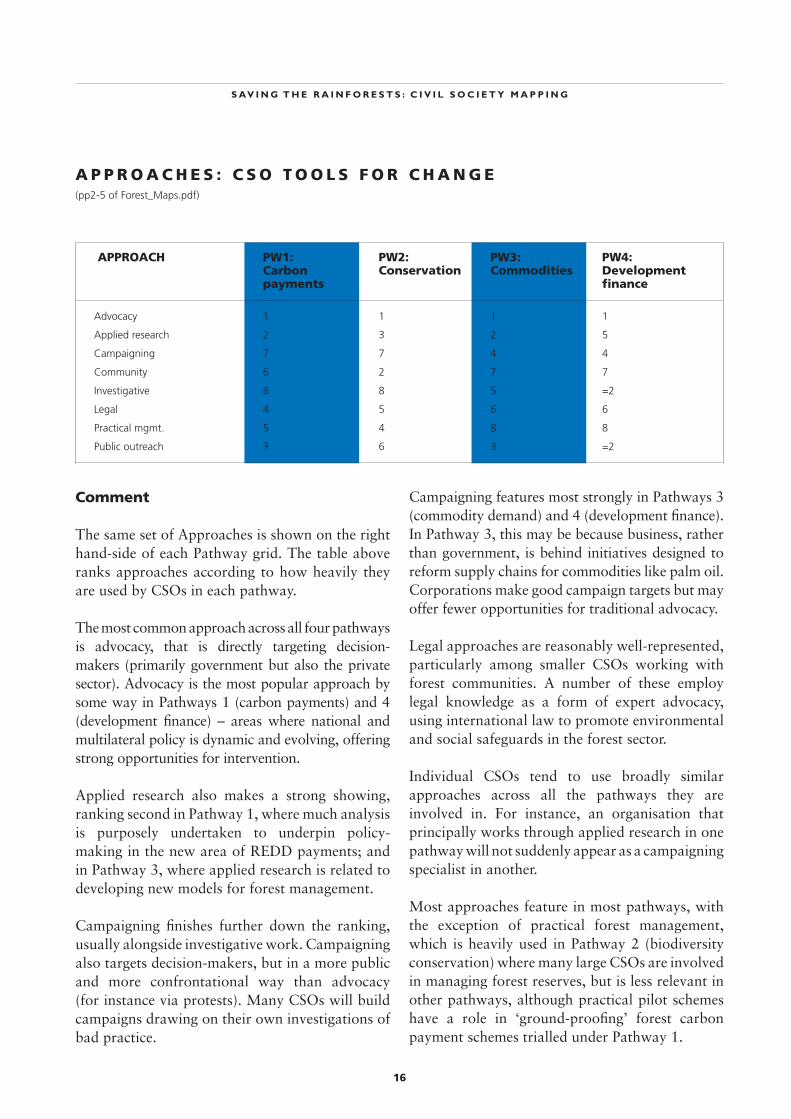
Comment
The same set of Approaches is shown on the right hand-side of each Pathway grid. The table above ranks approaches according to how heavily they are used by CSOs in each pathway.
The most common approach across all four pathways is advocacy, that is directly targeting decision-makers (primarily government but also the private sector). Advocacy is the most popular approach by some way in Pathways 1 (carbon payments) and 4 (development finance) – areas where national and multilateral policy is dynamic and evolving, offering strong opportunities for intervention.
Applied research also makes a strong showing, ranking second in Pathway 1, where much analysis is purposely undertaken to underpin policy-making in the new area of REDD payments; and in Pathway 3, where applied research is related to developing new models for forest management.
Campaigning finishes further down the ranking, usually alongside investigative work. Campaigning also targets decision-makers, but in a more public and more confrontational way than advocacy (for instance via protests). Many CSOs will build campaigns drawing on their own investigations of bad practice.
Campaigning features most strongly in Pathways 3 (commodity demand) and 4 (development finance). In Pathway 3, this may be because business, rather than government, is behind initiatives designed to reform supply chains for commodities like palm oil. Corporations make good campaign targets but may offer fewer opportunities for traditional advocacy.
Legal approaches are reasonably well-represented, particularly among smaller CSOs working with forest communities. A number of these employ legal knowledge as a form of expert advocacy, using international law to promote environmental and social safeguards in the forest sector.
Individual CSOs tend to use broadly similar approaches across all the pathways they are involved in. For instance, an organisation that principally works through applied research in one pathway will not suddenly appear as a campaigning specialist in another.
Most approaches feature in most pathways, with the exception of practical forest management, which is heavily used in Pathway 2 (biodiversity conservation) where many large CSOs are involved in managing forest reserves, but is less relevant in other pathways, although practical pilot schemes have a role in ‘ground-proofing’ forest carbon payment schemes trialled under Pathway 1.
A P P R O A C H E S : C S O T O O L S F O R C H A N G E (pp2-5 of Forest_maps.pdf)
APPROACH PW1: PW2: PW3: PW4: Carbon Conservation Commodities Development payments finance
Advocacy 1 1 1 1
Applied research 2 3 2 5
campaigning 7 7 4 4
community 6 2 7 7
Investigative 8 8 5 =2
Legal 4 5 6 6
Practical mgmt. 5 4 8 8
Public outreach 3 6 3 =2
S AV I N G T H E R A I N F O R E S T S : C I V I L S O C I E T Y M A P P I N G
17
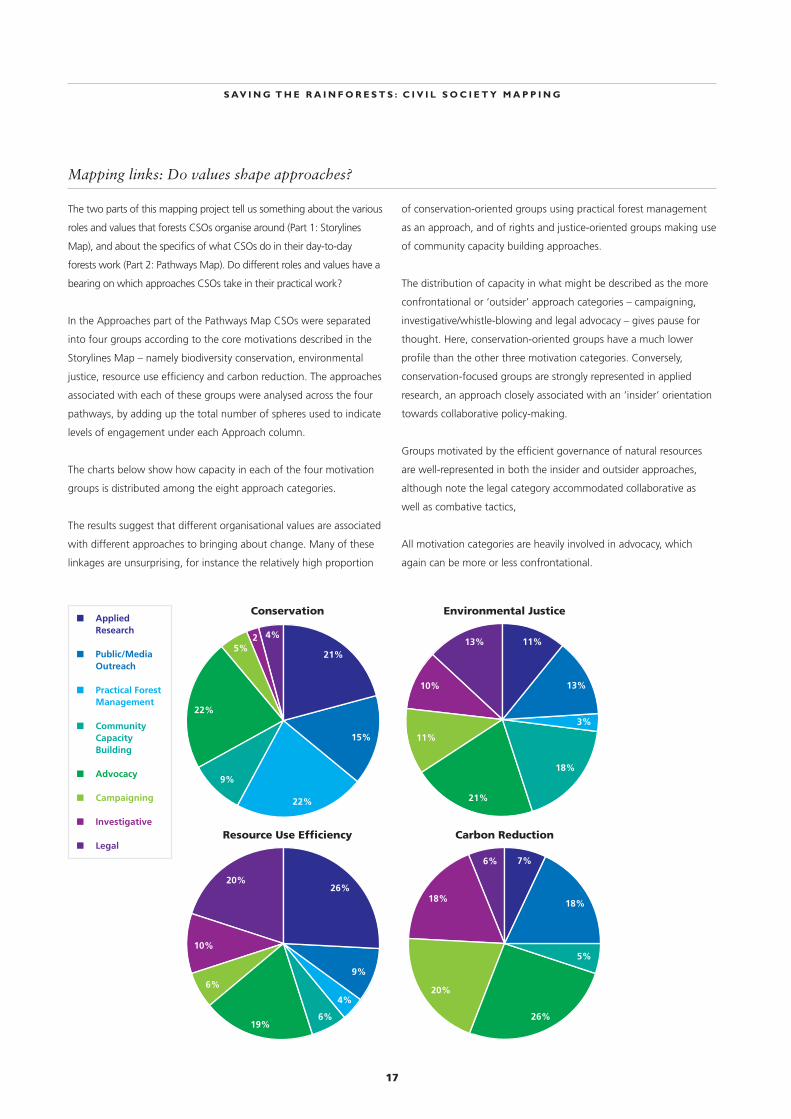
Mapping links: Do values shape approaches?
The two parts of this mapping project tell us something about the various
roles and values that forests cSOs organise around (Part 1: Storylines
map), and about the specifics of what cSOs do in their day-to-day
forests work (Part 2: Pathways map). Do different roles and values have a
bearing on which approaches cSOs take in their practical work?
In the Approaches part of the Pathways map cSOs were separated
into four groups according to the core motivations described in the
Storylines map – namely biodiversity conservation, environmental
justice, resource use efficiency and carbon reduction. The approaches
associated with each of these groups were analysed across the four
pathways, by adding up the total number of spheres used to indicate
levels of engagement under each Approach column.
The charts below show how capacity in each of the four motivation
groups is distributed among the eight approach categories.
The results suggest that different organisational values are associated
with different approaches to bringing about change. many of these
linkages are unsurprising, for instance the relatively high proportion
of conservation-oriented groups using practical forest management
as an approach, and of rights and justice-oriented groups making use
of community capacity building approaches.
The distribution of capacity in what might be described as the more
confrontational or ‘outsider’ approach categories – campaigning,
investigative/whistle-blowing and legal advocacy – gives pause for
thought. here, conservation-oriented groups have a much lower
profile than the other three motivation categories. conversely,
conservation-focused groups are strongly represented in applied
research, an approach closely associated with an ‘insider’ orientation
towards collaborative policy-making.
Groups motivated by the efficient governance of natural resources
are well-represented in both the insider and outsider approaches,
although note the legal category accommodated collaborative as
well as combative tactics,
All motivation categories are heavily involved in advocacy, which
again can be more or less confrontational.
n Applied Research
n Public/Media Outreach
n Practical Forest Management
n Community Capacity Building
n Advocacy
n Campaigning
n Investigative
n Legal
21%
15%
22%
9%
22%
5%2 4%
11%
7%
13%
18%
13%
6%
10%
18%
11%
3%
5%
26%
9%
10%
20%
6%
4%
21%
20%
18%
26%
6%
Carbon Reduction
Environmental Justice
Resource use Efficiency
Conservation
19%

S AV I N G T H E R A I N F O R E S T S : C I V I L S O C I E T Y M A P P I N G
18
The project set out to develop a mapping structure that meaningfully categorises the range of activities undertaken by forests CSOs, and just as importantly, allows the reader to see the differences between these approaches.
There are a number of ways in which civil society capacity can be ‘cut and sliced’, and our hope is to develop the maps into templates that can be applied to other environmental issues, while improving their accessibility and usefulness.
The key structural element of the mapping resides in the column headings used to describe ‘Interventions’, ‘Approaches’, and ‘Storylines’. The authors put together an initial list of these headings, which was further developed with feedback from forest experts in academia, philanthropy and civil society.
Assigning CSOs to the grid categories proved a challenge. Judging exactly what it is that CSOs do, and how they prioritise these activities, is a subjective process. The issues involved are often quite nebulous – what one person describes as “strengthening community rights”, another might call “enabling economic development”.
While, in a sense, this is a limitation of the mapping, ‘shades of grey’ are unavoidable in such a complex, inter-linked issue. As far as possible, the column headings were designed to minimise the number of categories the same work can appear in.
Four CSOs gave feedback on their classification5. Each reported that the maps underestimated the range and effort of their forests work. Two were broadly satisfied with the grid structures and their representation within them, one sought to be represented in a much larger number of categories, and the other had misgivings about the structure of the whole piece.
These comments are all noted and will be used in future iterations of the grids. The current maps have not been modified in response, partly because other forests CSOs have not had the same opportunity to comment, and also to maintain consistency across the piece. Moreover, increasing the number of columns in which each CSO appears would make it harder to perceive the differences between parts of civil society – a key purpose of this project.
A P P E N D I X 1: Notes on Methodology
5 Amazon Watch, Fauna and Flora International, FErN and Greenpeace UK
S AV I N G T H E R A I N F O R E S T S : C I V I L S O C I E T Y M A P P I N G
19
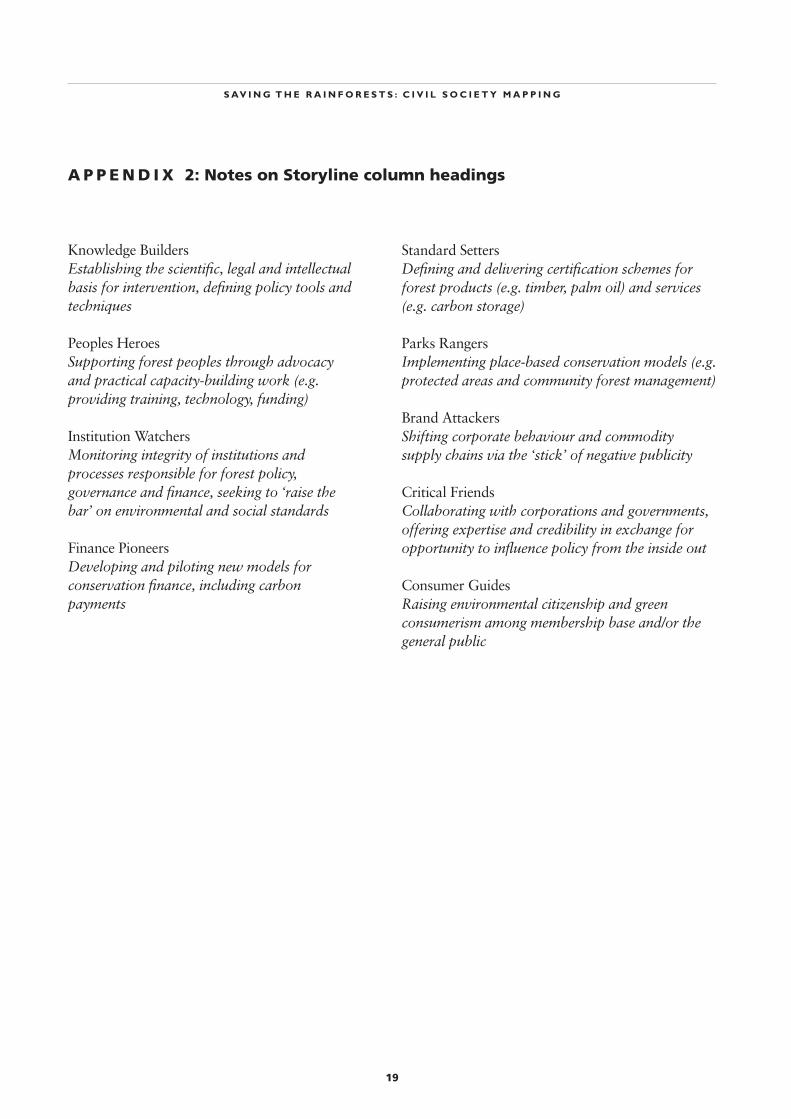
Knowledge BuildersEstablishing the scientific, legal and intellectual basis for intervention, defining policy tools and techniques
Peoples HeroesSupporting forest peoples through advocacy and practical capacity-building work (e.g. providing training, technology, funding)
Institution WatchersMonitoring integrity of institutions and processes responsible for forest policy, governance and finance, seeking to ‘raise the bar’ on environmental and social standards
Finance PioneersDeveloping and piloting new models for conservation finance, including carbon payments
Standard SettersDefining and delivering certification schemes for forest products (e.g. timber, palm oil) and services (e.g. carbon storage)
Parks RangersImplementing place-based conservation models (e.g. protected areas and community forest management)
Brand AttackersShifting corporate behaviour and commodity supply chains via the ‘stick’ of negative publicity
Critical FriendsCollaborating with corporations and governments, offering expertise and credibility in exchange for opportunity to influence policy from the inside out
Consumer GuidesRaising environmental citizenship and green consumerism among membership base and/or the general public
A P P E N D I X 2: Notes on Storyline column headings

S AV I N G T H E R A I N F O R E S T S : C I V I L S O C I E T Y M A P P I N G
20
PATHWAY 1: Payments for carbon and other ecosystem services
UNFCCC REDD: Structure of overall agreementHow REDD monies are raised and qualifying conditions for payment. Includes groups focused on inclusion of REDD in national climate policy
UNFCCC REDD: Reporting and verifying outcomesTransparency and integrity of systems for measuring emissions reductions, plus other environmental and social outcomes
Forest carbon trading and offsetsSpeed and depth of integration of REDD credits with carbon markets
REDD: Consistency with international policy/law on biodiversityHow and if REDD schemes recognise positive (or negative) conservation impacts
REDD: Consistency with international policy/law on human rightsHow concepts like FPIC (Free, Prior, Informed Consent) are applied in REDD frameworks
World Bank forest and climate fundsForest Carbon Partnership Facility and Forest Investment Program; how funds are spent and outcomes monitored
Voluntary carbon marketCarbon offset purchases by companies and individuals
Payments for non-carbon ecosystem servicesNascent markets for forests’ role in protecting watersheds, soils and biodiversity
Standards and certificationProcesses for verifying ecological claims, and/or production of saleable carbon units
Land tenure and quality of governanceWho has ownership of REDD schemes, how benefits are shared, how the process is managed and protected against corruption
Access to REDD decision-makingIndigenous peoples status in REDD talks, and ability to participate
PATHWAY 2: Biodiversity Conservation and Community Forest Management
United Nations Convention on Biological Diversity (UNCBD) and other international agreementsHow the international community designs, prioritises and delivers conservation activities
Protected areas and national parksDesignation and management of protected areas
Innovative conservation finance models (non-REDD)Debt-for-nature swaps, conservation concessions and other models
A P P E N D I X 3: Notes on Intervention column headings in Pathways Map
The titles of the Intervention columns in each of the four pathways is given below, along with additional notes of explanation, in italics. Each of the pink columns in the pathways grid refers to a different Intervention’ point – processes, institutions and trends that CSOs may seek to direct or intervene. Further detail on the meaning of each intervention is given below.

S AV I N G T H E R A I N F O R E S T S : C I V I L S O C I E T Y M A P P I N G
21
Institutional capacityStrengthening agencies that enforce laws, manage forest resources, and ‘scale up’ community conservation
Community conservationEmpowering communities as decision-makers in conservation policy and forest management
Public sector conservation fundingDesign and management of public funds, integrating conservation into wider range of funding streams
Private sector conservation fundingDesign and management of conservation funds supported by corporations and large philanthropies
Generation of new conservation finance streamsSupply and demand for new categories of forest product (e.g. ecotourism) and services (e.g. watershed protection)
Product certification standardsProcesses for verifying social and environmental claims made for various ‘forest friendly’ goods and services
Land tenure and quality of governanceClarity over land ownership, ending marginalisation of forest peoples, integrity of forest management
Fuel, food and fibre needsThe conservation impacts of fuel wood collection and fulfilment of other livelihood needs
Adaptation to environmental changeClimate and other changes likely to increase human pressure on forest resources
Enabling economic developmentAvailability of appropriate finance, technology, market access and skills
PATHWAY 3: Commodities Supply and Demand
BiofuelsEU and US biofuels targets may make it profitable to clear forests for fuel crops
Trade agreements, agriculture and energy subsidiesLand-use in forest nations is influenced by agricultural policy in trading partners
Illegal logging: FLEGForest Law Enforcement and Governance agreements are designed to reduce illegal logging at source
Illegal logging: Trade restrictions and procurementUS and EU regulations to ban or reduce illegal timber imports
Cattle: Beef and non-meat productsCattle ranching is the leading cause of deforestation in the Brazilian Amazon
Industrial logging (including Forest Stewardship Council (FSC) certification)‘Low-impact logging’ is in vogue, but there is controversy over whether commercial logging can ever be sustainable
Palm oil (including Roundtable on Sustainable Palm Oil (RSPO) process)Palm oil is a leading cause of Indonesia forest loss; the RSPO is a voluntary industry-led initiative
Soy (including Roundtable on Responsible Soy (RTRS) process)Soy is planted widely across South America; the RTRS is a voluntary industry-led initiative
Pulp/paper (including FSC)Pulp wood plantations are a leading cause of deforestation in Indonesia

S AV I N G T H E R A I N F O R E S T S : C I V I L S O C I E T Y M A P P I N G
22
Large corporations: Extractive industries and agricultureSocial and environmental impacts of oil, mining and agricultural corporations
Lobbying, transparency and accountabilityUndue political influence and conflict of public and private interest
Specific projects: Roads and waterwaysRoad and water transport opens up inaccessible forest for agriculture and settlement
Specific projects: DamsE.g. the Madeira River dam in Brazil
Specific projects: Minerals/fossil fuelEg the Camisea gas pipeline in the Peruvian Amazon
Specific projects: Logging and agricultureIndustrial-scale processing facilities for soy, palm oil, biofuels and cattle
Land tenure and quality of governanceLocal communities may not be adequately consulted over mega-projects, and insufficient consideration may be given to social or environmental harm
Biofuels (including the Roundtable on Sustainable Biofuels (RSB) process)As biofuels demand increases the RSB and other certification processes are being set up
Product certification standardsProcesses for verifying social and environmental claims made for commodity production
Land tenure and quality of governanceClarity over land ownership, how commodity production is managed and protected against corruption
PATHWAY 4: Development Finance
Public sector lending: Multilateral development banks and ECAsSocial and environmental impacts of lending by World Bank, export credit agencies and others
Private sector lending: Commercial banksSocial and environmental impacts of lending by private sector banks such as Citigroup and HSBC

S AV I N G T H E R A I N F O R E S T S : C I V I L S O C I E T Y M A P P I N G
23
The titles of the Approach columns in each of the five pathways is given below, along with additional notes of explanation (in italics). The same set of approach headings is repeated in each pathway. The definitions below are couched quite broadly to give a general perspective of what they mean. The precise application of each approach differs between pathways.
Applied researchStatistics, tools and techniques that create the case for intervention, and underpin policy development
Public/media outreachRaising awareness and recruiting support
Practical forest managementDesigning, financing and managing projects to protect forests, sometimes used to demonstrate new models of forest conservation
Community capacity buildingSupporting and mobilising forest peoples
AdvocacyMaking the case for intervention/change directly to decision-makers
CampaigningPressuring business and political constituencies to accelerate or change their direction of travel
Investigative/whistle-blowingExposing negative environmental and social outcomes associated with forest policy, commodities and investment
LegalSeeking legal protection for environmental and human rights, and/or using legal mechanisms to seek redress
A P P E N D I X 4: Notes on Approach column headings in Pathways Map

S AV I N G T H E R A I N F O R E S T S : C I V I L S O C I E T Y M A P P I N G
24
We wish to thank the following people for their input to this project in the form of feedback on various drafts of the Storylines and Pathways Maps. These experts have not seen the final report before publication, and this list does not imply endorsement of the project or its conclusions. The authors retain full responsibility for this work, and any errors therein.
Jeffrey Campbell, The Christensen FundSimon Counsell, Rainforest Foundation UKLafcadio Cortesi, Rainforest Action NetworkAbigail Entwistle, Fauna & Flora InternationalRobert Harley, CamcoPaul Jepson, School of Geography and the Environment, Oxford University Bernard Mercer, Forest Philanthropy Action NetworkSaskia Ozinga, FERNAtossa Soltani, Amazon WatchAndy Tait, Greenpeace UKPedro Tarak, Avina FoundationRay Victurine, Wildlife Conservation SocietyDan Zarin, David and Lucile Packard Foundation
A P P E N D I X 5: List of Forest Experts consulted