Savant Genome Browser 2: visualization and analysis for population
7
Savant Genome Browser 2: visualization and analysis for population-scale genomics Marc Fiume 1 , Eric J. M. Smith 1 , Andrew Brook 1 , Dario Strbenac 2 , Brian Turner 3 , Aziz M. Mezlini 4 , Mark D. Robinson 5 , Shoshana J. Wodak 2,6 and Michael Brudno 1,4, * 1 Department of Computer Science, University of Toronto, Ontario, Canada M5S 2E4, 2 Epigenetics Laboratory Cancer Research Program, Garvan Institute of Medical Research, Sydney, New South Wales 2011, Australia, 3 Molecular Structure and Function Program, 4 Centre for Computational Medicine, Hospital for Sick Children, Toronto, Ontario, Canada M5G 1L7, 5 Institute of Molecular Life Sciences, University of Zurich, 8057 Zu ¨ rich, Switzerland and 6 Department of Biochemistry, University of Toronto, Ontario, Canada M5S 1A8 Received March 7, 2012; Revised April 23, 2012; Accepted April 24, 2012 ABSTRACT High-throughput sequencing (HTS) technologies are providing an unprecedented capacity for data generation, and there is a corresponding need for efficient data exploration and analysis capabilities. Although most existing tools for HTS data analysis are developed for either automated (e.g. genotyping) or visualization (e.g. genome browsing) purposes, such tools are most powerful when combined. For example, integration of visualization and computation allows users to iteratively refine their analyses by updating computational param- eters within the visual framework in real-time. Here we introduce the second version of the Savant Genome Browser, a standalone program for visual and computational analysis of HTS data. Savant sub- stantially improves upon its predecessor and existing tools by introducing innovative visualization modes and navigation interfaces for several genomic datatypes, and synergizing visual and automated analyses in a way that is powerful yet easy even for non-expert users. We also present a number of plugins that were developed by the Savant Community, which demonstrate the power of integrating visual and automated analyses using Savant. The Savant Genome Browser is freely avail- able (open source) at www.savantbrowser.com. INTRODUCTION High-throughput sequencing (HTS) technologies have revolutionized the speed and economy with which genomic information can be obtained. The unprecedented data-generating capacity of these technologies has stimulated their use throughout molecular biology: in genomics, in transcriptomics (e.g. RNA-seq) and prote- omics (e.g. ChIP-seq). The large influx of raw sequencing data and resulting read alignment and genetic variant data has increased the need for efficient data storage, analysis and exploration. Although many data analysis steps can be automated through computational pipelines, a signifi- cant number of tasks still require human interpretation. Visualization tools such as the UCSC Genome Browser (1) and IGV (2) can aid in the interpretation of large and complex data sets. While the former is hosted on a webserver with access to a large backend database, the latter is run on client computers, and can access both local data on the user’s hard drive and remote data sets via the internet (if the data is stored in some standard format such as BAM or Tabix). Genome browsers have become integral parts of HTS analysis pipelines, where they are used to assess the reliability of computational predictions, validate findings in specific regions and guide refinement of automated tools. Despite the prolifer- ation of programs that deal with HTS data, most have been developed for either automated (e.g. read mapping, genotyping) or visualization (e.g. genome browsing) purposes, but not both. Yet visual and automated approaches are most powerful when used together, such that users can seamlessly inspect and perform computa- tion on their data, iteratively refining their analyses. In this article we present the second version of the Savant Genome Browser (3). The original version of Savant, like the UCSC Genome Browser and IGV, enabled fast visualization and navigation of reference genomes and corresponding genomic data sets—such as HTS read alignments, gene annotations and other tracks. The new version advances upon its predecessor and existing genome browsers by introducing a number *To whom correspondence should be addressed. Tel: +1 416 9782589; Fax: +1 416 9781455; Email: [email protected]; [email protected] Published online 25 May 2012 Nucleic Acids Research, 2012, Vol. 40, Web Server issue W615–W621 doi:10.1093/nar/gks427 ß The Author(s) 2012. Published by Oxford University Press. This is an Open Access article distributed under the terms of the Creative Commons Attribution Non-Commercial License (http://creativecommons.org/licenses/ by-nc/3.0), which permits unrestricted non-commercial use, distribution, and reproduction in any medium, provided the original work is properly cited. Downloaded from https://academic.oup.com/nar/article/40/W1/W615/1074612 by guest on 29 January 2022
Transcript of Savant Genome Browser 2: visualization and analysis for population
Savant Genome Browser 2: visualization andanalysis for population-scale genomicsMarc Fiume1, Eric J. M. Smith1, Andrew Brook1, Dario Strbenac2, Brian Turner3,
Aziz M. Mezlini4, Mark D. Robinson5, Shoshana J. Wodak2,6 and Michael Brudno1,4,*
1Department of Computer Science, University of Toronto, Ontario, Canada M5S 2E4, 2Epigenetics LaboratoryCancer Research Program, Garvan Institute of Medical Research, Sydney, New South Wales 2011, Australia,3Molecular Structure and Function Program, 4Centre for Computational Medicine, Hospital for Sick Children,Toronto, Ontario, Canada M5G 1L7, 5Institute of Molecular Life Sciences, University of Zurich, 8057 Zurich,Switzerland and 6Department of Biochemistry, University of Toronto, Ontario, Canada M5S 1A8
Received March 7, 2012; Revised April 23, 2012; Accepted April 24, 2012
ABSTRACT
High-throughput sequencing (HTS) technologies areproviding an unprecedented capacity for datageneration, and there is a corresponding need forefficient data exploration and analysis capabilities.Although most existing tools for HTS dataanalysis are developed for either automated (e.g.genotyping) or visualization (e.g. genome browsing)purposes, such tools are most powerful whencombined. For example, integration of visualizationand computation allows users to iteratively refinetheir analyses by updating computational param-eters within the visual framework in real-time. Herewe introduce the second version of the SavantGenome Browser, a standalone program for visualand computational analysis of HTS data. Savant sub-stantially improves upon its predecessor andexisting tools by introducing innovative visualizationmodes and navigation interfaces for several genomicdatatypes, and synergizing visual and automatedanalyses in a way that is powerful yet easy even fornon-expert users. We also present a number ofplugins that were developed by the SavantCommunity, which demonstrate the power ofintegrating visual and automated analyses usingSavant. The Savant Genome Browser is freely avail-able (open source) at www.savantbrowser.com.
INTRODUCTION
High-throughput sequencing (HTS) technologies haverevolutionized the speed and economy with whichgenomic information can be obtained. The unprecedented
data-generating capacity of these technologies hasstimulated their use throughout molecular biology: ingenomics, in transcriptomics (e.g. RNA-seq) and prote-omics (e.g. ChIP-seq). The large influx of raw sequencingdata and resulting read alignment and genetic variant datahas increased the need for efficient data storage, analysisand exploration. Although many data analysis steps canbe automated through computational pipelines, a signifi-cant number of tasks still require human interpretation.Visualization tools such as the UCSC Genome Browser
(1) and IGV (2) can aid in the interpretation of large andcomplex data sets. While the former is hosted on awebserver with access to a large backend database, thelatter is run on client computers, and can access bothlocal data on the user’s hard drive and remote data setsvia the internet (if the data is stored in some standardformat such as BAM or Tabix). Genome browsers havebecome integral parts of HTS analysis pipelines, wherethey are used to assess the reliability of computationalpredictions, validate findings in specific regions andguide refinement of automated tools. Despite the prolifer-ation of programs that deal with HTS data, most havebeen developed for either automated (e.g. read mapping,genotyping) or visualization (e.g. genome browsing)purposes, but not both. Yet visual and automatedapproaches are most powerful when used together, suchthat users can seamlessly inspect and perform computa-tion on their data, iteratively refining their analyses.In this article we present the second version of the
Savant Genome Browser (3). The original version ofSavant, like the UCSC Genome Browser and IGV,enabled fast visualization and navigation of referencegenomes and corresponding genomic data sets—such asHTS read alignments, gene annotations and other tracks.The new version advances upon its predecessor andexisting genome browsers by introducing a number
*To whom correspondence should be addressed. Tel: +1 416 9782589; Fax: +1 416 9781455; Email: [email protected];[email protected]
Published online 25 May 2012 Nucleic Acids Research, 2012, Vol. 40, Web Server issue W615–W621doi:10.1093/nar/gks427
� The Author(s) 2012. Published by Oxford University Press.This is an Open Access article distributed under the terms of the Creative Commons Attribution Non-Commercial License (http://creativecommons.org/licenses/by-nc/3.0), which permits unrestricted non-commercial use, distribution, and reproduction in any medium, provided the original work is properly cited.
Dow
nloaded from https://academ
ic.oup.com/nar/article/40/W
1/W615/1074612 by guest on 29 January 2022
of innovative visualizations and navigation interfaces, andallowing for seamless integration of diverse external datasets. We have also significantly expanded plugin function-ality, and this article describes a number of analytic,visualization and datasource plugins. These plugins,developed by the core Savant Development Team andby the Savant User Community, help synergize visualand automated analyses of genomic data.
SAVANT FEATURE SUMMARY
Within this section we briefly summarize importantSavant features, while in the following ones we describein more detail major recent enhancements to visualizationsand browser extensibility. A full set of features is describedin the User Manual, available on the Savant website.
Formats
Savant supports a wide range of file formats, including thecommon standards for read alignment (BAM), geneticvariants (VCF), interval (BED, GFF, Tabix) andcontinuous-valued (WIG, BigWIG, TDF) data. When ne-cessary, Savant automatically indexes and compresses allthese datatypes.
Datasources
In addition to working with local files, Savant supportsthe use of remote (through the internet) files anddatasources. All remote resources are cached locally, toenable rapid visualization upon re-loading of a previouslyvisited region. While many commonly used data sets (e.g.reference genomes, genes) are accessible through a publicrepository, tracks can also be quickly loaded directly fromthe UCSC Genome Database (4), without a need formanual download, as described below.
Navigation
Navigation to genomic regions of interest is assistedthrough textual search (e.g. seek to region by genename), as well as through bookmarks that the user canadd to and edit. User sessions can be saved for later use, orfor sharing among users, ensuring that collaborators haveidentical views of the same data.
VISUALIZING HTS DATA SETS
The size of HTS and related genomic data sets challengestheir interactive visualization: a single sequenced genomecan yield billions of reads resulting in read alignment andvariant prediction files that are each many gigabytes insize. Savant applies a multi-resolution visualization prin-ciple for each of these datatypes. For example, for readalignment tracks Savant seamlessly switches from showingindividual reads at basepair-resolution to showing an al-ternate, coverage representation at lower resolution ranges(e.g. when viewing millions of basepairs). This helpsmaintain interactive yet informative views of the data atall resolutions.
Furthermore, within a given resolution alternative viewsof the data, or a subset of the data, may be required. Forexample, each read alignment record typically contains thepredicted fragment sequence, several quality metrics andinformation about the location of the read’s mate. It isuseful to consider some but not all of these aspects, de-pending on the analytic task at hand. Savant includesseveral new visualization modes for HTS and geneticvariant data sets, each designed to focus on specificaspects of the data that are relevant to common analytictasks like assessing data quality, identifying geneticvariants and discovering population trends.
Visualizations for SNP and small indel discovery
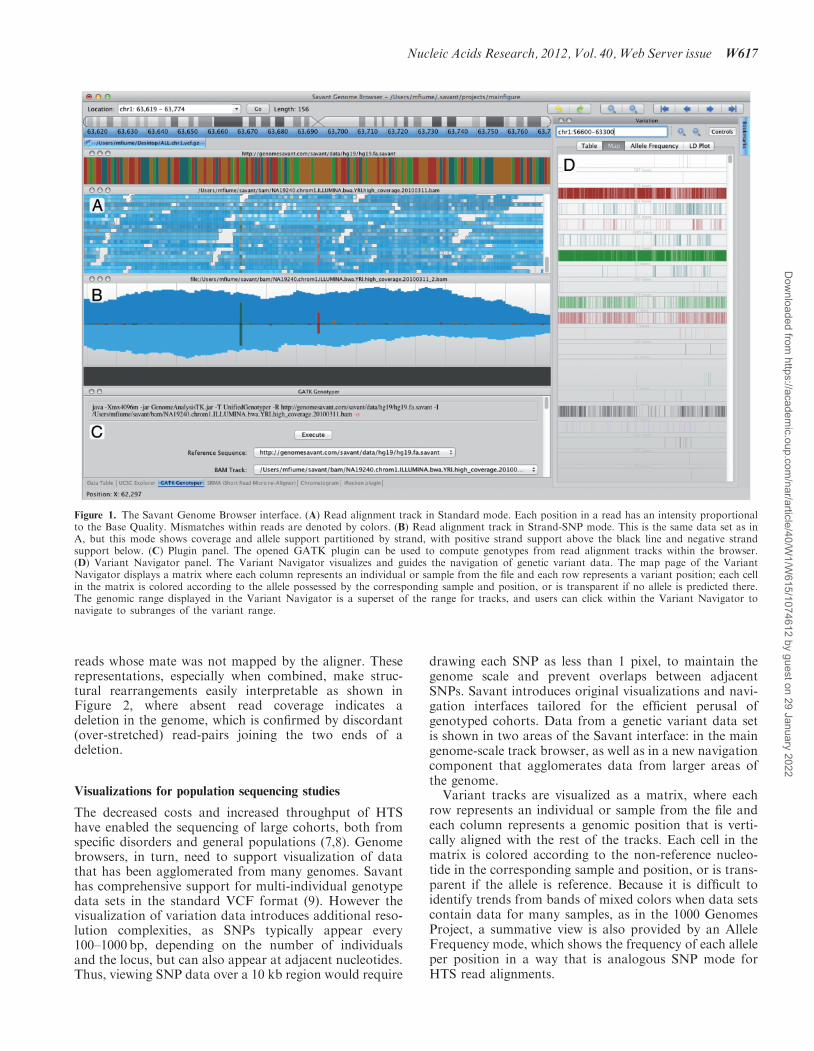
In the simplest terms the determination of whether aposition is variable depends on the percentage of readswith differing nucleotides at this position. Instead ofrequiring the user to infer this percentage from rawsequenced reads, this can instead be visualized asper-nucleotide histograms in the SNP visualizationmode. However HTS platforms also exhibit unique andreproducible biases that arise due to imperfect sequencingchemistries and/or library preparation. For example,strand-specific errors are common, and support fromreads sequenced from both strands of DNA is often arequirement to separate true from false variants. InSavant, a user can choose to separate coverage profilesby strand within the Strand-SNP mode, making the iden-tification of SNPs with support from both strandsstraightforward (Figure 1B) while also highlightingissues pertaining to strand-specific coverage biases.
Simultaneously just looking at percentages is insuffi-cient, as the processes of sequencing and alignment areprone to error. In order to highlight reads and nucleotidesmost informative for variation detection Savant users canchoose to shade whole reads or individual positions basedon their mapping quality or base quality, respectively.This visualization mode makes the disentanglement ofhigh and low confidence supporting data simpler, asshown in Figure 1A.
Visualizations for structural variant discovery
Detecting large-scale structural variants (insertions, dele-tions and inversions of multiple kilobases) using HTSreads requires emphasizing very different aspects of thedata than the high-resolution coverage maps describedabove. Duplications or deletions in a sequenced genomemanifest in increased or decreased coverage over the cor-responding region in the reference (5), and breakpointscan be identified more precisely via clusters of read pairsthat are discordant, that is they fall outside the expecteddistance and orientation constraints (6). When one viewsread alignment tracks over large regions in Savant, thebrowser automatically switches to the low-resolutioncoverage view, enabling the coarse identification of suchvariants. Alternatively, a user can choose to visualizeread pairs as arcs, which are scaled vertically accordingto the distance between the component reads, and col-ored according to relative orientations and size discord-ance. A distinct representation is also used for paired
W616 Nucleic Acids Research, 2012, Vol. 40, Web Server issue
Dow
nloaded from https://academ
ic.oup.com/nar/article/40/W
1/W615/1074612 by guest on 29 January 2022
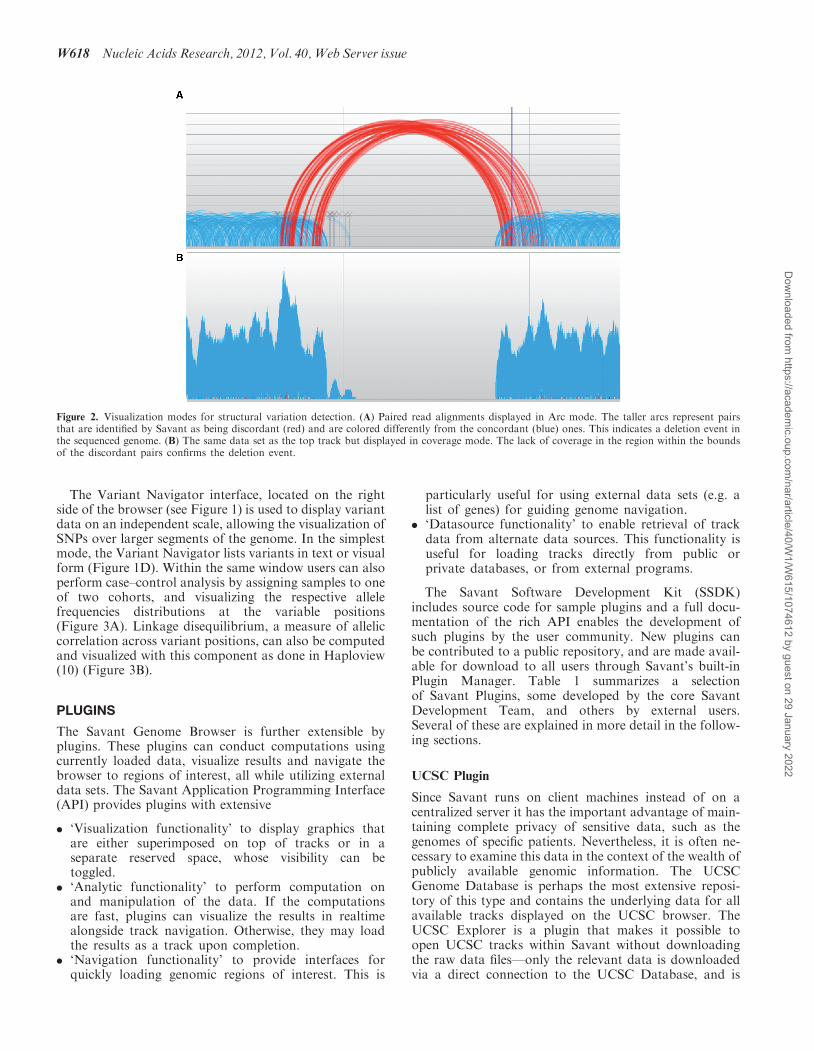
reads whose mate was not mapped by the aligner. Theserepresentations, especially when combined, make struc-tural rearrangements easily interpretable as shown inFigure 2, where absent read coverage indicates adeletion in the genome, which is confirmed by discordant(over-stretched) read-pairs joining the two ends of adeletion.
Visualizations for population sequencing studies
The decreased costs and increased throughput of HTShave enabled the sequencing of large cohorts, both fromspecific disorders and general populations (7,8). Genomebrowsers, in turn, need to support visualization of datathat has been agglomerated from many genomes. Savanthas comprehensive support for multi-individual genotypedata sets in the standard VCF format (9). However thevisualization of variation data introduces additional reso-lution complexities, as SNPs typically appear every100–1000 bp, depending on the number of individualsand the locus, but can also appear at adjacent nucleotides.Thus, viewing SNP data over a 10 kb region would require
drawing each SNP as less than 1 pixel, to maintain thegenome scale and prevent overlaps between adjacentSNPs. Savant introduces original visualizations and navi-gation interfaces tailored for the efficient perusal ofgenotyped cohorts. Data from a genetic variant data setis shown in two areas of the Savant interface: in the maingenome-scale track browser, as well as in a new navigationcomponent that agglomerates data from larger areas ofthe genome.Variant tracks are visualized as a matrix, where each
row represents an individual or sample from the file andeach column represents a genomic position that is verti-cally aligned with the rest of the tracks. Each cell in thematrix is colored according to the non-reference nucleo-tide in the corresponding sample and position, or is trans-parent if the allele is reference. Because it is difficult toidentify trends from bands of mixed colors when data setscontain data for many samples, as in the 1000 GenomesProject, a summative view is also provided by an AlleleFrequency mode, which shows the frequency of each alleleper position in a way that is analogous SNP mode forHTS read alignments.
Figure 1. The Savant Genome Browser interface. (A) Read alignment track in Standard mode. Each position in a read has an intensity proportionalto the Base Quality. Mismatches within reads are denoted by colors. (B) Read alignment track in Strand-SNP mode. This is the same data set as inA, but this mode shows coverage and allele support partitioned by strand, with positive strand support above the black line and negative strandsupport below. (C) Plugin panel. The opened GATK plugin can be used to compute genotypes from read alignment tracks within the browser.(D) Variant Navigator panel. The Variant Navigator visualizes and guides the navigation of genetic variant data. The map page of the VariantNavigator displays a matrix where each column represents an individual or sample from the file and each row represents a variant position; each cellin the matrix is colored according to the allele possessed by the corresponding sample and position, or is transparent if no allele is predicted there.The genomic range displayed in the Variant Navigator is a superset of the range for tracks, and users can click within the Variant Navigator tonavigate to subranges of the variant range.
Nucleic Acids Research, 2012, Vol. 40, Web Server issue W617
Dow
nloaded from https://academ
ic.oup.com/nar/article/40/W
1/W615/1074612 by guest on 29 January 2022
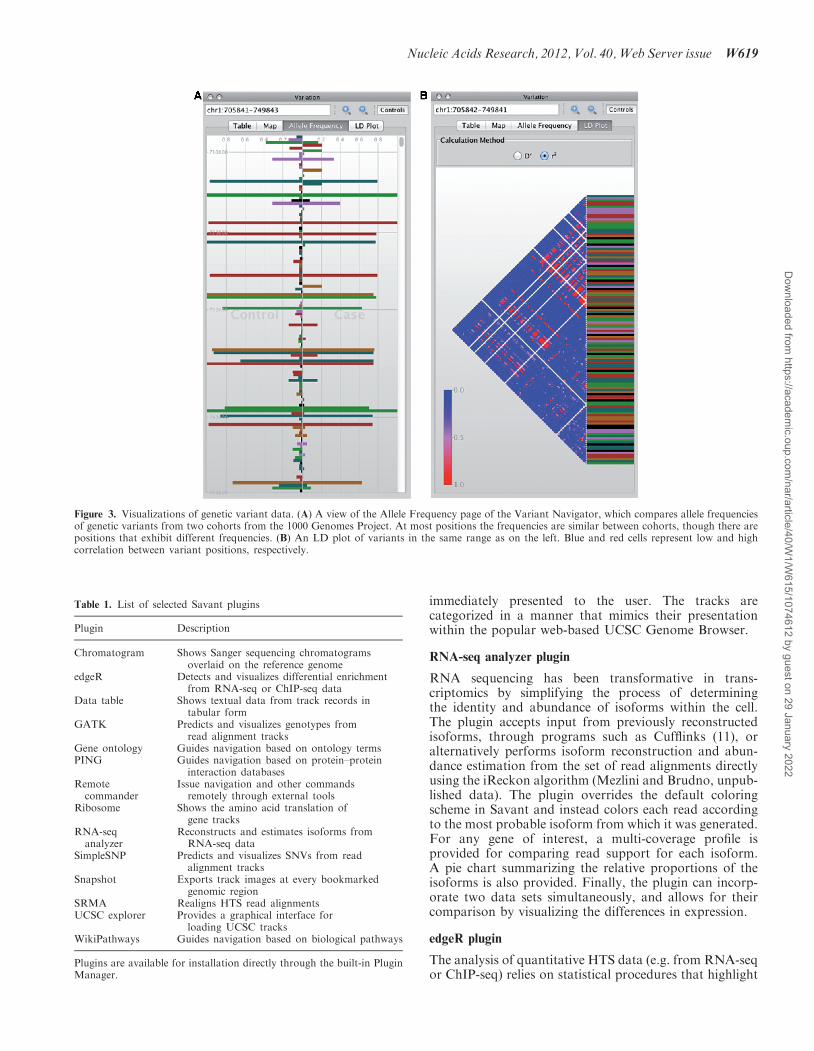
The Variant Navigator interface, located on the rightside of the browser (see Figure 1) is used to display variantdata on an independent scale, allowing the visualization ofSNPs over larger segments of the genome. In the simplestmode, the Variant Navigator lists variants in text or visualform (Figure 1D). Within the same window users can alsoperform case–control analysis by assigning samples to oneof two cohorts, and visualizing the respective allelefrequencies distributions at the variable positions(Figure 3A). Linkage disequilibrium, a measure of alleliccorrelation across variant positions, can also be computedand visualized with this component as done in Haploview(10) (Figure 3B).
PLUGINS
The Savant Genome Browser is further extensible byplugins. These plugins can conduct computations usingcurrently loaded data, visualize results and navigate thebrowser to regions of interest, all while utilizing externaldata sets. The Savant Application Programming Interface(API) provides plugins with extensive
. ‘Visualization functionality’ to display graphics thatare either superimposed on top of tracks or in aseparate reserved space, whose visibility can betoggled.
. ‘Analytic functionality’ to perform computation onand manipulation of the data. If the computationsare fast, plugins can visualize the results in realtimealongside track navigation. Otherwise, they may loadthe results as a track upon completion.
. ‘Navigation functionality’ to provide interfaces forquickly loading genomic regions of interest. This is
particularly useful for using external data sets (e.g. alist of genes) for guiding genome navigation.
. ‘Datasource functionality’ to enable retrieval of trackdata from alternate data sources. This functionality isuseful for loading tracks directly from public orprivate databases, or from external programs.
The Savant Software Development Kit (SSDK)includes source code for sample plugins and a full docu-mentation of the rich API enables the development ofsuch plugins by the user community. New plugins canbe contributed to a public repository, and are made avail-able for download to all users through Savant’s built-inPlugin Manager. Table 1 summarizes a selectionof Savant Plugins, some developed by the core SavantDevelopment Team, and others by external users.Several of these are explained in more detail in the follow-ing sections.
UCSC Plugin
Since Savant runs on client machines instead of on acentralized server it has the important advantage of main-taining complete privacy of sensitive data, such as thegenomes of specific patients. Nevertheless, it is often ne-cessary to examine this data in the context of the wealth ofpublicly available genomic information. The UCSCGenome Database is perhaps the most extensive reposi-tory of this type and contains the underlying data for allavailable tracks displayed on the UCSC browser. TheUCSC Explorer is a plugin that makes it possible toopen UCSC tracks within Savant without downloadingthe raw data files—only the relevant data is downloadedvia a direct connection to the UCSC Database, and is
Figure 2. Visualization modes for structural variation detection. (A) Paired read alignments displayed in Arc mode. The taller arcs represent pairsthat are identified by Savant as being discordant (red) and are colored differently from the concordant (blue) ones. This indicates a deletion event inthe sequenced genome. (B) The same data set as the top track but displayed in coverage mode. The lack of coverage in the region within the boundsof the discordant pairs confirms the deletion event.
W618 Nucleic Acids Research, 2012, Vol. 40, Web Server issue
Dow
nloaded from https://academ
ic.oup.com/nar/article/40/W
1/W615/1074612 by guest on 29 January 2022
immediately presented to the user. The tracks arecategorized in a manner that mimics their presentationwithin the popular web-based UCSC Genome Browser.
RNA-seq analyzer plugin
RNA sequencing has been transformative in trans-criptomics by simplifying the process of determiningthe identity and abundance of isoforms within the cell.The plugin accepts input from previously reconstructedisoforms, through programs such as Cufflinks (11), oralternatively performs isoform reconstruction and abun-dance estimation from the set of read alignments directlyusing the iReckon algorithm (Mezlini and Brudno, unpub-lished data). The plugin overrides the default coloringscheme in Savant and instead colors each read accordingto the most probable isoform from which it was generated.For any gene of interest, a multi-coverage profile isprovided for comparing read support for each isoform.A pie chart summarizing the relative proportions of theisoforms is also provided. Finally, the plugin can incorp-orate two data sets simultaneously, and allows for theircomparison by visualizing the differences in expression.
edgeR plugin
The analysis of quantitative HTS data (e.g. from RNA-seqor ChIP-seq) relies on statistical procedures that highlight
Figure 3. Visualizations of genetic variant data. (A) A view of the Allele Frequency page of the Variant Navigator, which compares allele frequenciesof genetic variants from two cohorts from the 1000 Genomes Project. At most positions the frequencies are similar between cohorts, though there arepositions that exhibit different frequencies. (B) An LD plot of variants in the same range as on the left. Blue and red cells represent low and highcorrelation between variant positions, respectively.
Table 1. List of selected Savant plugins
Plugin Description
Chromatogram Shows Sanger sequencing chromatogramsoverlaid on the reference genome
edgeR Detects and visualizes differential enrichmentfrom RNA-seq or ChIP-seq data
Data table Shows textual data from track records intabular form
GATK Predicts and visualizes genotypes fromread alignment tracks
Gene ontology Guides navigation based on ontology termsPING Guides navigation based on protein–protein
interaction databasesRemote
commanderIssue navigation and other commands
remotely through external toolsRibosome Shows the amino acid translation of
gene tracksRNA-seq
analyzerReconstructs and estimates isoforms from
RNA-seq dataSimpleSNP Predicts and visualizes SNVs from read
alignment tracksSnapshot Exports track images at every bookmarked
genomic regionSRMA Realigns HTS read alignmentsUCSC explorer Provides a graphical interface for
loading UCSC tracksWikiPathways Guides navigation based on biological pathways
Plugins are available for installation directly through the built-in PluginManager.
Nucleic Acids Research, 2012, Vol. 40, Web Server issue W619
Dow
nloaded from https://academ
ic.oup.com/nar/article/40/W
1/W615/1074612 by guest on 29 January 2022
differential regions. For example, the density of mappedreads in a particular genomic region may represent enrich-ment level of a protein–DNA interaction (ChIP-seq), orgene expression level (RNA-seq). The edgeR plugin is awrapper for software written in the R statisticalprogramming language for the detection of significantlydifferentially enriched regions or expressed genes, relativeto observed biological variation, directly within Savant(12). The plugin computes on multiple BAM tracks, somedesignated as Case and others as Control, and provides atable of ranked results, including the region locations,log-fold-changes, P-values and estimated false discoveryrates of the change between conditions.
WikiPathways plugin
WikiPathways is an open collaborative platform for thecuration of biological pathways (13). The WikiPathwaysplugin provides an interface to search, browse and visual-ize the over 1500 pathways available from this platform,and to use pathways to guide navigation to relevantgenomic locations within Savant. The use of functionalannotations for navigation through large genomes repre-sents a significant departure from existing navigation tech-niques, which are almost entirely based on linear scanning.
PING: protein interaction network to genome plugin
To better understand the functional consequences ofsequence variants it is necessary to look beyond thegenome, to gene products and their interactions, especiallywhen dealing with complex (i.e. non-monogenic) diseases.Given a query gene, the PING plugin allows one to viewthe partner genes (interactors) that engage in knownprotein–protein interactions, mapped across the genome.The program provides hyperlinks to further information:to Entrez for information about each interactor, toiRefWeb (14) for query-interactor information and toDAnCER (15) for gene annotations including associationsto disease and GO (16).
Application plugins
A large number of computational tools have been de-veloped for analyzing HTS data but nearly all requirecommand-line invocation and have file-based input andoutput. These programs can be easily chained togetherand run on large data sets, however such conveniencehampers the ability to efficiently fine-tune their parametersand severely restricts their use mainly to computationalspecialists. The SSDK has been expanded to support theincorporation of a wide array of genomic tools withinSavant, thereby unlocking opportunity for performingmany computational analyses within a powerful visual en-vironment. Now, with a minimal amount of effort—namely, specification of the program’s input, output andparameters—virtually any command-line tool thatcomputes on genomic data can be incorporated as aplugin within Savant, and its results rendered as a trackimmediately upon completion. This functionality is similarto that provided by the Galaxy Track Browser (GTB) (17)as part of the larger Galaxy framework (18), the key dis-tinction being that Galaxy is a web based, server-side
package, whereas Savant is client-side. To illustrate thisability we have built wrappers for two popular applica-tions: the Unified Genotyper of the Genome AnalysisToolkit (GATK) and the Short Read Micro Realigner(SRMA).
GATK pluginGATK predicts SNPs and indels from HTS read align-ments (19). While this genotyper is modeled to accountfor technology-specific biases automatically, it is stillhighly tuneable, allowing users to carefully adjust the sen-sitivity of the underlying detection algorithm. The GATKplugin is an XML specification of the input, output andparameters of the Unified Genotyper. These parametersare specified within Savant, which invokes the genotyper,and subsequently visualizes the resulting VCF file. Theplugin can quickly compute and visualize genotypes fora segment of the genome, allowing for rapid anddynamic experimentation with program parameters,prior to invoking the tool on a whole-genome scale.
SRMA pluginRead alignment tools consider each read independently.In the absence of additional information the precise pos-itioning of indels within a mapped read is difficult, par-ticularly towards the ends of reads where sequencingquality tends to deteriorate. SRMA is a tool thatperforms realignment of previously mapped reads basedon a local consensus (20), with the aim of sharing infor-mation across reads so as to remove false positives andproperly place aberrantly positioned variants. Like theGATK plugin, the SRMA plugin is a wrapper aroundthis command-line tool that facilitates its running withinthe visual environment of Savant, making possiblereal-time realignment of track reads and further deploy-ment on a whole genome scale.
DISCUSSION AND FUTURE WORK
Despite the proliferation of automated tools for computa-tion on HTS data, human interpretation is still necessaryfor its analysis. A lack of tools that support visual analysisof HTS data has precluded efficient interpretation of data,especially for biologists without significant informaticsexpertise. The Savant Genome Browser has beendesigned to meet the demands of even large populationsequencing efforts. In addition to having extended dataaccess and support, the current version of Savantdelivers creative visualization representations for HTSdata and a significantly upgraded plugin architecturethat provides the opportunity to incorporate any compu-tational tool within a visual environment.
We believe that synergizing the processes of visualiza-tion and analysis of genomic data significantly improveson the capabilities of current genome browsers. To enablethis, we will work to further develop the Savant pluginenvironment and to work with developers to incorporatenew visualizations, analytics and tools into the browser.We welcome developers to join the Savant Community,download the SSDK (which includes source code forsample plugins and the API) and contribute to the project.
W620 Nucleic Acids Research, 2012, Vol. 40, Web Server issue
Dow
nloaded from https://academ
ic.oup.com/nar/article/40/W
1/W615/1074612 by guest on 29 January 2022
ACKNOWLEDGEMENTS
We thank the Savant User Community for feedback onour tool, and the Savant Developers for submittedplugins.
FUNDING
CIHR Tools, Techniques and Innovation grant andMITACS Seed (to M.B.); the OGI SPARK (to M.B.and M.F.); an NSERC Graduate Fellowship (to M.F.);Google Summer of Code. Funding for open access charge:CIHR.
Conflict of interest statement. None declared.
REFERENCES
1. Kent,W.J., Sugnet,C.W., Furey,T.S., Roskin,K.M., Pringle,T.H.,Zahler,A.M. and Haussler,D. (2002) The Human GenomeBrowser at UCSC. Genome Res., 12, 996–1006.
2. Robinson,J.T., Thorvaldsdottir,H., Winckler,W., Guttman,M.,Lander,E.S., Getz,G. and Mesirov,J.P. (2011) Integrativegenomics viewer. Nature Biotechnol., 29, 24–26.
3. Fiume,M., Williams,V., Brook,A. and Brudno,M. (2010) Savant:genome browser for high-throughput sequencing data.Bioinformatics, 26, 1938–1944.
4. Karolchik,D., Baertsch,R., Diekhans,M., Furey,T.S., Hinrichs,A.,Lu,Y.T., Roskin,K.M., Schwartz,M., Sugnet,C.W., Thomas,D.J.et al. (2003) University of California Santa Cruz The UCSCGenome Browser database. Nucleic Acids Res., 31, 51–54.
5. Yoon,S., Xuan,Z., Makarov,V., Ye,K. and Sebat,J. (2009)Sensitive and accurate detection of copy number variants usingread depth of coverage. Genome Res., 19, 1586–1592.
6. Medvedev,P., Fiume,M., Dzamba,M., Smith,T. and Brudno,M.(2010) Detecting copy number variation with mated short reads.Genome Res., 20, 1613–1622.
7. The 1000 Genomes Project Consortium (2010) A map of humangenome variation from population-scale sequencing. Nature, 467,1061–1073.
8. O’Roak,B.J., Deriziotis,P., Lee,C., Vives,L., Schwartz,J.J.,Girirajan,S., Karakoc,E., MacKenzie,A.P., Ng,S.B., Baker,C.et al. (2011) Exome sequencing in sporadic autism spectrumdisorders identifies severe de novo mutations. Nat. Genet., 43,585–589.
9. Danecek,P., Auton,A., Abecasis,G., Albers,C.A., Banks,E.,DePristo,M.A., Handsaker,R.E., Lunter,G., Marth,G.T.,Sherry,S.T. et al. and 1000 Genomes Project Analysis Group(2011) The variant call format and VCFtools. Bioinformatics, 27,2156–2158.
10. Barrett,J.C., Fry,B., Maller,J. and Daly,M.J. (2005) Haploview:analysis and visualization of LD and haplotype maps.Bioinformatics, 21, 263–265.
11. Trapnell,C., Williams,B.A., Pertea,G., Mortazavi,A., Kwan,G.,van Baren,M.J., Salzberg,S.L., Wold,B.J. and Pachter,L. (2010)Transcript assembly and quantification by RNA-Seq revealsunannotated transcripts and isoform switching during celldifferentiation. Nat. Biotech., 28, 511–515.
12. Robinson,M.D., McCarthy,D.J. and Smyth,G.K. (2010) edgeR: aBioconductor package for differential expression analysis ofdigital gene expression data. Bioinformatics, 26, 139–140.
13. Pico,A.R., Kelder,T., van Iersel,M.P., Hanspers,K., Conklin,B.R.and Evelo,C. (2008) WikiPathways: pathway editing for thepeople. PLoS Biol., 6, e184+.
14. Turner,B., Razick,S., Turinsky,A.L., Vlasblom,J., Crowdy,E.K.,Cho,E., Morrison,K., Donaldson,I.M. and Wodak,S.J. (2010)iRefWeb: interactive analysis of consolidated protein interactiondata and their supporting evidence. Database, 2010. October 12(doi: 10.1093/database/baq023; epub ahead of print).
15. Turinsky,A.L., Turner,B., Borja,R.C., Gleeson,J.A., Heath,M.,Pu,S., Switzer,T., Dong,D., Gong,Y., On,T. et al. (2011)DAnCER: disease-annotated chromatin epigenetics resource.Nucleic Acids Res., 39, D889–D894.
16. Ashburner,M., Ball,C.A., Blake,J.A., Botstein,D., Butler,H.,Cherry,J.M., Davis,A.P., Dolinski,K., Dwight,S.S., Eppig,J.T.et al. (2000) Gene Ontology: tool for the unification of biology.Nat. Genet., 25, 25–29.
17. Goecks,J., Li,K., Clements,D., Team,T.G. and Taylor,J. (2011)The Galaxy Track Browser: transforming the genome browserfrom visualization tool to analysis tool. In Biological DataVisualization (BioVis), 2011 IEEE Symposium on IEEE,pp. 39–46.
18. Goecks,J., Nekrutenko,A., Taylor,J. and Galaxy Team. (2010)Galaxy: a comprehensive approach for supporting accessible,reproducible, and transparent computational research in the lifesciences. Genome Biol., 11, R86+.
19. McKenna,A., Hanna,M., Banks,E., Sivachenko,A., Cibulskis,K.,Kernytsky,A., Garimella,K., Altshuler,D., Gabriel,S., Daly,M.et al. (2010) The Genome Analysis Toolkit: a MapReduceframework for analyzing next-generation DNA sequencing data.Genome Res., 20, 1297–1303.
20. Homer,N. and Nelson,S. (2010) Improved variant discoverythrough local re-alignment of short-read next-generationsequencing data using SRMA. Genome Biol., 11, R99+.
Nucleic Acids Research, 2012, Vol. 40, Web Server issue W621
Dow
nloaded from https://academ
ic.oup.com/nar/article/40/W
1/W615/1074612 by guest on 29 January 2022