Saurashtra Universityetheses.saurashtrauniversity.edu/216/1/chakrabartty_pk_thesis_bm.pdfI am also...
331
Saurashtra University Re – Accredited Grade ‘B’ by NAAC (CGPA 2.93) Chakrabartty, Pinak K., 2006, Problems and Remedies of Process Houses of South Gujarat Region, thesis PhD, Saurashtra University http://etheses.saurashtrauniversity.edu/id/eprint/216 Copyright and moral rights for this thesis are retained by the author A copy can be downloaded for personal non-commercial research or study, without prior permission or charge. This thesis cannot be reproduced or quoted extensively from without first obtaining permission in writing from the Author. The content must not be changed in any way or sold commercially in any format or medium without the formal permission of the Author When referring to this work, full bibliographic details including the author, title, awarding institution and date of the thesis must be given. Saurashtra University Theses Service http://etheses.saurashtrauniversity.edu [email protected] © The Author
Transcript of Saurashtra Universityetheses.saurashtrauniversity.edu/216/1/chakrabartty_pk_thesis_bm.pdfI am also...

Saurashtra University Re – Accredited Grade ‘B’ by NAAC (CGPA 2.93)
Chakrabartty, Pinak K., 2006, Problems and Remedies of Process Houses of South Gujarat Region, thesis PhD, Saurashtra University
http://etheses.saurashtrauniversity.edu/id/eprint/216 Copyright and moral rights for this thesis are retained by the author A copy can be downloaded for personal non-commercial research or study, without prior permission or charge. This thesis cannot be reproduced or quoted extensively from without first obtaining permission in writing from the Author. The content must not be changed in any way or sold commercially in any format or medium without the formal permission of the Author When referring to this work, full bibliographic details including the author, title, awarding institution and date of the thesis must be given.
Saurashtra University Theses Service http://etheses.saurashtrauniversity.edu
© The Author
PROBLEMS AND REMEDIES OF PROCESS HOUSES
OF SOUTH GUJARAT REGION
The Thesis
Submitted by Pinak K. Chakrabartty
(Senior Lecturer)
SPB English Medium College of Commerce Athwalines
Surat.
For the Degree of
Doctor of Philosophy in
Commerce
Under the guidance of
Dr. Alok Kumar Chakrawal (Associate Professor)
Department of Commerce and Buiness Administration Saurashtra University
Rajkot.
YEAR : 2006
DEDICATED TO
MY
“PARENTS”
AND
“GURU- Dr. Alok Kumar Chakrawal”

DECLARATION
I, the undersigned Pinak K. Chakrabartty, a research student of
Department of Commerce and Business Administration, Saurashtra
University, Rajkot hereby acknowledge that the research work in this thesis
is my own and it is guided and supervised by Dr. Alok Kumar Chakrawal,
Associate Professor, Department of Commerce and Business
Administration, Saurashtra University, Rajkot.
I also acknowledge that the thesis has not been submitted to any other
university / Institution for any Degree of Award.
(Pinak K. Chakrabartty)
Dr. Alok Kumar Chakrawal (Associate Professor)
Department of Commerce and Business Administration Saurashtra University Rajkot-360 005
C E R T I F I C A T E
This is to certify that Mr. Pinak K. Chakrabartty carried out the
research work embodied in this thesis under my supervision and to the best
of my knowledge this is his own original contribution. Further, the work
contained in this thesis has not been previously submitted to any other
University for any degree.
- Dr. Alok Kumar Chakrawal (Associate Professor)

A C K N O W L E D G E M E N T
I would like to express my regards to Dr. Alok Kumar Chakrawal,
(Associat Professor) at Post – Graduate Department of Commerce and
Business Administration, Saurashtra University, Rajkot. I thank him for his
immense support during the period of my study. I am also highly indebted to
him for his invaluable guidance and kind supervision. He has encouraged
me by creating lively interest in my research. This work would not have
been possible without his constat guidance and efforts. I express my deep
sense of gratitude to Dr. Alok Kumar Chakrawal.
I am also thankful to all the officials of governmental and non-
governmental agencies for providing me the required literature and
material for this research work. I am also thankful to all the process houses
for giving me co-operation in providing information of their enterprises for
the study.
Last, but not the least, I express my deep gratitude to my wife for her
co-operation and inspiration during the course of study.
(Pinak K. Chakrabartty)

I N D E X
Sr. Name of the Chapter Page No.
C H A P T E R – 1 INTRODUCTION
1.1 Introduction 002 1.2 Research problem 003 1.3 Type of research 003 1.4 Nature of research 004 1.5 Objectives of the study 004 1.6 Major hypothesis to be tested 006 1.7 Significance of the study 006 1.8 Universe of the study 007 1.9 Method of Data collection 007 1.10 Method of Data analysis 007 1.11 Limitations of the study 008 1.12 Chapter scheme 008
C H A P T E R – 2 A BRIEF PROFILE OF TEXTILE INDUSTRY IN INDIA
2.1 Introduction 014 2.2 Classification 019 2.3 Composition 020 2.4 Establishment Period 026 2.5 Ownership type 030 2.6 Unit by nature of work 033 2.7 Activities by product types 038 2.8 Output and structure of employment 042 2.9 Technical and non-technical employment 050 2.10 Educational qualification 059 2.11 Employment by sex 061 2.12 Environment 062
Sr. Name of the Chapter Page No. 2.13 Ecology 064 2.14 Kinds of pollution and impacts 065 2.15 Eco friendly textiles 070 2.16 Effects of textile effluent on plant and Animal life 073 2.17 Impact of man’s activity on environment 074 2.18 Bat / Batneec 075 2.19 Cleaner technology advocate 076 2.20 Waste minimization in textile industry 076
CHAPTER – 3 A BRIEF PROFILE OF TEXTILE INDUSTRY IN SOUTH GUJARAT 3.1 Profile of the Textile Industry of South Gujarat 091 3.2 Environment of the Industry 100 3.3 Pattern of the growth in the South Gujarat Region 106 3.4 Technology of the Textile Industry 123 3.5 Infrastructural Facilities in South Gujarat 139
CHAPTER – 4 PROBLEMS AND REMEDIES OF PROCESS HOUSES
4.1 Introduction 181 4.2 Sources of Initial Capital 183 4.3 Financial Problems 183 4.4 Dilatory and Cumbersome Procedure 184 4.5 Problems Obtaining Loans From Banks 185 4.6 Problems of Marketing Management 188 4.7 Education of the Entrepreneurs and Volume of Sales 189 4.8 Determining Distribution Channels 190 4.9 Advertising of the Product 191 4.10 Problems of Marketing 192 4.11 Personnel Problems (Labour) 197

Sr. Name of the Chapter Page No.
4.12 Recruitment of the Workers 199 4.13 Labour Problems in the Units 199 4.14 Problems of Production Management 203 4.15 Noise Pollution and Other Pollution 208
CHAPTER – 5 RESEARCH RESULT
5.1 Introduction 221 5.2 Classification & Tabulisation 222 5.3 Analysis of Classification & Tabulisation 239
CHAPTER – 6 CONCLUSION
6.1 Findings 287
6.2 Suggestions 289
6.3 Conclusion 296
Appendix – I : Questionnaire
Appendix – II : Bibliography
Appendix – III : List of Industries
1
C H A P T E R – 1
INTRODUCTION
1.1 Introduction
1.2 Research Problem
1.3 Type of Research
1.4 Nature of Research
1.5 Objectives of the Study
1.6 Major Hypothesis to be tested
1.7 Significance of the Study
1.8 Universe of the Study
1.9 Method of Data Collection
1.10 Method of Data Analysis
1.11 Limitations of the Study
1.12 Chapter Scheme

2
1.1 Introduction :
In India, Textile Industries hold a vital place in the National
Economy. It is the 3rd largest organized industry in the country and
accounts for about 20% of our industrial production and provides
employment to about 25% of total factory labour force. But, its
performance in the organized sector particularly in terms of labour
and machine productivity has always been substantially lower than by
our counter parts like Japan, Hong Kong, Korea, Taiwan, etc. because
of the reasons such as technological problems relating to quality,
productivity, availability of insufficient finance, and industrial unrest
besides the other environmental problems relating to the policies of
the government.
In Surat, more that 90 % non automatic looms are in the decentralized
sector. In view of the government’s policy of freezing the weaving
capacity in the mill sector in order to encourage decentralized sector
which provides larger employment opportunity, the only option is to
increase the production capacity and thus to absorb increasing fixed
expenses and to replace low production machines with high speed
machines.
As such when the polyester was 1st introduced in India, the weavers
of Surat used man made yarns in India. At that time polyester was
3
considered as a superior textile fiber filament for apparel. Thereafter
the polyester yarn and fabric industry in Surat began to flourish more
and more and a large number of weaving and other processing houses
were established in 1980 and 1990s. At present there are about 350
dyeing and printing mills in and around Surat. Most of the units thrive
on the domestic market and very few tap new markets by the way of
exports.
1.2 Research Problem :
On one hand the process houses are faced with tremendous problems
such as labour, finance, management, competition, working
conditions, etc. while on the contrary the process houses are having
good prospects also. The study has tried look into the actual
problems of the process houses in the South Gujarat Region.
The main research problem of this study is to find out problems of
process houses and remedies for the problems.
1.3 Type of Research :
The present study is of survey type in nature. It requires investigating
effort to extract the real problems and prospects of the process houses
in the South Gujarat region.

4
This study is a descriptive and analytical type of research. Descriptive
research includes surveys and fact-finding inquiries of different kinds.
The main characteristic of this study is that the researcher has no
control of the variables. Ex post facts studies also include attempts by
the researcher to discover causes even when he can not control the
variables. The methods of research utilized in descriptive research are
survey methods of all kinds. In analytical research, on other hand, the
researcher has to use facts or information already available and
analyze these to make a critical evaluation of the study.
1.4 Nature of Research :
In the present study researcher has made an attempt to study the real
problems of process houses in the South Gujarat. To examine and
evaluate the Problems and Remedies with the several related aspects
is the objective of the study; therefore this is the main reason behind
the selection of this topic for research. Hence it would be an
important contribution to the existing knowledge about process
houses.
1.5 Objectives of the Study :
[A] One of the major objectives of the study is to look into labour
problems of the process house industry. These problems can be
further divided into two broader groups; i.e (i) Labour

5
Problems faced by the industry as a whole. (ii) Problems faced
by the workers on and off the jobs.
[B] Liberalization, Privatization and Globalization have a great
impact on the economy; the present study has an objective to
study the effects of liberalization, privatization and
globalization on the process houses.
[C] The process houses are facing various types of financial
problems. The present study aims at these problems also and
the researcher has tried to probe into authenticity problems of
the process houses.
[D] Process houses are engaged in processing the grey fabric into
finished sarees and dress materials by various processors.
During the process the process houses have to face number of
technical and inventory problems. The researcher has an
objective to study these problems.
[E] The researcher has an objective to know the actual managerial
problems involved in the operation of the process houses.
[F] The process houses are not exception to sickness, as they are
also facing sickness problems due to one other. The researcher

6
has an objective to know the actual cause of the sickness of the
process houses.
1.6 Major Hypothesis to be tested :
The hypotheses for the present study are as follows:
There is no significant difference among the Labour Problems
faced by the entrepreneurs in Process Industries.
There is no significant difference among the Production Problems
faced by the entrepreneurs in Process Industries.
There is no significant difference among the Raw Material
Problems faced by the entrepreneurs in Process Industries.
There is no significant difference among the Major Problems
faced by the entrepreneurs in Process Industries.
1.7 Significance of the Study :
The present study is significant from various points of view. The
study would contribute to the society and to the knowledge and would
help academic institutions in the following manner.
Contribution to the society: The present study would contribute to
the society in several ways. The study would reveal the facts and
figures of an important industry to the society since very meager
research work has been done in this area.
7
Contribution to the knowledge; University and educational
institutions would be benefited by knowing the type of training
programme and courses offered for the growth and development of
such industry.
1.8 Universe of the Study :
This study covers all the Process Houses of South Gujarat. Thus this
is a census type of inquiry.
1.9 Method of Data Collection :
The data for the proposed study would be collected from the
following two sources.
Primary data: The primary data for the study has been collected
through the tools developed in the form of questionnaire, survey,
observation, personal interviews, etc.
Secondary data: The researcher has collected secondary data as per
the requirement from the secondary sources viz. periodicals, journals,
magazines, news papers, newsletters, etc.
1.10 Method of Data Analysis :
Primary data collected through the questionnaire is analysed with the
use of several statistical tools. Classification and tabulation &

8
diagrams and charts of the data are one of the major tools used in the
study. From the management aspect, the average, t-test have also been
used in this study.
1.11 Limitations of the Study :
The area and scope of the study is stated as below:
Geographical Area: The geographical are of the study covers the
South Gujarat region of the Gujarat state.
Functional area: Functional area covers the activity of processing of
the sarees and dress material in the process houses of the South
Gujarat region.
This study is limited only to South Gujarat Region. Therefore, its
conclusions, though very useful can not be generalized. This study is
based on present facts and the future conclusion may be, unreliable.
1.12 Chapter Scheme:
This study is divided into six chapters. They are as follows:
C H A P T E R – 1
INTRODUCTION
1.1 Introduction
1.2 Research problem

9
1.3 Type of research
1.4 Nature of research
1.5 Objectives of the study
1.6 Major hypothesis to be tested
1.7 Significance of the study
1.8 Universe of the study
1.9 Method of Data collection
1.10 Method of Data analysis
1.11 Limitations of the study
1.12 Chapter scheme
C H A P T E R – 2
A BRIEF PROFILE OF TEXTILE INDUSTRY IN INDIA
2.1 INTRODUCTION
2.2 CLASSIFICATION
2.3 COMPOSITION
2.4 ESTABLISHMENT PERIOD
2.5 OWNERSHIP TYPE
2.6 UNIT BY NATURE OF WORK
2.7 ACTIVITIES BY PRODUCT TYPES
2.8 OUTPUT AND STRUCTURE OF EMPLOYMENT
2.9 TECHNICAL AND NON-TECHNICAL EMPLOYMENT
10
2.10 EDUCATIONAL QUALIFICATION
2.11 EMPLOYMENT BY SEX
2.12 ENVIRONMENT
2.13 ECOLOGY
2.14 KINDS OF POLLUTION AND IMPACTS
2.15 ECO FRIENDLY TEXTILES
2.16 EFFECTS OF TEXTILE EFFLUENT ON PLANT AND ANIMAL LIFE
2.17 IMPACT OF MAN’S ACTIVITY ON ENVIRONMENT
2.18 BAT/BATNEEC
2.19 CLEANER TECHNOLOGY ADVOCATE
2.20 WASTE MINIMIZATION IN TEXTILE INDUSTRY
CHAPTER – 3
A BRIEF PROFILE OF TEXTILE INDUSTRY IN SOUTH GUJARAT
3.1 Profile of the Textile Industry of South Gujarat
3.2 Environment of the Industry
3.3 Pattern of the growth in the South Gujarat Region
3.4 Technology of the Textile Industry
3.5 Infrastructural Facilities in South Gujarat
11
CHAPTER – 4
PROBLEMS AND REMEDIES OF PROCESS HOUSES
4.1 INTRODUCTION
4.2 SOURCES OF INITIAL CAPITAL
4.3 FINANCIAL PROBLEMS
4.4 DILATORY AND CUMBERSOME PROCEDURE
4.5 PROBLEMS OBTAINING LOANS FROM BANKS
4.6 PROBLEMS OF MARKETING MANAGEMENT
4.7 EDUCATION OF THE ENTREPRENEURS AND VOLUME OF SALES
4.8 DETERMINING DISTRIBUTION CHANNELS
4.9 ADVERTISING OF THE PRODUCT
4.10 PROBLEMS OF MARKETING
4.11 PERSONNEL PROBLEMS (LABOUR)
4.12 RECRUITMENT OF THE WORKERS
4.13 LABOUR PROBLEMS IN THE UNITS
4.14 PROBLEMS OF PRODUCTION MANAGEMENT
4.15 NOISE POLLUTION AND OTHER POLLUTION

12
CHAPTER – 5
RESEARCH RESULT
5 .1 INTRODUCTION
5 .2 CLASSIFICATION & STABILISATION
5 .3 ANALYSIS OF CLASSIFICATION & STABILISATION
CHAPTER – 6
CONCLUSION
6.1 Findings
6.2 Suggestions
6.3 Conclusion
APPENDIX – I : QUESTIONNAIRE
APPENDIX – II : BIBLIOGRAPHY
APPENDIX – III : LIST OF INDUSTRIES
The above six chapters comprise of the detailed analysis of the process
industries in the South Gujarat Region.

13
CHAPTER-2
A BRIEF PROFILE OF TEXTILE INDUSTRY IN INDIA
2.1 INTRODUCTION
2.2 CLASSIFICATION
2.3 COMPOSITION
2.4 ESTABLISHMENT PERIOD
2.5 OWNERSHIP TYPE
2.6 UNITS BY NATURE OF WORK
2.7 ACTIVITIES BY PRODUCT TYPES
2.8 OUTPUT AND STRUCTURE OF EMPLOYMENT
2.9 TECHNICAL AND NON-TECHNICAL EMPLOYMENT
2.10 EDUCATIONAL QUALIFICATION
2.11 EMPLOYMENT BY SEX
2.12 ENVIRONMENT
2.13 ECOLOGY
2.14 KINDS OF POLLUTION AND IMPACTS
2.15 ECO FRIENDLY TEXTILES
2.16 EFFECTS OF TEXTILE EFFLUENT ON PLANT AND ANIMAL LIFE
2.17 IMPACT OF MAN’S ACTIVITY ON ENVIRONMENT
2.18 BAT/BATNEEC
2.19 CLEANER TECHNOLOGY ADVOCATE
2.20 WASTE MINIMIZATION IN TEXTILE INDUSTRY
14
2.1 Introduction :
The significance of the Indian Textile Industry to national economy is
eminent from the fact that it is the prime contributor to value addition
and employment in manufacturing as well as export sector.
It contributes 8% to the Gross Domestic Product (GDP) and 20% to
the Industrial Production of the country. Exports from the textile
industry accounts for, almost 37% of the total export earnings, with a
minimum import content of less than 2%. This industry is the basic
source of clothing, and its health affects a large section of the
population involved in production, procurement, marketing and
consumption. [1]
In all, the sector employs as many as 93 million people providing a
direct employment to 38 million people, while the rest 55 million
people are being employed in textile related agricultural activities.
The manufacturing of textiles (Natural and Man Made) can generally
be divided into three stages. Spinning, Weaving and Processing.
The processing stage involves a treatment of woven fabric with
chemical and other substance in order to impart special properties to
the fabrics. [2]

15
The most common operations of this stage are bleaching, dyeing,
printing and mercerizing. The processing of the yarn and fabric,
contributes for the aesthetic value-addition in terms of colour, motifs
and geometrical designs. Besides these aesthetic requirements, a set
of consumer demand goes in favour of colour fastness to washing,
lights, perspiration and easy care requirements.
Also, of late, newer demands for perfumed fabrics, odourless fabrics
and so on have added new dimensions to the product quality, which
are compatible and could be met through chemical processing.
Moreover apart from the customer demands, certain so called non-
tariff barriers like banning of AZO dyes and other harmful chemicals
have also emerged.
One such barrier is the German ban on the textile products processed
with AZO dyes, which has significantly driven the textile processing
towards Eco friendly processes. [3]
As in weaving, the processing operation also takes place both in the
organised and the unorganised sectors. In the organised sector, in
addition to the composite mill (spinning, weaving and processing)
and semi composite units, processing is done in independent
processing houses organised on a factory basis.

16
In the decentralised sector, analogous to the distinction between
power looms and handlooms, there are small scale power processors,
as well as processors using traditional techniques. [4]
The processing activities in the textile industry are carried out in
Composite Mills, Spinning Units, Weaving/Knitting units and
independent process houses. The composite units have facilities for
manufacturing yarns and fabrics in addition to the infrastructural
facilities for major processing activities. These units are normally
large and all the three activities of spinning, weaving and processing
are carried out under one roof. Sometimes the spinning mills also
have processing units attached to them.
Some of the units have weaving and processing. Besides, there are
processing units that operate independently to cater to the processing
needs of their own work or that of the textile industry on the job-work
basis.
The type of operational facilities, manpower employment and
machinery deployed, the structural background etc., sharply
differentiate the processing units. For example the process houses
attached to composite mills get the grey cloth from the loom shed of
the mill. [5]
17
The fabric parameters such as weight per Square Mt. reed/picks etc.
are uniform and hence the processing is done with a relatively higher
degree of precision.
The composite mills have the capability for technology upgradation.
They are also capable of importing the state of art technologies for
production, quality control and testing to achieve the optimality
conditions to a greater extent, apart from employing the technically
qualified and experienced manpower to handle shop floor activities.
The semi-composite units where processing facilities such as spinning
and processing, weaving and processing or knitting and processing
are available are observed to be more or less specialized. The product
manufactured in the units goes for processing like the composite
units.
The only difference that exists in Semi-Composite Units as compared
to composite units is that, they do not carry out all the three activities
of spinning, weaving and processing.
The processed product quality is relatively better than the unorganised
independent process houses and the units are able to work under the
principles of economies of scale.
18
Further the personnel employed are qualified and experienced to
handle the sophisticated processing machinery, except in the case of
processing units.
The composite sector is capable of importing the state of art
technologies to integrate in the existing environment.
The independent process houses on the other hand, are unable to
control variation in processing parameters owing to lack of uniformity
in the fabric produced from the loom shed of the decentralised sector
of power looms.
Only those independent process houses, which are more organised,
have machines with modern technology and technically qualified
manpower maintaining controlled condition in developing the desired
quality product. As such in general the degree and nature of
technology sophistication greatly varies from unit to unit. The
maintenance of quality inclusion of quality control equipments and
provision of testing facilities vary, depending on the general attitude
and decision of the management. Further any inclusion of latest
generation processing machines, quality control equipments solely
depends on the extent and demand and profits of the customers.
Within the sector, the Small Scale Industry (SSI) presents a pitiable

19
situation of having the most obsolete and rudimentary type of
machines to process.
The quality of manpower ranges from both highly qualified to non-
qualified personnel. The independent process houses present a picture
of dualism with the most sophisticated state of art machinery to the
obsolete/outdated ones; their shop floor activities being carried out
with higher qualified personnel to most of the qualified personnel
surviving merely due to their experience. [6]
2.2 CLASSIFICATION :
The processing sector as a whole has been broadly classified into
three categories, i.e., the composite, semi composite and independent
process houses. The units having the facilities for manufacturing the
yarn and fabric; and also having the infrastructure facilities for major
processing activities have been classified under composite unit.
The spinning mills having processing facility of their own, the units
having weaving and processing and also knitting and processing
houses are classified as semi composite units.
These processing units, which operate independently to cater to the
processing needs of their own work or to the work of the textile
20
industry on the job work basis are classified as independent
processing units.
However some units have large scale processing activities while the
others process on a small scale. Accordingly these process houses are
further classified into Small Scale Industry (SSI) and Non-SSI
category. [7]
2.3 COMPOSITION :
For the sake of presentation of the number of units present in different
locations of the country by their status they have been segregated
according to the major states and union territories and also by major
concentration centres. In all, the total number of power processing
units in the country as enumerated stands at 2324.
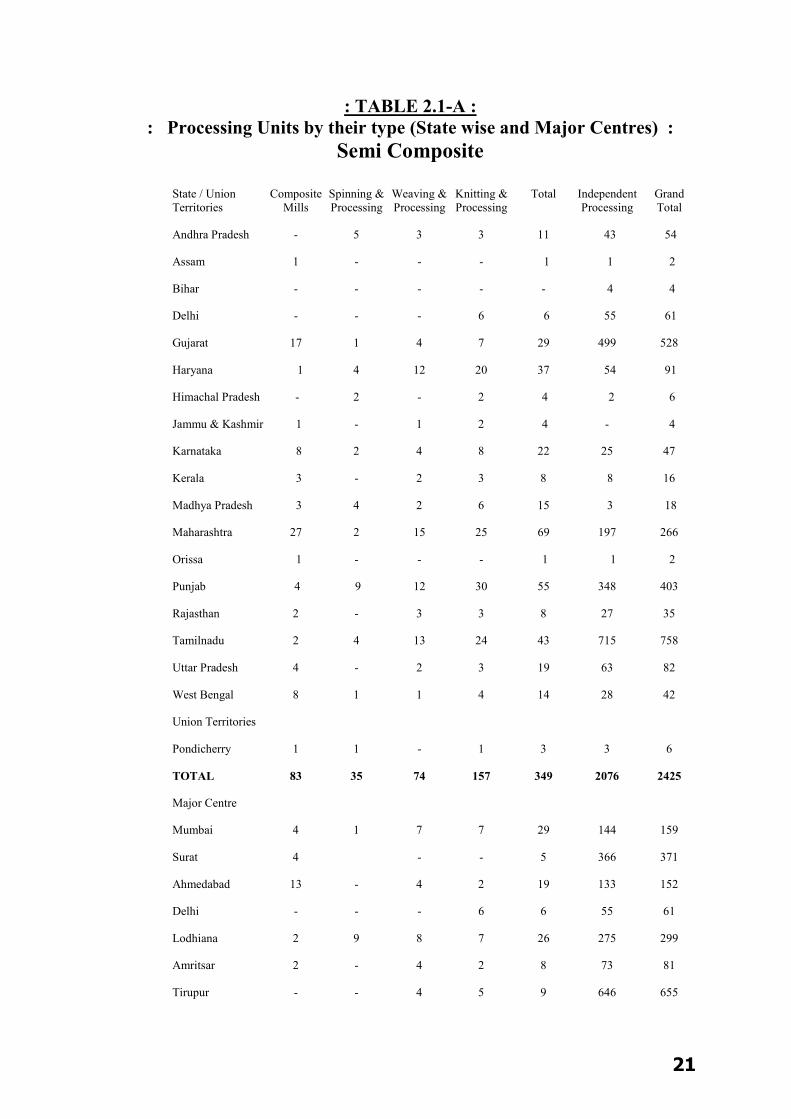
The census has identified as many as 83 composite units, 165 semi
composite units and 2076 independent processing units. Out of these
165 semi composite units, 35 belong to the spinning and processing
sector, 74 units belong to weaving and processing; and 56 are of
knitting and processing type.
21
: TABLE 2.1-A : : Processing Units by their type (State wise and Major Centres) :
Semi Composite
State / Union Composite Spinning & Weaving & Knitting & Total Independent Grand Territories Mills Processing Processing Processing Processing Total
Andhra Pradesh - 5 3 3 11 43 54
Assam 1 - - - 1 1 2
Bihar - - - - - 4 4
Delhi - - - 6 6 55 61
Gujarat 17 1 4 7 29 499 528
Haryana 1 4 12 20 37 54 91
Himachal Pradesh - 2 - 2 4 2 6
Jammu & Kashmir 1 - 1 2 4 - 4
Karnataka 8 2 4 8 22 25 47
Kerala 3 - 2 3 8 8 16
Madhya Pradesh 3 4 2 6 15 3 18
Maharashtra 27 2 15 25 69 197 266
Orissa 1 - - - 1 1 2
Punjab 4 9 12 30 55 348 403
Rajasthan 2 - 3 3 8 27 35
Tamilnadu 2 4 13 24 43 715 758
Uttar Pradesh 4 - 2 3 19 63 82
West Bengal 8 1 1 4 14 28 42
Union Territories
Pondicherry 1 1 - 1 3 3 6
TOTAL 83 35 74 157 349 2076 2425
Major Centre
Mumbai 4 1 7 7 29 144 159
Surat 4 - - 5 366 371
Ahmedabad 13 - 4 2 19 133 152
Delhi - - - 6 6 55 61
Lodhiana 2 9 8 7 26 275 299
Amritsar 2 - 4 2 8 73 81
Tirupur - - 4 5 9 646 655
22
In all total number of power processing units in the country as
enumerated stands at 2425 out of which 83 are composite units, 348
semi composite units and 2076 are independent processing units. Out
of 349 composite units 35 belong to spinning and processing sector
and 74 belong to weaving and processing; and 57 belong to knitting
and processing type.
The state wise position of the power processing units shows that 1955
units (81%) belong to Gujarat, Maharashtra, Tamilnadu and Punjab.
The concentration of processing units irrespective of their sectors,
indicates that the highest number of units are located in Tamilnadu
(758), followed by Gujarat (528), Punjab (403) and Maharashtra
(266). In Tamilnadu, the major concentration of processing units is in
Tirupur, which houses as large as 655 units constituting more than
88% of the total units located in the State. Ludhiana, Surat, Mumbai
and Ahmedabad are the major centres for the textile processing which
constitutes 74%, 70%, 59% and 29% respectively to the state total.
As far as the position of composite processing units is concerned, the
maximum number of composite units are established in the State of
Maharashtra numbering 27 out of which 14 (52%) are concentrated in
the State Capital and Commercial Capital, i.e., Mumbai in the
country. The other important state which houses more number of

23
composite units (17) is Gujarat. Out of the 17 composite units of the
State, 13 (77%) are located in Ahmedabad.
As far as Spinning and Processing Units in the Semi Composite
Sectors are concerned, out of 35 units, nine units are located in
Punjab, 5 units in Andhra Pradesh, 4 Haryana, 4 in Madhya Pradesh
and 4 in Tamil Nadu. The striking feature is that the less textile
developed states like Andhra Pradesh, Madhya Pradesh and Haryana
house more number of Spinning and Processing Units. The reason for
this could be that these Spinning and Processing activities draw their
strength from the availability of raw cotton. Out of 74 Weaving and
Processing units are 5 units located in Maharashtra, 13 units in Tamil
Nadu and 2 units each in the State of Punjab and Haryana.
Out of the total 157 Knitting and Processing Units, 3 are in Uttar
Pradesh, 30 in Punjab, 25 in Maharashtra and 24 in Tamil Nadu. In
the case of Independent Category, there are 2076 Independent Process
houses which constitute 85% of the total Processing Industry in the
country. These process houses either work for their own jobs or
accept job works from the industry. The largest number of
independent process houses is in the State of Tamil Nadu (715)
followed by Gujarat (499), Punjab (348) and Maharashtra (197).
24
The major concentration is in the areas of Tirupur (646) followed by
Surat (366), Ludhiana (275), Mumbai (144), Ahmedabad (133),
Amritsar (73) and Delhi (55).
The fabrics that are mostly processed in these textile centres include
Knitted Cotton fabrics in Tirupur, Synthetic Sarees and made up in
Surat, Synthetic Knitted fabrics in Ludhiana, Cotton, Synthetic
blend/mixed fabrics in Mumbai and Ahmedabad.
The distributions of SSI and Non-SSI units across the State are
presented in Table 2.1-B. The composite units are normally large and
investment is also huge in these industries, therefore none of the units
in the composite sector is included in SSI category.
All 83 units in the composite sector belong to Non-SSI. The units in
the semi compositions, independent factor indicate 1378 units (59%)
belong to SSI while 946 units (41%) belong to Non-SSI. Gujarat
shows approximately 50% from SSI and 50% from Non-SSI, while
Punjab and Tamil Nadu indicate more of SSI Units over Non-SSI.
Similarly in major concentration centres, such as Surat shows 50%
from each category while Ahmedabad and Delhi indicate more Non-
SSI units to the SSI units. [8]

25
: TABLE 2.1-B: : Units under SSI and Non-SSI (State wise and Major Centers ) :
State / Union Composite Semi-Composite Independent Total
Territories Non-SSI SSI Non-SSI SSI Non-SSI SSI Non-SSI
Andhra Pradesh - 1 10 34 9 35 19
Assam 1 - - 1 - 1 1
Bihar - - - 4 - 4 -
Delhi - - 6 25 30 25 36
Gujarat 17 - 7 247 252 247 276
Haryana 1 11 9 29 25 40 35
Himachal Pradesh - - 2 - 2 - 4
Jammu & Kashmir 1 - 2 - - - 3
Karnataka 8 - 8 7 8 17 24
Kerala 3 2 1 3 5 5 9
Madhya Pradesh 3 - 6 2 2 10
Maharashtra 27 8 17 115 82 123 126
Orissa 1 - - 1 - 1 1
Punjab 4 2 8 224 124 236 146
Rajasthan 2 2 8 19 9 23
Tamilnadu 2 5 19 561 54 566 175
Uttar Pradesh 4 7 6 38 25 45 35
West Bengal 8 2 2 18 10 20 20
Union Territories
Pondicherry 1 - 1 2 2 3
TOTAL 83 49 116 1329 742 1321 946
Major Centre
Mumbai 14 3 12 79 65 87 91
Surat 4 - 87 79 187 184
Ahmedabad 13 - 6 60 73 60 92
Delhi - - 6 25 30 25 36
Lodhiana 2 9 15 69 106 178 123
Amritsar 2 3 3 55 18 58 23
Tirupur - 3 6 518 128 521 134

26
Amritsar and Tirupur show more of the SSI units as compared to
Non-SSI units.
Within the independent units, 1329 units (64%) belong to SSI and
remaining 747 units (36%) belong to Non-SSI. [9]
2.4 ESTABLISHMENT PERIOD :
The processing units in the country were established in different
period and continue to operate over a period of time. The units
process and add new machines and machinery on the demand of time.
Few of the processing units also close down on account of their
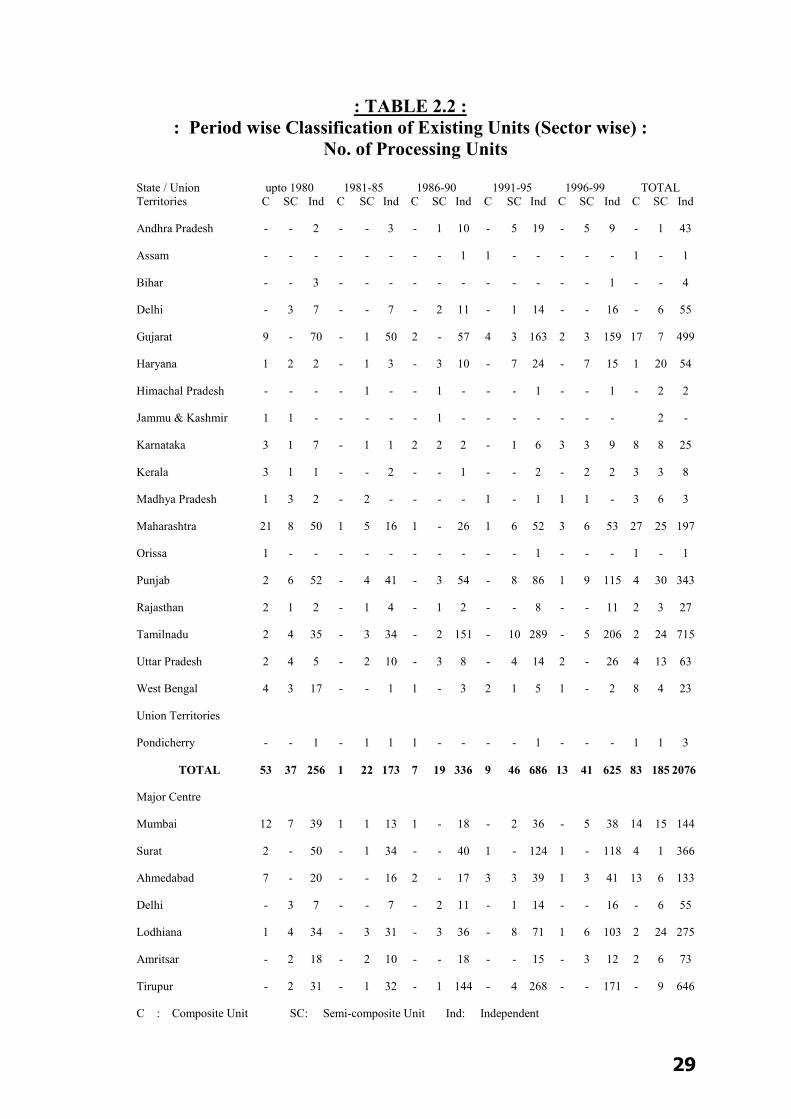
problems. Table; 2.2 presents the number of units established in
various states and major centres unto 1980. 1During 1981-85, 1986-
90, 1991-95 and 1996-99. Out of the total 2,324 units, 346 units
(15%) were established unto 1980. 196 units (8%) between1981-85,
362 units (16%) and between 1986-90, 741 units (32%) during 1991-
95 and 679 units 29%) were established during 1996-99.
A cursory look of different sectors of the industry (Table 2.2) indicate
that out of 83 composite unit, 53, units (64%) were established unto
1980, and 1 unit (1%) was established between 1981-85, 7 units (8%)
between 1986-90, 9 units (11%) between 1991-95 and rest 13 units
(16%) were established during 1996-99. Out of total 21 units
27
established in Maharashtra unto 1980, 12 were set up in Mumbai
itself. Two more units were added to the list of Mumbai during 1981-
90, Beyond 1990 no new units have come up which had been a major
textile centre in the past. The addition during the post 1990 period to
the composite sector of the processing industry are mainly contributed
from the state of Gujarat, Maharashtra, Tamil Nadu and West Bengal.
The Semi Composite Sector of the industry indicates that out of 165
units, 37 units (22%) were established unto 1980, 22 units (3%)
between 1981-85, 9 units (2%) between 1986-90, 46 units (28%)
between 1994-95 and the rest 41 units (25% during 1996-99. It is
observed from the year of establishment that more number of
processing units has been established after 1990. Of the total number
of units established and continue till date, 87 units (53%) have come
after 1990 and the largest number 46 during 1991-95.
The independent sector of the industry; indicates that out of 2,076
units (12%) were established unto 1980, 173 units (8%) between
1981-85, 336 units (16%) between 986-90, 686 units (34%) between
1991-95 and rest 625 units (30%) during 1996-99. Here too, it is
observed from the year of establishment, that more processing units
have been established in the post 1990 period.
28
Out of total number of units established and continuing till date,
1,311 (63%) have come up after 1990 and the largest number of 686
during 1991-95 Surat, Ludhiana, Ahmedabad and Tirupur, established
more units during 1991-99. The country witnessed mushrooming of
power loom units for supply of woven fabrics and the fabrics
produced from power looms needed the service of processing.
To augment the processing needs of power loom clothes the
independent process houses grew rapidly.
Regarding the SSI and Non-SSI units of the independent sector of the
1,329 independent SSI units 162 units (12%) were established unto to
1980, 106 units (8%) established in 1981-85, 221 units (6%) between
986-90, 448 units (34%) between 1991-95 and the rest 392 units
(30%) during 1996-99. Out of 74% independent Non-SSI units, 94
units (13%) were established unto 1980, 67 units (9%) were between
1981-85, 15 units (15%) in 1986-90, 238 units (32%) between 1991-
95 and the rest 233 units (31%) during 1996-99. [10]
29
: TABLE 2.2 : : Period wise Classification of Existing Units (Sector wise) :
No. of Processing Units State / Union upto 1980 1981-85 1986-90 1991-95 1996-99 TOTAL Territories C SC Ind C SC Ind C SC Ind C SC Ind C SC Ind C SC Ind
Andhra Pradesh - - 2 - - 3 - 1 10 - 5 19 - 5 9 - 1 43
Assam - - - - - - - - 1 1 - - - - - 1 - 1
Bihar - - 3 - - - - - - - - - - - 1 - - 4
Delhi - 3 7 - - 7 - 2 11 - 1 14 - - 16 - 6 55
Gujarat 9 - 70 - 1 50 2 - 57 4 3 163 2 3 159 17 7 499
Haryana 1 2 2 - 1 3 - 3 10 - 7 24 - 7 15 1 20 54
Himachal Pradesh - - - - 1 - - 1 - - - 1 - - 1 - 2 2
Jammu & Kashmir 1 1 - - - - - 1 - - - - - - - 2 -
Karnataka 3 1 7 - 1 1 2 2 2 - 1 6 3 3 9 8 8 25
Kerala 3 1 1 - - 2 - - 1 - - 2 - 2 2 3 3 8
Madhya Pradesh 1 3 2 - 2 - - - - 1 - 1 1 1 - 3 6 3
Maharashtra 21 8 50 1 5 16 1 - 26 1 6 52 3 6 53 27 25 197
Orissa 1 - - - - - - - - - - 1 - - - 1 - 1
Punjab 2 6 52 - 4 41 - 3 54 - 8 86 1 9 115 4 30 343
Rajasthan 2 1 2 - 1 4 - 1 2 - - 8 - - 11 2 3 27
Tamilnadu 2 4 35 - 3 34 - 2 151 - 10 289 - 5 206 2 24 715
Uttar Pradesh 2 4 5 - 2 10 - 3 8 - 4 14 2 - 26 4 13 63
West Bengal 4 3 17 - - 1 1 - 3 2 1 5 1 - 2 8 4 23
Union Territories
Pondicherry - - 1 - 1 1 1 - - - - 1 - - - 1 1 3
TOTAL 53 37 256 1 22 173 7 19 336 9 46 686 13 41 625 83 185 2076
Major Centre
Mumbai 12 7 39 1 1 13 1 - 18 - 2 36 - 5 38 14 15 144
Surat 2 - 50 - 1 34 - - 40 1 - 124 1 - 118 4 1 366
Ahmedabad 7 - 20 - - 16 2 - 17 3 3 39 1 3 41 13 6 133
Delhi - 3 7 - - 7 - 2 11 - 1 14 - - 16 - 6 55
Lodhiana 1 4 34 - 3 31 - 3 36 - 8 71 1 6 103 2 24 275
Amritsar - 2 18 - 2 10 - - 18 - - 15 - 3 12 2 6 73
Tirupur - 2 31 - 1 32 - 1 144 - 4 268 - - 171 - 9 646
C : Composite Unit SC: Semi-composite Unit Ind: Independent

30
2.5 OWNERSHIP TYPE :
The type of ownership has a bearing on the structure and functioning
of the processing units. In order to analyze the profile of the power
processing units, all units were classified into five categories, i.e.,
(i) Private Sector
(ii) Co-operative Sector
(iii) Central Government Undertaking
(iv) State Government Undertaking
(v) Others.
The Private Sector of industry further breaks down into:
1) Private Limited Company
2) Public Limited Company
3) Partnership
4) Sole Proprietorship
Public Limited Company is one whose share can be brought and sold
from the Stock Exchange so that any one can buy them. They are
registered under Company Act of 1956.
While a Private Limited Company has a small number of share
holders whose shares are not traded on the Stock Exchange. They are,
of course, registered as Private Limited under the Company Act of

31
1956. Registered business where the liability of share of the partners
is limited to the amount of capital they invest and their partners may
or may not take part in the running of the business, while other
working partners are fully liable for all the obligation of the
partnership, are called limited Partnership Enterprises. [8]
A unit under the ownership of a single individual is termed as Sole
Proprietorship.
The processing units, under the Co-operative fold refer to the business
run by a group of workers who are the owners and share the profits of
the unit themselves. These units are normally registered under the
Cooperative Act of 1960.
All other categories of the processing units which are not falling
under the above four groups are classified as others. For example, the
units under the joint control of State Government and Central
Government or run by a Trust and Family are included in the others
categories. [9]
The analysis of the processing units by their ownership type of
various status and their concentration centres are given below:
32
: TABLE 2.3: : Distribution of Processing Units by their Nature of work :
State / Union Own Job Work Both (Mixed) Total All All All All Units C SC Ind Units C SC Ind Units C SC Ind Units C SC Ind Andhra Pradesh 41 - 8 33 3 - - 3 10 - 3 7 54 - 11 43
Assam 1 1 - - - - - - 1 - - 1 2 1 - 1
Bihar - - - - 4 - - 4 - - - - 4 - - 4
Delhi 5 - 5 - 53 - - 53 3 - 1 2 61 - 6 55
Gujarat 35 15 5 15 44 - - 414 74 2 2 70 523 17 7 499
Haryana 25 1 16 8 40 - - 40 10 - 4 6 75 1 20 54
Himachal Pradesh 2 - 2 - - - - - 2 - - 2 4 - 2 2
Jammu & Kashmir 1 * 1 - - - - - 2 1 1 - 3 1 2 -
Karnataka 19 7 6 6 14 - - 14 8 1 2 5 41 8 8 25
Kerala 7 1 2 4 1 - - 1 6 2 1 3 14 3 3 8
Madhya Pradesh 7 1 5 - 1 - - 1 4 1 1 2 12 3 6 3
Maharashtra 44 14 13 17 102 1 1 150 53 12 11 30 249 27 25 197
Orissa 2 1 - 1 - - - - - - - - 2 1 - 1
Punjab 64 3 22 39 293 - 4 289 25 1 4 20 382 4 30 348
Rajasthan 6 2 - 4 19 - 2 17 7 - 1 6 32 2 3 27
Tamilnadu 51 1 11 39 609 - 5 604 81 1 8 72 741 1 24 715
Uttar Pradesh 10 3 3 4 61 - 8 53 9 1 2 6 80 4 13 63
West Bengal 13 8 1 4 19 - - 19 8 - 3 5 40 8 4 28
Union Territories
Pondicherry - - - - 1 - - 1 4 1 1 2 5 1 1 3
TOTAL 333 59 100 174 1684 1 20 1663 307 23 45 239 2324 83 165 2076
Major Centre
Mumbai 26 6 6 14 113 1 1 111 34 7 8 19 173 14 15 144
Surat 10 3 - 7 339 - - 339 22 1 1 20 371 4 1 366
Ahmedabad 25 12 5 8 75 - - 75 53 1 1 50 152 13 6 133
Delhi 5 - 5 - 53 - - 53 3 - 1 2 61 - 6 55
Lodhiana 28 2 19 7 263 - 3 260 10 - 2 8 301 2 24 275
Amritsar 36 1 3 32 30 - 1 29 15 1 2 12 11 2 6 73
Tirupur 31 - 2 29 566 - 3 565 56 - 4 52 655 - 9 646
C : Composite Unit SC: Semi-composite Unit Ind: Independent
33
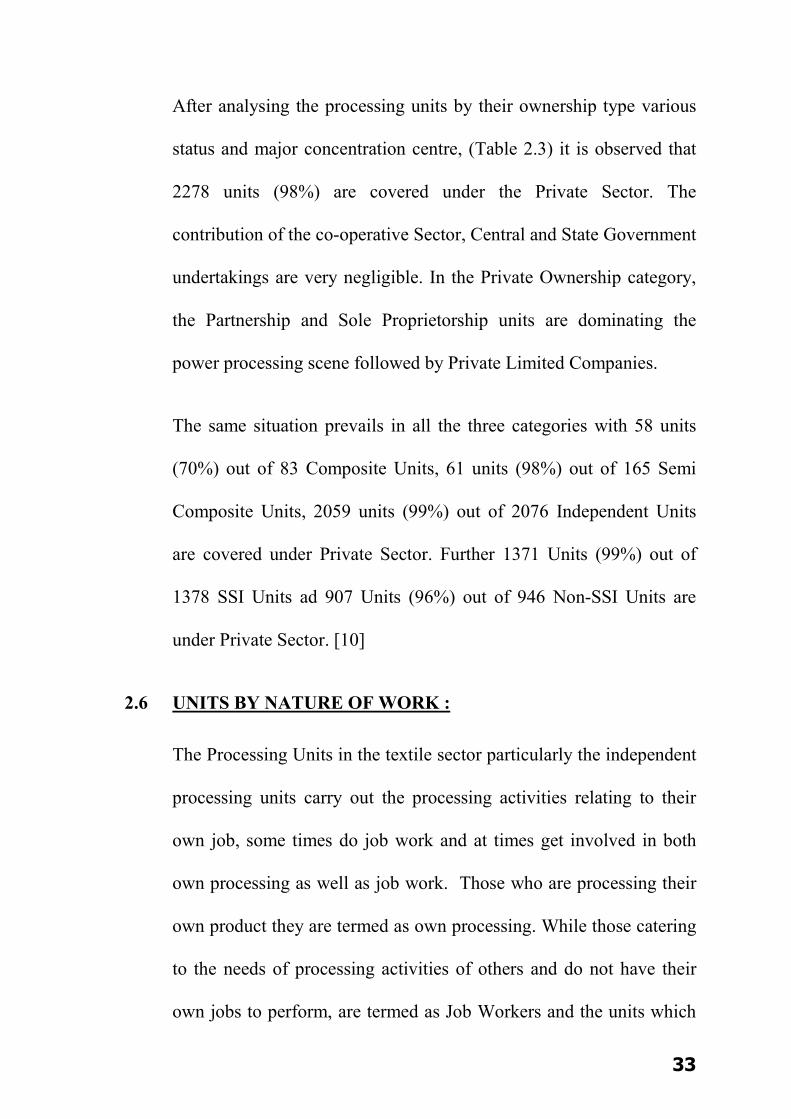
After analysing the processing units by their ownership type various
status and major concentration centre, (Table 2.3) it is observed that
2278 units (98%) are covered under the Private Sector. The
contribution of the co-operative Sector, Central and State Government
undertakings are very negligible. In the Private Ownership category,
the Partnership and Sole Proprietorship units are dominating the
power processing scene followed by Private Limited Companies.
The same situation prevails in all the three categories with 58 units
(70%) out of 83 Composite Units, 61 units (98%) out of 165 Semi
Composite Units, 2059 units (99%) out of 2076 Independent Units
are covered under Private Sector. Further 1371 Units (99%) out of
1378 SSI Units ad 907 Units (96%) out of 946 Non-SSI Units are
under Private Sector. [10]
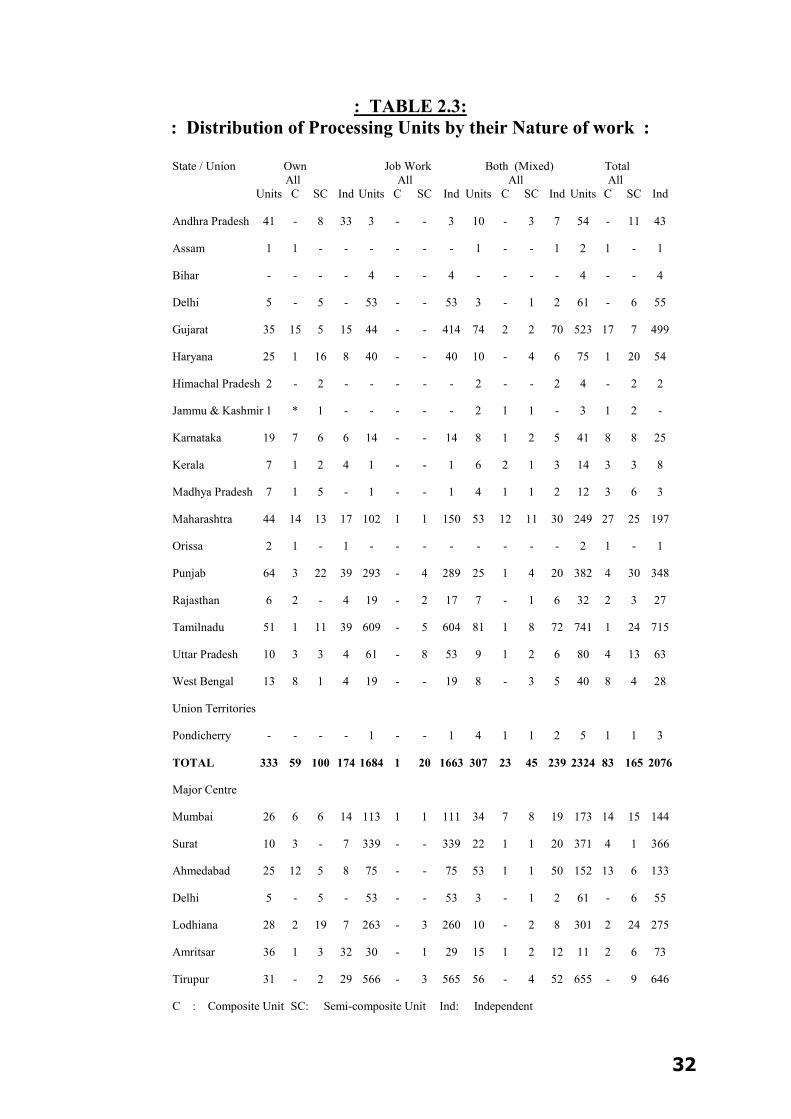
2.6 UNITS BY NATURE OF WORK :
The Processing Units in the textile sector particularly the independent
processing units carry out the processing activities relating to their
own job, some times do job work and at times get involved in both
own processing as well as job work. Those who are processing their
own product they are termed as own processing. While those catering
to the needs of processing activities of others and do not have their
own jobs to perform, are termed as Job Workers and the units which

34
are processing their job and also processing for others are classified as
both. This nature of work was observed mostly in case of
independent units. The information collected on the above variables
are presented in Table 2.3 which reveals that out of 2,324 units,
processors carrying their own work are identified to be 333 in
Number (14%); while the job workers are at a much larger number of
1684 (73%) and that of both (Mixed) category, it is 307 (13%).
The composite sector of the industry, as usual reveals that most of
the processing units (59 units) carry out their own jobs and only a few
of them go for processing both their own jobs as well as jobs offered
from others, only are of the unit was identified to undertake
processing activities on job work basis. The composite units carry
out their processing activity for the yarn, fabrics and garments
produced in their mills. The units those who provide service to the
industry in relation to the processing, in addition to processing of
their own jobs in the composite sector, are only 23 (28%) and they
prefer to utilize their Processing Units for job works while the unit is
idle.
In Semi-Composite Sector 100 units (60%) carry out their own jobs,
only 20 units (12%) are working on job basis and 45 units (27%) are
carrying out job work in addition to their own jobs. Evidently the
35
composite sector of the processing units do not cater to the industry in
terms of providing exclusive processing facility to others except one
observed in Maharashtra. Dedicated processing (i.e. Processing of
their own product only) of the composite sector is about 72% as
against 6% of the Semi-Composite Sector.
However the Semi-Composite Units indicate large number of units
catering to the job work. The reasons assigned to such a situation is
that the units which has processing facilities do not process their own
products due to some reasons or other and ultimately end up in doing
job work also, in order to productively use the processing facilities
available in the unit.
The Processing Units which process, their own job in the independent
sector is as low as 174 (8%) while the units offering job work is as
large as 166 (80%). The mixed category of Processing Units is also
less in number figuring 239 (12%) in a total of 2076 units. The
establishment of job workers in the independent sector has been due
to the Skewed growth of the power loom industry in the country
during the recent past.
These industries do not have any processing facilities of their own
and therefore they try to rely on the facilities provided by others. The

36
mushrooming growth of power looms resulted into a similar growth
of independent process houses catering to the needs of the power
looms and composite mills housing inadequate processing facilities.
The units accepting job work in major textile centres of the country
indicate that Mumbai has units (77%), Surat has 339 units (93%),
Ahmedabad has 75 units (56%), Delhi 53 units (96%) Ludhiana 360
units (95%) and Tirupur has 565 units (87%).
The observation of details of the processing units on the nature of the
work in the SSI and Nm-SSI units establishes the fact that, the
independent units are mostly job workers.
More that 72% of the units in the independent process houses work
for the industry alone,; without any processing activity of their own.
The units working for their own and units of mixed category (i.e. the
process houses processing their own job as well as jobs from the
industry) have smaller stakes in the total processing activity. They
seem to have equal share. It was observed that independent process
houses in their SSI category are numbered at 1329. The independent
SSI Units also tell almost a similar story in the SSI categories. About
83% of the independent SSI Units are jobbers.

37
The balance 17% of them is roughly divided in doing their jobs of
mixed types. The Non-SSI independent process houses also cater
largely to the job work. The results reveal that more than 75% of the
Non-SSI independent process houses process the job of the industry.
Even the Non-SSI independent units are more of mixed types than
own. Approximately 9% of the units are dedicated to their own
processing work while the rest 16% are of mixed types doing the
processing work of their own and also for the industry. [11]
The nature of work linkage to the ownership type indicates that the
private sector units, owns more than 98% of the units. Of them
approximately 73% undertake job works. The rest of the private
sector units undertake own processing and both (Mixed) are 14% and
3% respectively. The significant feature of the Cooperative Sector of
the processing units is that out of 14 units, and 8 units (57%), are
working for jobs. However the Central and State Government
undertakings are dedicated to their own processing work. In the
composite unit irrespective of their ownership type, almost all units
are either carrying out own processing, or both (Mixed) activities.
98% of the Semi-Composite units are owned by the private sector.
The Semi-Composite Units are mostly looking into their own
processing work while few of them (27%) cater to the needs of the

38
industry, in addition to their own processing jobs only 11% are
jobbers. Further the independent units of the private sector share 99%
of which the jobbers accounted for more than 80% own processing
and both (Mixed) in the private sector are 8% and 12% respectively.
In case of the units classified under SSI, private sector owns 1371
units 99% of which the jobbers accounted for 80%. The independent
SSI Process Houses in the private sector process a slightly higher job
work (83%) as compared to all SSI Units in the country. [12]
2.7 ACTIVITIES BY PRODUCT TYPES :
Processing involves bleaching, dyeing, printing, mercerizing, and
others. These operations are applied to fibres, yarn, fabrics, garments
and madeups. The fibre needs different kinds of treatment depending
on the type of the fibre.
Some processing units are capable of processing a particular fibre or
group of fibre, while some units may be able to process the yarn in
different forms and so on. In order to find out the type of processing
facilities available in the country in terms of the fibre, yarn and
fabrics and their combinations in composite, semi-composite and
independent sectors of the industries, the data relating to the above
variables are also disaggregated and reveals that the cotton fibre
processing facility is in as large as 49% of the units and man made

39
synthetic is more than 2%. Blended/mixed materials are processed in
103 units (4%) while cotton and blended mixed materials are
processed in 107 units (5%). The cotton fibre processing facilities are
available in composite mill semi-composite (8%) and composite
process house (3%). The exclusive processing facilities for man made
synthetic fibre, is mostly carried out by independent process houses
and to a very less extent in the semi-corporate units. [13]
Similarly the blended / mixed fibre processing is done largely by
independent units (more than 89%), followed by Semi-Composite
Units and Composite Unit.:
: TABLE 2.4: Distribution of Processing Units by their Nature of work:
Product Group ALL SSI NON-SSI Total C SC Ind Total C SC Ind Total C SC Ind
Fibre, Yarn and Fabric Processing 18 12 1 5 3 - - 3 15 12 1 2
Fibre and Yarn Processing 25 - 8 17 10 - - 10 15 - 8 7
Yarn and Fabric Processing 111 27 19 65 43 - 3 40 68 27 16 25
Yarn Processing only 306 5 34 267 194 - 15 179 112 5 19 88
Fabric Processing Only 1756 30 78 1648 1061 - 23 1038 695 30 55 610
Garment/Made-ups Processing only 40 - 5 35 35 - 2 33 5 - 3 2
Fabric and Garment/
Made-ups Processing 24 - 3 21 19 - 1 18 5 - 2 3
Other Type 44 9 17 18 13 - 5 8 31 9 12 10
TOTAL 2324 83 165 2076 1378 - 49 1329 946 83 116 747
C : Composite Unit; SC: Semi-composite Unit ; Ind : Independent

40
The processing facilities and their popular combination are printed in
Table 2.4. The Units undertaking exclusive processing activities are
in Yarn, Fabrics and Garment / Made-ups processing. No unit has
been identified to have carried out the processing of fibre alone.
Mostly the units having fibre processing activity also combine yarn
processing and/or yarn and fabric processing.
Fabric Processing dominates the processing sector. The units
exclusively undertaking fabric processing activities are more than
75% followed by Yarn 13% and Yarn and Fabric processing together
is about 5%. The independent processing units exclusively working
for fabric processing share more than 79% in the total independent
units while Semi-Composite units share 47% and Composite units
Share 36% in their respective categories.
Alternatively, exclusive fabric processing activity is mostly carried
out by the independent process houses.
It is further observed that the independent SSI Category of the units,
process roughly 64% of the fabric and rest by the Non-SSI category
within the independent process houses.
Similarly the yarn processing activity mainly carried out by the
independent process houses to an extent of 87%. The SSI Sector
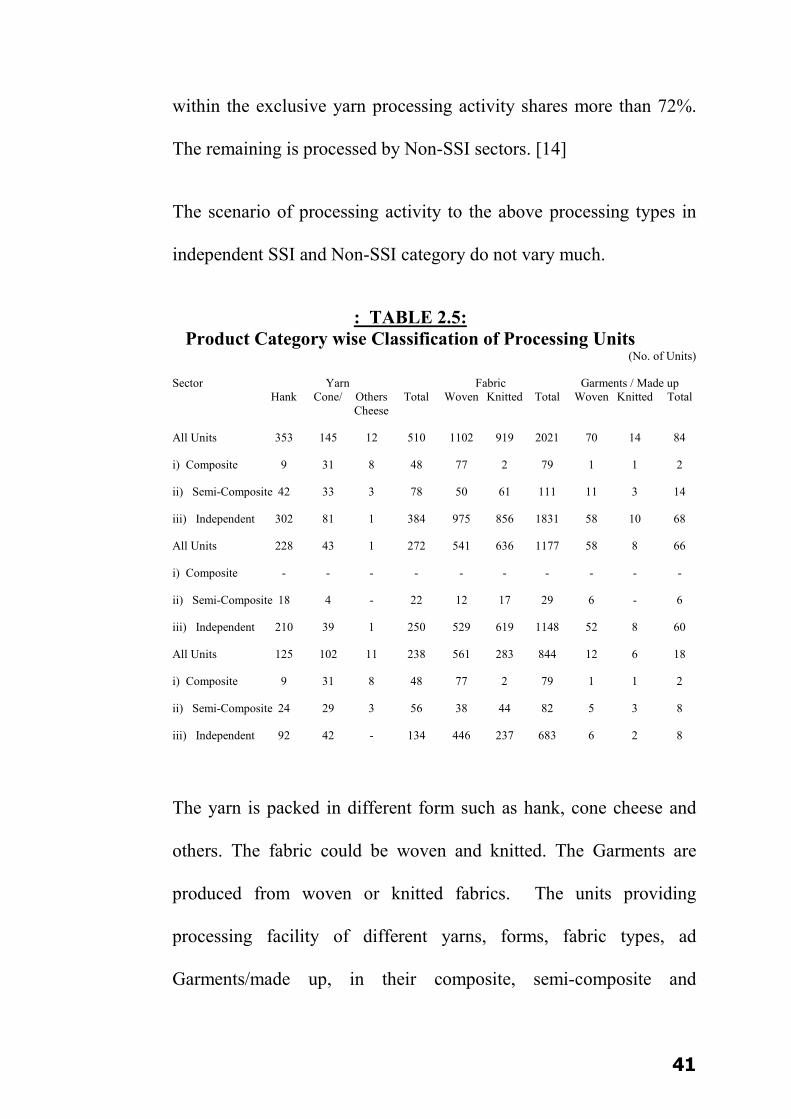
41
within the exclusive yarn processing activity shares more than 72%.
The remaining is processed by Non-SSI sectors. [14]
The scenario of processing activity to the above processing types in
independent SSI and Non-SSI category do not vary much.
: TABLE 2.5: Product Category wise Classification of Processing Units
(No. of Units)
Sector Yarn Fabric Garments / Made up Hank Cone/ Others Total Woven Knitted Total Woven Knitted Total Cheese
All Units 353 145 12 510 1102 919 2021 70 14 84
i) Composite 9 31 8 48 77 2 79 1 1 2
ii) Semi-Composite 42 33 3 78 50 61 111 11 3 14
iii) Independent 302 81 1 384 975 856 1831 58 10 68
All Units 228 43 1 272 541 636 1177 58 8 66
i) Composite - - - - - - - - - -
ii) Semi-Composite 18 4 - 22 12 17 29 6 - 6
iii) Independent 210 39 1 250 529 619 1148 52 8 60
All Units 125 102 11 238 561 283 844 12 6 18
i) Composite 9 31 8 48 77 2 79 1 1 2
ii) Semi-Composite 24 29 3 56 38 44 82 5 3 8
iii) Independent 92 42 - 134 446 237 683 6 2 8
The yarn is packed in different form such as hank, cone cheese and
others. The fabric could be woven and knitted. The Garments are
produced from woven or knitted fabrics. The units providing
processing facility of different yarns, forms, fabric types, ad
Garments/made up, in their composite, semi-composite and

42
independent sector are presented in Table 2.5. The units which offer
yarn processing of different forms is identified to be 510, out of
which 353 units (69%) process yarn in hank form. 145 (29%) is in
Cone or Cheese while other forms are accounting to 12 units (2%)
only.
The other forms of processing could be warp/beam processing etc.
Out of 2021 fabric processing units 1,102 (55%) process woven
fabrics ad 919 (45%) process knitted fabrics.
Out of 84 Garment/made ups processing units 70 (83%) are providing
facilities for woven garment processing while 14 (17%) are
processing knitted garments and made ups. [15]
2.8 OUTPUT AND STRUCTURE OF EMPLOYMENT :
The out put of a processing unit could be the processing of fibre, yarn,
fabric and garment / made ups. The fibre and yarn out put have been
qualified in terms of tonnes while the woven fabric has been
measured in lakh metres. Knitten fabrics being usually measured in
tonnes have been taken so. [W1]
The processed garments/made ups are measured in Thousand Pieces.
The quantum and quality of out put is dependent on the
professionalism of manpower, technical know-how and the quality of

43
machine/machineries used for processing. A single important factor in
influencing the quality, quantity of production, besides the machinery
is the manpower. [W2]
The available manpower in any processing industry has been divided
into five major categories such as Managerial, Supervisory,
Operational, Administrative and Auxiliary. They are further grouped
into technical and non-technical types depending upon their
deployment in different Processing activity. [W3]
All senior level personnel who manage the activities of the industry
are called Managers.
Some times, the Masters manage the processing units. The industry
has specialised personnel at the highest level operation in specific
areas such as dyeing, printing, etc., They are called as Dyeing Master
or Printing Master etc.,
The Manager other than the Masters, Manage the larger units. The
masters on the other hand are supported by second level of manpower
from the Supervisory cadre. [W4]
Further the operational staff is deployed to carry out the day to day
operations in Processing Units.
44
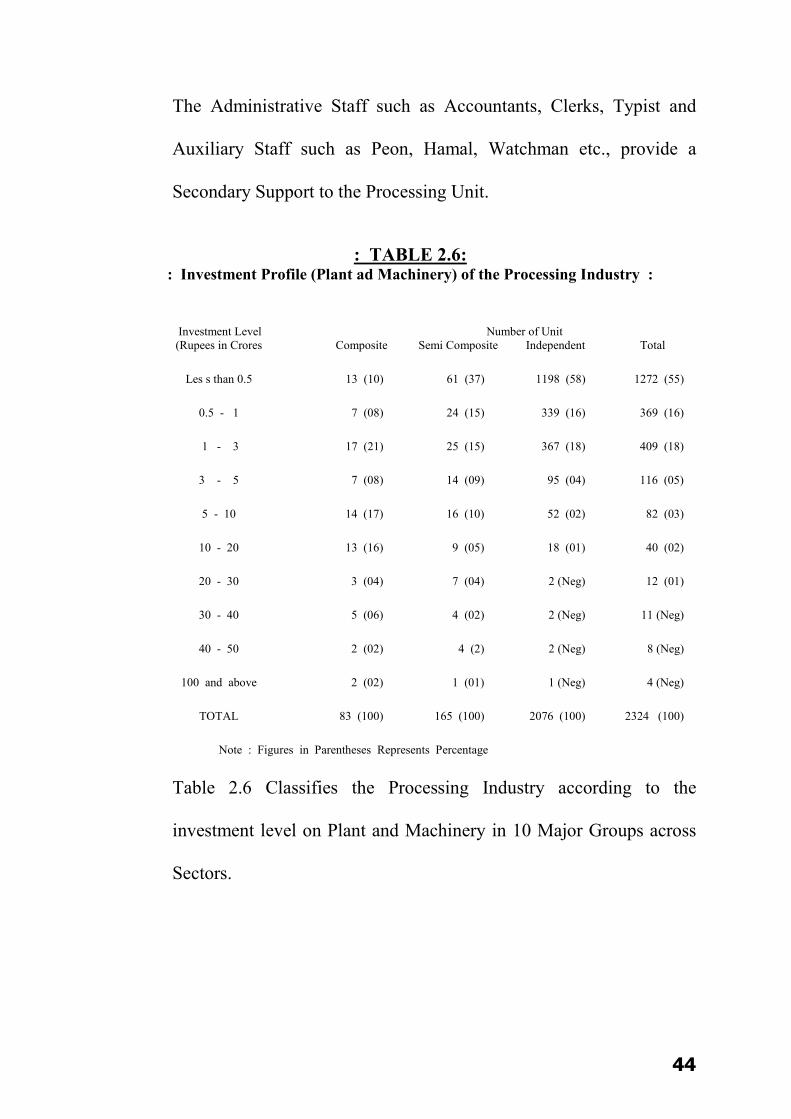
The Administrative Staff such as Accountants, Clerks, Typist and
Auxiliary Staff such as Peon, Hamal, Watchman etc., provide a
Secondary Support to the Processing Unit.
: TABLE 2.6: : Investment Profile (Plant ad Machinery) of the Processing Industry :
Investment Level Number of Unit (Rupees in Crores Composite Semi Composite Independent Total
Les s than 0.5 13 (10) 61 (37) 1198 (58) 1272 (55)
0.5 - 1 7 (08) 24 (15) 339 (16) 369 (16)
1 - 3 17 (21) 25 (15) 367 (18) 409 (18)
3 - 5 7 (08) 14 (09) 95 (04) 116 (05)
5 - 10 14 (17) 16 (10) 52 (02) 82 (03)
10 - 20 13 (16) 9 (05) 18 (01) 40 (02)
20 - 30 3 (04) 7 (04) 2 (Neg) 12 (01)
30 - 40 5 (06) 4 (02) 2 (Neg) 11 (Neg)
40 - 50 2 (02) 4 (2) 2 (Neg) 8 (Neg)
100 and above 2 (02) 1 (01) 1 (Neg) 4 (Neg)
TOTAL 83 (100) 165 (100) 2076 (100) 2324 (100)
Note : Figures in Parentheses Represents Percentage
Table 2.6 Classifies the Processing Industry according to the
investment level on Plant and Machinery in 10 Major Groups across
Sectors.

45
As large as 55% of the units in the Processing Sectors is managed
with a meagre investment of less than 50 lakh rupees and 89% of the
units invested less than 3 crores rupees in Plant and Machinery. The
Sector wise position of the lowest invested units is also appalling.
The composite sector units under half a crores investment are as large
as 16%., Semi-Composite (37%) and independent sector (58%). It is
further noticeable that the units, under rupees 3 crores of investment,
in composite sector is almost 45% followed by Semi Composite (6
7%) and independent sector (92%). The high profile units existing in
the processing sector in terms of investment is absolutely meagre and
therefore, the modernization and upgradation of the units are the call
of the day if the textile Industry is to survive and become vibrant.
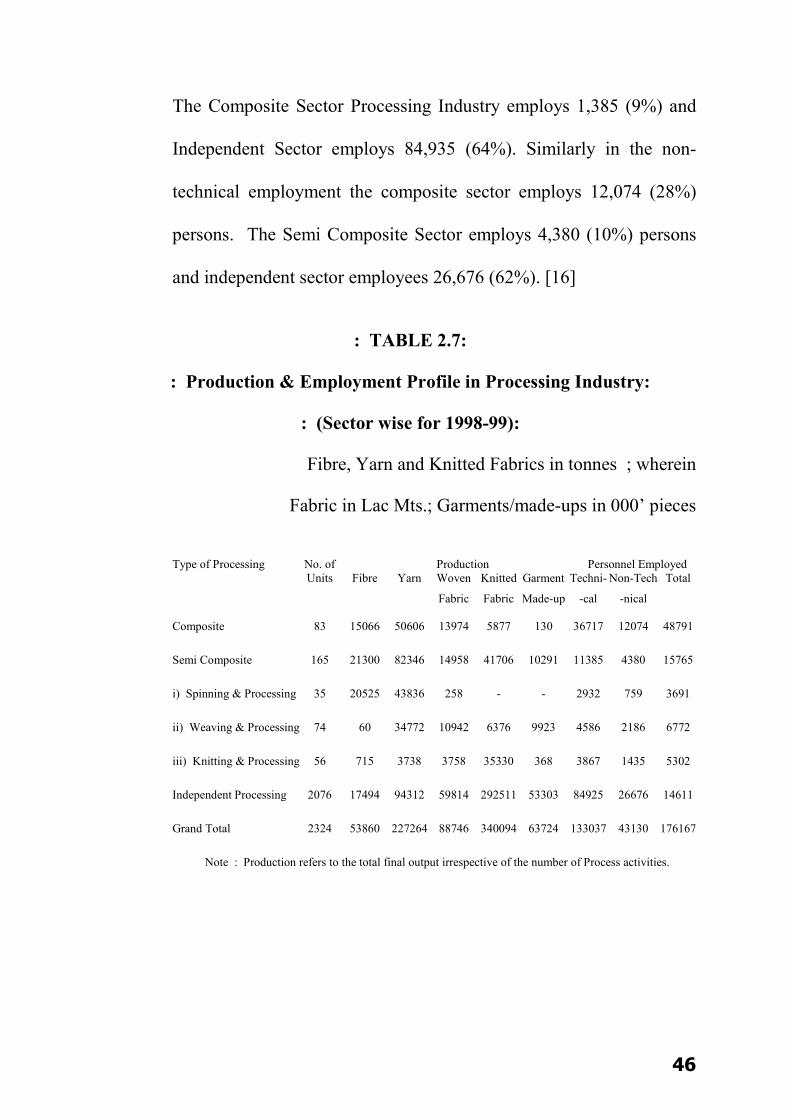
The total production of fibre ad yarn during 1998-99 is 53860 and
227,264 tones respectively. Similarly the total output for woven
fabric is estimated at 88746 lakh meters. Knitted Fabric output is
340,094 tonnes and 63724 thousand pieces in case of garments and
made up. In table 2.7 the given production was effected by a total
manpower deployment of 176167 persons.
The share of personnel employment, of composite, semi-composite
and independent processing is as 28%, 9% and 63% respectively.
46
The Composite Sector Processing Industry employs 1,385 (9%) and
Independent Sector employs 84,935 (64%). Similarly in the non-
technical employment the composite sector employs 12,074 (28%)
persons. The Semi Composite Sector employs 4,380 (10%) persons
and independent sector employees 26,676 (62%). [16]
: TABLE 2.7:
: Production & Employment Profile in Processing Industry:
: (Sector wise for 1998-99):
Fibre, Yarn and Knitted Fabrics in tonnes ; wherein
Fabric in Lac Mts.; Garments/made-ups in 000’ pieces
Type of Processing No. of Production Personnel Employed Units Fibre Yarn Woven Knitted Garment Techni- Non-Tech Total
Fabric Fabric Made-up -cal -nical
Composite 83 15066 50606 13974 5877 130 36717 12074 48791
Semi Composite 165 21300 82346 14958 41706 10291 11385 4380 15765
i) Spinning & Processing 35 20525 43836 258 - - 2932 759 3691
ii) Weaving & Processing 74 60 34772 10942 6376 9923 4586 2186 6772
iii) Knitting & Processing 56 715 3738 3758 35330 368 3867 1435 5302
Independent Processing 2076 17494 94312 59814 292511 53303 84925 26676 14611
Grand Total 2324 53860 227264 88746 340094 63724 133037 43130 176167
Note : Production refers to the total final output irrespective of the number of Process activities.

47
Out of the total manpower employed, technical manpower accounts
for 76% and the rest non-technical. The ratio of technical personnel to
the non-technical personnel in industry is estimated at 3.09 revealing
the fact that three technical employments generate at least one non-
technical employment.
Further the above ratio for Composite, Semi-Composite and
Independent Sector is 3.04, 2.60 and 3.18 respectively.
Within the sector the Spinning and Processing Units are seen to have
employed larger technical personnel as compared to Weaving and
Processing, and Knitting and Processing Sectors. They are in the ratio
of 3.86, 2.10 and 2.69 respectively. The ratios seem to be constant
with the general notion of the employment structure of the textile
processing industry. The Composite Units indicating as usual a high
level of technical employment in the Processing activity for the
reasons that they most often have all types of Processing facilities
such as bleaching, dyeing, printing, finishing, etc., Qualified and
experienced personnel are employed to operate the shop floor
activities. This is the reason why the technical employment as
compared to non-technical is relatively high. [17]
48
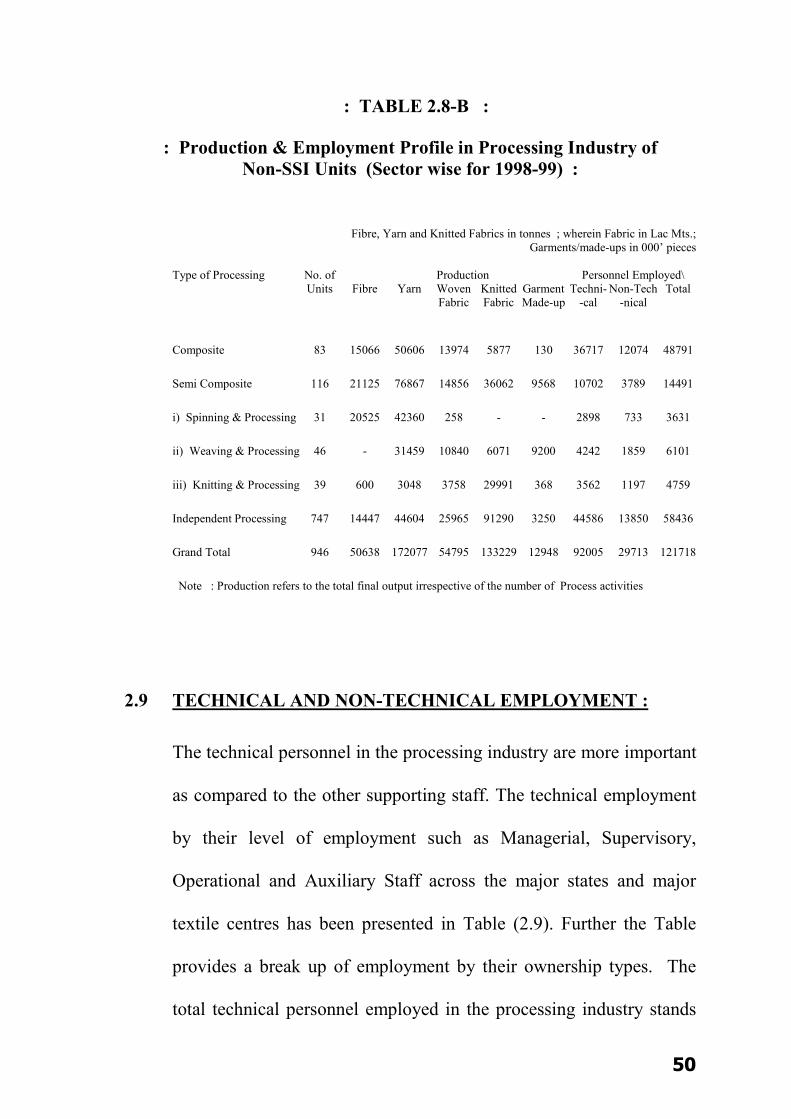
However in case of Semi Composite Units, the situation is little
different. Normally these kind of units concentrate on Spinning,
Weaving, Knitting etc. More often the processing is specialised. A
Spinning unit may have the facilities of bleaching mercerizing and
dying of yarn. They may not need to have fabric processing facilities
if they do not go for Job Work. [18]
As a result the unit operates with a low ratio of technical to
nontechnical manpower. The independent sector on the other had,
employs marginally higher technical personnel as compared to
Composite Sectors. The technical personnel in the independent
process house sometimes handle non-technical issues also. This gives
rise to less employment in the on-technical side. [19]
Out of the total fibre processed during the year 1998-99 and 28%
fibre has been processed in the composite sector of 40% processed in
semi-composite sector and 40% processed in Semi-Composite. In
case of Processing of yarn, the Composite Sector accounted for 22%
and semi-composite 36%. The share of woven fabric processing in the
independent sector is 67%. In the Independent Sector, the knitted
fabrics are processed to an extent of 86% and garments/made up to
84%. The details of output and employment in SSI and Non-SSI
units could be seen in Table 2.8-A and 2.8-B respectively. [20]

49
: TABLE 2.8-A:
: Production & Employment Profile in Processing Industry of SSI Units : : (Sector wise for 1998-99):
Fibre, Yarn and Knitted Fabrics in tonnes; wherein Fabric in Lakh Mts.; Garments/made-ups in 000’ pieces
Type of Processing No. of Production Personnel Employed Units Fibre Yarn Woven Knitted Garment Techni- Non-Tech Total Fabric Fabric Made-up -cal -nical
Composite - - - - - - - - -
Semi Composite 49 175 5479 102 5644 723 683 591 1274
i) Spinning & Processing 4 - 1476 - - - 34 26 60
ii) Weaving & Processing 28 60 3313 102 305 723 344 327 671
iii) Knitting & Processing 17 115 690 - 5339 - 305 238 543
Independent Processing 1329 3047 49708 33849 201221 50053 40349 12826 53175
Grand Total 1378 3222 55187 33951 206865 50776 41032 13417 54449
Note: Production refers to the total final out put irrespective of the number of Process activities
50
: TABLE 2.8-B :
: Production & Employment Profile in Processing Industry of Non-SSI Units (Sector wise for 1998-99) :
Fibre, Yarn and Knitted Fabrics in tonnes ; wherein Fabric in Lac Mts.; Garments/made-ups in 000’ pieces
Type of Processing No. of Production Personnel Employed\ Units Fibre Yarn Woven Knitted Garment Techni- Non-Tech Total Fabric Fabric Made-up -cal -nical
Composite 83 15066 50606 13974 5877 130 36717 12074 48791
Semi Composite 116 21125 76867 14856 36062 9568 10702 3789 14491
i) Spinning & Processing 31 20525 42360 258 - - 2898 733 3631
ii) Weaving & Processing 46 - 31459 10840 6071 9200 4242 1859 6101
iii) Knitting & Processing 39 600 3048 3758 29991 368 3562 1197 4759
Independent Processing 747 14447 44604 25965 91290 3250 44586 13850 58436
Grand Total 946 50638 172077 54795 133229 12948 92005 29713 121718
Note : Production refers to the total final output irrespective of the number of Process activities
2.9 TECHNICAL AND NON-TECHNICAL EMPLOYMENT :
The technical personnel in the processing industry are more important
as compared to the other supporting staff. The technical employment
by their level of employment such as Managerial, Supervisory,
Operational and Auxiliary Staff across the major states and major
textile centres has been presented in Table (2.9). Further the Table
provides a break up of employment by their ownership types. The
total technical personnel employed in the processing industry stands
51
at 1,33,037. The majority of them are employed in the private sector.
The industry employees, Managers, Supervisors, operational and
auxiliary staff, in the ratio of 3.34, 10.07, 85.11, 1.48 respectively.
The employment of technical manpower across the states reveals that
Gujarat employees 64,467 personnel followed by Maharashtra
(18,715), Tamilnadu (14,635) and Punjab (9,457). [W5]
The total employment of technical manpower of the Gujarat State is
mostly contributed from Surat and Ahmedabad.
Similarly the majority of the technical employment in Maharashtra,
Tamil Nadu and Punjab is generated from Mumbai, Tirupur and
Amritsar respectively.
The sector wise technical employment reveals that the composite
sector employees 36,717 personnel during 1998-99 and these
employments are mostly seen in Gujarat 19,587, Maharashtra 6,434
and Punjab 3,799.
The composite sector employs the Managers, Supervisors,
Operational and Auxiliary staff in the ratio of 2.52, 9.82. 87.01, 0.65
respectively. Out of the total employment in the composite sector
78% are employed by the private sector only.

52
The total technical personnel employed in the semi-composite sector
stands at 11,385 during 1998-99 and these employment one mostly
secured from Gujarat (1,869), Maharashtra (1,823) and Punjab
(1,473). [W6]
The Semi-Composite Sector employs the Manager, Supervisor,
Operational and Auxiliary staff in the ratio of 5.01, 12.79, 85345 and
1.78 respectively. Out of the total employment in semi-composite
sector 95.70% are employed in the Private Sector only. The total
technical personnel employed in the independent sector stands at
84,935 during 998-99 and these employments are mostly effected by
Gujarat 43,011, Tamil Nadu 13,058 and Maharashtra 10,458. Surat
in Gujarat, Tirupur in Tamil Nadu are taking the leading shares in the
respective states.
The independent sector employs the Managers, Supervisors,
Operational and Auxiliary staff in the ratio of 3.47, 9.81, 84.92 and
1.80 respectively. Out of the total employment in the independent
sector, 98.52% are employed in the private sector only.
The less number of managerial employments in the composite sector
may be attributed to the reasons that the technology level in the sector
is high and most of high tech activities are carried out in the

53
mechanical process. The independent sector, on the other hand
manages, the day to day business through their supervisors rather than
exclusive appointment of managers.
It is also observed that the owners of the Process Houses more often
manage the process houses in the independent sector. The invisible
management in the sector reflects less of the managerial employment
in the independent process houses. [W7]
The total technical personnel employed in the case of SSI Units
stands at 41,032 during 1998-99 and these employments are mostly
effected by Gujarat 19,831 and Tamil Nadu 8,822.
The SSI Units employs the manager, supervisors, operational and
auxiliary staffs in the ratio of 4.19, 9.48, 84.5 and 1.83 respectively.
In the case of No-SSI units the total technical personnel employed
stands at 92,005 during 1998-99 and these employments are mostly
affected, by Gujarat 44,636 and Maharashtra 14,096.
The Non-SSI unit employs the Managers, Supervisors, Operational
and Auxiliary staff in the ratio of 2.96, 10.39, 25.39 and 1.32
respectively.
54
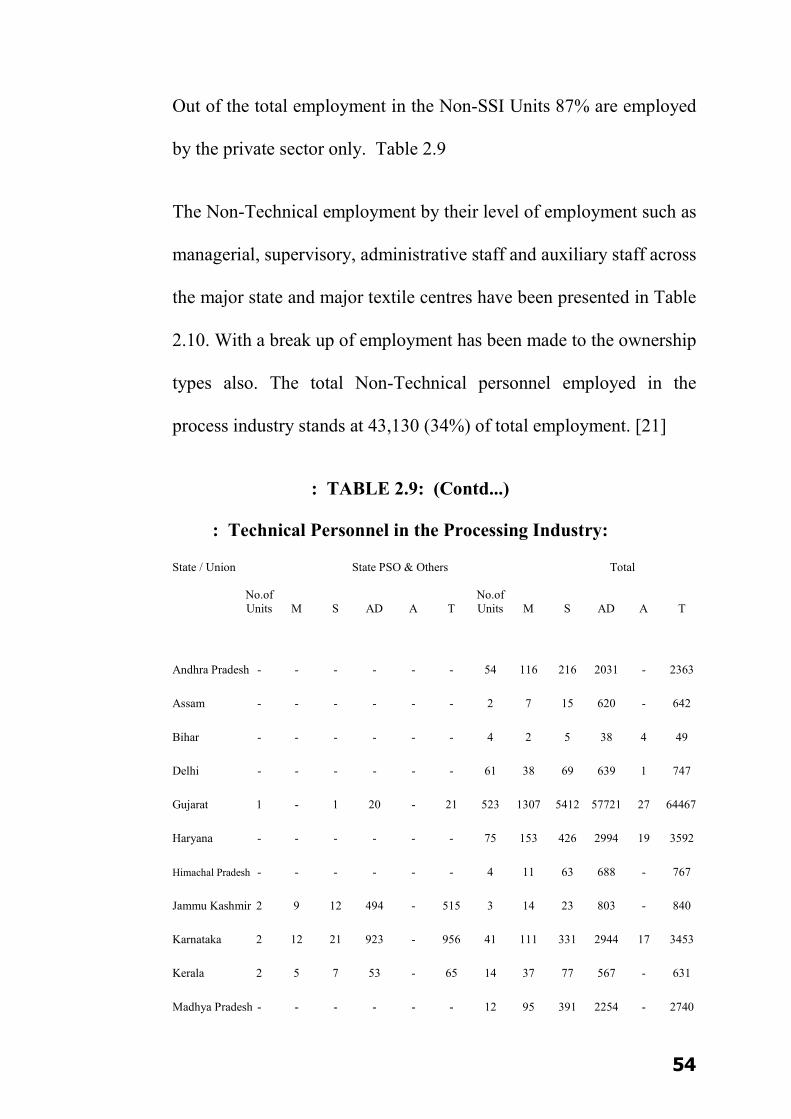
Out of the total employment in the Non-SSI Units 87% are employed
by the private sector only. Table 2.9
The Non-Technical employment by their level of employment such as
managerial, supervisory, administrative staff and auxiliary staff across
the major state and major textile centres have been presented in Table
2.10. With a break up of employment has been made to the ownership
types also. The total Non-Technical personnel employed in the
process industry stands at 43,130 (34%) of total employment. [21]
: TABLE 2.9: (Contd...)
: Technical Personnel in the Processing Industry:
State / Union State PSO & Others Total No.of No.of Units M S AD A T Units M S AD A T
Andhra Pradesh - - - - - - 54 116 216 2031 - 2363
Assam - - - - - - 2 7 15 620 - 642
Bihar - - - - - - 4 2 5 38 4 49
Delhi - - - - - - 61 38 69 639 1 747
Gujarat 1 - 1 20 - 21 523 1307 5412 57721 27 64467
Haryana - - - - - - 75 153 426 2994 19 3592
Himachal Pradesh - - - - - - 4 11 63 688 - 767
Jammu Kashmir 2 9 12 494 - 515 3 14 23 803 - 840
Karnataka 2 12 21 923 - 956 41 111 331 2944 17 3453
Kerala 2 5 7 53 - 65 14 37 77 567 - 631
Madhya Pradesh - - - - - - 12 95 391 2254 - 2740

55
Maharashtra 6 31 107 - 157 295 249 834 2409 14078 1394 18715
Orissa 1 4 13 328 - 345 2 4 16 384 - 404
Punjab 1 1 1 - - 2 382 397 995 8026 39 9457
Rajasthan - - - - - - 32 93 412 2532 - 3037
Tamil Nadu - - - - - - 741 1025 2013 11217 380 14635
Uttar Pradesh - - - - - - 80 128 242 2324 5 2709
West Bengal - - - - - - 40 54 165 2775 80 3074
Union Territories
Pondicherry 1 9 25 310 - 344 5 14 62 589 - 670
TOTAL 16 71 187 2128 157 2543 2324 4445 13392 113234 1966 133037
Major Centre
Mumbai 1 5 21 - - 26 173 729 1921 11317 1217 15184
Surat 1 - 1 20 - 21 371 687 2912 36133 9 39471
Ahmedabad - - - - - - 152 620 2500 21588 18 24726
Delhi - - - - - - 61 38 69 639 1 747
Ludhiana 1 1 1 - - 2 301 231 549 3323 39 4142
Amritsar - - - - - - 81 166 446 4703 - 5315
Tirupur - - - - - - 655 880 1620 8318 350 11168
Note: M : Managerial Staff; S : Supervisory level ;
AD: Administrative Staff; A : Auxiliary Staff: T: Total.
The majority of them are employed in the private sector. The industry
employs the managers, supervisors, administrative and auxiliary staff
in the ratio of 5.56, 8.81, 3.91 and 53.73 respectively. [22]

56
TABLE 2.10: (Contd...)
: Non-Technical Personnel in the Processing Industry:
State / Union State PSO & Others Total No.of No.of Units M S AD A T Units M S AD A T
Andhra Pradesh - - - - - - 54 73 149 213 642 1077
Assam - - - - - - 2 3 - 33 10 46
Bihar - - - - - - 4 3 - 2 12 17
Delhi - - - - - - 61 18 9 44 56 127
Gujarat 1 2 - 5 10 17 523 1063 1830 4078 5574 12545
Haryana - - - - - - 75 94 135 457 720 1406
Himachal Pradesh - - - - - - 4 6 25 32 1 64
Jammu Kashmir 2 6 4 103 49 162 3 17 72 161 62 312
Karnataka 2 7 6 142 31 186 41 51 38 488 195 765
Kerala 2 3 - 23 8 34 14 25 5 58 51 139
Madhya Pradesh - - - - - - 12 52 87 450 151 740
Maharashtra 6 27 7 295 1525 1854 249 244 510 3663 6453 10970
Orissa 1 - - 1 6 7 2 1 2 4 11 18
Punjab 1 - - 4 7 11 382 135 274 1062 5520 6991
Rajasthan - - - - - - 32 115 128 749 346 1338
Tamil Nadu - - - - - - 741 286 244 1246 2610 4386
Uttar Pradesh - - - - - - 80 68 101 277 300 746
West Bengal - - - - - - 40 29 183 606 395 1213
Union Territories
Pondicherry 1 - - 4 9 13 5 13 6 148 63 230
TOTAL 16 45 17 577 1645 2284 2324 2396 3798 13764 23172 43130
Major Centre
Mumbai 1 6 - 75 29 110 173 265 393 2788 3296 6742

57
Surat 1 2 - 5 10 17 371 456 178 2421 3366 6421
Ahmedabad - - - - - - 152 607 1652 1657 2208 6124
Delhi - - - - - - 61 18 9 44 56 127
Ludhiana 1 - - 4 7 11 301 75 131 470 2759 3435
Amritsar - - - - - - 81 60 143 592 2761 3566
Tirupur - - - - - - 655 233 191 960 2176 3560
Note: M: Managerial Staff ; S : Supervisory level ; AD : Administrative Staff ;
A: Auxiliary Staff: T: Total .
The employment of non-technical manpower across the states reveals
that Gujarat employees 12,545 personnel followed by Maharashtra
(10,970) and Punjab (6, 99). The total employment of nontechnical
manpower is generated from respective textile concentration zone of
the states.
The total non-technical personnel employed in the composite sector
stands at 12,074 during 1998-99 and these employments are mostly
effected by Maharashtra (4,734) followed by Gujarat (4,399). The
composite sector employs the managers, supervisors, administrative
staff and auxiliary Staff in the ratio of 4.3, 5.41, 32.26 and 48.03
respectively

58
Out of the total employment in the composite Sector 76% are
employed in Private Sector only.
The total non-technical personnel employed in the Semi-Composite
Sector stands at 4,380 during 1998-99. The ratio of managers,
supervisors, administrative and auxiliary Staff are 7.74, 9.82, 35.82
and 44.42 respectively. 96% of them are contributed by Private
Sectors. The Independent Sector employs as many as 26.676 Non-
Technical Personnel during 1998-99 and these employments are
mostly sourced from Surat in Gujarat and Mumbai in Maharashtra.
The ratio of employment of the managers, supervisors, administration
and auxiliary Staff are 4.95, 4.85, 26.73 and 49.37 respectively.
The details of SSI and Non-SSI employment show that the ratio of
Managers, Supervisors, Operational and Auxiliary staff in all SSI
Units are computed as 6.06, 5.25, 28.09 and 60.60 whereas the Non-
SSI sectors computes 5.33, 10.41, 33.64 and 50.62 respectively.
A cursory look into the ratio, indicate that the SSI Sector employs
more supervisors and operational staff as compared to the former. The
reason should be the Non-SSI Sector is large and has better
technology levels.

59
The Non-SSI Sector being more quality conscious prefers to
adequately supervise for quality standards by employing more
Supervisors and qualified operational staff. The Managerial level
works are cut short and also less number of more qualified managers
is deployed. [23]
2.10 EDUCATIONAL QUALIFICATION :
The industry employs technical personnel in major categories such as
Managerial, Supervisory, Operational and Auxiliary. The educational
qualifications of these personnel were collected and their percentage
distribution is indicated in Table 2.11.
As revealed in the table, the Post graduates in the Industry are only
2%, 9% are graduates, 5% are Diploma holders, 12% are Certificate
Holders and rest 72% are working in the Industry on account of their
experience.
The technical personnelemployed in the Composite, Semi-Composite
and Independent Sector merely on experience, account for 64.68 and
78% respectively. Alternatively the industry is devoid of
educationally qualified personnel and their percentage is below 30%.
[24]
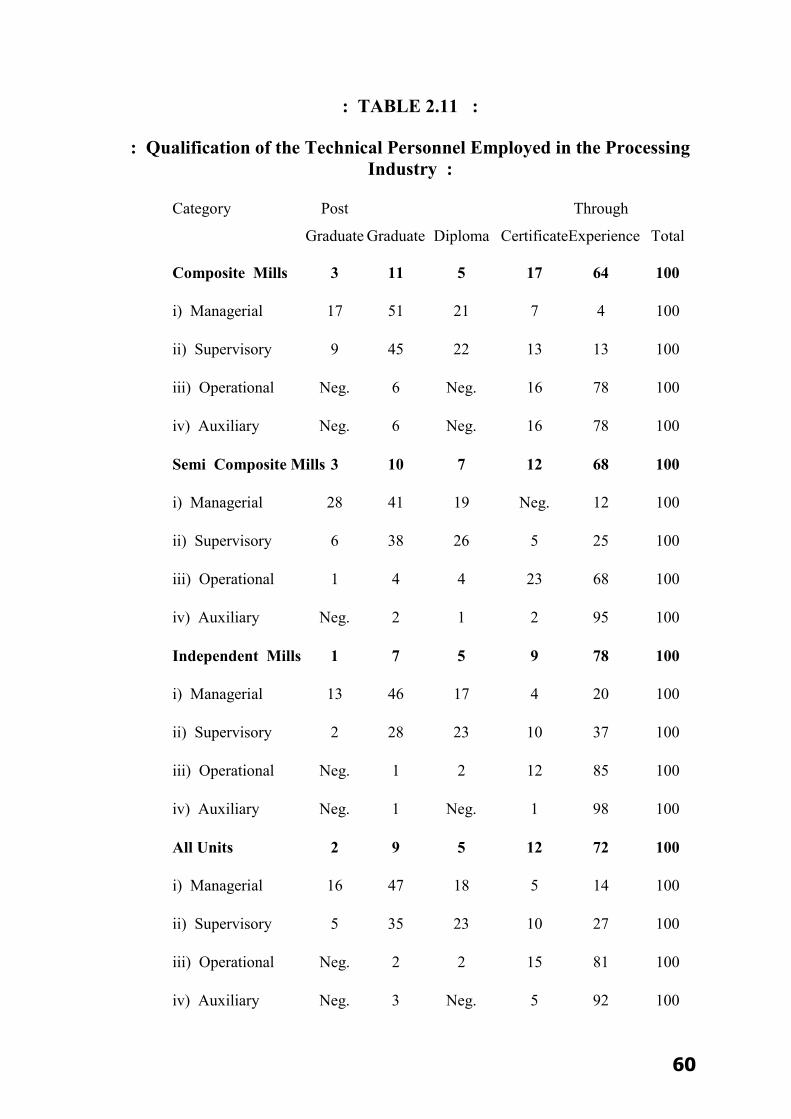
60
: TABLE 2.11 :
: Qualification of the Technical Personnel Employed in the Processing Industry :
Category Post Through
Graduate Graduate Diploma CertificateExperience Total Composite Mills 3 11 5 17 64 100
i) Managerial 17 51 21 7 4 100
ii) Supervisory 9 45 22 13 13 100
iii) Operational Neg. 6 Neg. 16 78 100
iv) Auxiliary Neg. 6 Neg. 16 78 100
Semi Composite Mills 3 10 7 12 68 100
i) Managerial 28 41 19 Neg. 12 100
ii) Supervisory 6 38 26 5 25 100
iii) Operational 1 4 4 23 68 100
iv) Auxiliary Neg. 2 1 2 95 100
Independent Mills 1 7 5 9 78 100
i) Managerial 13 46 17 4 20 100
ii) Supervisory 2 28 23 10 37 100
iii) Operational Neg. 1 2 12 85 100
iv) Auxiliary Neg. 1 Neg. 1 98 100
All Units 2 9 5 12 72 100
i) Managerial 16 47 18 5 14 100
ii) Supervisory 5 35 23 10 27 100
iii) Operational Neg. 2 2 15 81 100
iv) Auxiliary Neg. 3 Neg. 5 92 100
61
and Central Government or run by a Trust and Family are included in
the others categories. [25]
2.11 EMPLOYMENT BY SEX :
The study of sex-wise employment in the processing industry reveals
that the processing industry is a male dominated one. The ratio of
male to female employment is 52.69. i.e. for every 53 male
employment in the industry witnessed a single female employment
while from the technical side the male employment is relatively
higher. It is also found that for every 59 males a single female is
employed. [26]
The possible female participation in technical side is in the
laboratories and design development sections. On an average 1.41
females per unit are employed in the processing industry. The same
situation prevails in the SSI Sector also.
The processing activities in the textile industry are carried out in
composite mills, spinning units, weaving/knitting units and
independent process houses. The composite units have facilities for
manufacturing yarn. [27]

62
2.12 ENVIRONMENT :
There is lot of hue and cry over the environment protection and the
role of the textile industry is to preserve the same. It is a bare fact that
no matter how sophisticated machinery/ technology may be used it
cannot protect the environment unless they are backed up by
management and awareness amongst the work force.
The state of technology and machinery in the textile industry is most
outdated and therefore the management has to make special efforts to
protect the environment. Textile and clothing are among the basic
needs of human beings and followed by the other two are food and
shelter. With the growth of world population, consumption of textiles
is growing by leaps and bound. [28]
The industrial growth, uncontrolled urbanization, slums and poverty
quest for better standard of living, and have lead to environmental
degradation. Everyone in the world agrees that there is limit to growth
be it population or industrial growth. Man cannot over consume the
limited available natural resources as the very existence of mankind
would be their put to danger. In order to substantiate the energy
requirement tidal and solar energy has been explored to remove the
paucity of energy. In order to meet the requirement of food, tissue
63
culture and genetic engineering is made use of. However the need of
the hour is to live within the resources available.
Environment is basically the surrounding condition which sustains
and influences the development of life on this planet and pollution
refers to the contamination of the natural ingredients of the
environment. Environment consists of water, air, land and all plants,
man and other animals. There is an interrelationship between and all
these and bio-mass is the total amount of living material which exists
on this planet. [29]
Biodiversity is a measure, of species richness and natural genetic,
variation which apply within or between species. Biodiversity is vital
to the proper functioning of Ecosystem. Ecosystem is a scientific term
that describes community of organisms and their environment. They
interact with one another and are deemed to be inseparable. [B1]
It is very true that the world life support system is depleting very fast.
United Nations Environment Programme (UNEP) provides constant
review of global environment situation and helps safeguards to
protect the environment for the present and future generations. It
carries out Earth watch programme which assess the impact of natural
and man made changes. It tries to identify causes and suggests
64
preventive measures to various government, scientists and
industrialist. It has also laid down principles to define human rights
and human responsibilities pertaining to global environment
protection. It is committed to sustainable development and to
eradicate poverty. It advocates that “Polluters must pay”. [B2]
2.13 ECOLOGY :
It is the study of organisms, plants, living creatures and the
environment besides the way in which human activities affect wild
life and natural surroundings. It is also obvious that every thing we do
damage the environment in one way or the other. Damage to the
environment cannot be totally eradicated but one can take measures to
reduce the damage. This is possible by implementing the concept of
“Clear Technology”. It refers to substantial reduction in
environmental impact of industrial processes through judicious and
optimum use of resources. The aim is to meet the need of the present
without compromising the ability of the future generation to meet
their needs. One must realize that non-renewable natural resources are
limited and hence its indiscriminate use is not justified. With the
human activity biodiversity is adversely affected and the rate of
extinction is 1000 times than the natural rate. [B3]
65
2.14 KINDS OF POLLUTION AND IMPACTS:
Air Pollution :
Cotton dust, nitrogen oxide, sulphur dioxide, carbon monoxide and
dioxide, methane gas, C.F.C gas, chemical vapours, vapours of
oxidation colours, kerosene vapours, formaldehyde fumes etc. cause air
pollution impact of such pollution is ozone layer depletion, global
warming acid rain respiratory problems, lungs and heart diseases brain
diseases due to lead contamination, nausea, eye irritation, etc. [B4]
Green House Effect:
This is a natural phenomenon essential for sustaining life on earth.
Green house gas allows light through the space to the surface of the
earth but trap some of the heat. The heat is radiated back to the space.
However accumulation of excess green house gas in the earth’s
atmosphere is not desirable as it may cause increase in global mean
temperature known as global warming. [B5]
Global Warming :
It occurs due to excess green house gases. As a result it is expected
that sea level would rise by 50 cms by the year 2100. It is also
estimated that carbon dioxide levels of the earth have risen from 280
ppm to 350 ppm during the last 100 years. Therefore carbon dioxide
emissions must be cut down. If the temperature increases glaciers in

66
Polar Regions would melt and this melting can submerge low lying
areas. Carbon dioxide levels also rise because of large scale
deforestation as it is known that trees use carbon dioxide from the
atmosphere.
Nitrogen oxides are responsible for generating ground level ozone
which may cause damage to trees and vegetation and create
respiratory problems in humans. Ozone layer laying 12-50 kms above
the earth protects life on earth by filtering harmful ultra violet rays
which causes skin cancer. Ozone layer depletion in earth’s
atmosphere is due to halogen gases, nitrogen oxide and fluorocarbon
compounds produced by the coolants used in air conditioners.
Vehicular traffic using lead petrol results in the increase of lead in the
atmosphere and if the level is high it affects child brain cell and cause
mental retardation. Cement used in building construction can causes
lung diseases and respiratory disorders like T.B and Asthma. [30]
Water Pollution :
Effluent from industries and sewage discharge, surface run of
pesticides used in agriculture activities cause water pollutions. This
results in shortages of safe drinking water and can cause water borne
diseases such as malaria, dengue, cholera, diarrhea, jaundice, polio,
skin irritation, killing of plants, animals and aquatic life due to
67
toxicity and salinity. Heavy mental discharges in water cause diseases
of nervous system and brittle bones. [31]
Land contamination :
Disposal of effluents from industry on land and of solid waste cause
land contamination. Such contamination of soil results in loss in
agricultural productivity, ground water contamination and affects
human health, aquatic life and biodiversity. It also leads to
desertification. [32]
Noise Pollution :
Noise pollution is caused by sound produced in spinning and weaving
departments and this causes deafness amongst workers. Noise
pollution can also be because of vehicular traffic. [33]
Societal Pollution:
Human activities can be of two types destructive and constructive.
Undesirable growth of population results into slums and poverty
especially amongst illiterate masses. It also results in unlawful
activities. On the other side constructive activities support life, reduce
distress such as hour for orphans, old people, and blind people and so
on. Protection of world life bird sanctuaries is also a desirable
activity. [34]

68
All these must be such that they protect or sustain life as well as
protect the environment. Ours is the only planet where life exists in
this solar system to the best of our knowledge. In view of this we
should always try to protect the environment form destruction.
Air Borne Domestic Diseases Water Borne Effluent
Food poison Industrial Earth Quake Biodegradable Natural disasters Floods Pollution Forest Fires Non Biodegradable
and Central Government or run by a Trust and Family are included in
the others categories. [35]
The analysis of the processing units by their ownership type of
various status and their concentration centres are given below:
2.15 ECO FRIENDLY TEXTILES :
As per the latest developments it is important to inculcate an
awareness in the entrepreneurs and technologist about the new
environmental regulation enforced by the international community
especially Europe led by Germany. These new Ecology standards
69
together with I.S.O. 9000 quality standards are becoming important
issues for Indian Textiles and dyestuff industries. The industry needs
to gear up to adopt itself to the environmental protection standards
and use eco friendly textile items. In order to protect the environment
it was advocated to use safe alternatives for eco friendly textiles.
Labels like:- (1) Eco textile 100 standard
(2) Clean fashion
(3) Steilmams
(4) Eco Mark (Indian Label), etc
are becoming popular.
Such types of label indicate that in the process of textile processing
only safe chemicals are being made use off. That also denote that
textile products from various sector example cotton, cotton and blend,
wool, silk, jute man made fibers are not processed by using banned
AZO dyes and other chemicals such as pesticides, formaldehyde
resins, kerosene oil emulsions nonyl phenol ethylene oxide
condensates heavy metal ions which are allergic and are harmful to
plant, aquatic life and all living animals and human beings. The heavy
metals in effluents enter the food chain where sewage sludge is used
as fertilizers.

70
For eco friendly textiles, labelling of the textile items is permitted
only if the upper tolerance limit of these items either in air emissions
or in water effluent or even in finished fabrics/ garments form the
factory are not crossed. It is necessary to discourage the manufacture
of toxic chemicals, auxiliaries’ dyestuff by the small scale industries.
The industry will have to add to their slogan- Productivity (P) Quality
(Q) Reliability (R) the words safety (S). For energy product all
specific criteria will have to be covered to achieve significant
reduction in the adverse effect in the environment. In the process of
manufacturing man made textile industry of Surat creates pollution as
follows:
(a) Solid yarn waste :
Are mostly collected by scavengers and reused as scrap. These
on several occasions, choke the drain and is not bio-degradable.
(b) Oils and lubricant :
They go in the drain water and pollute the atmosphere.
(c) Chemicals auxiliaries and dyestuff:
The industry consumes tones of such chemicals and most of
which go down the drain and some of these are toxic for plant
and marine life. Every gallon of waste drained by Surat process

71
house may contain as high as 5 gms of chemicals, auxiliaries
and dyes. Besides raw water used by the industry are also high
Total dissolved Solids (TDS) vary from 500 to 5000 ppm or
more.
(d) Oxides of nitrogen, carbon and sulphur :
These are emitted from boiler chimneys into atmosphere. The
quantum of these can be controlled by proper selection of fuel
as well as by proper firing and complete combustion of the
same in boiler.
(e) Fly ash :
It shows suspended carbon particles in the atmosphere from
boiler chimney. It must be noted that Indian coal have 20 to
25% ash content and lignite has high sulphur content. The
textile industry whether it manufactures fabric for local market
or for export market will have to take care of:-
(1) Both quality and quantity of pollution load and
(2) Check the finished product for the presence of banned
chemicals such as formaldehyde, pesticides, benzidine,
pentachloro phenol, heavy metal ions etc in minute parts
per million (ppm) quantities.

72
It may be argued that civilization and industrialization lead to comfort
and prosperity but there also aggregate problems of pollution. It is
important to take steps to minimize generation of waste or pollution
and hazardous chemicals are replaced by harmless substitutes having
lower BOD/COD values. The generated waste must also be suitably
treated to reduce its toxicity to plant and animal life. It is also
important to make entrepreneurs, technicians and consumers aware
about the problem of pollution.
The European philosophy is that “What is good for stomach is good
for the skin”. Several other phrases are in vogue like “Cleaner
technology/ production”, “Safer atmosphere”, “Effluent norm
“Environmental audit,”. “Waste minimizatio at source,” “green
audit”, and” pollution must pay”, etc.
It is also a fact that 20% of the industrial production is from the
decentralized sector and this must be upgraded in work in more
organized fashion. The industry must be ready to replace the red list
chemicals which will cost 6 to 10% more and the customers must be
motivated to pay in light of the betterment of the environment. There
are few things that need to be followed by the industry.
Good house keeping for safety
73
Inputs changed
(1) Bio degradable
(2) Buyers acceptability assured
Machinery maintained to save
(1) Energy
(2) Water
(3) Chemicals
Material substitution
(1) Lower BOD/COD value
(2) Cost reduction
Reuse-Recycle-Recover inputs
Safe disposal of waste
(1) gaseous
(2) liquid
(3) solid [36]
2.16 EFFECTS OF TEXTILE EFFLUENT ON PLANT AND
ANIMAL LIFE :
Free chlorine and caustic alkalinity affect the crops and marine life.
Suspended matters whether organic or inorganic are prone to settle
and can cause choking of pipes, gutters.

74
Dissolved solids in effluent clog the porous structure of the soil and
hamper the intake of air from atmosphere and retard the growth of
plants.
Salt deposition on the soil can hinder the growth of plant roots.
High sodium content in the soil leads to ion exchange and reduce
permeability of soil.
Presence of bacteria and chemicals in effluent lead to depletion of
oxygen in fresh water and such water is unfit for drinking.
Iron impurities give bad appearance and taste to fresh water.
Copper impurities destroy useful bacteria.
Lead & chromium in effluent affect the metabolism in the body. [37]
2.17 IMPACT OF MAN’S ACTIVITY ON ENVIRONMENT:
The basic needs of man are food clothing and shelter and for this he
will have to earn to maintain a certain standard of living.
Rich Employed (worker) Man Man Poor Self Employed Entrepreneur
In the life span activity man creates pollution.
75
Types of pollution :
domestic pollution (sewage)
agriculture pollution (pesticides)
Industrial pollution (effluents) [38]
2.18 BAT/BATNEEC :
In order that these tolerance limits are not exceeded, Best Available
Technology (BAT) and Best Available Technology Not Entailing
Excessive Cost (BATNEEC) are to be used. While deciding on
BAT/BATNEEC following points must be considered.
Source reduction to minimize waste :
Chemical/dye substitution (lesser COD/BOD values)
Conservation/optimization of chemicals/dyes
Waste conservation
o Process modification
o Equipment modification
Reuse/Recycle/Recovery (chemical water, container/packages)
Maintenance to conserve energy
Short sequence operation
Good house keeping. [39]

76
2.19 CLEANER TECHNOLOGY ADVOCATE:
Now dyes and process e.g.: high exhaustion dyes, low metal content
dyes and auxiliaries low formaldehyde finish, are of easily bio-
degradable sizes, ecofriendly, etc.
Enzyme Processing : Mechanical finishes decatising/emerising/zero
finish calendar
Fibers like lyocell which are environment friendly.
Such steps enable us to reduce:
Waste
Cost of waste treatment
Inventory and energy cost
cost of handling
Reuse/Recycle waste
2.20 ASTE MINIMIZATION IN TEXTILE INDUSTRY :
It is a fact that textiles are the basic requirement for man in the
civilized world. It is significant in India as it provides direct
employment to about 40 million workers. Out of the countries total
export 20%was contributed by textile. In order to sustain the growth
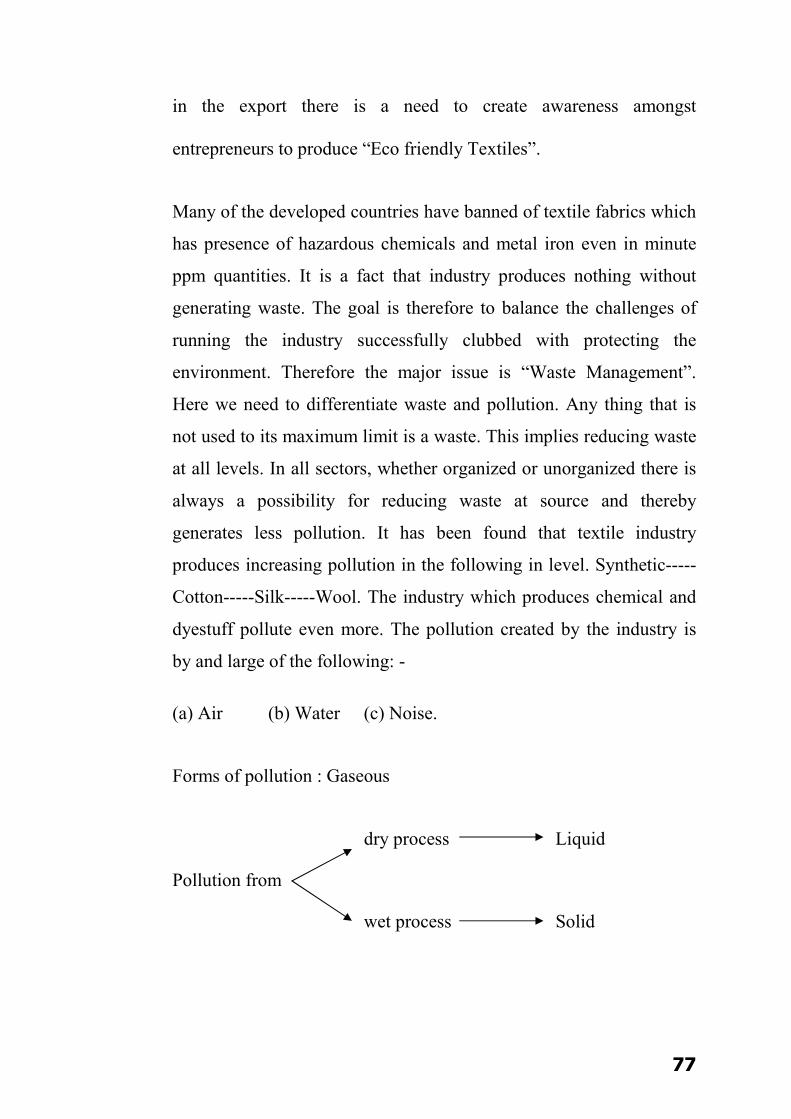
77
in the export there is a need to create awareness amongst
entrepreneurs to produce “Eco friendly Textiles”.
Many of the developed countries have banned of textile fabrics which
has presence of hazardous chemicals and metal iron even in minute
ppm quantities. It is a fact that industry produces nothing without
generating waste. The goal is therefore to balance the challenges of
running the industry successfully clubbed with protecting the
environment. Therefore the major issue is “Waste Management”.
Here we need to differentiate waste and pollution. Any thing that is
not used to its maximum limit is a waste. This implies reducing waste
at all levels. In all sectors, whether organized or unorganized there is
always a possibility for reducing waste at source and thereby
generates less pollution. It has been found that textile industry
produces increasing pollution in the following in level. Synthetic-----
Cotton-----Silk-----Wool. The industry which produces chemical and
dyestuff pollute even more. The pollution created by the industry is
by and large of the following: -
(a) Air (b) Water (c) Noise.
Forms of pollution : Gaseous
dry process Liquid
Pollution from
wet process Solid
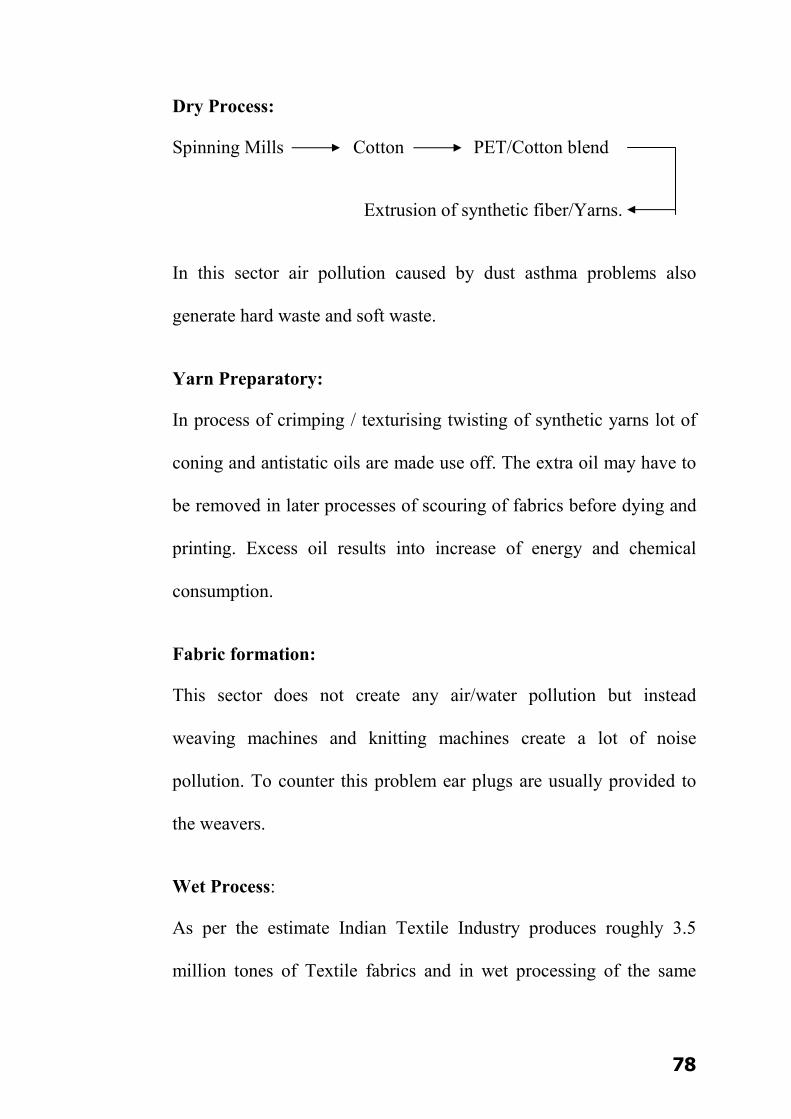
78
Dry Process:
Spinning Mills Cotton PET/Cotton blend
Extrusion of synthetic fiber/Yarns.
In this sector air pollution caused by dust asthma problems also
generate hard waste and soft waste.
Yarn Preparatory:
In process of crimping / texturising twisting of synthetic yarns lot of
coning and antistatic oils are made use off. The extra oil may have to
be removed in later processes of scouring of fabrics before dying and
printing. Excess oil results into increase of energy and chemical
consumption.
Fabric formation:
This sector does not create any air/water pollution but instead
weaving machines and knitting machines create a lot of noise
pollution. To counter this problem ear plugs are usually provided to
the weavers.
Wet Process:
As per the estimate Indian Textile Industry produces roughly 3.5
million tones of Textile fabrics and in wet processing of the same
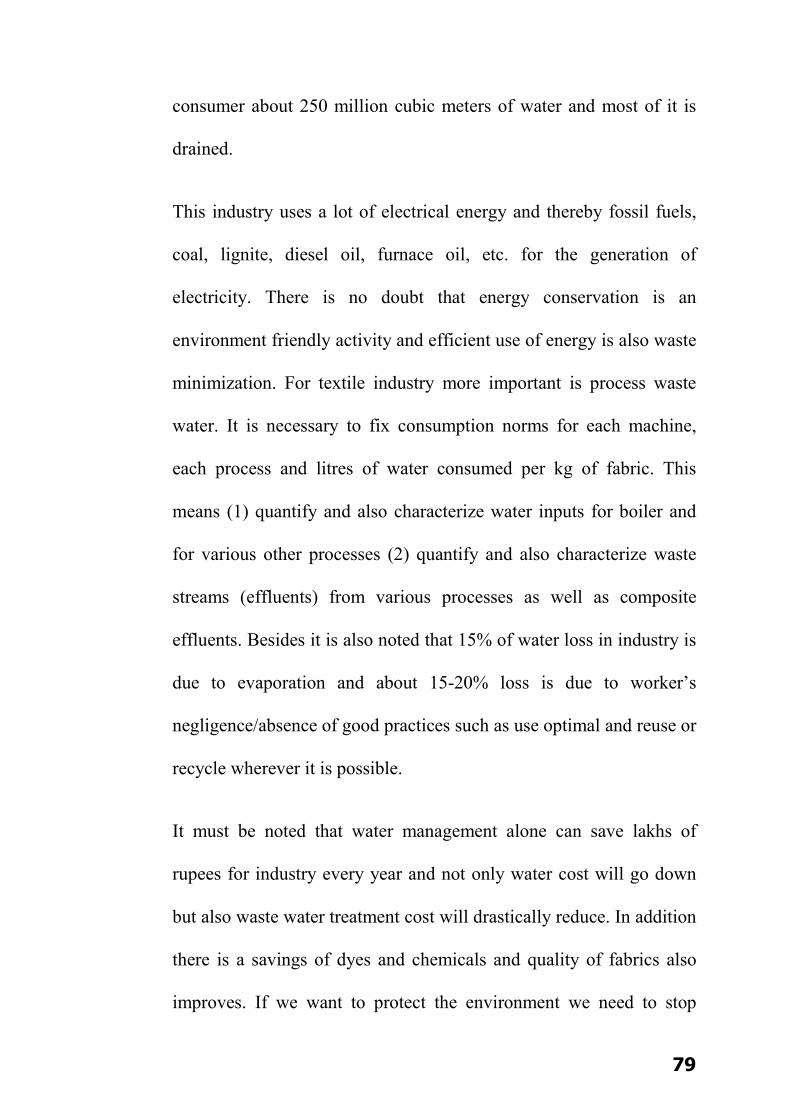
79
consumer about 250 million cubic meters of water and most of it is
drained.
This industry uses a lot of electrical energy and thereby fossil fuels,
coal, lignite, diesel oil, furnace oil, etc. for the generation of
electricity. There is no doubt that energy conservation is an
environment friendly activity and efficient use of energy is also waste
minimization. For textile industry more important is process waste
water. It is necessary to fix consumption norms for each machine,
each process and litres of water consumed per kg of fabric. This
means (1) quantify and also characterize water inputs for boiler and
for various other processes (2) quantify and also characterize waste
streams (effluents) from various processes as well as composite
effluents. Besides it is also noted that 15% of water loss in industry is
due to evaporation and about 15-20% loss is due to worker’s
negligence/absence of good practices such as use optimal and reuse or
recycle wherever it is possible.
It must be noted that water management alone can save lakhs of
rupees for industry every year and not only water cost will go down
but also waste water treatment cost will drastically reduce. In addition
there is a savings of dyes and chemicals and quality of fabrics also
improves. If we want to protect the environment we need to stop
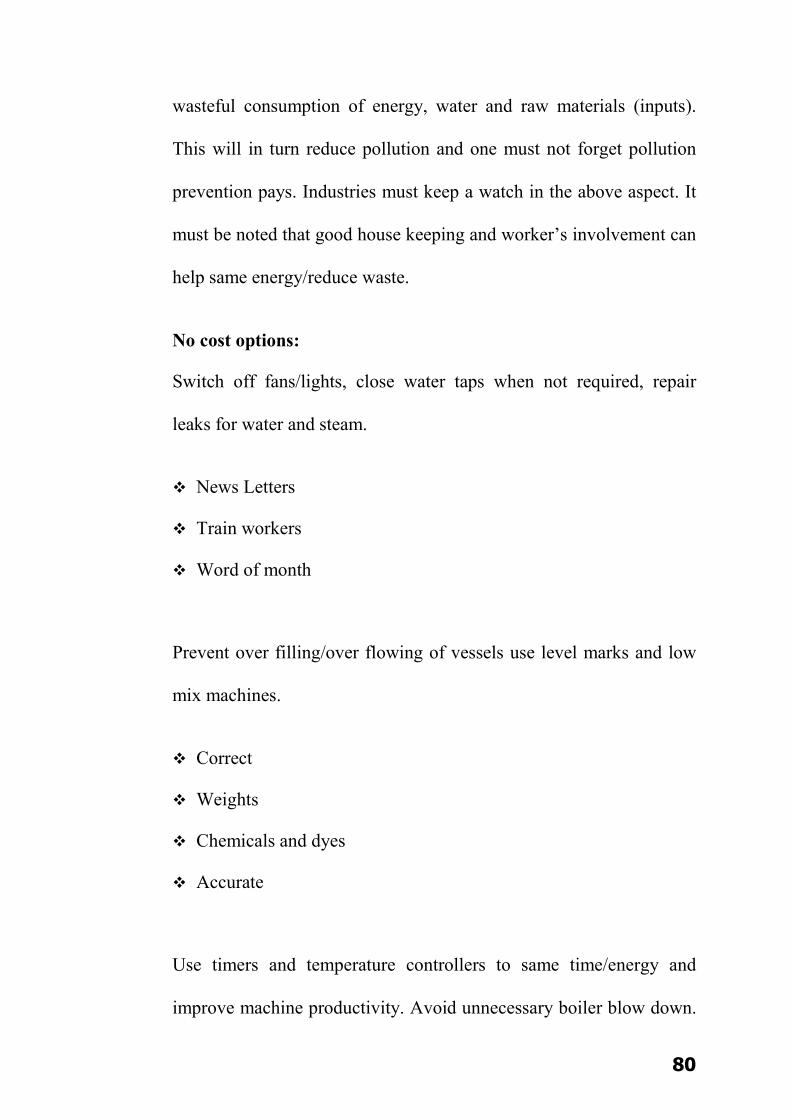
80
wasteful consumption of energy, water and raw materials (inputs).
This will in turn reduce pollution and one must not forget pollution
prevention pays. Industries must keep a watch in the above aspect. It
must be noted that good house keeping and worker’s involvement can
help same energy/reduce waste.
No cost options:
Switch off fans/lights, close water taps when not required, repair
leaks for water and steam.
News Letters
Train workers
Word of month
Prevent over filling/over flowing of vessels use level marks and low
mix machines.
Correct
Weights
Chemicals and dyes
Accurate
Use timers and temperature controllers to same time/energy and
improve machine productivity. Avoid unnecessary boiler blow down.

81
Steam pipes must be lagged and steam traps well maintained, install
water flow meters. All the above practices are a part of “Good House
keeping”.
Indian Textile industry is facing new challenges of acute recessionary
trends in the national as well as global market. With the rising input
cost and extremely competitive global consumers, only the fittest can
hope to survive. Besides there is also a serious threat on account of
measures required to be taken for environment protection. [40]
Surat industry consumers:
About 600 tonnes of non-ionic detergents every year based on nonyl
phenol
1) Ethoxylate on biodegradation gives toxic metabolic which are
highly poisonous to fishes.
2) Fair quantities of stain removers based on carbon tetrachloride
which has ten times, higher ozone depletion capacity than
CFC like Freon used as coolant in air conditioners.
3) Even oxalic acid used in scouring and for rust stains is quite
toxic for aquatic organisms and has high COD/BOD values.

82
4) Hydrosulphite of soda also causes huge depletion of dissolved
oxygen in water.
5) Acetic acid alone causes more than 15% of synthetic process
houses total COD/BOD loads.
6) Carriers based on chlorobenzenes are highly toxic.
7) Castor oil ethoxylate based levelling agent used in polyester
dyeing has high COD/BOD values.
8) Huge quantities of sequestering agents used by Surat industry,
polyphosphate like TSPP and sodium hexa meta phosphate are
already banned in Europe but they are being used in Surat as
water is very hard in industry and even in house hold
detergents. Their phosphates are hydrolyzed which promote
algae which has high Oxygen demand and on rolling cause the
river to die off.
9) Pentachlorophenol used in printing gum is red listed chemical.
It causes dermatitis. It can lead to liver and kidney damage. It is
toxic and therefore use of phenol in nylon printing must be
avoided.
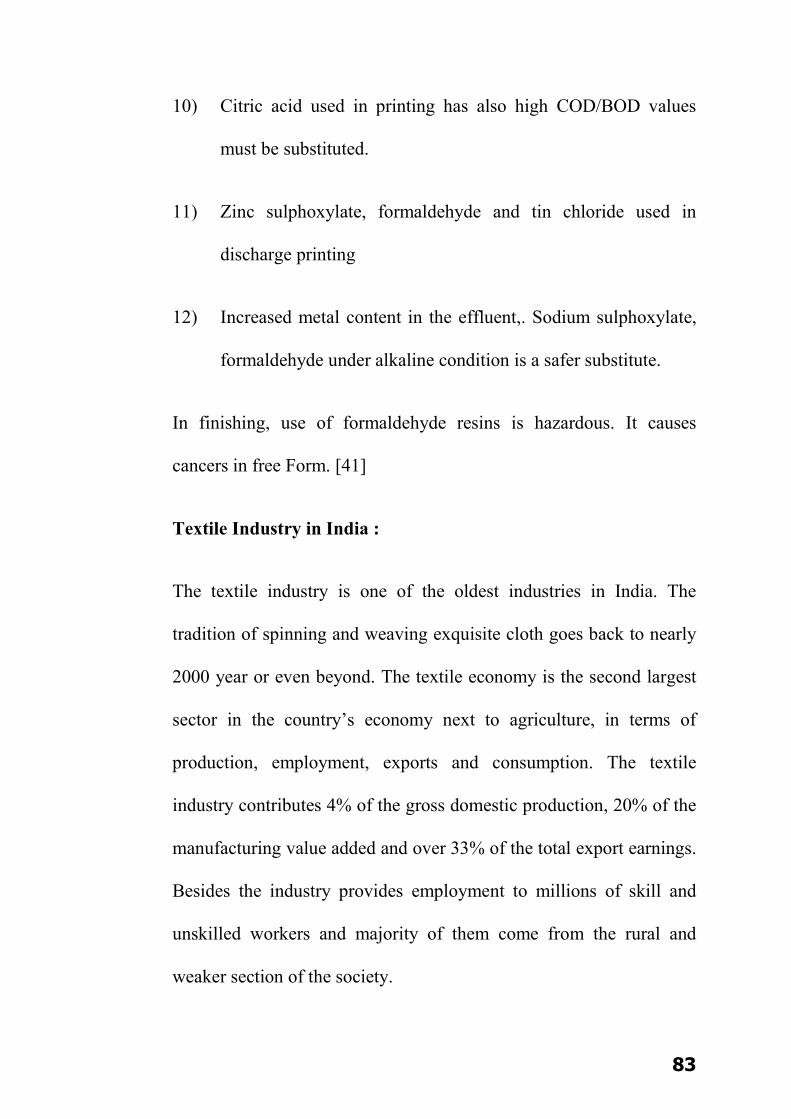
83
10) Citric acid used in printing has also high COD/BOD values
must be substituted.
11) Zinc sulphoxylate, formaldehyde and tin chloride used in
discharge printing
12) Increased metal content in the effluent,. Sodium sulphoxylate,
formaldehyde under alkaline condition is a safer substitute.
In finishing, use of formaldehyde resins is hazardous. It causes
cancers in free Form. [41]
Textile Industry in India :
The textile industry is one of the oldest industries in India. The
tradition of spinning and weaving exquisite cloth goes back to nearly
2000 year or even beyond. The textile economy is the second largest
sector in the country’s economy next to agriculture, in terms of
production, employment, exports and consumption. The textile
industry contributes 4% of the gross domestic production, 20% of the
manufacturing value added and over 33% of the total export earnings.
Besides the industry provides employment to millions of skill and
unskilled workers and majority of them come from the rural and
weaker section of the society.
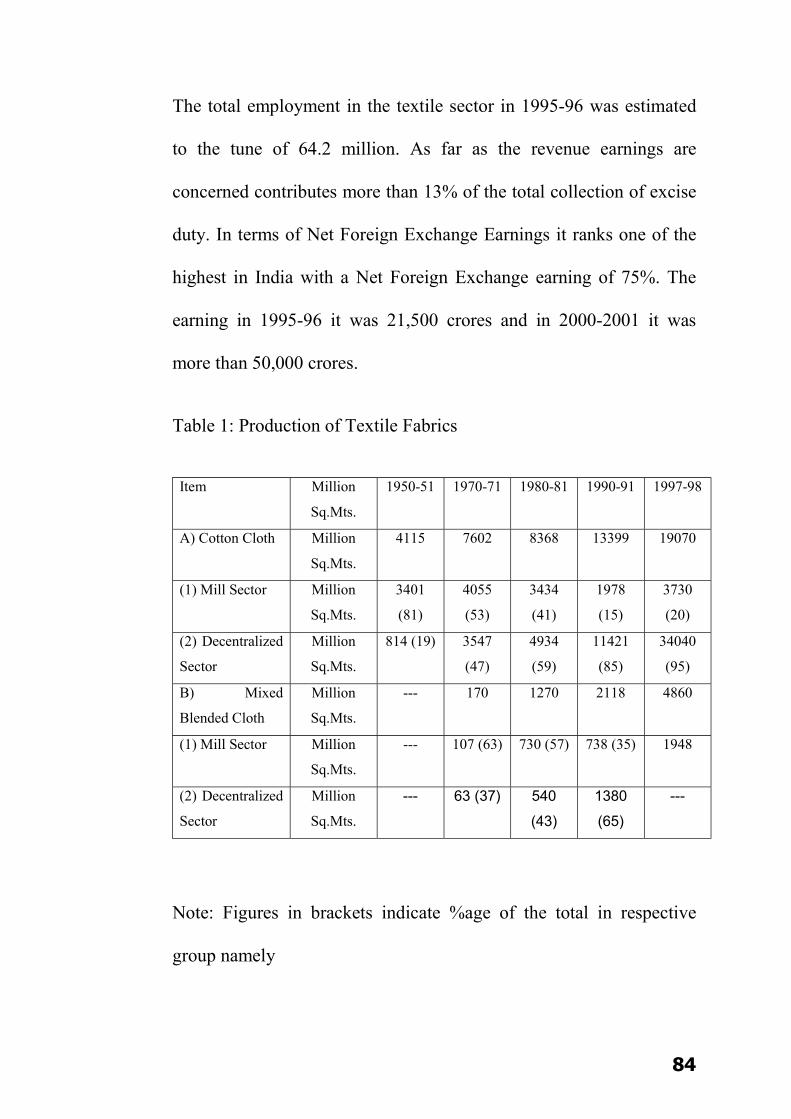
84
The total employment in the textile sector in 1995-96 was estimated
to the tune of 64.2 million. As far as the revenue earnings are
concerned contributes more than 13% of the total collection of excise
duty. In terms of Net Foreign Exchange Earnings it ranks one of the
highest in India with a Net Foreign Exchange earning of 75%. The
earning in 1995-96 it was 21,500 crores and in 2000-2001 it was
more than 50,000 crores.
Table 1: Production of Textile Fabrics
Item Million
Sq.Mts.
1950-51 1970-71 1980-81 1990-91 1997-98
A) Cotton Cloth Million
Sq.Mts.
4115 7602 8368 13399 19070
(1) Mill Sector Million
Sq.Mts.
3401
(81)
4055
(53)
3434
(41)
1978
(15)
3730
(20)
(2) Decentralized
Sector
Million
Sq.Mts.
814 (19) 3547
(47)
4934
(59)
11421
(85)
34040
(95)
B) Mixed
Blended Cloth
Million
Sq.Mts.
--- 170 1270 2118 4860
(1) Mill Sector Million
Sq.Mts.
--- 107 (63) 730 (57) 738 (35) 1948
(2) Decentralized
Sector
Million
Sq.Mts. --- 63 (37) 540
(43)
1380
(65)
---
Note: Figures in brackets indicate %age of the total in respective
group namely

85
(a) Cotton cloth
(b) Mixed blended cloth
(c) Man made fiber fabrics.
Growth of textile industry in India:
The textile industry in India can be divided into two broad sectors
namely “Mill Sector” and “Decentralized Sector” which is coming
into great prominence and contributing increasing quantities of textile
in the total cloth production in the country. The following table shows
the same. The textile fabric or cloth that is being produced in India is
of three kinds:
Cotton Cloth :
Mixed or blended cloth in which cloth is manufactured using both
cotton thread and man made fiber.
Cloths manufactured by using only man made fiber or thread.
It may also be pointed out that cloth is produced in India in the
organized textile mills that is mills or organized sector and secondly
cloth is also produced in the decentralized sector which is made up of
thousands of handlooms and power looms with which cloth produced
of all the three kinds mentioned above namely cotton cloth, mixed or

86
blended cloth and man made fiber fabric in case of which cloth is
produced entirely using man made fiber or thread. From the table 1
following facts become clear:
(1) If we consider all the three types of textile fabrics which are
produced in the country it is noticed that in 1950-51 textile
fabric produced in the country amounted to 4,515 million sq
mts whereas in 1991 the figure was 20,354 million sq mts. This
means that in 40 years time the production of the textile fabric
in the country has increased by 4.5 folds.
(2) In respect of production of cotton cloth in 1950-51, 4215
million sq mts was produced while in 1990-91 production rose
to 13,399 million sq mts. This means the production of cotton
cloth increased by three Times during 40 years.
(3) In respect of production of cotton cloth it is also noticed from
the table that in 1950-51 nearly 81% of the total cotton cloth
was produced in the mill sector whereas only 19% was
produced in the decentralized sector. As years went by the
percentage of mill sector went on declining and that of the
decentralized sector increased. [42]
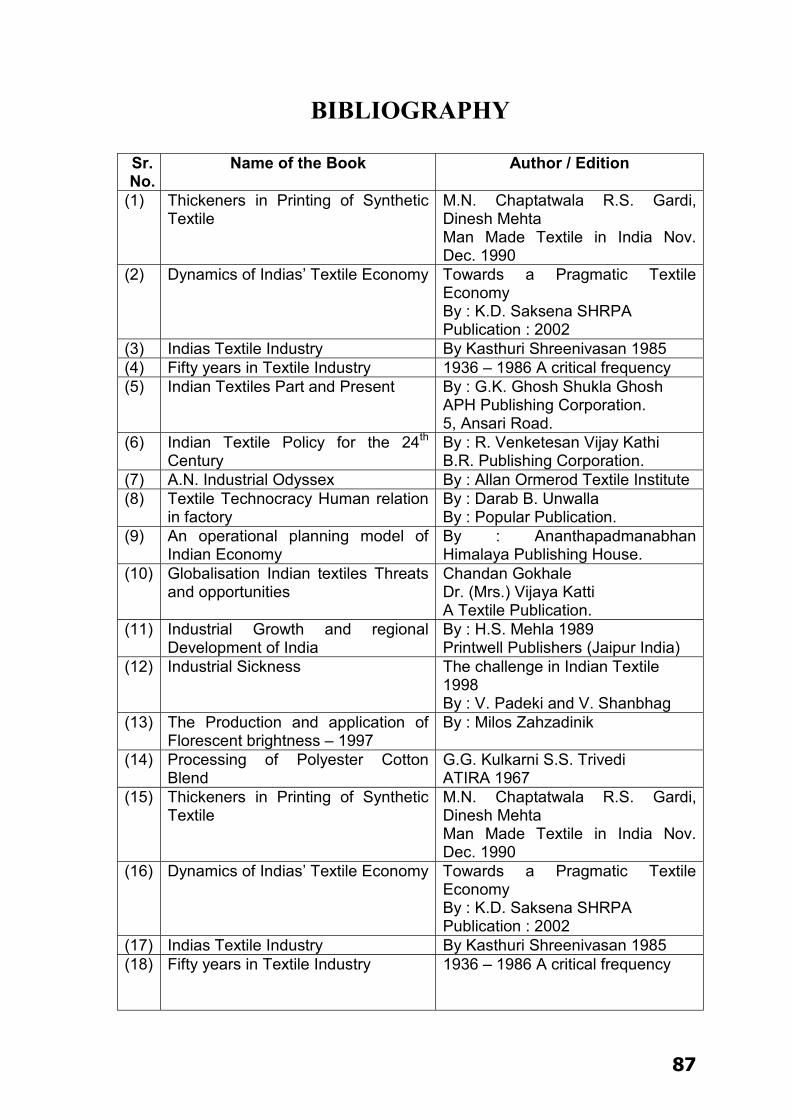
87
BIBLIOGRAPHY
Sr. No.
Name of the Book Author / Edition
(1) Thickeners in Printing of Synthetic Textile
M.N. Chaptatwala R.S. Gardi, Dinesh Mehta Man Made Textile in India Nov. Dec. 1990
(2) Dynamics of Indias’ Textile Economy Towards a Pragmatic Textile Economy By : K.D. Saksena SHRPA Publication : 2002
(3) Indias Textile Industry By Kasthuri Shreenivasan 1985 (4) Fifty years in Textile Industry 1936 – 1986 A critical frequency (5) Indian Textiles Part and Present By : G.K. Ghosh Shukla Ghosh
APH Publishing Corporation. 5, Ansari Road.
(6) Indian Textile Policy for the 24th Century
By : R. Venketesan Vijay Kathi B.R. Publishing Corporation.
(7) A.N. Industrial Odyssex By : Allan Ormerod Textile Institute (8) Textile Technocracy Human relation
in factory By : Darab B. Unwalla By : Popular Publication.
(9) An operational planning model of Indian Economy
By : Ananthapadmanabhan Himalaya Publishing House.
(10) Globalisation Indian textiles Threats and opportunities
Chandan Gokhale Dr. (Mrs.) Vijaya Katti A Textile Publication.
(11) Industrial Growth and regional Development of India
By : H.S. Mehla 1989 Printwell Publishers (Jaipur India)
(12) Industrial Sickness The challenge in Indian Textile 1998 By : V. Padeki and V. Shanbhag
(13) The Production and application of Florescent brightness – 1997
By : Milos Zahzadinik
(14) Processing of Polyester Cotton Blend
G.G. Kulkarni S.S. Trivedi ATIRA 1967
(15) Thickeners in Printing of Synthetic Textile
M.N. Chaptatwala R.S. Gardi, Dinesh Mehta Man Made Textile in India Nov. Dec. 1990
(16) Dynamics of Indias’ Textile Economy Towards a Pragmatic Textile Economy By : K.D. Saksena SHRPA Publication : 2002
(17) Indias Textile Industry By Kasthuri Shreenivasan 1985 (18) Fifty years in Textile Industry 1936 – 1986 A critical frequency

88
Sr. No.
Name of the Book Author / Edition
(19) Indian Textiles Part and Present By : G.K. Ghosh Shukla Ghosh APH Publishing Corporation. 5, Ansari Road.
(20) Indian Textile Policy for the 24th Century
By : R. Venketesan Vijay Kathi B.R. Publishing Corporation.
(21) A.N. Industrial Odyssex By : Allan Ormerod Textile Institute (22) Textile Technocracy Human relation
in factory By : Darab B. Unwalla By : Popular Publication.
(23) An operational planning model of Indian Economy
By : Ananthapadmanabhan Himalaya Publishing House.
(24) Globalisation Indian textiles Threats and opportunities
Chandan Gokhale Dr. (Mrs.) Vijaya Katti A Textile Publication.
(25)
Industrial Growth and regional Development of India
By : H.S. Mehla 1989 Printwell Publishers (Jaipur India)
(26) Industrial Sickness The challenge in Indian Textile 1998 By : V. Padeki and V. Shanbhag
(27) The Production and application of Florescent brightness – 1997
By : Milos Zahzadinik
(28) Processing of Polyester Cotton Blend
G.G. Kulkarni S.S. Trivedi ATIRA 1967
(29) Processing of Man Made Fibres 2001
V. Usenko MIR Publishers Morco
(30) Economy energy and environment in textile Wet Processing
By S.S. Trivedi 1987
(31) Textile Processing and finishing Aids By : John W. Palmer 1977 Noya data Corporation U.S.A.
(32) Processing of Polyster Cotton Blend By : G.G.Kulkarni S.S. Trivedi ATIRA 1967
(33) Norms for The Textile Industry ATIRA (34) Process Control in Wearing By : M.C. Paliwal and P.D. Kimoti
1986 (35) Water and effluents in Textile Mills
1989 P.B. Jhala M.M. Vyas and K. Subrahmanyam
(36) Maintenance in chemical processing department of textile Mills
By : S.V. Gokhale and A.K. Dhingra
(37) Textile Processing and Properties 1998
Preparation of Dyeing, Finishing and Performance By : TYRONEL VIGO
(38) Technology of bleaching and Mercerizing
By : Dr. SHENAI SEVAK Publications 1996.
(39) Me and My Mill Industry By : Bhaskar G. Kakatkar 1998 The Indian Cotton Mills Federation; Bombay.
(40) An exercise in Managing a TextileMills
By : R.P. Poddar 1991
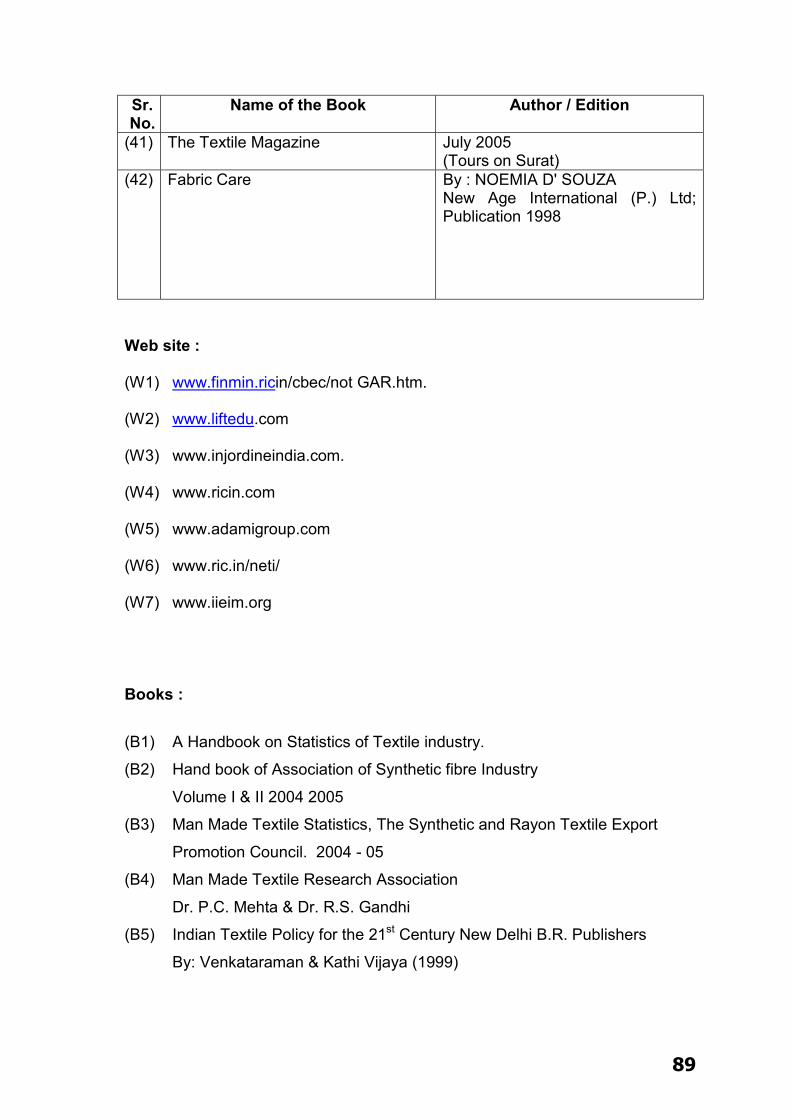
89
Sr. No.
Name of the Book Author / Edition
(41) The Textile Magazine July 2005 (Tours on Surat)
(42) Fabric Care By : NOEMIA D' SOUZA New Age International (P.) Ltd; Publication 1998
Web site :
(W1) www.finmin.ricin/cbec/not GAR.htm.
(W2) www.liftedu.com
(W3) www.injordineindia.com.
(W4) www.ricin.com
(W5) www.adamigroup.com
(W6) www.ric.in/neti/
(W7) www.iieim.org
Books :
(B1) A Handbook on Statistics of Textile industry.
(B2) Hand book of Association of Synthetic fibre Industry
Volume I & II 2004 2005
(B3) Man Made Textile Statistics, The Synthetic and Rayon Textile Export
Promotion Council. 2004 - 05
(B4) Man Made Textile Research Association
Dr. P.C. Mehta & Dr. R.S. Gandhi
(B5) Indian Textile Policy for the 21st Century New Delhi B.R. Publishers
By: Venkataraman & Kathi Vijaya (1999)

90
CHAPTER – 3
A BRIEF PROFILE OF TEXTILE INDUSTRY IN
SOUTH GUJARAT
3.1 Profile of the Textile Industry of South Gujarat.
3.2 Environment of the Industry.
3.3 Pattern of the growth in the South Gujarat Region.
3.4 Technology of the Textile Industry.
3.5 Infrastructural Facilities in South Gujarat.

91
3.1 TEXTILE INDUSTRY OF SOUTH GUJARAT :
Gujarat is one of the oldest and major centres of the composite mills
in India. The prime centre of the Textile Industry has been mainly
located in the places like Ahmedabad and Surat. Ahmedabad hitherto
was called as “Manchester of India”. It is estimated that Gujarat has
about 16 lakh power looms. Ahmedabad has about 400,000 power
looms and 150 process houses. While in South Gujarat there are more
than 4, 50,000 power looms and 300 process houses. In addition to
this other regions are Vapi, Bharuch and Ankleshwar.
Earlier, there were three centres in India. They were Mumbai,
Ahmedabad and Kanpur. When the textile industry was in its boom
Ahmedabad had about 86 composite looms but due to the faulty
policy of the Government there has been a drastic decline in the
number of composite mills in Ahmedabad and presently there are
only 8 to 10 mills working in the city. This decline in the composite
mills can be attributed due to the following reasons:
The labour cost, electricity charges, local tax are relatively high.
Besides the electricity and fuel charges in Ahmedabad are relatively
high as compared to Tamil Nadu, Maharashtra, and West Bengal.
92
Further the Sales Tax and other Local Taxes are higher in Gujarat and
there is an Octroi duty of 4% levied on the raw material. This also
increases the cost.
The sickness of the composite mills is attributed to the increase in
number of the power looms and process houses which have been set
up in large numbers in Surat, Bhiwandi, Ankleshwar, Bharuch and
other places in the country.
SURAT:
Surat has been in existence as a sea port since the 1600 century by the
Britishers. It is said that Surat received trade ships from 84 countries
of the world. The city is known for mainly two industries that is
Diamond and Textile.
The city is spread over 113 sq km. The city experienced rapid
industrial growth since 1960s. It has presently a work force of about
12 lakh. The city today has emerged as the major revenue earner in
terms of excise, sale tax and house tax. The city also experienced
floods in 1960 causing heavy damage to the infrastructural property.
However with the construction of Ukai Dam the threats of floods
have now reduced.

93
As Surat is 350 km away from Mumbai it has developed as a satellite
industrial town which has constantly fed to the industries of the
commercial capital of the country. As per the Surat Municipal
Corporation presently there are 10,000 diamond cutting and polishing
unit and 380 dyeing and printing mills, 80 chemical industries, 500
texturising unit approximately 4,50,000 power loom units and 6610
jari units in the city.
As per the estimate about 40% of the man made fabrics in the country
is manufactured in Surat. Almost 80 percent of the country’s total
diamond processing (cutting and polishing) is done in Surat. The city
is a major foreign exchange earner with around 40% of the Nation’s
total diamond and gems report having a turnover of about Rs 36000
annually. Prior to 1970s the city’s economy was attributed with jari
and art silk industry. The famous Kancheevaram sarees of the South
India used to get the jari/lurex with gold linings from Surat.
In 1960 and 1970 the diamond industry witnessed a real boom. Rough
diamonds were imported from the miner of South Africa and the Surti
Patel’s were the craftsman who used their skills in cutting and
polishing in Surat. It is said that out of 10 diamonds in the world 7
diamonds are cut and polished in Surat. The boom in the diamond
industry gave a boost to the Export Sector.
Since the last 2 decades the area around Surat has witnessed huge
industrial development and heavy industries like Reliance Industries
Limited, Essar Steels, KRIBHCO, ONGC, NTPC, Larson and Tubro

94
have set up their work installations at Hazira on the coastal belt in
Surat. The total investment in Hazira belt is to the tune of Rs 18,860
crores products like Heavy plant equipment, Liquid petroleum gas,
Sulphur synthetic yarn, Sponge iron, Urea ammonia, DAP are
produced by Larsen and Tubro, Essar Steel, ONGC and Reliance
Industries, projects like nuclear energy heavy water are also being
executed.
In the recent years the slump in the world market in the past few years
has largely affected the textile and diamond industry. This has
resulted in the diversification and has resulted the growth of paper
mills, cattle feed production units, forest produced and mineral based
units, poultry farms, electronic manufacturing units, ship building,
wind mills, furnace and rolling mills, air conditioning and
refrigeration, aqua culture and marine product based industries.
Recently liquefied natural gas (LNG) terminal at Hazira near
Magdalla port started its operation. A economic zone first of its kind
in the country has also started functioning near Sachin in Surat since
November 2000 for giving fillip to the export facility under one roof.
A garment park has also been planned in the city.
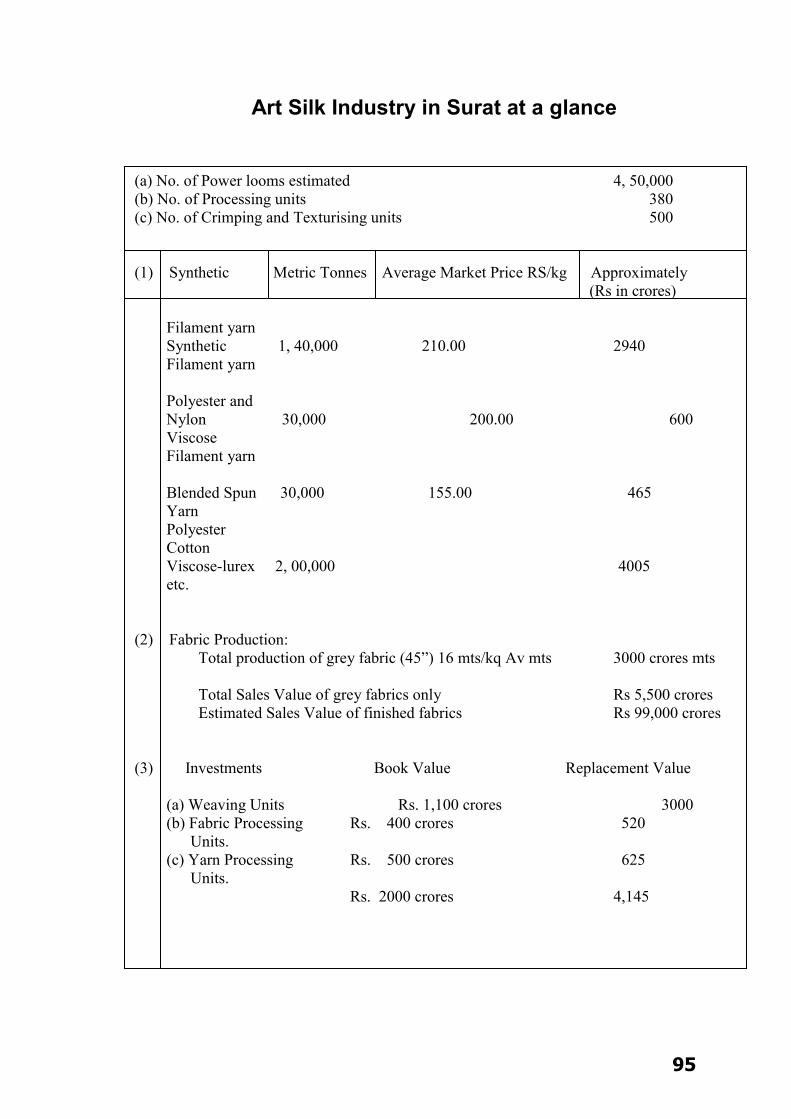
95
Art Silk Industry in Surat at a glance
(a) No. of Power looms estimated 4, 50,000 (b) No. of Processing units 380 (c) No. of Crimping and Texturising units 500 (1) Synthetic Metric Tonnes Average Market Price RS/kg Approximately (Rs in crores) Filament yarn Synthetic 1, 40,000 210.00 2940 Filament yarn Polyester and Nylon 30,000 200.00 600 Viscose Filament yarn Blended Spun 30,000 155.00 465 Yarn Polyester Cotton Viscose-lurex 2, 00,000 4005 etc. (2) Fabric Production: Total production of grey fabric (45”) 16 mts/kq Av mts 3000 crores mts Total Sales Value of grey fabrics only Rs 5,500 crores Estimated Sales Value of finished fabrics Rs 99,000 crores (3) Investments Book Value Replacement Value (a) Weaving Units Rs. 1,100 crores 3000 (b) Fabric Processing Rs. 400 crores 520 Units. (c) Yarn Processing Rs. 500 crores 625 Units. Rs. 2000 crores 4,145
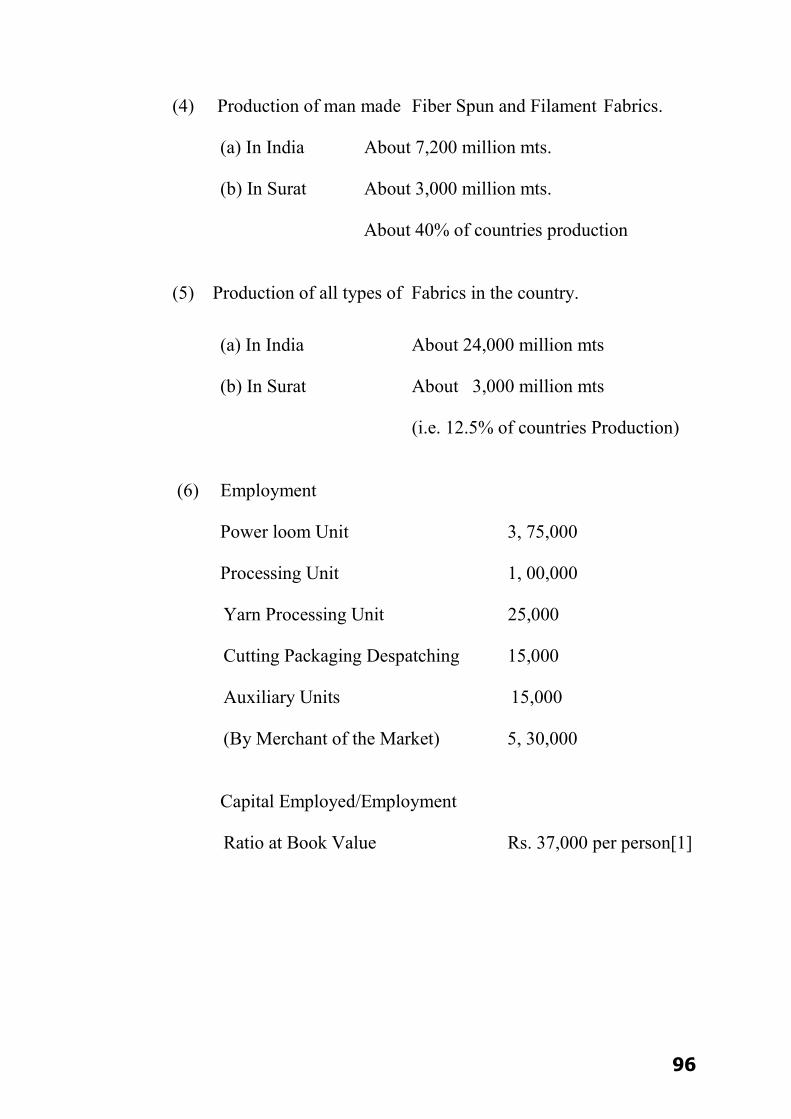
96
(4) Production of man made Fiber Spun and Filament Fabrics.
(a) In India About 7,200 million mts.
(b) In Surat About 3,000 million mts.
About 40% of countries production
(5) Production of all types of Fabrics in the country.
(a) In India About 24,000 million mts
(b) In Surat About 3,000 million mts
(i.e. 12.5% of countries Production)
(6) Employment
Power loom Unit 3, 75,000
Processing Unit 1, 00,000
Yarn Processing Unit 25,000
Cutting Packaging Despatching 15,000
Auxiliary Units 15,000
(By Merchant of the Market) 5, 30,000
Capital Employed/Employment
Ratio at Book Value Rs. 37,000 per person[1]
97
TEXTILE INDUSTRY OF SOUTH GUJARAT REGION:
Surat was famous for its Lurex or Jari Industry and Pure silk from the
early times and off late since last two decades it is famous for its
diamond and Synthetic Fabric Industries world wide. The Art Silk or
Synthetic Fabric is concerned it started in 1978-79 in Surat region
replacing the pure silk and presently it is the largest manufacturer of
the synthetic fabric not only in the country but across the globe.
The total number of looms installed in the 40 km circumference from
Surat is more than 6.5 Lakh and about 90% of them use Nylon,
Viscose and Polyester Yarn. As such in the past the textile industry
and composite mills were situated in Mumbai, Ahmedabad region.
The composite units carry out all the activities from raw material
stage to the finished stage under one roof. In 1980-81 a major labour
strike took place in Mumbai by Dr. Dutta Samant the strike lasted for
months and this brought the decline in the composite mill sector and
thereafter the Government also decentralized the Textile Industry.
This led to the development of small scale entrepreneur and the phase
of decentralization started where main three process of spinning,
weaving, dyeing and finishing decentralized. At present three
channels is prevalent in Surat.

98
(1) Large scale : These units which have their own weaving unit,
besides some fabric, they get the job work done by outside
weavers.
These units are large in size and have their own Dyeing and
Printing Units besides they also have their own Market Net
Work like Garden Vareli, Vipul Sarees, Gupta Dyeing, Parag
Sarees and Pratibha Textile, Himson Group.
(2) Medium Scale : These units have their own unit of weaving as
well as dyeing some of the products are also being
manufactured on job work basis. They are Luthra, Rachna and
others are some examples of medium scale units.
(3) Small scale : Around 70% of the total grey manufacturers fall
in this category. Majority of them are having 24 to 48 looms.
These manufacturers produce the grey fabric and sell in the
Surat Textile Market i.e. to the traders. The breakages of the
production are as under:
About 70% of Saree cloth
About 15% of Dress Material
About 15% Shirting and Suiting

99
The quality of the Fabric manufactured is known by different brand
names such as De China, Poonam, Chiffon, Metal Chiffon, etc. The
distribution channels are as under: [2]
Man Made Fiber/ Filament Industry :
Fashion Trends are fast changing in India in live with the Global
Trends. Factors responsible for the change are high per capita
earnings and increased exposure to Electronic Media; Western
dresses are now replacing traditional Indian Dress particularly among
ladies. Moreover shift in the fashion cycle which is getting shorter as
the consumers demand for greater products of international standard.
The man made fiber/filament industry which started in India in 1950s
today accounts for over 28% of all textile fiber and yarn in the
country. It is making remarkable progress and in the next 5 to 6 years
time this industry is likely to account for almost 50% of all Textile
Fiber Production in the country. It is a very large and fast growing
industry and asks for efficient analysis. Man Made Textile Industry in
India has certain unique advantage which can benefit global buyers.
Weavers Traders Whole Seller Retailer Consumers

100
SALIENT FEATURES:
(1) This industry is centuries old and today it has perfected the art
of producing Exquisite Textiles.
(2) Industry is self sufficient and is vertically well integrated.
(3) The production is well diversified. This has also brought about
specialty in the work more over such a system can adopt
frequent changes according to the fashion trends prevalent in
the market.
(4) The set up is capable for sufficing large quantity of orders.
(5) The range of product is quite wide. It ranges from sophisticated
to those which are required by middle and lower end
customers. [B1]
3.2 ENVIRONMENT IN TEXTILE INDUSTRY :
The power loom industries of Surat have essentially a decentralized
character. Family members irrespective of age or sex have carried or
weaving mostly in small units in their free time. The industry is
labour intensive and one of the largest single source of employment
employing more than 8 lakh persons in power loom, fabric
101
processing, yarn processing, cutting/packing, etc. and other trading
activities. [W1]
CONTINUOUS GROWTH:
Despite of restrictions imposed by the government the industry has
had continuous growth. As the infrastructure is available small units
can be set up with little efforts in this part of the state. The present
trend is that more and more units of medium size i.e. 18 to 36 or more
looms will be better managed. They also have access to skilled
workers and other technical staff to control the wastage and the
damages thereby making the unit viable. [W2]
RURAL WORKERS:
The labour force employed in the textile industry of Surat is
heterogeneous. For example there are child female workers in the
preparatory wing, skilled weavers in the power loom units, skilled
machine operators or beggaries in the process house. [W3]
CONCEPT OF HEALTHY WAGES:
It is note worthy, that the power loom units are poor pay master. But
the trend at present indicate a shift towards costlier sort of nylon and
polyester and this has resulted in better wages to the weavers not only
because of per meter rate being higher but also as now the weaver
102
handles 3 to 4 looms or more as compared to 2 looms handled earlier.
It is reported that average wage is Rs. 100 for 4 looms in 12 hours.
MUSHROOMING OF SLUMS AND HEALTH PROBLEMS:
Majority of the labour force belong to other states mainly Andhra
Pradesh, Orissa, UP and Bihar where the pace of industrial
development is very slow. The migrant labour has come to Surat after
1975 and thereafter there has been galloping development in the
Industrialization This has resulted in rapid growth of the slums and
dwelling which has caused over crowding in the slum and because of
unhealthy living condition the health of the water is affected and this
results into absenteeism form the work. Mostly these workers are very
poor and many a times they resort to antisocial activity which is also a
major threat to the area where they reside. [W4]
UNION ACTIVITIES:
The workers come from different states and so they normally do not
unit. As they are also not aware of their rights and they are also
unaware of the labour laws. No complaints are registered for the fear
of loosing job. There is no prominent union present in the region.
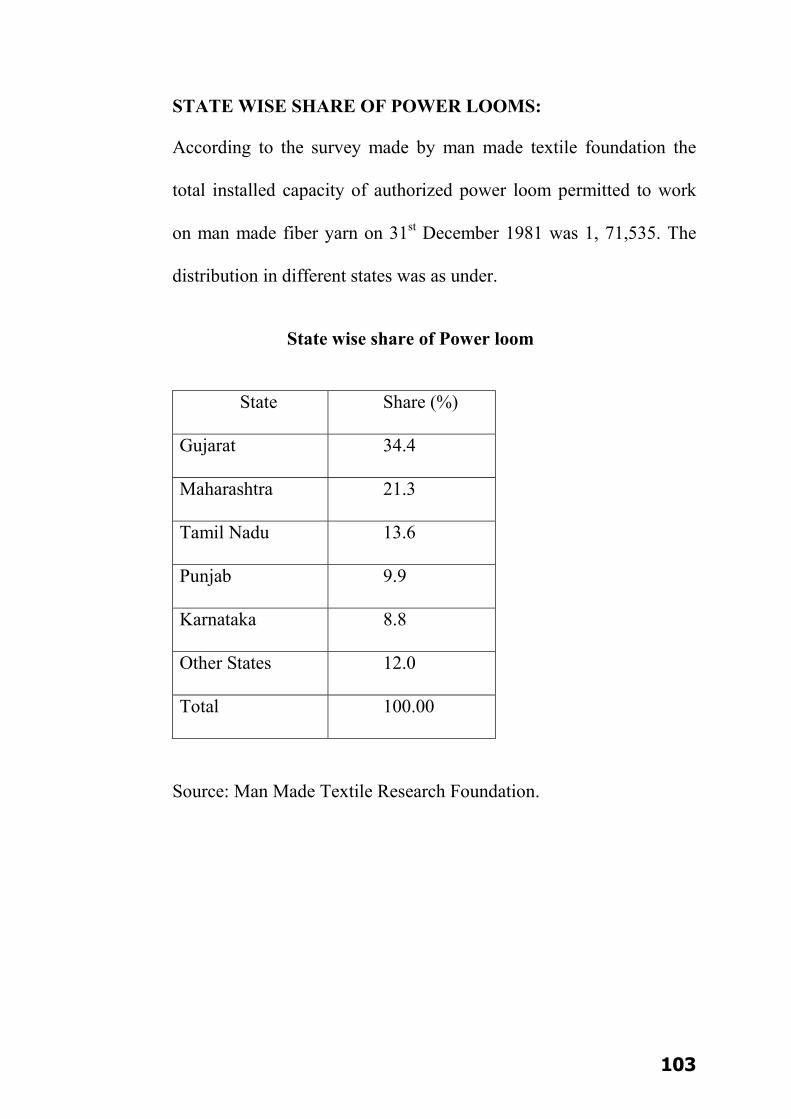
103
STATE WISE SHARE OF POWER LOOMS:
According to the survey made by man made textile foundation the
total installed capacity of authorized power loom permitted to work
on man made fiber yarn on 31st December 1981 was 1, 71,535. The
distribution in different states was as under.
State wise share of Power loom
State Share (%)
Gujarat 34.4
Maharashtra 21.3
Tamil Nadu 13.6
Punjab 9.9
Karnataka 8.8
Other States 12.0
Total 100.00
Source: Man Made Textile Research Foundation.
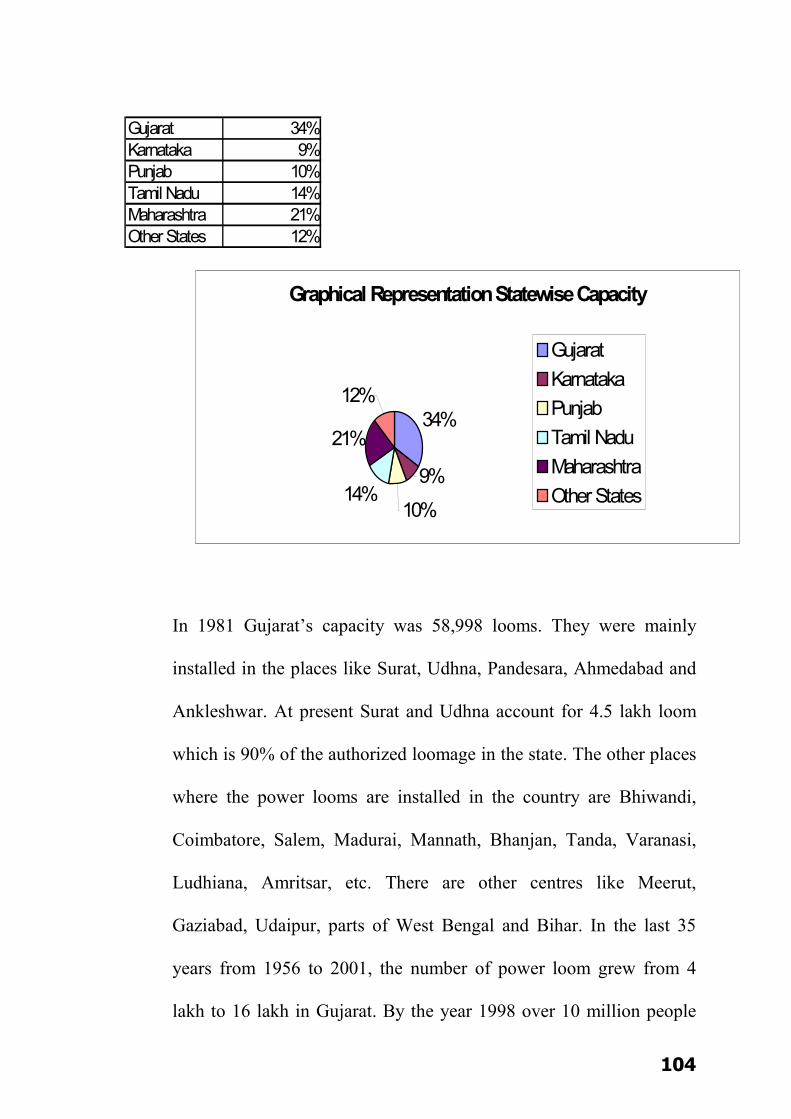
104
Gujarat 34%Karnataka 9%Punjab 10%Tamil Nadu 14%Maharashtra 21%Other States 12%
Graphical Representation Statewise Capacity
34%
9%10%
14%
21%
12%
GujaratKarnatakaPunjabTamil NaduMaharashtraOther States
In 1981 Gujarat’s capacity was 58,998 looms. They were mainly
installed in the places like Surat, Udhna, Pandesara, Ahmedabad and
Ankleshwar. At present Surat and Udhna account for 4.5 lakh loom
which is 90% of the authorized loomage in the state. The other places
where the power looms are installed in the country are Bhiwandi,
Coimbatore, Salem, Madurai, Mannath, Bhanjan, Tanda, Varanasi,
Ludhiana, Amritsar, etc. There are other centres like Meerut,
Gaziabad, Udaipur, parts of West Bengal and Bihar. In the last 35
years from 1956 to 2001, the number of power loom grew from 4
lakh to 16 lakh in Gujarat. By the year 1998 over 10 million people
105
were dependent directly or indirectly and the average monthly salary
has gone up to Rs. 2200 per month which is much higher than the
minimum wage prescribed for the skilled workers.
The synthetic yarn manufactures have also concentrated on this
sector. This sector is a major provider of clothing in the country. As
such the Union Territories of Dadra and Nagar Haveli, Silvasa and
Daman have also emerged as main centres. Prior to the installation of
production of yarn at Silvasa and Daman the activities of yarn
processing was located at in and around at Mumbai. Number of
Texturiser units and Crimping Units were situated near places like
Bhiwandi, Tarapur, etc.
Surat developed as a major yarn processing centre since the incentive
scheme from the Union Territories of Dadra Nagar Haveli, Silvasa
was announced by the Central Government. Further Silvasa, Daman,
Vapi, Ankleshwar, and Panoli which were near to Surat also became
new centres and Surat is also considered to be the Manchester of Man
Made Fabric Industry in India. The fast growth of the Man Made
Filament Industries in India and the speedy growth of power loom
sector have been complementary to each other. The yarn processing
sector is also linked between these two growing sectors.

106
The Fabric produced whether in organized mill or power loom sector
or hand loom sector has to be given a post weaving/ knitting
treatment. This treatment includes bleaching, mercerizing, heat
setting if required besides dyeing, printing and finishing. In the
composite mill all these activities are carried out in house. A large
number of process house have started to cater to the requirement of
Fabric Processing, from these sectors. [3]
Since 1970, process houses started setting up near power loom cluster.
As the time passed some independent merchant processors also came
into being. They purchase the grey (unprocessed) fabric from power
loom and used to get these fabric processed i.e. heat set, dyed, printed
and finished either through job work or by setting up their own
process house. Slowly as the power looms started up new installations
in the centres like Ankleshwar, Bhiwandi, Amritsar and Ludhiana and
so the process houses also started establishing up in the above places.
The process houses have become very vital for the survival of the
power looms. [4]
GROWTH OF TEXTILE INDUSTRY IN THE REGION:
Surat got electricity around 1925 and the 1st power loom was installed
in the year 1930 and prior to that the industry operated a few pedal
looms and a large number of handlooms. A few power looms were

107
operated with diesel generators as early as 1920. the following Table
1 gives an account of growth in number of units of looms from 1910
to 1983. It is found that in 1930 there were 185 power looms and it
increased to 2079 looms in 1940 and to 2882 looms in 1950. Number
of units was 27 in 1930, 74 in 1940 and 172 in 1950. In 1960 there
were 791 units with a total of 8105 looms or an average of 10 looms
per unit. This average was true in 1970 but it came down to 8.9 looms
per unit in 1980 and to 7.33 per unit in 1983. The decrease in the
number of looms per unit is because of the following reasons:
Inadequate financial resources Increasing Machinery Cost Factory legislations applying to larger units with more workers.
Table 1: Growth of Power Loom in Surat.
Year No. of Units Working.
Total No. of looms Working.
1910 1 2
1920 18 100
1930 27 185
1940 74 2079
1950 172 2882
1951 210 3111
1952 232 3404
1953 241 3483
1954 280 3674
1955 398 4750

108
1956 435 5144
1957 451 5287
1958 478 5515
1959 505 5861
1960 791 8105
1961 876 8742
1962 951 9444
1963 1000 9842
1964 1084 10504
1965 1377 12937
1966 1473 13963
1967 1540 14483
1968 1715 15809
1969 1784 16477
1970 2096 19025
1971 2336 20880
1972 2505 22316
1973 2674 23779
1974 2866 25488
1975 3264 28978
1976 3714 33079
1977 4107 36598
1978 4639 41094
1979 5264 46262
1980 5744 50083
1981 6126 53004
1983 8500 62348
Source: Man Made Textile Research Foundation.

109
Table 2 gives the growth of power looms since 1970 taking 1970 as
100. Between 1970 and 1983 the number have increased by factor of
1.8 up to 1981 and 2.28 as on 1983 i.e. a simple average growth of
18% up to 1981 and 2.28 as 1983 a simple average growth of 18%
and 22% respectively. [5]
Table 2: Rate of growth of power loom in Surat since 1970.
Year No of Power loom
Index
1970 19025 100
1971 20880 109.75
1972 22316 117.29
1973 23779 124.99
1974 25488 133.97
1975 28978 152.32
1976 33069 173.82
1977 36598 192.37
1978 41084 216.00
1979 46262 243.16
1980 50083 263.25
1981 53254 279.92
1983 62348 327.72
Source: Man Made Textile Research Foundation.
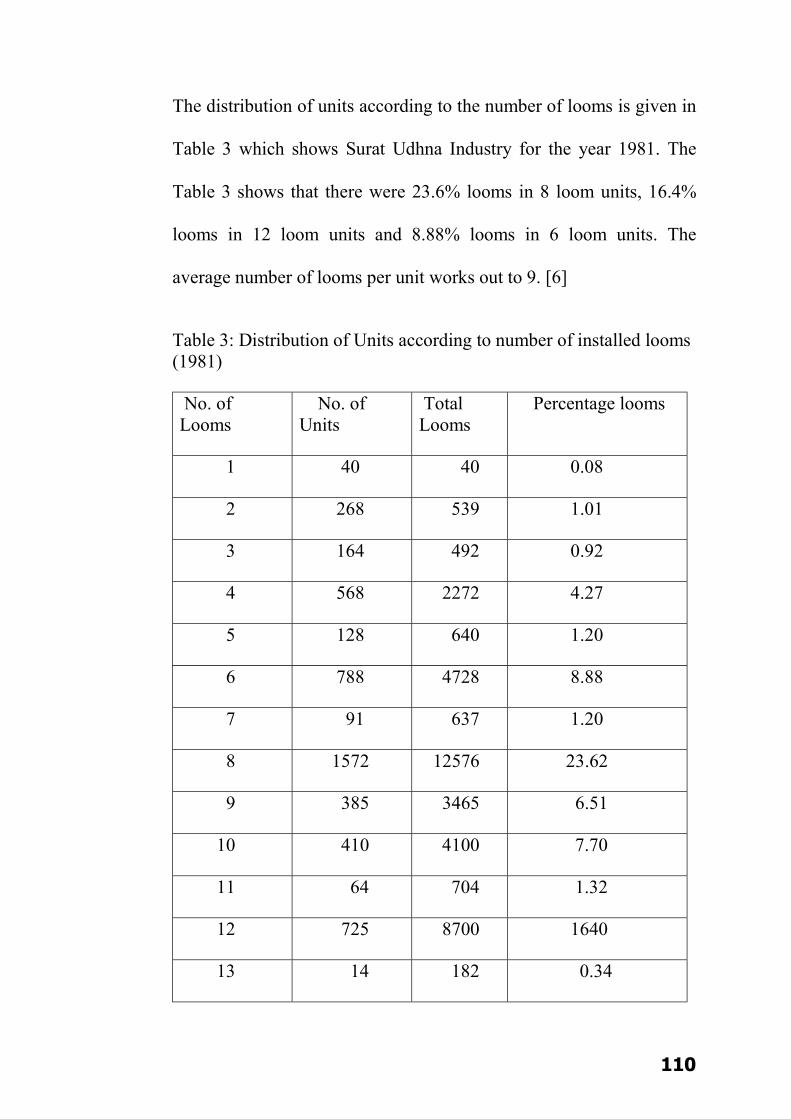
110
The distribution of units according to the number of looms is given in
Table 3 which shows Surat Udhna Industry for the year 1981. The
Table 3 shows that there were 23.6% looms in 8 loom units, 16.4%
looms in 12 loom units and 8.88% looms in 6 loom units. The
average number of looms per unit works out to 9. [6]
Table 3: Distribution of Units according to number of installed looms (1981)
No. of Looms
No. of Units
Total Looms
Percentage looms
1 40 40 0.08
2 268 539 1.01
3 164 492 0.92
4 568 2272 4.27
5 128 640 1.20
6 788 4728 8.88
7 91 637 1.20
8 1572 12576 23.62
9 385 3465 6.51
10 410 4100 7.70
11 64 704 1.32
12 725 8700 1640
13 14 182 0.34

111
14 56 784 1.47
15 24 360 0.68
16 120 1920 3.60
17 8 126 0.24
18 56 1008 1.89
19 8 152 0.28
20 45 900 1.69
21 3 63 0.11
22 13 286 0.54
23 2 46 0.09
24 41 984 1.85
25 3 75 0.14
>25 141 7440 13.97
Total 5741 53254 100.00
Source: Man Made Textile Research Foundation [7]
According to a survey of 1984 of membership of one of the larger
Weaver’s Association the distribution is shown in Table 4. Percentage
of Looms in Units 4, 6, 8, 12 and more than 25 looms in Table 5.
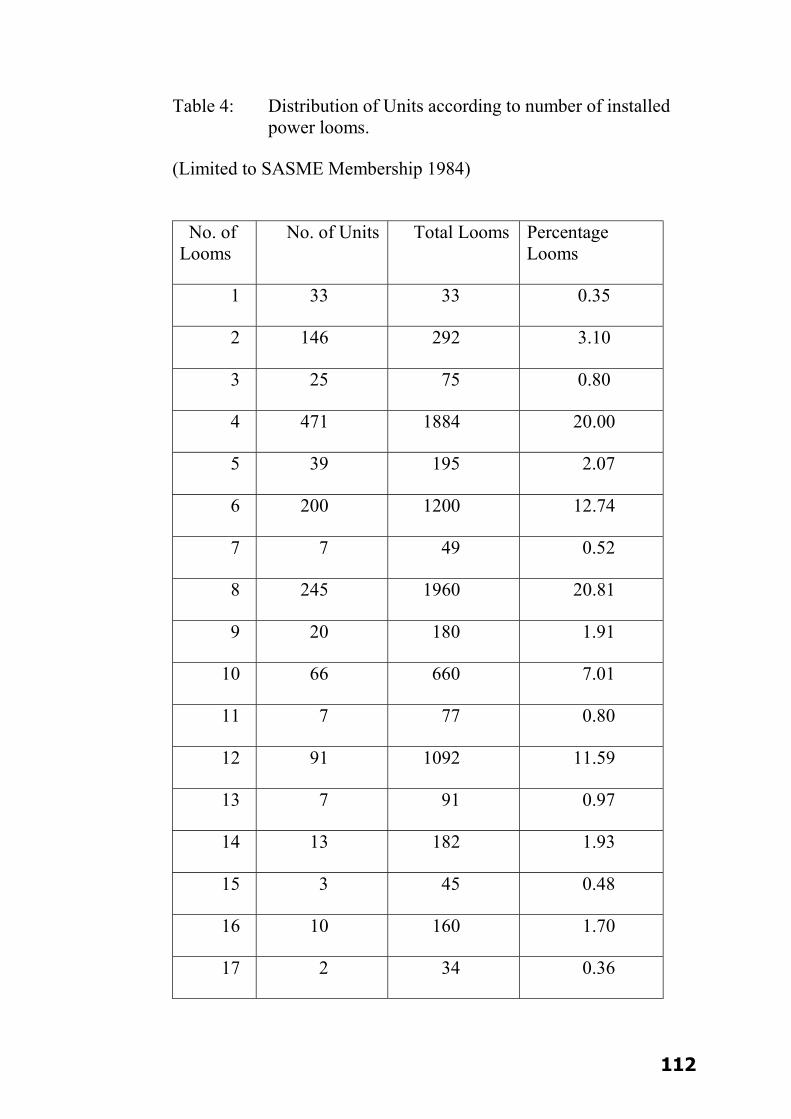
112
Table 4: Distribution of Units according to number of installed power looms.
(Limited to SASME Membership 1984)
No. of Looms
No. of Units Total Looms Percentage Looms
1 33 33 0.35
2 146 292 3.10
3 25 75 0.80
4 471 1884 20.00
5 39 195 2.07
6 200 1200 12.74
7 7 49 0.52
8 245 1960 20.81
9 20 180 1.91
10 66 660 7.01
11 7 77 0.80
12 91 1092 11.59
13 7 91 0.97
14 13 182 1.93
15 3 45 0.48
16 10 160 1.70
17 2 34 0.36

113
18 5 90 0.96
19 --- --- ---
20 5 100 1.06
21 1 21 0.22
22 4 88 0.93
23 --- --- ---
24 4 96 1.02
25 1 25 0.27
> 25 11 790 8.39
Total
1416 9419 99.96
Source: Man Made Textile Research Foundation. [8]
Table 5:
No. of looms per unit
Percentage looms
(1984- Limited Data)
Percentage looms
( 1981-84 Authorized looms)
4 1884/9419 20.00
6 1200/9419 12.74
8 1960/9419 20.81
12 1092/9419 11.59
25 790/9419 8.39
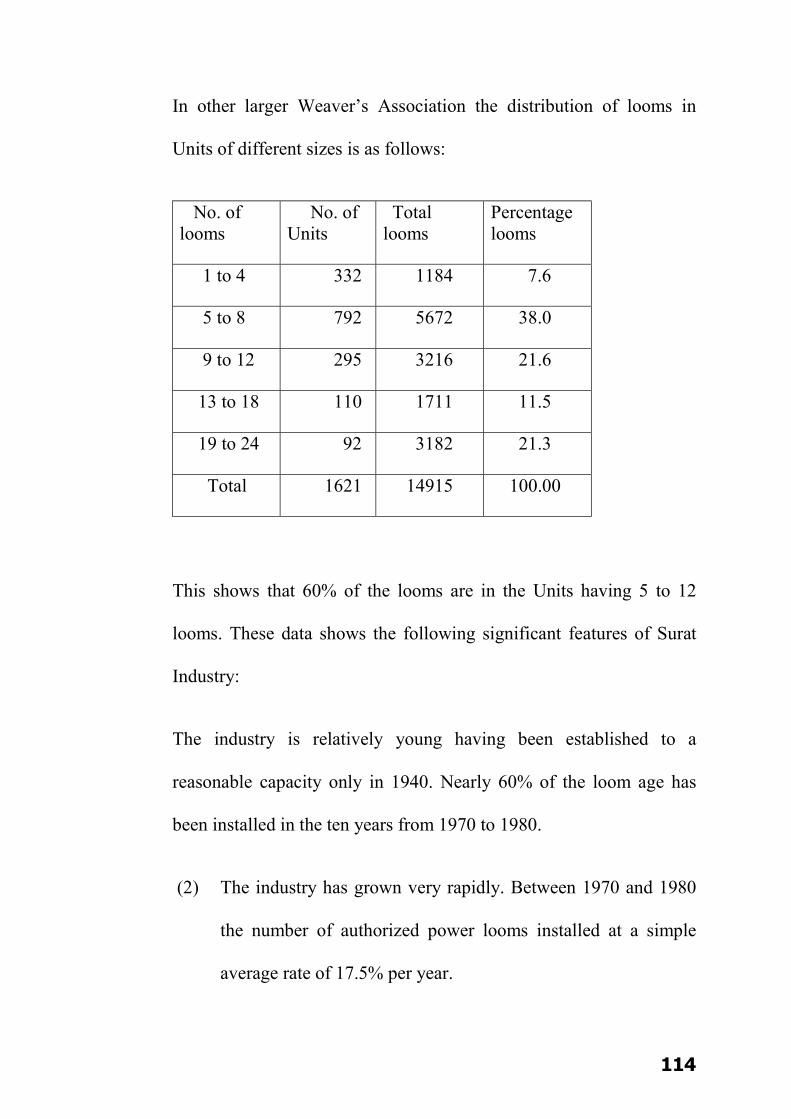
114
In other larger Weaver’s Association the distribution of looms in
Units of different sizes is as follows:
No. of looms
No. of Units
Total looms
Percentage looms
1 to 4 332 1184 7.6
5 to 8 792 5672 38.0
9 to 12 295 3216 21.6
13 to 18 110 1711 11.5
19 to 24 92 3182 21.3
Total 1621 14915 100.00
This shows that 60% of the looms are in the Units having 5 to 12
looms. These data shows the following significant features of Surat
Industry:
The industry is relatively young having been established to a
reasonable capacity only in 1940. Nearly 60% of the loom age has
been installed in the ten years from 1970 to 1980.
(2) The industry has grown very rapidly. Between 1970 and 1980
the number of authorized power looms installed at a simple
average rate of 17.5% per year.
115
(3) The industry is highly decentralized majority of units having 4,
6, 8, or 12 looms. There are only about 8 to 15% looms in units
with more than 25 looms. The total no of such units being,141.
There are only about 40 units with more than100 looms with a
total loom age of about 10% of the total loom age in Surat. [9]
According to Mr. R.P. Poddar, (The Indian Textile Journal Volume
XCIV Page 37, Feb 1984), the share of the decentralized sector in
cloth production in India has grown from 21% in 1961 to 63% in
1984. There were 23000 authorized power loom in 1951, 1,46,000 in
1963, 3,46,000 in 1978 and 5,77,000 in 1982-83. There is substantial
unauthorized capacity which is difficult to estimate except from
consumption of spun and filament yarn. According to these estimates
the total number of power looms in India is approximately 8 lakhs (6
lakhs unauthorized).
In Surat the total number of power looms is estimated at about 1.5
lakh out of which 0.62 lakh are unauthorized. The total production
capacity of all the three sectors of the Indian Textile industry is 22000
million meters. Where as the highest production achieved has been
11,145 million meters of which 8120 million meters was cotton and
3025 million meters was blends and man made textiles. It is obvious
that there is considerable over capacity as far as cloth production
116
goes. This is one of the reasons why many textile mills are getting
financially sick.
The total number of power looms in Surat and Udhna is estimated to
be 4.5 lakh though the number of authorized looms is only about 2
lakh. Production per loom per day is on an average 40 mts. Thus at
100% capacity utilization daily production can be estimated at about
180 lakh mts. The industry works at 70% capacity. Thus daily
production of cloth can be estimated at about 126 lakh mts.
Amongst the first process house to be set up in Surat were Dhanamal
Silk Mills and S Standard Silk Mills (of Vakharia group). Prior to
1940 Garden Silk Mills set up its process house in 1931. J.L Vakharia
and Hathiwalas also set up process houses in Surat between 1930 and
1940. In 1965 there were only 14 process houses in Surat. The
number increased to 28 by 1970, 30 by 1975 and 104 by 1980 and
today in 2005 there are 385 process houses. The growth of the process
houses in Surat is shown in Table 6. [9]

117
Table : 6
Growth of Process House in Surat:
Year Total No. of Units Working
Year Total No. of Units Working
1931 1 1970 28
1940 2 1971 35
1941 3 1972 40
1948 4 1973 42
1949 5 1974 43
1954 6 1975 50
1957 7 1976 56
1961 8 1977 68
1963 9 1978 80
1964 10 1979 98
1965 14 1980 104
1966 17 1981 122
1967 20 1982 129
1968 23 1983 134
1969 24 1984 140
The growth (in terms of 1965=100) in number of process houses from
1965 to 1984 is shown in Table 7.
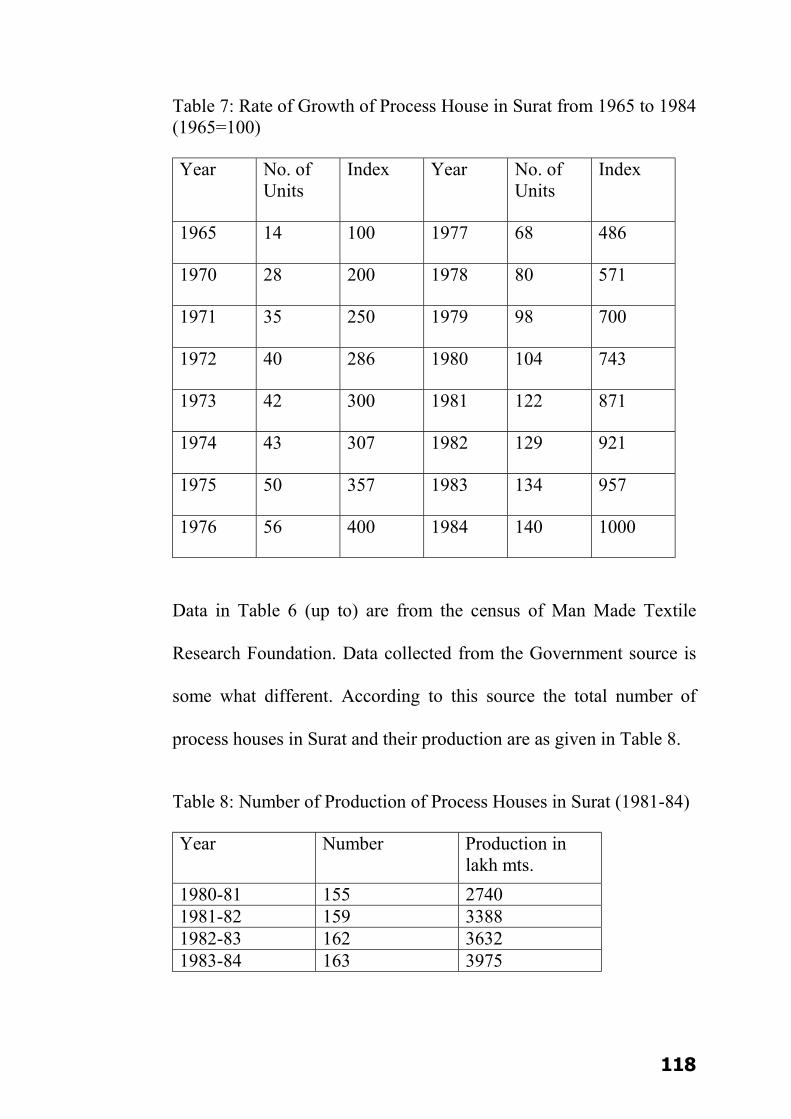
118
Table 7: Rate of Growth of Process House in Surat from 1965 to 1984 (1965=100)
Year No. of Units
Index Year No. of Units
Index
1965 14 100 1977 68 486
1970 28 200 1978 80 571
1971 35 250 1979 98 700
1972 40 286 1980 104 743
1973 42 300 1981 122 871
1974 43 307 1982 129 921
1975 50 357 1983 134 957
1976 56 400 1984 140 1000
Data in Table 6 (up to) are from the census of Man Made Textile
Research Foundation. Data collected from the Government source is
some what different. According to this source the total number of
process houses in Surat and their production are as given in Table 8.
Table 8: Number of Production of Process Houses in Surat (1981-84)
Year Number Production in lakh mts.
1980-81 155 2740 1981-82 159 3388 1982-83 162 3632 1983-84 163 3975

119
Thus out of a daily grey production of 42 lakh mts i.e. annual
production 12,600 lakh mts the reported processing production is
3,975 lakh mts per year that is approximately 32%. There is some
doubt about the reliability of the reported processing production
which do not tally with electrical power consumption or dyes and
chemical consumed.
There is a suspicion that the part of the production processed is not
reported to evade excise duty. In any case a substantial portion of the
grey cloth made in Surat is sent to process houses in Mumbai,
Ahmedabad, Ankleshwar, etc. for processing. [10]
From the statistics it is evident that the rate of growth of process
houses is much more rapid than of power looms. Also most of the
growth has taken place in last 10 to 15 years. From the index of 200
in 1970 it has shot up to 871 in 1981 and to 1000 in 1984 i.e. more
than four folds increase in only 11 years and a five fold increase in 14
years. Since a substantial portion of the cloth woven is in and around
Surat, still it has to be taken elsewhere for processing. It is also
reported that 30 to 40 power looms are being installed in Surat
everyday. It can be safely expected that processing volume in Surat
will continue to grow rapidly both by expansion of existing process
houses as well as by establishing new ones. According to the census
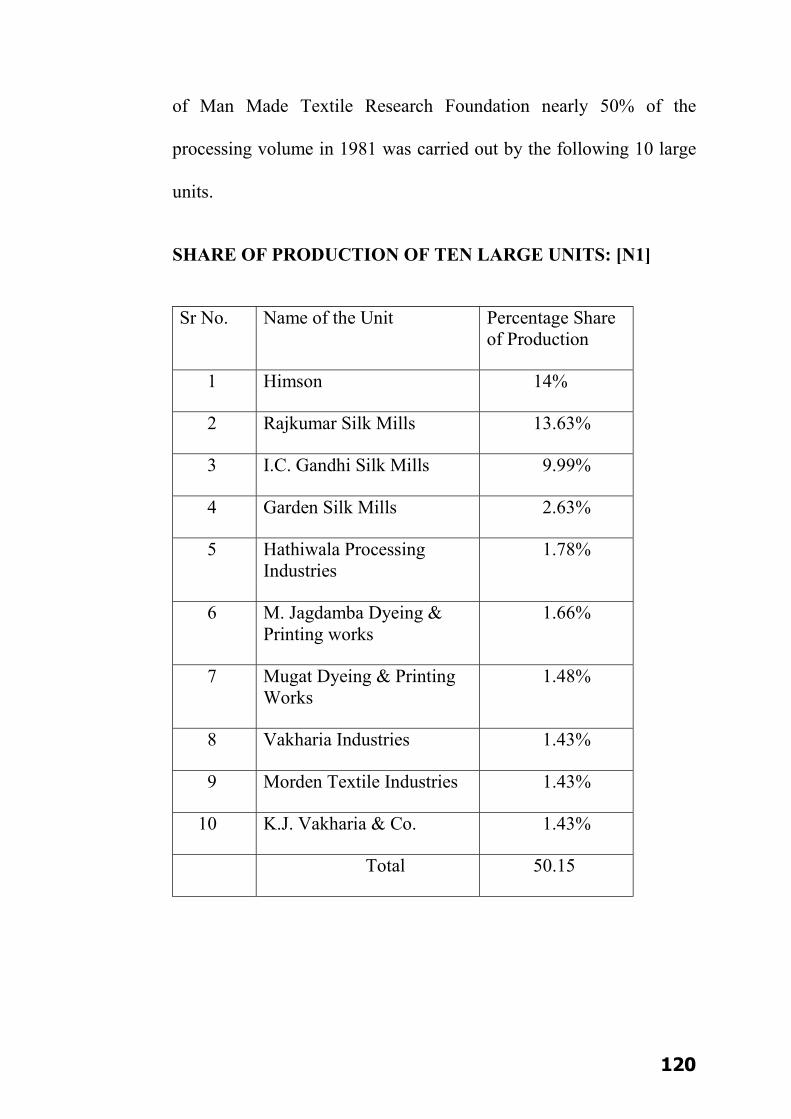
120
of Man Made Textile Research Foundation nearly 50% of the
processing volume in 1981 was carried out by the following 10 large
units.
SHARE OF PRODUCTION OF TEN LARGE UNITS: [N1]
Sr No. Name of the Unit Percentage Share of Production
1 Himson 14%
2 Rajkumar Silk Mills 13.63%
3 I.C. Gandhi Silk Mills 9.99%
4 Garden Silk Mills 2.63%
5 Hathiwala Processing Industries
1.78%
6 M. Jagdamba Dyeing & Printing works
1.66%
7 Mugat Dyeing & Printing Works
1.48%
8 Vakharia Industries 1.43%
9 Morden Textile Industries 1.43%
10 K.J. Vakharia & Co. 1.43%
Total 50.15
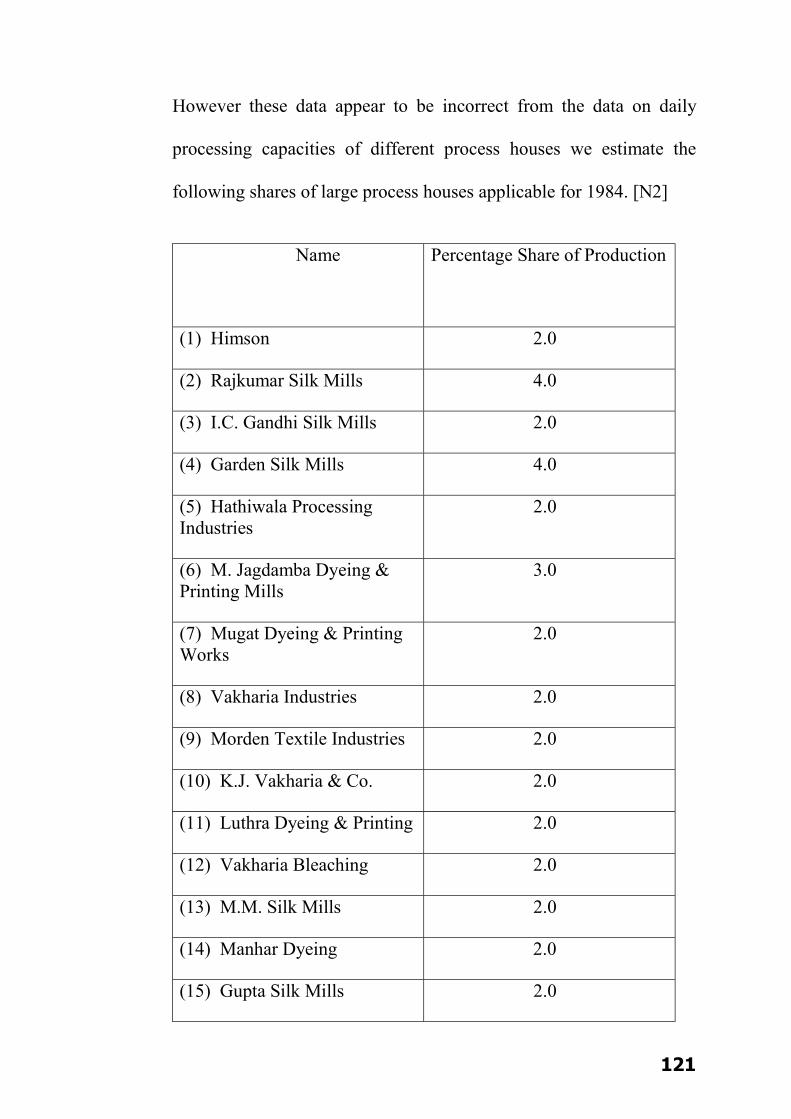
121
However these data appear to be incorrect from the data on daily
processing capacities of different process houses we estimate the
following shares of large process houses applicable for 1984. [N2]
Name Percentage Share of Production
(1) Himson 2.0
(2) Rajkumar Silk Mills 4.0
(3) I.C. Gandhi Silk Mills 2.0
(4) Garden Silk Mills 4.0
(5) Hathiwala Processing Industries
2.0
(6) M. Jagdamba Dyeing & Printing Mills
3.0
(7) Mugat Dyeing & Printing Works
2.0
(8) Vakharia Industries 2.0
(9) Morden Textile Industries 2.0
(10) K.J. Vakharia & Co. 2.0
(11) Luthra Dyeing & Printing 2.0
(12) Vakharia Bleaching 2.0
(13) M.M. Silk Mills 2.0
(14) Manhar Dyeing 2.0
(15) Gupta Silk Mills 2.0
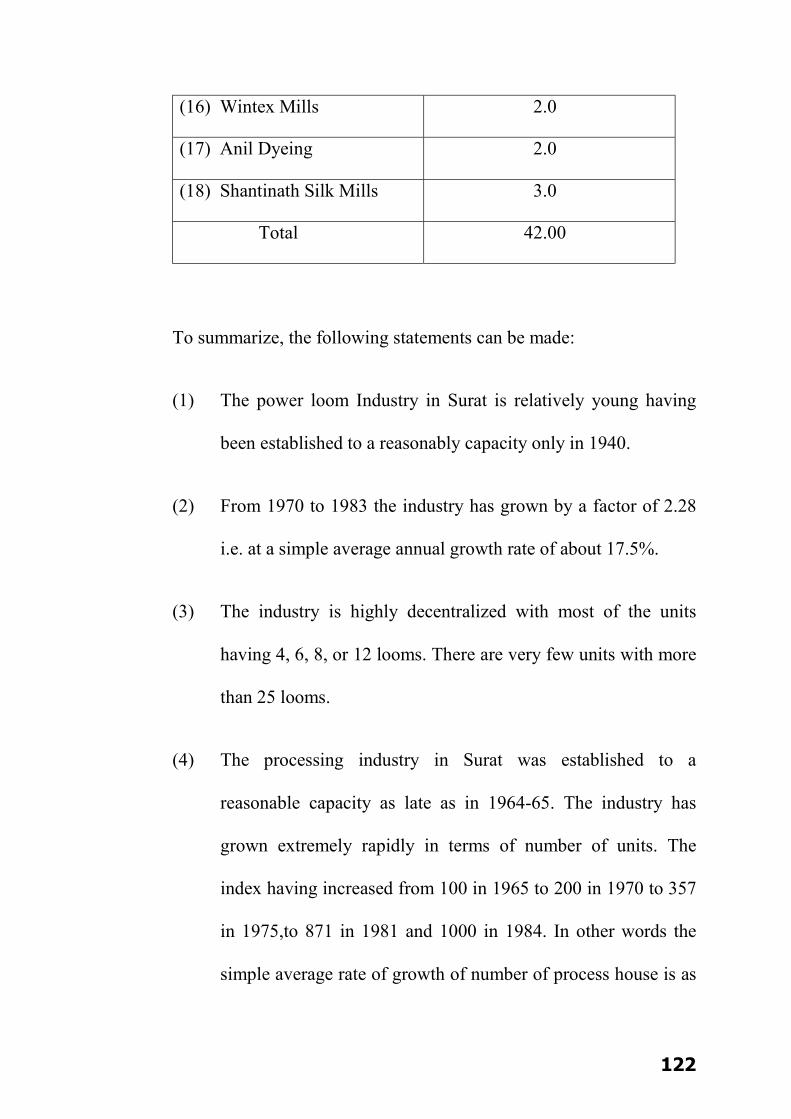
122
(16) Wintex Mills 2.0
(17) Anil Dyeing 2.0
(18) Shantinath Silk Mills 3.0
Total 42.00
To summarize, the following statements can be made:
(1) The power loom Industry in Surat is relatively young having
been established to a reasonably capacity only in 1940.
(2) From 1970 to 1983 the industry has grown by a factor of 2.28
i.e. at a simple average annual growth rate of about 17.5%.
(3) The industry is highly decentralized with most of the units
having 4, 6, 8, or 12 looms. There are very few units with more
than 25 looms.
(4) The processing industry in Surat was established to a
reasonable capacity as late as in 1964-65. The industry has
grown extremely rapidly in terms of number of units. The
index having increased from 100 in 1965 to 200 in 1970 to 357
in 1975,to 871 in 1981 and 1000 in 1984. In other words the
simple average rate of growth of number of process house is as
123
high as 60% per year from 1970 to 1981 and 57% from 1970 to
1984.
(5) Nearly 45% of processing in Surat is done by 20 large process
houses.
(6) Despite of rapid growth in the number of process houses,
substantial proportions (estimated to the tune of 40 to 50%) of
cloth woven in and around Surat has to be processed outside in
cities like Ahmedabad, Mumbai, etc. It would be safe to
assume that the processing industry will continue to grow by
expansion as well as by setting up new units. [N3]
3.4 TECHNOLOGY OF TEXTILE INDUSTRY :
The Man Made Textile Research Foundation (MTRF) conducted a
survey of power looms in and around Surat in 1981. They surveyed
6186 units with a total of 53254 looms. 59% of the units surveyed
were set up after 1971. The average age of the power loom was 12
years and three months.

124
Types of looms were as follows:
Type of Loom Percentages
Plain 46%
Dobby 48%
Jacquard 1%
Ribbon 5%
Source: Man Made Textile Research Foundation.
Reed Space distribution was as follows:
Reed Space Percentage
50” to 60” 69.4%
40” to 50” 14.1%
Less than 40” 7.9%
More than 60” 8.6%
Average reed space was 55”. It can be seen that nearly 3/4th of the
looms have reed space greater than 50” i.e. suitable for 45” width
fabric such as sarees which is the major industry of Surat Industry.
Jacquard looms are reported to be on the increase and may be about
2% of the total loom age today. For 53254 looms other preparatory
machines used were as follows.
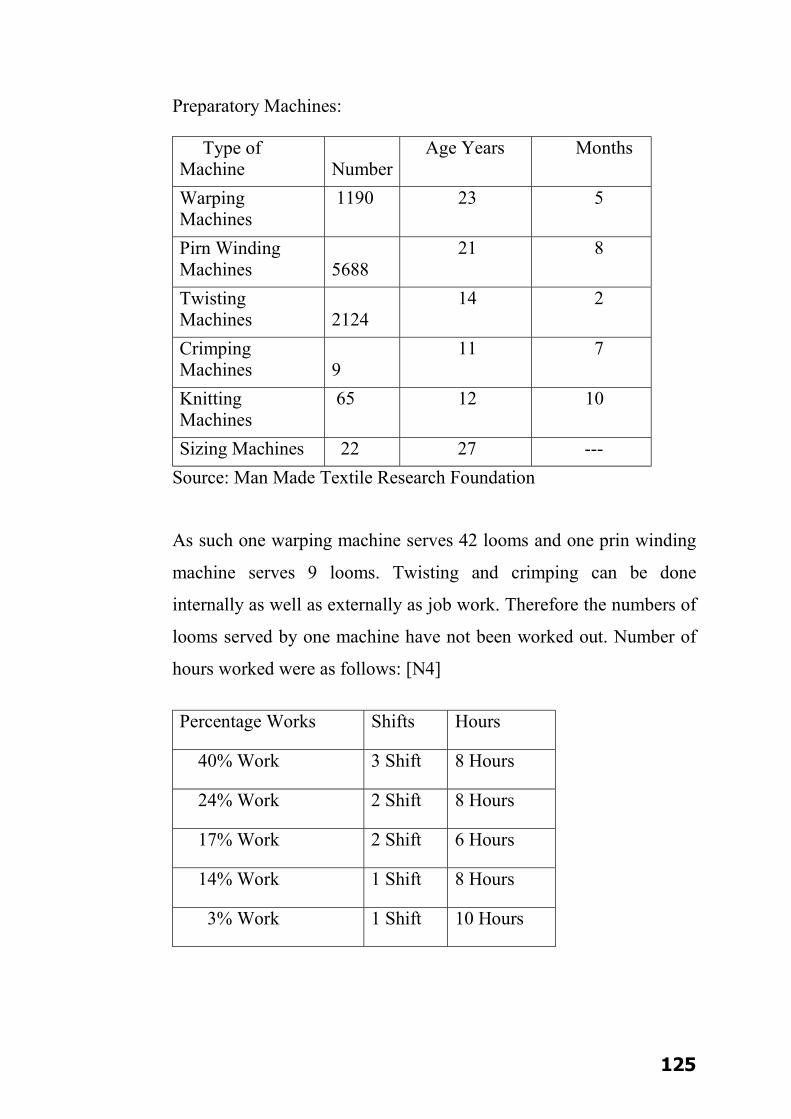
125
Preparatory Machines:
Type of Machine
Number
Age Years Months
Warping Machines
1190 23 5
Pirn Winding Machines
5688
21 8
Twisting Machines
2124
14 2
Crimping Machines
9
11 7
Knitting Machines
65 12 10
Sizing Machines 22 27 --- Source: Man Made Textile Research Foundation
As such one warping machine serves 42 looms and one prin winding
machine serves 9 looms. Twisting and crimping can be done
internally as well as externally as job work. Therefore the numbers of
looms served by one machine have not been worked out. Number of
hours worked were as follows: [N4]
Percentage Works Shifts Hours
40% Work 3 Shift 8 Hours
24% Work 2 Shift 8 Hours
17% Work 2 Shift 6 Hours
14% Work 1 Shift 8 Hours
3% Work 1 Shift 10 Hours

126
Average number of hours worked is 17 hours and 21 minutes i.e.,
capacity utilization is 71.5%. About 50% of these units were set up in
the last 10 years i.e. after 1973 except 3 units which were set up more
than 25 years back, the rest were set up in and after 1950. Thus age
wise these units are quite young i.e. 10 to 25 years old. 26 of the 29
units surveyed worked 24 hours a day, 2 worked 16 hours a day and 1
worked 12 hours a day. For the large unit it is necessary to maximize
capacity utilization to keep overhead in control. It is expected that
smaller units of 4 to 12 looms in many of which the owner and his
family operate the looms may not be working more than 12 hours a
day. However the number of such units is today rather small in Surat
and it is decreasing day by day. Of the units surveyed, none except
one had any automatic looms. They all operated only plain looms.
The solitary exception had Air Jet Looms. The loom speed was
generally 120 to 125 rpm. Though in some units the speed of some
loom was 135 rpm and in one unit even 140 rpm. The looms were
individually driven with motors having generally 0.5 to 0.75 HP and
in two cases one HP only two units had humidification system.
Since power looms almost invariably weave Nylon and Polyester, the
importance of controlling relative humidity is much less than in mills
which weave cotton/viscose. All the units inspected grey cloth

127
produced by them for defects and damages and certain production
was specifically earmarked as suitable for dyeing.
Of the units surveyed only 4 had electronic weft feelers. This means
that wastage of filament weft must be high as much as 1.5 to 2%.
With a weft feeler the weft waste is brought down to 0.5%. This
means minimum savings of 1% waste of filament weft. Average
production per loom per day is 40 mts. Taking 4 kg per 100 mts as the
weight of the fabric the weight of the weft used per loom per day is
about 0.8 kg i.e. worth Rs. 1.60 at least. A saving of 1% means,
saving of Rs 1.6 per loom per day i.e. Rs. 500 per year per loom. An
electronic weft feeler cost Rs 1200. This means the pay back is about
2-2 ½ years, thus this investment is worth considering by the weaving
units. For the weaving industry in Surat it can be said that the
technology employed is conventional and may be obsolete. Almost all
the units use only plain looms even though they produce expensive
synthetic fabrics. It goes to the credit of the workers that even with
plain looms they are able to produce fabrics of acceptable quality.
Loom speeds are low as compared to other countries such as Japan
for similar fabrics using filament yarns both as warp and weft. Even
simple attachments such as electronic weft feelers which have a short
pay back are used by only a few units. Preparatory machines like wise
128
are cheap and conventional type and no attempt has been made to use
high speed semi automatic machine.
For an industry which is young it is surprising that it did not have
taken advantage of modern and sophisticated technology. As we see
many weaving units have been established in the last 10 years and
majority in the last 25 years. Advanced designs of Preparatory looms
are available. The choice of relatively inexpensive, conventional
technology can be due to the following ownership factors.-
(1) Almost all the units are run as proprietary or partnership
concerns in which the capital investment is limited by the
resource available to the entrepreneurs. In a public limited
company on the other hand substantial funds would come from
the investing public.
(2) The average size of the units is small 12 looms to an extent this
is due to the factor mentioned above. Adoption of the
sophisticated technology in such small units may be difficult.
However what is surprising is that even in the larger units with
an annual turnover adopted in weaving is not different from
that in the smaller units.

129
(3) Ownership of weaving units in Surat is in the hands of middle
class, businessmen and a few professionals, who do not have
sufficient finance and their risk taking capacity is limited.
When we look at the process house, the situation is significantly
different. There are four streams of entrepreneurs for process houses.
(1) Family : As a family grows and gets divided the number of
process house owned by them are multiplied. Example
Vakharia and Chevli families.
(2) Big, individual weavers set up their own process houses instead
of getting job work done.
(3) Big traders in textiles followed the same logic and set up
process houses of their own.
(4) Traders in other commodities, rich farmers and Expatriate
Indians considered process houses as an attractive investment
.E.g. Divya Vasundhara Financers (Glamour and Natraj),
Chhaganlal Narottamdas (Mugut Dyeing and Printing),
Ashabhai Patel and C. K. Pithawala expatriate from East Africa
(Aschma Dyeing and Printing). This class has to depend
heavily on Dyers and Printers who therefore dictated their
130
terms. Process houses have also been set up by the cooperative
weaver’s society, however these societies in general have not
performed well and are gradually dying. Of the 113 process
houses surveyed by MTRF in 1981 as many as 85 units were
established after 1971 i.e. bulk of the industry are only 10-12
years old. In ownership pattern 13 of the 113 process houses
were Private Limited Companies and 5 were Public Limited
Companies. The investment in the process house with a
capacity of about 15000 meters per day is about 2 crores today.
Thus only large business houses with ample financial resources
can set up a process house. Also the economics offered by
modern processing machines over conventional ones are far
more attractive than for weaving. For example an HTHP beam
dyeing machine or Jet dyeing machines is more economical in
labour, colour, chemicals and energy than the enclosed Jigger.
Further quality in the finished fabrics is of paramount
importance. This is generally achieved more readily with
modern technology. The dimensional stability and feel which
are obtained with the hot air, heat setting stenter cannot be
matched by any other machines.

131
All these factors have contributed to adoption of relatively more
modern technology in process houses in Surat as compared to the
Weaving units. This can be seen from the census of machinery (in
1981) in process houses conducted by MTRF are as under.
Old Machines
Types of Machines No. of Machines
(1) Dyeing:
Jiggers 708
H.P. Jiggers 41
HTHP Beam Dyeing
59
Jet Dyeing 5
Pad Mangles 93
Winches 137
Kiers/Vats 30
Beek Dyeing 4
(2) Printing:
Tables 869
Semi Auto Screen Printing
121
Auto Screen Printing
17

132
Rotary Printing 5
Transfer Printing
1
Flock Printing 1
Steam Ager 118
Universal Steamer
40
Loop Steamer 8
(3) Finishing:
Calendars 40
Felt Calendars 34
Stenters 142
Polymerizers 14
Boilers 73
Decatizing M/C 1
Embossing M/C 4
(4) Other Equipment:
Vertical Cylinder Range
64
Horizontal Cylinder Range
20
Open Width Washing Machine
11
Rope Washing Machine
16
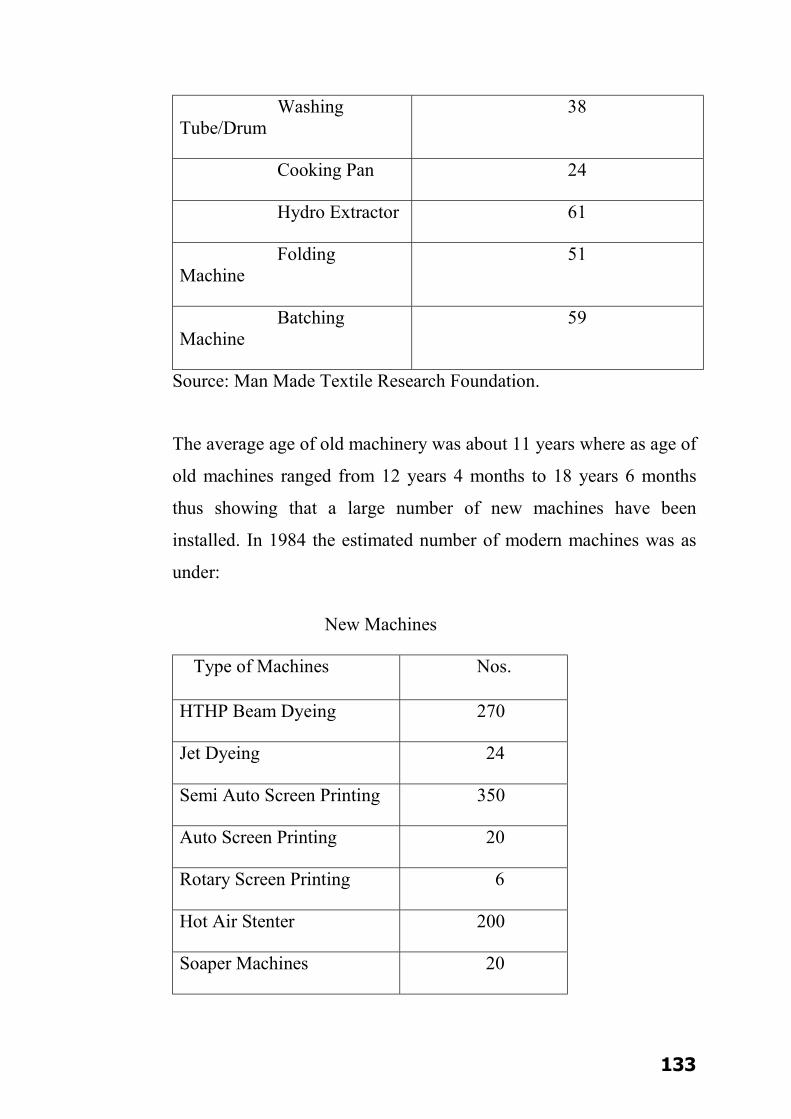
133
Washing Tube/Drum
38
Cooking Pan 24
Hydro Extractor 61
Folding Machine
51
Batching Machine
59
Source: Man Made Textile Research Foundation.
The average age of old machinery was about 11 years where as age of
old machines ranged from 12 years 4 months to 18 years 6 months
thus showing that a large number of new machines have been
installed. In 1984 the estimated number of modern machines was as
under:
New Machines
Type of Machines Nos.
HTHP Beam Dyeing 270
Jet Dyeing 24
Semi Auto Screen Printing 350
Auto Screen Printing 20
Rotary Screen Printing 6
Hot Air Stenter 200
Soaper Machines 20

134
Two points are evident from this data:
The processing industry is equipped with relatively more modern
machinery.
The pace of introduction of modern machinery is also quite fast. This
is due to increase of polyester varieties. Moreover the process houses
have also started processing dress material in large quantities along
with the sarees.
The Surat processing industry handles approximately 400 million
meters per year out of approximately 1260 million meters grey
production in Surat. Bulk of the production is sarees, dress materials,
dupatta, etc. About a decade back a process house used to have a
capacity of 7000 to 8000 meters per day for economic viability. At
that time most process house printed fabrics manually on tables
having surface coated with wax or covered with resin or back grey.
Today with the increase in labour and fuel cost a process house
should have a capacity of producing 12000 mts per day to make the
unit viable. Automation is required in certain labour intensive
processes. Many process houses have invested in machines such as
Jumbo Jiggers beam and Jet Dyeing machine. Semi and fully
automatic flat bed screen printing machine, Jumbo agers and even

135
rotary screen printing machines. All this has made the process house
capable to dye any quality of fabric and print any style. Management
has also lately been investing in economic boiler of install
economizers an old Lancashire Boilers. Some have even adopted
waste heat recovery system. Condensate collection and reuse is
practical by some process houses as also softening of boiler feed
water. Efforts are being made to reduce cost of dyeing by lowering
M: 1 ratio by ordering smaller size beam dyeing machine for 45”
sarees or 36” dress materials or by introducing dummy to fill the void
spaces and reduce liquor ratio.
The diameters of the perforated beams have also been reduced to
enable bigger batch sizes. To increase the productivity on beam and
Jet dyeing machines, some units have adopted an auxiliary tank for
storing hot water and feed hot water to the machines to reduce dyeing
time per batch. Since last two to three years conversion of beam
dyeing machine patented by the local engineers is also getting
popular. This conversion enables circulation in a closed system by
attaching a small closed tank with provision to introduce compressed
air to maintain pressure.
Nearly 78% of the beams dyeing machines in Surat have been
converted according to this design. There is an estimated 20% saving
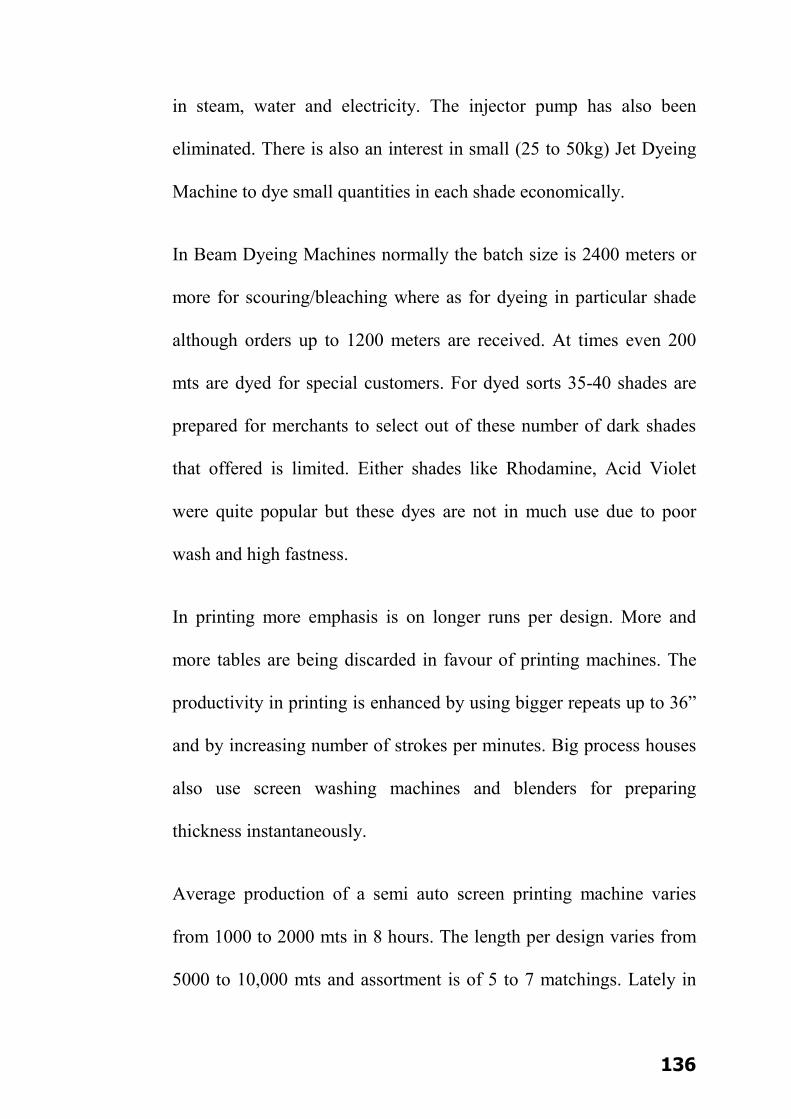
136
in steam, water and electricity. The injector pump has also been
eliminated. There is also an interest in small (25 to 50kg) Jet Dyeing
Machine to dye small quantities in each shade economically.
In Beam Dyeing Machines normally the batch size is 2400 meters or
more for scouring/bleaching where as for dyeing in particular shade
although orders up to 1200 meters are received. At times even 200
mts are dyed for special customers. For dyed sorts 35-40 shades are
prepared for merchants to select out of these number of dark shades
that offered is limited. Either shades like Rhodamine, Acid Violet
were quite popular but these dyes are not in much use due to poor
wash and high fastness.
In printing more emphasis is on longer runs per design. More and
more tables are being discarded in favour of printing machines. The
productivity in printing is enhanced by using bigger repeats up to 36”
and by increasing number of strokes per minutes. Big process houses
also use screen washing machines and blenders for preparing
thickness instantaneously.
Average production of a semi auto screen printing machine varies
from 1000 to 2000 mts in 8 hours. The length per design varies from
5000 to 10,000 mts and assortment is of 5 to 7 matchings. Lately in
137
Surat Discharge Printing in nylon and polyester is widely practiced. It
is estimated that in around 40 process houses, fabrics are pointed in
Discharge Style and that white as well as colour effects are printed
side by side while effects will be 25% whereas coloured effects will
be 75%. For nylon discharge prints local manufacturers of dye stuff
have come with a complete range of dischargeable dyestuff which are
selected from Direct Acid and Disperse Groups of dyes.
Mostly Rangolite, Decrolein/ Saffolin or Stannous Chloride is used as
discharging agents and grand shades are dyed either at temperature
below normal or pad/dried or blotch printed. The consumptions of
reducing agents for these styles are estimated at around 10-15 tonnes
per month valued at Rs 12-16 lakhs. Besides availability of locally
manufactured dyestuffs and Guar Gum, derivatives as printing
thickeners at very competitive rate with credit facilities has enabled
process houses to control the job work rates dyeing and printing.
Some of the process houses even manufacture their own dye stuff and
Gaur Gum derivative for captive consumption to further reduce the
cost of production.
In unit with only one stenter, maximum production of 15000 mts per
day can be achieved including heat setting, dyeing and finishing. In
units with more than one stenter, higher production is aimed at.
138
Stenter used in Surat process houses are either old two chamber
converted Wakayama type or Pin/clip up to date Artos/Maneklal and
Famatex type of 3 to 5 chambers. Electrical heating on stenter is not
uncommon although the trend is to do away with electrical heating
and replacing it by thermic fluid. Even today about 50 Wakayama
stenter are in use at these process houses and 28 of them have only
Wakayama stenters.
Maintenance of the stenters is often neglected. Proper high
temperature resistant lubricating greases and oils on rails are not used
nor is enough care taken to keep exhaust clean or to operate dampers
effectively to maintain optimum level in the hot air. Many units have
adopted electronic accessories such as edge feelers over feed
indicators and weft set to correct bow and skew to improve the
quality of production. After finishing on stenter the fabric is dried at
150 to 170 Centigrade to get better dimensional stability especially
width control, resin finishing is done for nylon fabric to give body
and dry feel to look like polyester. Even cheaper urea formaldehyde
resin was used for this purpose but due to its adverse effect on high
fastness of dyes, now DMDHEU resin is more common. Use of
silicones in finishing is also very popular. Most of these process
houses have more than one boiler and indirect oil heating systems are
139
increasing in demand. In Surat 108 Lancashire boilers, 32 Marine
boilers, 24 Package boilers and 65 Indirect Oil heating system are in
operation. All except one Package boiler is coal fired only one is oil
fired. As fuel coal, lignite and even fire wood is used. The cost of fuel
per meter of cloth processed has been found to vary in one survey of
process houses from minimum of 25 NP/meters to a maximum of 75
NP/meters. On an average a process house every month consumes
over Rs 1,20,000 worth of fuel. [11]
3.5 Infrastructure in the region :
Proper infrastructure facility should be there to develop the industry,
trade and commerce. Infrastructure includes transportation, power and
telecommunication. As far as Textile Industry is concerned the
infrastructure may include Transportation, Power
Telecommunication, Land, Water, etc. Textile Industry requires basic
necessity for the various operation of business.
Infrastructure is required to carry out business effectively, right from
idea generation, site selection, location of the plant, distance from the
market, availability of the customer, availability of transport of raw
materials and to ship the finished goods to the market places. Factors
like rail road and air transport should be available, besides the units

140
also require water, land power, communication channel, availability
of labour along with warehousing facility.
Textile business operates in separate units like spinning, weaving,
dyeing and printing. All the units are inter-related and the output of
one is the input of another. Besides land for the construction of the
building, power labour and transportation are the most important
factor for all the other activities while water is important for dyeing
and printing units. Imbalance in any one factor may lead to increase
in cost of production.
Surat District at a Glance :
(1) Area 7657 sq km. (2) Population growth rate 3.6%. (3) Average rainfall 1000 mm to 1200 mm. (4) Average temperature 10 C to 45 C. (5) Number of talukas 14. (6) District main place Surat City. (7) Municipal Corporation 1 (Surat). (8) Nagar Palikas 2 (Bardoli Vyara). (9) Municipal Burea 1 Songadh. (10) Total Villages 1185. (11) Literacy rate 6436. (12) Bank Facilities 356. (13) Villages Electrified 100%.

141
Industrial Talukas:
Bardoli, Chorasiya, Mandvi, Mangrol, Olpad, Palsana
Industrial Sector
Sr.No. Category Total No. of Units
Investment in crores
Employment No. of Person
1 Small scale industry
36,680
1,078 1,76,583
2 Medium and large scale units already established
471
18,860
90,500
3 Medium and large scale units (under construction)
180
823
14,280
Source: District Industrial Center Surat.
Main Industries of Surat District
Sr.No. Industry No of Units
Employment (No of Persons)
1 Jari Industry 6,500 45,000
2 Power loom Industry
24,670 300,000
3 Texturising Industry
500 5,000
4 Process House 381 1,00,000
5 Diamond Industry 10,000 6,00,000
Source: District Industrial Center Surat.
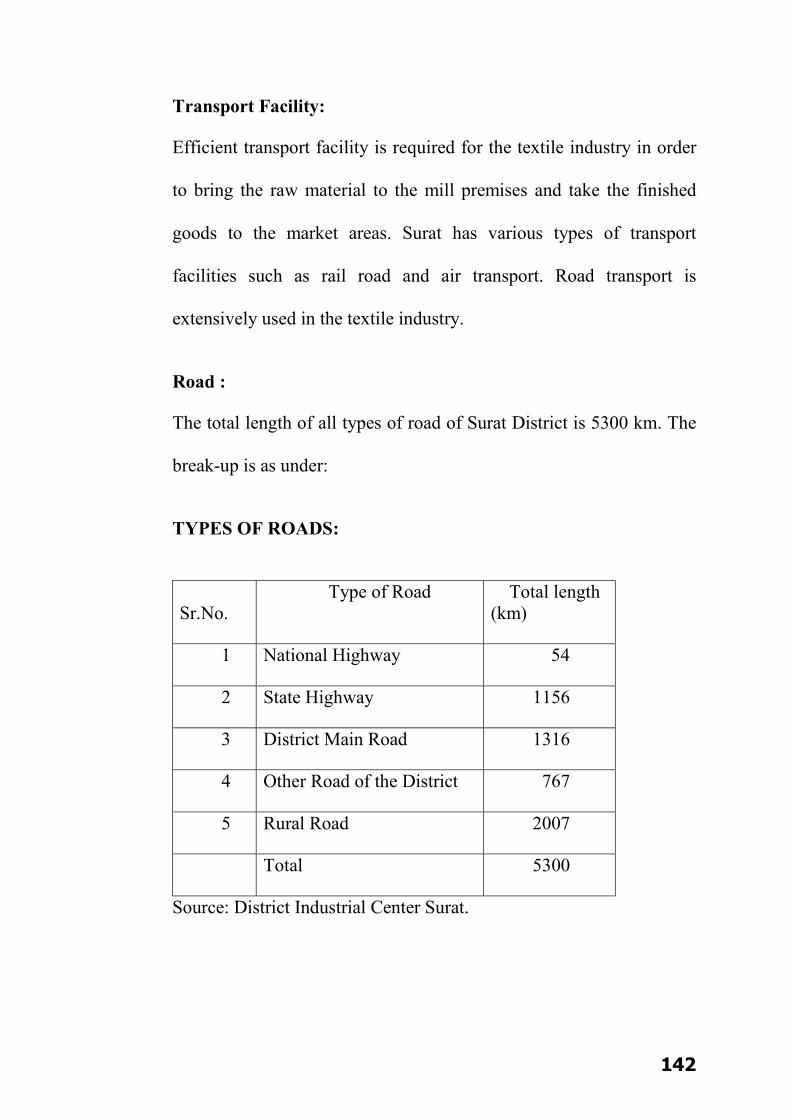
142
Transport Facility:
Efficient transport facility is required for the textile industry in order
to bring the raw material to the mill premises and take the finished
goods to the market areas. Surat has various types of transport
facilities such as rail road and air transport. Road transport is
extensively used in the textile industry.
Road :
The total length of all types of road of Surat District is 5300 km. The
break-up is as under:
TYPES OF ROADS:
Sr.No.
Type of Road Total length (km)
1 National Highway 54
2 State Highway 1156
3 District Main Road 1316
4 Other Road of the District 767
5 Rural Road 2007
Total 5300
Source: District Industrial Center Surat.

143
Out of 1185 villages 904 villages have the direct state transport
facilities. There are many efficient transport company in an around
Surat to transport the finished products to the different parts of the
country.
RAILWAY:
The district has 147 km broad guage and 59 km of narrow guage rail
line.
Railway Lines:
Sr.No. Taluka Broad Guage Rail (km)
Station
1 Choriyasi 36 Kosad, Utran, Udhna, Bhestan, Sachin.
2 Olpad 20 Kim, Safedpura, Sayan, Gothan.
3 Kamrej --- --- 4 Mangrol 15 Hathran, Kosamba. 5 Mandvi --- --- 6 Songhad 15 Doswada, Fort
Songhad, Kakui. 7 Ucchchal 12 Bhadhuja 8 Nizar --- --- 9 Vyara 10 Vyara, Lotarva,
Mangrol and Madhi. 10 Bardoli 15 Bardoli, Timba 11 Valod 5 Kaha 12 Mahuva --- --- 13 Palsana 19 Noil, Chalthan,
Gangadhara

144
Airways:
Surat has an airport The total length of the air strip is 4300 feet.
Presently it is only suitable for 8 to 10 sector small aircraft. This air
port is being made big for developing it as an International Airport.
Port Surat is also connected with sea route. Port Magdalla has
having a Jetty and Cater for the loading and unloading of cargo for
Reliance, Essar, LET, etc.
Water :
Textile industry requires huge quantity of water. The Ukai Dam and
Kakrapar Dam have enough water to cater to the needs of the
different industries and for domestic purpose.
Electricity:
Gujarat Electricity Board provides electricity to all villages and Surat
city. Following is the list of substation of G.E.B working in the Surat
District.

145
G.E.B. Substation:
Sr.No. Name of Substation
Taluka Capacity
1 220/66 kv Vav Kamrej 350
2 220/66 kv Icchapore
Choryasi 100
3 220/66 kv Limbayat
Mangrol 150
4 132/66 kv Bhestan Choryasi 190
5 66/ kv Utran Choryasi 28
6 66/ kv Tapi Choryasi 45
7 66/ kv Kadodra Palsana 30
8 66/ kv Olpad Olpad 20
9 66/ kv Palod-Kim Mangrol 45
10 66/ Kamrej Kamrej 20
11 66 kv Udhna Choryasi 60
12 66 kv Sachin A Choryasi 50
13 66 kv Pandesara Choryasi 45
14 66 kv Sachin B Choryasi 30
15 66 kv Pipodra Mangrol 30
16 66 kv Gunsada Songhad 11
17 66 kv Vyara Vyara 35
18 66 kv Bardoli Bardoli 35

146
19 66 kv Valod Valod 35
20 66 kv Dolvan Vyara 10
21 66 kv Mahuva Mahuva 10
22 66 kv Mandvi Mandvi 20
23 66 kv Nizar Nizar 15
24 66 kv Ucchchal Ucchchal 10
25 66 kv Ukai Songhad 11
26 66 kv Godagra Choryasi 15
27 66 kv Icchapore Choryasi 20
28 66 kv Variyav Choryasi 10
29 66 kv Bhestan Choryasi 75
Source: G.E.B Surat.
Good net work of road rail port and availability of labour at cheap
rate are some of the plus points for the Textile industry. At the same
time there are some demerits such as deficit power supply, power
rationing, high power tariff which goes against the industry.
Glimpse of the city of Surat :
Surat is one of the oldest cities of India. History says it is rebuilt
somewhere in the 11th century but its origin is quite old. In
Skandapurna this city is referred by various names like Suryapur,
Brahmpur, Tapipur, Brahmaranya, etc. This city has experienced
147
number of ups and down. Once it was one of the biggest ports of the
world. However the actual place of the port was at Sumali, a village
near the city. In the old books of Jainas this city is referred as
Suryapur.
Surat was under the rule of Rajput king of kamrej. Shivaji maharaja
invaded Surat several times and took away plenty of wealth. Due to
its international reputation for business and wealth the entire Emperor
from Taghlak to Moguls were interested in Surat. Lastly Portuguese,
French and Britishers all started their business companies at and from
Surat. Today there exists some monuments in one form or another in
the city.
The city at that time also had business of cotton textile, silk, and wool
fabrics. They were exported to Jawa, Sumatra, Rome, Mecca, Japan
and many other countries. On 15th of May, 1800 Britishers took over
the change of the city and they left in 1947 when India became
independent. [12]
Art Silk Weaving Industry of Surat :
Surat is the biggest centre of Art Silk Weaving Industry in India
where more than one and half lakh Art Silk power looms are
functioning which accounts for more than 60% of the total art Silk
148
Power loom of the country. This industry has played a phenomenal
role in the cause of industrial development for the nation and it is
beyond doubt that self accomplished progress of the industry has
attracted the attention of ever changing world to this decentralized
industry in Surat.
The existence of the industry in Surat dates back to 1925. During the
Mughal rule on account of perfect trade policy the khinkhab weavers
of Surat were artisan themselves producing intricate designs on hand
loom with silk and jari. At that time a large number of handlooms
were functioning at this centre and raw silk as well as jari threads
were the main raw materials for manufacture of textile. Gradually
with the invention of electricity, young entrepreneurs engaged in this
industry installed the power looms discarded by the cotton mills,
commenced production after certain modification so as to make them
suitable for manufacturing pure silk fabrics and with this change over
the production increased rapidly the quality improved significantly,
physical labour and strains were reduced to some extent and
ultimately resulted in higher earnings for the power loom weavers.
In fact the industry’s structure resembles that of the cottage industry
system prevalent in Japan. It is a domestic industry where there are
15000 units and the members of the family usually maintained
149
themselves by working on an average 9 power looms each. They
hardly employ any other staff thus the power looms were more or less
being dispersed into small decentralized units. Between the years
1955-57 with the advent of protection offered to this industry by way
of heavy duty on import of Art Silk Fabrics, the power loom industry
gradually grew into a small nucleus with total installed capacity of
12000 power looms in Surat and by the time second world war broke
out the industry was yet in its infant stage though development of this
industry advanced slowly and steadily till 1944. The industry in Surat
has achieved spectacular progress during a short span of two decades
on account of impetus received by it due to the above factors and
today it has gained an important place not only nationwide but has
earned a world wide reputation.
In the significant growth of the power loom in the last 55 years, there
are about 10 families of Surat who have played a leading role. In
respect to this we shall mention few facts about some of these
families who have contributed to the growth of the industry. The
industry is highly decentralized, the modal value being 12 to 16
power loom per unit. Most of these small factories are first generation
and so are some of the larger units. However majority of the larger
units today are of second generation. Some of the families which
150
contributed significantly in the growth of power looms in Surat are
Bachkaniwala, Hathiwala, Vakharia, Dhamanwala, Mahatma,
Dr.Amichand Shah, Chevli and Lekhadia.
Mr. Hiralal Mancharam Bachkaniwala from whom the name Himson
was adopted in 1949 had a few handlooms in late 1920’s. He also had
a shop (Pedhi) in Kolkata, specializing in sarees for young girls. The
shop went into liquidation forcing Hiralal to take up a senior job with
Vakharia’s. In 1938-39, Hiralal acquired the 1st 4 power looms. By
1946-47 this number had increased to 12 looms and by 1950 to 80
looms.
Today Himson has 400 looms, two process houses, engineering
works and a filament twisting and texturising unit. It processes about
28000 meters per day of nylon and polyesters filament cloth and
process about 50000 meters per day. It also makes texturising
machines in collaboration with Seragg and has also developed its own
design of Air texturising machines. In addition to 400 looms Himson
has 22 Warp knitting and Raschel Machines. Himson was the 1st
(with Paragon Mumbai) to use nylon filament yarn in Surat. Hiralal
Bachkaniwala was also a Leader in starting cooperative power loom
weaving of Surat and was instrumental in starting Surat weavers’
producers’ cooperative society and Surat Vankar Sangh. One of
151
Hiralal’s son, Surajrama (popularly known as Bachkaniwala) went to
V.J.T.I and was selected in 1954-55 to go to Leeds under the United
Nations Technical Assistance Programme. Bachubhai’s two sons and
nephew are qualified technologists/Engineers with brilliant academic
careers and have obtained post graduate degree from U.K. and U.S.A.
The Mahatma is another pioneer who came into the textile business in
1920’s with hand looms. They specialized in a fabric called Aikoys,
which is the national Attire for Ugandan Women. This was a 2/40’s x
20’s viscose staple fabric of 27” width sold in 2 or 3 yard length and
54” width by sewing together two pieces. A lot of finish work had to
be done after the fabric was woven. Mr. Pranjivandas Mahatma went
to Uganda and Kenya and established the business in Nairobi. Most
of the weaving of the fabric was done on a contract basis through
outside weavers as they had only 20 looms. The Mahatma family
latter, set up their shop of outlet for the lungis. By the year 1954 the
handlooms were replaced by 20 power looms on which they made
spun viscose and cotton fabrics. In the year 1972 the family won
National Export award for export to Kenya, Uganda, Tanzania and
Oman. Today Pranjivandas family has 100 power looms and also
owes an industrial estate at Khatodra. As the family has been divided
they no longer occupy premier position.
152
The Hathiwala family is another industrial house which has an early
history of power loom industry. They set up their business in 1920
with Hattersley Pedal operated looms to weave pure Silk Pitamber
with pure jari borders which had market in Surat, Karnataka and
South India. Thereafter in 1925 the Hathiwala family acquired 20
power looms on which they specialized in weaving Bosky Shirting.
The Hathiwala used to get the job done from Bachkaniwala and
Chevli family.
By 1940 they had 200 power looms and in 1950 they had set up one
of the earliest process houses in Surat. The machinery of the process
house was imported from Wakayama iron works, Japan through Mr.
Nagindas Kharwar. In 1960 Jayantilal Hathiwala went to Japan as a
guest of Asahi Rayon and saw single end sizing there and the same
machine was imported in India in 1963 for making it possible to
weave single yarn fabric. At present they have Cimmco looms with
electrical weft stop motion. As per Mr. Jayantilal Hathiwala they have
lost their premier position as they did not keep abreast with modern
technology.
Mr.Vrajlal Damanwala is another family who were the pioneer in the
textile business. The family owns 2 units winter mills and
Damanwala silk mills. Vrajlal’s grandfather started handlooms and
153
his father to work with pedalooms. They used to produce pure silk
“Khand” to be sold in Maharashtra and Indore. This family installed
the 1st power loom in 1930 on which they used to weave China cord
from 1935 to 1941. They mainly imported Japanese viscose. This
supply stopped due to the Second World War and they had to switch
over to cotton. They were also the first to start to introduce cotton
hank dyeing in Surat in 1941 to 1942 which lasted till 1945 with a
daily production of 1000 pounds approximately. During this period
their main production was 2/30 (30’s cotton yarn and viscose filament
double) shirting. They also used to double 30’s waste yarn (bottom) at
home since this was a difficult task they started using quality weft.
This item was very profitable for Damanwala and so from 25 looms
in 1948 the family acquired 80 looms in 1949, 160 looms in 1950 and
at present they have 300 looms in two Wintex Mills.
Mr. Jyotindra Lekhadia’s family who was a late comer in Surat power
loom scene started with 24 Japanese loom in1954 and this was
gradually increased to 100 looms in 1959. They also used to imported
requisite preparatory machinery. At that time they specialized in
viscose/ viscose georgette which were sold in grey state in the state of
Mumbai, where it was processed & sold in the wider markets of the
country. They started their own process house in 1963 & thereafter

154
started their own finished production. They introduced Nylon in 1965
& 1978. They started production of polyesters. They started to crimp
in 1973-74.
More than 75% of their production is polyester, 50% being sarees and
50% dress material with little of shirting. Printing was started by then
around 1975-76. Mr. Ranchodlal Popawala the grand old man of
Surat was an entrepreneur. He contributed significantly to the power
loom industry of Surat. According to him the present growth in the
number of power loom is illusory since it is concentrated at Surat
alone. At the national level this growth is not significant. He also
emphasis the industry modernize its marketing and management.
Traders from outside have exploited the manufacturers and have
themselves earned huge profits. He also stresses that the industry
must diversify if they have to compete with the new global market.
The name of Vakharia’s is also prominent amongst the pioneers in the
Surat textile industry. The Vakharia Brothers, Jayantibhai and
Jaikishandas started with weaving units. Mr. Jaikishandas L Vakharia
was amongst the 1st to set up process house in Surat. The machinery
was purchased from Wakayama Iron Works, Japan through Mr.
Nagindas Kharwar who negotiated machinery for total 3 process
houses the other two being Hathiwala and Surat weavers cooperative
155
society. This family later set up another process house in the name of
standard mills. Gradually Vakharia’s started focusing more in the
activity of processing. Today the family owes six process houses each
of this unit is equipped with up to date, modern machines such as
automatic screen printing machine, H.T.H.P., Beam dyeing and Jet
dyeing machine to enable them to process 100% synthetic fabric as
well as blended fabrics. These process houses approximately produce
100000 mts per day.
Garden silk Mills started in 1930’s by Amichand Shah, was the
largest weaving and processing unit in Surat for Man Made Textile.
Most of the growth of garden silk mills has taken place in the second
generation. This group is very strong in marketing and today it is a
common household name all over India. They have 700 looms of
their own in addition they also get the job work done from outside
portion. They have a processing capacity of approximately 80000 mts
per day.
The Chevli family is another pioneer of the industry. Late Mr.
Manibhai Chevli took his L.T.M. from V.J.T.I. Mumbai in 1934-35.
He worked in Surat Cotton Mills for 7 years and thereafter joined
their own weaving unit. Their Pedi was known as Dayabhai Gopaldas
Pedi. Besides this pioneer family there are quite a few “Pedhis”
156
whose third generation is now achieve in the textile field amongst
there Kashiram Jivanram Lekhadia and Navnitlal Dayaram Jariwala.
They actively started jari industry but later on switched over to
textiles. As such electricity was introduced in Surat between 1925 and
1930. However there were a few power looms operating as early as
1920. One of the features from this chronicle of history of families is
that each of these families specialized in a single product which was
made by that family alone. When the preference and demand
changed, they switched over to another product. This product
standardization and specialization have paid rich dividends in getting
insight into the technological requirements and perfecting the skills
necessary to produce the selected fabrics of the best quality and at
lowest cost. [13]
THE NATURE OF PRODUCTION WORK OF THE POWER LOOMS :
The power looms units consist of only the power looms while the
preparatory processes are executed elsewhere. The principle raw
material for this of this industry is yarn of various types such as
nylon, terrene, etc. This is a synthetic or artificial fiber. The unit
purchases the yarn Corp from the market. The yarn corps is sold by
local agents and come under various brand names like Reliance,
Gujarat filaments, Nirlon Modipone, Garware, etc. The yarn counts
157
(15 number, 20 number, 40 number, etc.). If the yarn needs twisting
then the yarn corps is placed on a winding machine. Winding
operation is automatic which are run on electric power machines. But
the personal supervision is required over this machine to check on any
failure or defects. The person who looks after the process is called the
winder.
The winders are male workers without any formal technical training.
They learn the job by experience. The winding operation requires
keen eye sight and some finger dexterity. From the winding machines
the yarn strings are filled on the cones in a twisting machine. Again
the twisted yarn is brought back on the winding machine. These
winding machines are different and each has each a capacity of 64
Firkas. As winding operation is more complex one, a person is
required whole time to attend to one machine. The completed spools
from the winding machines are then taken to the warping machines.
These machines help the yarn to acquire proper sizing. A measuring
clock is attached to this machine and with the help of the clock; it is
possible to determine the before
hand the size of warped yarn that is Meter age. One person attends the
warping process the warper oversees this process of creeling and
warping. He has to be vigilant about thread breakages and other
158
defects that might creep in. From the creel the thread pass through
comb (fani) and jack comb. This is called as combing operations. The
warped and combed spools are later woven round the beams. These
beams are then brought to the looms for weaving operations. These
beams are then fixed on the looms. The loom worker or weaver then
weaves the cloth with the help of bobbins, already filled by the
bobbin workers.
Weaving job is done by the weaver and each weaver looks after 4 to
12 looms. In some factory units with semi automatic or automatic
machinery the number of looms per worker are higher. The weaver’s
work is monotonous. He has to be watchful so that there is no thread
breakages or unevenness in the weaving. As soon as he notices any
defect, he has to stop the machine, join the thread or attend to the
defects and restart the looms. The woven cloth is automatically
measured so that he can ascertain the total cloth output to his credit.
Cloth prepared on the loom is then brought to the check board. Check
board is made of wood or glass fitted with tube light. The worker
checks board whether cloth material has any loose ends or minor
defects. He also uses brush to bring evenness of the cloth material.
One worker can check about 500 mts of cloth in 8 hours shift. The
cloth material which has under gone final checking and inspection is
159
then folded. The supervisor marks the name of the weaver who has
completed this work and also the checker who has checked it. The
folded material is then weighed on the weighing machine and kept
ready for dispatch or sale. The commission agent comes to the factory
for personal checking of the final product including the weight. The
power looms used in these factories are capable of utilizing any type
of yarn. The looms are available in Surat market and internal
modifications are made by the artisan or karigar to make the looms
worthy of taking any job work. The spare parts are also available in
Surat City.
Maintenance and repairs are carried out by the senior weavers as
master machines. In large factories there are categories of personal,
accountants, clerks, peons, etc. They attend to the clerical work. The
ratio of supervisor to worker is normally 1:20. The flow chart no1
gives an idea of work process in a nut shell.
THE STEPS OF OPERATION OF PROCESS HOUSE :
Processing units undertake two major jobs, namely dyeing and
printing. The first operation in these units is the weighing of the grey
cloth material by the clerk or supervisor of the processing unit. The
weighed cloth is then taken to check board and minutely inspected to
ensure that there is no major defect. The checked cloth is then put in
160
the Stenter Machine when it is stretched along side this process, the
cloth material also passes through steam chamber. This helps to
strengthen the fiber and increase the durability of the material. More
importantly this process allows the cloth later to receive colour more
evenly. Its capacity to absorb the dyes evenly increases due to this
process. After the process of stentering the cloth material is taken to
the bleaching process. The bleaching is carried out with the help of
washing machine. Soap, chemical powders, detergents, etc. are used
as cleaning agents in the bleaching process. This process removes any
stains on the cloth. The cloth is then dried in the sun or artificially
with dryer fitted machines. The bleaching cloth is then ready for
dyeing.
The dyeing process requires colour chemical including acids. Each
cloth material requires special colour chemicals and their
combinations. For instance the nylon grey cloth needs the acidic
colours while the polyester grey cloth requires disperse colour. The
cotton cloth also requires separate mixing of the colours including the
use of salt. These decisions are taken by the dyeing master who is the
most experienced worker, sometimes with formal training
background. Even ordinary workers learn the technicalities in this
process after 2-3 years of work in dyeing sections. The dyed cloth is

161
then washed in cold water. After dyeing if the cloth appears to be
loose and creasy again this cloth material is put on the Stenter
machine and Starch is used to make the cloth stiff. This process is
known as finishing process as the steam is used at various stages in
the dyeing and finishing process. Besides it requires a cautious and
expert judgment to determine the level or degree of steam treatment.
A slight mistake on the part of the workers giving steam treatment
might damage the cloth. Since the cloth material is expensive the
owner of the units takes utmost care to appoint an experiment and
trained person of this supervisory task. After dyeing and finishing
works the cloth material is placed on printing tables for printing work.
The printing tables are usually very long admeasuring over 30 meters
in length and 2 meters in width. The printing worker is also
experienced persons without much formal training.
The printers use the design paper called Kodak paper. The design
section is manned by the artists who prepare several designs with the
help of ink and special chemicals. The artists provide design blocks or
screens with the help of which the printers undertake printing jobs.
They keep on moving from one end of the table to another and screen
print the cloth. Like weavers on the looms the printers have to stand
continuously for long hours. Besides the printer have to us one colour

162
at a time. That means if the cloth material requires multiple colour
prints say 4 to 5 colours then the printer has to move back forward
many times. Unless one colour is dried completely, he cannot begin
printing another colour. After the printing operation is over, the cloth
material is allowed to dry completely. Again it is sent to another
section for washing and bleaching. Starch is also used during this
stage. Then the finished cloth is sent for folding and packing. The
supervisor notes down the quality of the job done and also the details
of total output of the finished cloth. This cloth material is then handed
over to the traders or merchant or loom owners from whom this job
was assigned to the processing units’ flow chart 2. [14]

163
Flow Chart 1: Preparatory and Weaving.
Flow chart 2: Processing Units.
(A) Dyeing Process:
Re Bleaching for stains
Washing Dyeing Washing in cold water
Yarn on Cops
Winding Twisting Winding spool firka
Warping
Beam Passing
Weaving on power loom
Checking on check board
Folding
Weighing Recording Output
Grey cloth ready for dispatch
Dyeing Printing process
Weighing of cloth
Checking on check board
Stretching on stenter
Bleaching
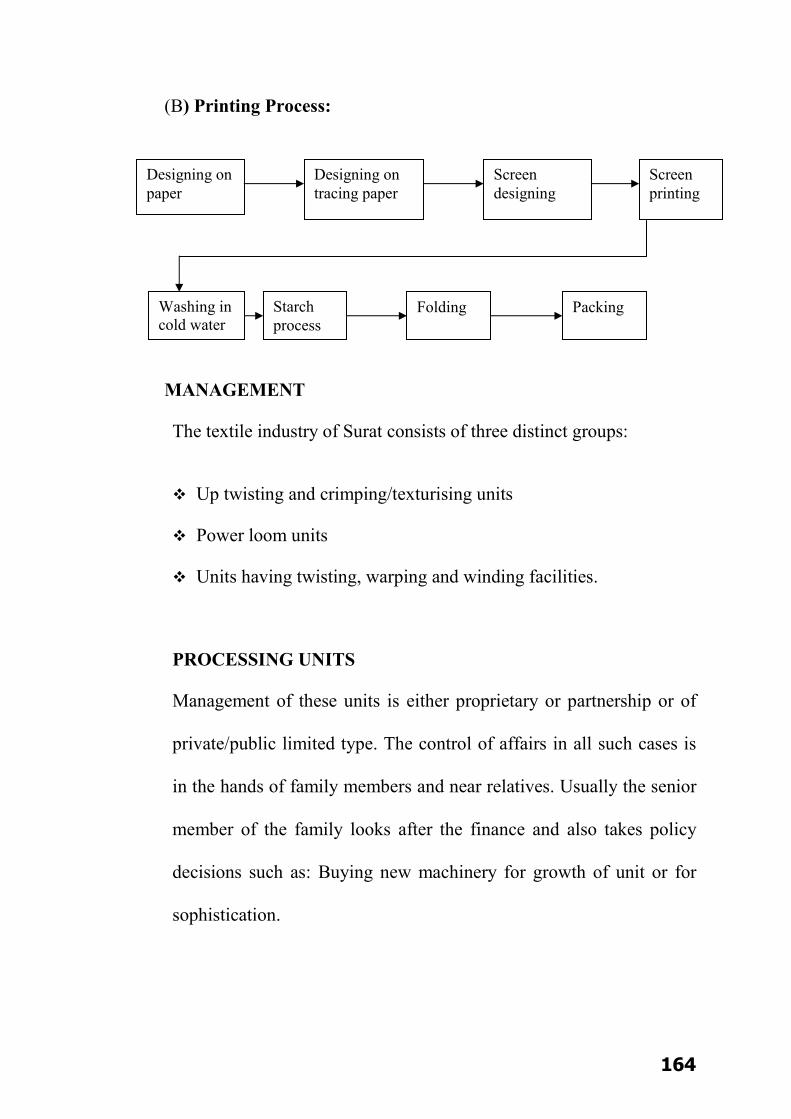
164
(B) Printing Process:
MANAGEMENT
The textile industry of Surat consists of three distinct groups:
Up twisting and crimping/texturising units
Power loom units
Units having twisting, warping and winding facilities.
PROCESSING UNITS
Management of these units is either proprietary or partnership or of
private/public limited type. The control of affairs in all such cases is
in the hands of family members and near relatives. Usually the senior
member of the family looks after the finance and also takes policy
decisions such as: Buying new machinery for growth of unit or for
sophistication.
Starch process
Folding Packing
Designing on paper
Designing on tracing paper
Screen designing
Screen printing
Washing in cold water
165
Introduction of new merchants or new products
The younger brother or sons handle routine purchases and supervision
of day to day management, product quality and plant production.
(A) MANAGEMENT OF CRIMPING/TEXTURISING
UNITS:
Management of texturising units are aware of the fact that
quality of basic POY (Partially oriented yarn) yarn is of utmost
importance and yarn having thick/thin places or undrawn
portions is out right rejected.
The owner himself looks after purchases and sales and keeps in
touch with the market trends. The yarn technician is
responsible for quality check up and is usually a qualified
textile technologist. The laboratory incharge reports to the yarn
technician his routine findings. The mechanical technician is
held responsible for machine maintenance. Small units
sometimes have one mechanical technician between two of
them to curtail expenditure. Both these technicians are
answerable to the manager. Besides these qualified personnel
jobber/foreman, worker/operatives and packer cum checker and
A/C plant operator are also employed. The machines especially
texturising machines are fully automatic.

166
Texturising machines employing friction spindle have less
breakages as compared to crimping machines which employ
magnetic spindles. In crimping/texturising units, spindle-wise
records of production and quality are maintained. Besides this
daily report on downtimes due to power failure, machine
breakdown, air conditioner failure, etc. is also scrupulously
maintained. There is also a factory report and laboratory report.
In crimping/texturising units as well as up twisters, yarn is
processed on job work as well as on purchase-process-sell basis
depending on financial position of the management. In
crimping units more frequent changes of quality to meet the
market needs are done but on texturising machines, quality
change is kept to minimum as loss of production is high. It is
changed only when raw material position demands a change or
the market for a running quality dries up.
(B) MANAGEMENT STRUCTURE OF POWER LOOM
UNITS:
Most of these units are owned by entrepreneurs either in
proprietorship or in a partnership. There is hardly any private
limited firms excepting a few composite units i.e. units having

167
preparatory, weaving and wet processing sections. These
composite units have more than 100 looms in operation.
The small units exist as either only weaving units or only
preparatory units. These small weaving units have 12 to 36
looms in operations. The big units are those which have both
preparatory and weaving section together. Management
structure therefore is different depending upon the size of the
unit.
Top Management:
Top management in small units is the owner or the proprietor himself.
He is assisted by a jobber and a clerk cum folder in the day to day
working of the unit. The responsibilities are as follows:

168
Error!
Purchase of raw material or job work
Production Planning and General Supervision
Public Relations
Market Speculation and Sales
Jobber (1) M/C maintenance (2) Labour Recruitment (3) Production (4) Quality control (5) Waste Management
Clerk- cum- folder (1) Raw material inspection (2) Grey fabric inspection (3) Register and record
maintenance.
Proprietor
Finance

169
Records: Records maintained by these units are of two types.
Labour:
Job Work Own Manufacturing
Warp Beam Weight Records Warp and Weft Yarn Purchase Record
Weft Yarn Weight Records
Fabric Production Records Sales Record
Business Records Business Records
Waste Percentage Record Fabric Production Records
Waste Percentage Record Machine Maintenance Record
Muster Wages etc Machine Maintenance Record
Muster/Wages etc.
Records

170
Recruitment is done in these small units through a jobber in
consultation with the owner. There is always acute shortage of
weavers, winder, etc. In case of small units contract labour is not
practical because it is neither profitable to the owner nor to the
contractor. The labour relations are generally good because the
number is very small and it is maintained at a personal level.
Quality Control:
Raw material is inspected for any faults, damages, etc. by clerk cum
folder. Process control is done by the jobber particularly when new
variety is introduced. Grey fabric inspection and mending work is
done by the folder. Damages are detected and controlled during
general supervision. The small units cannot afford to have any
laboratory at all.
New Varieties :
New varieties are introduced only once or twice in a year. These are
introduced based upon market trends. Whenever necessary, outside
help of master weaver is sought to set up new quality. [15]
Management of Process House :

171
The process houses are by and large labour intensive units and
therefore the management is more complex. The pattern of working
however remains more or less the same though on a magnified scale.
The process houses are having Proprietary, Partnership or Private
Limited Managements. The general consensus is that the private
limited concern offers only an advantage of carrying forward of
losses. In these units the top position is usually held by a senior, who
is more mature and dynamic person of the family. He looks after
finance banking, general administration, machine purchase,
merchants and is also a responsible for policy decision. The
responsibilities may vary from unit to unit and is more modern set up.
There is greater delegation of responsibilities to junior family
members or some times to departmental heads if limited family
members are available.
The younger generation of entrepreneurs is now technically qualified
and they do hold positions like Technical Director. It is normally
found that internal work and external work management
responsibilities are clear cut divided. For example a member of the
family is made responsible for the following:For construction and
Installation of Machine, and Maintenance and for handling the
banking and labour Problems.
172
For trouble shooting in the department handling complaints form
merchants and new product development, for the purchase of
colour/chemicals etc.
In very few process houses paid Managers are engaged to manage
activities like finance, production, labour relations, etc. In some of the
process houses it was noted that a post of Finance Manager has been
created to manage jobs like labour factory administration, finance
management mostly related to Banking such as opening of letter of
credit maintaining inward outward registers, etc. Usually directly
under management there are departmental heads such as Dyeing
Masters and Printing Masters under whom several supervisors
function to carry out routine work.
The post of maintenance Engineer is not given due importance it
carries and a junior level person is engaged to shoulder this activity.
In some process house it is also observed that interference form
management in day to day working of department is too involved and
the work invariably suffers due to confused instruction from several
Bosses. There is however some well managed units where every thing
is done in a systematic way and through a proper channel. Some units
avail of services of consultants well who are well versed with
Management, Dyeing, Printing, Boiler, Performance Problems, etc. It
173
has been found that in older units labour problems are more
aggregated where as in Newer Units, Finance, Internet Burden, etc.
need more attention. It is also well known that most of the process
houses are engaged in job work on a specific charge. However there
are few units who process their own fabrics. In such cases the
purchase of yarns for manufacture of grey fabrics and purchase of
colours/chemicals for processing of fabric are managed by separate
hands. In process house the degree of dependence on contract system
of labour varies some units completely depend on contract labour
whereas others have varying proportion of contract labour. Invariably
in printing department contract labour is engaged. But in dyeing
department their own labour is engaged by many process houses.
Contract rates for labourers are fixed and depend on type of activity
i.e. printing (machine or table) washing of prints, designing, etc. In
general 80% of the work force is on contract basis whereas 20% is
their own. In most of the process houses both supervising staff as well
as workers are engaged on 12 hours basis, in fact most employees
prefer this as in these days of high cost of living extra earnings are
needed. Due to contract labour system the process houses
management do not have to face any labour problems as contractor is
responsible for quality and quantity of production. He exercises

174
control once labourers and also recruits them or sacks them as when
required. He keeps on changing the worker from one unit to other to
nip the problems in the end.
Labour shortages are experienced in summer seasons where migrant
labour takes leave to go home. More so some workers also have
agricultural activities and so they also proceed on leave during this
season. During this period there is high absenteeism and so the work
is carried out by temporary untrained persons and so many times the
unit experience quality and quantity wise problems. The process
houses management prefers to engage workers from several
communities to prevent them from forming labour unions. However
in certain process houses situated in the vicinity of big industrial units
such as Pandesara Union activities are observed and some labour
unrest is also noticed. On an average in a medium size process house
there are 200 to 250 workers. The benefit of PF, ESIS, Bonus, etc.
given to workers is settled every year in the process houses.
Process house management however does face an acute shortage of
technical staff especially at senior level and as a result the mobility of
the staff is quite high. The technical staff mostly moves from one unit
to other with the whole team or group. In process house usually under
Dyeing and Printing Master (both) about 6 to 8 supervisors are
175
engaged to mind the routine work in 3 shifts and office staff of 3 to 4
persons is also employed to maintain records. In many process houses
the policy of internal promotions is followed to encourage sincerity.
Shop floor experienced is always preferred. For example an able
worker is promoted to colour mixer and the to supervisor grade a
worker on printing machine is promoted to machine operator grade
and so on.
The general findings are technically qualified staff is unstable. In
some process houses the management of dyeing unit and printing unit
is in separate hands and is under different names. The records
maintained in process houses are not very systematic. However the
Dyeing Master maintains the grey good register lot wise and
merchant wise and prepare a programme. Some records are
maintained of daily productions on important machines like hot air
stenter or printing machines. In printing department matching wise
records of designs printed are maintained and invariable when the lot
is finished, the record of shortages if any will be maintained. In some
cases knitted sorts, elongations are recorded.
The responsibility for the quality of grey goods given for job work
rests on the traders. However in process, damages are checked by
checkers in dyeing and printing departments. In some well managed

176
units, meter to meter check is exercised and shortage reports are
submitted to the management. The movement of fabric from
department to department is lot wise however system of lot card is not
followed. Some records are also maintained for samples taken out
every day for printing design and matching.
In some good units colours, chemicals, etc. are issued to department
by stores against requisition slips and daily record of consumptions is
maintained item wise and shortages at the end of month are reported
to the management like wise costing of shades designs printed is also
done. In most of process house there is a set up for quality control in
the form of a small laboratory where facilities are available to check
the strength and printing of chemicals and auxiliaries. The materials
are rejected if they are not found as per their previous established
standard or some money is deducted for the inferior supply on prorate
basis.
In most of the units the laboratory staff reports to the management in
charge of purchases. Besides checking of raw material in most
process houses quality of goods in process is inspected by supervisor
staff. Finished products are scrutinized before dispatching it to the
trader both for quality as well as quantity. In process house there is a
practice of stamping at both ends of a piece received to safe guard

177
against thefts. This sort of practice also helps to convince the traders
in case of exercise shrinkages while processing.
The grey goods folder and finished material checker as well as
persons in key department like ager, print washer, etc. are instructed
to report any unwarranted damages like misprints, distortion, patches
in dyeing, cut salvedges, etc. In some units the fastness of dyed
shades or prints is also assessed especially washing fastness. It is also
observed that in most of the process houses frequent changes are not
entertained. The management has contact with fixed number of
traders who specializes in certain qualities and a routine is set.
However in progressive units the challenge is accepted and new
varieties are introduced every month. It usually takes a week to set the
quality provided the changes are of a minor nature or a new type of
finish is required. For example if a mill has to set the 1st time a quality
of shirting or dress material it takes 6 to 8 weeks to fix up the
sequence of operations to be followed and match the finish of a
standard sample. Such changes are however limited. [16]
BIBLIOGRAPHY
Sr. No.
Name of the Book Author / Edition

178
(1) The Textile Magazine July 2005 (Tours on Surat)
(2) Fabric Care By : NOEMIA D' SOUZA New Age International (P.) Ltd; Publication 1998
(3) Fabric Forming Systems By : Peter Schwartz Trevor Rhodes Mansor Mohamad 1996 School of Textile North Corotina Noyes Publication U.S.A. Mahajan Book Distributors
(4) Fabric Forming By : B. HASMUKHRAI & B.K. Keshavan 1987
(5) Textile Manufacturing by By : M.G. Kulkarni 2001 Published by India Print Unit; Bombay.
(6) Understanding Textiles By : Phyllis G. Tortora 1998 (7) Textile Processing By : J.H. Marvin 1999
Published Man Millum Publishing (8) Morden textile By : Dorothy Siegert Lyle
Published by John Wiley & Sons Inc. New York London Sydney Toranto
(9) An introduction to textile technology By : Dr. T. ISHIDA 1991 Published by OSAKA SENKEN LGO Japan
(10) Textile Fibre to Fabrics By: M. David Pottor 1998 Bernard P. Corbman Mc graw Hill Publishers.
(11) Handbook of Textiles By : Barker 1998 Abhishek Publication.
(12) Essentials of Textile By Marjony L. Joseph 1988 Mc grew Hill Publication
(13) Textile and Clothing Management An international conference 13-15, December 2004 Allied Publishers Pvt. Ltd New Delhi Mumbai Ahmedabad
(14) Emerging Trends in Polymers & Textiles
By Manjeet Jassal AshwinK. Agarwal Internal Conferenceon 7 & 8 Jan. ‘05 IIT New Delhi.
(15) Textile Terms and definitions By : Prof. J.E. Mc Intyre 1997 Published by : Biddles Limited U.K.
(16) Ram Asrey Lal, Joint Conference book of Papers
Tree and Atira Ahmedabad 26 Sept. 1998.
Web site :
(W1) wwwindiaonesotp.com/Dirof Trade htm.
179
(W2) www.welcometoindia.com.
(W3) wwwapparel.indiamart.com.
(W4) wwwinfabanc com/vanijya
Books :
(B1) THE GLORY OF GUJARAT By : Rajnee Vayas - 1998
AKSHARA PRAKASHAN AHMEDABAD.
News Papers : (N1) Economic Times : 1st April 2005 (N2) Gujarat Mitra : 5th Aug. 2005. (N3) Economic Times : 4th April 2005. (N4) Economic Times : 14th April 2005. www.finmin.ricin/cbec/not GAR.htm.

180
CHAPTER – 4
PROBLEMS AND REMEDIES OF PROCESS HOUSES
4.1 INTRODUCTION
4.2 SOURCES OF INITIAL CAPITAL
4.3 FINANCIAL PROBLEMS
4.4 DILATORY AND CUMBERSOME PROCEDURE
4.5 PROBLEMS OBTAINING LOANS FROM BANKS
4.6 PROBLEMS OF MARKETING MANAGEMENT
4.7 EDUCATION OF THE ENTREPRENEURS AND
VOLUME OF SALES
4.8 DETERMINING DISTRIBUTION CHANNELS
4.9 ADVERTISING OF THE PRODUCT
4.10 PROBLEMS OF MARKETING
4.11 PERSONNEL PROBLEMS (LABOUR)
4.12 RECRUITMENT OF THE WORKERS
4.13 LABOUR PROBLEMS IN THE UNITS
4.14 PROBLEMS OF PRODUCTION MANAGEMENT
4.15 NOISE POLLUTION AND OTHER POLLUTION :

181
4.1 INTRODUCTION
The new thrust given to the process of economic development of the
country by the new dynamic leadership has created an all round
enthusiasm and the new slogan of “March towards the twenty first
century” has gained popularity. But in this new enthusiasm, a very
vital sector of the society which can contribute substantially towards
the economic development of the country is still not given still as
much attention as required sector is women entrepreneurs. Every
woman is a manager and assumes responsibility of running the house
and she also uses all the tools of efficiently management without
boasting about them.
In this chapter the researcher has examined some problems faced by
women entrepreneurs. These problems are divided in the following
broad categories. These categories are as under:
(1) Problems of Financial Management.
(2) Problems of Marketing Management.
(3) Problems of Personnel Management.
(4) Problems of Production Management.
(5) Problems of related to Social Prejudices.
(6) Miscellaneous Problems.

182
PROBLEM OF FINANCIAL MANAGEMENT :
Finance holds the key to all business activity. It is the life blood of
business in any productive sphere and works as the guide for
regulating investment decisions and expenditure. Financial supports
as well as financial viability are the most important considerations of
every business proposition. Finance is also a common denominator. A
major proposition of the plan, policies and objectives of any
organization, whether in large industry sector or in small sector, is
explained and interpreted in financial terms.
Finance is that administrative area or set of administrative functions
in an organization which relate with the management of cash and
credit so that the organization may have means to carry out its
objective as satisfactorily as possible. All inputs deployed in an
enterprise, i.e. Men, Money, materials, machines and methods involve
an investment of both fixed and working capitals which in turn
generate a flow of funds. Principles and policies of financial
management aim at the effective use of the investment in order to get
the best out of the single rupee deployed with in the profitability of a
unit is affected by both of these things.
183
4.2 SOURCES OF INITIAL CAPITAL :
Small industry has been characterized as the seedbed of an economic
system, a vital place of new products, new technologies and new
entrepreneurial talent. Some past studies undertaken in this area had
summarized that without proper financing there can be no efficient
planning of business enterprise, nor purchase of material, nor
production, nor marketing, nor only fair profit.
Due to the government’s concerned efforts, many promotional
financial agencies have also initiated several schemes to promote
entrepreneurship in the various states. In Gujarat, GSFC; a prime
financial Govt. undertaking corporation of state, has some special
schemes for assistance to textile industries. [1]
4.3 FINANCIAL PROBLEMS :
It was observed that the entrepreneurs under the study are facing the
acute financial problems. It was observed that the respondents in
general are aware of the institutional financial services in the south
Gujrat region and most of the entrepreneurs have also availed of the
same. But they reported following type of problems in getting the
loans from financial institutions.

184
4.4 DILATORY AND CUMBERSOME PROCEDURE :
During the research study, it was observed that entrepreneurs are
utterly dissatisfied with the working of banks and other agencies
engaged in promotion and development of textile industries. The
entrepreneur allured by many facilities and incentives provided by the
government soon, losses his enthusiasm and zeal when he observes
the real working of these agencies.
After preparing feasibility report when they approach the agencies,
they faces problem due to cumbersome, harassing and dilatory
procedure at various stages, i.e. completion of legal formalities for
the registration and licences, disbursement of loan, registration with
DIC, sales tax registration, excise licencse, sanction of long term as
well as working capital loans and its disbursements etc.
The entrepreneurs opined that some of these delays are procedural
and some others are deliberate, where corruption plays a major role.
The file is intentionally not moved until the palms of concerned
persons are greased. It was informed that when a project get, delayed
the scope cost over run increases and the funds meant for the industry
get depleted either on account of the personal withdrawals during the
period of owing to pre-operative expenditure, made in completing the
above mentioned formalities.
185
It was also reported by the entrepreneurs that some times the officials
of the agencies\banks are critising out projects and ask various types
of questions that are not related with the projects as well as not
connected with their areas of authority. [2]
4.5 PROBLEMS OBTAINING LOANS FROM BANKS :
Financial problems experiences by the entrepreneurs are most
essentially in the area of working capital. It was observed that the
entrepreneurs are in need of greater amount of working capital.
Almost the entrepreneurs had planned to expand or diversity their
production, but this plan could not be materialised mainly due to the
non-availability of long term funds as well as working capital. The
entrepreneurs alleged that commercial banks are still pursuing the
traditional approach while financing the entrepreneurs. Instead of
visualizing the viability and profitability of the units, the banks weigh
on amount and quality of security offered against the loans.
Some other relevant problems revealed during the research-study are
as under :
(1) The rate of interest on loans is very high. Some time it also
becomes difficult to repay the instalments \principal amount in
186
the initial years when units have still not established
themselves in market.
It is also reported by the entrepreneurs that our nationalized
banks charge high rate of interest as compared to the co-
operative banks. If entrepreneurs approach co-operative banks
for the finance for their project they have to forgo the subsidy
benefits from the government, which are available from the
nationalized banks.
(2) They also felt that taxes, duties and some other charges on
entrepreneurs should be reduced.
(3) Lack of published material at grass-root level regarding finance
and other incentives is also one of the great problems faced by
the entrepreneurs. They also reported that some time
information is available in English language and it is difficult
(to understand them) for the less educated or their family
members, especially in rural area. [3]
It is also reported that due to above mentioned problems they have to
take help of the agents for smooth sanctioning of loans and agents
charge high commission for the same.
187
SUGGESTIONS :
(1) The commercial banks should liberalise the terms and
conditions for granting the loans to the entrepreneurs with the
approval of Reserve Bank of India.
(2) Some reduction in rate of interest is also required particularly
in the case of entrepreneurs.
(3) Simple application forms should be prepared by the
promotional agencies as well as banks for the entrepreneurs.
(4) The commercial banks should evolve a need-based in place of
security based financing policy to assist entrepreneurs.
Moreover, in genuine cases, working capital should be
sanctioned immediately by the banks, so as to enable the
smooth functioning of the units managed by entrepreneurs.
(5) The state government should create a special fund to provide
loans to entrepreneurs through DICs for the improvement of
quality production.
(6) Some other relevant taxes should also be reduced for the
entrepreneurs.

188
4.6 PROBLEMS OF MARKETING MANAGEMENT :
Marketing is one of the vital factors for the success of industries.
Focussing on market is important. If there is no market for the items
produced by the industry then that industry cannot exist for a long
time. The very purpose of a manufacturing concern is to produce
what the customer wants, at a reasonable price. The entire function of
a production must be distinctly customer oriented. Today’s market is
a buyer’s market. An entrepreneur has to face a cut – throat
competition not only from indigenous producers but also from the
producers of the world. Quality, cost, design, standardization,
advertisement and proper distribution of the product play a very
crucial role in competing and holding the market and hence all
decisions affecting market should be taken by entrepreneurs after
having full information of the needs and desires of the customers,
their buying capacities and habits, etc.
Effective marketing not only enables the entrepreneurs to sell his
products on profitable terms to the ultimate consumer or users but
prospective demand can also be aroused among the potential
customers by discovering and creating new needs.
Entrepreneurs face increasing difficulties in marketing their products
and generally are not utilizing their production capacity to full extent.
189
This is a recurring waste of productive resources and is a colossal
national loss.
Several studies in the past have shown that the entrepreneurs of our
country have not fully appreciated the importance of marketing, not
they have not employed and implemented effective, marketing
techniques in their enterprises.
In the present study an attempt has been made to study the marketing
practices adopted by entrepreneurs. The study reveals that in most of
the enterprises marketing functions are not being discharged in a
scientific manner. Though most of the entrepreneurs, have begun to
appreciate the importance of marketing management, yet they have
not adopted the modern marketing techniques due to their limitation
like small size of their enterprises, limited funds and limited area of
the market of their products etc. [4]
4.7 EDUCATION OF THE ENTREPRENEURS AND VOLUME OF SALES :
The ensuing analysis has been made with a view to finding out the
association, if any, between the higher qualification of the
entrepreneurs and the higher sales.

190
4.8 DETERMINING DISTRIBUTION CHANNELS
A channel of distribution for a product is the route along which it
moves from producer to the ultimate customer or the industrial unit. It
includes both the producer and ultimate customer or users of the
product, as well as all agents and merchant middlemen involved in
the transfer of its title.
There are number of alternative channels for the distribution certain
categories of middlemen depends upon various factors,i e . nature of
the product, and size of sales organization, size of the market,
middlemen’s organization and resources, cost of distribution, services
and facilities given by middlemen to the producer and customers etc.
Some of the common distribution channels are:
Whole Sellers
Retailers
Selling Agents
Direct Selling
The channel of distribution has a direct bearing upon the price paid by
the consumers. If the channel of distribution selected by the
manufacturer is unduly large comprising of a series of middlemen, the
prices of their product is bound to be higher as each middlemen will

191
add his profit to the original price of the products. As such, an
entrepreneur must choose a channel which allows him to react in
market in the most profitable manner. The ensuing analysis has been
made to determine the channels of distribution chosen by the
entrepreneurs under the study.
It was observed that the most of the unit sell their products either
through whole sellers or directly to the consumers or users of the
products.
It has been found that 09 units, out of the 20 units, undertaken for the
study sell their products through whole sellers either wholly or
partially. Eleven entrepreneurs sell their products directly to users.
4.9 ADVERTISING OF THE PRODUCT :
In this age of mass scale production and severe competition,
advertising has become the most important activity of the sales
management. The fundamental purpose of advertising is
communication. Through effective communication, advertising makes
buyers to look, like, influencing the human behaviour, the awakening
of desire, to process the advertiser’ products, etc Advertising, thus, is
as invaluable device of attracting consumer attention, creating desire
and breaking sales resistance.
192
Several media of advertising are available for an entrepreneur and he
has to select one or more of these media for his product to be
advertised. Media choices are mainly influenced by the purpose of
advertising, nature of the product, the types of the consumers to be
approached and budgeted amount of expenditure on advertisement.
While selecting the media, an entrepreneur must consider the
advertising characteristics and relative merits and demerits of major
types of media, .e.g. newspapers, magazines, calendars, direct mail,
radio, cinema, television, window displays and outdoor advertising
such as posters, painting on walls, signboards etc.
It was reported that out of 300 units under study only 50 percent units
reported using the advertisement media to promote their sales. Most
popular media of advertisement are; sign boards and newspapers. It
was further; it is observed that many of the units use more than one
type of aid. According to some, the financial constraints of the
enterprises do no permit them to employ any mass communication
media.
4.10 PROBLEMS OF MARKETING :
During the course of this study, it has been observed that
entrepreneurs are facing a number of difficulties in marketing their
193
products. But on account of their localized nature, limited sphere of
activities and techniques they are unable to employ the personnel
having adequate experience and knowledge in marketing field. It has
been found that the entrepreneurs, in general, do not possess adequate
up-to-date market information.
In this study 80 percent agreed that they face the problems of the sale
of their products in market where 20 percent were disagree. Majority
face the following.
Cut Throat competition in the market
Non competitive price of the product
Delay in collection of payment from customers
Difficulty to stand in the publicity war by the L.S.I. (Large Scale Industries)
Customers preference to the products of brand named companies and
other 70 percent are suffering of the cut-throat competition in the
market. Some have reported that they are not able to stand in the
market against the qualitative and quantitative production of the
national\multinational companies. Presently, consumers are well
aware about the brand, quality durability, price, after sale services,
etc. of the various products which they require, But the entrepreneurs
194
are unable to provide. They also agreed that the price of their product
is comparatively high and they do not have any quantities standards
on the basis of which they can improve the product.
Following are some other problems, which the entrepreneurs face.
A) Due to the lack of standardization they are not able to sell their
product at the global level.
B) They are not able to employ excellent exports of marketing in
their enterprise or even consult them, because of shortage of
finance and high charges of the services offered by them.
C) Limitations of advertising and publicity affects the selling of
the products.
D) They are not financially able to adopt sales promotion and
other such policies.
E) It was observed that none of the entrepreneur under the study
had ever conducted the marketing research in a systematic
manner due to their lack of knowledge of that process and they
also believe that it is not required for their products in a
comparatively small market.

195
F) It was also reported by some of the entrepreneurs that the
government has taken number of steps to motivate co-operative
societies and they also purchase the products produced by co-
operative society, but in the case of individual entrepreneurs
there is such special scheme to purchase the good produced by
them.
G) Some of the entrepreneurs also reported that non-co-operative
attitudes of wholesalers, retailers and some time even
consumers affect the selling of their products. [5]
SUGGESTIONS :
It is suggested that the state government should set up a state
marketing corporation for marketing the products manufactured by
the entrepreneurs. Such a corporation will not only remove marketing
bottle necks of the entrepreneurs but it will also come as a great relief
to the consumers in the sense that they will then get the goods at
cheaper rates due to elimination of middlemen’s profit.
Marketing consortium may be constituted either as a company or as a
registered society. They should be sponsored and supported by the
state governments, multinational companies, public sector
undertakings NGOs, etc. The constitution of the consortium should
196
include entrepreneurs as its members and its services should be meant
exclusively for the member units. A consortium of units, for
marketing purposes, may generally perform the following functions.
To organize and establish distribution channels.
To organize marketing research and sales promotion in the local
national as well as global markets.
To participate in trade fairs and exhibitions at national and
international levels.
To establish Common facilities for testing and quality control.
To provide after sale services on behalf of a member unit.
To provide a brand name of trade-mark to the products of member
unit.
To organize and promote other facilities such as product
development etc. for the benefit of member units.
To utilize fully the installed capacity of the units and increase their
profitability.
To provide the services of experienced management consultants.
197
4.11 PERSONNEL PROBLEMS (LABOUR)
Management of personnel is the most delicate aspects of
management. The organization’s efficiency, profitability and its very
existence depends upon the men working in the organization. A
competent, contented, co-operative, coordinated, controlled,
organized and well directed team of men is a pre-requisite for getting
the work done and accomplishing the organization goals. Personnel
management aims at achieving both efficiency and justice, neither of
which can be pursued successfully without the other. It seeks to bring
together and develop into an effective organization, men who make
up enterprise, enabling each to make his own best contribution to its
success, both as an individual and as a member of working group. It
seeks to provide fair terms and conditions of employment and brings
satisfaction to those employed. [W1]
Generally, am entrepreneur has to deal with the following major
functions in connection with the operation of his enterprise.
Manpower planning.
Recruitment, selection and placement.
Job evaluation.

198
Wage and salary administration.
Conditions of employment.
Training and education.
Industrial relations, and
Negotiations.
Good industrial relations result in overall peaceful atmosphere and
welling co-operation from all people employed in the organization
which ultimately helps in achieving the organisation’s goal. On the
other hand, strained relations result in frequent disputes. Industrial
unrest leads to strikes and lock-outs, high labour turnover and
absenteeism, frequent closures of factories, indiscipline, lower
morale, sabotage and violence boycott, picketing, antagonism, class
struggle, etc. From entrepreneur’s point of view happy contented,
efficient, willing and co-operative employees are of great
significance.
It indicates that if they have some experience and training they can
produce goods by themselves and thus they can save adequate money
on their part. Support of the family member is also an important
factor.
199
4.12 RECRUITMENT OF THE WORKERS :
Wage system is regarded as a positive instrument to attain the
objectives of sound employment relationships. Slipshod wage policies
many a time result in employees dissatisfaction grievances, high
labour turnover, high labour cost, low productivity, low profits and
strained employer – employee relationships.
For the units under study, generally wages are paid on monthly basis.
None of the units understudy has adopted any incentive wage system
in a systematic and scientific manner. [W2]
4.13 LABOUR PROBLEMS IN THE UNITS :
During the course of the study, it has been observed that the
entrepreneurs are facing various labour problems in their units.
LABOUR PROBLEMS IN THE UNITS :
WAGE & SALARY
Bonus
WORKING HOURS
LEAVE
RIGHTS/BENEFITS
BEHAVIOUR
HIGH TURNOVER/ABSENTEEISM
INCENTIVES

200
OTHER
The entrepreneurs are facing various kinds of labour problems.
Many of the entrepreneurs are not well acquainted with techniques as
how to recruit, develop, utilize, evaluate and retain the right numbers
and right types of workers.
The labour – welfare activities for employees are found to be
inadequate.
There is no system of proper training to develop the efficiency of the
employed workers.
SUGGESTIONS :
The mode of recruitment must be modified. It has been observed that
most of the units are still recruiting the workforce by the traditional
method.
It has been found that normally there is no scientific policy for the
promotion of the workers, in the units. It is suggested that an effective
incentive system should be formulated by the entrepreneurs, which
may go a long way to improve the efficiency of the capable workers.
The welfare activities for workers are found to the inadequate in the
units under study. It is suggested that certain common facilities like
201
medical, education training, must be provided in a manner that every
worker may get required help without cruel efforts on his part.
Entrepreneurs should realize that training is the process of assisting
people in developing skills relevant to their work. They should,
therefore, take some steps to impart training to the workers in order to
increase their productivity.
It has been observed that the area in which entrepreneurs face the
greatest difficulty is that of management. Therefore, it is suggested
that training programmes for entrepreneurs should be conducted by
the state governments, concerned corporations and DICs.
Majority of the entrepreneurs manage small enterprise and therefore,
they are not in a position to adopt principles or techniques which are
required for the efficient management of large enterprises.. For
example, promotion, demotion, incentive schemes, wage and salary
administration, manpower planning etc. are of specific nature as far as
there units are concerned and are to be treated in a different manner.
In this situation following suggestions are given.
(A) For the recruitment, selection and appointment, entrepreneurs
should observe and examine the candidates on the basis of
his/her previous experience. Some time they may secure

202
opinion from their previous employers. The terms of services
salaries, working hours, etc. should be fixed at the time of
appointment.
(B) When a single worker is appointed in the unit, there is no need
of formal promotion but with consideration of his tenure of
service, his performance and loyalty towards the unit, his or her
salary should be increased or adjusted.
(C) For the development of the morale and motivation,
occasionally giving gifts, awarding cash prizes, etc. can play a
significant role.
(D) Generally in small units, there are fewer problems, of strikes,
lockouts, etc. But entrepreneurs should be aware of
dissatisfaction of the employees. Techniques of personal
informal relations with the employees are the best solution for
the removal of the dissatisfaction among the employees. To
create a homely environment entrepreneurs can take many
steps. i. e . making them take part in the to day decision making
process, taking interest in his or her family problems , attending
social ceremonies, celebrating common festivals together etc.

203
4.14 PROBLEMS OF PRODUCTION MANAGEMENT :
Production function is an important function in all the industrial or
manufacturing enterprises, Most of the other activities in these
enterprises revolve around this function. Therefore, it is essential that
production function is managed properly so that it may contribute
effectively to the objectives of the enterprise.
Production means the conversion of raw materials into finished
products with the help of certain processes. The main aim of any
production system is to produce the desired goods and services
effectively and efficiently. In order to achieve this aim, it is essential
to plan, organize, direct and control the production system which is
the task of production management. Production management ensures
the conversion of various inputs into outputs so that the wants of the
customers are satisfied
Production management involves planning, organizing, direction and
controlling the activities relating to the production function.
Production management can be classified into two major phases; (10
managerial function regarding the design of the production system,
and (2) operation and control of the production system I . e.
Production system is the framework within which the conversion of
inputs into outputs occur. At one end of the production system are the
204
inputs that are linked by certain operations or processes which impart
value to the inputs. This concept of the production system can be
applied to all those activities resulting in goods or services.
Production planning and control is concerned with directing
production along the lines set by the planning department. It is the
means by which actual performance of the productive apparatus is
constantly evaluated in the light of standards set in advance.
Production planning and control, as the name implies, is concerned
with two aspects of production.
According to Alford and Beatly ; “Production Planning and control
comprise the planning routing, scheduling, dispatching and follow up
function in the productive process that the movements of material,
performance of machines and operations of labour, however, sub-
divided, are directed and co-ordinated as to quantity, quality, time and
place. It is adopting as a business principle the old adage of plan your
work and work your plan (5) Charles A, keopke defines production
planning and control as the “coordination of a series of functions
according to a plan which will economically utilize the plant, their
entire manufacturing cycle, from the production of all materials to the
shipping of finished goods at a predetermined rate.

205
The entrepreneurs as a small producer should give serious thought to
production planning and control before entering into a production
line. Whatever the nature of products consumers or capital, goods, it
is necessary to find out the design, colour, size and quality of product
the market likes. There should be a complete co-ordination between
marketing and production activities in order to tailor the production to
the needs of the people. [W3]
RAW MATERIAL :
Majority of the units have a facility of store the raw material
purchased in advance. Some units reported that some time they have
to store their raw material in private godowns.
Some raw matching have to be stored in large quantity depending on
the availability of funds for which adequate space is not available on
the site of units concerned. Some units reported that required raw
material is easily available in the local market and their production
depends on the orders and accordingly purchases are made.
Some products find favour in the market, some others may lose
attraction of the customers and some disappear due to the entrance of
competitive products. Therefore, adding or dropping products in the
existing line of production is an important consideration of product

206
policy decisions. The entrepreneur in its ranges of assorted items may
go in for a wide variety of different items, different degrees of
quality, varieties in packaging etc. The product design, style and sizes
are important considerations in deciding the product mix. Policy
decisions have to be taken for like branding, packaging, trademark
etc.
A common complaint against small entrepreneur is their ignorance
about the scientific methods of production management, which causes
high cost and comparatively poor quality of their products, non-
adherence to the inevitably schedules etc. A planned production
system inevitably controls the cost, improves the quality of products
and eliminates the undue delay in delivery.
None of the units understudy have standardized certificates for their
products. It was also observed that the units under study purchase the
raw materials from indigenous sources and none or very few of the
units import raw materials from other countries. Ninety five percent
entrepreneurs reported easy availability of their required raw
materials. [W4]

207
PROBLEMS OF PRODUCTION MANAGEMENT:
Majority of the entrepreneurs are facing the problems of
underutilization of established production capacity.
It was observed that many of the products manufactured by
entrepreneurs are not of a standard quality. One of the main reasons
of this is the absence of provision for testing and process equipments
and instruments.
Due to the lack of experience and training majority of entrepreneurs
are basically unaware about the production planning and product
development.
Lack of finance is also an important aspect that restricts the
entrepreneurs to develop their product line and product mix.
It was also reported that raw materials available in open market is
costly. It adds to their cost of production and finally affects the
profitability of the units.
SUGGESTIONS :
Training programme for the entrepreneurs and also the production
supervisor/worker if any of the unit should be organized in the area of

208
technical aspect of production. Small Industries Service Institute
should initiate in this issue.
There should be special assistance for the product quality
maintenance and infect development to the entrepreneurs. Lending
institutions which provided them finance in the initial period should
take initiative regarding such assistance based on the survey of such
units.
With the help of governmental agencies, entrepreneurs should
develop product research project, and product development project
for their enterprises.
These factors are discouraging to entrepreneurs for becoming
successful entrepreneurs.
4.15 NOISE POLLUTION AND OTHER POLLUTION :
Work related accidents and illness are capable of reducing profits by
10% or more and industrial safety and health protection cannot be
separated form environmental protection. As such, sound is useful for
communication but unwanted or excessive sound is termed as noise.
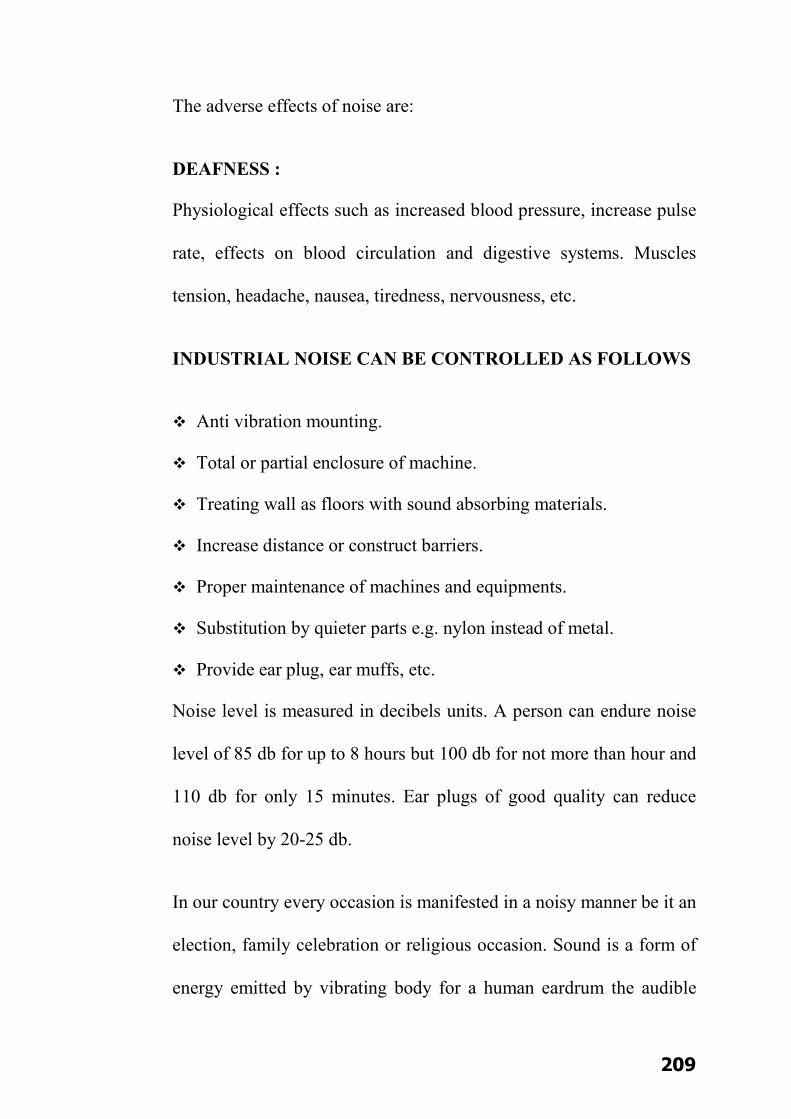
209
The adverse effects of noise are:
DEAFNESS :
Physiological effects such as increased blood pressure, increase pulse
rate, effects on blood circulation and digestive systems. Muscles
tension, headache, nausea, tiredness, nervousness, etc.
INDUSTRIAL NOISE CAN BE CONTROLLED AS FOLLOWS
Anti vibration mounting.
Total or partial enclosure of machine.
Treating wall as floors with sound absorbing materials.
Increase distance or construct barriers.
Proper maintenance of machines and equipments.
Substitution by quieter parts e.g. nylon instead of metal.
Provide ear plug, ear muffs, etc.
Noise level is measured in decibels units. A person can endure noise
level of 85 db for up to 8 hours but 100 db for not more than hour and
110 db for only 15 minutes. Ear plugs of good quality can reduce
noise level by 20-25 db.
In our country every occasion is manifested in a noisy manner be it an
election, family celebration or religious occasion. Sound is a form of
energy emitted by vibrating body for a human eardrum the audible
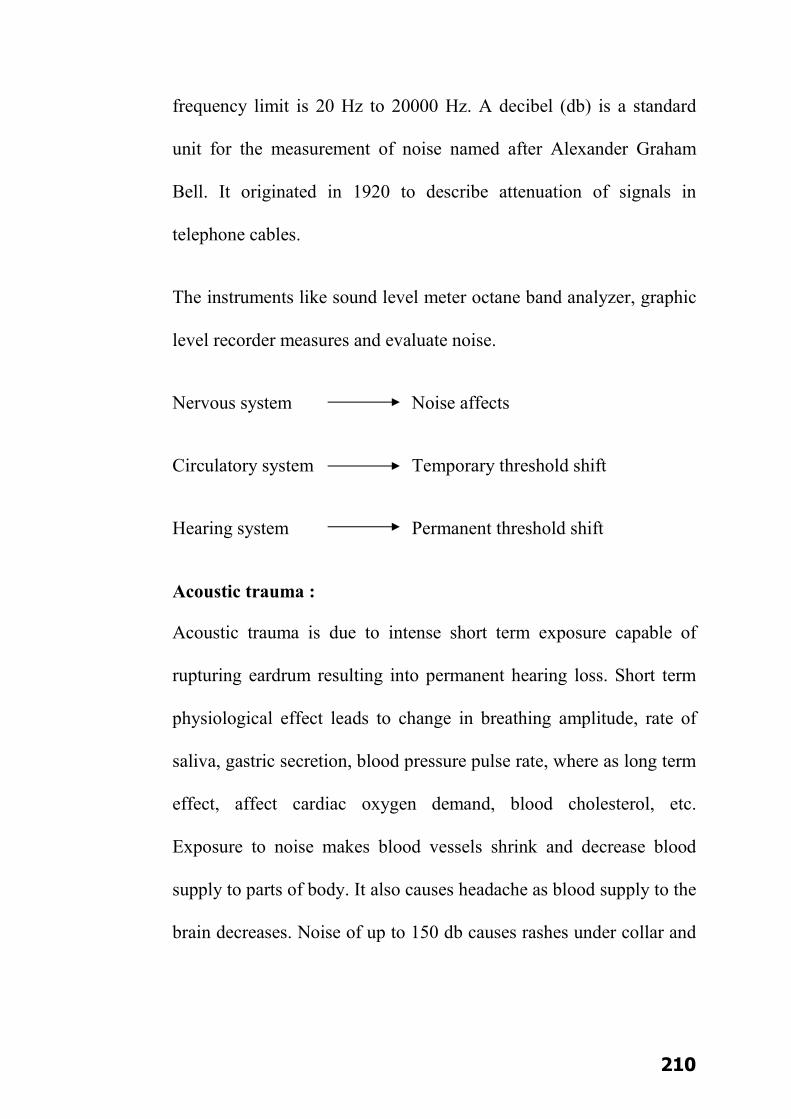
210
frequency limit is 20 Hz to 20000 Hz. A decibel (db) is a standard
unit for the measurement of noise named after Alexander Graham
Bell. It originated in 1920 to describe attenuation of signals in
telephone cables.
The instruments like sound level meter octane band analyzer, graphic
level recorder measures and evaluate noise.
Nervous system Noise affects
Circulatory system Temporary threshold shift
Hearing system Permanent threshold shift
Acoustic trauma :
Acoustic trauma is due to intense short term exposure capable of
rupturing eardrum resulting into permanent hearing loss. Short term
physiological effect leads to change in breathing amplitude, rate of
saliva, gastric secretion, blood pressure pulse rate, where as long term
effect, affect cardiac oxygen demand, blood cholesterol, etc.
Exposure to noise makes blood vessels shrink and decrease blood
supply to parts of body. It also causes headache as blood supply to the
brain decreases. Noise of up to 150 db causes rashes under collar and
211
in between fringes and thighs and 130 to 135 db sound produces
dizziness and vomiting.
Noise level of Textile machinery
(1) pening and blow room 5-94 decibels
(2) ard room 87-90 decibels
(3) raw frame/spinning 89-96 decibels
(4) inding machine 85-89 decibels
(5) Warping machine 85-88 decibels
(6) Sizing machine 80 decibels
(7) Large weaving shed 100-105 decibels
(8) Shuttle less weaving 90-96 decibels
(9) Shearing/cropping machine 78-88 decibels
The level of the noise can be reduced by using silencers devices like
mufflers, fixing vibrator pads, proper layout and spacing of looms,
using rubber pads, engineering plastics in place of metal spares,
placing machines in enclosure, by the sue of carpets, drapery and
upholstered furniture in office, planting of trees on highways, etc.
Besides sound absorbing materials like hair, felt, perforated plywood
acoustic tiles should be made use of, to reduce the sound levels.
212
DUST POLLUTION :
Dust is another pollutant which can cause lung diseases. Dust of fiber,
dyestuffs leads to chest tightness, shortness of breath and coughs. The
severity depends upon:-
The amount of dust in the work room
Length of Exposure
To overcome the problem use of mask and vacuum cleaning can be
resorted to. [W5]
REMEDIES SUGGESTED :
The level of technology is one of the inevitable conditions for
advancing quality production in the processing sector. The other
benefits accruing on account of technology upgradation and
modernisation is the reduction of production time, optimum
utilization of resources and utilities and energy savings which will
reduce the per unit cost of production.
At present only 10% of the Units in the Processing Sector are
having modern technology. The remaining 90% of the units are
either in the level of medium or obsolete technology.

213
New modern units should be encouraged to be set up. This will
bring about establishment of centres of excellence, which would
have multiplier and demonstrable effect.
Since the setting up of the processing unit is capital intensive,
adequate credit facilities should be available.
To encourage the processors the lending rate should be made
attractive concessions on excise duty and tax excerption may be
considered as an encouragement.
Presently the Processing units do not have adequate
Machines/Machinery with process control. Very few of the Units
have production automation system. Besides, Bleaching is mostly
carried out through Batch Processing Method. High tech open width
bleaching plants are not in existence in the country.
The advanced technology level machines are mostly imported and are
established after 1995, besides they are very few in number.
In order to produce zero defect fabrics it is desirable to go for micro
process base system at the level of production.

214
Indigenously developed machines/Machineries with process control
facilities and IT back up should be produced in the country for easy
accessibility of the processors.
It is observed that the Indian Machinery Manufacturers do not go for
production of processing equipments because of unsustainable
demands from the Processing Industry.
In order to encourage the production of indigenous machines of high
quality on sustainable basis, credit facilities should be provided at low
rate of interest.
Besides the reduction in the tax, for such machines should also been
considered
The most important raw material for processing is dyes and chemical
besides principle raw material such as fibre, yarn, fabric, garments,
etc., Some of the dyes particularly the AZO groups from direct acid
and disperse types are presumed to be harmful for the human skin.
There has been, strict import laws for the textiles produced by the use
of above group of dyes. The Government has already banned the
above group of dyes for use and production of textiles.
215
But there are no regulations for non use of the dyes. Effective
regulating measures should be evolved to restrict the use of AZO
Group of dyes, by creating an environment of awareness on the above
amongst the processors
Alternative dye stuff should be found out through research and
development.
The testing facilities on quality and eco parameters are adequately
available in the country. The latest generation equipments have been
imported from USA and other European countries to provide the state
of art testing facilities to the industry.
The Government has already invested large establishing the amount
of money in best available equipments. The processing houses should
take advantage of the existing facilities for testing.
It is observed that despite of the awareness level is quite high but the
culture, of testing and asserting the standards are lacking.
Besides as Processing is carried out in most disorganised manner, the
owners and Managers give little importance to the testing side.
Their priority is generating output in terms of quantity only.
216
This situation needs a complete reversal. The benefit of quality testing
and testing for eco parameters needs to be informed to the processors.
Efforts, therefore, should be made to invigorate interactive and
awareness sessions in terms of seminar and workshops amongst the
processing fraternity to inculcate the culture of testing.
The effluent treatment facility in the processing sector is limited and
most of the existing treatment facilities are unto secondary levels of
treatment.
The effluent treatment has received prime importance for adhering to
the environmental norms. Recent Governmental regulations on
environmental control measures (Particularly treatment of Effluents)
have been stringent. The state pollution control boards implement
their own regulations.
There should be common national standards for pollution control for
textile industry as a whole instead of different standards prevailing in
different states.
The Effluent Treatments must be carried out on the Processing Units
as precaution for preservation of environment.

217
Besides, on an average, more than 100 litters of water is required to
process 10 Mts. of Fabrics. Given the shortage of water in many
places, reuse of the water is highly essential. The processing house
should be encouraged to adopt ISO 14000 systems. For adopting ISO
14000 and installing proper Epps, the process houses should be
provided easy interest free capital for a specific period, since
installation of Effluent Treatment plant \does not increase the
productivity rather adds to the component of the existing cost.
The textile processing sector has well qualified managers and
supervisors to man the best of processing units of the country.
However, their number is small.
The major processing activities carried out and supervised is by the
operational staff, which constitutes roughly 85% of the total
manpower employed in the Processing Sector.
The Processing units going for modernisation and upgradation should
provide adequate technical training to staff employed in different
shop floor activities and it should be a compulsory component in the
modernisation/upgradation module.
The training will necessarily increase the quality of output besides
optionally using the resources and utilities.

218
The training institutions and organisations should be identified, listed
and circulated to the Processing Houses for implementation.
Most of the Processing houses in the Medium tech and obsolete
categories work in unsuitable and ethical environments. The health of
the staff labour is also compromised for industry’s benefit.
There are many centres that indicate labour employment on contract
basis. The labour is exploited in terms of low wage payments and
larger duration of work.
Many advanced importing countries across the globe are insisting that
the products should be generated by a good environment with best
possible facilities to the labour participating in production systems.
The implementation of such system is carried out through SEA. 8000.
The processing units should be encouraged to adopt S.A. 8000
systems.
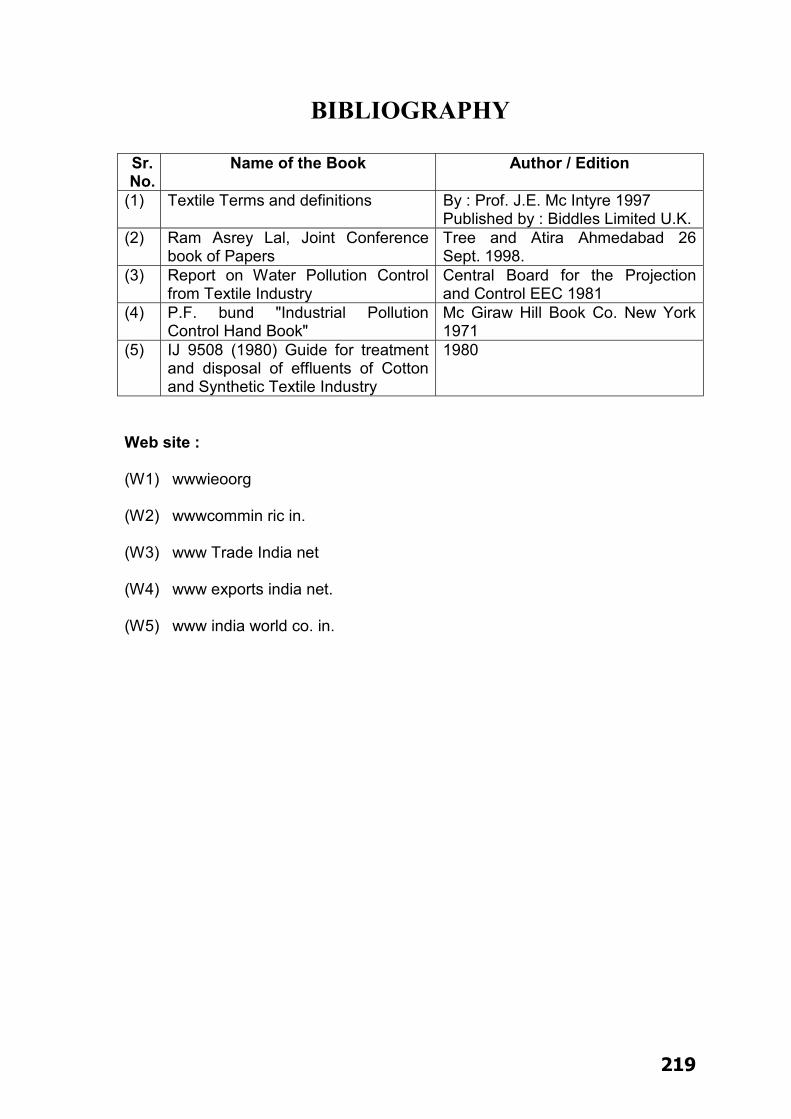
219
BIBLIOGRAPHY
Sr. No.
Name of the Book Author / Edition
(1) Textile Terms and definitions By : Prof. J.E. Mc Intyre 1997 Published by : Biddles Limited U.K.
(2) Ram Asrey Lal, Joint Conference book of Papers
Tree and Atira Ahmedabad 26 Sept. 1998.
(3) Report on Water Pollution Control from Textile Industry
Central Board for the Projection and Control EEC 1981
(4) P.F. bund "Industrial Pollution Control Hand Book"
Mc Giraw Hill Book Co. New York 1971
(5) IJ 9508 (1980) Guide for treatment and disposal of effluents of Cotton and Synthetic Textile Industry
1980
Web site :
(W1) wwwieoorg
(W2) wwwcommin ric in.
(W3) www Trade India net
(W4) www exports india net.
(W5) www india world co. in.

220
CHAPTER – 5
RESEARCH RESULT
5 .1 INTRODUCTION
5 .2 CLASSIFICATION & TABULISATION
5 .3 ANALYSIS OF CLASSIFICATION &
TABULISATION
221
5.1 INTRODUCTION :
In this chapter researcher has discussed about PROBLEMS AND
REMEDIES OF PROCESS HOUSES OF SOUTH GUJARAT
REGION.
Researcher has visited process houses of south Gujarat region and
asked questions included in the quetionary. Out of this quetionery he
has prepared Tables.

222
5.2 CLASSIFICATION & TABULISATION
Table No . 5 .2 .1 LABOUR PROBLEMS FACED BY
THE ENTREPRENEURS IN PROCESS INDUSTRIES
PROBLEMS Very
High
High Aver
-age
Less Very
Less
Tota l
(A) Ineff ic ient Labour
- - - 1 - 1
(B) Insuff ic ient Labour Supply
- - - 1 1 2
(C) High Labour
turn over
2 - - 1 2 -1
(D) Absenteeism 1 2 - 1 - -2
(E) Indus t r ia l Bargaining
- 1 - - - -1
(F) Under Perfo rmance
- - 1 2 - 3
(G) Wastage of t ime - - - 1 - 1
(H) Lack of Punctual i ty
- 1 - 1 - 0
( I ) Wastage of raw mater ia l
- 1 - 3 - 2
(J ) Careless Behavior
- 1 1 2 2 4
9
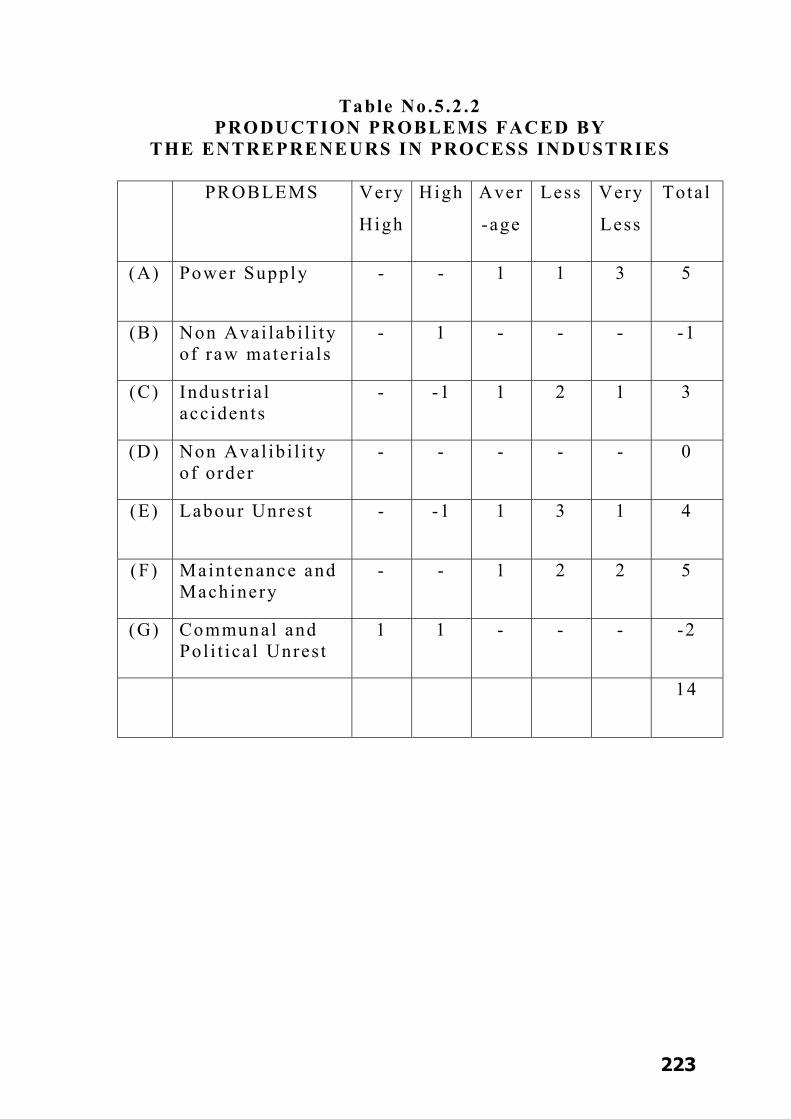
223
Table No .5 .2 .2 PRODUCTION PROBLEMS FACED BY
THE ENTREPRENEURS IN PROCESS INDUSTRIES
PROBLEMS Very
High
High Aver
-age
Less Very
Less
Tota l
(A) Power Supply - - 1 1 3 5
(B) Non Avai labi l i ty of raw mater ia ls
- 1 - - - -1
(C) Indust r ia l acc idents
- -1 1 2 1 3
(D) Non Aval ib i l i ty of order
- - - - - 0
(E) Labour Unres t - -1 1 3 1 4
(F) Maintenance and Machinery
- - 1 2 2 5
(G) Communal and Pol i t ica l Unres t
1 1 - - - -2
14

224
Table No .5 .2 .3 RAW MATERIALS PROBLEMS FACED BY
THE ENTREPRENEURS IN PROCESS INDUSTRIES
PROBLEMS Very
High
High Aver
-age
Less Very
Less
Tota l
(A) Inadequate supply
- - - 1 2 3
(B) Was tage 1 1 - - - -2
(C) Pi l ferage - 1 1 3 2 5
(D) Storage and Maintenance
- - - 1 - 1
(E) High Pr ice - 1 - 2 3 4
(F) Import Hurd les - - - 1 1 2
(G) High logis t ic cos t
1 2 - - - -3
(H) Poor qual i ty - 1 - 2 1 2
12

225
Table No .5 .2 .4 MAJOR PROBLEMS FACED BY
THE ENTREPRENEURS IN PROCESS INDUSTRIES
PROBLEMS Very
High
High Aver
-age
Less Very
Less
Tota l
(A) Government Rules & Regula t ions
1 2 - - - -3
(B) Compet i t ions - 1 - 2 1 2
(C) Socia l Act iv i t ies and Protes ts
- - 1 1 2 4
(D) Technologica l Change
- 1 - - - -1
(E) Lack of Finance - -1 - 2 1 2
(F) Lack of Orders - - - 1 1 2
(G) Labour Problems - 1 - 2 - 1
7

226
Table no. 5.2.5 Kind of Processing in UnitS :
Process
No. of
Entrepreneurs
(A) Dyeing 16
(B) Printing 11
(C) Bleaching 14
(D) Other 9
Total 50 1
Table no. 5.2.6 Reasons for undertaking specific process activity.
Process No. of Entrepreneurs
(A) Profitable Proposition 7
(B) Availability of orders 14
(C) Convenient Support Facility 12
(D) Less Competition 10
(E) Any Other 8
Total 50 1
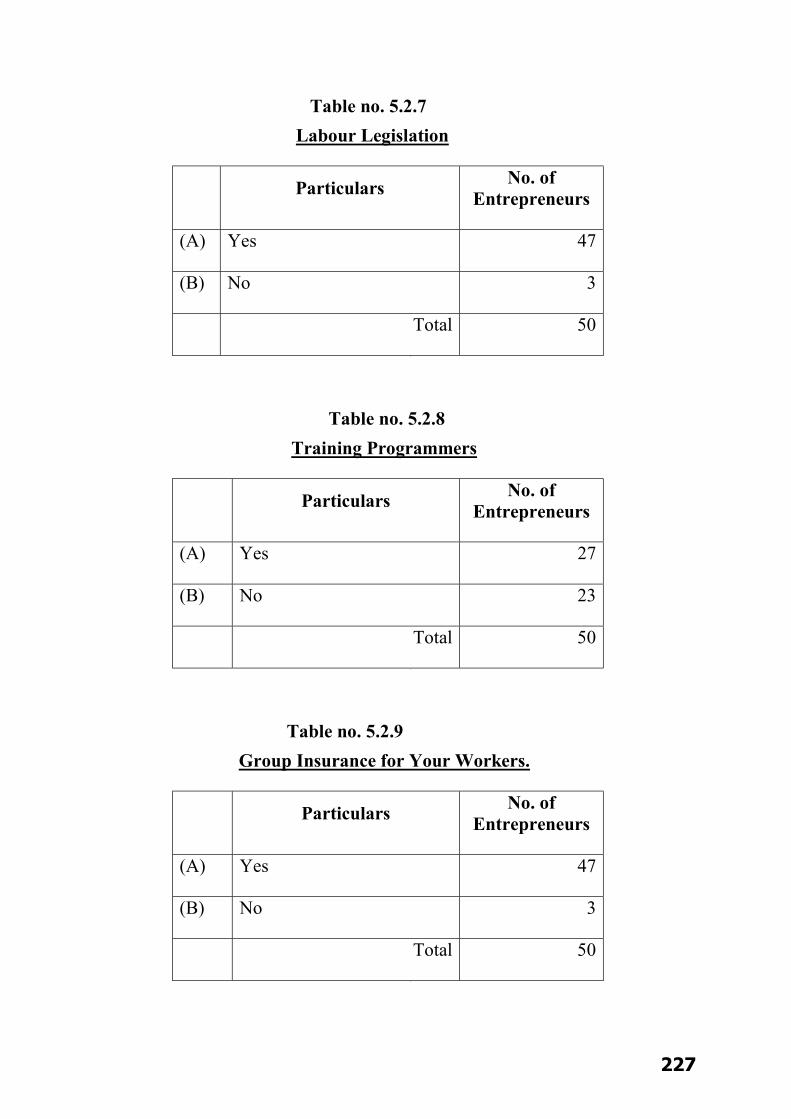
227
Table no. 5.2.7 Labour Legislation
Particulars No. of Entrepreneurs
(A) Yes 47
(B) No 3
Total 50 1
Table no. 5.2.8 Training Programmers
Particulars No. of Entrepreneurs
(A) Yes 27
(B) No 23
Total 50 1
Table no. 5.2.9
Group Insurance for Your Workers.
Particulars No. of Entrepreneurs
(A) Yes 47
(B) No 3
Total 50 1
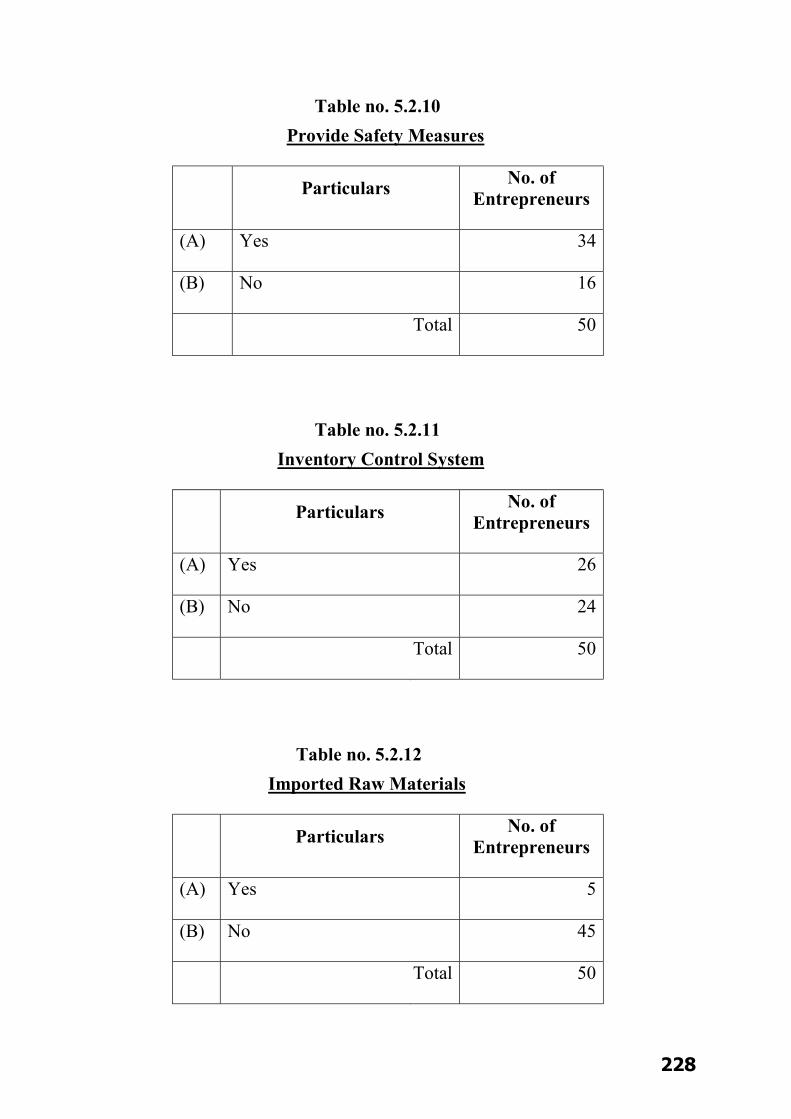
228
Table no. 5.2.10 Provide Safety Measures
Particulars No. of Entrepreneurs
(A) Yes 34
(B) No 16
Total 50
Table no. 5.2.11 Inventory Control System
Particulars No. of Entrepreneurs
(A) Yes 26
(B) No 24
Total 50 1
Table no. 5.2.12 Imported Raw Materials
Particulars No. of Entrepreneurs
(A) Yes 5
(B) No 45
Total 50 1
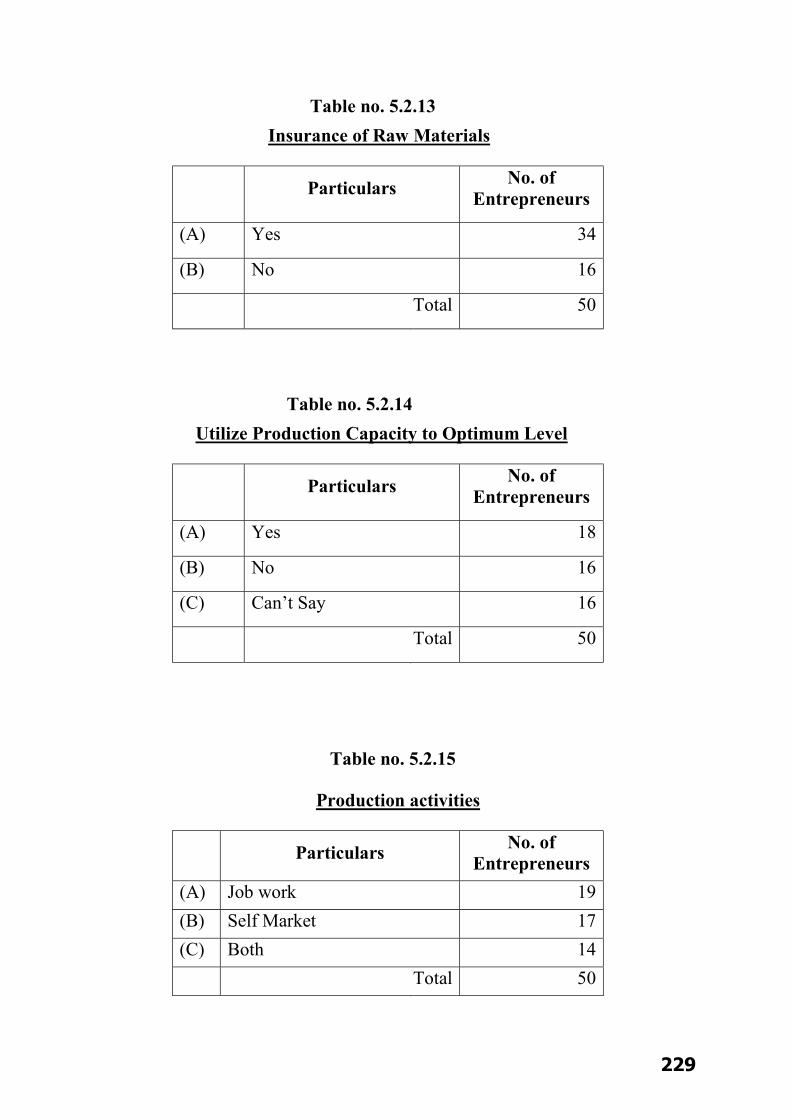
229
Table no. 5.2.13 Insurance of Raw Materials
Particulars No. of Entrepreneurs
(A) Yes 34
(B) No 16
Total 50 1
Table no. 5.2.14 Utilize Production Capacity to Optimum Level
Particulars No. of Entrepreneurs
(A) Yes 18
(B) No 16
(C) Can’t Say 16
Total 50 1
Table no. 5.2.15
Production activities
Particulars No. of Entrepreneurs
(A) Job work 19 (B) Self Market 17 (C) Both 14 Total 50
1
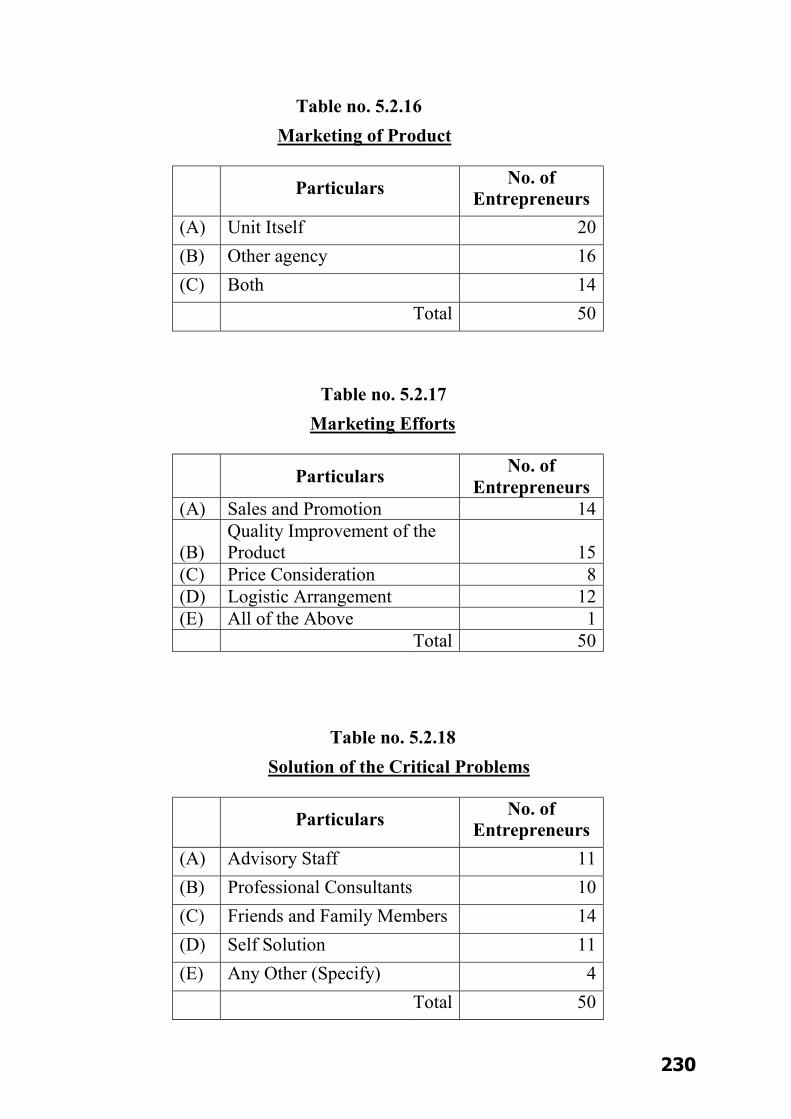
230
Table no. 5.2.16 Marketing of Product
Particulars No. of Entrepreneurs
(A) Unit Itself 20 (B) Other agency 16 (C) Both 14 Total 50
Table no. 5.2.17
Marketing Efforts
Particulars No. of Entrepreneurs
(A) Sales and Promotion 14
(B) Quality Improvement of the Product 15
(C) Price Consideration 8 (D) Logistic Arrangement 12 (E) All of the Above 1 Total 50
1
Table no. 5.2.18 Solution of the Critical Problems
Particulars No. of Entrepreneurs
(A) Advisory Staff 11 (B) Professional Consultants 10 (C) Friends and Family Members 14 (D) Self Solution 11 (E) Any Other (Specify) 4 Total 50
1
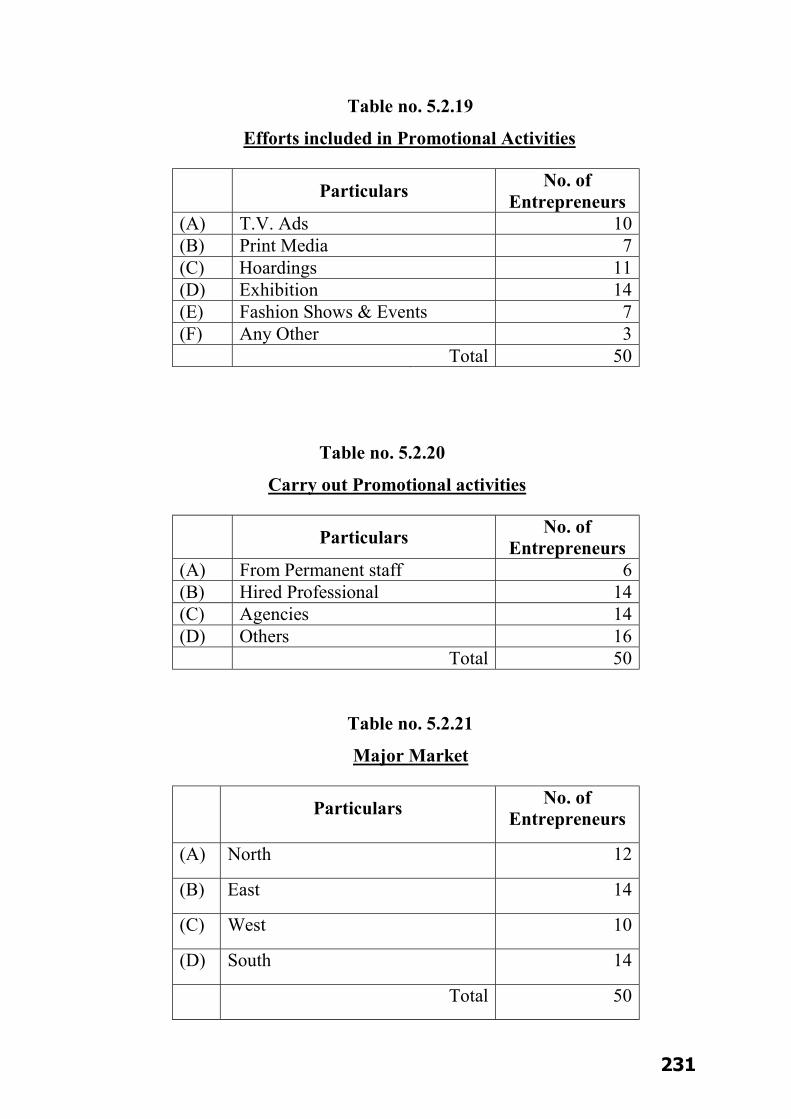
231
Table no. 5.2.19
Efforts included in Promotional Activities
Particulars No. of Entrepreneurs
(A) T.V. Ads 10 (B) Print Media 7 (C) Hoardings 11 (D) Exhibition 14 (E) Fashion Shows & Events 7 (F) Any Other 3 Total 50
1
Table no. 5.2.20
Carry out Promotional activities
Particulars No. of Entrepreneurs
(A) From Permanent staff 6 (B) Hired Professional 14 (C) Agencies 14 (D) Others 16 Total 50
Table no. 5.2.21
Major Market
Particulars No. of Entrepreneurs
(A) North 12
(B) East 14
(C) West 10
(D) South 14
Total 50
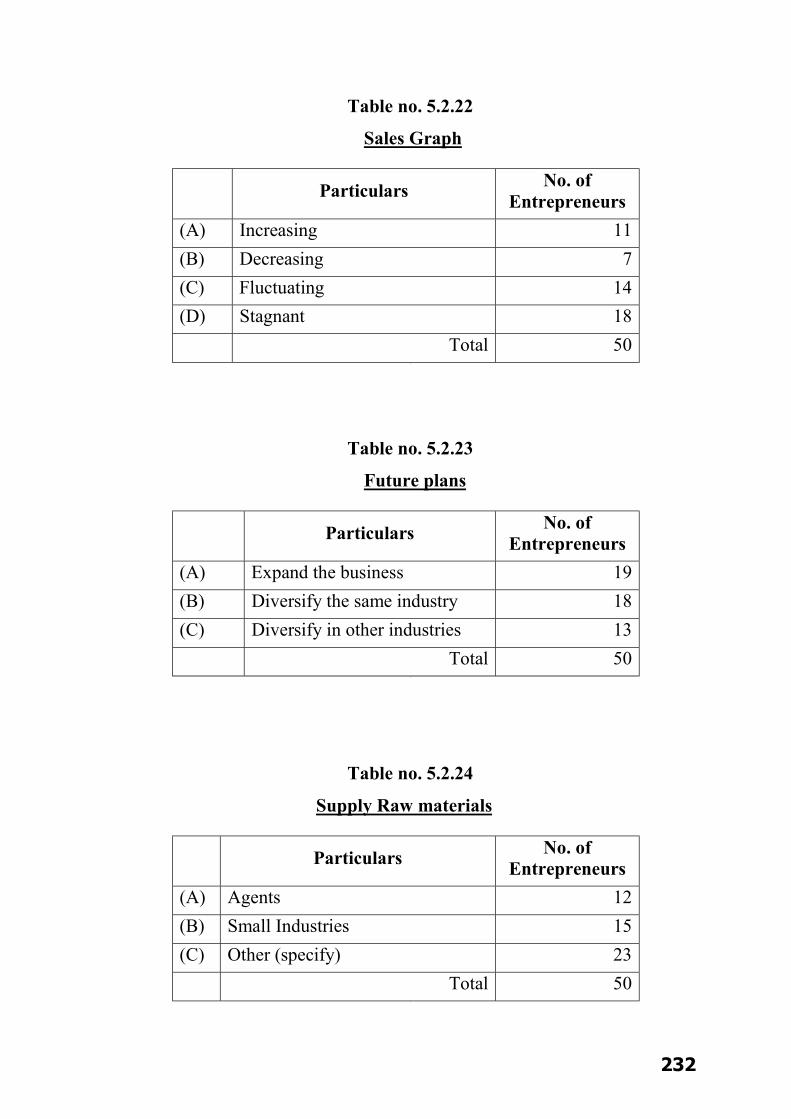
232
Table no. 5.2.22
Sales Graph
Particulars No. of Entrepreneurs
(A) Increasing 11 (B) Decreasing 7 (C) Fluctuating 14 (D) Stagnant 18 Total 50
1
Table no. 5.2.23
Future plans
Particulars No. of Entrepreneurs
(A) Expand the business 19 (B) Diversify the same industry 18 (C) Diversify in other industries 13 Total 50
1
Table no. 5.2.24
Supply Raw materials
Particulars No. of Entrepreneurs
(A) Agents 12 (B) Small Industries 15 (C) Other (specify) 23 Total 50
1
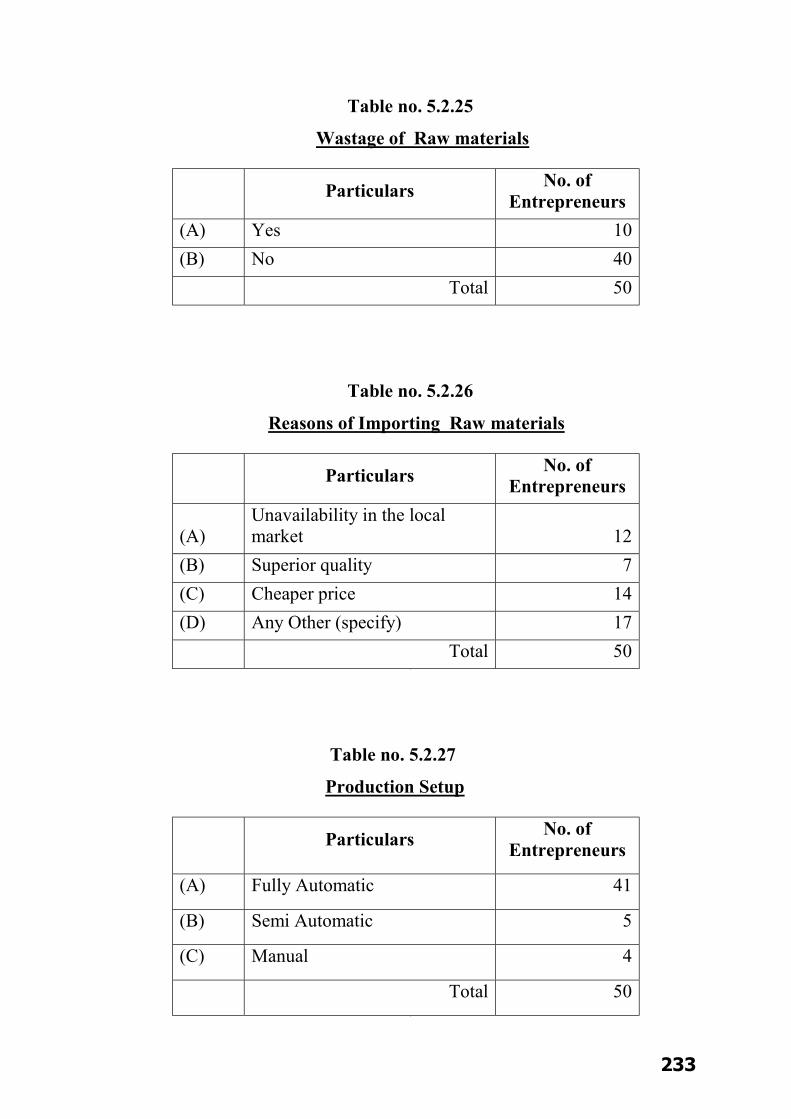
233
Table no. 5.2.25
Wastage of Raw materials
Particulars No. of Entrepreneurs
(A) Yes 10 (B) No 40 Total 50
Table no. 5.2.26
Reasons of Importing Raw materials
Particulars No. of Entrepreneurs
(A) Unavailability in the local market 12
(B) Superior quality 7 (C) Cheaper price 14 (D) Any Other (specify) 17 Total 50
1
Table no. 5.2.27
Production Setup
Particulars No. of Entrepreneurs
(A) Fully Automatic 41
(B) Semi Automatic 5
(C) Manual 4
Total 50 1

234
Table no. 5.2.28 Kind of Planning
Particulars No. of Entrepreneurs
(A) Weekly 6 (B) Fortnightly 14 (C) Monthly 16 (D) Quartely 14 Total 37
Table no. 5.2.29 Number of Association
Particulars No. of Entrepreneurs
(A) Yes 20 (B) No 12 (C) Cant’s Say 18 Total 50
1
Table no. 5.2.30 Financial Performance :
Particulars No. of Entrepreneurs
(A) Excellent 14 (B) Very good 12 (C) Good 4 (D) Bad 12 (E) Worst 8 Total 50
1

235
Table no. 5.2.31 Rate overall performance
Particulars No. of Entrepreneurs
(A) Extra ordinary 9 (B) Very good 11 (C) Good 12 (D) Poor 4 (E) Worst 14 Total 50
1
Table no. 5.2.32 Right type of Labour :
Particulars No. of Entrepreneurs
(A) More than sufficient 7 (B) Sufficient 23 (C) Manageable 12 (D) Insufficient 7 (E) Very less 1 Total 50
1
Table no. 5.2.33 Labor laws are hindrance to the progress of the industry :
Particulars
No. of
Entrepreneurs
(A) Agree 15
(B) Disagree 15
(C) Can’t say 20
Total 50
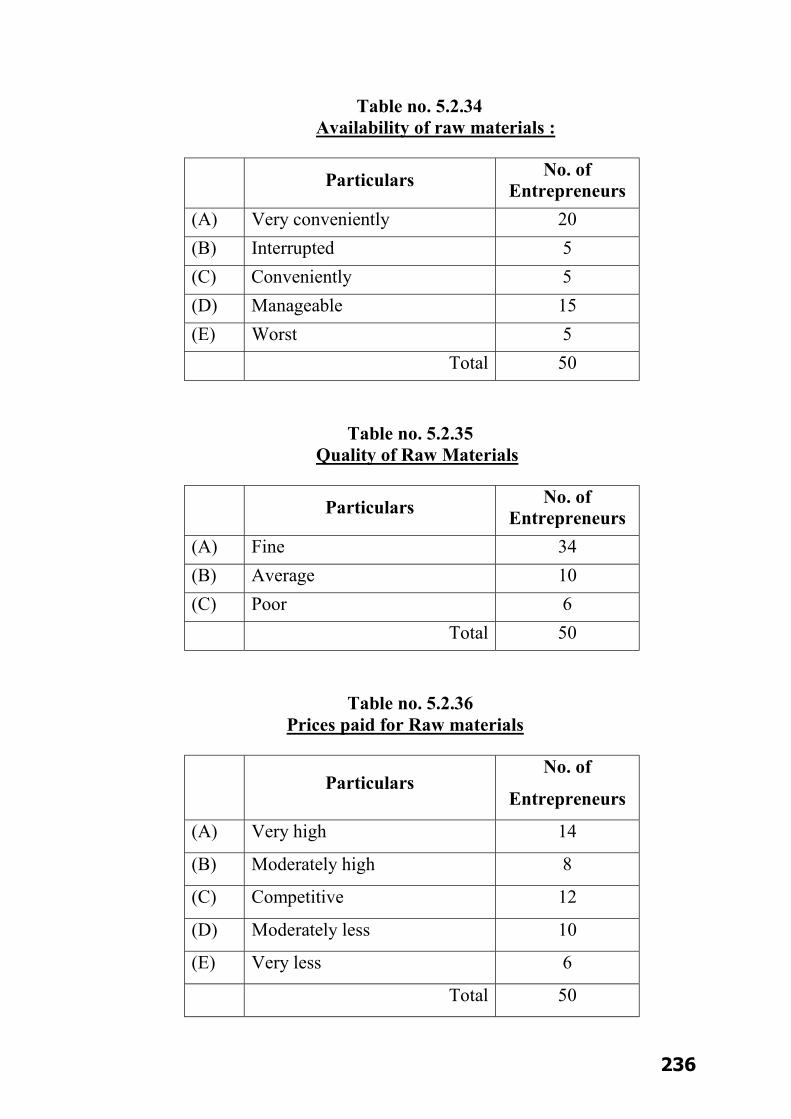
236
Table no. 5.2.34 Availability of raw materials :
Particulars No. of Entrepreneurs
(A) Very conveniently 20 (B) Interrupted 5 (C) Conveniently 5 (D) Manageable 15 (E) Worst 5 Total 50
Table no. 5.2.35 Quality of Raw Materials
Particulars No. of Entrepreneurs
(A) Fine 34 (B) Average 10 (C) Poor 6 Total 50
Table no. 5.2.36 Prices paid for Raw materials
Particulars
No. of
Entrepreneurs
(A) Very high 14
(B) Moderately high 8
(C) Competitive 12
(D) Moderately less 10
(E) Very less 6
Total 50

237
Table No .5 .2 .37
Problems Faced In Terms of Labour
Sr. Labour Problems Rank
(A) Ineff ic ient Labour 10
(B) Insuff ic ient Labour Supply 9
(C) High Labour Turn Over 1
(D) Absenters 7
(E) Indust r ia l Bargaining 8
(F) Under – Performance 2
(G) Wastage of Time 4
(H) Lack of Punctual i ty 6
(I) Wastage of Raw Mater ia l 3
(J) Care less Behaviour 5
Table No . 5 .2 .38 Major Problems in Terms of Raw Materia ls
Sr. Raw Material Problems Rank
(A) Inadequate Supply 3
(B) Wastage 1
(C) Pi l ferage 7
(D) Sto rage and Maintenance 2
(E) High Pr ice 5
(F) Impor t Hurdles 6
(G) High Logis t ic Cost 4

238
Table No .5 .2 .39 Major Reasons of Disconnect ing Product ion
Sr. Major Reason Disconnecting Productions Rank
(A) Power Supply 1
(B) Maintenance and Machinery 4
(C) Labour Unres t 2
(D) Indust r ia l Accidents 5
(E) Non-Avai labi l i ty of Raw Mater ia ls 3
(F) Non-Avai labi l i ty of Order --
(G) Commual and Pol i t ica l Unres t --
Table No .5 .2 .40 Major Problems in the Process Industr ies
Sr. Problems in the Process Industries Rank
(A) Government Rules and Regula t ions 3
(B) Compet i t ions 1
(C) Socia l Act iv is ts and Protes ts 6
(D) Technological Change 5
(E) Lack of Finance 4
(F) Lack of Orders 7
(G) Labour Problems 2
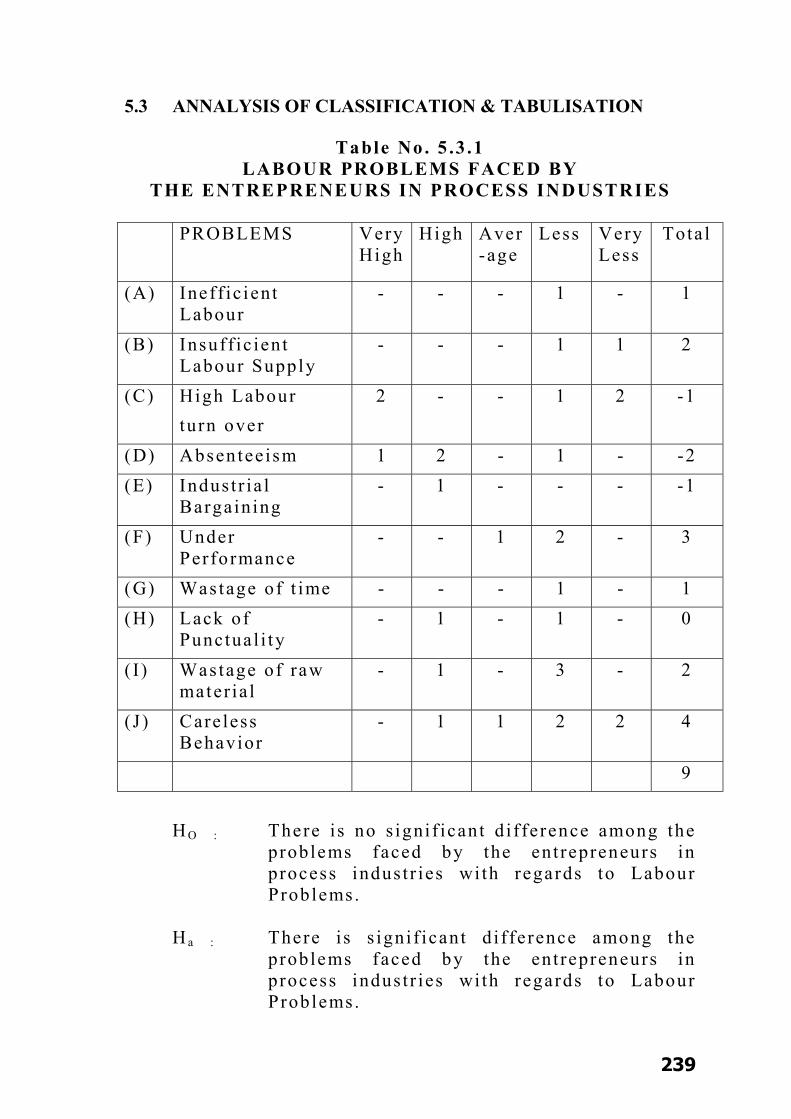
239
5.3 ANNALYSIS OF CLASSIFICATION & TABULISATION
Table No . 5 .3 .1 LABOUR PROBLEMS FACED BY
THE ENTREPRENEURS IN PROCESS INDUSTRIES
PROBLEMS Very High
High Aver-age
Less Very Less
Tota l
(A) Ineff ic ient Labour
- - - 1 - 1
(B) Insuff ic ient Labour Supply
- - - 1 1 2
(C) High Labour turn over
2 - - 1 2 -1
(D) Absenteeism 1 2 - 1 - -2 (E) Indus t r ia l
Bargaining - 1 - - - -1
(F) Under Perfo rmance
- - 1 2 - 3
(G) Wastage of t ime - - - 1 - 1 (H) Lack of
Punctual i ty - 1 - 1 - 0
( I ) Wastage of raw mater ia l
- 1 - 3 - 2
(J ) Careless Behavior
- 1 1 2 2 4
9
H O : There i s no s igni f icant d i f ference among the
problems faced by the ent repreneurs in process indust r ies wi th regards to Labour Problems.
H a : There i s s igni f icant d i f ference among the
problems faced by the ent repreneurs in process indust r ies wi th regards to Labour Problems.
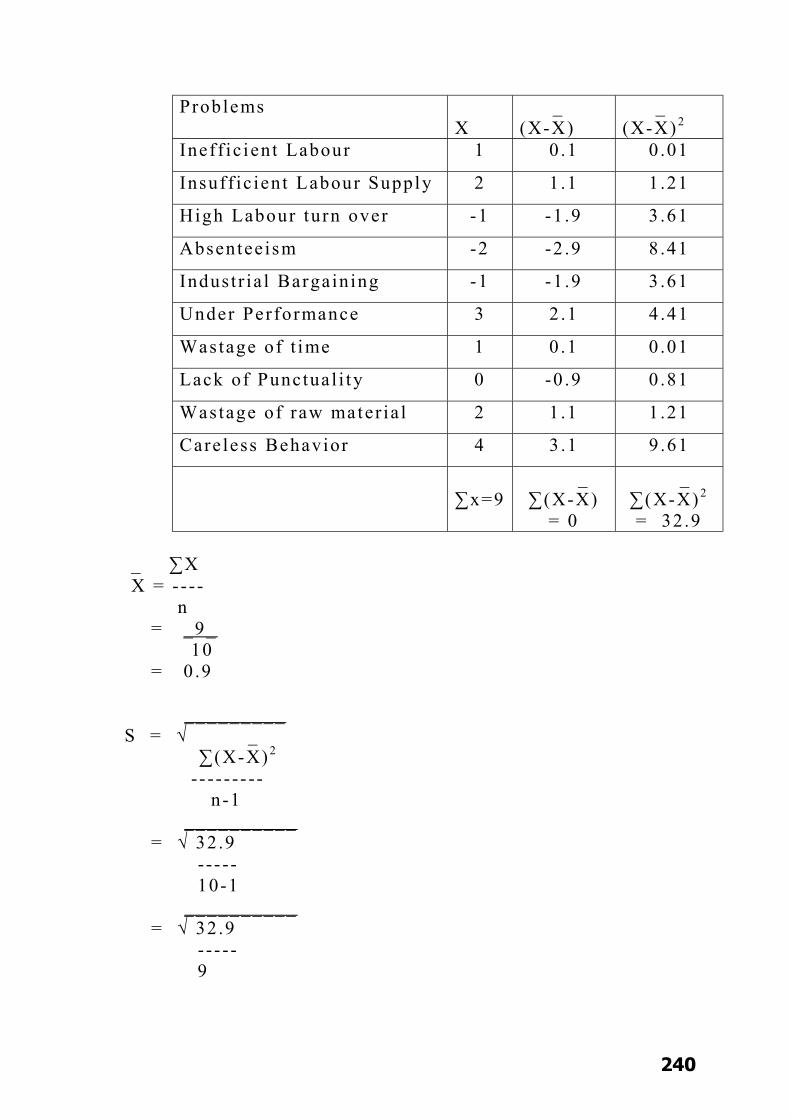
240
Problems X
_ (X-X)
_ (X-X)2
Ineff ic ient Labour 1 0 .1 0 .01
Insuff ic ient Labour Supply 2 1 .1 1 .21
High Labour turn over -1 -1 .9 3 .61
Absenteeism -2 -2 .9 8 .41
Indust r ia l Bargaining -1 -1 .9 3 .61
Under Performance 3 2 .1 4 .41
Wastage of t ime 1 0 .1 0 .01
Lack of Punctual i ty 0 -0 .9 0 .81
Wastage of raw mater ia l 2 1 .1 1 .21
Care less Behavior 4 3 .1 9 .61
∑x=9
_ ∑ (X-X)
= 0
_ ∑ (X-X) 2
= 32 .9 _ ∑X X = - - - - n = _9_ 10 = 0 .9 _________ S = √ _
∑ (X-X) 2 - - - - - - - - - n -1 __________ = √ 32 .9 - - - - - 10-1 __________ = √ 32 .9 - - - - - 9

241
__________ = √ 3 .65 S = 1 .91 _ __ t c = (X - µ) √ n - - - - - - - - x S ___ = (0 .9-0) √ 10 - - - - - - - - x 1 .91 = 0 .9 x 3 .16 - - - - - - - - - - - - 1 .91 t c = 1 .48 Degree o f f reedom = n-1 = 10-1 = 9 Table va lue of t a t 5% level and Degree o f f reedom 9 t t = 2 .26
Calcula ted value of t i s less than i t s t able value .
Test i s ins igni f icant
Null hypothes is accepted
Alternat ive Hypothes is Rejec ted
Entrepreneur faced Labour Problem
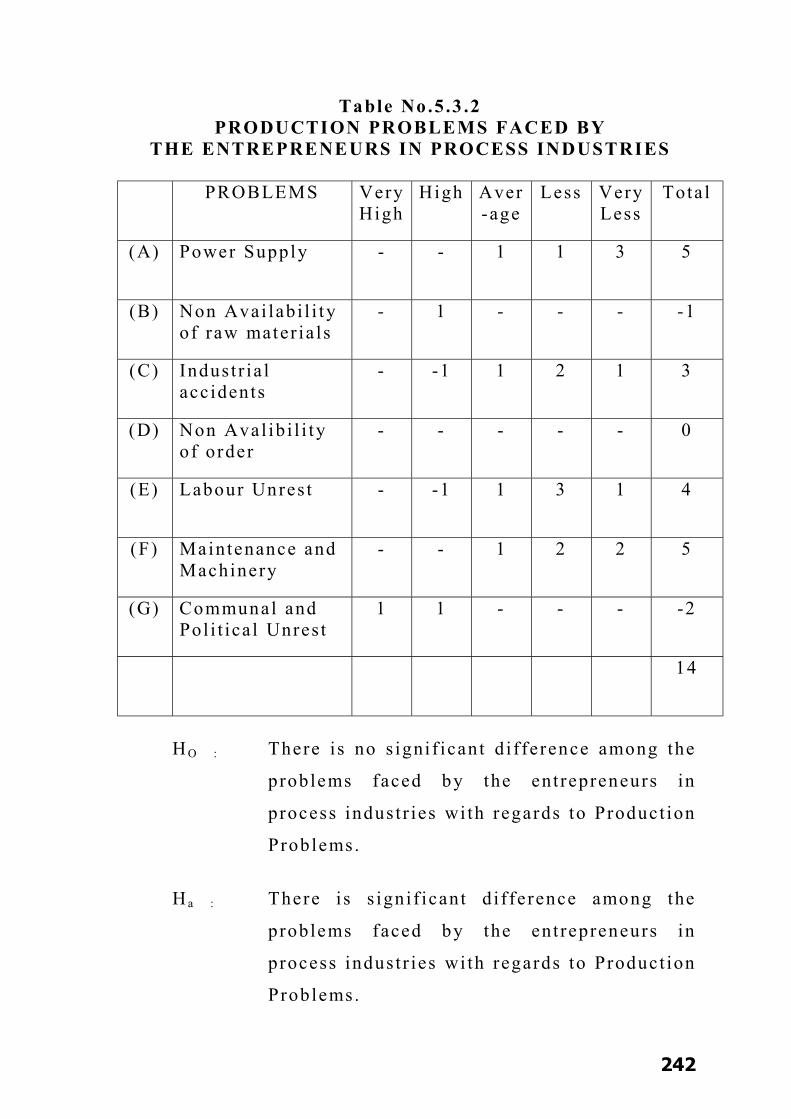
242
Table No .5 .3 .2 PRODUCTION PROBLEMS FACED BY
THE ENTREPRENEURS IN PROCESS INDUSTRIES
PROBLEMS Very High
High Aver-age
Less Very Less
Tota l
(A) Power Supply - - 1 1 3 5
(B) Non Avai labi l i ty of raw mater ia ls
- 1 - - - -1
(C) Indust r ia l acc idents
- -1 1 2 1 3
(D) Non Aval ib i l i ty of order
- - - - - 0
(E) Labour Unres t - -1 1 3 1 4
(F) Maintenance and Machinery
- - 1 2 2 5
(G) Communal and Pol i t ica l Unres t
1 1 - - - -2
14
H O : There i s no s igni f icant d i f ference among the
problems faced by the ent repreneurs in
process indust r ies wi th regards to Product ion
Problems.
H a : There i s s igni f icant d i f ference among the
problems faced by the ent repreneurs in
process indust r ies wi th regards to Product ion
Problems.
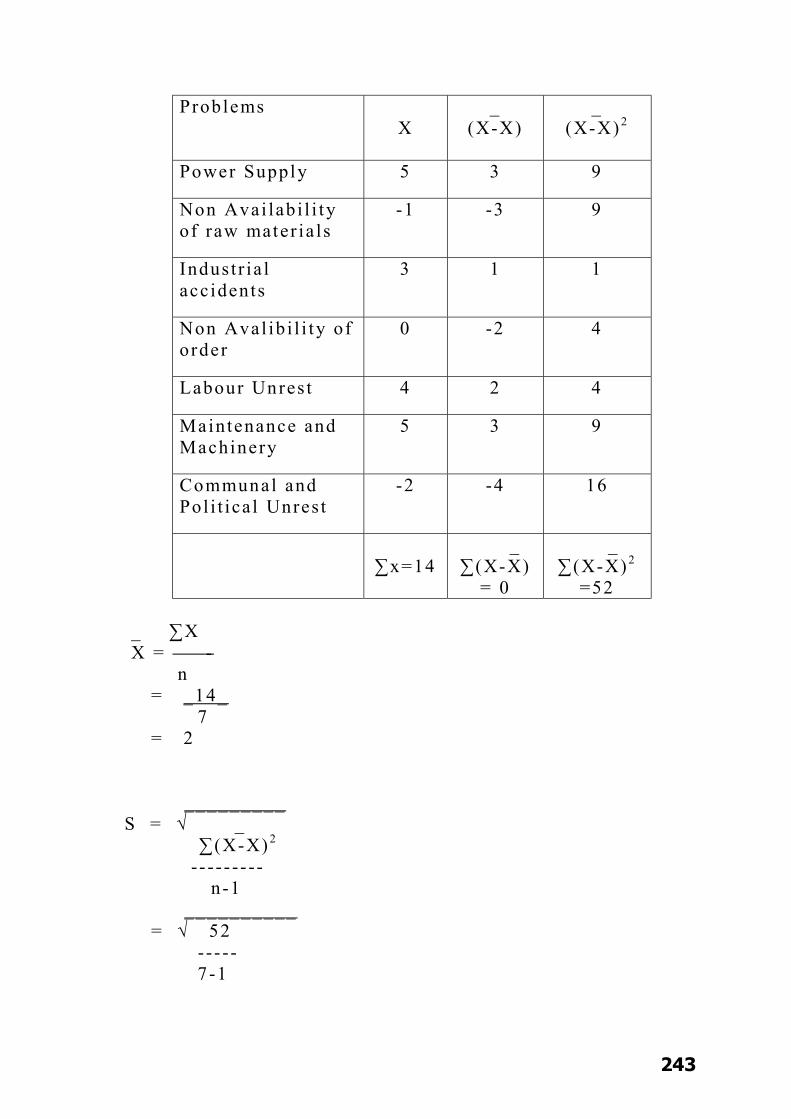
243
Problems X
_ (X-X)
_ (X-X)2
Power Supply 5 3 9
Non Avai labi l i ty of raw mater ia ls
-1 -3 9
Indust r ia l acc idents
3 1 1
Non Aval ib i l i ty of order
0 -2 4
Labour Unres t 4 2 4
Maintenance and Machinery
5 3 9
Communal and Pol i t ica l Unres t
-2 -4 16
∑x=14
_ ∑ (X-X)
= 0
_ ∑ (X-X) 2
=52 _ ∑X X = - n = _14_ 7 = 2 _________ S = √ _
∑ (X-X) 2 - - - - - - - - - n -1 __________ = √ 52 - - - - - 7 -1

244
__________ = √ 52 - - - - - 6 __________ = √ 8 .67 S = 2 .94 _ __ t c = (X - µ) √ n - - - - - - - - x S ___ = (2-0) √ 7 - - - - - - - - x 2 .94 = 2 x 2 .65 - - - - - - - - - - - - 2 .94 t c = 1 .80 Degre of f reedom = n-1 = 7 -1 = 6 Table va lue of t a t 5% level and Degree o f f reedom 6 t t = 2 .45
Caldula td va lue of t i s less than i t s t able value .
Test i s ins igni f icant
Null hypothys is accepted
Alternat ive Hypothis is Rejec ted
Entreprenure faced Product ion Problem

245
Table No .5 .3 .3 RAW MATERIALS PROBLEMS FACED BY
THE ENTREPRENEURS IN PROCESS INDUSTRIES
PROBLEMS Very
High
High Aver
-age
Less Very
Less
Tota l
(A) Inadequate supply
- - - 1 2 3
(B) Was tage 1 1 - - - -2
(C) Pi l ferage - 1 1 3 2 5
(D) Storage and Maintenance
- - - 1 - 1
(E) High Pr ice - 1 - 2 3 4
(F) Import Hurd les - - - 1 1 2
(G) High logis t ic cos t
1 2 - - - -3
(H) Poor qual i ty - 1 - 2 1 2
12
H O : There i s no s igni f icant d i f ference among the
problems faced by the ent repreneurs in process
indust r ies wi th regards to Raw mater ia l Problems .
H a : There i s s igni f icant d i f ference among the
problems faced by the ent repreneurs in process
indust r ies wi th regards to Raw mater ia l Problems .
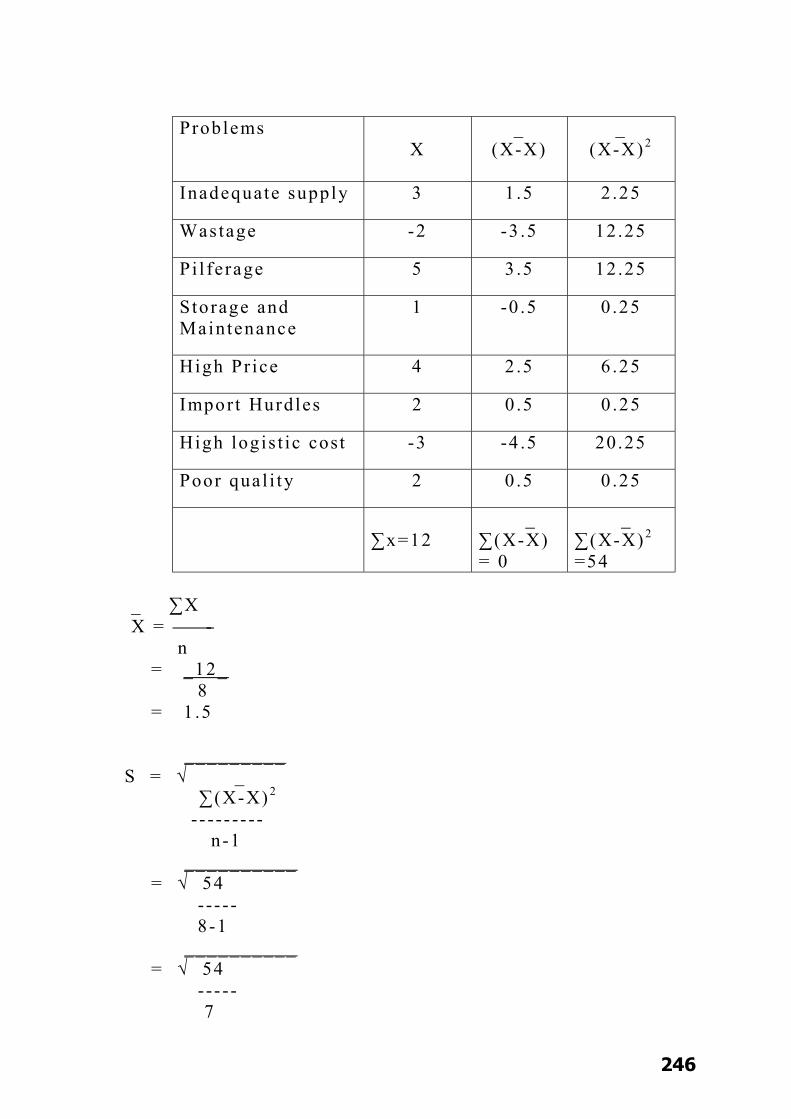
246
Problems
X _
(X-X) _
(X-X)2
Inadequate supply 3 1 .5 2 .25
Wastage -2 -3 .5 12.25
Pi l ferage 5 3 .5 12 .25
Sto rage and Maintenance
1 -0 .5 0 .25
High Pr ice 4 2 .5 6 .25
Impor t Hurdles 2 0 .5 0 .25
High logis t ic cost -3 -4 .5 20.25
Poor qual i ty 2 0 .5 0 .25
∑x=12
_ ∑ (X-X) = 0
_ ∑ (X-X) 2
=54 _ ∑X X = - n = _12_ 8 = 1 .5 _________ S = √ _
∑ (X-X) 2 - - - - - - - - - n -1 __________ = √ 54 - - - - - 8 -1 __________ = √ 54 - - - - - 7
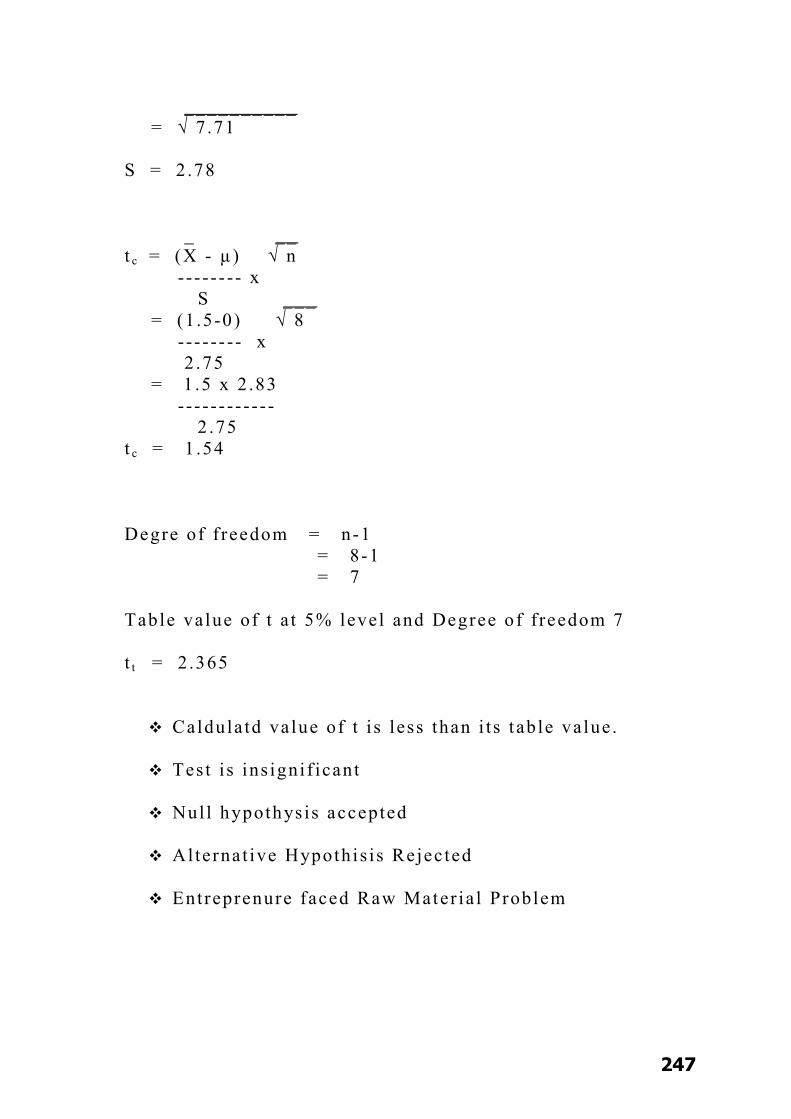
247
__________ = √ 7 .71 S = 2 .78 _ __ t c = (X - µ) √ n - - - - - - - - x S ___ = (1 .5-0) √ 8 - - - - - - - - x 2 .75 = 1 .5 x 2 .83 - - - - - - - - - - - - 2 .75 t c = 1 .54 Degre of f reedom = n-1 = 8 -1 = 7 Table va lue of t a t 5% level and Degree o f f reedom 7 t t = 2 .365
Caldula td va lue of t i s less than i t s t able value .
Test i s ins igni f icant
Null hypothys is accepted
Alternat ive Hypothis is Rejec ted
Entreprenure faced Raw Mater ia l Problem

248
Table No.5 .3 .4 MAJOR PROBLEMS FACED BY
THE ENTREPRENEURS IN PROCESS INDUSTRIES
PROBLEMS Very
High
High Aver
-age
Less Very
Less
Tota l
(A) Government Rules & Regula t ions
1 2 - - - -3
(B) Compet i t ions - 1 - 2 1 2
(C) Socia l Act iv i t ies and Protes ts
- - 1 1 2 4
(D) Technologica l Change
- 1 - - - -1
(E) Lack of Finance - -1 - 2 1 2
(F) Lack of Orders - - - 1 1 2
(G) Labour Problems - 1 - 2 - 1
7
H O : There i s no s igni f icant d i f ference among the
major problems faced by the ent repreneurs in
process indust r ies .
H a : There i s s igni f icant d i f ference among the major
problems faced by the ent repreneurs in process
indust r ies .

249
Problems
X _ (X-X)
_ (X-X)2
Government Rules & Regula t ions
-3 -4 16
Compet i t ions 2 1 1
Socia l Act iv i t ies and Protes ts
4 3 9
Technological Change
-1 -2 4
Lack of Finance 2 1 1
Lack of Orders 2 1 1
Labour Problems 1 0 0
∑x=7
_ ∑ (X-X)
= 0
_ ∑ (X-X) 2
=32 _ ∑X X = - n = _7_ 7 = 1 _________ S = √ _
∑ (X-X) 2 - - - - - - - - - n -1 __________ = √ 32 - - - - - 7 -1 __________ = √ 32 - - - - - 6

250
__________ = √ 5 .33 S = 2 .31 _ __ t c = (X - µ) √ n - - - - - - - - x S ___ = (1 -0) √ 7 - - - - - - - - x 2 .31 = 1 x 2 .65 - - - - - - - - - - - - 2 .31 t c = 1 .15 Degre of f reedom = n-1 = 7 -1 = 6 Table va lue of t a t 5% level and Degree o f f reedom 6 t t = 2 .447
Caldula td va lue of t i s less than i t s t able value .
Test i s ins igni f icant
Null hypothys is accepted
Alternat ive Hypothis is Rejec ted
Entreprenure faced Major Problem

251
5.3.5 Kind of Processing in UnitS :
(A) As per table no. 5.3.5 there is, out of fifty units, sixteen
units, are such that they under take dyeing and
percentage wise it is 32.
(B) Eleven units under the printing activity and percentage
wise amounts to 22.
(C) Fourteen units carry on Bleaching process and
percentage wise amounts to 28.
(D) Nine units carry out all types of authority like printing
dyeing bleaching etc. and percentage wise is 18.
Table no. 5.3.5
Kind of Processing in unit
Process
No. of
Entrepreneurs In %
(A) Dyeing 16 32
(B) Printing 11 22
(C) Bleaching 14 28
(D) Other 9 18
Total 50 100
Form the above table researcher can get the following diagram.
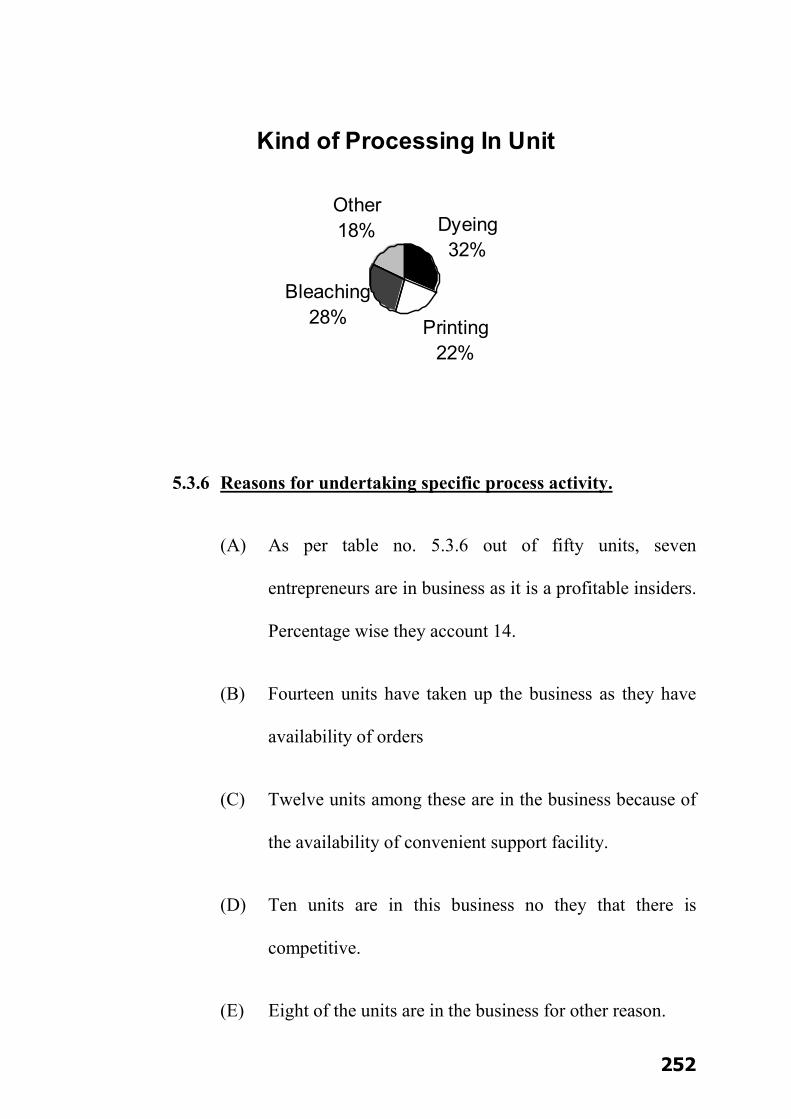
252
Kind of Processing In Unit
Dyeing32%
Printing22%
Bleaching28%
Other18%
5.3.6 Reasons for undertaking specific process activity.
(A) As per table no. 5.3.6 out of fifty units, seven
entrepreneurs are in business as it is a profitable insiders.
Percentage wise they account 14.
(B) Fourteen units have taken up the business as they have
availability of orders
(C) Twelve units among these are in the business because of
the availability of convenient support facility.
(D) Ten units are in this business no they that there is
competitive.
(E) Eight of the units are in the business for other reason.
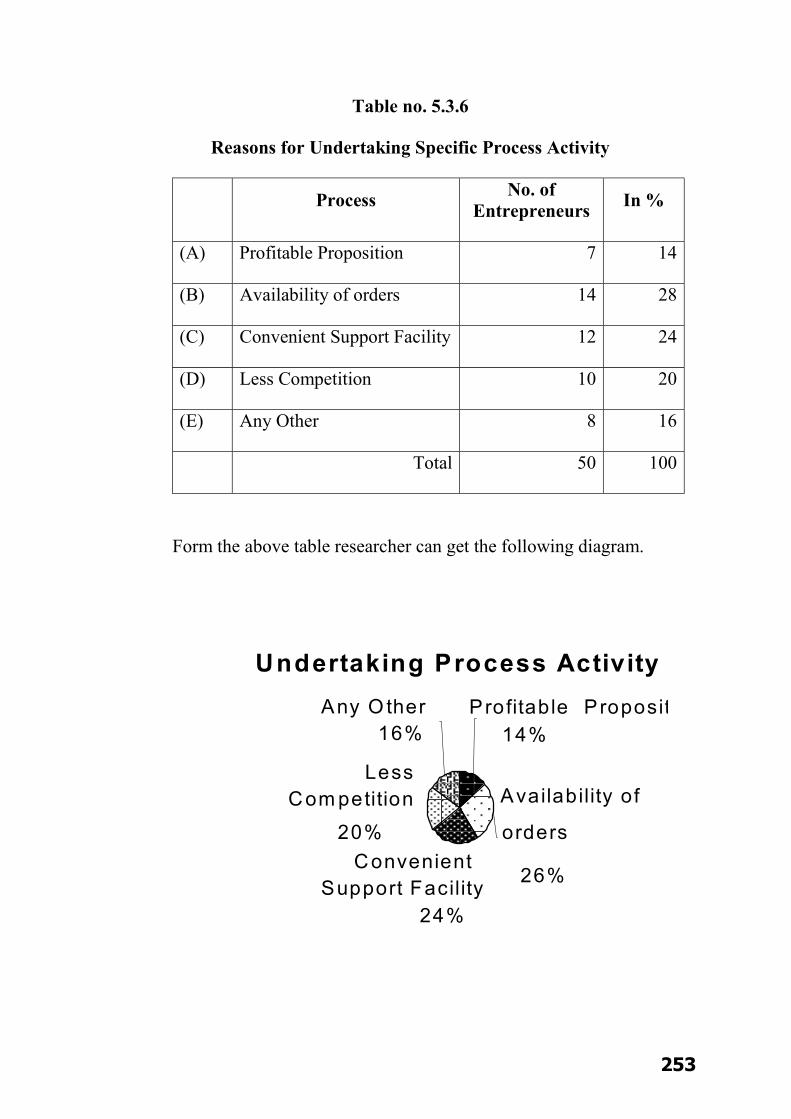
253
Undertaking Process Activity
Profitable Proposit14%
Availability of
orders
26% Convenient
Support Facility 24%
Less Com petition
20%
Any O ther 16%
Table no. 5.3.6
Reasons for Undertaking Specific Process Activity
Process No. of Entrepreneurs In %
(A) Profitable Proposition 7 14
(B) Availability of orders 14 28
(C) Convenient Support Facility 12 24
(D) Less Competition 10 20
(E) Any Other 8 16
Total 50 100
Form the above table researcher can get the following diagram.

254
Labo ur L eg astion
Yes94%
No6%
5.3.7 Labour Legislation :
As per table no. 5.3.7 out of fifty units fourty seven units
follow labour legislation. Two of the units do not follow labour
legislation. In percentage Third do not follow labour
legislation.
Table no. 5.3.7
Labour Legislation
Particulars No. of Entrepreneurs In %
(A) Yes 47 94
(B) No 3 6
Total 50 100
Form the above table researcher can get the following diagram.

255
Traning Programmers
Yes39%
No61%
5.3.8 Training Programmers
(A) As per table no. 5.3.8 there an Fifty units entrepreneurs,
out of which twenty seven units conduct training
program. Percentage wise they are 54.
(B) Fourty Three of the units do not conduct any training
program and percentage wise they are 46.
Table no. 5.3.8
Training Programmers
Particulars No. of Entrepreneurs In %
(A) Yes 27 54
(B) No 23 46
Total 50 100
Form the above table researcher can get the following diagram.
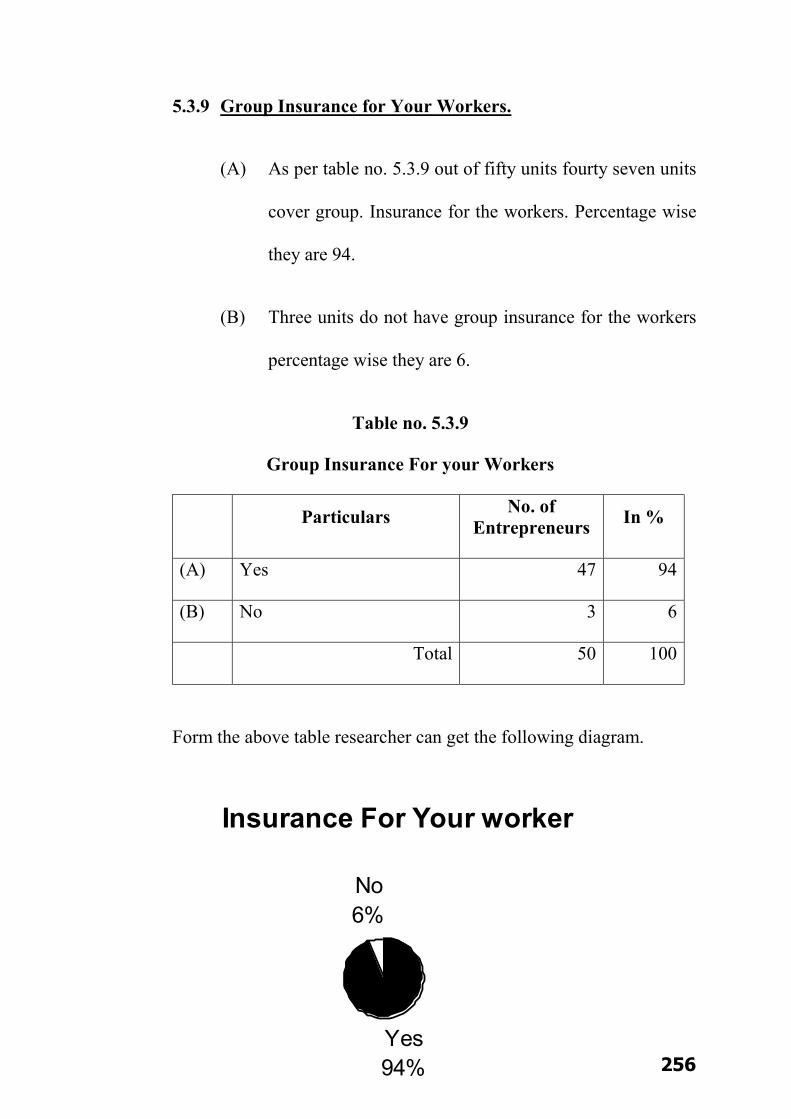
256
Insurance For Your worker
Yes94%
No6%
5.3.9 Group Insurance for Your Workers.
(A) As per table no. 5.3.9 out of fifty units fourty seven units
cover group. Insurance for the workers. Percentage wise
they are 94.
(B) Three units do not have group insurance for the workers
percentage wise they are 6.
Table no. 5.3.9
Group Insurance For your Workers
Particulars No. of Entrepreneurs In %
(A) Yes 47 94
(B) No 3 6
Total 50 100
Form the above table researcher can get the following diagram.
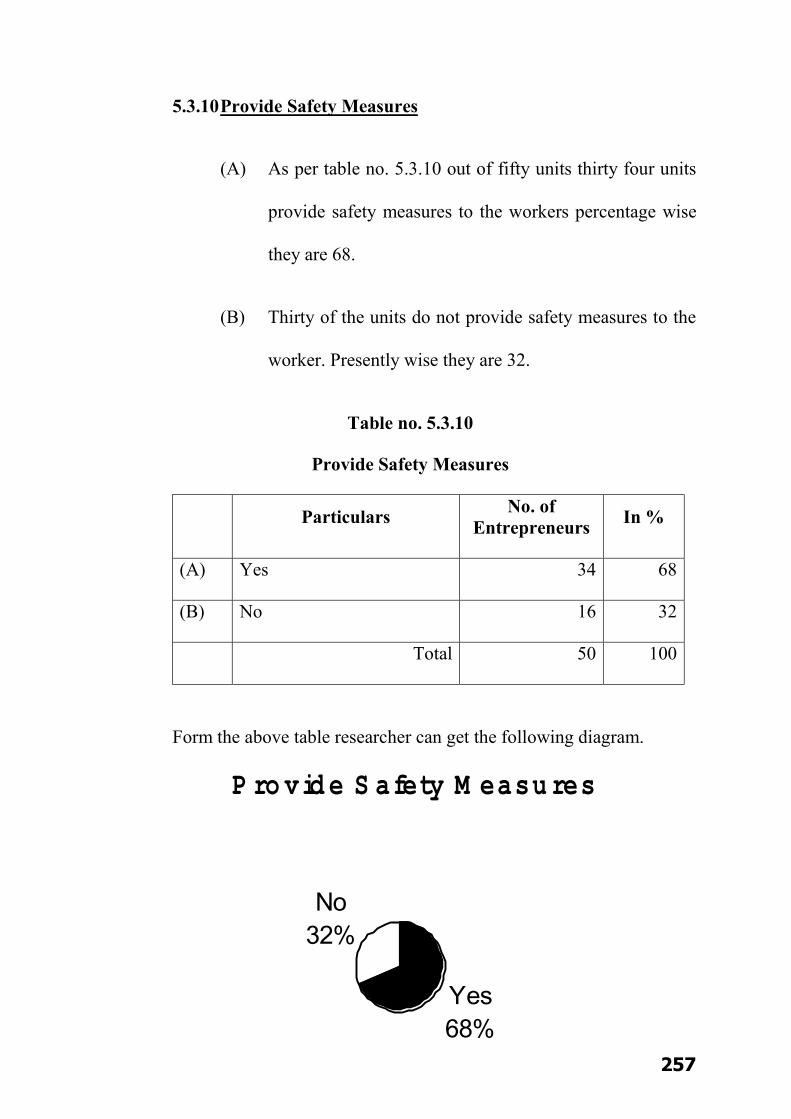
257
P ro vid e S afety M easu res
Yes68%
No32%
5.3.10 Provide Safety Measures
(A) As per table no. 5.3.10 out of fifty units thirty four units
provide safety measures to the workers percentage wise
they are 68.
(B) Thirty of the units do not provide safety measures to the
worker. Presently wise they are 32.
Table no. 5.3.10
Provide Safety Measures
Particulars No. of Entrepreneurs In %
(A) Yes 34 68
(B) No 16 32
Total 50 100
Form the above table researcher can get the following diagram.

258
Inventory C ontrol S ystem
Yes52%
No48%
5.3.11 Inventory Control System
(A) As per table no. 5.3.11 out of fifty units twenty six units
follow inventory control system. Percentage wise they
are 52.
(B) Fourty Eight of the units do not follow inventory control
system. Percentage wise they are 48.
Table no. 5.3.11
Inventory Control System
Particulars No. of Entrepreneurs In %
(A) Yes 26 52
(B) No 24 48
Total 50 100
Form the above table researcher can get the following diagram.

259
Im p o rted R aw M aterials
Y es10%
N o90%
5.3.12 Imported Raw Materials
As per table no. 5.3.12 out of fourty seven units, five of
entrepreneurs not use Imported Raw materials in percentage 10
Fourty five entrepreneurs do not use Imported Raw materials in
percentage 90.
Table no. 5.3.12
Imported Raw Materials
Particulars No. of Entrepreneurs In %
(A) Yes 5 10
(B) No 45 90
Total 50 100
Form the above table researcher can get the following diagram.
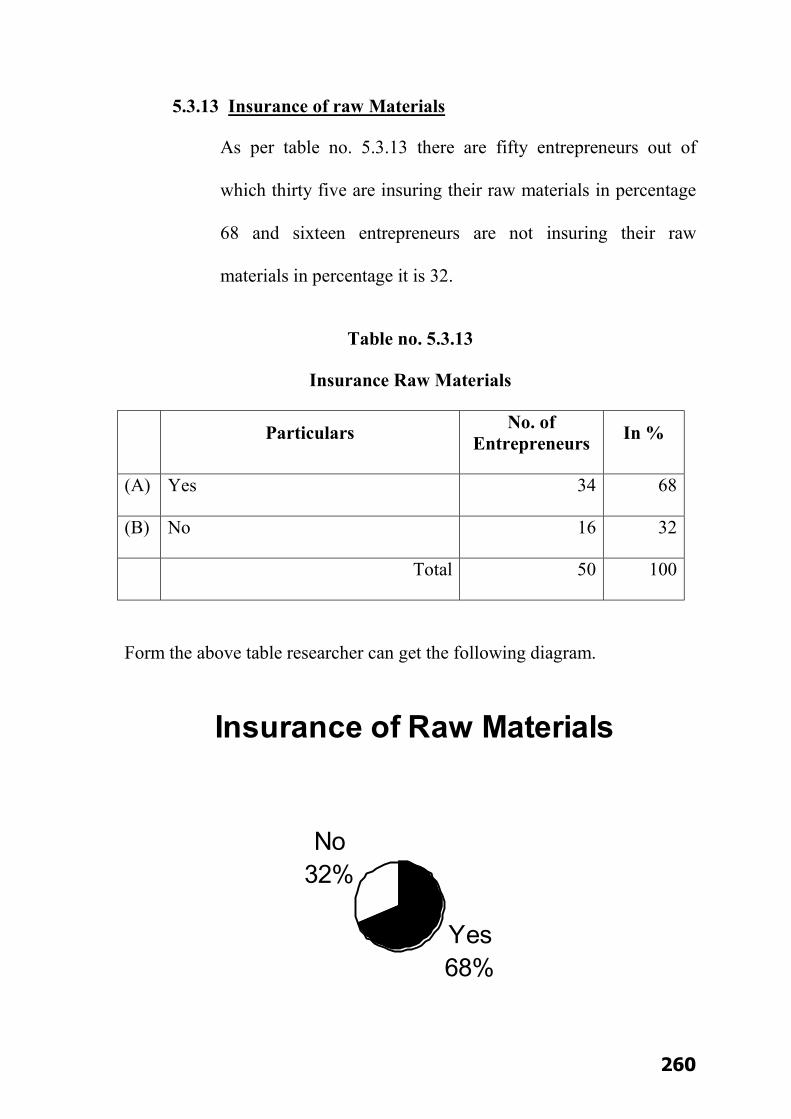
260
Insurance of Raw Materials
Yes68%
No32%
5.3.13 Insurance of raw Materials
As per table no. 5.3.13 there are fifty entrepreneurs out of
which thirty five are insuring their raw materials in percentage
68 and sixteen entrepreneurs are not insuring their raw
materials in percentage it is 32.
Table no. 5.3.13
Insurance Raw Materials
Particulars No. of Entrepreneurs In %
(A) Yes 34 68
(B) No 16 32
Total 50 100
Form the above table researcher can get the following diagram.
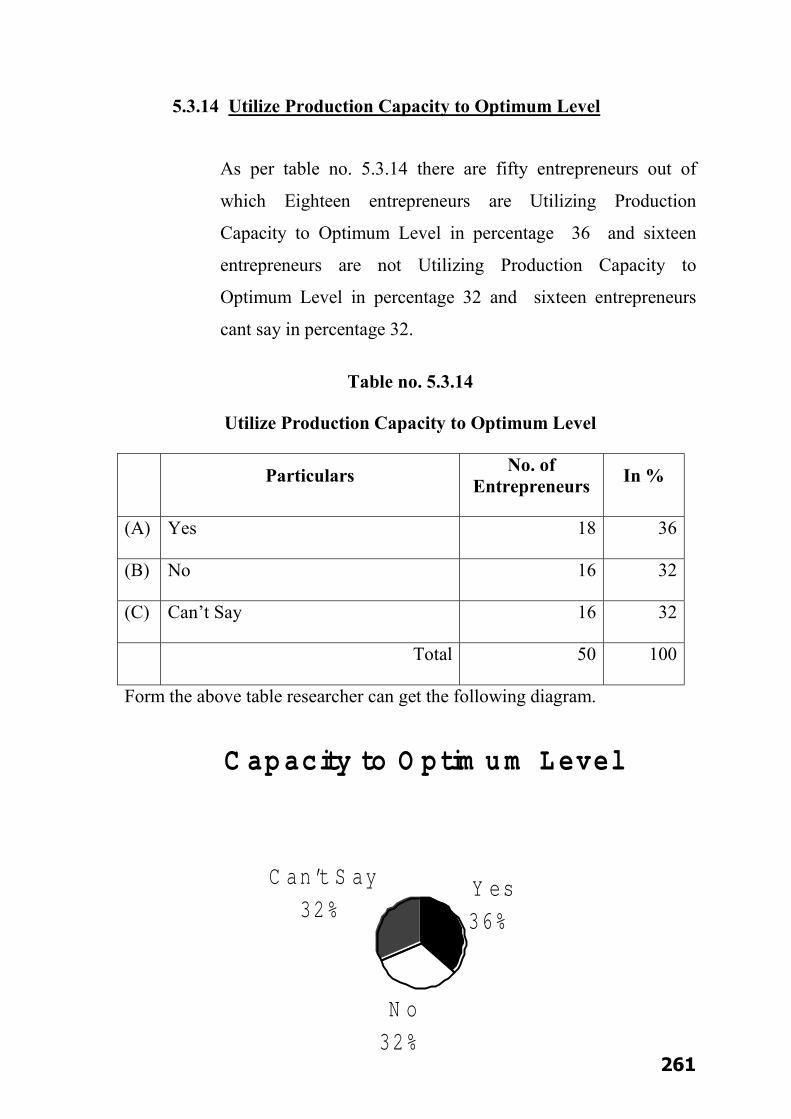
261
C ap acity to O p tim u m L evel
Y es36%
N o32%
C an’t S ay 32%
5.3.14 Utilize Production Capacity to Optimum Level
As per table no. 5.3.14 there are fifty entrepreneurs out of
which Eighteen entrepreneurs are Utilizing Production
Capacity to Optimum Level in percentage 36 and sixteen
entrepreneurs are not Utilizing Production Capacity to
Optimum Level in percentage 32 and sixteen entrepreneurs
cant say in percentage 32.
Table no. 5.3.14
Utilize Production Capacity to Optimum Level
Particulars No. of Entrepreneurs In %
(A) Yes 18 36
(B) No 16 32
(C) Can’t Say 16 32
Total 50 100
Form the above table researcher can get the following diagram.

262
Production Activity
Job work 38%
Self Market 34%
Both 28%
5.3.15 Production activities
As per table no. 5.3.15 there are fifty entrepreneurs out of
which Nineteen entrepreneurs are doing Job work in percentage
38, seventy entrepreneurs have their own market in percentage
34 and Fourty entrepreneurs use both in percentage 28.
Table no. 5.3.15
Production activities
Particulars No. of Entrepreneurs In %
(A) Job work 19 38
(B) Self Market 17 34
(C) Both 14 28
Total 50 100
Form the above table researcher can get the following diagram.
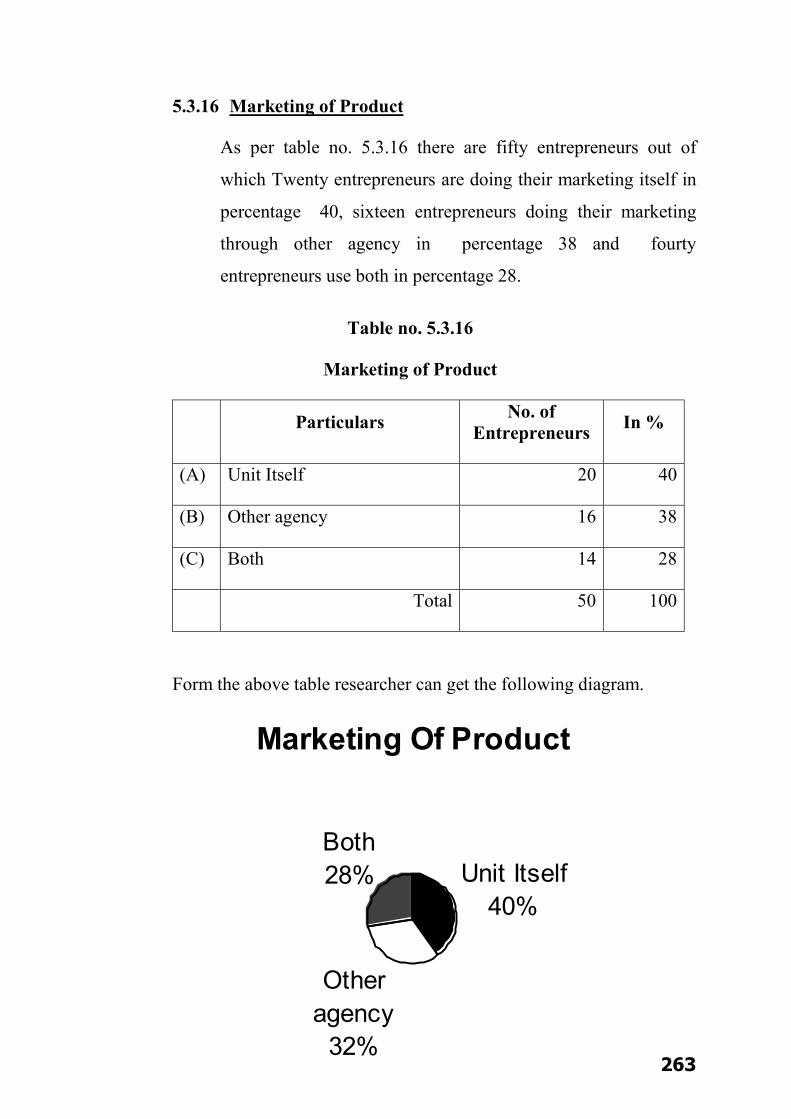
263
Marketing Of Product
Unit Itself40%
Other agency
32%
Both 28%
5.3.16 Marketing of Product
As per table no. 5.3.16 there are fifty entrepreneurs out of
which Twenty entrepreneurs are doing their marketing itself in
percentage 40, sixteen entrepreneurs doing their marketing
through other agency in percentage 38 and fourty
entrepreneurs use both in percentage 28.
Table no. 5.3.16
Marketing of Product
Particulars No. of Entrepreneurs In %
(A) Unit Itself 20 40
(B) Other agency 16 38
(C) Both 14 28
Total 50 100
Form the above table researcher can get the following diagram.
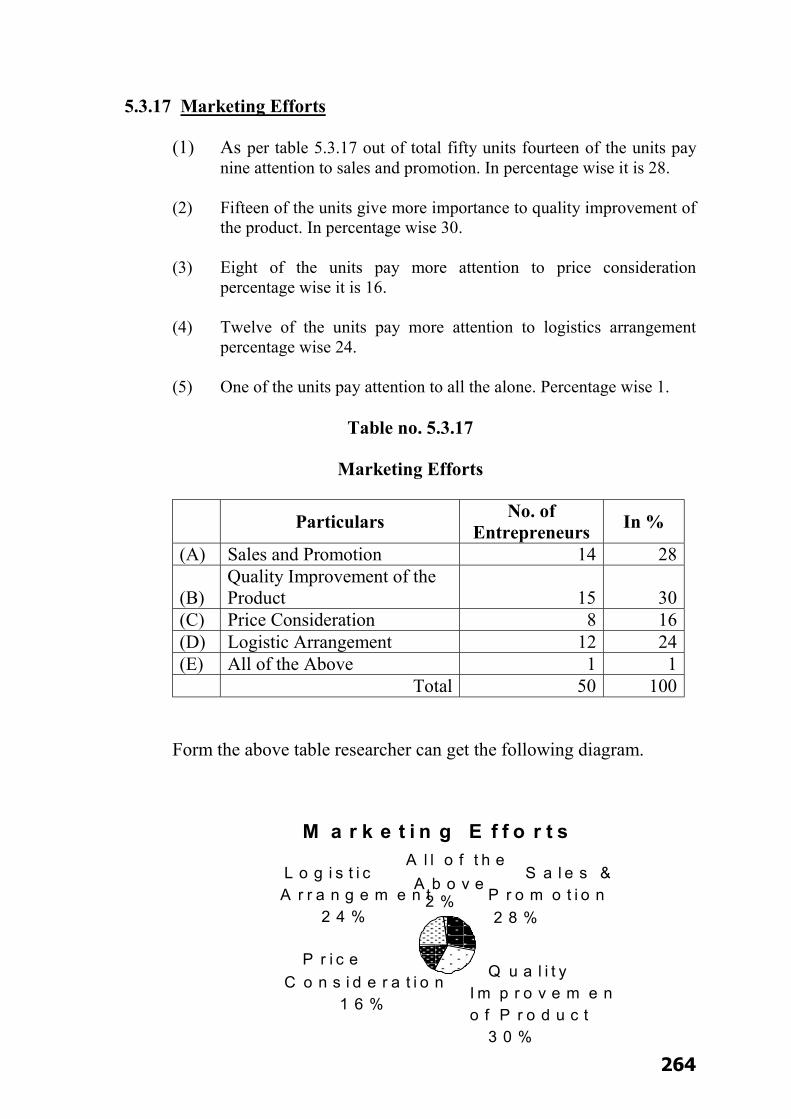
264
M a r k e t i n g E f f o r t s
S a l e s &P r o m o t i o n 2 8 %
Q u a l i t y I m p r o v e m e no f P r o d u c t
3 0 %
P r i c e C o n s i d e r a t i o n
1 6 %
L o g i s t i c A r r a n g e m e n t
2 4 %
A l l o f t h e
A b o v e 2 %
5.3.17 Marketing Efforts
(1) As per table 5.3.17 out of total fifty units fourteen of the units pay nine attention to sales and promotion. In percentage wise it is 28.
(2) Fifteen of the units give more importance to quality improvement of the product. In percentage wise 30.
(3) Eight of the units pay more attention to price consideration percentage wise it is 16.
(4) Twelve of the units pay more attention to logistics arrangement percentage wise 24.
(5) One of the units pay attention to all the alone. Percentage wise 1.
Table no. 5.3.17
Marketing Efforts
Particulars No. of Entrepreneurs In %
(A) Sales and Promotion 14 28
(B) Quality Improvement of the Product 15 30
(C) Price Consideration 8 16 (D) Logistic Arrangement 12 24 (E) All of the Above 1 1 Total 50 100
Form the above table researcher can get the following diagram.

265
5.3.18 Solution of the Critical Problems
(A) From the table 5.3.18 we abserve that eleven of the units consult the advisory staff to solve critical problem percentage wise 22.
(B) Ten of the units take the help of professional consultants percentage wise it is 20.
(C) Fourteen of this units consult their family members and friends to solve critical problems. Percentage wise it is 28.
(D) Arround Eleven units resort to say solutions percentage wise it is 22.
(E) Four of the units basic use of any of the above factors for solving the critical problem percentage wise it is 8.
Table no. 5.3.18 Solution of the critical problems
Particulars No. of
Entrepreneurs In %
(A) Advisory Staff 11 22 (B) Professional Consultants 10 20 (C) Friends and Family Members 14 28 (D) Self Solution 11 22 (E) Any Other (Specify) 4 8 Total 50 100 Form the above table researcher can get the following diagram.
Solution of Critical Problem
Advisory Staff 22%
Professional
Consultants
20%
Friends & Family
Member
Self Solution
22%
Any Other
(Specify) 8%

266
Efforts included in Promotional Activities
T.V. Ads 19%
Print Media 13%
Hoardings21%
Exhibition28%
Fashion Shows & Events13%
Any Other 6%
5.3.19 Efforts included in Promotional Activities
As per table no. 5.3.19 there are fifty entrepreneurs out of which Seven entrepreneurs Use T.V. Ads in percentage 20, Seven entrepreneurs use print media in percentage 14. Eleven entrepreneurs use hoarding in percentage 22. Fourteen entrepreneurs use exhibition in percentage 28. Seven entrepreneurs use Fashion shows and events in percentage 14 and only three entrepreneurs are using other sources in percentage 6.
Table no. 5.3.19
Efforts Included in Promotional Activities
Particulars No. of Entrepreneurs In %
(A) T.V. Ads 10 20 (B) Print Media 7 14 (C) Hoardings 11 22 (D) Exhibition 14 28 (E) Fashion Shows & Events 7 14 (F) Any Other 3 6 Total 50 100
Form the above table researcher can get the following diagram.
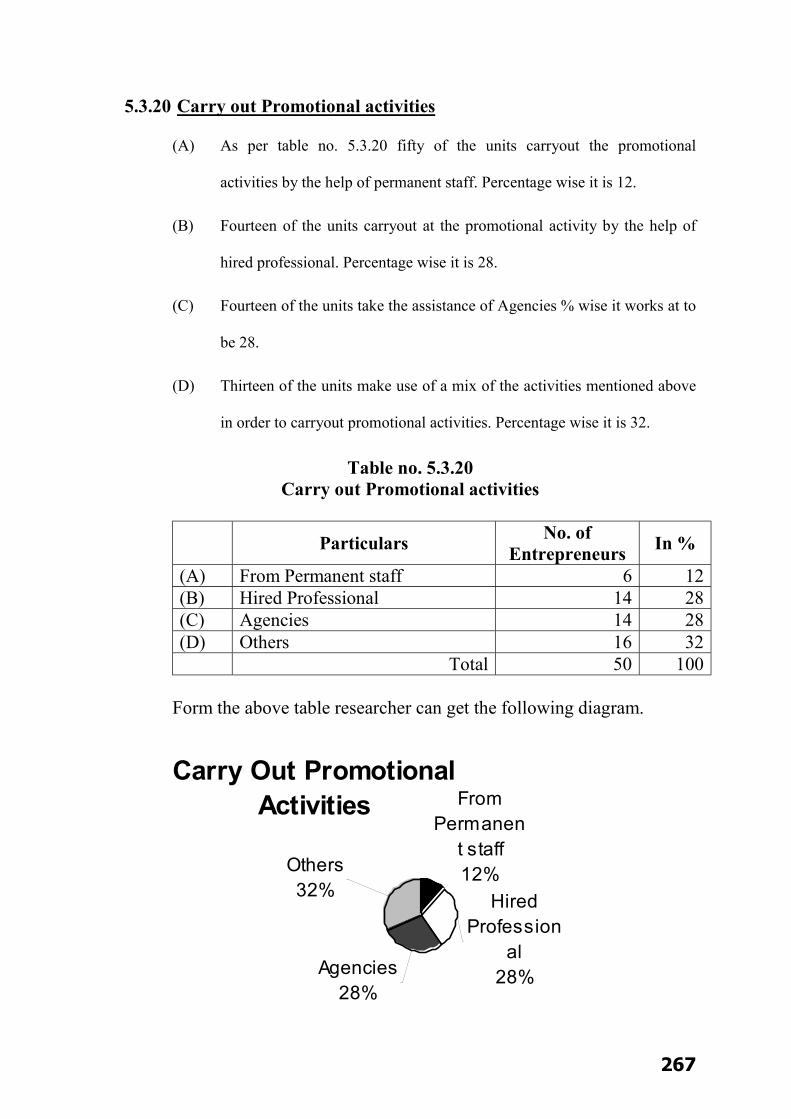
267
Carry Out Promotional Activities From
Permanent staff12%
Agencies28%
Others 32% Hired
Professional
28%
5.3.20 Carry out Promotional activities
(A) As per table no. 5.3.20 fifty of the units carryout the promotional
activities by the help of permanent staff. Percentage wise it is 12.
(B) Fourteen of the units carryout at the promotional activity by the help of
hired professional. Percentage wise it is 28.
(C) Fourteen of the units take the assistance of Agencies % wise it works at to
be 28.
(D) Thirteen of the units make use of a mix of the activities mentioned above
in order to carryout promotional activities. Percentage wise it is 32.
Table no. 5.3.20 Carry out Promotional activities
Particulars No. of
Entrepreneurs In %
(A) From Permanent staff 6 12 (B) Hired Professional 14 28 (C) Agencies 14 28 (D) Others 16 32 Total 50 100
Form the above table researcher can get the following diagram.
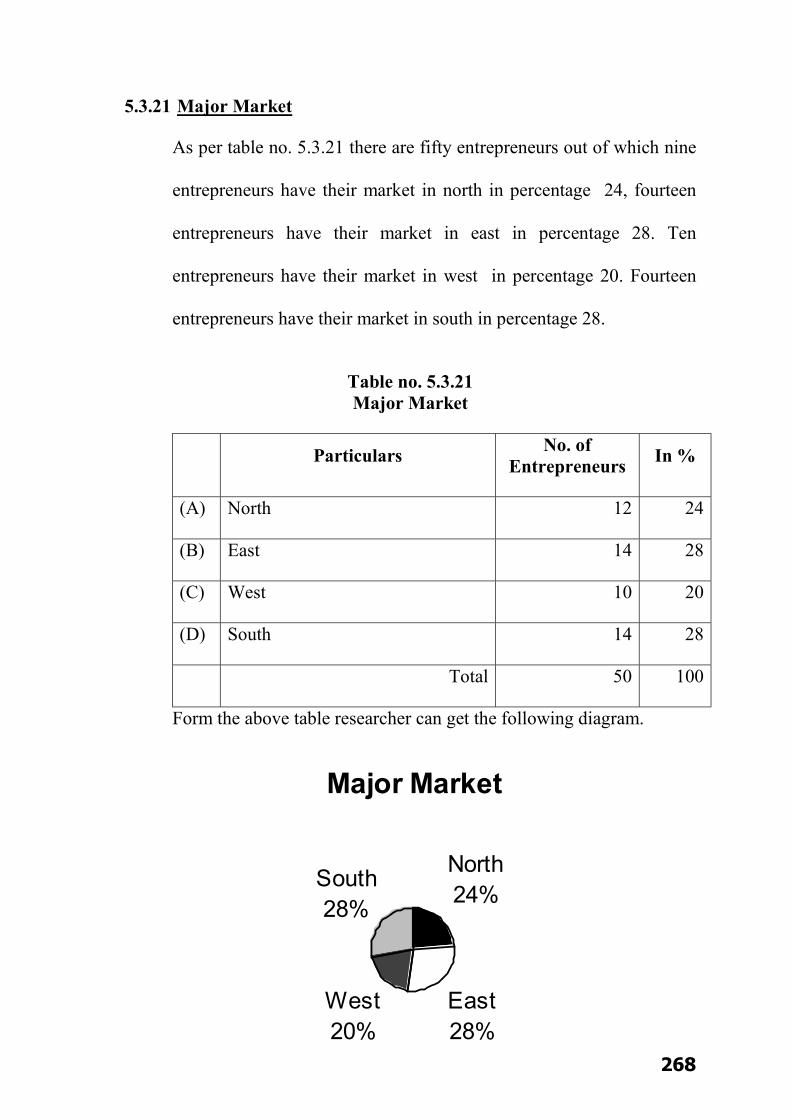
268
Major Market
North24%
East28%
West20%
South 28%
5.3.21 Major Market
As per table no. 5.3.21 there are fifty entrepreneurs out of which nine
entrepreneurs have their market in north in percentage 24, fourteen
entrepreneurs have their market in east in percentage 28. Ten
entrepreneurs have their market in west in percentage 20. Fourteen
entrepreneurs have their market in south in percentage 28.
Table no. 5.3.21 Major Market
Particulars No. of Entrepreneurs In %
(A) North 12 24
(B) East 14 28
(C) West 10 20
(D) South 14 28
Total 50 100
Form the above table researcher can get the following diagram.

269
Sales Graph
Increasing 22%
Fluctuating 28%
Stagnant 36% Decreasin
g 14%
5.3.22 Sales Graph
As per table no. 5.3.22 there are fifty entrepreneurs out of which eight
entrepreneurs have their sales graph in increasing order in percentage
22, seven entrepreneurs their sales graph in decreasing order in
percentage 14. Four entrepreneurs their sales graph in fluctuating in
percentage 28. Eighteen entrepreneurs their sales graph in stagnant
order in percentage 36.
Table no. 5.3.22 Sales Graph
Particulars No. of
Entrepreneurs In %
(A) Increasing 11 22
(B) Decreasing 7 14
(C) Fluctuating 14 28
(D) Stagnant 18 36
Total 50 100
Form the above table researcher can get the following diagram.
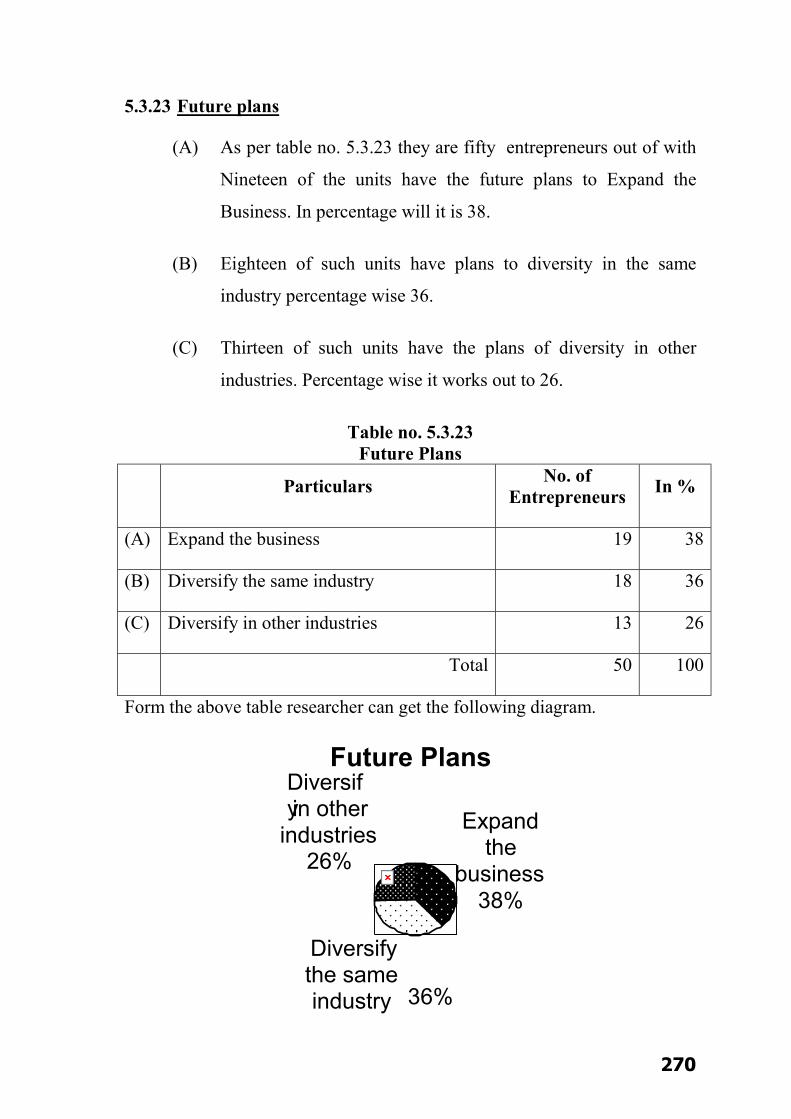
270
5.3.23 Future plans
(A) As per table no. 5.3.23 they are fifty entrepreneurs out of with
Nineteen of the units have the future plans to Expand the
Business. In percentage will it is 38.
(B) Eighteen of such units have plans to diversity in the same
industry percentage wise 36.
(C) Thirteen of such units have the plans of diversity in other
industries. Percentage wise it works out to 26.
Table no. 5.3.23 Future Plans
Particulars No. of Entrepreneurs In %
(A) Expand the business 19 38
(B) Diversify the same industry 18 36
(C) Diversify in other industries 13 26
Total 50 100
Form the above table researcher can get the following diagram.
Future Plans
Expand the
business 38%
Diversify the same industry 36%
Diversify in other
industries 26%

271
Supply of Raw Materials
Agents 24%
Small Industries
30%
Other (specify)
46%
5.3.24 Supply Raw materials
(A) As per the table 5.3.24 out of the Total Fifty units, Twelve of
the units get this raw Material supply through the agents.
Percentage wise it is 24.
(B) Fifteen of the units get the supply of the raw materials from
small industries, percentage wise it is 30.
(C) Twenty Three of this thought get the supply of raw material
through other i.e. Traders etc. Percentage wise it is 46.
Table no. 5.3.24 Supply of Raw materials
Particulars No. of Entrepreneurs In %
(A) Agents 12 24
(B) Small Industries 15 30
(C) Other (specify) 23 46
Total 50 100
Form the above table researcher can get the following diagram.
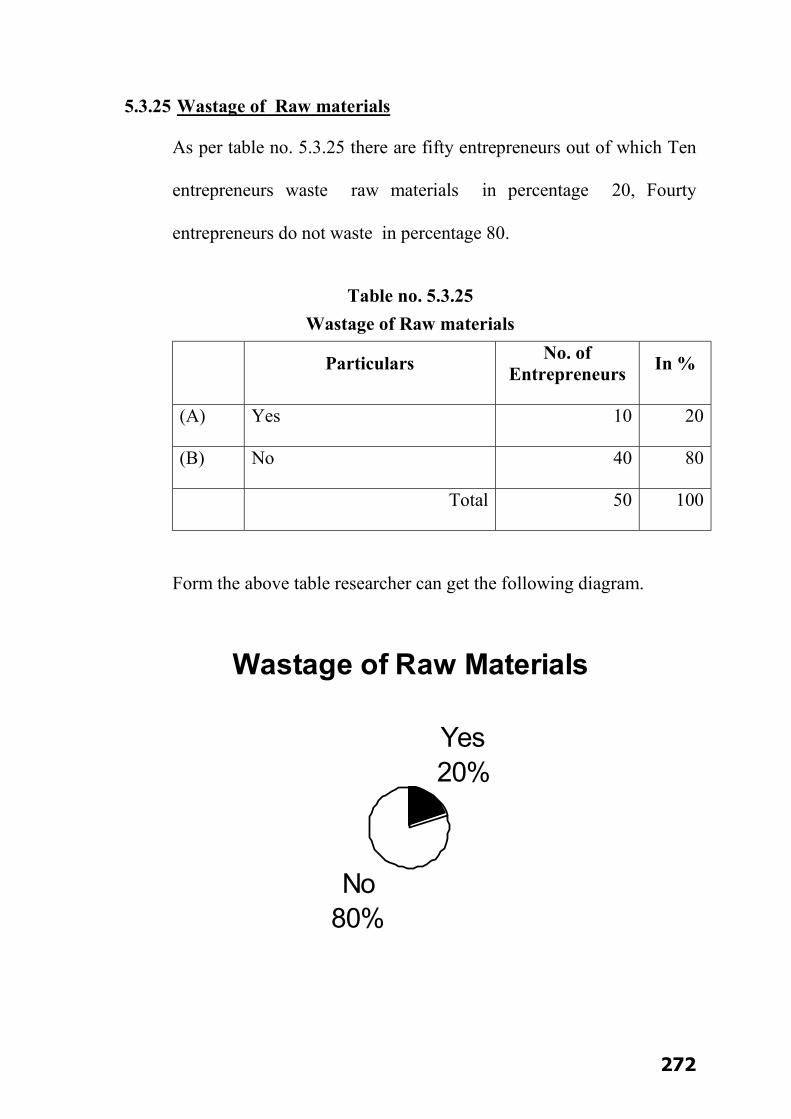
272
Wastage of Raw Materials
Yes 20%
No 80%
5.3.25 Wastage of Raw materials
As per table no. 5.3.25 there are fifty entrepreneurs out of which Ten
entrepreneurs waste raw materials in percentage 20, Fourty
entrepreneurs do not waste in percentage 80.
Table no. 5.3.25 Wastage of Raw materials
Particulars No. of Entrepreneurs In %
(A) Yes 10 20
(B) No 40 80
Total 50 100
Form the above table researcher can get the following diagram.
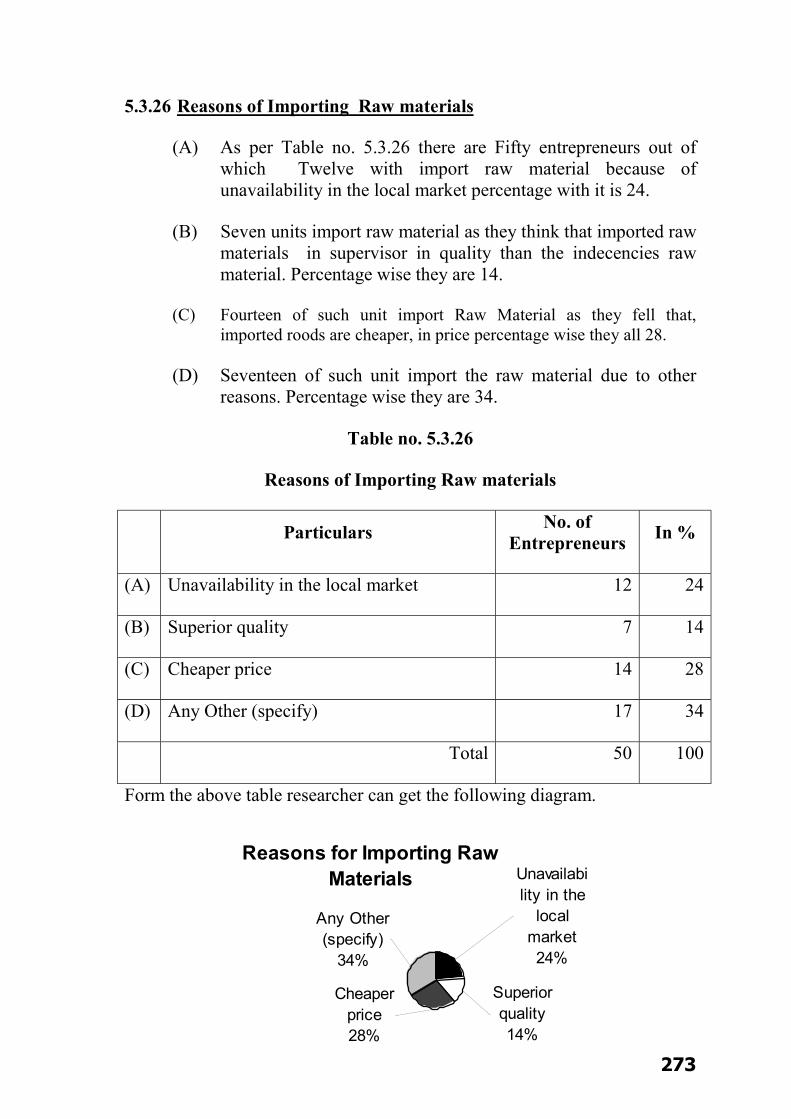
273
Reasons for Importing Raw Materials
Cheaper price28%
Any Other (specify)
34%
Superior quality 14%
Unavailability in the
local market 24%
5.3.26 Reasons of Importing Raw materials
(A) As per Table no. 5.3.26 there are Fifty entrepreneurs out of which Twelve with import raw material because of unavailability in the local market percentage with it is 24.
(B) Seven units import raw material as they think that imported raw materials in supervisor in quality than the indecencies raw material. Percentage wise they are 14.
(C) Fourteen of such unit import Raw Material as they fell that, imported roods are cheaper, in price percentage wise they all 28.
(D) Seventeen of such unit import the raw material due to other reasons. Percentage wise they are 34.
Table no. 5.3.26
Reasons of Importing Raw materials
Particulars No. of Entrepreneurs In %
(A) Unavailability in the local market 12 24
(B) Superior quality 7 14
(C) Cheaper price 14 28
(D) Any Other (specify) 17 34
Total 50 100
Form the above table researcher can get the following diagram.
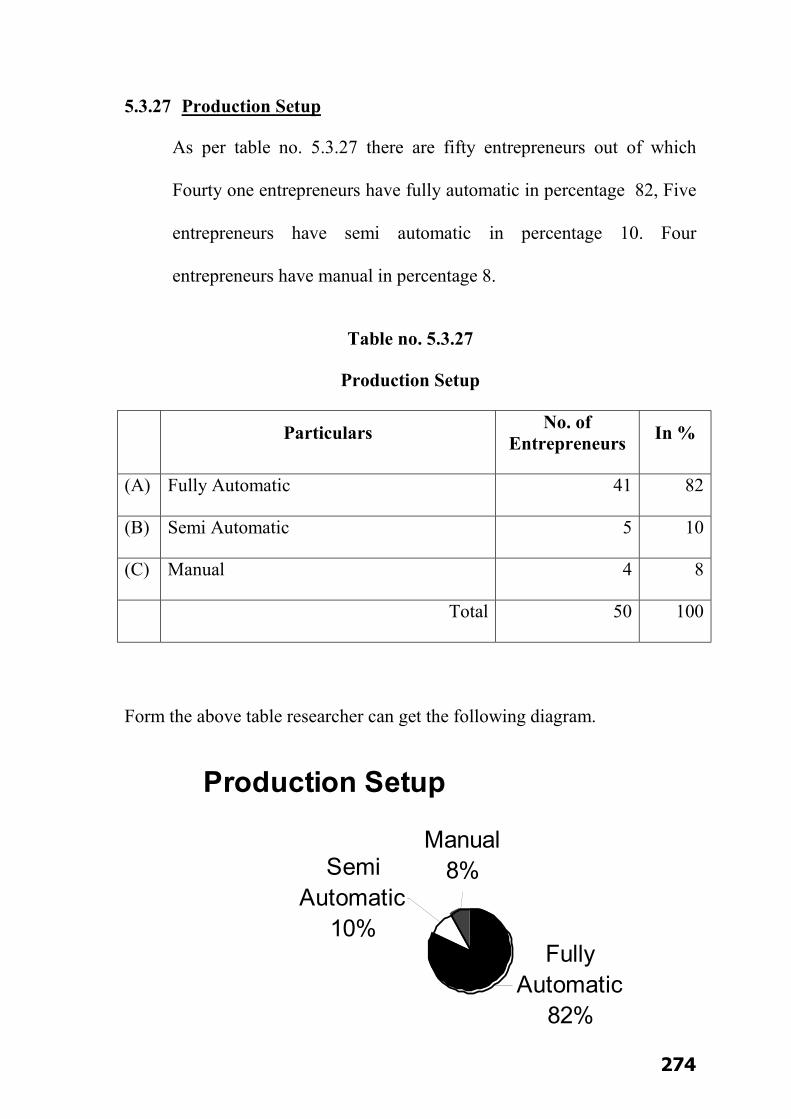
274
Production Setup
Fully Automatic
82%
Semi Automatic
10%
Manual 8%
5.3.27 Production Setup
As per table no. 5.3.27 there are fifty entrepreneurs out of which
Fourty one entrepreneurs have fully automatic in percentage 82, Five
entrepreneurs have semi automatic in percentage 10. Four
entrepreneurs have manual in percentage 8.
Table no. 5.3.27
Production Setup
Particulars No. of Entrepreneurs In %
(A) Fully Automatic 41 82
(B) Semi Automatic 5 10
(C) Manual 4 8
Total 50 100
Form the above table researcher can get the following diagram.
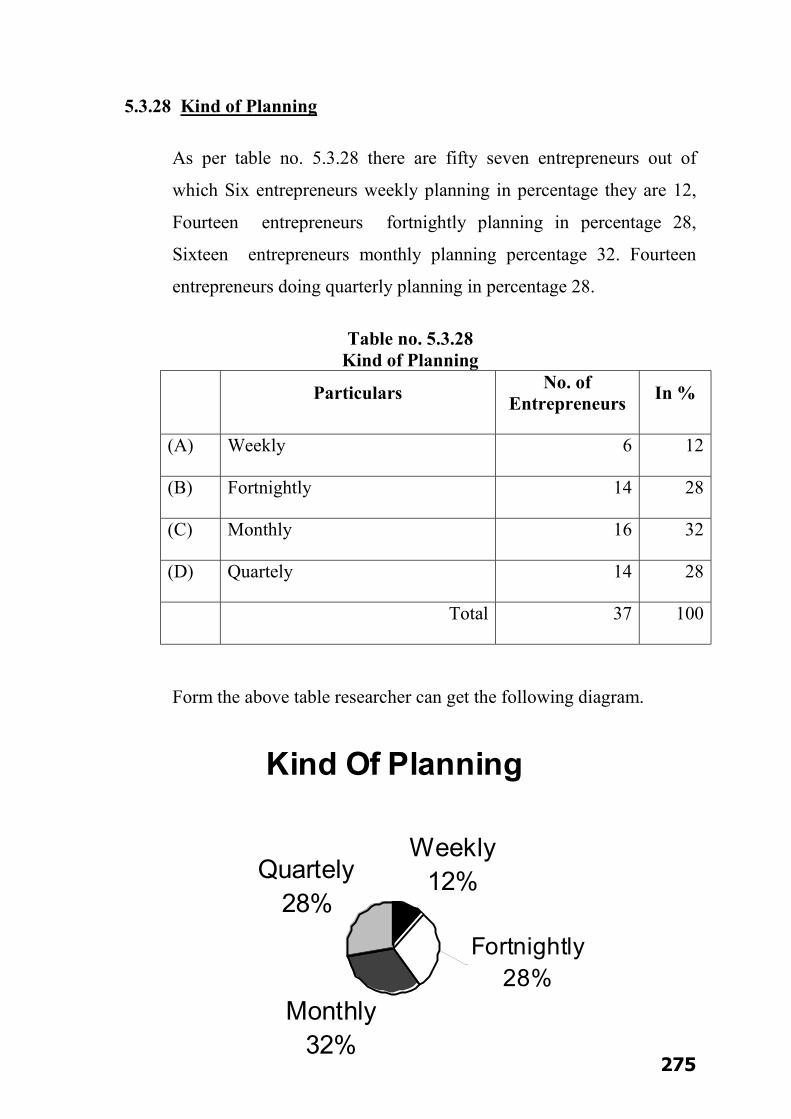
275
Kind Of Planning
Weekly12%
Monthly32%
Quartely 28%
Fortnightly28%
5.3.28 Kind of Planning
As per table no. 5.3.28 there are fifty seven entrepreneurs out of
which Six entrepreneurs weekly planning in percentage they are 12,
Fourteen entrepreneurs fortnightly planning in percentage 28,
Sixteen entrepreneurs monthly planning percentage 32. Fourteen
entrepreneurs doing quarterly planning in percentage 28.
Table no. 5.3.28 Kind of Planning
Particulars No. of Entrepreneurs In %
(A) Weekly 6 12
(B) Fortnightly 14 28
(C) Monthly 16 32
(D) Quartely 14 28
Total 37 100
Form the above table researcher can get the following diagram.
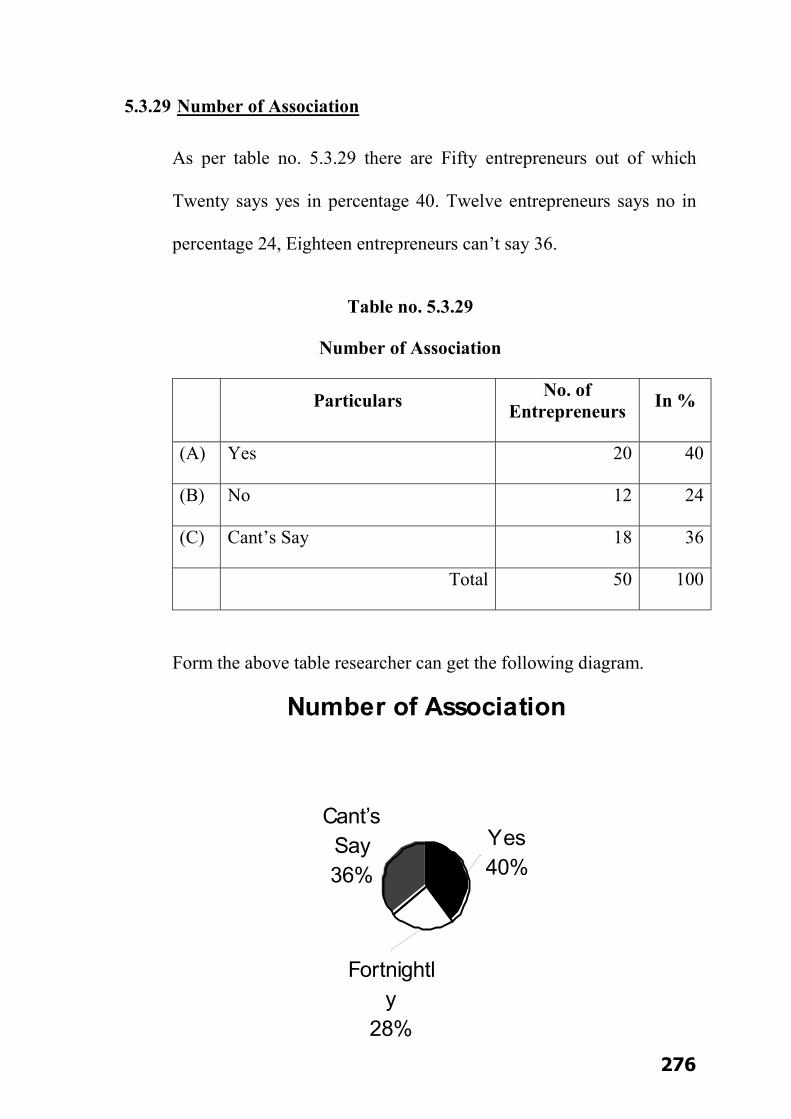
276
Number of Association
Cant’s Say 36%
Yes 40%
Fortnightly
28%
5.3.29 Number of Association
As per table no. 5.3.29 there are Fifty entrepreneurs out of which
Twenty says yes in percentage 40. Twelve entrepreneurs says no in
percentage 24, Eighteen entrepreneurs can’t say 36.
Table no. 5.3.29
Number of Association
Particulars No. of Entrepreneurs In %
(A) Yes 20 40
(B) No 12 24
(C) Cant’s Say 18 36
Total 50 100
Form the above table researcher can get the following diagram.
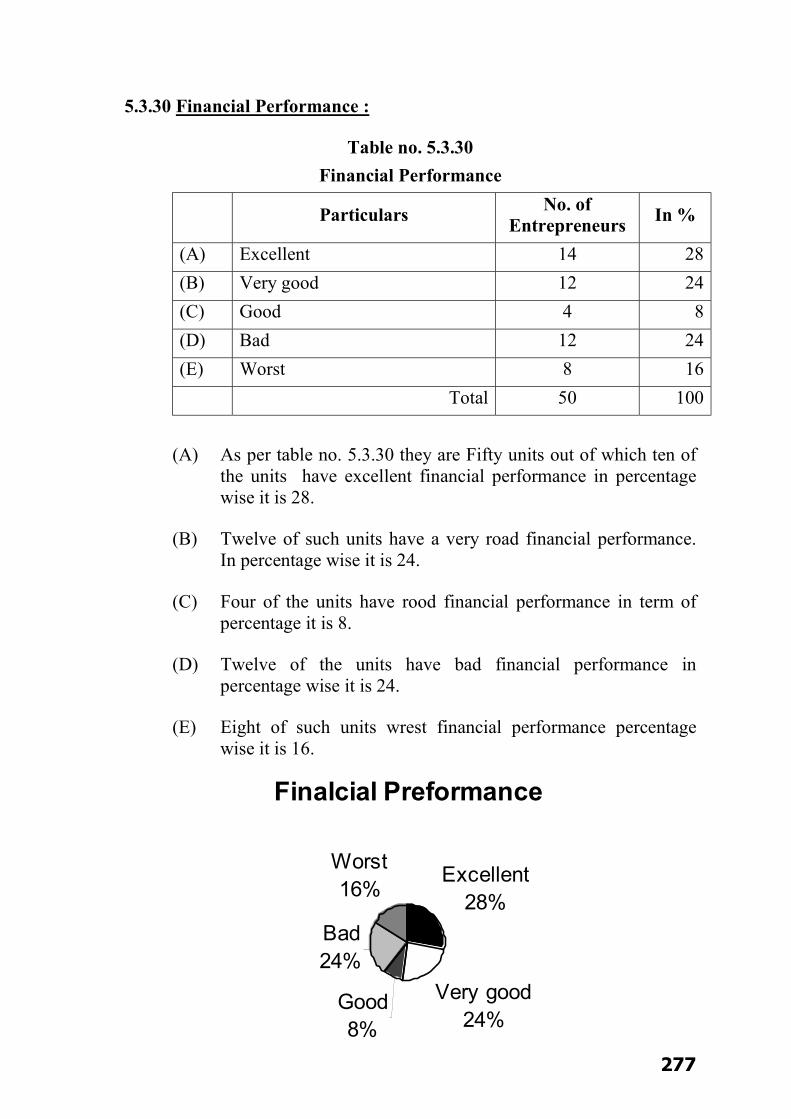
277
Finalcial Preformance
Excellent 28%
Very good24%
Good8%
Bad24%
Worst16%
5.3.30 Financial Performance :
Table no. 5.3.30 Financial Performance
Particulars No. of Entrepreneurs In %
(A) Excellent 14 28 (B) Very good 12 24 (C) Good 4 8 (D) Bad 12 24 (E) Worst 8 16 Total 50 100
(A) As per table no. 5.3.30 they are Fifty units out of which ten of
the units have excellent financial performance in percentage wise it is 28.
(B) Twelve of such units have a very road financial performance. In percentage wise it is 24.
(C) Four of the units have rood financial performance in term of percentage it is 8.
(D) Twelve of the units have bad financial performance in percentage wise it is 24.
(E) Eight of such units wrest financial performance percentage wise it is 16.
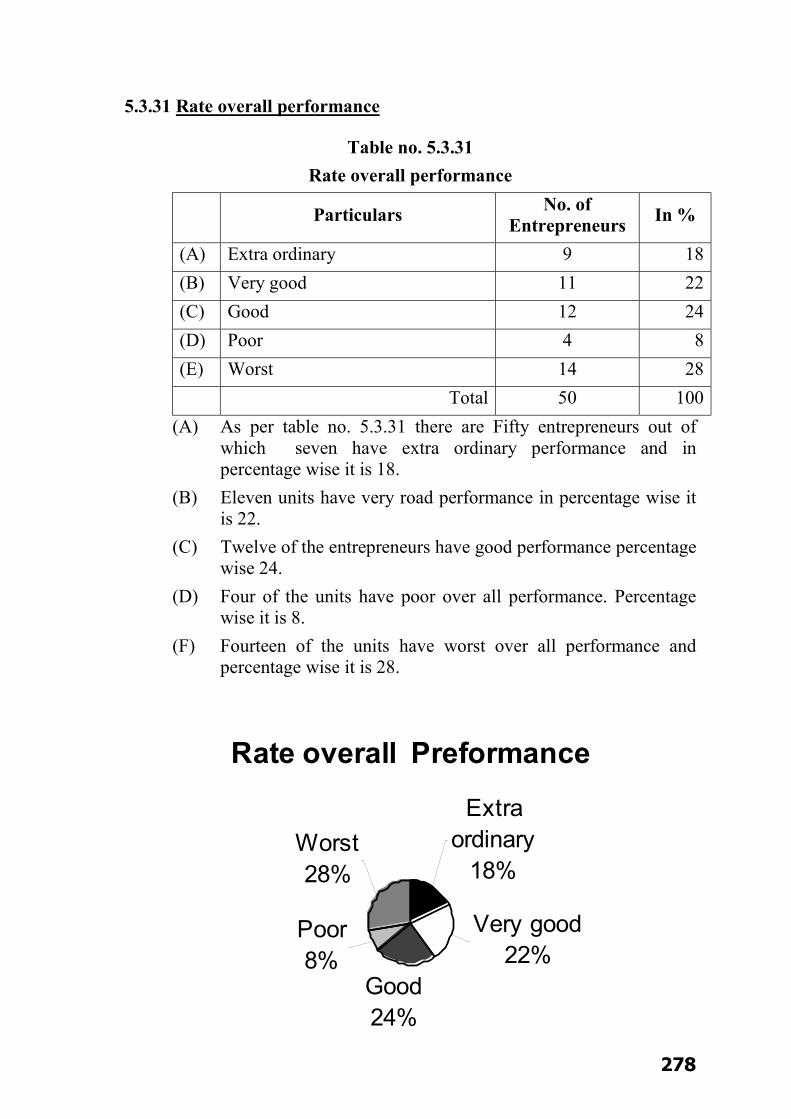
278
Rate overall Preformance
Good24%
Worst28%
Extra ordinary
18%
Poor 8%
Very good22%
5.3.31 Rate overall performance
Table no. 5.3.31 Rate overall performance
Particulars No. of Entrepreneurs In %
(A) Extra ordinary 9 18 (B) Very good 11 22 (C) Good 12 24 (D) Poor 4 8 (E) Worst 14 28 Total 50 100
(A) As per table no. 5.3.31 there are Fifty entrepreneurs out of which seven have extra ordinary performance and in percentage wise it is 18.
(B) Eleven units have very road performance in percentage wise it is 22.
(C) Twelve of the entrepreneurs have good performance percentage wise 24.
(D) Four of the units have poor over all performance. Percentage wise it is 8.
(F) Fourteen of the units have worst over all performance and percentage wise it is 28.
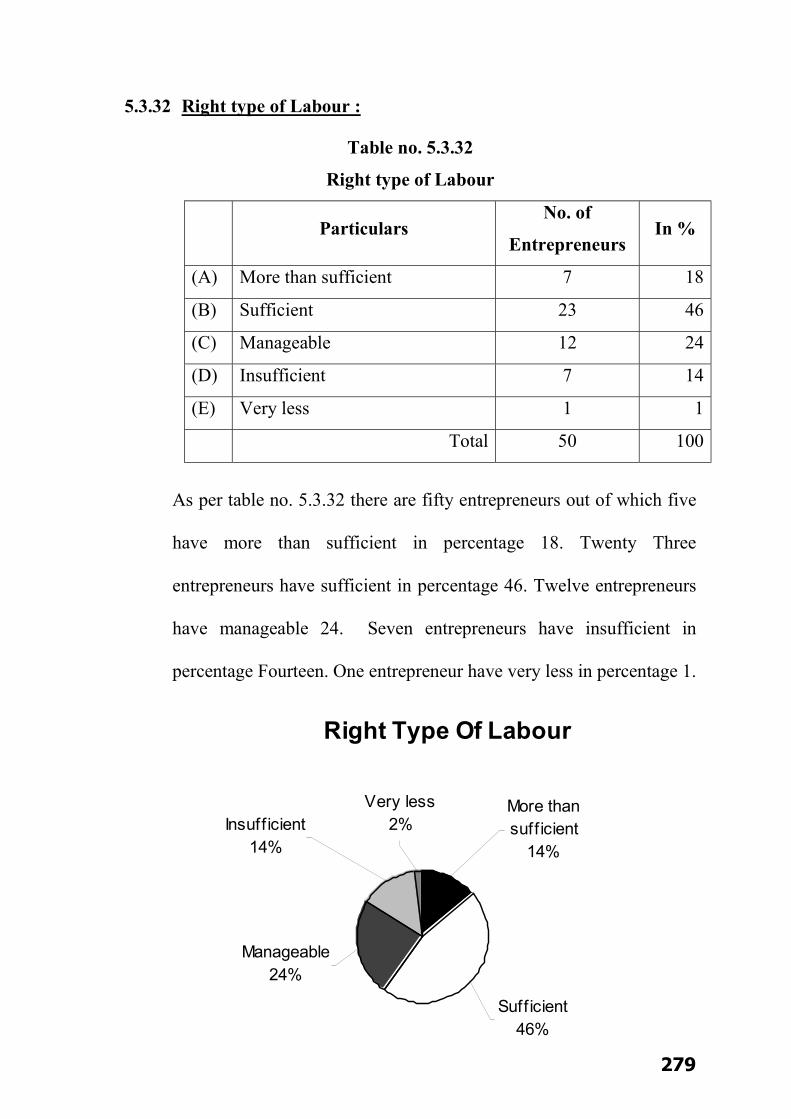
279
Right Type Of Labour
Manageable 24%
Very less 2%
More than suff icient
14%Insufficient
14%
Sufficient 46%
5.3.32 Right type of Labour :
Table no. 5.3.32
Right type of Labour
Particulars
No. of
Entrepreneurs In %
(A) More than sufficient 7 18
(B) Sufficient 23 46
(C) Manageable 12 24
(D) Insufficient 7 14
(E) Very less 1 1
Total 50 100
As per table no. 5.3.32 there are fifty entrepreneurs out of which five
have more than sufficient in percentage 18. Twenty Three
entrepreneurs have sufficient in percentage 46. Twelve entrepreneurs
have manageable 24. Seven entrepreneurs have insufficient in
percentage Fourteen. One entrepreneur have very less in percentage 1.
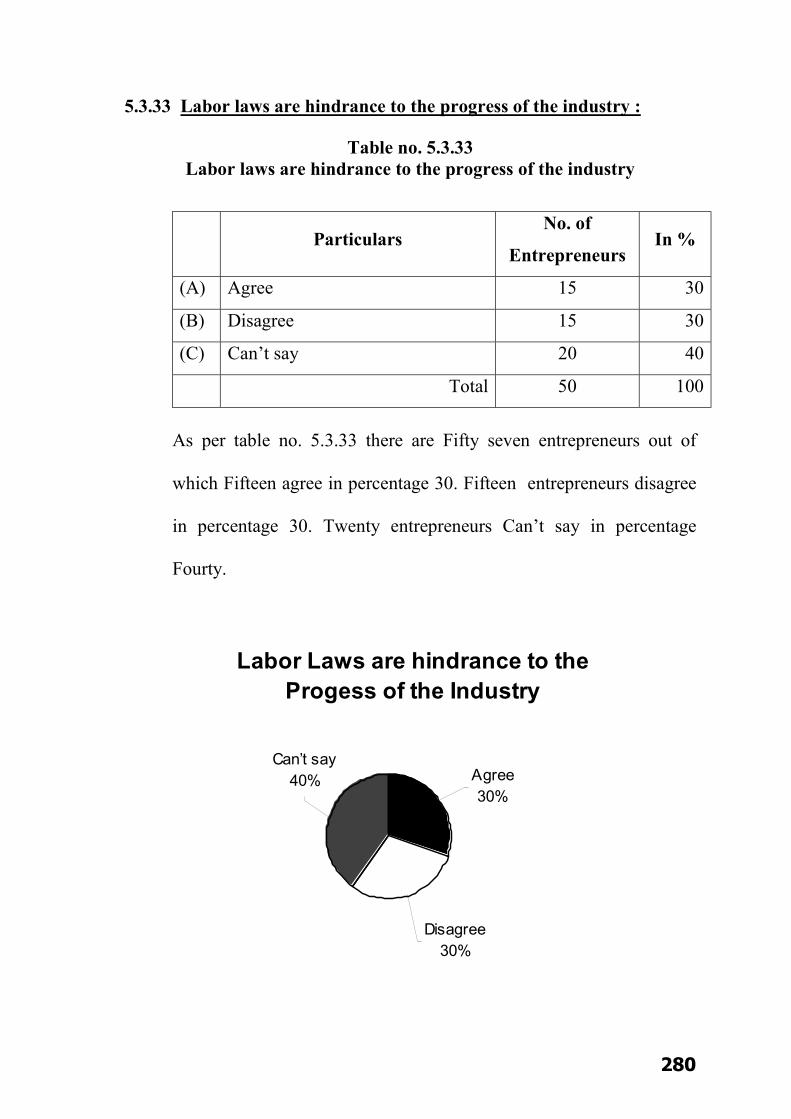
280
Labor Laws are hindrance to the Progess of the Industry
Can’t say 40% Agree
30%
Disagree 30%
5.3.33 Labor laws are hindrance to the progress of the industry :
Table no. 5.3.33 Labor laws are hindrance to the progress of the industry
Particulars
No. of
Entrepreneurs In %
(A) Agree 15 30
(B) Disagree 15 30
(C) Can’t say 20 40
Total 50 100
As per table no. 5.3.33 there are Fifty seven entrepreneurs out of
which Fifteen agree in percentage 30. Fifteen entrepreneurs disagree
in percentage 30. Twenty entrepreneurs Can’t say in percentage
Fourty.
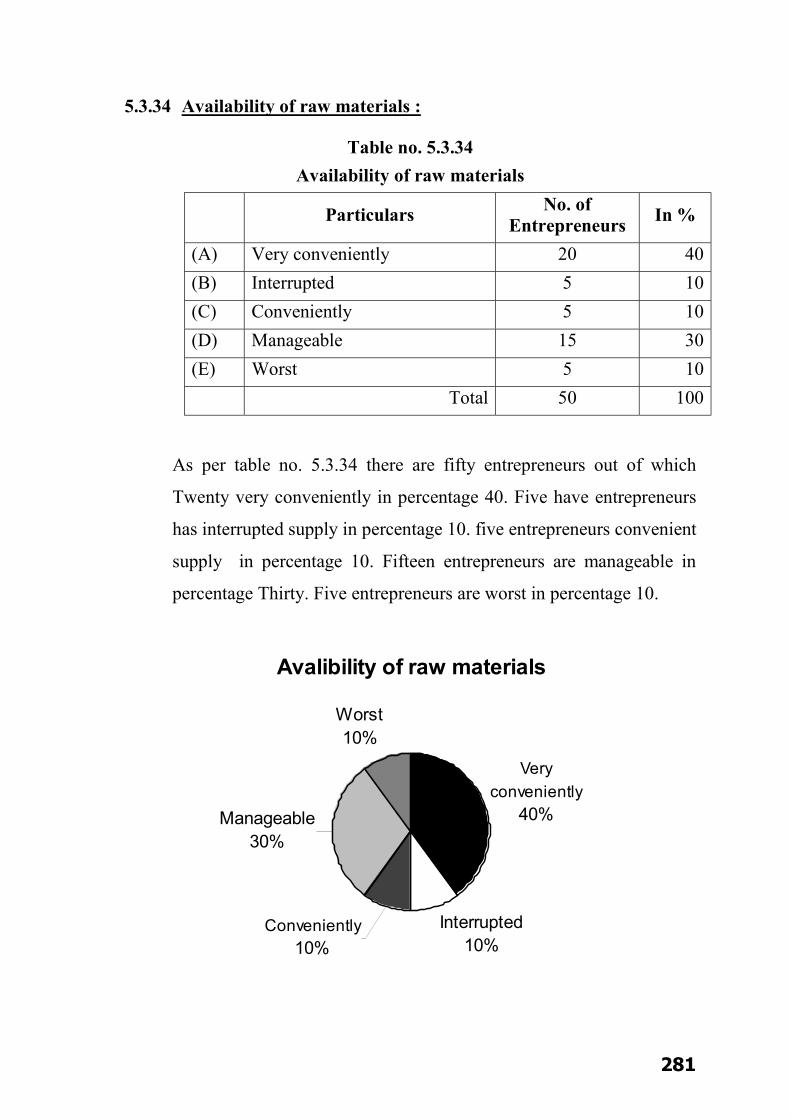
281
Avalibility of raw materials
Interrupted10%
Worst10%
Very conveniently
40%Manageable 30%
Conveniently 10%
5.3.34 Availability of raw materials :
Table no. 5.3.34 Availability of raw materials
Particulars No. of Entrepreneurs In %
(A) Very conveniently 20 40 (B) Interrupted 5 10 (C) Conveniently 5 10 (D) Manageable 15 30 (E) Worst 5 10 Total 50 100
As per table no. 5.3.34 there are fifty entrepreneurs out of which
Twenty very conveniently in percentage 40. Five have entrepreneurs
has interrupted supply in percentage 10. five entrepreneurs convenient
supply in percentage 10. Fifteen entrepreneurs are manageable in
percentage Thirty. Five entrepreneurs are worst in percentage 10.
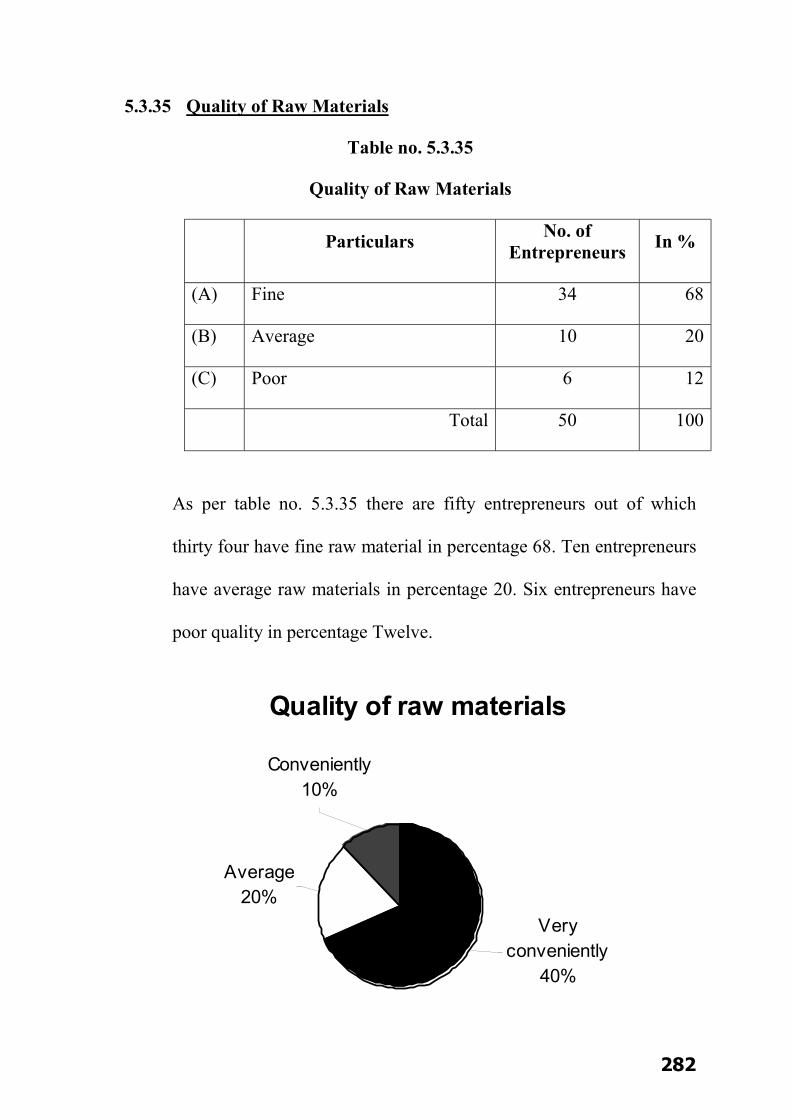
282
Quality of raw materials
Average 20%
Very conveniently
40%
Conveniently 10%
5.3.35 Quality of Raw Materials
Table no. 5.3.35
Quality of Raw Materials
Particulars No. of Entrepreneurs In %
(A) Fine 34 68
(B) Average 10 20
(C) Poor 6 12
Total 50 100
As per table no. 5.3.35 there are fifty entrepreneurs out of which
thirty four have fine raw material in percentage 68. Ten entrepreneurs
have average raw materials in percentage 20. Six entrepreneurs have
poor quality in percentage Twelve.
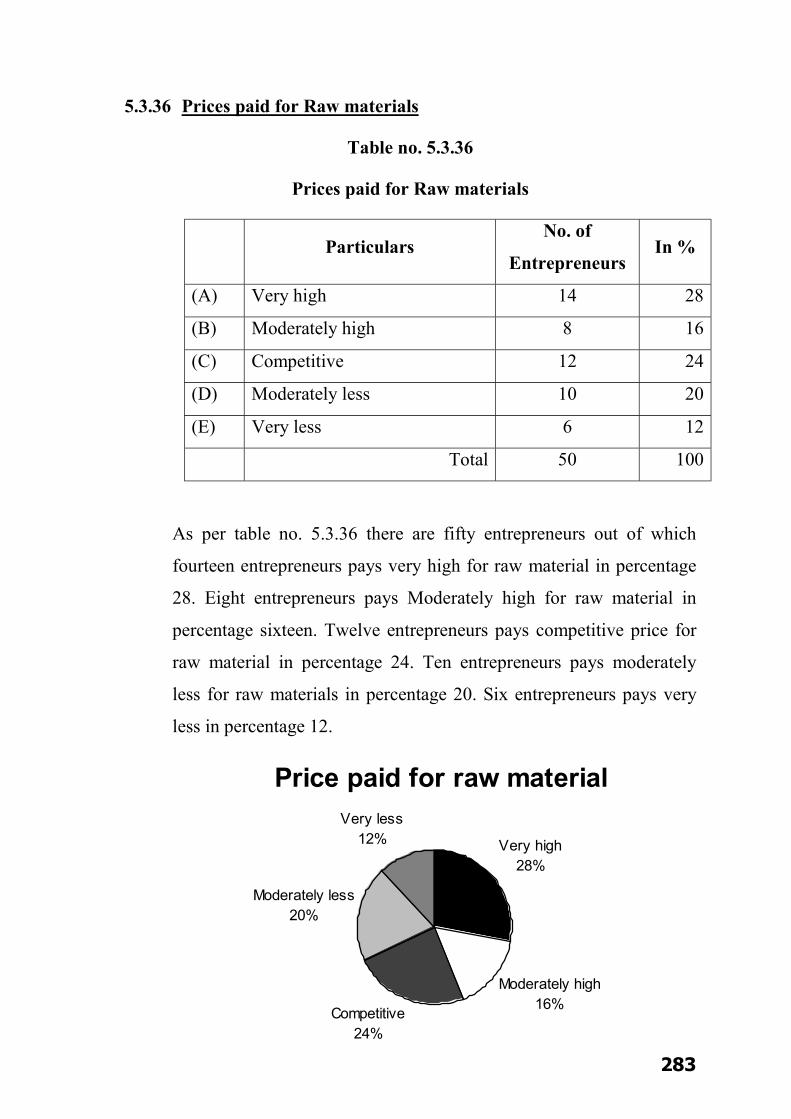
283
Price paid for raw material
Very high 28%
Moderately high 16%
Moderately less20%
Very less12%
Competitive 24%
5.3.36 Prices paid for Raw materials
Table no. 5.3.36
Prices paid for Raw materials
Particulars
No. of
Entrepreneurs In %
(A) Very high 14 28
(B) Moderately high 8 16
(C) Competitive 12 24
(D) Moderately less 10 20
(E) Very less 6 12
Total 50 100
As per table no. 5.3.36 there are fifty entrepreneurs out of which
fourteen entrepreneurs pays very high for raw material in percentage
28. Eight entrepreneurs pays Moderately high for raw material in
percentage sixteen. Twelve entrepreneurs pays competitive price for
raw material in percentage 24. Ten entrepreneurs pays moderately
less for raw materials in percentage 20. Six entrepreneurs pays very
less in percentage 12.
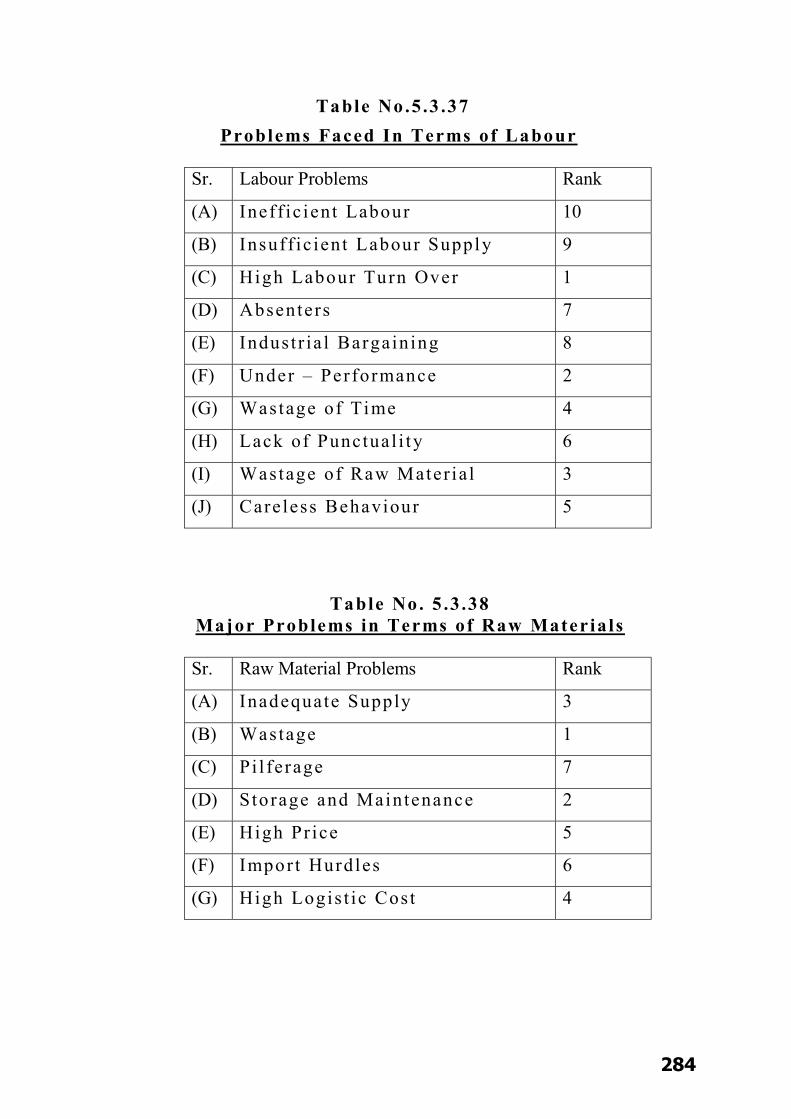
284
Table No .5 .3 .37 Problems Faced In Terms of Labour
Sr. Labour Problems Rank
(A) Ineff ic ient Labour 10
(B) Insuff ic ient Labour Supply 9
(C) High Labour Turn Over 1
(D) Absenters 7
(E) Indust r ia l Bargaining 8
(F) Under – Performance 2
(G) Wastage of Time 4
(H) Lack of Punctual i ty 6
(I) Wastage of Raw Mater ia l 3
(J) Care less Behaviour 5
Table No . 5 .3 .38 Major Problems in Terms of Raw Materia ls
Sr. Raw Material Problems Rank
(A) Inadequate Supply 3
(B) Wastage 1
(C) Pi l ferage 7
(D) Sto rage and Maintenance 2
(E) High Pr ice 5
(F) Impor t Hurdles 6
(G) High Logis t ic Cost 4

285
Table No .5 .3 .39 Major Reasons of Disconnect ing Product ion
Sr. Major Reason Disconnecting Productions Rank
(A) Power Supply 1
(B) Maintenance and Machinery 4
(C) Labour Unres t 2
(D) Indust r ia l Accidents 5
(E) Non-Avai labi l i ty of Raw Mater ia ls 3
(F) Non-Avai labi l i ty of Order --
(G) Commual and Pol i t ica l Unres t --
Table No .5 .3 .40 Major Problems in the Process Industr ies
Sr. Problems in the Process Industries Rank
(A) Government Rules and Regula t ions 3
(B) Compet i t ions 1
(C) Socia l Act iv is ts and Protes ts 6
(D) Technological Change 5
(E) Lack of Finance 4
(F) Lack of Orders 7
(G) Labour Problems 2

286
CHAPTER – 6
CONCLUSION
6.1 Findings
6.2 Suggestions
6.3 Conclusion
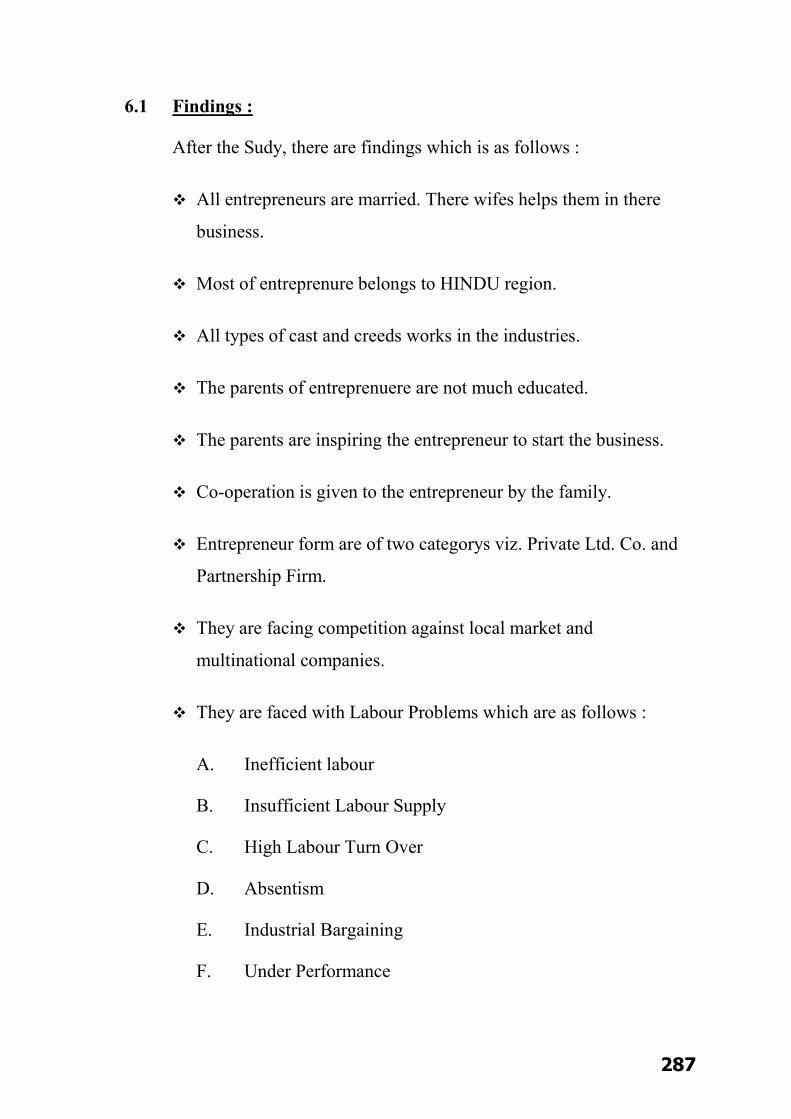
287
6.1 Findings :
After the Sudy, there are findings which is as follows :
All entrepreneurs are married. There wifes helps them in there
business.
Most of entreprenure belongs to HINDU region.
All types of cast and creeds works in the industries.
The parents of entreprenuere are not much educated.
The parents are inspiring the entrepreneur to start the business.
Co-operation is given to the entrepreneur by the family.
Entrepreneur form are of two categorys viz. Private Ltd. Co. and
Partnership Firm.
They are facing competition against local market and
multinational companies.
They are faced with Labour Problems which are as follows :
A. Inefficient labour
B. Insufficient Labour Supply
C. High Labour Turn Over
D. Absentism
E. Industrial Bargaining
F. Under Performance
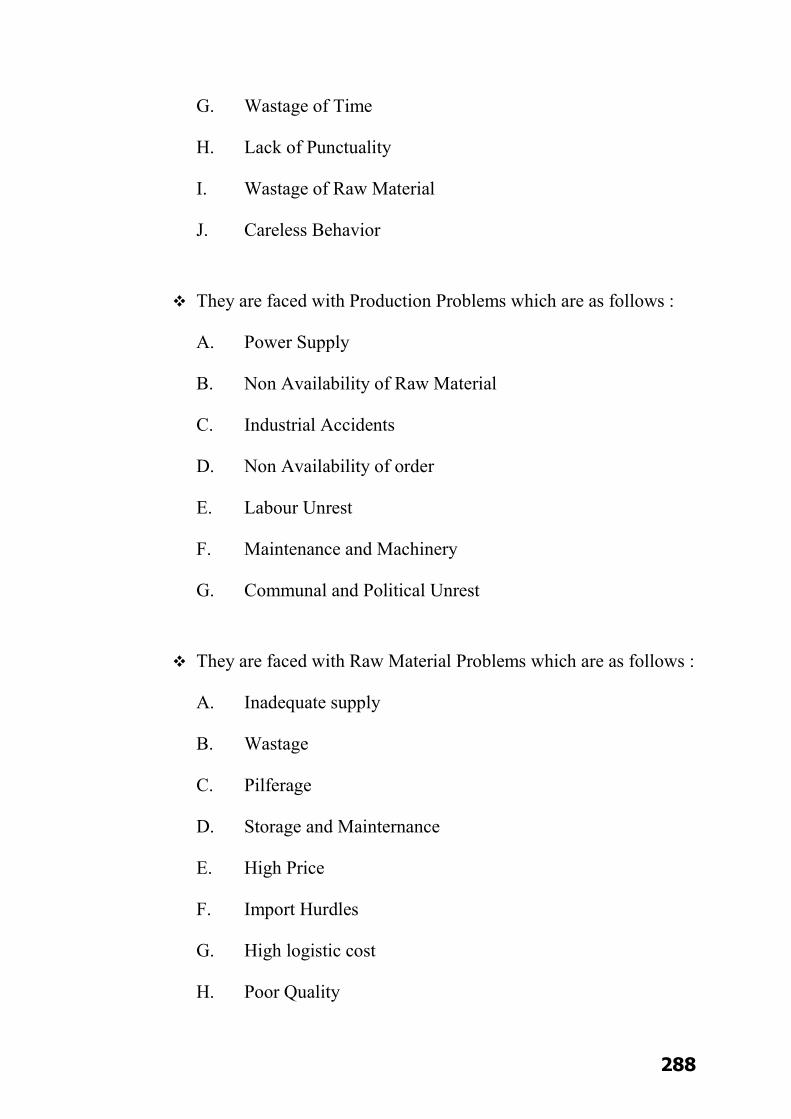
288
G. Wastage of Time
H. Lack of Punctuality
I. Wastage of Raw Material
J. Careless Behavior
They are faced with Production Problems which are as follows :
A. Power Supply
B. Non Availability of Raw Material
C. Industrial Accidents
D. Non Availability of order
E. Labour Unrest
F. Maintenance and Machinery
G. Communal and Political Unrest
They are faced with Raw Material Problems which are as follows :
A. Inadequate supply
B. Wastage
C. Pilferage
D. Storage and Mainternance
E. High Price
F. Import Hurdles
G. High logistic cost
H. Poor Quality

289
They are faced with Major Problems which is are follows :
A. Governent Rules & Regulations
B. Competitions
C. Social Activities and Protests
D. Technologocal Change
E. Lack of Finance
F. Lack of Orders
G. Labour Problems
6.2 Suggestions
1. The level of technology is one of the inevitable condition for
advancing quality production in the processing sector. The
other benefits accruing on account of technology upgradation
and modernisation is the reduction of production time,
optimum utilization of resources and utilities and energy
savings which will reduce the per unit cost of production.
At present only 10% of the Units in the Processing Sector are
having modern technology. The remaining 90% of the units are
either in the level of medium or obsolete technology.
290
2. New modern units should be encouraged to be set up. This will
bring about establishment of centres of excellence, which
would have multiplier and demonstrable effect.
Since the setting up of the processing unit is capital intensive,
adequate credit facilities should be available.
To encourage the processors the lending rate should be made
attractive concessions on excise duty and tax excerption may
be considered as an encouragement.
3. Presently the Processing units do not have adequate
Machines/Machinery with process control. Very few of the
Units have production automation system. Besides Bleaching is
mostly carried out through Batch Processing Method. High
tech open width bleaching plants are not in existence in the
country.
The advanced technology level machines are mostly imported
and are established after 1995, besides they are very few in
number.
In order to produce zero defect fabrics it is desirable to go for
micro process base system at the level of production.
291
Indigenously developed Machines/Machineries with process
control acilities and IT back up should be produced in the
country for easy accessibility of the processors.
It is observed that the Indian Machinery Manufacturers do not
go for production of processing equipments because of
unsustainable demands from the Processing Industry.
In order to encourage the production of indigenous machines of
high quality on sustainable basis, credit facilities should be
provided at low rate of interest.
Besides the reduction in the tax for such machines should also
been considered.
4. The most important raw material for processing is dyes and
chemical besides principle raw material such as fibre, yarn,
fabric, garments, etc., Some of the dyes particularly the azo
groups from direct acid and disperse types are presumed to be
harmful for the human skin.
There has been strict import laws for the textiles produced by
the use of above group of dyes. The Government has already

292
banned the above group of dyes for use and production of
textiles.
But there are no regulation for non use of the dyes. Effective
regulating measures should be evolved to restrict the use of
Azo Group of dyes by Creating an environment of awareness
on the above amongst the processors.
Alternative dye stuff should be found out through research and
development.
5. The testing facilities on quality and eco parameters are
adequately available in the country. The latest generation
equipments have been imported from USA and other European
countries to provide the state of art testing facilities to the
industry.
The Government has already invested large amount of money
in establishing the best available equipments. The processing
houses should take advantage of the existing facilities for
testing.

293
It is observed that despite of the awareness level is quite high
but the culture of testing and asserting the standards are
lacking.
Besides as Processing is carried out in most disorganised
manner, the owners and Managers give little importance to the
testing side.
Their priority is generating output in terms of quantity only.
This situation needs a complete reversal. The benefit of quality
testing and testing for eco parameters needs to be informed to
the processors.
Efforts, therefore, should be made to invigorate interactive and
awareness sessions in terms of seminar and workshops amongst
the processing fraternity to inculcate the culture of testing.
6. The effluent treatment facility in the processing sector is
limited and most of the existing treatment facilities are upto
secondary levels of treatment.

294
The effluent treatment has received prime importance for
adhering to the environmental norms. Recent Governmental
regulations on environmental control measures (Particularly
treatment of Effluents) have been stringent. The state
pollution control boards implement their own regulations.
There should be common national standards for pollution
control for textile industry as a whole instead of different
standards prevailing in different states.
The Effluent Treatments must be carried out on the Processing
Units as precaution for preservation of environment.
Besides, on an average, more than 100 liters of water is
required to process 10 Mts. of Fabrics. Given the shortage of
water in many places, reuse of the water is highly essential.
The processing house should be encouraged to adopt ISO
14000 systems. For adopting ISO 14000 and installing proper
ETPs., the process houses should be provided easy interest free
capital for a specific period, since installation of Effluent
Treatment plant \does not increase the productivity rather adds
to the component of the existing cost.
295
7. The textile processing sector has well qualified managers and
supervisors to man the best of processing units of the country.
However, their number is small.
The major processing activities carried out and supervised is by
the operational staff, which constitutes roughly 85% of the total
manpower employed in the Processing Sector.
The Processing units going for modernisation and upgradation
should provide adequate technical training to staff employed in
different shop floor activities and it should be a compulsory
component in the modernisation/upgradation module.
The training will necessarily increase the quality of output
besides optionally using the resources and utilities.
The training institutions and organisations should be identified,
listed and circulated to the Processing Houses for
implementation.
8. Most of the Processing houses in the Medium tech and obsolete
categories work in unsuitable and methical environments. The
health of the staff labour is also compromised for industry’s
benefit.

296
There are many centres that indicate labour employment on
contract basis. The labour is exploited in terms of low wage
payments and larger duration of work.
Many advanced importing countries across the globe are
insisting that the products should be generated by a good
environment with best possible facilities to the labour
participating in production systems.
The implementation of such system is carried out through S.A.
8000. The processing units should be encouraged to adopt S.A.
8000 systems.
6.3 conclusion :
Profile of the Industry:
The processing activities in the textile industry are carried out in
composite mills, spinning units, weaving/knitting units and
independent process houses. The composite units have facilities for
manufacturing yarn and fabrics in addition to the infrastructure
facilities for major processing activities. These units are normally,
large and all the three activities of spinning weaving and processing
are carried out under one roof. Some times the spinning mills also
297
have processing units attached to them. some of the units have
weaving and processing ,and also knitting and processing facilities.
Besides there are processing units that operate independently to cater
to the processing needs of their own work or that of the textile
industry on the job work basis. The type of operational facilities
manpower employment and machinery deployed, the structural
background etc, sharply differentiate the processing units.

1
APPENDIX – I
QUESTIONNAIRE
Part A : General information
(1) Name of the respondent :
(2) Address :
(A) Works : Postal address :
Telephone Mobile
E-mail : Website
(B) Residence : Postal Address :
Telephone
(3) Education :
(A) Conventional :
(1) Upto 10th S.S.C.
(2) Upto 12th H.S.C.
(3) Upto Graduatiion
(B) Technical :
Specify :
(4) Age :
(5) Sex : M F
(6) Native Place :
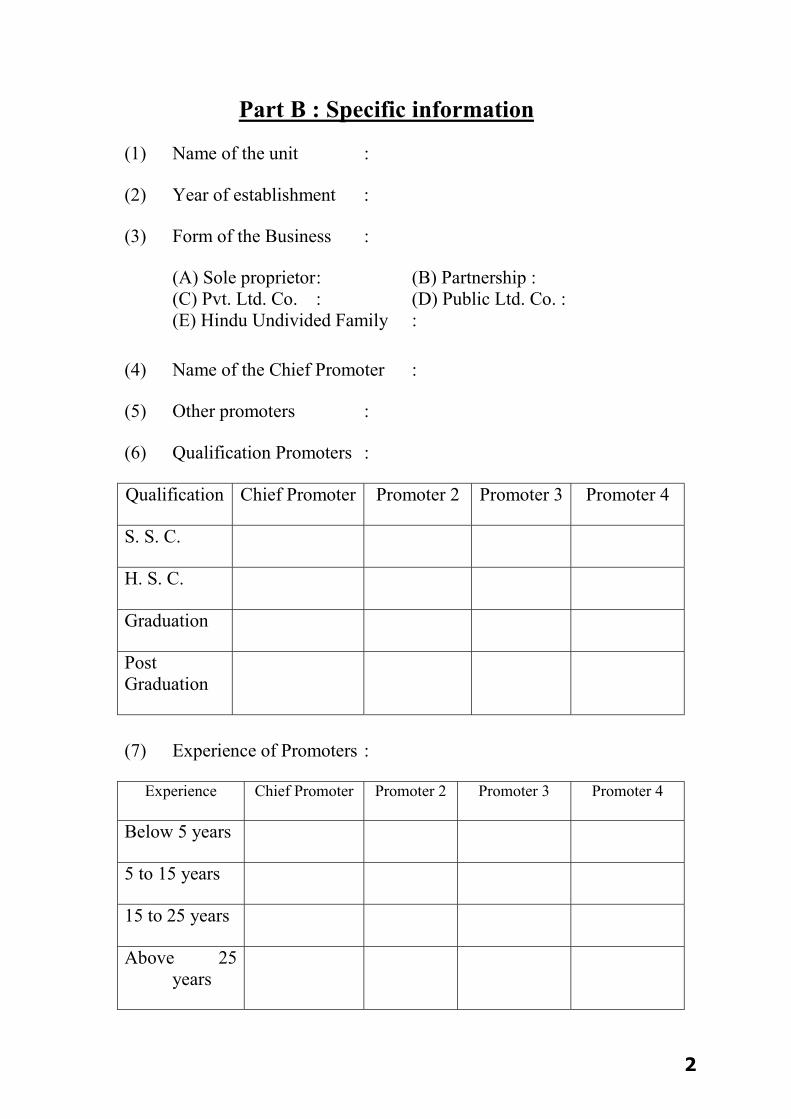
2
Part B : Specific information
(1) Name of the unit :
(2) Year of establishment :
(3) Form of the Business :
(A) Sole proprietor : (B) Partnership : (C) Pvt. Ltd. Co. : (D) Public Ltd. Co. :
(E) Hindu Undivided Family : (4) Name of the Chief Promoter :
(5) Other promoters :
(6) Qualification Promoters :
Qualification Chief Promoter Promoter 2 Promoter 3 Promoter 4
S. S. C.
H. S. C.
Graduation
Post Graduation
(7) Experience of Promoters :
Experience Chief Promoter Promoter 2 Promoter 3 Promoter 4
Below 5 years
5 to 15 years
15 to 25 years
Above 25 years
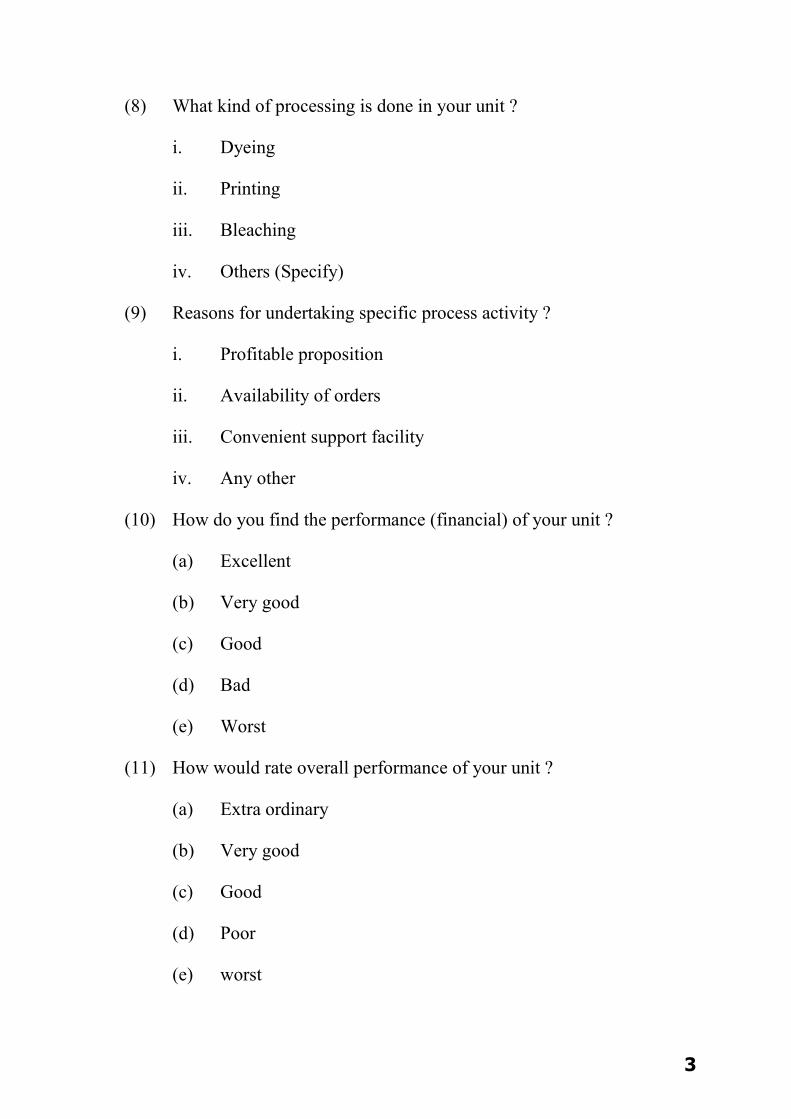
3
(8) What kind of processing is done in your unit ?
i. Dyeing
ii. Printing
iii. Bleaching
iv. Others (Specify)
(9) Reasons for undertaking specific process activity ?
i. Profitable proposition
ii. Availability of orders
iii. Convenient support facility
iv. Any other
(10) How do you find the performance (financial) of your unit ?
(a) Excellent
(b) Very good
(c) Good
(d) Bad
(e) Worst
(11) How would rate overall performance of your unit ?
(a) Extra ordinary
(b) Very good
(c) Good
(d) Poor
(e) worst
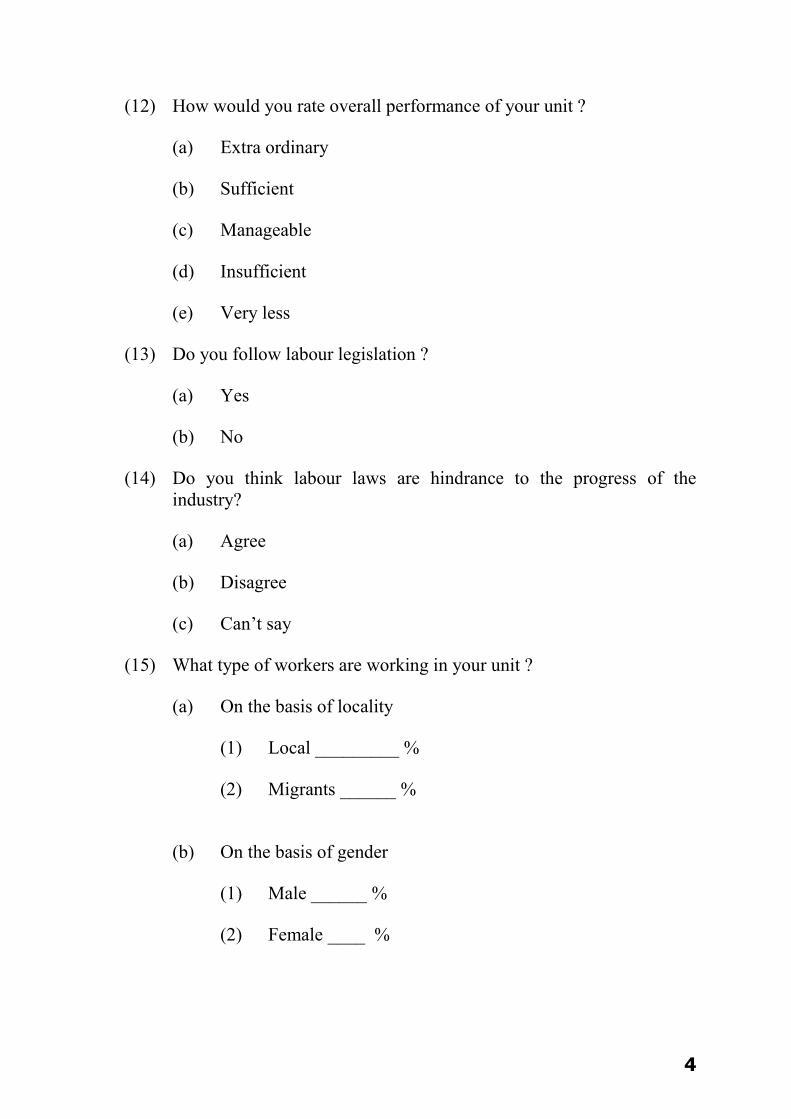
4
(12) How would you rate overall performance of your unit ?
(a) Extra ordinary
(b) Sufficient
(c) Manageable
(d) Insufficient
(e) Very less
(13) Do you follow labour legislation ?
(a) Yes
(b) No
(14) Do you think labour laws are hindrance to the progress of the industry?
(a) Agree
(b) Disagree
(c) Can’t say
(15) What type of workers are working in your unit ?
(a) On the basis of locality
(1) Local _________ %
(2) Migrants ______ %
(b) On the basis of gender
(1) Male ______ %
(2) Female ____ %

5
(c) On the basis of skill
(1) Skilled _____ %
(2) Semi-skilled ____ %
(3) Unskilled _____ %
(d) On the basis of agreement
(a) Employed by the unit.
(b) Employed by the contractor ___ %
(c) On the n nature of employment
(1) Permanent _______ %
(2) Temporary _______%
(3) Casual __________ %
(16) What are the basic problems faced by your unit in terms of labour ?
(Give your ranking)
(A) Inefficient labour ( )
(B) Insufficient Labour supply ( )
(C) High labour turn over ( )
(D) Absentism ( )
(E) Industrial Barganing ( )
(F) Under – performance ( )
(G) Wastage of time ( )
(H) Lack of punctuality ( )
(I) Wastage of raw material ( )
(J) Careless Behaviour ( )
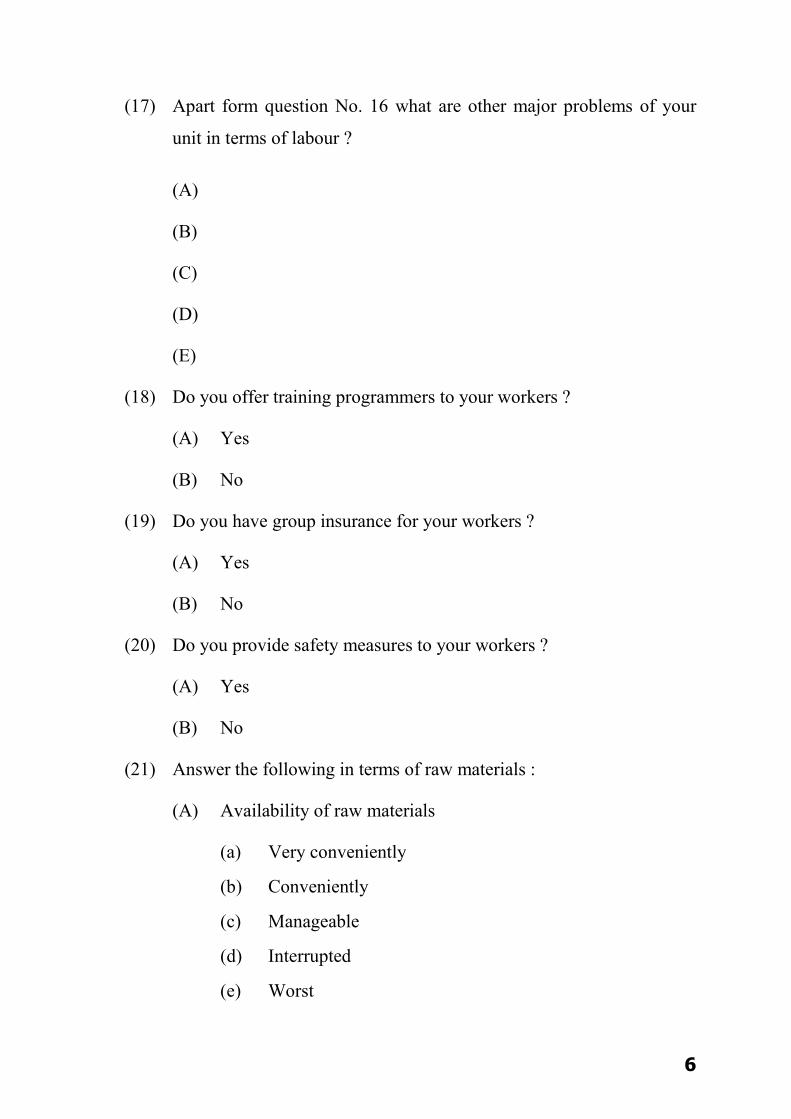
6
(17) Apart form question No. 16 what are other major problems of your
unit in terms of labour ?
(A)
(B)
(C)
(D)
(E)
(18) Do you offer training programmers to your workers ?
(A) Yes
(B) No
(19) Do you have group insurance for your workers ?
(A) Yes
(B) No
(20) Do you provide safety measures to your workers ?
(A) Yes
(B) No
(21) Answer the following in terms of raw materials :
(A) Availability of raw materials
(a) Very conveniently
(b) Conveniently
(c) Manageable
(d) Interrupted
(e) Worst

7
(B) Quality of the raw materials available
(a) Fine
(b) Average
(c) Poor
(C) Prices paid for the raw materials
(a) Very High
(b) Moderately High
(c) Competitive
(d) Moderately less
(e) Very less
(D) Mode of supply of raw materials
(a) Agents
(b) Small industries
(c) Others (specify)
(22) Do you have an inventory control system ?
(a) Yes
(b) No
If yes what king of inventory control system is followed___ specify
(23) Do you have wastage(of any kind) problems in terms of raw materials?
(a) Yes
(b) No
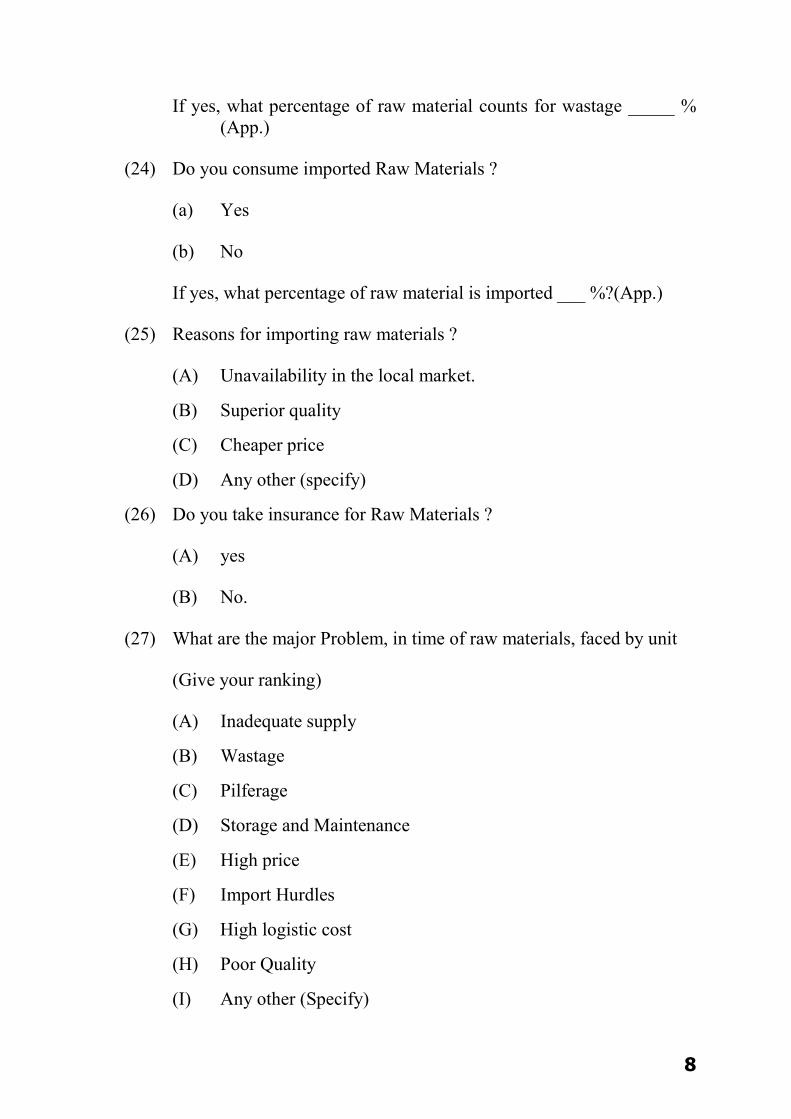
8
If yes, what percentage of raw material counts for wastage _____ % (App.)
(24) Do you consume imported Raw Materials ?
(a) Yes
(b) No
If yes, what percentage of raw material is imported ___ %?(App.)
(25) Reasons for importing raw materials ?
(A) Unavailability in the local market.
(B) Superior quality
(C) Cheaper price
(D) Any other (specify)
(26) Do you take insurance for Raw Materials ?
(A) yes
(B) No.
(27) What are the major Problem, in time of raw materials, faced by unit
(Give your ranking)
(A) Inadequate supply
(B) Wastage
(C) Pilferage
(D) Storage and Maintenance
(E) High price
(F) Import Hurdles
(G) High logistic cost
(H) Poor Quality
(I) Any other (Specify)
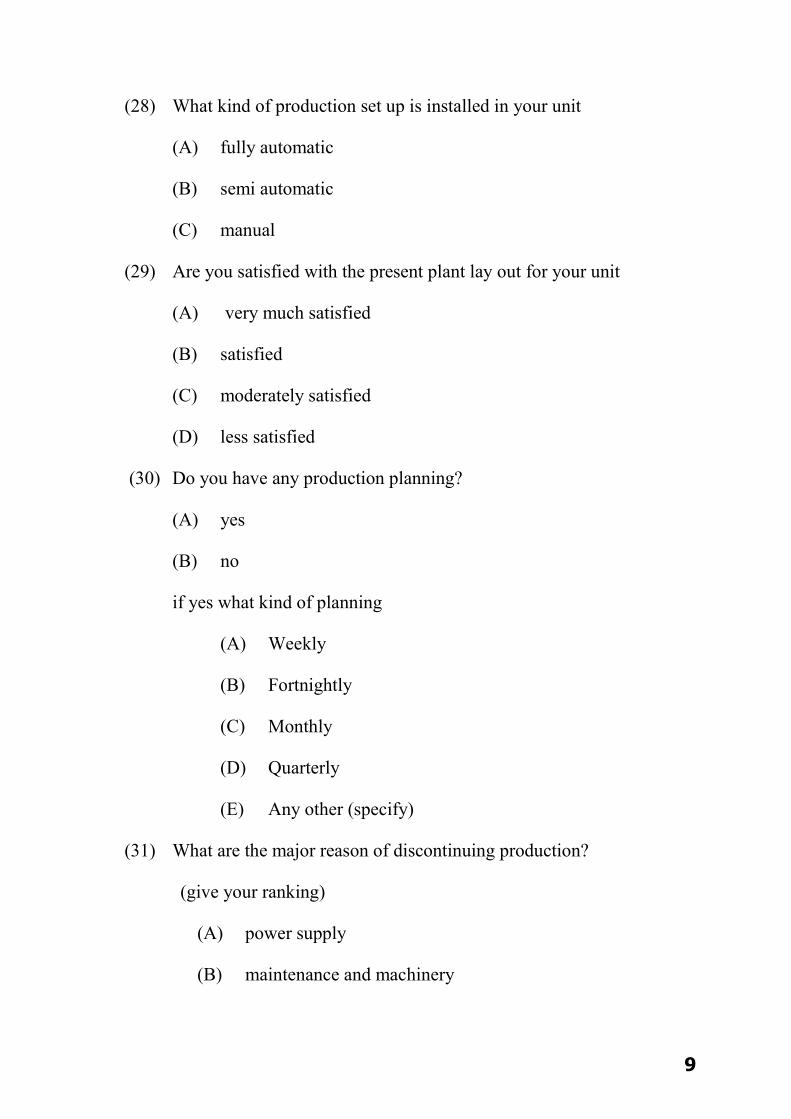
9
(28) What kind of production set up is installed in your unit
(A) fully automatic
(B) semi automatic
(C) manual
(29) Are you satisfied with the present plant lay out for your unit
(A) very much satisfied
(B) satisfied
(C) moderately satisfied
(D) less satisfied
(30) Do you have any production planning?
(A) yes
(B) no
if yes what kind of planning
(A) Weekly
(B) Fortnightly
(C) Monthly
(D) Quarterly
(E) Any other (specify)
(31) What are the major reason of discontinuing production?
(give your ranking)
(A) power supply
(B) maintenance and machinery
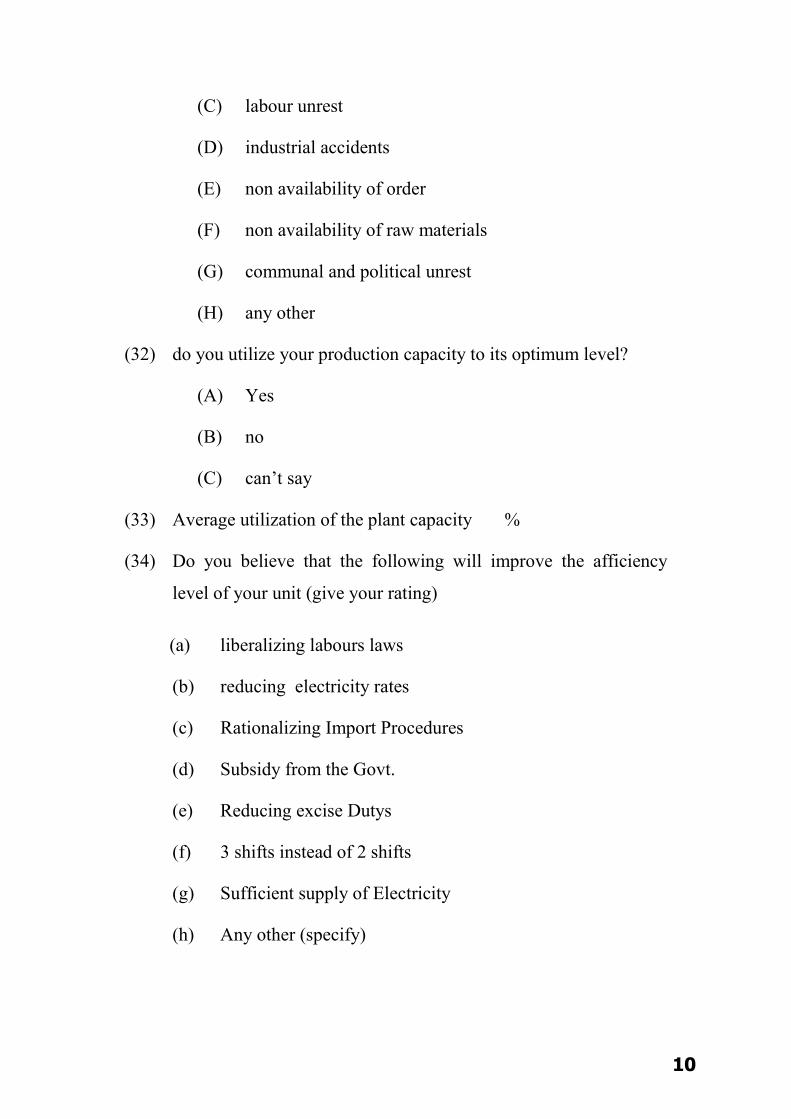
10
(C) labour unrest
(D) industrial accidents
(E) non availability of order
(F) non availability of raw materials
(G) communal and political unrest
(H) any other
(32) do you utilize your production capacity to its optimum level?
(A) Yes
(B) no
(C) can’t say
(33) Average utilization of the plant capacity %
(34) Do you believe that the following will improve the afficiency
level of your unit (give your rating)
(a) liberalizing labours laws
(b) reducing electricity rates
(c) Rationalizing Import Procedures
(d) Subsidy from the Govt.
(e) Reducing excise Dutys
(f) 3 shifts instead of 2 shifts
(g) Sufficient supply of Electricity
(h) Any other (specify)

11
(35) From whom do you get the solution to the critical problems
(A) Advisory staff
(B) Professional Consultants
(C) Friends and Family Members
(D) Self Solution
(E) Any other (specify)
(36) Production activities are carried out for______
(37) Marketiong of the product is done by _______
(A) Unit itself
(B) Other agency
(C) Both
(38) Marketing efforts of your unit includes _____
(A) Sales and Promotion
(B) Quality Improvement of the Product
(C) Price Consideration
(D) Logistic Arrangement
(E) All of the above
(39) Does the govement provide any support in marketing of your product?
(A) Yes
(B) No
If yes. What king of support is available?
If no. what kind of support from the Govt. you would appreciate?

12
(40) Do you frrl that middlemen are taking away most of the profits and
manufacturing units (like you) are not able to have minimum due
profits?
(A) Strongly agree
(B) Agree
(C) Disagree
(D) Disagree
(E) Strongly Disagree
(41) How do you find your distribution network?
(A) Very Good
(B) Considerably Good
(C) Not Good
(42) How do you find pricing of the product manufactured by your unit?
(A) Above the marker
(B) As per the market
(C) Below the market
(43) Do you feel that cut-throat competition is prevailing in the market .
and as a result you are forced to reduce the prices of your prodicts
quite often?
(A) Yes
(B) Can’t say
(C) No

13
(44) Efforts included in promotional activities
(A) T.V. Ads (Local & Nayional Channels)
(B) Print Media (News Papers & Maga/ines)
(C) Hoardings
(D) Exhibition
(E) Fashion shows & Evwents
(F) Any orher (specity)
(45) What % of the income are spent on promotional activities______%
(46) How do you carry out promotional activities?
(A) From permant staff
(B) Hired professional
(C) Agencies
(D) Others (specify)
(47) Impact of promotional activities on sales
(A) Very High
(B) Moderate
(C) Can’t say
(D) Low
(E) No Impact
(48) What is the major market fot your product?
(A) North (B) East
(C) West (D) South
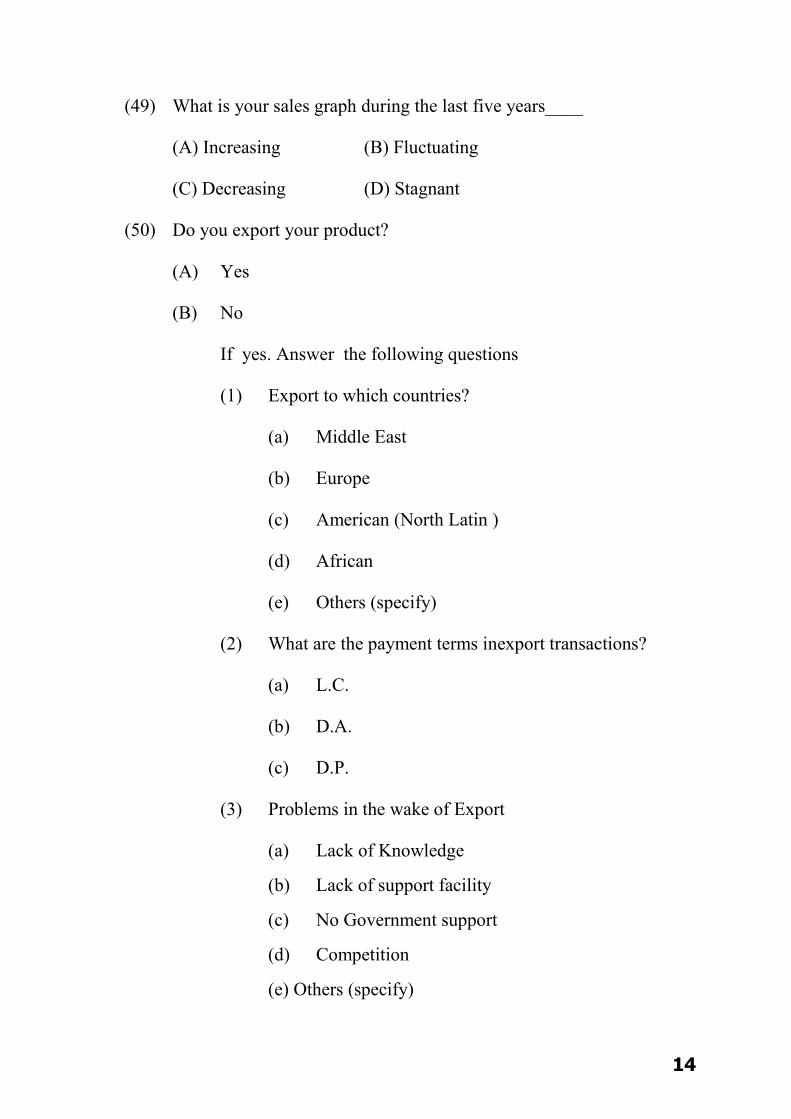
14
(49) What is your sales graph during the last five years____
(A) Increasing (B) Fluctuating
(C) Decreasing (D) Stagnant
(50) Do you export your product?
(A) Yes
(B) No
If yes. Answer the following questions
(1) Export to which countries?
(a) Middle East
(b) Europe
(c) American (North Latin )
(d) African
(e) Others (specify)
(2) What are the payment terms inexport transactions?
(a) L.C.
(b) D.A.
(c) D.P.
(3) Problems in the wake of Export
(a) Lack of Knowledge
(b) Lack of support facility
(c) No Government support
(d) Competition
(e) Others (specify)

15
(52) Major Problem for the unit______(Give your ranking)
(A) Government Rules and Regulations
(B) Competitions
(C) Social Activists Change
(D) Technological Change
(E) Lack of Orders
(F) Lack of Orders
(G) Labour Problems
(H) Any Other (specify)
(53) Are you member of any association?
(A) Yes
(B) No
If yes. Does it help you in your business?
(A) Yes
(B) No
(C) Can’t say
(54) What other major problems are there in your Industry?
(1)
(2)
(3)
(4)
(5)
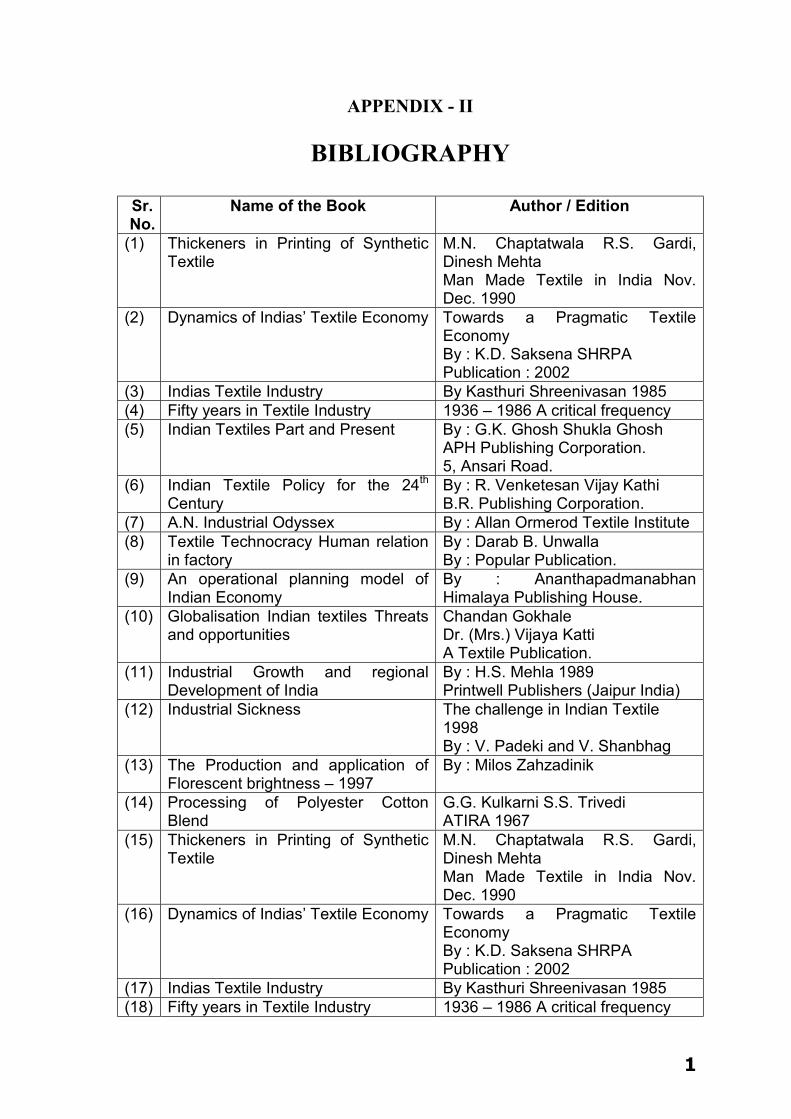
1
APPENDIX - II
BIBLIOGRAPHY
Sr. No.
Name of the Book Author / Edition
(1) Thickeners in Printing of Synthetic Textile
M.N. Chaptatwala R.S. Gardi, Dinesh Mehta Man Made Textile in India Nov. Dec. 1990
(2) Dynamics of Indias’ Textile Economy Towards a Pragmatic Textile Economy By : K.D. Saksena SHRPA Publication : 2002
(3) Indias Textile Industry By Kasthuri Shreenivasan 1985 (4) Fifty years in Textile Industry 1936 – 1986 A critical frequency (5) Indian Textiles Part and Present By : G.K. Ghosh Shukla Ghosh
APH Publishing Corporation. 5, Ansari Road.
(6) Indian Textile Policy for the 24th Century
By : R. Venketesan Vijay Kathi B.R. Publishing Corporation.
(7) A.N. Industrial Odyssex By : Allan Ormerod Textile Institute (8) Textile Technocracy Human relation
in factory By : Darab B. Unwalla By : Popular Publication.
(9) An operational planning model of Indian Economy
By : Ananthapadmanabhan Himalaya Publishing House.
(10) Globalisation Indian textiles Threats and opportunities
Chandan Gokhale Dr. (Mrs.) Vijaya Katti A Textile Publication.
(11) Industrial Growth and regional Development of India
By : H.S. Mehla 1989 Printwell Publishers (Jaipur India)
(12) Industrial Sickness The challenge in Indian Textile 1998 By : V. Padeki and V. Shanbhag
(13) The Production and application of Florescent brightness – 1997
By : Milos Zahzadinik
(14) Processing of Polyester Cotton Blend
G.G. Kulkarni S.S. Trivedi ATIRA 1967
(15) Thickeners in Printing of Synthetic Textile
M.N. Chaptatwala R.S. Gardi, Dinesh Mehta Man Made Textile in India Nov. Dec. 1990
(16) Dynamics of Indias’ Textile Economy Towards a Pragmatic Textile Economy By : K.D. Saksena SHRPA Publication : 2002
(17) Indias Textile Industry By Kasthuri Shreenivasan 1985 (18) Fifty years in Textile Industry 1936 – 1986 A critical frequency
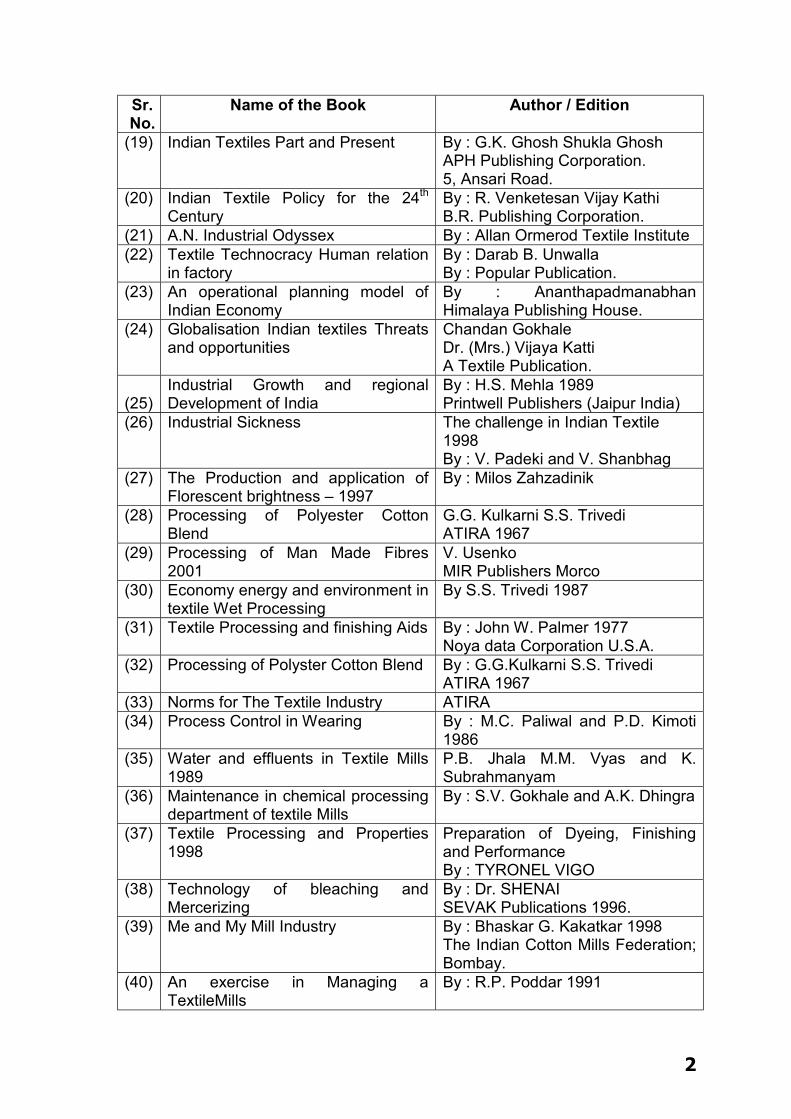
2
Sr. No.
Name of the Book Author / Edition
(19) Indian Textiles Part and Present By : G.K. Ghosh Shukla Ghosh APH Publishing Corporation. 5, Ansari Road.
(20) Indian Textile Policy for the 24th Century
By : R. Venketesan Vijay Kathi B.R. Publishing Corporation.
(21) A.N. Industrial Odyssex By : Allan Ormerod Textile Institute (22) Textile Technocracy Human relation
in factory By : Darab B. Unwalla By : Popular Publication.
(23) An operational planning model of Indian Economy
By : Ananthapadmanabhan Himalaya Publishing House.
(24) Globalisation Indian textiles Threats and opportunities
Chandan Gokhale Dr. (Mrs.) Vijaya Katti A Textile Publication.
(25)
Industrial Growth and regional Development of India
By : H.S. Mehla 1989 Printwell Publishers (Jaipur India)
(26) Industrial Sickness The challenge in Indian Textile 1998 By : V. Padeki and V. Shanbhag
(27) The Production and application of Florescent brightness – 1997
By : Milos Zahzadinik
(28) Processing of Polyester Cotton Blend
G.G. Kulkarni S.S. Trivedi ATIRA 1967
(29) Processing of Man Made Fibres 2001
V. Usenko MIR Publishers Morco
(30) Economy energy and environment in textile Wet Processing
By S.S. Trivedi 1987
(31) Textile Processing and finishing Aids By : John W. Palmer 1977 Noya data Corporation U.S.A.
(32) Processing of Polyster Cotton Blend By : G.G.Kulkarni S.S. Trivedi ATIRA 1967
(33) Norms for The Textile Industry ATIRA (34) Process Control in Wearing By : M.C. Paliwal and P.D. Kimoti
1986 (35) Water and effluents in Textile Mills
1989 P.B. Jhala M.M. Vyas and K. Subrahmanyam
(36) Maintenance in chemical processing department of textile Mills
By : S.V. Gokhale and A.K. Dhingra
(37) Textile Processing and Properties 1998
Preparation of Dyeing, Finishing and Performance By : TYRONEL VIGO
(38) Technology of bleaching and Mercerizing
By : Dr. SHENAI SEVAK Publications 1996.
(39) Me and My Mill Industry By : Bhaskar G. Kakatkar 1998 The Indian Cotton Mills Federation; Bombay.
(40) An exercise in Managing a TextileMills
By : R.P. Poddar 1991
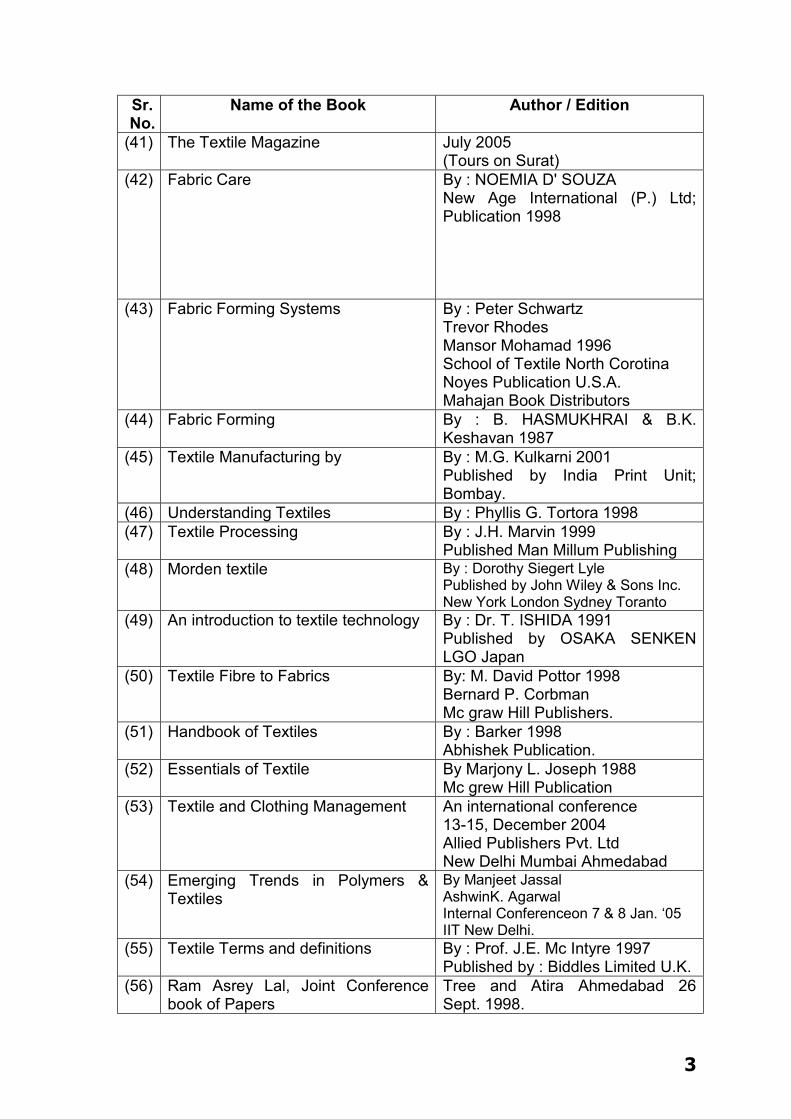
3
Sr. No.
Name of the Book Author / Edition
(41) The Textile Magazine July 2005 (Tours on Surat)
(42) Fabric Care By : NOEMIA D' SOUZA New Age International (P.) Ltd; Publication 1998
(43) Fabric Forming Systems By : Peter Schwartz Trevor Rhodes Mansor Mohamad 1996 School of Textile North Corotina Noyes Publication U.S.A. Mahajan Book Distributors
(44) Fabric Forming By : B. HASMUKHRAI & B.K. Keshavan 1987
(45) Textile Manufacturing by By : M.G. Kulkarni 2001 Published by India Print Unit; Bombay.
(46) Understanding Textiles By : Phyllis G. Tortora 1998 (47) Textile Processing By : J.H. Marvin 1999
Published Man Millum Publishing (48) Morden textile By : Dorothy Siegert Lyle
Published by John Wiley & Sons Inc. New York London Sydney Toranto
(49) An introduction to textile technology By : Dr. T. ISHIDA 1991 Published by OSAKA SENKEN LGO Japan
(50) Textile Fibre to Fabrics By: M. David Pottor 1998 Bernard P. Corbman Mc graw Hill Publishers.
(51) Handbook of Textiles By : Barker 1998 Abhishek Publication.
(52) Essentials of Textile By Marjony L. Joseph 1988 Mc grew Hill Publication
(53) Textile and Clothing Management An international conference 13-15, December 2004 Allied Publishers Pvt. Ltd New Delhi Mumbai Ahmedabad
(54) Emerging Trends in Polymers & Textiles
By Manjeet Jassal AshwinK. Agarwal Internal Conferenceon 7 & 8 Jan. ‘05 IIT New Delhi.
(55) Textile Terms and definitions By : Prof. J.E. Mc Intyre 1997 Published by : Biddles Limited U.K.
(56) Ram Asrey Lal, Joint Conference book of Papers
Tree and Atira Ahmedabad 26 Sept. 1998.
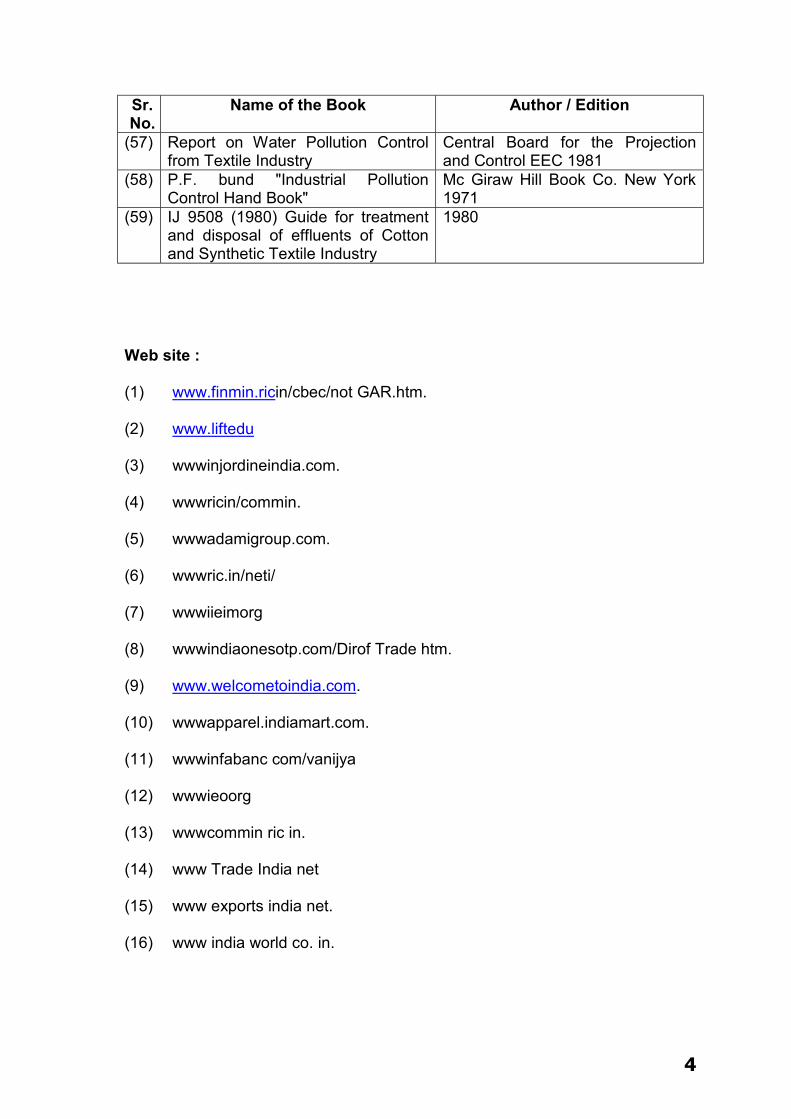
4
Sr. No.
Name of the Book Author / Edition
(57) Report on Water Pollution Control from Textile Industry
Central Board for the Projection and Control EEC 1981
(58) P.F. bund "Industrial Pollution Control Hand Book"
Mc Giraw Hill Book Co. New York 1971
(59) IJ 9508 (1980) Guide for treatment and disposal of effluents of Cotton and Synthetic Textile Industry
1980
Web site :
(1) www.finmin.ricin/cbec/not GAR.htm.
(2) www.liftedu
(3) wwwinjordineindia.com.
(4) wwwricin/commin.
(5) wwwadamigroup.com.
(6) wwwric.in/neti/
(7) wwwiieimorg
(8) wwwindiaonesotp.com/Dirof Trade htm.
(9) www.welcometoindia.com.
(10) wwwapparel.indiamart.com.
(11) wwwinfabanc com/vanijya
(12) wwwieoorg
(13) wwwcommin ric in.
(14) www Trade India net
(15) www exports india net.
(16) www india world co. in.
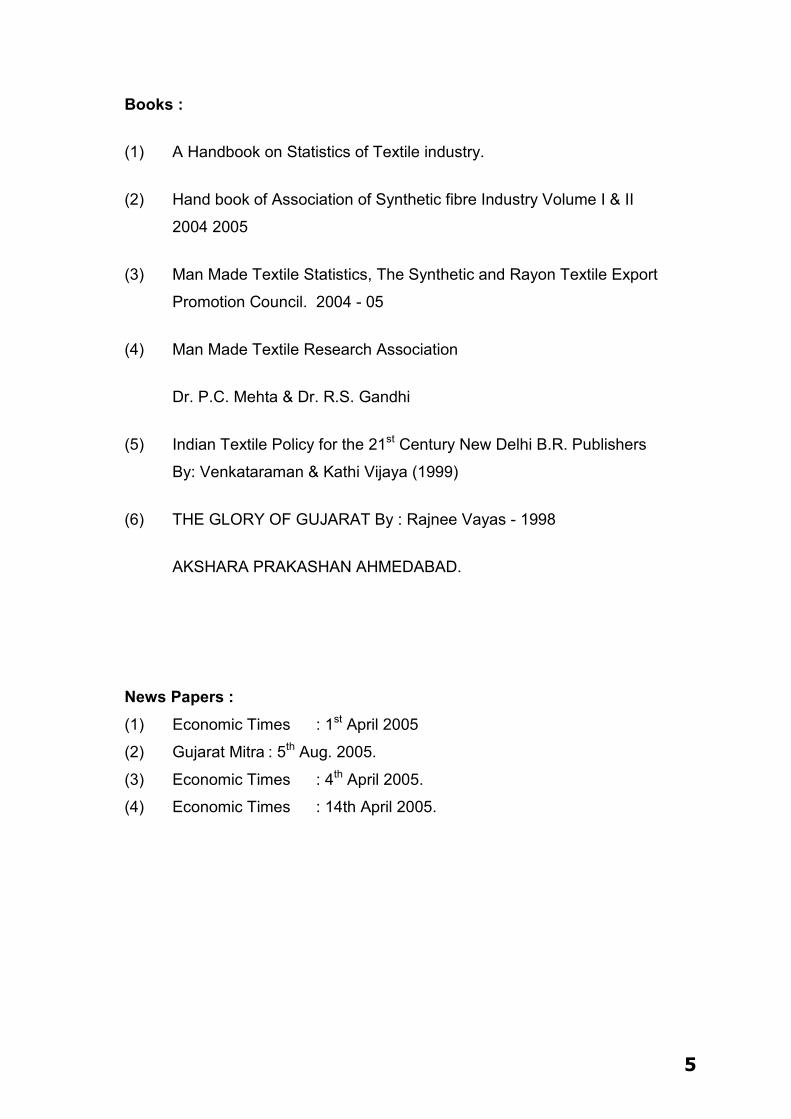
5
Books :
(1) A Handbook on Statistics of Textile industry.
(2) Hand book of Association of Synthetic fibre Industry Volume I & II
2004 2005
(3) Man Made Textile Statistics, The Synthetic and Rayon Textile Export
Promotion Council. 2004 - 05
(4) Man Made Textile Research Association
Dr. P.C. Mehta & Dr. R.S. Gandhi
(5) Indian Textile Policy for the 21st Century New Delhi B.R. Publishers
By: Venkataraman & Kathi Vijaya (1999)
(6) THE GLORY OF GUJARAT By : Rajnee Vayas - 1998
AKSHARA PRAKASHAN AHMEDABAD.
News Papers : (1) Economic Times : 1st April 2005
(2) Gujarat Mitra : 5th Aug. 2005.
(3) Economic Times : 4th April 2005.
(4) Economic Times : 14th April 2005.
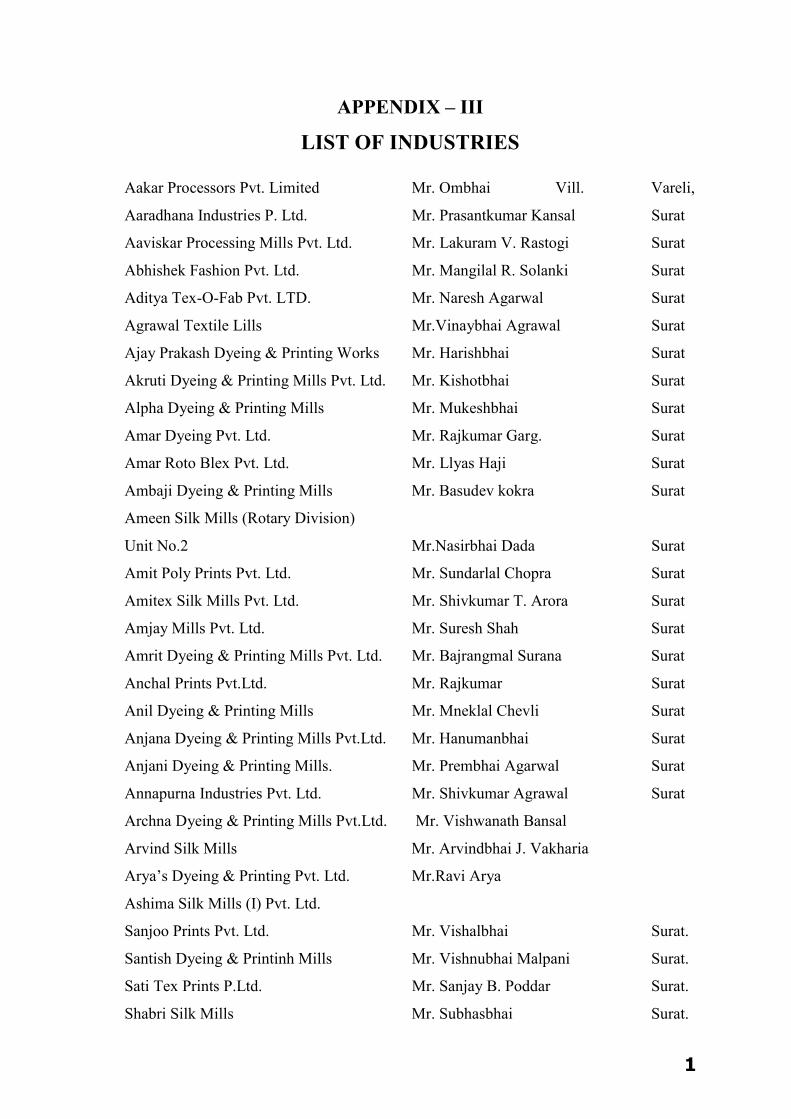
1
APPENDIX – III
LIST OF INDUSTRIES
Aakar Processors Pvt. Limited Mr. Ombhai Vill. Vareli,
Aaradhana Industries P. Ltd. Mr. Prasantkumar Kansal Surat
Aaviskar Processing Mills Pvt. Ltd. Mr. Lakuram V. Rastogi Surat
Abhishek Fashion Pvt. Ltd. Mr. Mangilal R. Solanki Surat
Aditya Tex-O-Fab Pvt. LTD. Mr. Naresh Agarwal Surat
Agrawal Textile Lills Mr.Vinaybhai Agrawal Surat
Ajay Prakash Dyeing & Printing Works Mr. Harishbhai Surat
Akruti Dyeing & Printing Mills Pvt. Ltd. Mr. Kishotbhai Surat
Alpha Dyeing & Printing Mills Mr. Mukeshbhai Surat
Amar Dyeing Pvt. Ltd. Mr. Rajkumar Garg. Surat
Amar Roto Blex Pvt. Ltd. Mr. Llyas Haji Surat
Ambaji Dyeing & Printing Mills Mr. Basudev kokra Surat
Ameen Silk Mills (Rotary Division)
Unit No.2 Mr.Nasirbhai Dada Surat
Amit Poly Prints Pvt. Ltd. Mr. Sundarlal Chopra Surat
Amitex Silk Mills Pvt. Ltd. Mr. Shivkumar T. Arora Surat
Amjay Mills Pvt. Ltd. Mr. Suresh Shah Surat
Amrit Dyeing & Printing Mills Pvt. Ltd. Mr. Bajrangmal Surana Surat
Anchal Prints Pvt.Ltd. Mr. Rajkumar Surat
Anil Dyeing & Printing Mills Mr. Mneklal Chevli Surat
Anjana Dyeing & Printing Mills Pvt.Ltd. Mr. Hanumanbhai Surat
Anjani Dyeing & Printing Mills. Mr. Prembhai Agarwal Surat
Annapurna Industries Pvt. Ltd. Mr. Shivkumar Agrawal Surat
Archna Dyeing & Printing Mills Pvt.Ltd. Mr. Vishwanath Bansal
Arvind Silk Mills Mr. Arvindbhai J. Vakharia
Arya’s Dyeing & Printing Pvt. Ltd. Mr.Ravi Arya
Ashima Silk Mills (I) Pvt. Ltd.
Sanjoo Prints Pvt. Ltd. Mr. Vishalbhai Surat.
Santish Dyeing & Printinh Mills Mr. Vishnubhai Malpani Surat.
Sati Tex Prints P.Ltd. Mr. Sanjay B. Poddar Surat.
Shabri Silk Mills Mr. Subhasbhai Surat.
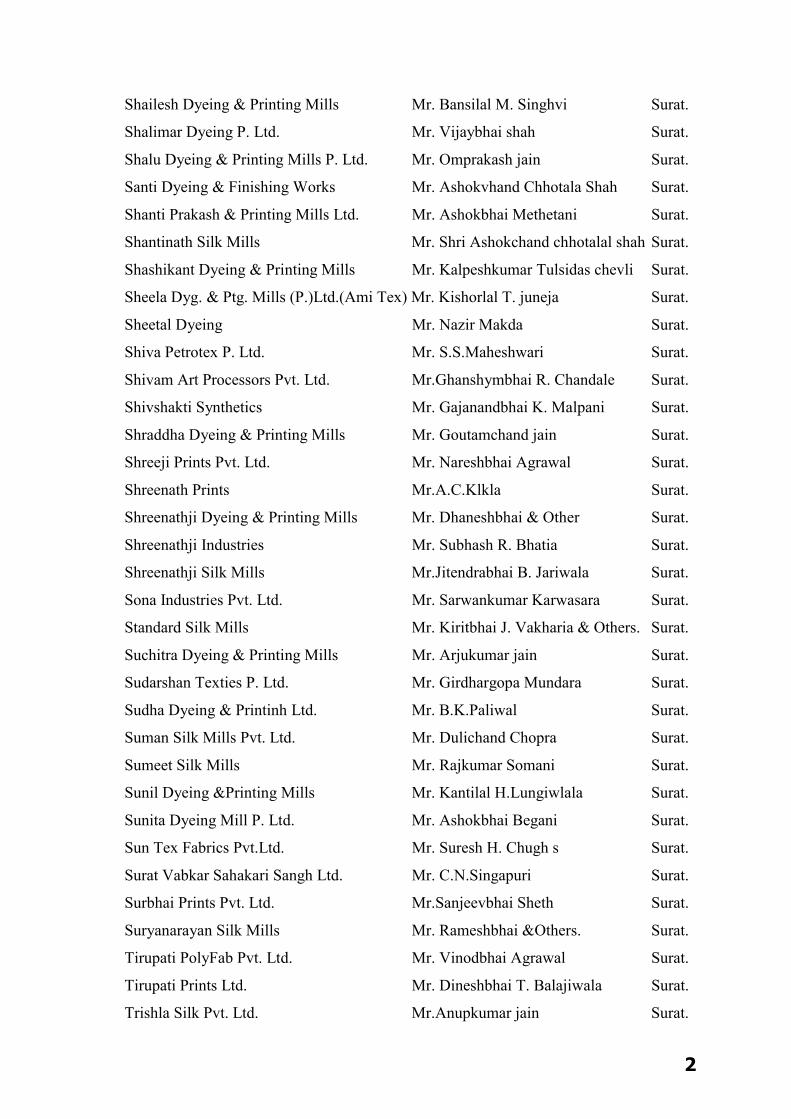
2
Shailesh Dyeing & Printing Mills Mr. Bansilal M. Singhvi Surat.
Shalimar Dyeing P. Ltd. Mr. Vijaybhai shah Surat.
Shalu Dyeing & Printing Mills P. Ltd. Mr. Omprakash jain Surat.
Santi Dyeing & Finishing Works Mr. Ashokvhand Chhotala Shah Surat.
Shanti Prakash & Printing Mills Ltd. Mr. Ashokbhai Methetani Surat.
Shantinath Silk Mills Mr. Shri Ashokchand chhotalal shah Surat.
Shashikant Dyeing & Printing Mills Mr. Kalpeshkumar Tulsidas chevli Surat.
Sheela Dyg. & Ptg. Mills (P.)Ltd.(Ami Tex) Mr. Kishorlal T. juneja Surat.
Sheetal Dyeing Mr. Nazir Makda Surat.
Shiva Petrotex P. Ltd. Mr. S.S.Maheshwari Surat.
Shivam Art Processors Pvt. Ltd. Mr.Ghanshymbhai R. Chandale Surat.
Shivshakti Synthetics Mr. Gajanandbhai K. Malpani Surat.
Shraddha Dyeing & Printing Mills Mr. Goutamchand jain Surat.
Shreeji Prints Pvt. Ltd. Mr. Nareshbhai Agrawal Surat.
Shreenath Prints Mr.A.C.Klkla Surat.
Shreenathji Dyeing & Printing Mills Mr. Dhaneshbhai & Other Surat.
Shreenathji Industries Mr. Subhash R. Bhatia Surat.
Shreenathji Silk Mills Mr.Jitendrabhai B. Jariwala Surat.
Sona Industries Pvt. Ltd. Mr. Sarwankumar Karwasara Surat.
Standard Silk Mills Mr. Kiritbhai J. Vakharia & Others. Surat.
Suchitra Dyeing & Printing Mills Mr. Arjukumar jain Surat.
Sudarshan Texties P. Ltd. Mr. Girdhargopa Mundara Surat.
Sudha Dyeing & Printinh Ltd. Mr. B.K.Paliwal Surat.
Suman Silk Mills Pvt. Ltd. Mr. Dulichand Chopra Surat.
Sumeet Silk Mills Mr. Rajkumar Somani Surat.
Sunil Dyeing &Printing Mills Mr. Kantilal H.Lungiwlala Surat.
Sunita Dyeing Mill P. Ltd. Mr. Ashokbhai Begani Surat.
Sun Tex Fabrics Pvt.Ltd. Mr. Suresh H. Chugh s Surat.
Surat Vabkar Sahakari Sangh Ltd. Mr. C.N.Singapuri Surat.
Surbhai Prints Pvt. Ltd. Mr.Sanjeevbhai Sheth Surat.
Suryanarayan Silk Mills Mr. Rameshbhai &Others. Surat.
Tirupati PolyFab Pvt. Ltd. Mr. Vinodbhai Agrawal Surat.
Tirupati Prints Ltd. Mr. Dineshbhai T. Balajiwala Surat.
Trishla Silk Pvt. Ltd. Mr.Anupkumar jain Surat.
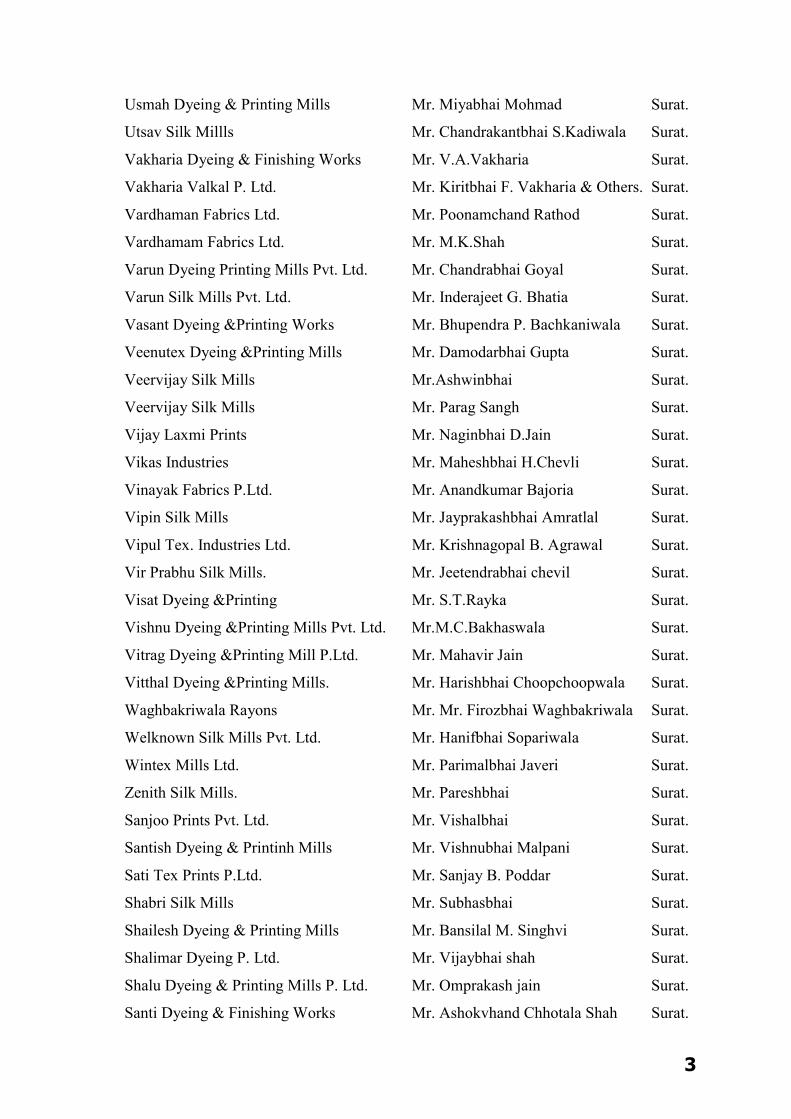
3
Usmah Dyeing & Printing Mills Mr. Miyabhai Mohmad Surat.
Utsav Silk Millls Mr. Chandrakantbhai S.Kadiwala Surat.
Vakharia Dyeing & Finishing Works Mr. V.A.Vakharia Surat.
Vakharia Valkal P. Ltd. Mr. Kiritbhai F. Vakharia & Others. Surat.
Vardhaman Fabrics Ltd. Mr. Poonamchand Rathod Surat.
Vardhamam Fabrics Ltd. Mr. M.K.Shah Surat.
Varun Dyeing Printing Mills Pvt. Ltd. Mr. Chandrabhai Goyal Surat.
Varun Silk Mills Pvt. Ltd. Mr. Inderajeet G. Bhatia Surat.
Vasant Dyeing &Printing Works Mr. Bhupendra P. Bachkaniwala Surat.
Veenutex Dyeing &Printing Mills Mr. Damodarbhai Gupta Surat.
Veervijay Silk Mills Mr.Ashwinbhai Surat.
Veervijay Silk Mills Mr. Parag Sangh Surat.
Vijay Laxmi Prints Mr. Naginbhai D.Jain Surat.
Vikas Industries Mr. Maheshbhai H.Chevli Surat.
Vinayak Fabrics P.Ltd. Mr. Anandkumar Bajoria Surat.
Vipin Silk Mills Mr. Jayprakashbhai Amratlal Surat.
Vipul Tex. Industries Ltd. Mr. Krishnagopal B. Agrawal Surat.
Vir Prabhu Silk Mills. Mr. Jeetendrabhai chevil Surat.
Visat Dyeing &Printing Mr. S.T.Rayka Surat.
Vishnu Dyeing &Printing Mills Pvt. Ltd. Mr.M.C.Bakhaswala Surat.
Vitrag Dyeing &Printing Mill P.Ltd. Mr. Mahavir Jain Surat.
Vitthal Dyeing &Printing Mills. Mr. Harishbhai Choopchoopwala Surat.
Waghbakriwala Rayons Mr. Mr. Firozbhai Waghbakriwala Surat.
Welknown Silk Mills Pvt. Ltd. Mr. Hanifbhai Sopariwala Surat.
Wintex Mills Ltd. Mr. Parimalbhai Javeri Surat.
Zenith Silk Mills. Mr. Pareshbhai Surat.
Sanjoo Prints Pvt. Ltd. Mr. Vishalbhai Surat.
Santish Dyeing & Printinh Mills Mr. Vishnubhai Malpani Surat.
Sati Tex Prints P.Ltd. Mr. Sanjay B. Poddar Surat.
Shabri Silk Mills Mr. Subhasbhai Surat.
Shailesh Dyeing & Printing Mills Mr. Bansilal M. Singhvi Surat.
Shalimar Dyeing P. Ltd. Mr. Vijaybhai shah Surat.
Shalu Dyeing & Printing Mills P. Ltd. Mr. Omprakash jain Surat.
Santi Dyeing & Finishing Works Mr. Ashokvhand Chhotala Shah Surat.

4
Shanti Prakash & Printing Mills Ltd. Mr. Ashokbhai Methetani Surat.
Shantinath Silk Mills Mr. Shri Ashokchand chhotalal shah Surat.
Shashikant Dyeing & Printing Mills Mr. Kalpeshkumar Tulsidas chevli Surat.
Sheela Dyg. & Ptg. Mills (P.)Ltd.(Ami Tex) Mr. Kishorlal T. juneja Surat.
Sheetal Dyeing Mr. Nazir Makda Surat.
Shiva Petrotex P. Ltd. Mr. S.S.Maheshwari Surat.
Shivam Art Processors Pvt. Ltd. Mr.Ghanshymbhai R. Chandale Surat.
Shivshakti Synthetics Mr. Gajanandbhai K. Malpani Surat.
Shraddha Dyeing & Printing Mills Mr. Goutamchand jain Surat.
Shreeji Prints Pvt. Ltd. Mr. Nareshbhai Agrawal Surat.
Shreenath Prints Mr.A.C.Klkla Surat.
Shreenathji Dyeing & Printing Mills Mr. Dhaneshbhai & Other Surat.
Shreenathji Industries Mr. Subhash R. Bhatia Surat.
Shreenathji Silk Mills Mr.Jitendrabhai B. Jariwala Surat.
Sona Industries Pvt. Ltd. Mr. Sarwankumar Karwasara Surat.
Standard Silk Mills Mr. Kiritbhai J. Vakharia & Others. Surat.
Suchitra Dyeing & Printing Mills Mr. Arjukumar jain Surat.
Sudarshan Texties P. Ltd. Mr. Girdhargopa Mundara Surat.
Sudha Dyeing & Printinh Ltd. Mr. B.K.Paliwal Surat.
Suman Silk Mills Pvt. Ltd. Mr. Dulichand Chopra Surat.
Sumeet Silk Mills Mr. Rajkumar Somani Surat.
Sunil Dyeing &Printing Mills Mr. Kantilal H.Lungiwlala Surat.
Sunita Dyeing Mill P. Ltd. Mr. Ashokbhai Begani Surat.
Sun Tex Fabrics Pvt.Ltd. Mr. Suresh H. Chugh s Surat.
Surat Vabkar Sahakari Sangh Ltd. Mr. C.N.Singapuri Surat.
Surbhai Prints Pvt. Ltd. Mr.Sanjeevbhai Sheth Surat.
Suryanarayan Silk Mills Mr. Rameshbhai &Others. Surat.
Tirupati PolyFab Pvt. Ltd. Mr. Vinodbhai Agrawal Surat.
Tirupati Prints Ltd. Mr. Dineshbhai T. Balajiwala Surat.
Trishla Silk Pvt. Ltd. Mr.Anupkumar jain Surat.
Usmah Dyeing & Printing Mills Mr. Miyabhai Mohmad Surat.
Utsav Silk Millls Mr. Chandrakantbhai S.Kadiwala Surat.
Vakharia Dyeing & Finishing Works Mr. V.A.Vakharia Surat.
Vakharia Valkal P. Ltd. Mr. Kiritbhai F. Vakharia & Others. Surat.

5
Vardhaman Fabrics Ltd. Mr. Poonamchand Rathod Surat.
Vardhamam Fabrics Ltd. Mr. M.K.Shah Surat.
Varun Dyeing Printing Mills Pvt. Ltd. Mr. Chandrabhai Goyal Surat.
Varun Silk Mills Pvt. Ltd. Mr. Inderajeet G. Bhatia Surat.
Vasant Dyeing &Printing Works Mr. Bhupendra P. Bachkaniwala Surat.
Veenutex Dyeing &Printing Mills Mr. Damodarbhai Gupta Surat.
Veervijay Silk Mills Mr.Ashwinbhai Surat.
Veervijay Silk Mills Mr. Parag Sangh Surat.
Vijay Laxmi Prints Mr. Naginbhai D.Jain Surat.
Vikas Industries Mr. Maheshbhai H.Chevli Surat.
Vinayak Fabrics P.Ltd. Mr. Anandkumar Bajoria Surat.
Vipin Silk Mills Mr. Jayprakashbhai Amratlal Surat.
Vipul Tex. Industries Ltd. Mr. Krishnagopal B. Agrawal Surat.
Vir Prabhu Silk Mills. Mr. Jeetendrabhai chevil Surat.
Visat Dyeing &Printing Mr. S.T.Rayka Surat.
Vishnu Dyeing &Printing Mills Pvt. Ltd. Mr.M.C.Bakhaswala Surat.
Vitrag Dyeing &Printing Mill P.Ltd. Mr. Mahavir Jain Surat.
Vitthal Dyeing &Printing Mills. Mr. Harishbhai Choopchoopwala Surat.
Waghbakriwala Rayons Mr. Mr. Firozbhai Waghbakriwala Surat.
Welknown Silk Mills Pvt. Ltd. Mr. Hanifbhai Sopariwala Surat.
Wintex Mills Ltd. Mr. Parimalbhai Javeri Surat.
Zenith Silk Mills. Mr. Pareshbhai Surat.