Saudi Economic Chartbook
20
Hans-Peter Huber, PhD Chief Investment Officer Riyad Capital 6775 Takhassusi St. – Olaya Riyadh 12331-3712 rccioof�[email protected] Saudi Economic Chartbook *This report is Issued by Riyad Capital First Quarter 2018
Transcript of Saudi Economic Chartbook
Hans-Peter Huber, PhD Chief Investment Officer Riyad Capital 6775 Takhassusi St. – Olaya Riyadh 12331-3712 rccioof�[email protected]
Saudi Economic Chartbook
*This report is Issued by Riyad Capital
First Quarter 2018
Saudi Economic Chartbook First Quarter 2018
Page 1
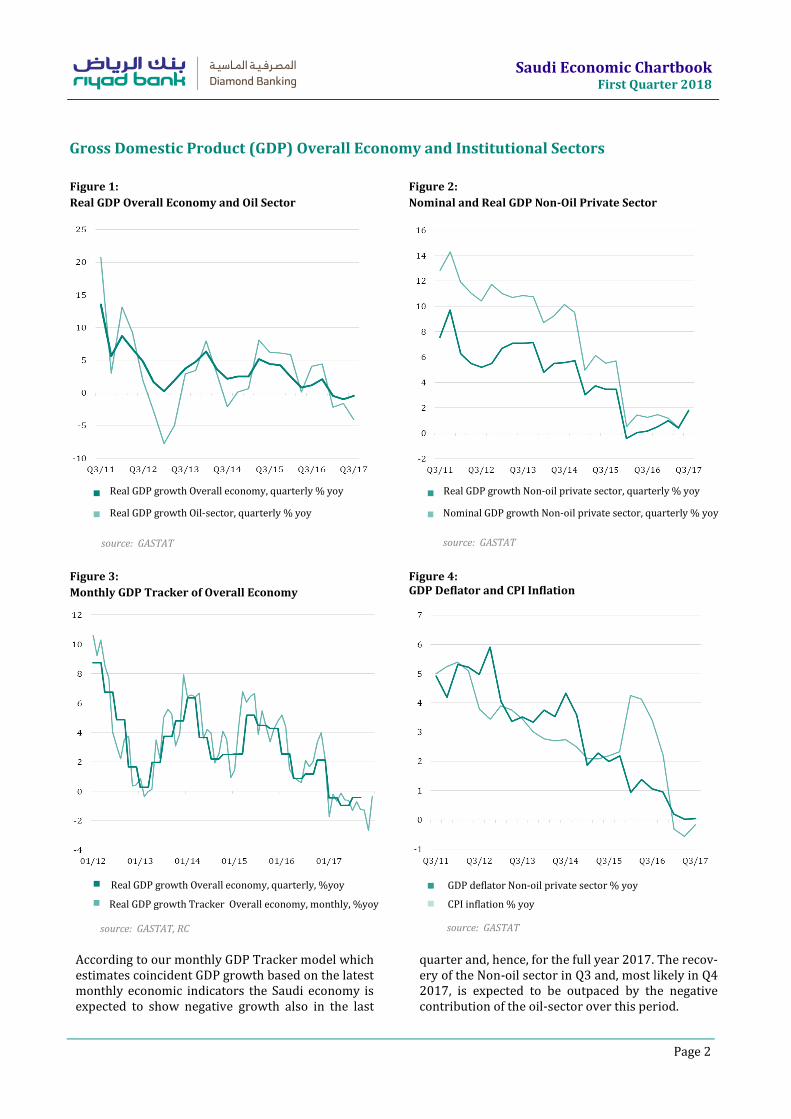
Point-of-Sales Transactions Jumping in December 2017
The introduction of the 5%
VAT in January 2018 moti-
vated households to acceler-
ate spending ahead of this
new consumption tax.
source: SAMA
Fiscal Reform Program Initiated at the Beginning of 2018
For the first time in three years official foreign currency reserves showed a
quarterly net inflow in Q4 2017 as a tentative sign of stabilization after a pro-
tracted decline before. This can at least partly be explained by higher oil ex-
port revenues on the back of the recent oil price rally.
Point-of-sales transactions as a proxy for private consumption witnessed a
strong increase in December, jumping by 28% yoy – a growth rate last seen
three years ago. This private spending boost was primarily caused by acceler-
ated consumption ahead of the VAT introduction in January 2018.
Purchasing Manager Indices as a proxy for the business climate dropped in
January 2018 due to the introduction of the fiscal reform steps which will af-
fect economic activity in the short term. However, we consider this impact to
be transitory.
CPI inflation picked up in January to 3.0% as a result of the fiscal reform
measures already mentioned. This inflationary rebound follows a period of
outright deflation with the CPI level declining on average by -0.8% in 2017.
After a protracted decline the Saudi real estate market shows clear signs of
stabilization. In the last quarter 2017 real estate activity notably recovered
compared to the previous year’s period.
TASI bounced back from its lows in November 2017 to reach levels in January
last seen in 2015. Meanwhile, the corporate earnings recovery continued as
Q4 earnings figures turned out to be substantially better than in the final
quarter 2016.
Point-of-sales transactions, % yoy
3-Months Moving Average, % yoy
Table of Contents:
GDP Data ………………….…………. 2
Monetary and Financial
Indicators ………………………….… 3
Fiscal Balance and
Government Debt…………………. 6
Private Spending and
Foreign Trade …............................... 7
Non-Oil Business Climate
Indicators …………………...……….. 8
Inflation Indicators …………….... 9
Real Estate Market …………..... 10
Oil Market …….………………………12
Foreign Exchange and
Interest Rates …….………...……… 13
Saudi Balance of Payments ..….15
Saudi Equity Market ………...... 16
Facts and Figures
at a Glance …….……………............ 18
Saudi Economic Chartbook First Quarter 2018
Page 2
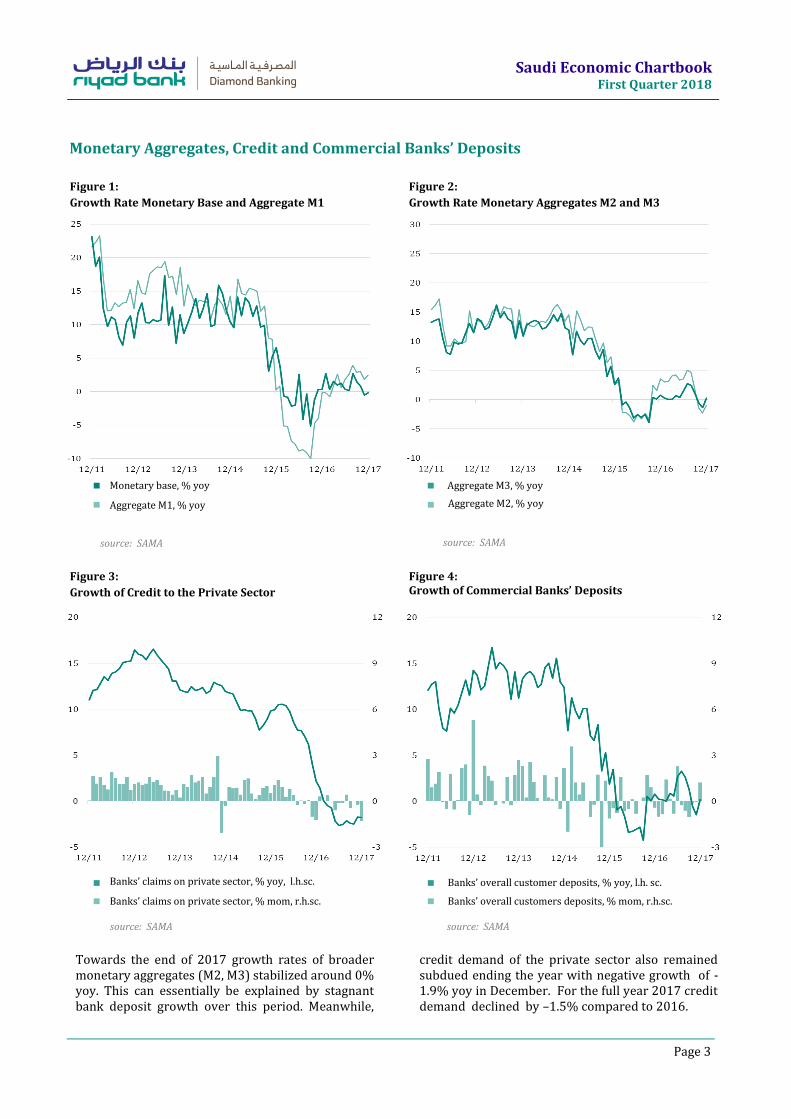
source: GASTAT source: GASTAT
Real GDP growth Overall economy, quarterly % yoy Real GDP growth Non-oil private sector, quarterly % yoy
Gross Domestic Product (GDP) Overall Economy and Institutional Sectors
According to our monthly GDP Tracker model which estimates coincident GDP growth based on the latest monthly economic indicators the Saudi economy is expected to show negative growth also in the last
quarter and, hence, for the full year 2017. The recov-ery of the Non-oil sector in Q3 and, most likely in Q4 2017, is expected to be outpaced by the negative contribution of the oil-sector over this period.
source: GASTAT, RC source: GASTAT
Real GDP growth Oil-sector, quarterly % yoy Nominal GDP growth Non-oil private sector, quarterly % yoy
GDP deflator Non-oil private sector % yoy
CPI inflation % yoy
Figure 2:
Nominal and Real GDP Non-Oil Private Sector
Figure 1:
Real GDP Overall Economy and Oil Sector
Figure 3:
Monthly GDP Tracker of Overall Economy
Figure 4: GDP Deflator and CPI Inflation
Real GDP growth Overall economy, quarterly, %yoy
Real GDP growth Tracker Overall economy, monthly, %yoy
Saudi Economic Chartbook First Quarter 2018
Page 3
source: SAMA source: SAMA
Monetary base, % yoy Aggregate M3, % yoy
Monetary Aggregates, Credit and Commercial Banks’ Deposits
Towards the end of 2017 growth rates of broader monetary aggregates (M2, M3) stabilized around 0% yoy. This can essentially be explained by stagnant bank deposit growth over this period. Meanwhile,
credit demand of the private sector also remained subdued ending the year with negative growth of -1.9% yoy in December. For the full year 2017 credit demand declined by –1.5% compared to 2016.
Banks’ claims on private sector, % yoy, l.h.sc.
source: SAMA source: SAMA
Banks’ claims on private sector, % mom, r.h.sc.
Aggregate M1, % yoy Aggregate M2, % yoy
Banks’ overall customer deposits, % yoy, l.h. sc.
Banks’ overall customers deposits, % mom, r.h.sc.
Figure 2:
Growth Rate Monetary Aggregates M2 and M3
Figure 1:
Growth Rate Monetary Base and Aggregate M1
Figure 4: Growth of Commercial Banks’ Deposits
Figure 3:
Growth of Credit to the Private Sector
Saudi Economic Chartbook First Quarter 2018
Page 4
source: SAMA source: SAMA
Claims on the private sector as % of total bank deposits Claims on the government as % of total bank deposits
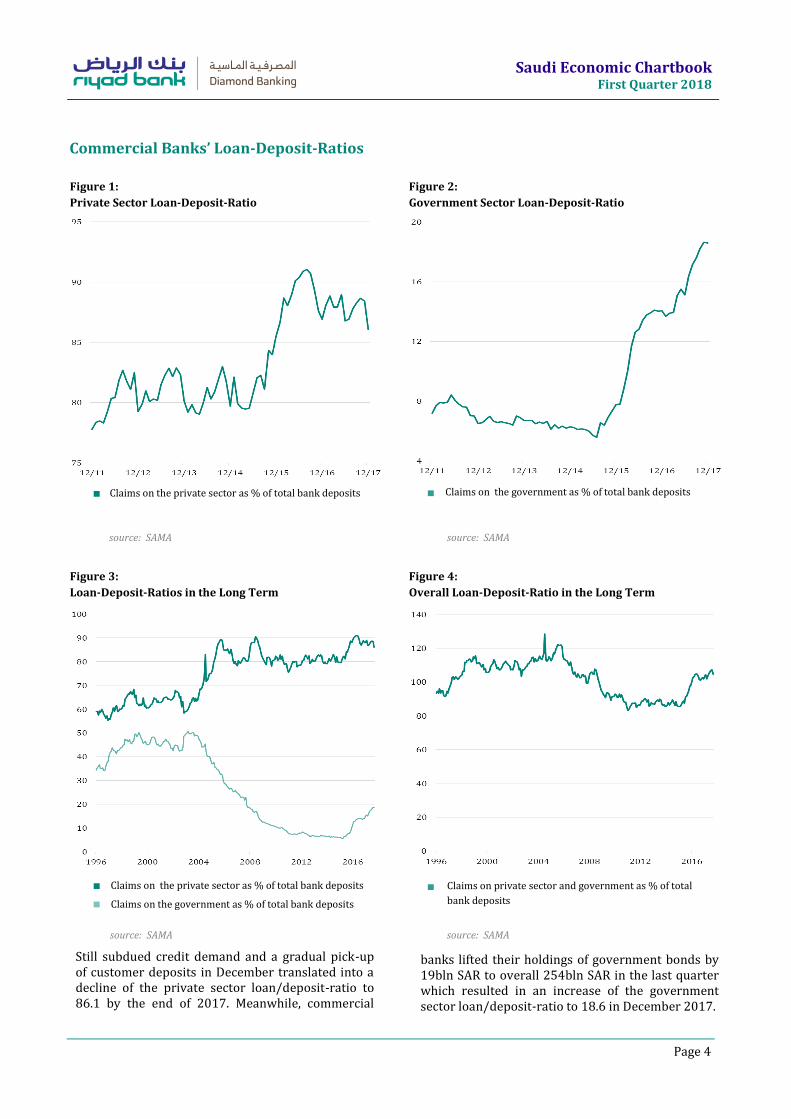
Still subdued credit demand and a gradual pick-up of customer deposits in December translated into a decline of the private sector loan/deposit-ratio to 86.1 by the end of 2017. Meanwhile, commercial
banks lifted their holdings of government bonds by 19bln SAR to overall 254bln SAR in the last quarter which resulted in an increase of the government sector loan/deposit-ratio to 18.6 in December 2017.
source: SAMA source: SAMA
Claims on the private sector as % of total bank deposits Claims on private sector and government as % of total
bank deposits
Commercial Banks’ Loan-Deposit-Ratios
Claims on the government as % of total bank deposits
Figure 1:
Private Sector Loan-Deposit-Ratio
Figure 2:
Government Sector Loan-Deposit-Ratio
Figure 3:
Loan-Deposit-Ratios in the Long Term
Figure 4:
Overall Loan-Deposit-Ratio in the Long Term
Saudi Economic Chartbook First Quarter 2018
Page 5
source: SAMA
source: SAMA source: SAMA
Total foreign currency reserves at SAMA, in bln SAR, l.h.sc. Total government deposits at SAMA, in bln SAR, l.h.sc.
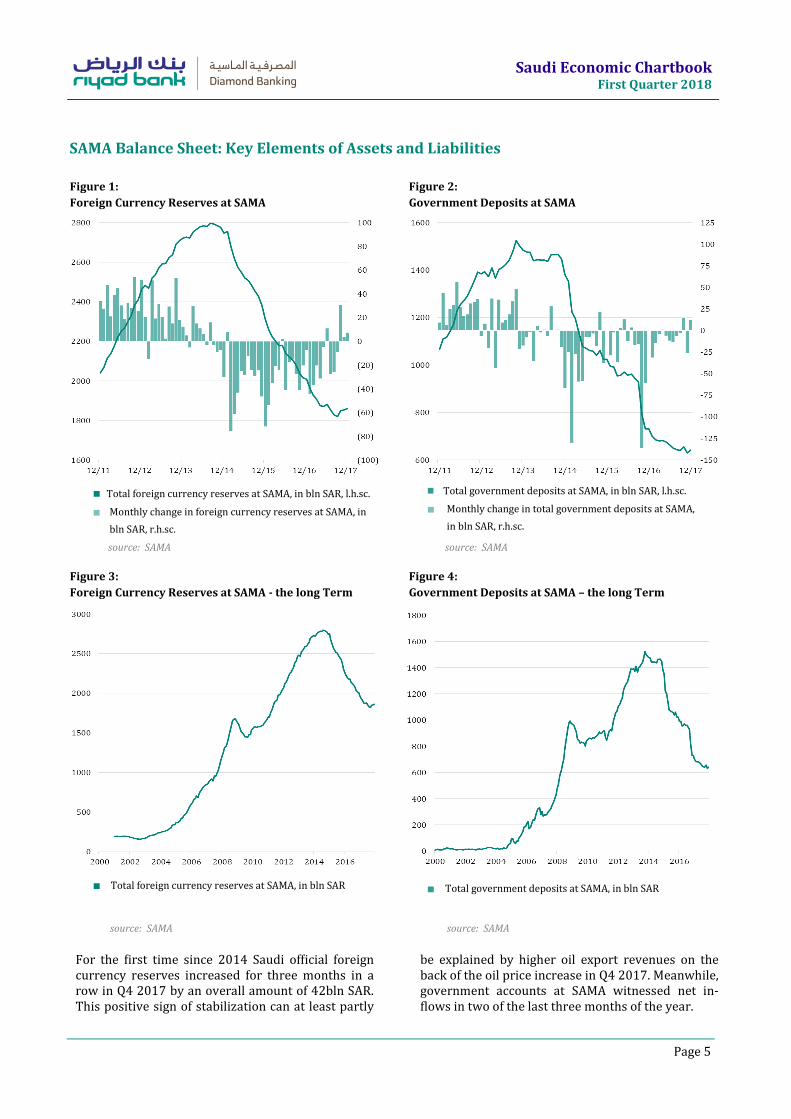
For the first time since 2014 Saudi official foreign currency reserves increased for three months in a row in Q4 2017 by an overall amount of 42bln SAR. This positive sign of stabilization can at least partly
be explained by higher oil export revenues on the back of the oil price increase in Q4 2017. Meanwhile, government accounts at SAMA witnessed net in-flows in two of the last three months of the year.
Total foreign currency reserves at SAMA, in bln SAR Total government deposits at SAMA, in bln SAR
source: SAMA
SAMA Balance Sheet: Key Elements of Assets and Liabilities
Figure 1:
Foreign Currency Reserves at SAMA
Figure 2:
Government Deposits at SAMA
Figure 3:
Foreign Currency Reserves at SAMA - the long Term
Figure 4:
Government Deposits at SAMA – the long Term
Monthly change in foreign currency reserves at SAMA, in
bln SAR, r.h.sc.
Monthly change in total government deposits at SAMA,
in bln SAR, r.h.sc.
Saudi Economic Chartbook First Quarter 2018
Page 6
source: MoF source: MoF
Oil revenues
Non-oil revenues
Employee compensation (salaries & wages)
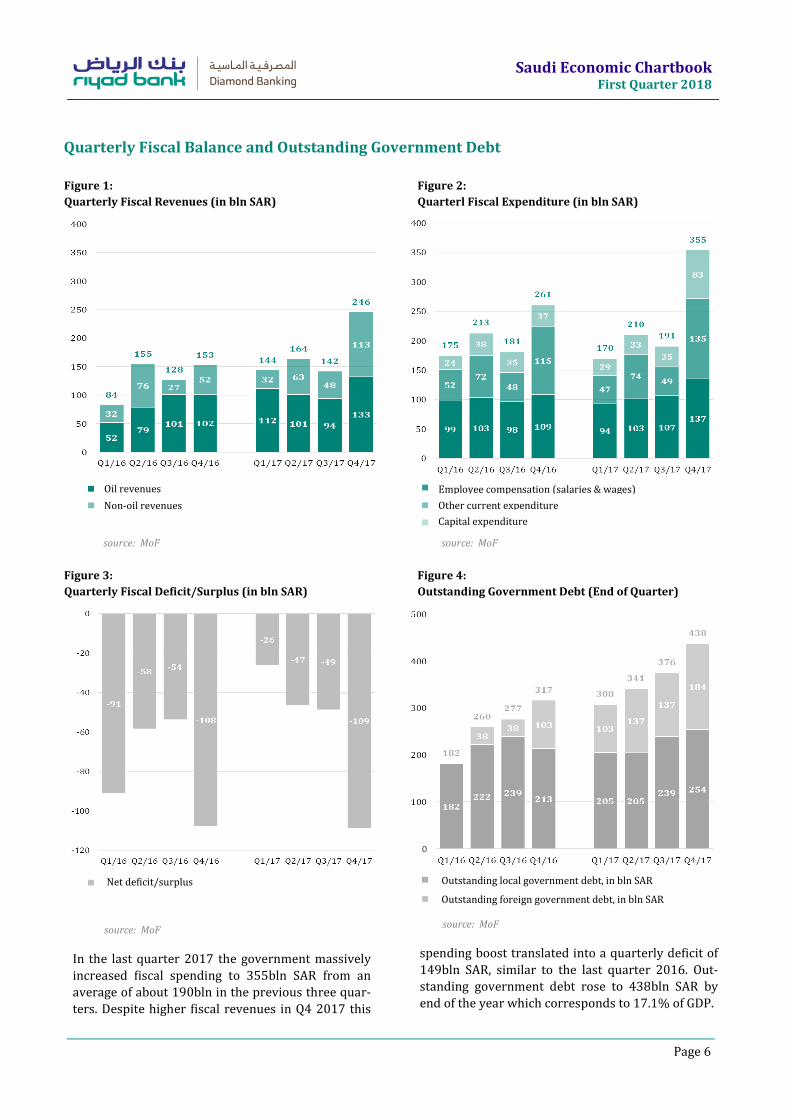
In the last quarter 2017 the government massively
increased fiscal spending to 355bln SAR from an
average of about 190bln in the previous three quar-
ters. Despite higher fiscal revenues in Q4 2017 this
spending boost translated into a quarterly deficit of
149bln SAR, similar to the last quarter 2016. Out-
standing government debt rose to 438bln SAR by
end of the year which corresponds to 17.1% of GDP.
source: MoF source: MoF
Net deficit/surplus Outstanding local government debt, in bln SAR
Other current expenditure
Quarterly Fiscal Balance and Outstanding Government Debt
Figure 1:
Quarterly Fiscal Revenues (in bln SAR)
Figure 2:
Quarterl Fiscal Expenditure (in bln SAR)
Figure 3:
Quarterly Fiscal Deficit/Surplus (in bln SAR)
Figure 4:
Outstanding Government Debt (End of Quarter)
Capital expenditure
Outstanding foreign government debt, in bln SAR
Saudi Economic Chartbook First Quarter 2018
Page 7
source: SAMA source: SAMA
Point-of-sales transactions, % yoy
3-Months Moving Average, % yoy
ATM withdrawals, % yoy
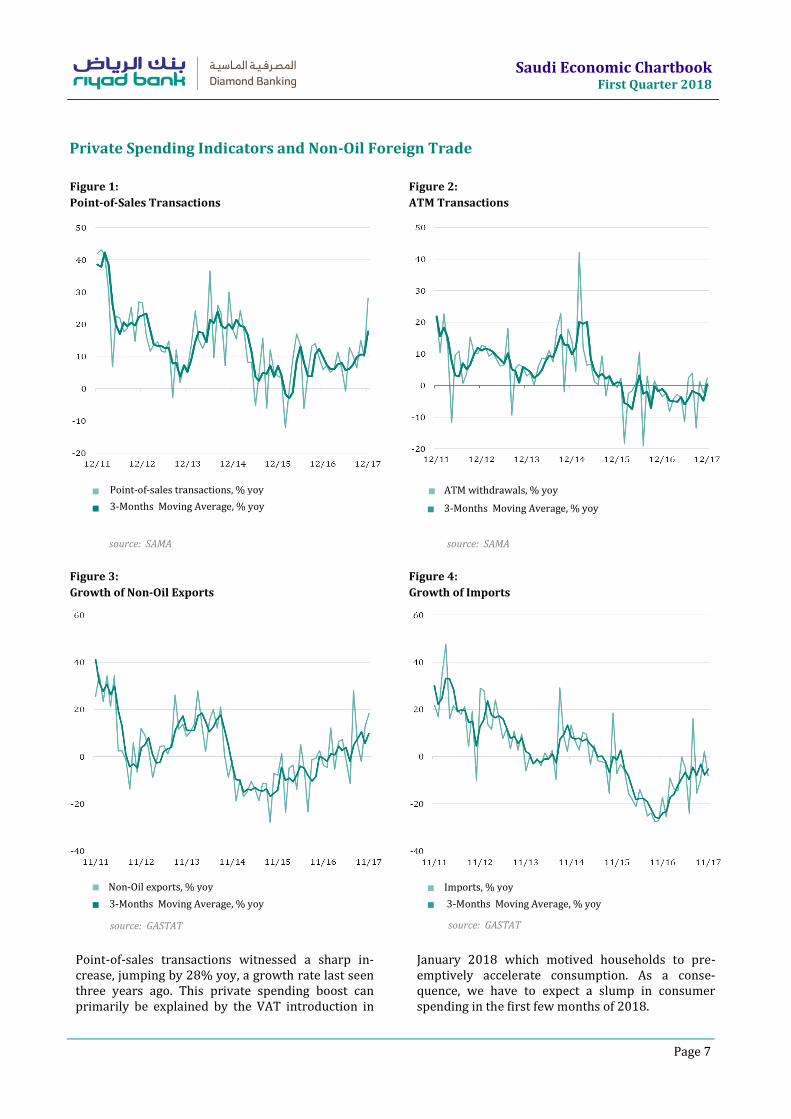
Point-of-sales transactions witnessed a sharp in-crease, jumping by 28% yoy, a growth rate last seen three years ago. This private spending boost can primarily be explained by the VAT introduction in
January 2018 which motived households to pre-emptively accelerate consumption. As a conse-quence, we have to expect a slump in consumer spending in the first few months of 2018.
source: GASTAT source: GASTAT
Non-Oil exports, % yoy Imports, % yoy
3-Months Moving Average, % yoy
Private Spending Indicators and Non-Oil Foreign Trade
Figure 1:
Point-of-Sales Transactions
Figure 2:
ATM Transactions
Figure 3:
Growth of Non-Oil Exports
Figure 4:
Growth of Imports
3-Months Moving Average, % yoy 3-Months Moving Average, % yoy
Saudi Economic Chartbook First Quarter 2018
Page 8
source: Markit source: Markit
Emirates NBD PMI Composite
6-Months Moving Average
Emirates NBD PMI Output
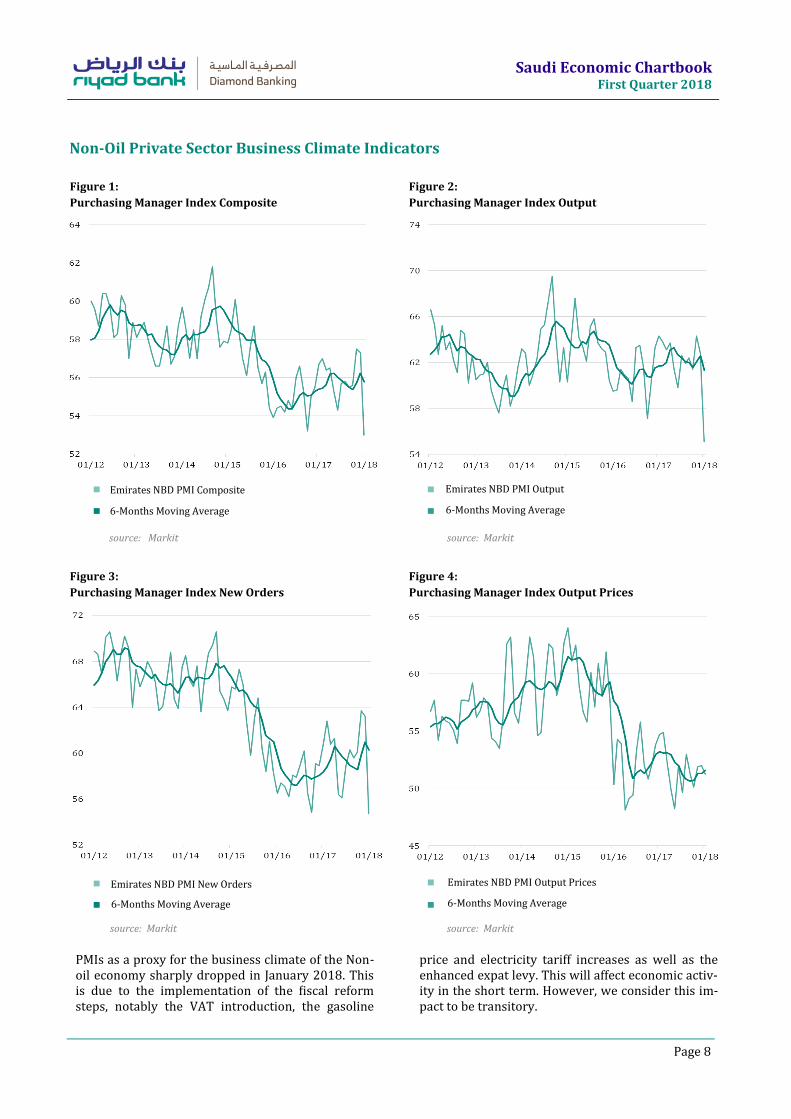
PMIs as a proxy for the business climate of the Non-oil economy sharply dropped in January 2018. This is due to the implementation of the fiscal reform steps, notably the VAT introduction, the gasoline
price and electricity tariff increases as well as the enhanced expat levy. This will affect economic activ-ity in the short term. However, we consider this im-pact to be transitory.
source: Markit source: Markit
Emirates NBD PMI New Orders
Non-Oil Private Sector Business Climate Indicators
Emirates NBD PMI Output Prices
6-Months Moving Average
6-Months Moving Average 6-Months Moving Average
Figure 1:
Purchasing Manager Index Composite
Figure 2:
Purchasing Manager Index Output
Figure 3:
Purchasing Manager Index New Orders
Figure 4:
Purchasing Manager Index Output Prices
Saudi Economic Chartbook First Quarter 2018
Page 9
source: GASTAT source: GASTAT
CPI inflation, % yoy CPI inflation, % yoy
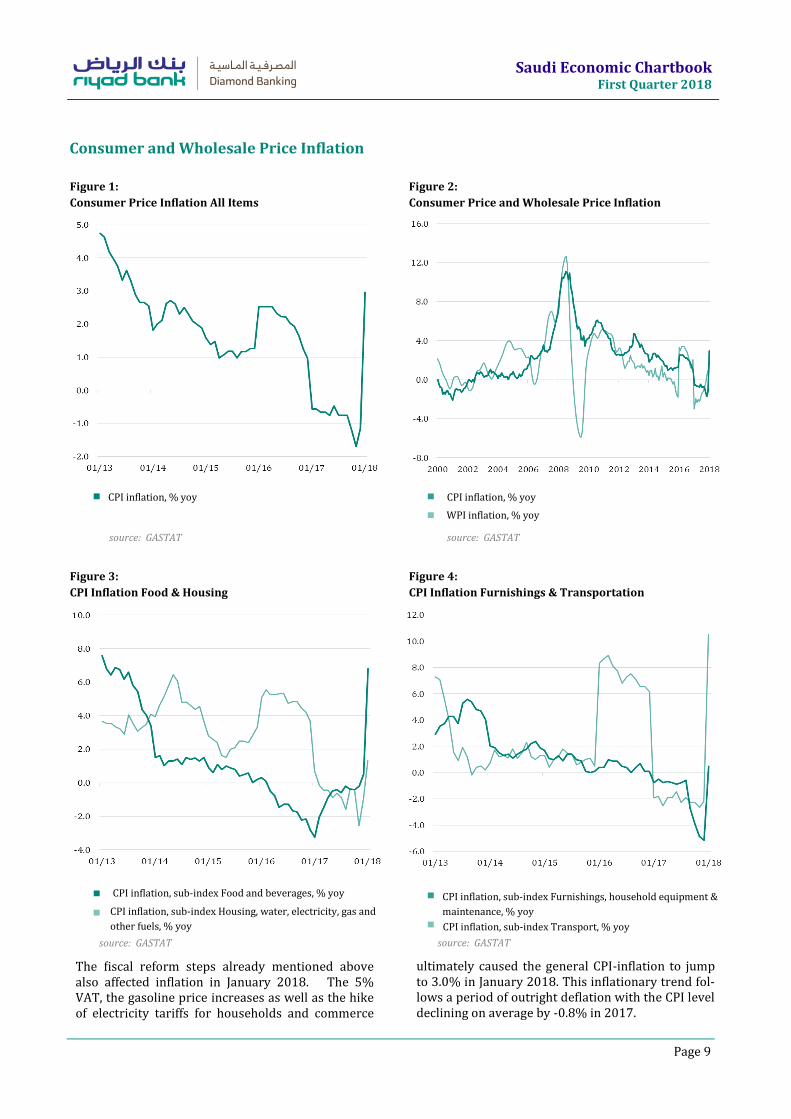
The fiscal reform steps already mentioned above also affected inflation in January 2018. The 5% VAT, the gasoline price increases as well as the hike of electricity tariffs for households and commerce
ultimately caused the general CPI-inflation to jump to 3.0% in January 2018. This inflationary trend fol-lows a period of outright deflation with the CPI level declining on average by -0.8% in 2017.
source: GASTAT source: GASTAT
CPI inflation, sub-index Transport, % yoy
WPI inflation, % yoy
Consumer and Wholesale Price Inflation
CPI inflation, sub-index Furnishings, household equipment &
maintenance, % yoy
CPI inflation, sub-index Food and beverages, % yoy
CPI inflation, sub-index Housing, water, electricity, gas and
other fuels, % yoy
Figure 1:
Consumer Price Inflation All Items
Figure 2:
Consumer Price and Wholesale Price Inflation
Figure 3:
CPI Inflation Food & Housing
Figure 4:
CPI Inflation Furnishings & Transportation
Saudi Economic Chartbook First Quarter 2018
Page 10
source: MOJ, RC
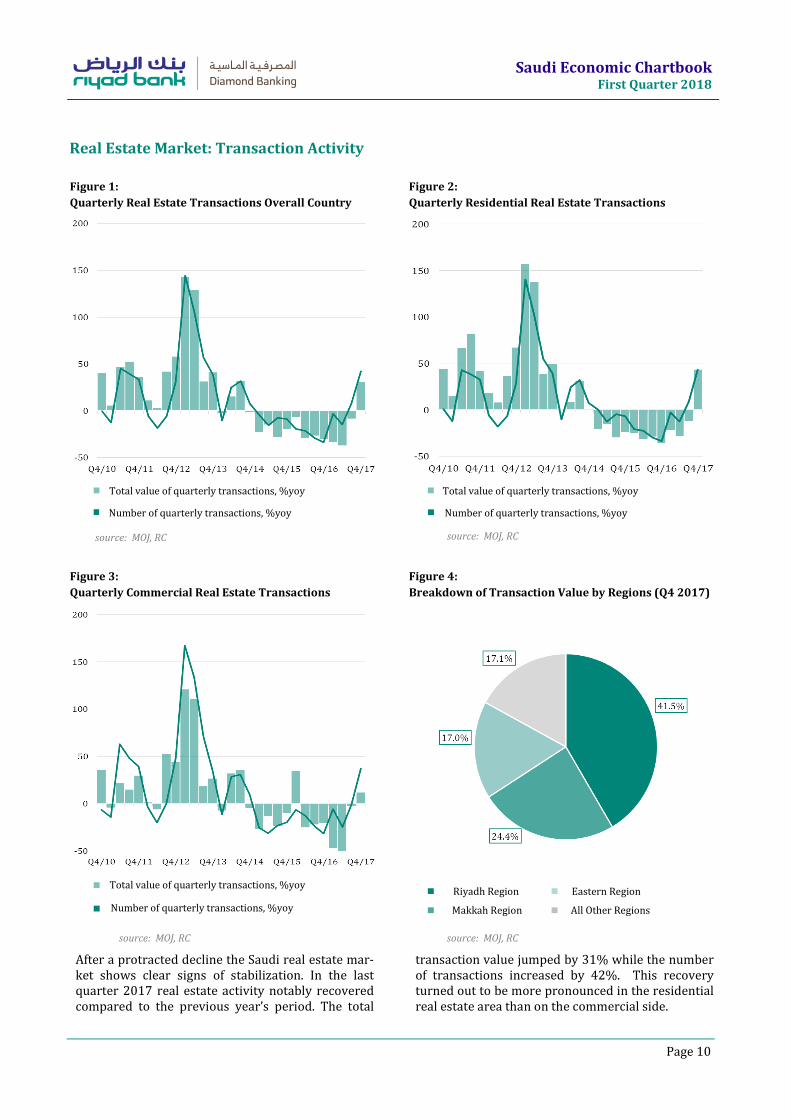
After a protracted decline the Saudi real estate mar-ket shows clear signs of stabilization. In the last quarter 2017 real estate activity notably recovered compared to the previous year’s period. The total
transaction value jumped by 31% while the number of transactions increased by 42%. This recovery turned out to be more pronounced in the residential real estate area than on the commercial side.
source: MOJ, RC source: MOJ, RC
Total value of quarterly transactions, %yoy
Number of quarterly transactions, %yoy
Real Estate Market: Transaction Activity
Riyadh Region
Makkah Region
Eastern Region
All Other Regions
Total value of quarterly transactions, %yoy
Number of quarterly transactions, %yoy
source: MOJ, RC
Total value of quarterly transactions, %yoy
Number of quarterly transactions, %yoy
Figure 1:
Quarterly Real Estate Transactions Overall Country
Figure 3:
Quarterly Commercial Real Estate Transactions
Figure 4:
Breakdown of Transaction Value by Regions (Q4 2017)
Figure 2:
Quarterly Residential Real Estate Transactions
Saudi Economic Chartbook First Quarter 2018
Page 11
source: GASTAT source: GASTAT
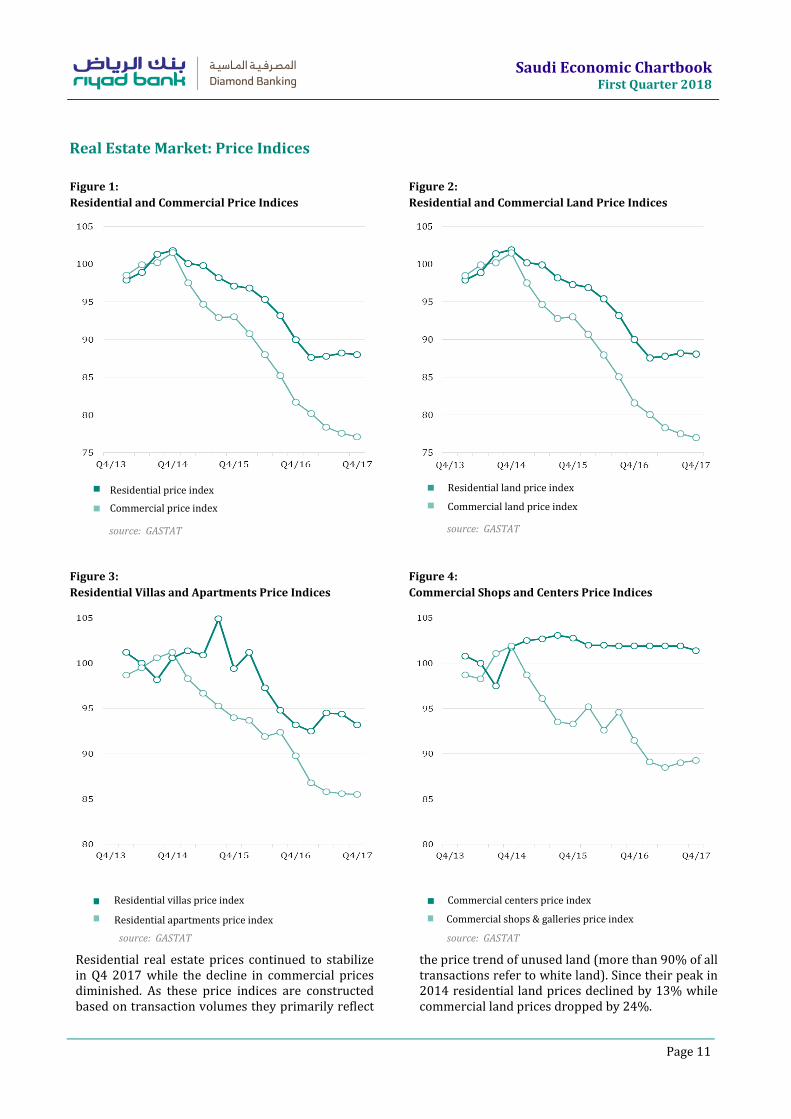
Residential real estate prices continued to stabilize in Q4 2017 while the decline in commercial prices diminished. As these price indices are constructed based on transaction volumes they primarily reflect
the price trend of unused land (more than 90% of all transactions refer to white land). Since their peak in 2014 residential land prices declined by 13% while commercial land prices dropped by 24%.
source: GASTAT source: GASTAT
Residential villas price index
Residential price index Residential land price index
Commercial land price index Commercial price index
Real Estate Market: Price Indices
Residential apartments price index
Commercial centers price index
Commercial shops & galleries price index
Figure 1:
Residential and Commercial Price Indices
Figure 2:
Residential and Commercial Land Price Indices
Figure 3:
Residential Villas and Apartments Price Indices
Figure 4:
Commercial Shops and Centers Price Indices
Saudi Economic Chartbook First Quarter 2018
Page 12
source: JODI, Bloomberg source: JODI
Saudi Arabian crude oil production, in 1000 bd, l.h.sc.
Saudi Arabian total oil refinery output in 1000 bd, l.h.sc.
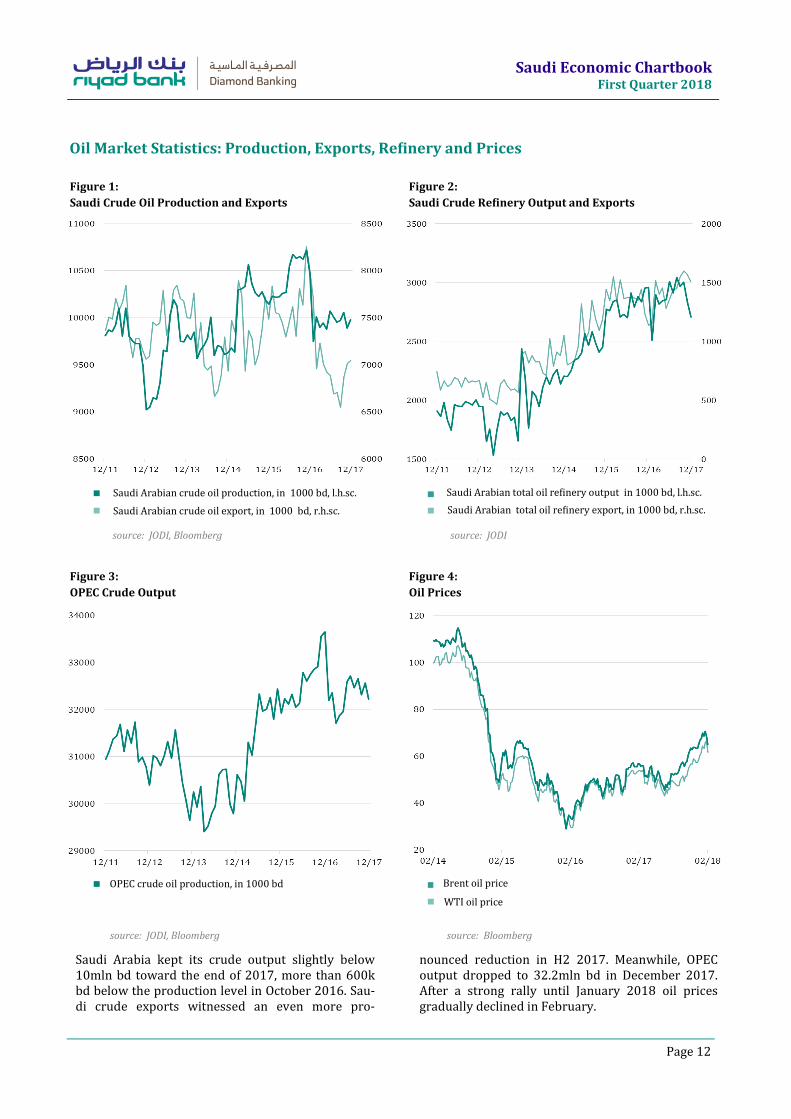
Saudi Arabia kept its crude output slightly below 10mln bd toward the end of 2017, more than 600k bd below the production level in October 2016. Sau-di crude exports witnessed an even more pro-
nounced reduction in H2 2017. Meanwhile, OPEC output dropped to 32.2mln bd in December 2017. After a strong rally until January 2018 oil prices gradually declined in February.
source: JODI, Bloomberg source: Bloomberg
Brent oil price OPEC crude oil production, in 1000 bd
WTI oil price
Oil Market Statistics: Production, Exports, Refinery and Prices
Saudi Arabian crude oil export, in 1000 bd, r.h.sc. Saudi Arabian total oil refinery export, in 1000 bd, r.h.sc.
Figure 1:
Saudi Crude Oil Production and Exports
Figure 2:
Saudi Crude Refinery Output and Exports
Figure 3:
OPEC Crude Output
Figure 4:
Oil Prices
Saudi Economic Chartbook First Quarter 2018
Page 13
source: Bloomberg source: Bloomberg, JP Morgan
12-months forward exchange rate USD/SAR
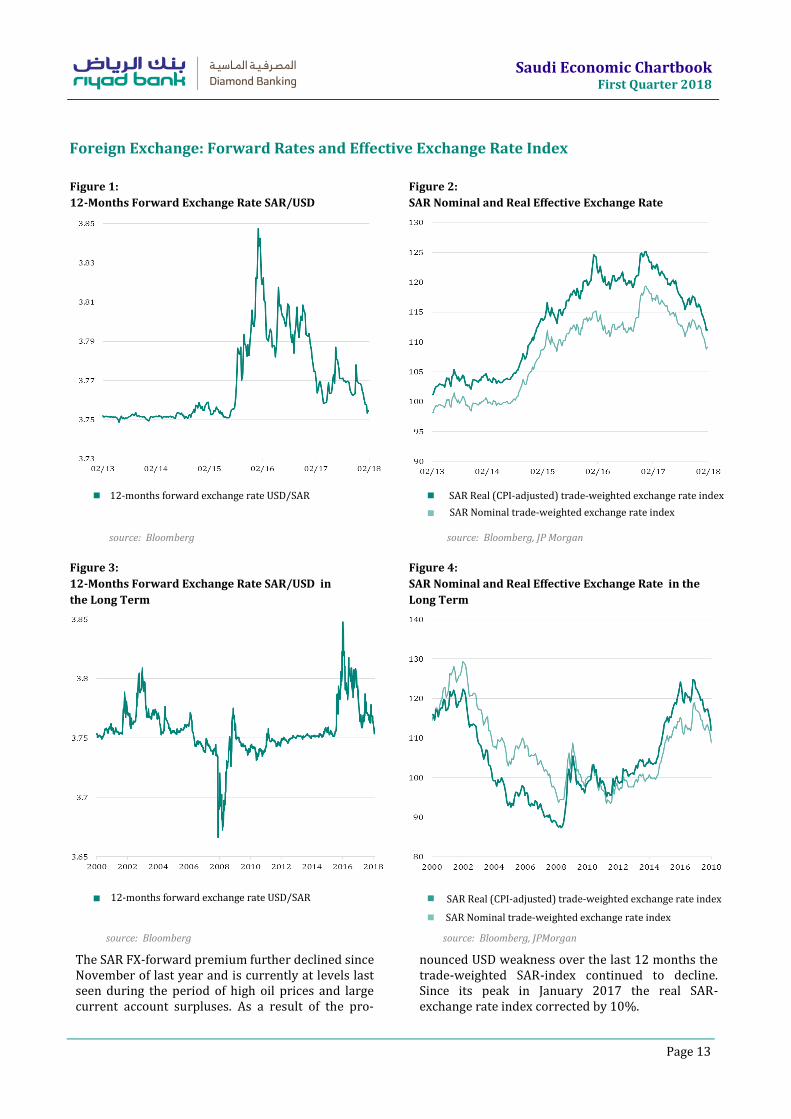
The SAR FX-forward premium further declined since November of last year and is currently at levels last seen during the period of high oil prices and large current account surpluses. As a result of the pro-
nounced USD weakness over the last 12 months the trade-weighted SAR-index continued to decline. Since its peak in January 2017 the real SAR-exchange rate index corrected by 10%.
source: Bloomberg source: Bloomberg, JPMorgan
SAR Real (CPI-adjusted) trade-weighted exchange rate index
SAR Nominal trade-weighted exchange rate index
Foreign Exchange: Forward Rates and Effective Exchange Rate Index
12-months forward exchange rate USD/SAR
SAR Nominal trade-weighted exchange rate index
SAR Real (CPI-adjusted) trade-weighted exchange rate index
Figure 1:
12-Months Forward Exchange Rate SAR/USD
Figure 2:
SAR Nominal and Real Effective Exchange Rate
Figure 3:
12-Months Forward Exchange Rate SAR/USD in
the Long Term
Figure 4:
SAR Nominal and Real Effective Exchange Rate in the
Long Term
Saudi Economic Chartbook First Quarter 2018
Page 14
source: Bloomberg source: Bloomberg
3-months SIBOR (Saudi Interbank Offered Rate)
5-year Swap rate SAR
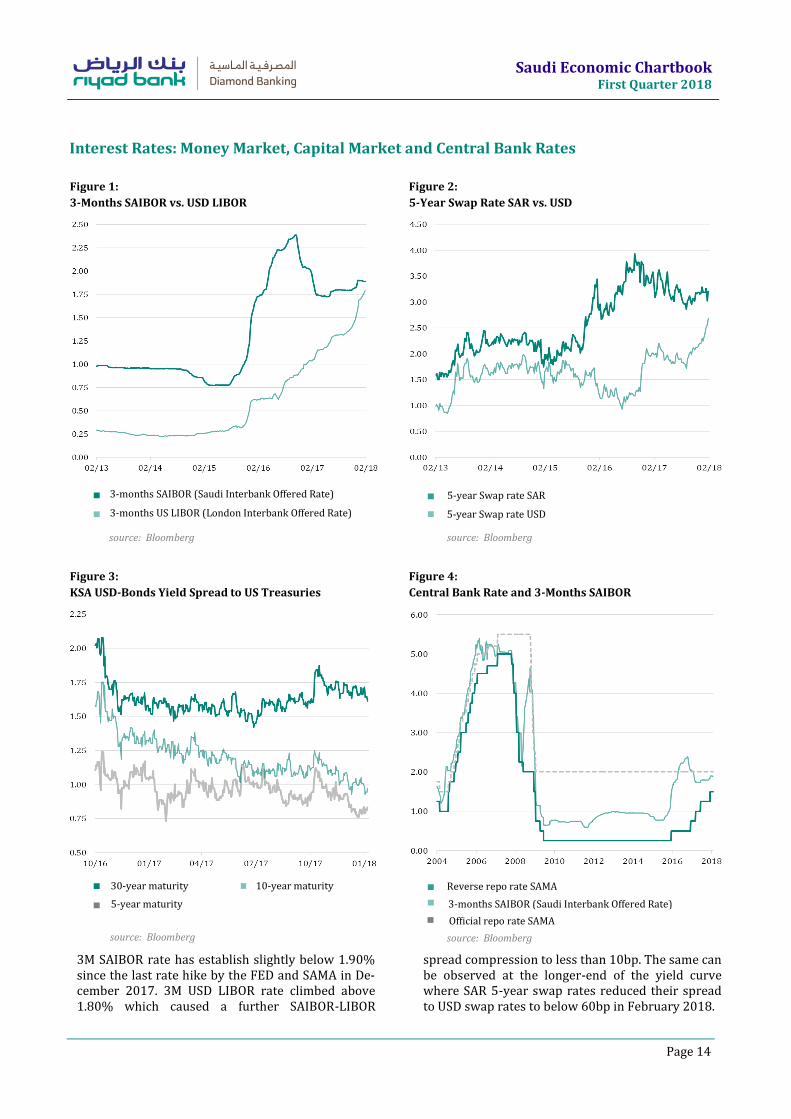
3M SAIBOR rate has establish slightly below 1.90% since the last rate hike by the FED and SAMA in De-cember 2017. 3M USD LIBOR rate climbed above 1.80% which caused a further SAIBOR-LIBOR
spread compression to less than 10bp. The same can be observed at the longer-end of the yield curve where SAR 5-year swap rates reduced their spread to USD swap rates to below 60bp in February 2018.
source: Bloomberg source: Bloomberg
30-year maturity Reverse repo rate SAMA
5-year maturity 3-months SAIBOR (Saudi Interbank Offered Rate)
5-year Swap rate USD 3-months US LIBOR (London Interbank Offered Rate)
Interest Rates: Money Market, Capital Market and Central Bank Rates
3-months SAIBOR (Saudi Interbank Offered Rate)
3-months US LIBOR (London Interbank Offered Rate)
Figure 1:
3-Months SAIBOR vs. USD LIBOR
Figure 2:
5-Year Swap Rate SAR vs. USD
Figure 3:
KSA USD-Bonds Yield Spread to US Treasuries
Figure 4:
Central Bank Rate and 3-Months SAIBOR
10-year maturity
Official repo rate SAMA
Saudi Economic Chartbook First Quarter 2018
Page 15
source: SAMA source: SAMA
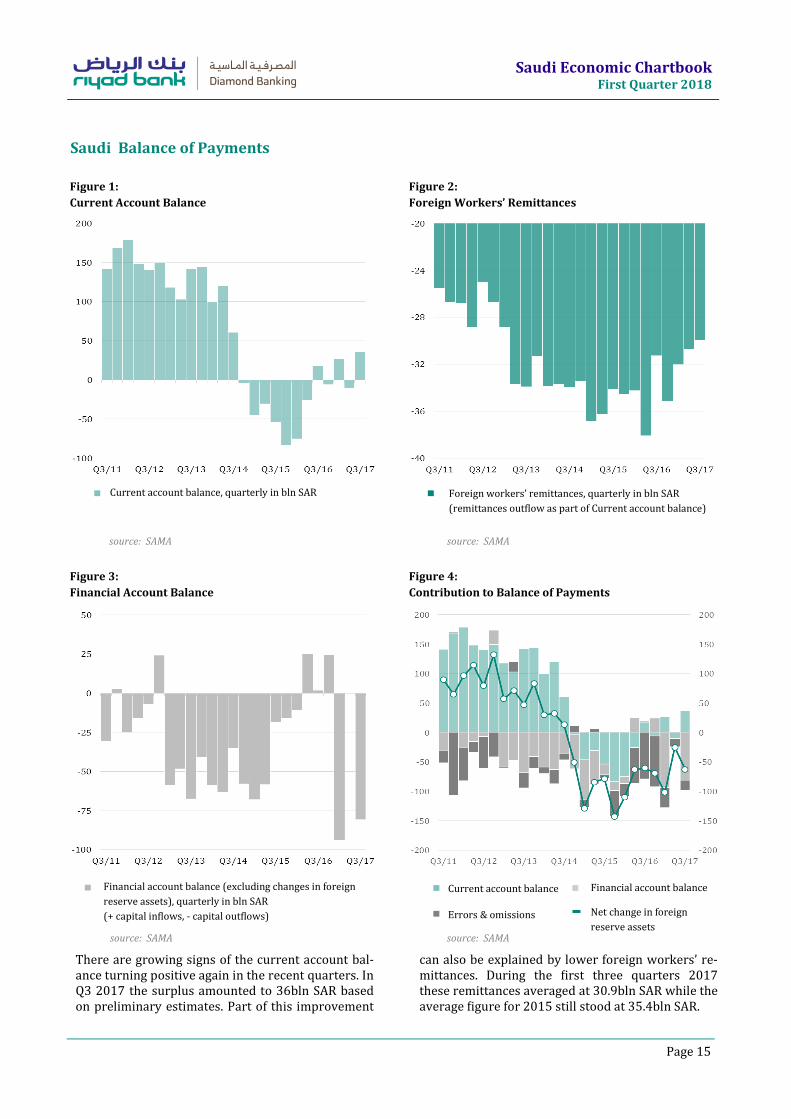
Current account balance, quarterly in bln SAR Foreign workers’ remittances, quarterly in bln SAR
(remittances outflow as part of Current account balance)
There are growing signs of the current account bal-ance turning positive again in the recent quarters. In Q3 2017 the surplus amounted to 36bln SAR based on preliminary estimates. Part of this improvement
can also be explained by lower foreign workers’ re-mittances. During the first three quarters 2017 these remittances averaged at 30.9bln SAR while the average figure for 2015 still stood at 35.4bln SAR.
source: SAMA source: SAMA
Saudi Balance of Payments
Figure 1:
Current Account Balance
Figure 2:
Foreign Workers’ Remittances
Figure 3:
Financial Account Balance
Figure 4:
Contribution to Balance of Payments
Current account balance
Errors & omissions
Financial account balance
Net change in foreign
reserve assets
Financial account balance (excluding changes in foreign
reserve assets), quarterly in bln SAR
(+ capital inflows, - capital outflows)
Saudi Economic Chartbook First Quarter 2018
Page 16
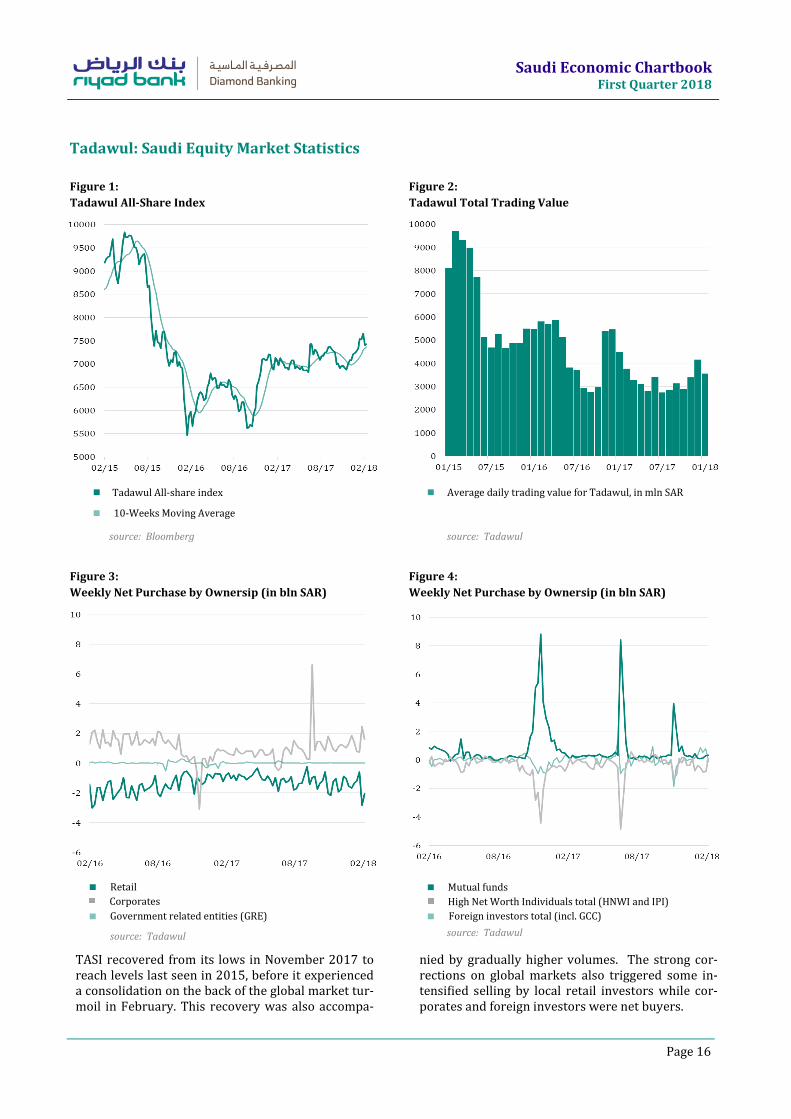
source: Bloomberg source: Tadawul
Tadawul All-share index Average daily trading value for Tadawul, in mln SAR
TASI recovered from its lows in November 2017 to reach levels last seen in 2015, before it experienced a consolidation on the back of the global market tur-moil in February. This recovery was also accompa-
nied by gradually higher volumes. The strong cor-rections on global markets also triggered some in-tensified selling by local retail investors while cor-porates and foreign investors were net buyers.
source: Tadawul source: Tadawul
Tadawul: Saudi Equity Market Statistics
10-Weeks Moving Average
Retail Mutual funds
High Net Worth Individuals total (HNWI and IPI) Corporates
Government related entities (GRE) Foreign investors total (incl. GCC)
Figure 1:
Tadawul All-Share Index
Figure 2:
Tadawul Total Trading Value
Figure 3:
Weekly Net Purchase by Ownersip (in bln SAR)
Figure 4:
Weekly Net Purchase by Ownersip (in bln SAR)
Saudi Economic Chartbook First Quarter 2018
Page 17
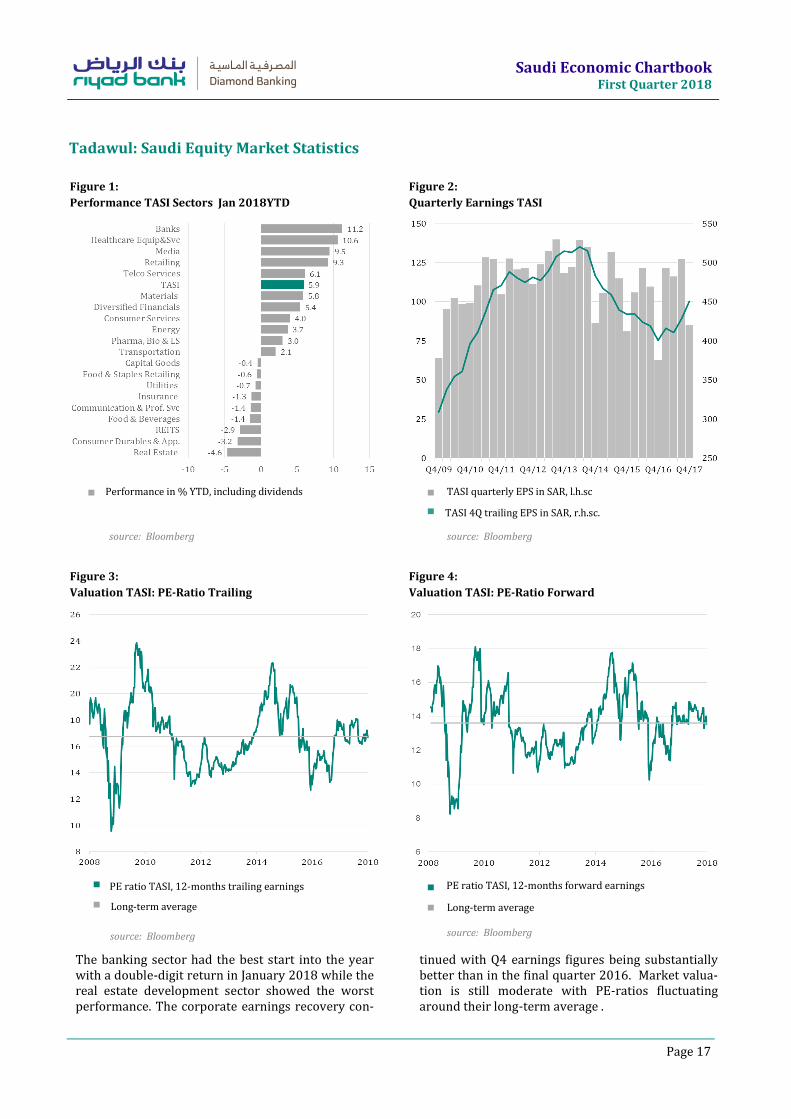
source: Bloomberg source: Bloomberg
TASI quarterly EPS in SAR, l.h.sc
The banking sector had the best start into the year with a double-digit return in January 2018 while the real estate development sector showed the worst performance. The corporate earnings recovery con-
tinued with Q4 earnings figures being substantially better than in the final quarter 2016. Market valua-tion is still moderate with PE-ratios fluctuating around their long-term average .
source: Bloomberg source: Bloomberg
PE ratio TASI, 12-months trailing earnings
Long-term average
TASI 4Q trailing EPS in SAR, r.h.sc.
PE ratio TASI, 12-months forward earnings
Long-term average
Tadawul: Saudi Equity Market Statistics
Figure 1:
Performance TASI Sectors Jan 2018YTD
Figure 2:
Quarterly Earnings TASI
Figure 3:
Valuation TASI: PE-Ratio Trailing
Figure 4:
Valuation TASI: PE-Ratio Forward
Performance in % YTD, including dividends
Saudi Economic Chartbook First Quarter 2018
Page 18
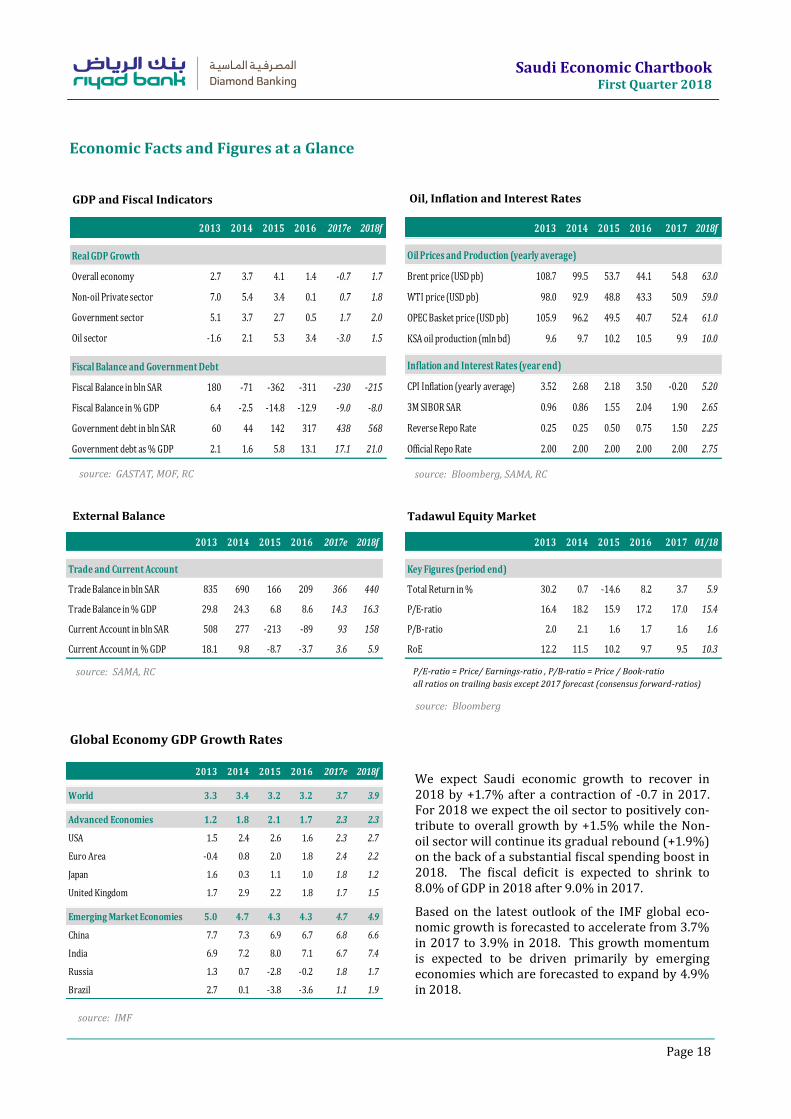
Economic Facts and Figures at a Glance
We expect Saudi economic growth to recover in 2018 by +1.7% after a contraction of -0.7 in 2017. For 2018 we expect the oil sector to positively con-tribute to overall growth by +1.5% while the Non-oil sector will continue its gradual rebound (+1.9%) on the back of a substantial fiscal spending boost in 2018. The fiscal deficit is expected to shrink to 8.0% of GDP in 2018 after 9.0% in 2017.
Based on the latest outlook of the IMF global eco-nomic growth is forecasted to accelerate from 3.7% in 2017 to 3.9% in 2018. This growth momentum is expected to be driven primarily by emerging economies which are forecasted to expand by 4.9% in 2018.
Oil, Inflation and Interest Rates GDP and Fiscal Indicators
Tadawul Equity Market External Balance
Global Economy GDP Growth Rates
source: GASTAT, MOF, RC source: Bloomberg, SAMA, RC
source: SAMA, RC
source: Bloomberg
source: IMF
P/E-ratio = Price/ Earnings-ratio , P/B-ratio = Price / Book-ratio
all ratios on trailing basis except 2017 forecast (consensus forward-ratios)
2013 2014 2015 2016 2017e 2018f
Real GDP Growth
Overall economy 2.7 3.7 4.1 1.4 -0.7 1.7
Non-oil Private sector 7.0 5.4 3.4 0.1 0.7 1.8
Government sector 5.1 3.7 2.7 0.5 1.7 2.0
Oil sector -1.6 2.1 5.3 3.4 -3.0 1.5
Fiscal Balance and Government Debt
Fiscal Balance in bln SAR 180 -71 -362 -311 -230 -215
Fiscal Balance in % GDP 6.4 -2.5 -14.8 -12.9 -9.0 -8.0
Government debt in bln SAR 60 44 142 317 438 568
Government debt as % GDP 2.1 1.6 5.8 13.1 17.1 21.0
2013 2014 2015 2016 2017 2018f
Oil Prices and Production (yearly average)
Brent price (USD pb) 108.7 99.5 53.7 44.1 54.8 63.0
WTI price (USD pb) 98.0 92.9 48.8 43.3 50.9 59.0
OPEC Basket price (USD pb) 105.9 96.2 49.5 40.7 52.4 61.0
KSA oil production (mln bd) 9.6 9.7 10.2 10.5 9.9 10.0
Inflation and Interest Rates (year end)
CPI Inflation (yearly average) 3.52 2.68 2.18 3.50 -0.20 5.20
3M SIBOR SAR 0.96 0.86 1.55 2.04 1.90 2.65
Reverse Repo Rate 0.25 0.25 0.50 0.75 1.50 2.25
Official Repo Rate 2.00 2.00 2.00 2.00 2.00 2.75
2013 2014 2015 2016 2017e 2018f
Trade and Current Account
Trade Balance in bln SAR 835 690 166 209 366 440
Trade Balance in % GDP 29.8 24.3 6.8 8.6 14.3 16.3
Current Account in bln SAR 508 277 -213 -89 93 158
Current Account in % GDP 18.1 9.8 -8.7 -3.7 3.6 5.9
2013 2014 2015 2016 2017 01/18
Key Figures (period end)
Total Return in % 30.2 0.7 -14.6 8.2 3.7 5.9
P/E-ratio 16.4 18.2 15.9 17.2 17.0 15.4
P/B-ratio 2.0 2.1 1.6 1.7 1.6 1.6
RoE 12.2 11.5 10.2 9.7 9.5 10.3
2013 2014 2015 2016 2017e 2018f
World 3.3 3.4 3.2 3.2 3.7 3.9
Advanced Economies 1.2 1.8 2.1 1.7 2.3 2.3
USA 1.5 2.4 2.6 1.6 2.3 2.7
Euro Area -0.4 0.8 2.0 1.8 2.4 2.2
Japan 1.6 0.3 1.1 1.0 1.8 1.2
United Kingdom 1.7 2.9 2.2 1.8 1.7 1.5
Emerging Market Economies 5.0 4.7 4.3 4.3 4.7 4.9
China 7.7 7.3 6.9 6.7 6.8 6.6
India 6.9 7.2 8.0 7.1 6.7 7.4
Russia 1.3 0.7 -2.8 -0.2 1.8 1.7
Brazil 2.7 0.1 -3.8 -3.6 1.1 1.9
Saudi Economic Chartbook First Quarter 2018
Page 19
Disclaimer
The information in this report was compiled in good faith from various public sources believed to be reliable. Whilst all reasonable care has been taken to ensure that the facts stated in this report are accurate and that the forecasts, opinions and expectations contained herein are fair and reasonable, Riyad Capital makes no representa-tions or warranties whatsoever as to the accuracy of the data and information provided and, in particular, Riyad Capital does not represent that the information in this report is complete or free from any error. This report is not, and is not to be construed as, an offer to sell or solicitation of an offer to buy any financial securities. Accordingly, no reliance should be placed on the accuracy, fairness or completeness of the information contained in this report. Riyad Capital accepts no liability whatsoever for any loss arising from any use of this report or its contents, and neither Riyad Capital nor any of its respective directors, officers or employees, shall be in any way responsible for the contents hereof. Riyad Capital or its employees or any of its affiliates may have a financial interest in securities or other assets referred to in this report.
Opinions, forecasts or projections contained in this report represent Riyad Capital's current opinions or judgment as at the date of this report only and are therefore subject to change without notice. There can be no assurance that future results or events will be consistent with any such opinions, forecasts or projections which represent only one possible outcome. Further such opinions, forecasts or projections are subject to certain risks, uncertain-ties and assumptions that have not been verified and future actual results or events could differ materially.
The value of, or income from, any investments referred to in this report may fluctuate and/or be affected by changes. Past performance is not necessarily an indicative of future performance. Accordingly, investors may receive back less than originally invested amount.
This report provide information of a general nature and do not address the circumstances, objectives, and risk tolerance of any particular investor. Therefore, it is not intended to provide personal investment advice and does not take into account the reader’s financial situation or any specific investment objectives or particular needs which the reader’s may have. Before making an investment decision the reader should seek advice from an inde-pendent financial, legal, tax and/or other required advisers.
This research report might not be reproduced, nor distributed in whole or in part, and all information; opinions, forecasts and projections contained in it are protected by the copyright rules and regulations.
Riyad Capital is a Saudi Closed Joint Stock Company with a paid up capital of SR 200 million , with commercial
registration number (1010239234), licensed and organized by the Capital Market Authority under License No.
(07070-37), Head Office: 6775 Takhassusi Street – Olaya, Riyadh 12331-3712 , Saudi Arabia (“KSA”). Website:
www.riyadcapital.com
*This report is Issued by Riyad Capital