Saudi Arabia Chart Book - Samba€¦ · ded from Saudi Arabia Chart Book ... growth slowed in real...
9
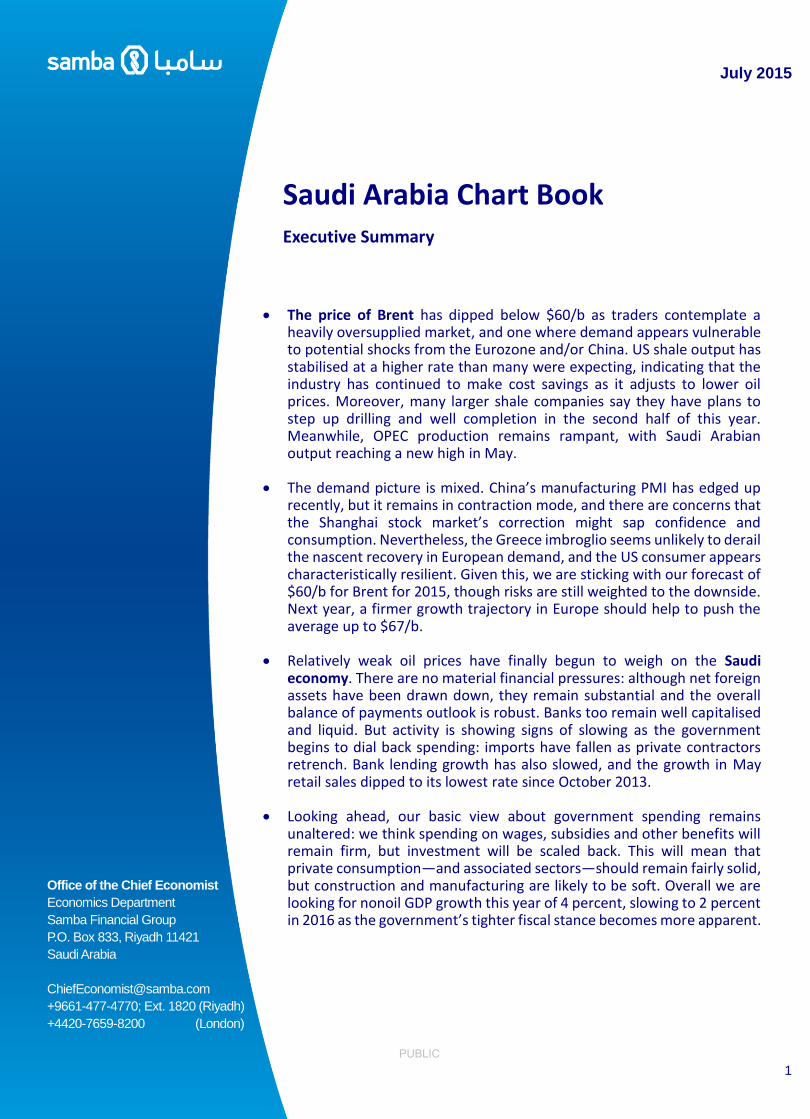
July 2015 PUBLIC 1 Office of the Chief Economist Economics Department Samba Financial Group P.O. Box 833, Riyadh 11421 Saudi Arabia [email protected] +9661-477-4770; Ext. 1820 (Riyadh) +4420-7659-8200 (London) can be ded from www.samba.com Saudi Arabia Chart Book Executive Summary The price of Brent has dipped below $60/b as traders contemplate a heavily oversupplied market, and one where demand appears vulnerable to potential shocks from the Eurozone and/or China. US shale output has stabilised at a higher rate than many were expecting, indicating that the industry has continued to make cost savings as it adjusts to lower oil prices. Moreover, many larger shale companies say they have plans to step up drilling and well completion in the second half of this year. Meanwhile, OPEC production remains rampant, with Saudi Arabian output reaching a new high in May. The demand picture is mixed. China’s manufacturing PMI has edged up recently, but it remains in contraction mode, and there are concerns that the Shanghai stock market’s correction might sap confidence and consumption. Nevertheless, the Greece imbroglio seems unlikely to derail the nascent recovery in European demand, and the US consumer appears characteristically resilient. Given this, we are sticking with our forecast of $60/b for Brent for 2015, though risks are still weighted to the downside. Next year, a firmer growth trajectory in Europe should help to push the average up to $67/b. Relatively weak oil prices have finally begun to weigh on the Saudi economy. There are no material financial pressures: although net foreign assets have been drawn down, they remain substantial and the overall balance of payments outlook is robust. Banks too remain well capitalised and liquid. But activity is showing signs of slowing as the government begins to dial back spending: imports have fallen as private contractors retrench. Bank lending growth has also slowed, and the growth in May retail sales dipped to its lowest rate since October 2013. Looking ahead, our basic view about government spending remains unaltered: we think spending on wages, subsidies and other benefits will remain firm, but investment will be scaled back. This will mean that private consumption—and associated sectors—should remain fairly solid, but construction and manufacturing are likely to be soft. Overall we are looking for nonoil GDP growth this year of 4 percent, slowing to 2 percent in 2016 as the government’s tighter fiscal stance becomes more apparent.
Transcript of Saudi Arabia Chart Book - Samba€¦ · ded from Saudi Arabia Chart Book ... growth slowed in real...
July 2015
PUBLIC
1
Office of the Chief Economist
Economics Department
Samba Financial Group
P.O. Box 833, Riyadh 11421
Saudi Arabia
+9661-477-4770; Ext. 1820 (Riyadh)
+4420-7659-8200 (London)
can be
ded from www.samba.com
Saudi Arabia Chart Book Executive Summary
The price of Brent has dipped below $60/b as traders contemplate a heavily oversupplied market, and one where demand appears vulnerable to potential shocks from the Eurozone and/or China. US shale output has stabilised at a higher rate than many were expecting, indicating that the industry has continued to make cost savings as it adjusts to lower oil prices. Moreover, many larger shale companies say they have plans to step up drilling and well completion in the second half of this year. Meanwhile, OPEC production remains rampant, with Saudi Arabian output reaching a new high in May.
The demand picture is mixed. China’s manufacturing PMI has edged up recently, but it remains in contraction mode, and there are concerns that the Shanghai stock market’s correction might sap confidence and consumption. Nevertheless, the Greece imbroglio seems unlikely to derail the nascent recovery in European demand, and the US consumer appears characteristically resilient. Given this, we are sticking with our forecast of $60/b for Brent for 2015, though risks are still weighted to the downside. Next year, a firmer growth trajectory in Europe should help to push the average up to $67/b.
Relatively weak oil prices have finally begun to weigh on the Saudi economy. There are no material financial pressures: although net foreign assets have been drawn down, they remain substantial and the overall balance of payments outlook is robust. Banks too remain well capitalised and liquid. But activity is showing signs of slowing as the government begins to dial back spending: imports have fallen as private contractors retrench. Bank lending growth has also slowed, and the growth in May retail sales dipped to its lowest rate since October 2013.
Looking ahead, our basic view about government spending remains unaltered: we think spending on wages, subsidies and other benefits will remain firm, but investment will be scaled back. This will mean that private consumption—and associated sectors—should remain fairly solid, but construction and manufacturing are likely to be soft. Overall we are looking for nonoil GDP growth this year of 4 percent, slowing to 2 percent in 2016 as the government’s tighter fiscal stance becomes more apparent.
July 2015
PUBLIC
2
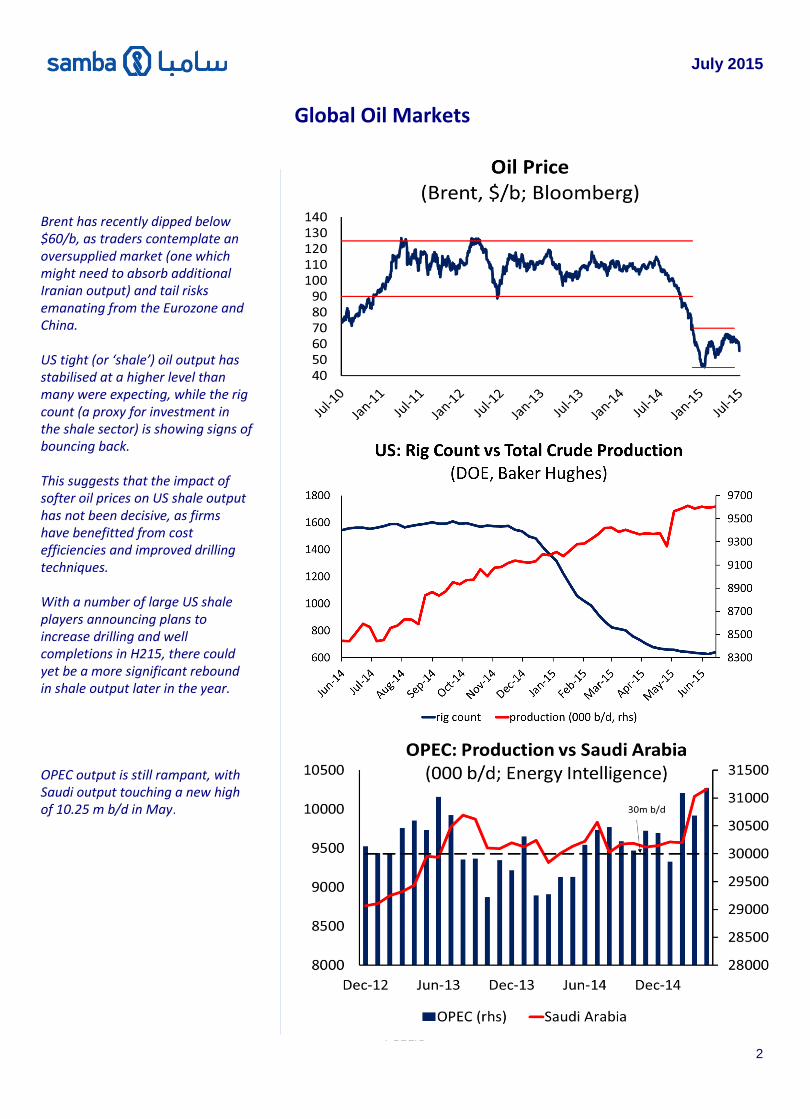
Global Oil Markets
Brent has recently dipped below $60/b, as traders contemplate an oversupplied market (one which might need to absorb additional Iranian output) and tail risks emanating from the Eurozone and China. US tight (or ‘shale’) oil output has stabilised at a higher level than many were expecting, while the rig count (a proxy for investment in the shale sector) is showing signs of bouncing back. This suggests that the impact of softer oil prices on US shale output has not been decisive, as firms have benefitted from cost efficiencies and improved drilling techniques. With a number of large US shale players announcing plans to increase drilling and well completions in H215, there could yet be a more significant rebound in shale output later in the year. OPEC output is still rampant, with Saudi output touching a new high of 10.25 m b/d in May.
July 2015
PUBLIC
PUBLIC
PUBLIC
3
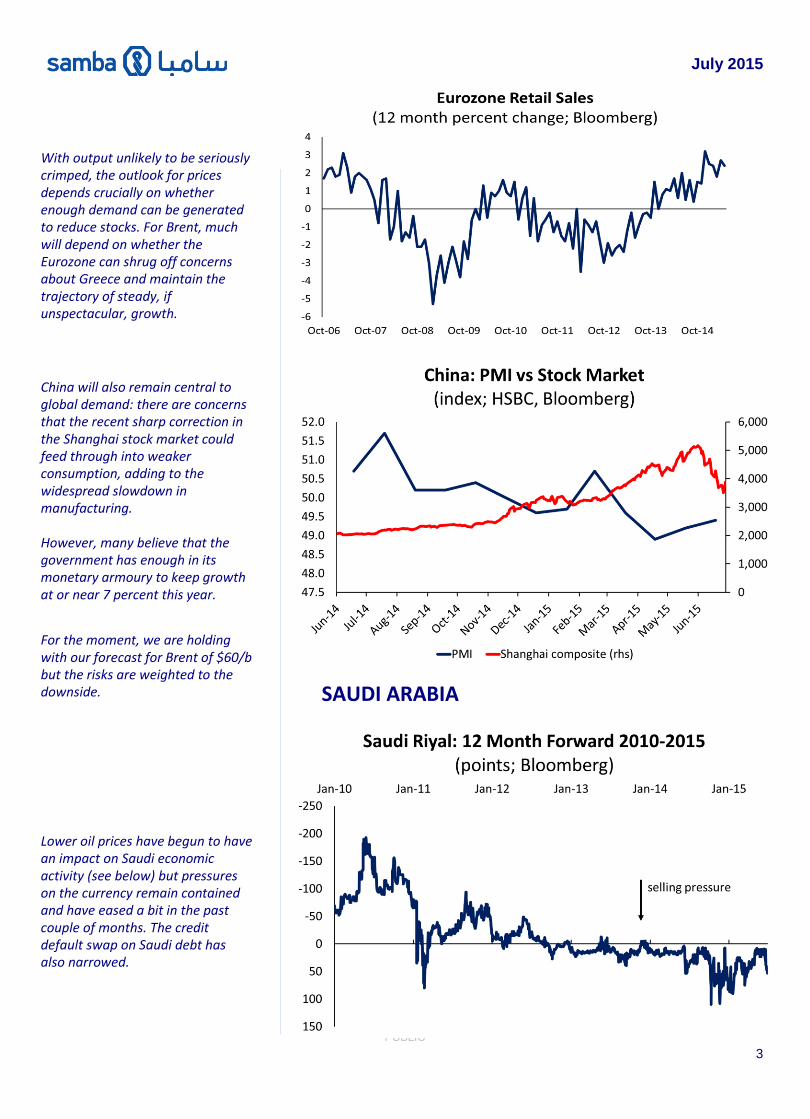
With output unlikely to be seriously crimped, the outlook for prices depends crucially on whether enough demand can be generated to reduce stocks. For Brent, much will depend on whether the Eurozone can shrug off concerns about Greece and maintain the trajectory of steady, if unspectacular, growth.
China will also remain central to global demand: there are concerns that the recent sharp correction in the Shanghai stock market could feed through into weaker consumption, adding to the widespread slowdown in manufacturing. However, many believe that the government has enough in its monetary armoury to keep growth at or near 7 percent this year.
For the moment, we are holding with our forecast for Brent of $60/b but the risks are weighted to the downside.
Lower oil prices have begun to have an impact on Saudi economic activity (see below) but pressures on the currency remain contained and have eased a bit in the past couple of months. The credit default swap on Saudi debt has also narrowed.
SAUDI ARABIA
July 2015
PUBLIC
4
7
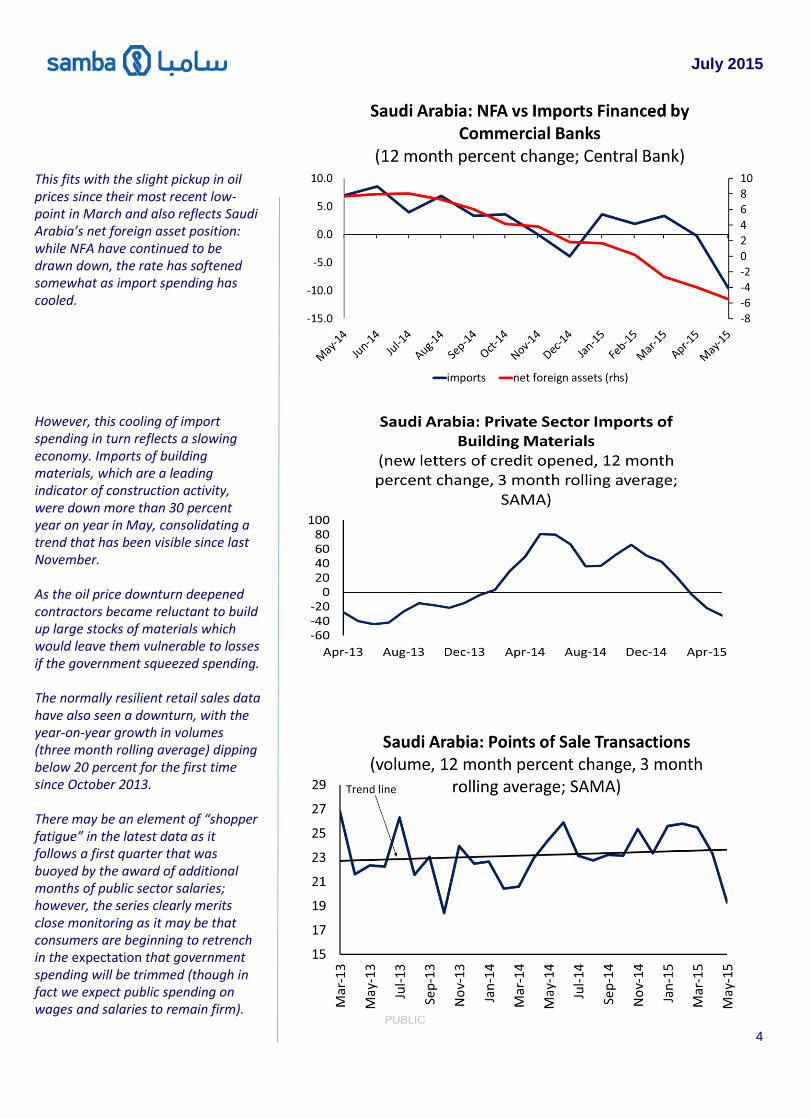
This fits with the slight pickup in oil prices since their most recent low-point in March and also reflects Saudi Arabia’s net foreign asset position: while NFA have continued to be drawn down, the rate has softened somewhat as import spending has cooled. However, this cooling of import spending in turn reflects a slowing economy. Imports of building materials, which are a leading indicator of construction activity, were down more than 30 percent year on year in May, consolidating a trend that has been visible since last November. As the oil price downturn deepened contractors became reluctant to build up large stocks of materials which would leave them vulnerable to losses if the government squeezed spending. The normally resilient retail sales data have also seen a downturn, with the year-on-year growth in volumes (three month rolling average) dipping below 20 percent for the first time since October 2013. There may be an element of “shopper fatigue” in the latest data as it follows a first quarter that was buoyed by the award of additional months of public sector salaries; however, the series clearly merits close monitoring as it may be that consumers are beginning to retrench in the expectation that government spending will be trimmed (though in fact we expect public spending on wages and salaries to remain firm).
July 2015
PUBLIC
5
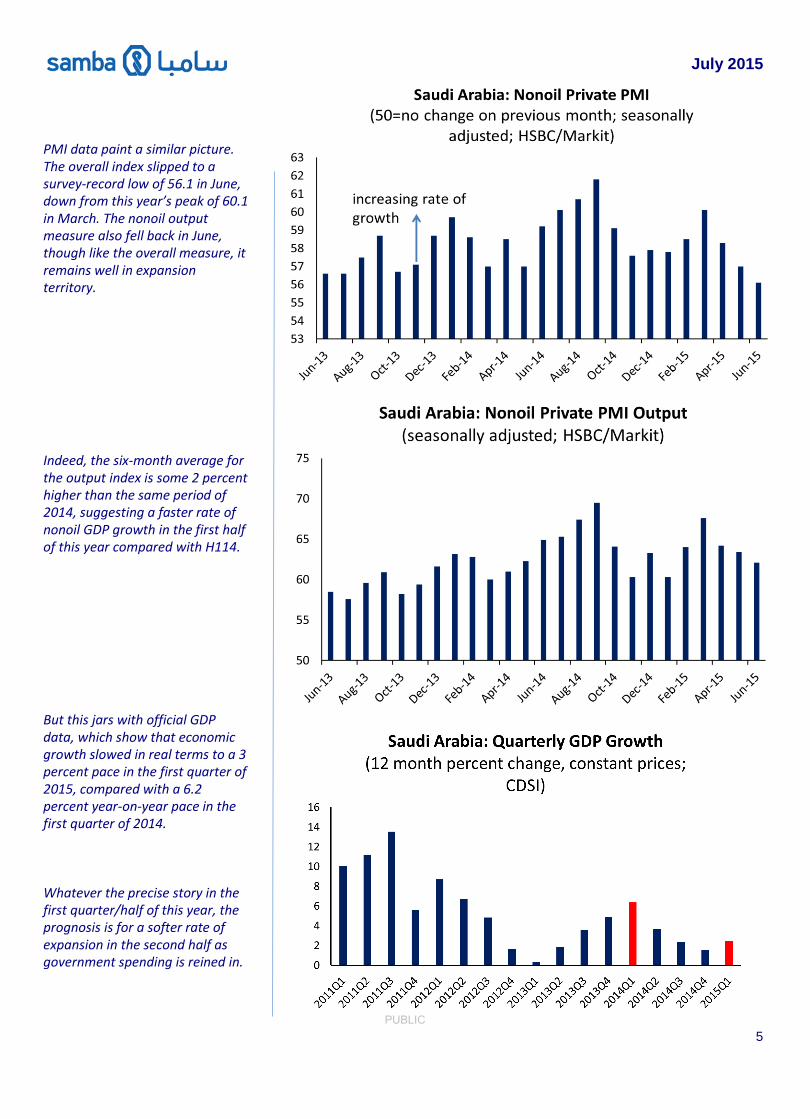
PMI data paint a similar picture. The overall index slipped to a survey-record low of 56.1 in June, down from this year’s peak of 60.1 in March. The nonoil output measure also fell back in June, though like the overall measure, it remains well in expansion territory. Indeed, the six-month average for the output index is some 2 percent higher than the same period of 2014, suggesting a faster rate of nonoil GDP growth in the first half of this year compared with H114. But this jars with official GDP data, which show that economic growth slowed in real terms to a 3 percent pace in the first quarter of 2015, compared with a 6.2 percent year-on-year pace in the first quarter of 2014. Whatever the precise story in the first quarter/half of this year, the prognosis is for a softer rate of expansion in the second half as government spending is reined in.

July 2015
PUBLIC
6
There are no intra-year fiscal data, but a number of initiatives suggest that the government is tightening its stance: one example is that ministry projects worth more than SR100 m now need central government approval (regardless of budgeted appropriations). Other initiatives—from SAMA—also point to slower growth: the 70 percent LTV cap on mortgage lending has already contributed to a sharp downturn in housing activity, while a 15 percent cap on bank lending to any one company/group (previously 25 percent) might further slow domestic credit growth. It is notable that bank lending to the private sector in May cooled to its lowest year-on-year rate since December 2010.
The coincidence of higher interest rates and government domestic debt issuance suggests that lending to the private sector will likely ease further in the final quarter of this year and into 2016 (though note that the sector has ample liquidity with an average L-D ratio for private sector lending of under 80 percent). Recently released and revised official data show that government spending grew by almost 12 percent in 2014, higher than originally estimated, and not far below the five year average of 13 percent. This was despite the downturn in oil prices that began around the middle of last year.
July 2015
PUBLIC
7
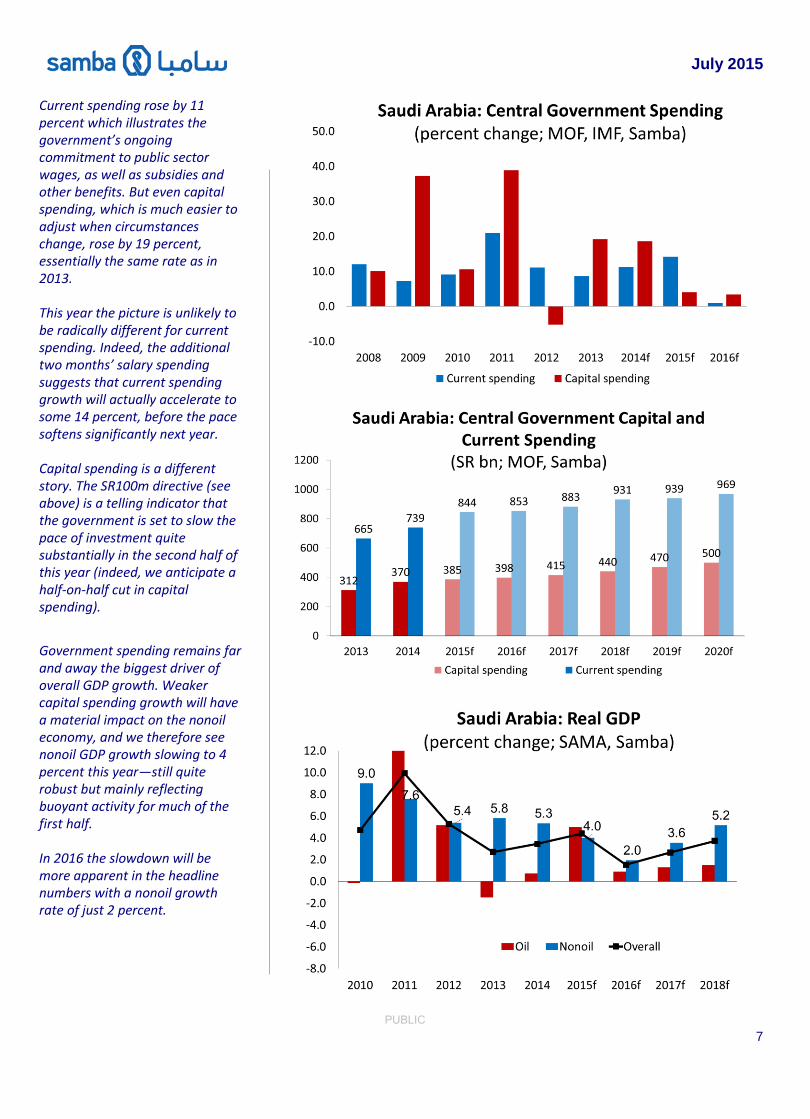
Current spending rose by 11 percent which illustrates the government’s ongoing commitment to public sector wages, as well as subsidies and other benefits. But even capital spending, which is much easier to adjust when circumstances change, rose by 19 percent, essentially the same rate as in 2013. This year the picture is unlikely to be radically different for current spending. Indeed, the additional two months’ salary spending suggests that current spending growth will actually accelerate to some 14 percent, before the pace softens significantly next year. Capital spending is a different story. The SR100m directive (see above) is a telling indicator that the government is set to slow the pace of investment quite substantially in the second half of this year (indeed, we anticipate a half-on-half cut in capital spending).
Government spending remains far and away the biggest driver of overall GDP growth. Weaker capital spending growth will have a material impact on the nonoil economy, and we therefore see nonoil GDP growth slowing to 4 percent this year—still quite robust but mainly reflecting buoyant activity for much of the first half. In 2016 the slowdown will be more apparent in the headline numbers with a nonoil growth rate of just 2 percent.
July 2015
PUBLIC
8
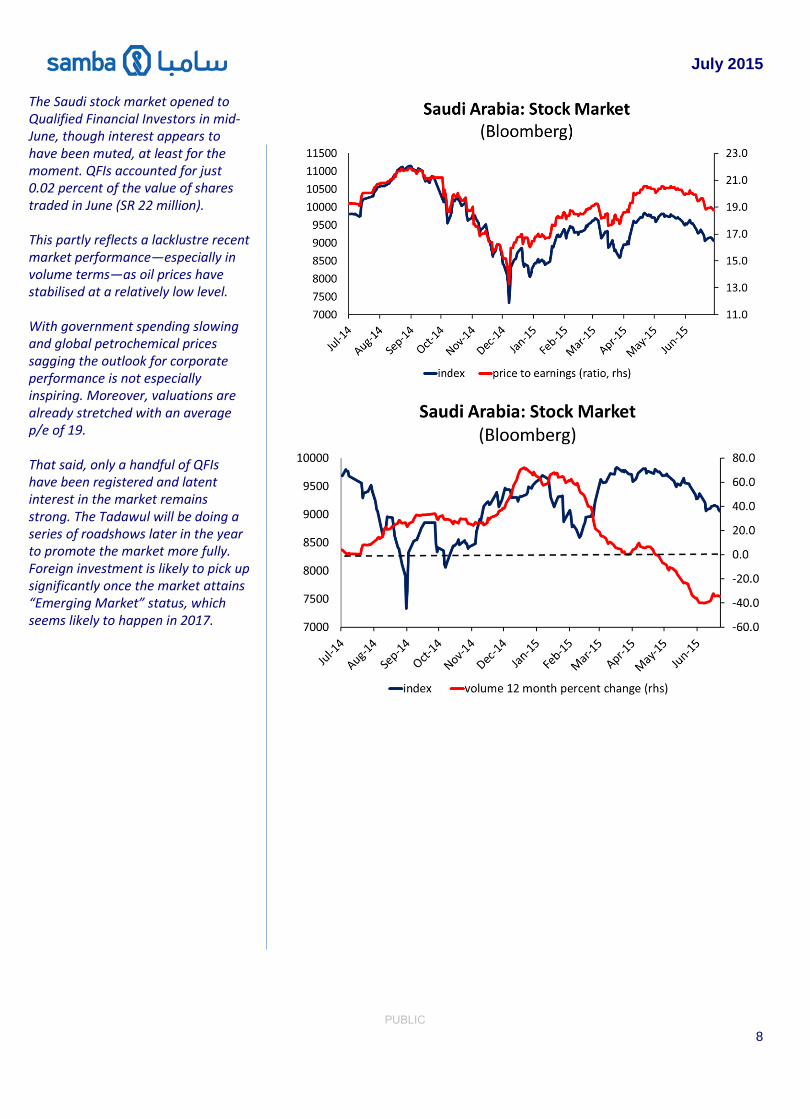
Recently, the main index has followed the oil price, erasing a previous trend when the performance of global equities’ markets was the main influence.
How attractive the market might prove to foreign institutions remains the subject of some debate. Weaker oil prices have already hit the bottom line of chemicals’ firms, which account for a large chunk of the index.
The market also appears quite expensive compard with some of its peers. The p/e is already over 19, while the dividend yield is not paricularly compelling at 2.83 percent. The latter is a key metric for large foreign institutions, especially pension funds.
That said, the country itself has a stable currency, strong demographics, abundant energy, and a govenrnent with barely any debt.
It could take up to two years before the Tadawul is officially incorported into the MSCI’s EM index. Its inclusion would be an automatic trigger for additional passive fund inflows.
`
The Saudi stock market opened to Qualified Financial Investors in mid-June, though interest appears to have been muted, at least for the moment. QFIs accounted for just 0.02 percent of the value of shares traded in June (SR 22 million). This partly reflects a lacklustre recent market performance—especially in volume terms—as oil prices have stabilised at a relatively low level. With government spending slowing and global petrochemical prices sagging the outlook for corporate performance is not especially inspiring. Moreover, valuations are already stretched with an average p/e of 19. That said, only a handful of QFIs have been registered and latent interest in the market remains strong. The Tadawul will be doing a series of roadshows later in the year to promote the market more fully. Foreign investment is likely to pick up significantly once the market attains “Emerging Market” status, which seems likely to happen in 2017.

July 2015
PUBLIC
9
James Reeve Deputy Chief Economist [email protected] Andrew Gilmour Deputy Chief Economist [email protected] Thomas Simmons Economist [email protected]
Disclaimer This publication is based on information generally available to the public from sources believed to be reliable and up to date at the time of publication. However, SAMBA is unable to accept any liability whatsoever for the accuracy or completeness of its contents or for the consequences of any reliance which may be place upon the information it contains. Additionally, the information and opinions contained herein: 1. Are not intended to be a complete or comprehensive study or to provide advice
and should not be treated as a substitute for specific advice and due diligence concerning individual situations;
2. Are not intended to constitute any solicitation to buy or sell any instrument or engage in any trading strategy; and/or
3. Are not intended to constitute a guarantee of future performance. Accordingly, no representation or warranty is made or implied, in fact or in law, including but not limited to the implied warranties of merchantability and fitness for a particular purpose notwithstanding the form (e.g., contract, negligence or otherwise), in which any legal or equitable action may be brought against SAMBA. Samba Financial Group P.O. Box 833, Riyadh 11421 Saudi Arabia