working capital and corporate strategy patterns in working capital of ...
Upload
anuj-gandhiCategory
view
108download
1description

WORKING CAPITAL MANAGEMENT
AT
“SATYAM COTTEX PVT LTD”
Submitted in partial fulfillment of the requirement
For the award of
MASTER’S DEGREE IN BUSINESS ADMINISTRATION
(Session 2011-2013)
Submitted By:
NITIN JAIN ROLL NO : 11225
PANIPAT INSTITUTE OF ENGINEERING & TECHNOLOGY
KURUKSHETRAUNIVERSITY, KURUKSHETRA

ACKNOWLEDGEMENT
It is well-established fact that behind every achievement lays an unfathomable sea of
gratitude to those who have extended their support and without whom the project would
ever have come into existence.
I express my gratitude to SATYAM COTTEX PVT LTD, Panipat, for providing me an
opportunity to work on this thesis as a part of the curriculum.
Also, I express my gratitude to Prof. Dr. Puja Walia Mann (Head of Management
Department) and MR. AKHILESH MISHRA (Faculty – MBA) on the completion of my
project.
NITIN JAIN
ROLL NO: 11225

INDEX
CHP. NO. PARTICULARS PAGE NO.
1. INTRODUCTION
1.1 Industry Profile
1.2 Company Profile
1.3 Introduction To Topic
1
2. LITERATURE REVIEW64
3. RESEARCH METHODOLOGY
3.1 Definition
3.2 Objective Of The Study
3.3 Justification Of The Study
3.4 Scope Of The Study
3.5 Research Design
3.6 Data Collection
3.7 Limitations
69
4. ANALYSIS AND INTERPRETATION73
5.
6.
CONCLUSION AND SUGGESTIONS
5.1 Findings
5.2 Suggestion
5.3 Conclusion
BIBLIOGRAPHY
84
86
89

ANNEXURES
DECLARATION
I, hereby declare that the Summer Training project entitled “WORKING CAPITAL
MANAGEMENT IN SATYAM COTTEX PVT. LTD.” is an original work and the same has
not been submitted to any other Institute for the award of any other degree & the information
provided in the study is authentic to the best of best of my knowledge.
(NITIN JAIN)
ROLL NO : 11225

CHAPTER-1
INTRODUCTION

INTRODUCTION TO TEXTILE INDUTRY
(A)Overview of the Indian textile industry
Indian Textile Industry can essentially be categorized into two segments:-
1. Organized Textile Industry
2. Unorganized Textile Industry
Unorganized sector is the dominant part in this industry which mainly utilizes the traditional
practices in cloth production and hence is labor intensive in nature. This industry is characterized
by the production of clothes either through weaving or spinning with the help of hands. The
decentralized nature is considered as another important feature of the unorganized textile
industry in India.
Sub-Categorized sectors of the Indian textile Industry
Textile Industry based on fiber produced through man made means or natural cotton In the whole Indian
textile industry, this sector has come as the largest producer of textile products. This industry has also
proved its potential in employing the maximum number of people in the entire industry which has been
calculated to be around a whooping one million workers. As per the latest records (31.01.2007) of
Ministry of Textiles, the total number of mills in this particular sector is 1818 in number. The installed
capacity of all these mills accumulates to 35.37 million spindles and 0.45 million rotors
During the year 2000-2001, the total amount of spun yarn produced was 3160 million kgs. This amount
saw an increase of around 400 million kgs within the period of 2000-2001 to 2005-2006.
Cloth production has also evidenced a declining trend during 2000-2006 with an absolute decrease of
ninety four million square meters. The annual growth rate of total cloth production in the textile industry
has been calculated to be around 5.24 % between 2000-2001 to 2005-2006. But stratified result of this
industry show that during the above mentioned period, the organized sector of this industry has posted
fluctuating results whereas the unorganized one has performed positively with an yearly rate of growth
amounting to 5.4%.

Investment In Indian Textile Industry
Investment in Indian Textile Industry
The scenario of investment in the Indian textile industry started to change after the inception of the
special “Textile Package” during the 2003-2004 budgets. The recommendations made in the budget
included the reforms that are required to be made in the fiscal policy of the Indian textile Industry for
attracting investment in this industry. The policy matters associated with restructuring of debt for
financial viability of this industrial sector are also being addressed in this budget. A fund was set up in
accordance with the recommendations of the aforesaid budget with an initial principal amount of Rs.
3000 crores. This fund was meant for restructuring of the textile sector.
Factors responsible for wooing the investors in Indian textile industry:-
The size of the textile along with apparel market in India is quite big.
Performance of this industry has been consistent right from the start of the new millennium.
Availability of the skilled labor in India is comparatively cheap in relation to the same in
other parts of the world.
The policies related to the Foreign Direct Investment in India are comparatively lenient and
are transparent in nature among all the developing countries.
There is no limit on foreign direct investment in the textile industry and hence 100% direct
investment can be done by the foreign capitalists in the Indian textile industry.
Foreign Investments done in the Indian Textile Industry through the automatic route offers a
hassle-free way of investing. These investments are not required to be approved by the
government or the apex bank of India, RBI. The foreign investors are only required to make a
notification to the regional office of the apex bank only after receiving the receipt of the
remittance. This notification is required to be done within thirty days from the date of
receiving the remittance. The ministry concerned with the development of Textile Industry in
India has formed a special cell for attracting FDI in this sector. Objectives of this special cell
for wooing FDI are :-

This cell helps the willing foreign companies to find out viable partners meant for floating a
joint venture company in order to produce textile products.
FDI special cell acts as the mediator between the foreign investor and the different
organizations for setting up the textile industry. The specialized helps that are given by this
cell involve advisory support along with assistance.
At the time of operation of the textile industry set by the foreign investor certain problems
may crop up. These problems are sorted out by the FDI cell.
FDI cell monitors as well as maintains the data related with the total production of the textile
sector. They also collect the stratified data of production by both domestic industry as well as
the industry set up by the foreign investor. In the financial year 2005-2006, it has been found
out that the percentage share of the textile industry in the total foreign investment done was
1.02%.
As a part of domestic textile sector expansion, the companies of Indian origin are also not far
behind in making investments. Arvind Mills Limited is expanding its production as well as
capacity base through the construction of two new industrial set ups in Bangalore and
Ahmadabad.

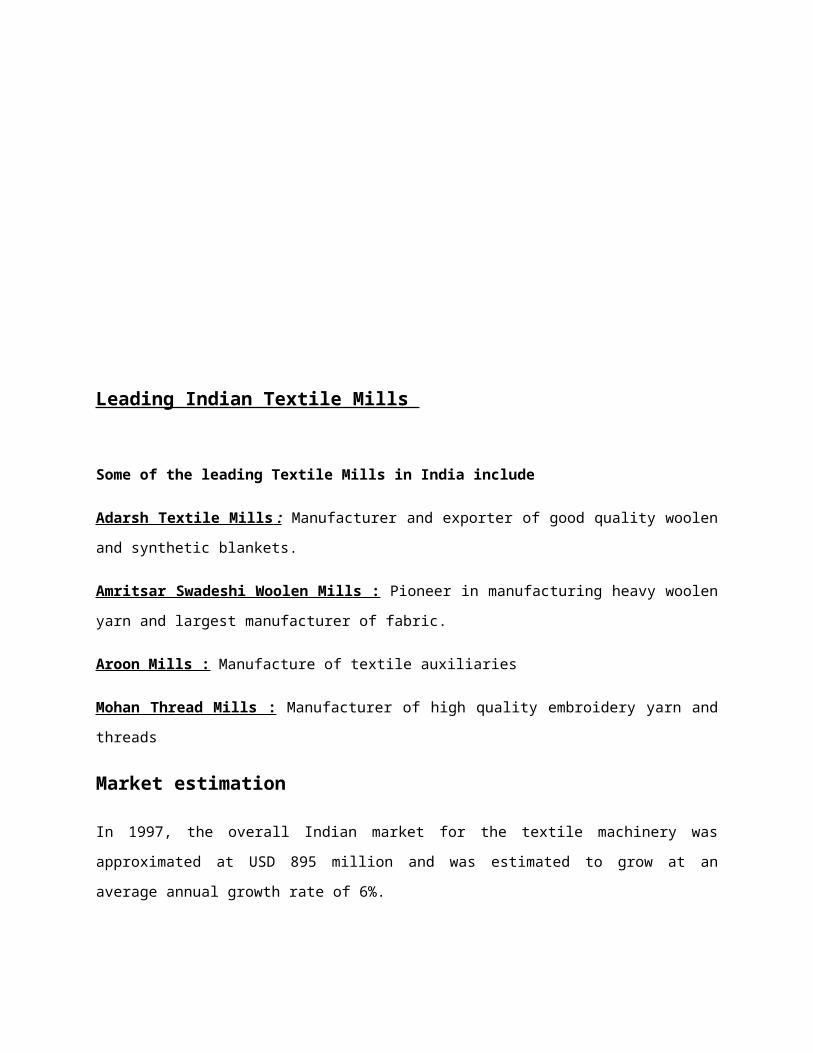
Leading Indian Textile Mills
Some of the leading Textile Mills in India include
Adarsh Textile Mills : Manufacturer and exporter of good quality woolen and synthetic blankets.
Amritsar Swadeshi Woolen Mills : Pioneer in manufacturing heavy woolen yarn and largest
manufacturer of fabric.
Aroon Mills : Manufacture of textile auxiliaries
Mohan Thread Mills : Manufacturer of high quality embroidery yarn and threads
Market estimation
In 1997, the overall Indian market for the textile machinery was approximated at USD 895 million and
was estimated to grow at an average annual growth rate of 6%.
Factors responsible behind the growth of textile machinery in India
Some of the major factors responsible behind the growth of textile machinery sector are:
An immense demand of Indian apparels and textiles in the international market
Low custom duties on imported textile machinery
Less tight government restrictions on imported goods Major trading partners regarding
import of textile machineries include U.S., Germany, Switzerland and U.K. India ranks
second in the global textile industry and accounts a major portion to the overall Indian
exports. For the sustenance of this growth and to maintain the competence in the
international market, the textile mills in India need to be modernized.
(B)Leading Textile mills in India :-
Some of the major textile mills in India are:
1. Raymond Ltd., Mumbai
2. Grasim Industries Ltd., Nagda
3. DCM Textiles, New Delhi
4. S. Kumars, Kolkata
5. Reliance Industries, Ahmedabad
6. Mafatlal Industries, Mumbai
7. Arvind Mills Ltd., Ahmedabad
8. AshimaSyntex, Ahmedabad
9. NAHAR SPINING, LUDHIANA
10. Hisar Spinning Mills Ltd.
11. Anand Silk Mills, Valsad
12. Titex Silk Mills,Valsad
13. Shree sainath Silk Mills, Valsad
14. Shreeji Trading Company, Surat
15. Garden Silk Mills Ltd., Surat
16. Raj Rayon Ltd., Mumbai
17. The Bombay Dyeing & mfg. Pvt Ltd., Mumbai
18. Shiyaji Silk Mills Ltd, Thane
19. Nirmala Fabrics, Thane
COMPANY PROFILE
NAME OF COMPANY : SATYAM COTTEX PVT.LTD
SATYAM COTTEX PVT. LTD is an industrial conglomerate based at PANIPAT in
HARYANA with the group turnover in excess of Rs.20 MILLION . The Satyam cottexpvt ltd
is one of the oldest and well recognized businesses in India. The company was incorporated in
1990 by Mr. Sushiljain , The company’s present chairman and managing director.The company
is one of the pioneers of the organized Indian woollen hosiery industry. The company made a
beginning as a manufacturer of hosiery items Which was followed by setting up a worsted
woollen spinning plant of 100 spindles in 1990 {today 1000 spindles} to serve as a backward
integration of the existing manufacturing activities. The company believes that this worsted
woollen spinning in the northern India.
Matching ahead in the journey pace with overall industrial development in India the company is
now a vertically integrated woollen textile company, having presence in diverse market, with
wide range of products including wooollen hosiery and cotton garments. In company’s woollen
hosiery segment, we start our operations with import of raw greasy wool mostly from U.S.A and
company products include various types of specialty yarns, such as, worsted woollen yarn, shody
yarn, various types of carpet yarn, fancy yarn, hand knitting and hosiery garments etc.
The company manufacture facilities are spread across various locations in and around PANIPAT
in HARYANA fully backed by the facilities to provide quality products to our customers.
INTRODUCTION TO TOPIC:
WORKING CAPITAL MANAGEMENT
Working Capital is very important factor for every business. Without Working Capital the day-to-day activities of a business cannot run. The reason behind selected this important topic is clear after discussing it’s need which are as follows:
Every running business needs working capital: Even a business, which is fully equipped with all types of fixed assets required, is bound to collapse without
Adequate supply of raw materials for processing; Cash to pay for wages, power and other costs; Creating a stock of finished goods to feed the market demand regularly; (iv) the ability to grant
credit to its customers. All these require working capital. Working capital is thus like the lifeblood of a business. The business will not be able to carry on day-to-day activities without the availability of adequate working capital.
. Initially ‘cash’ is converted into raw materials. Subsequently, with the usage of fixed assets resulting in value additions, the raw materials get converted into work in process and then into finished goods.
When sold on credit, the finished goods assume the form of debtors who give the business cash on due date. Thus ‘cash’ assumes its original form again at the end of one such working capital cycle but in the course it passes through various other forms of current assets too. This is how various components of current assets keep on changing their forms due to value addition.
They rotate and business operations continue. Thus, the working capital cycle involves rotation of various constituents of the working capital.
WORKING
CAPITAL MANAGEMENT
MEANING AND DEFINITION OF WORKING CAPITAL:
Working capital refers to short-term funds to meet operating expenses. To quote Ramamoorthy, “It refers to the funds, which a company must possess to finance its day-to-day operations”. It is concerned with the management of the firm’s current assets and current liabilities. It relates to with the problems that arise in attempting to manage the current assets, current liabilities and their inter-relationship that exists between them. If a firm cannot maintain a satisfactory level of working capital, it is likely to become insolvent and may even be forced into bankruptcy.
CONCEPT OF WORKING CAPITAL:There are two concept of working capital:
1) Gross Working Capital Concept2) Net Working Capital Concept
1) Gross Working Capital Concept:According to this concept, working capital means gross working capital which is the total of all the current assets of a business.
GROSS WORKING CAPITAL = TOTAL CURRENT ASSETS
2) Net Working Capital Concept:According to this concept, working capital means net working capital, which is the excess of current assets over current liabilities.
NET WORKING CAPITAL=CURRENT ASSETS-CURRENT LIABILITIES

PERMANENT WORKING CAPITAL:Permanent working capital is the minimum investment kept in the form of inventory of raw materials, work-in-process, finished goods, stores & spares and book debts to facilitate uninterrupted operation in a firm. Though this investment is stable in short run, it certainly varies in long run depending upon the expansion programs undertaken by the firm. It may increase or decrease over a period of time. The minimum level of current assets maintained in a firm is usually known as permanent or regular working capital.
TEMPORARY WORKING CAPITAL:A firm is required to maintain additional current assets temporarily over and above permanent working capital to satisfy cyclical demands. Any additional working capital apart from permanent
KINDS OF WORKING CAPITAL
NEED OR TIME BASE
CONCEPT BASE
TEMPORARY
OR VARIABLE
PERMANENT OR
REGULAR
WORKING
NET
WORKING
GROSS
WORKING

working capital required to support the changing production and sales activities is referred to as temporary or variable working capital. In other words, an amount over and above the permanent level of working capital is temporary, fluctuating or variable working capital. At times, additional working capital is required to meet the unforeseen events like floods, strikes, fire and price hike tendencies and contingencies.
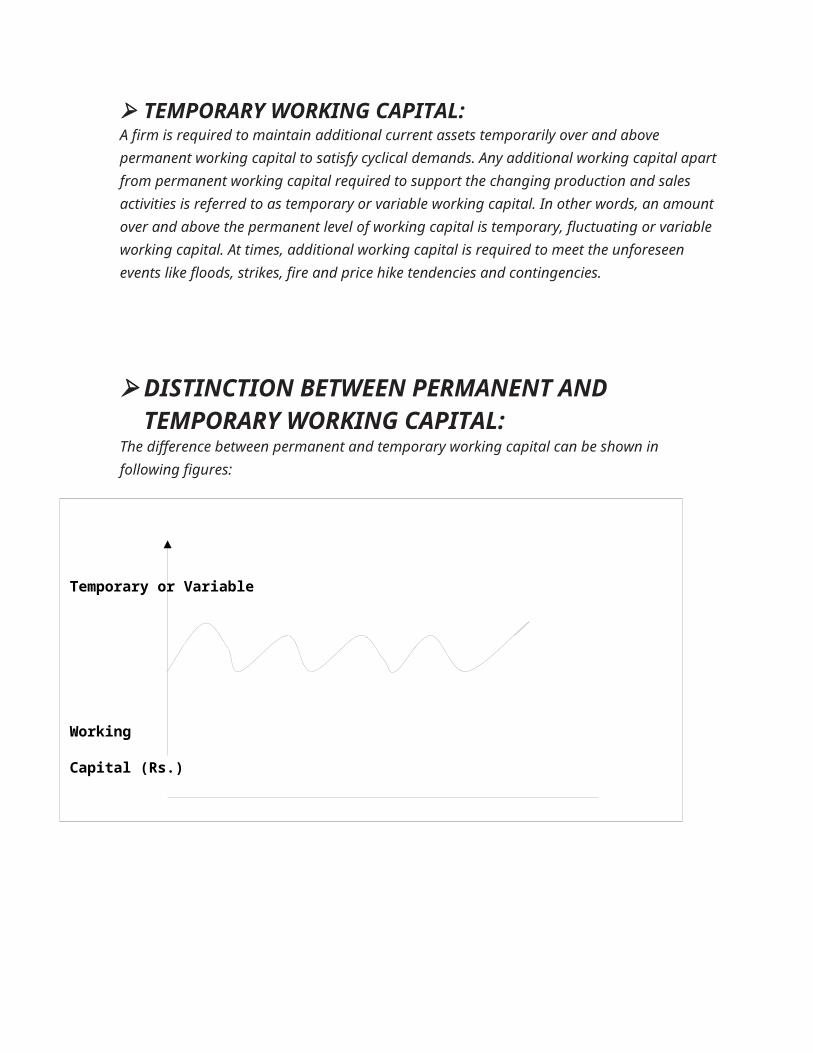
DISTINCTION BETWEEN PERMANENT AND TEMPORARY WORKING CAPITAL:
The difference between permanent and temporary working capital can be shown in following figures:
Temporary or Variable
Working
Capital (Rs.)
Permanent or
Regular

The above figure depicts the permanent or regular working capital that is stable
Temporary or Variable
Permanent
Or
Regular
WorkingCapital (Rs.)

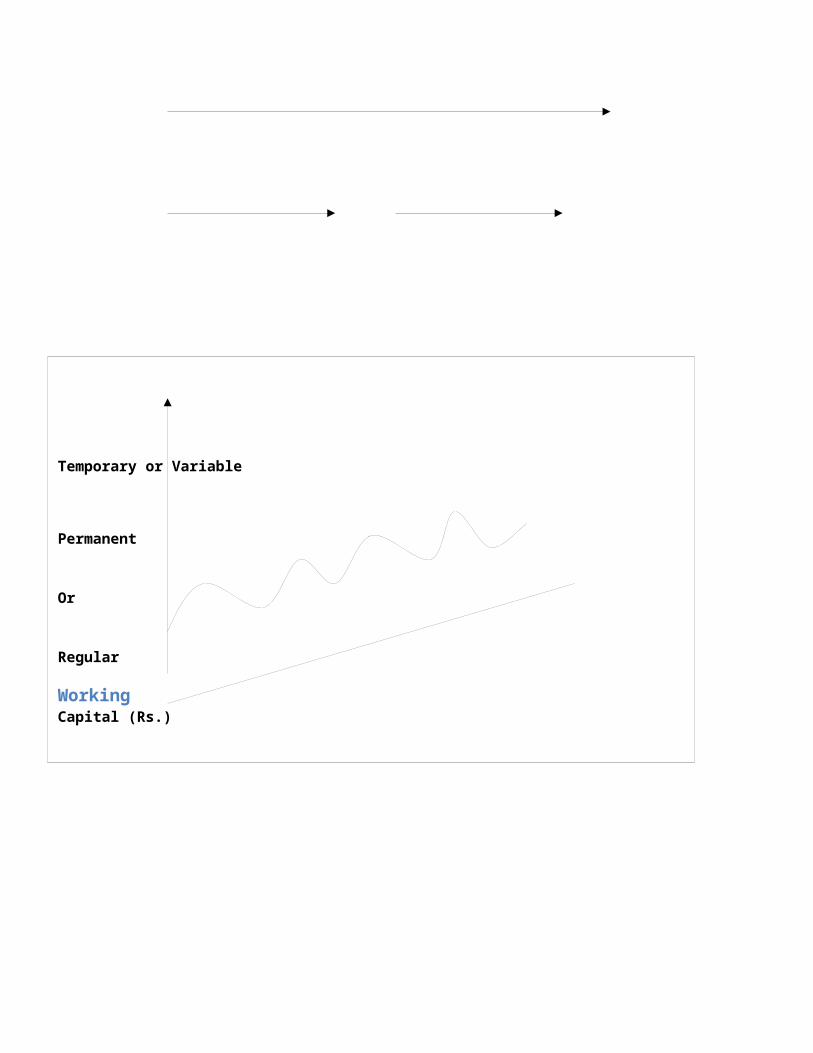
over a period, where as temporary or variable working capital is oscillating, or showing ups and down- some time working capital requirement has increased or decreased. The very first figure will hold good to those firms, where there is no development and have seasonal or cyclic fluctuations.
But for the growing firms second figure will be suitable.
Over a long period, permanent working capital also changes with the additional funds, required for expression programs.
OBJECTIVES OF WORKING CAPITAL MANAGEMENT:
The objectives of working capital management could be stated as,
i) To ensure optimum investment in current assets.ii) To strike a balance between the twin objectives of liquidity and
profitability in the use of funds.
iii) To ensure adequate flow of funds for current operations.iv) To speed up the flow of funds or to minimize the stagnation of funds.
FACTORS AFFECTED WORKING CAPITAL: The working capital needs of a business are influenced by numerous factors. The important ones are discussed in brief as given below:
i. Nature of Enterprise:
The nature and the working capital requirements of an enterprise are interlinked. While a manufacturing industry has a long cycle of operation of the working capital, the same would be short in an enterprise involved in providing services. The amount required also varies as per the nature; an enterprise involved in production would require more working capital than a service sector enterprise.
ii. Manufacturing/Production Policy:
Each enterprise in the manufacturing sector has its own production policy, some follow the policy of uniform production even if the demand varies from time to time, and others may follow the

principle of 'demand-based production' in which production is based on the demand during that particular phase of time. Accordingly, the working capital requirements vary for both of them.
iii. Operations:
The requirement of working capital fluctuates for seasonal business. The working capital needs of such businesses may increase considerably during the busy season and decrease during the slack season. Ice creams and cold drinks have a great demand during summers, while in winters the sales are negligible.
iv. Market Condition:
If there is high competition in the chosen product category, then one shall need to offer sops like credit, immediate delivery of goods etc. for which the working capital requirement will be high. Otherwise, if there is no competition or less competition in the market then the working capital requirements will be low.
v. Availability of Raw Material:
If raw material is readily available then one need not maintain a large stock of the same, thereby reducing the working capital investment in raw material stock. On the other hand, if raw material is not readily available then a large inventory/stock needs to be maintained, thereby calling for substantial investment in the same.
vi. Growth and Expansion:
Growth and expansion in the volume of business results in enhancement of the working capital requirement. As business grows and expands, it needs a larger amount of working capital. Normally, the need for increased working capital funds precedes growth in business activities.
vii. Price Level Changes:
Generally, rising price level requires a higher investment in the working capital. With increasing prices, the same level of current assets needs enhanced investment.

Component of Working Capital Basis of Valuation:
Inventory Management:
Inventory includes all types of stocks. For effective working capital management, inventory needs to be managed effectively. The level of inventory should be such that the total cost of ordering and holding inventory is the least. Simultaneously, stock out costs should also be minimized. Business, therefore, should fix the minimum safety stock level; re-order level and ordering quantity so that the inventory cost is reduced and its management become efficient.
Receivables’ Management: Every business would prefer selling its produce on cash basis. However, due to factors like trade policies, prevailing marketing conditions, etc., businesses are compelled to sell their goods on credit. In certain circumstances, a business may deliberately extend credit as a strategy of increasing sales. Extending credit means creating a current asset in the form of ‘Debtors’ or ‘Accounts Receivable’. Investment in this type of current assets needs proper and effective management as it gives rise to costs such as:
i. Cost of carrying receivable (payment of interest etc.)
ii. Cost of bad debt losses
Cash Management: Cash is the most liquid current asset. It is of vital importance to the daily operations of business. While the proportion of assets held in the form of cash is very small, its efficient management is crucial to the solvency of the business. Therefore, planning cash and controlling its use are very important tasks. Cash budgeting is a useful device for this purpose.
Cash Budget: Cash budget basically incorporates estimates of future inflows and outflows of cash over a projected short period of time which may usually be a year, a half or a quarter year. Effective cash management is facilitated if the cash budget is further broken down into month, week or even on daily basis.
There are two components of cash budget
(i) Cash inflows and
(ii) Cash outflows.

The main sources for these flows are given hereunder:
Cash Inflows: (a) Cash sales
(b) Cash received from debtors
(c) Cash received from loans, deposits, etc.
Average credit Total amount of receivables = Extended (in days)
Average credit sales per
day
(d) Cash receipt of other revenue income
(e) Cash received from sale of investments or assets.
Cash Outflows: (a) Cash purchases
(b) Cash payment to creditors
(c) Cash payment for other revenue expenditure
(d) Cash payment for assets creation (e) Cash payment for withdrawals, taxes
(f) Repayment of loans, etc.
DETERMINATION OF REQUIRED WORKING CAPITAL:
Working capital is equal to the current assets minus current liabilities. In other words, working capital consisting two components, such as current assets and current liabilities. Hence, for estimation of working capital, there is a need to follow the following four–step procedure:
Estimation of cash of the various current assets required by the firm. Estimation of spontaneous current liabilities of the firm Compute net working capital by subtracting the estimate current liabilities from current assets

Add some percentage of net working capital if there is any contingency or safety working capital required, to get the required working capital
MANAGEMENT OF WORKING CAPITAL
Following are the main objectives or aspects of working capital management:
1) To Determine the Adequate or Optimum Quantum of Investment in Working Capital:
As discussed, a firm should maintain adequate or reasonable investment in working capital. Investment in working capital should neither be excessive nor inadequate.
2) To Determine the Composition or Structure of Current Assets:
The financial management is required to determine the composition of current assets. It should decide how much amount should be invested in each individual current assets. For this purpose, it should fix the average amount invested in stock, debtors, marketable securities and the level of cash balance.
3) To Maintain a Proper Balance between Liquidity and Profitability:
While managing working capital, management will have to reconcile two conflicting aspects. The conflicting aspects are liquidity and profitability. If the quantum of working capital is relatively large, it will increase the liquidity but decrease the profitability. The reason is that a considerable amount of firm’s funds will be tied up in current assets and to the extent this investment is idle, the firm will have to forego profits. On the other hand, if the quantum of working capital is relatively small, it will decrease liquidity but will result in the profitability. This is because the less funds are tied up in idle current assets.
CHAPTER-2
LITERATURE REVIEW

REVIEW OF LITERATURE
An overview of working capital management and corporate financing describes that over the
past 40 years major theoretical developments have occurred in the areas of longer-term
investment and financial decision making. Many of these new concepts and the related
techniques are now being employed successfully in industrial practice. By contrast, far less
attention has been paid to the area of short-term finance, in particular that of working capital
management. Such neglect might be acceptable were working capital considerations of
relatively little importance to the firm, but effective working capital management has a
crucial role to play in enhancing the profitability and growth of the firm. Indeed, experience
shows that inadequate planning and control of working capital is one of the more common
causes of business failure. (C.L.,Pike,1984). “The Effect of Working Capital Management on
Firm Profitability: Evidence from Turkey” (2008) describes that the effect of working capital
management on firm profitability. In accordance with this aim, to consider statistically
significant relationships between firm profitability and the components of cash conversion
cycle at length, a sample consisting of Istanbul Stock Exchange (ISE) listed manufacturing
firms for the period of 1998-2007 has been analysed under a multiple regression model.
Empirical findings of the study show that accounts receivables period, inventory period and
leverage affect firm profitability negatively; while growth (in sales) affects firm profitability
positively.(Samiloglu F. &Demirgunes K,2008). “Working capital, sometimes called gross
working capital, simply refers to the firm's total current assets (the short-term ones), cash,
marketable securities, accounts receivable, and inventory. While long-term financial analysis
primarily concerns strategic planning, working capital management deals with day-to-day
operations. By making sure that production lines do not stop due to lack of raw materials,
that inventories do not build up because production continues unchanged when sales dip, that
customers pay on time and that enough cash is on hand to make payments when they are due.
Obviously without good working capital management, no firm can be efficient and
profitable. (Hardcastle J,2007). The working capital in a firm generally arises out of four
basic factors like sales volume,technologicalchanges,seasonal , cyclical changes and policies
of the firm.Thestrenghth of the firm is dependent on the working capital as discussed earlier
but this working capital is inteslf dependent on the level of sales volume of the firm.The firm

requires current assets to support and maintain operational or functional activities.By current
assets we mean the assets which can be converted readily into cash say within a year such as
receivables,inventories and liquid cash.If the level of sales is stable and towards growth the
level of cash,receivables and stock will also be on the high.(Dubey R, 2008).

CHAPTER-3
RESEARCH METHODOLOGY

OUTLINE OF THE STUDY
The management of working capital is very important. It involves the study of day-to-day affairs
of the company. The motive behind the study is to develop an understanding about the working
capital management in the running business organization and to help the company in developing
the efficient working capital management. Therefore, it helps in future planning and control
decisions.
OBJECTIVES OF THE STUDY
The objectives of the study are as follows:
To analyze the working capital management of the company.
To determine the gross and net operating cycle of the unit.
To know the future need of working capital in the running organization.
To render recommendations for the effective management of working capital.

RESEARCH METHODOLOGY
The term research refers to the systematic method consisting of enunciating the problem ,
formulating a hypothesis collecting the data , analyzing the facts and reaching the certain
conclusions either in the form of solution towards the concern problem or in certain
generalization for some theoretical formulation .
Research Methodology is a way to solve systematically the research problem .It may be
understood as a science of studying how research is done scientifically.
Time Period of the study:
The present study was undertaken during Six weeks from 14th June - 26th July.
Research Design:
Descriptive research procedure is used for describing the recent situations in the organization and
analytical research to analyze the results by using research tools.
Descriptive research, also known as statistical research, describes data and characteristics
about the population or phenomenon being studied. Descriptive research answers the
questions who, what, where, when and how...
Although the data description is factual, accurate and systematic, the research cannot describe
what caused a situation. Thus, Descriptive research cannot be used to create a causal
relationship, where one variable affects another. In other words, descriptive research can be said
to have a low requirement for internal validity.
In short descriptive research deals with everything that can be counted and studied. But there
are always restrictions to that. Your research must have an impact to the lives of the people
around you. For example,finding the most frequent disease that affects the children of a town.
The reader of the research will know what to do to prevent that disease thus, more people will
live a healthy life.
Data Source & Collection Methods:
There are two types for collecting data
1. Primary data
2. Secondary data
Secondary Data:
Secondary data are those which have already been collected by someone else and
which have already been passed through the statistical process. The Secondary data consist of
reality available compendices already complied statistical statements. Secondary data consists of
not only published records and reports but also unpublished records.
Here , the analysis on basis of secondary data, which included-
Balance sheet of company
Profit and loss A/C of Satyam
Cost sheets, & Trail balance of five years

. Purpose:
The purpose of this paper is to properly analysis of the working capital management of
Satyam, over the period 2008-2012.
Tools used:
The different tools to analyze the working capital management of Satyam -
Analysis through Working capital ratios
Analysis through Schedule change in working capital
Analysis through Gross operating cycle & Net operating cycle
Analysis through Various components of working capital

CH-4 DATA
ANALYSIS AND
INTERPRETATION

WORKING CAPITAL ANALYSIS

(1) Raw Material Conversion Period (RMCP)
= Average Raw Material Stock
Average Raw Materials consumed during the year
PARTICULARS 2011-12 2011-10 2010-09 2009-08 2008-07
Average raw
material stock
33065118 33352213.5 20819151 13076062.5 9471720.12
Raw material
consumed
during the year
314166.03 213093.45 107464.04 218371.65 121729.46
RMCP 105.25 156.52 193.73 59.88 77.80
2012 2011 2010 2009 20080
50
100
150
200
250
105.25
156.52
193.73
59.8877.8
RMCP

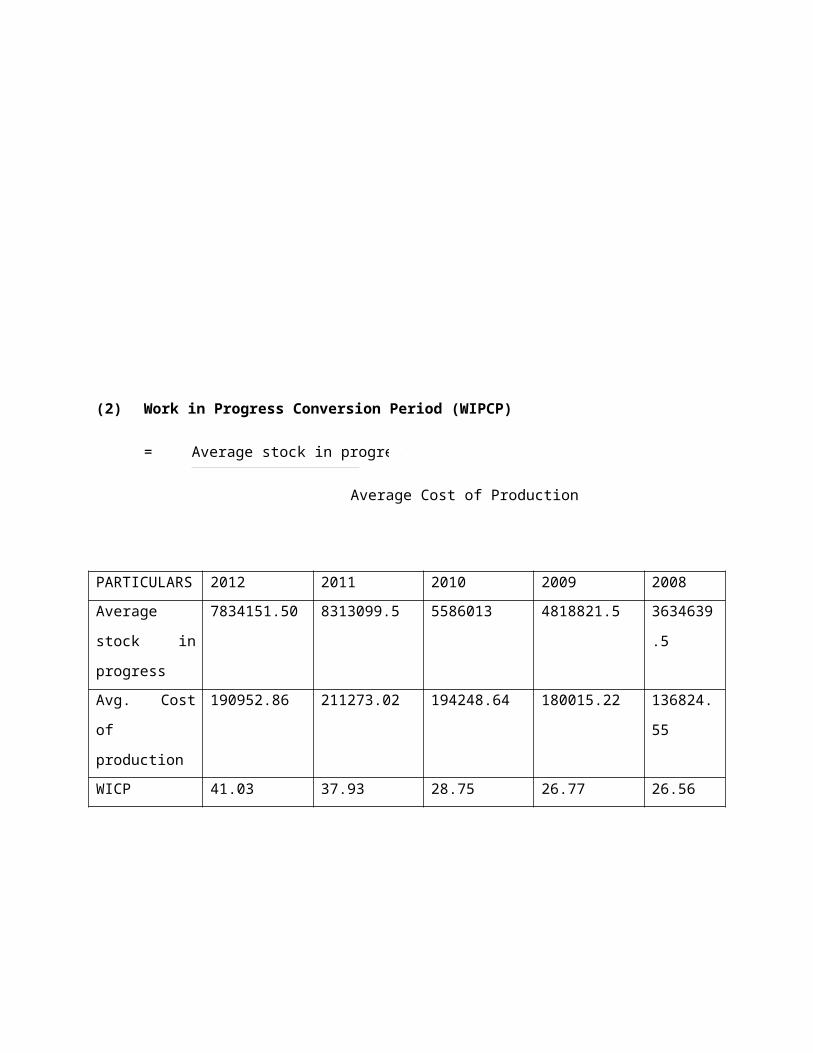
(2) Work in Progress Conversion Period (WIPCP)
= Average stock in progress
Average Cost of Production
PARTICULARS 2012 2011 2010 2009 2008
Average stock in
progress
7834151.50 8313099.5 5586013 4818821.5 3634639.5
Avg. Cost of
production
190952.86 211273.02 194248.64 180015.22 136824.55
WICP 41.03 37.93 28.75 26.77 26.56
2012 2011 2010 2009 20080
5
10
15
20
25
30
35
40
45 41.0337.93
28.7526.77 26.56
WICP

(3) Finished Goods Conversion Period (FGCP)
= Average finished goods inventory
Average Cost of goods sold
PARTICULARS 2012 2011 2010 2009 2008
Average
finished goods
inventory
14911159 13149905.5 5004497 6396225 5858384.5
Cost of goods
sold
1955523.98 1648540.72 1398222.17 1260173 989215.18
FGCP 7.63 7.98 3.58 5.08 5.92
2012 2011 2010 2009 20080
1
2
3
4
5
6
7
8
97.63 7.98
3.58
5.085.92
FGCP
X 360X 360

(4) Debtors’ Conversion Period (DCP)
= Days in year company operating
Debtors’ turnover
PARTICULARS 2012 2011 2010 2009 2008
Days in year
company operating
360 360 360 360 360
Debtors’ turnover 21.66 22.89 18.41 15.82 18.38
DCP 16.62 15.72 19.55 22.76 19.59
2012 2011 2010 2009 20080
5
10
15
20
25
16.62 15.72
19.55
22.76
19.59
DCP
(5) Credit Conversion Period (CCP)
= Days in year company operating
Creditors’ turnover
PARTICULARS 2012 2011 2010 2009 2008
Days in year
company operating
360 360 360 360 360
Creditors’ turnover 27.15 26.02 39.50 22.77 23.30
Avg. consumption
period OR CCP
13.26 13.84 9.11 15.81 16.14
2012 2011 2010 2009 20080
2
4
6
8
10
12
14
16
18
13.26 13.84
9.11
15.81 16.14
CCP
X

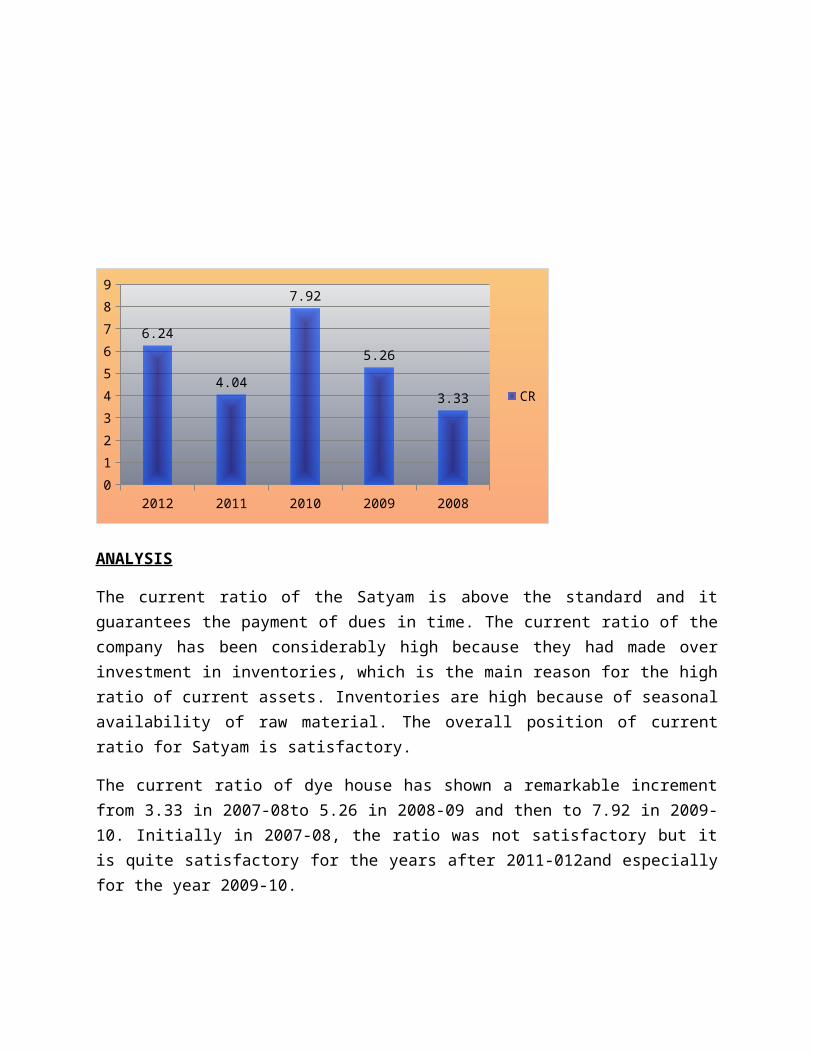
1. RATIO ANALYSIS
A ratio equal or near to the rule of thumb of 2:1 i.e. current assets double the current liabilities is
considered to be satisfactory.
Current Ratio = Current Assets
Current Liabilities
2012 2011 2010 2009 20080
1
2
3
4
5
6
7
8
9
6.24
4.04
7.92
5.26
3.33 CR
ANALYSIS
The current ratio of the Satyam is above the standard and it guarantees the payment of dues in time. The current ratio of the company has been considerably high because they had made over
YEAR CURRENT ASSETS CURRENT
LIABILITIES
CURRENT RATIO
2012 115612673.56 18528617.22 6.24
2011 141934492.00 35172584.20 4.04
2010 97761075.20 12343214.74 7.92
2009 72335450.22 13758132.09 5.26
2008 72171734.06 21676428.69 3.33

investment in inventories, which is the main reason for the high ratio of current assets. Inventories are high because of seasonal availability of raw material. The overall position of current ratio for Satyam is satisfactory.
The current ratio of dye house has shown a remarkable increment from 3.33 in 2007-08to 5.26 in 2008-09 and then to 7.92 in 2009-10. Initially in 2007-08, the ratio was not satisfactory but it is quite satisfactory for the years after 2011-012and especially for the year 2009-10.
LIQUID RATIO –Quick Ratio = Quick or Liquid Assets
Current Liabilities
Quick Assets = Current Assets – Inventory – Prepaid Expenses
YEAR LIQUID ASSETS CURRENT LIABILITIES
LIQUID RATIO
2012 71845029.56 18528617.22 3.88
2011 74081279.00 35172584.20 2.11
2010 56583851.20 12343124.74 4.58
2009 50693352.22 13758132.09 3.68
2008 45231614.06 21676428.69 2.09

2012 2011 2010 2009 20080
0.5
1
1.5
2
2.5
3
3.5
4
4.5
5
3.88
2.11
4.58
3.68
2.09 LR
Analysis
According to rule of thumb, it should be 1:1. For Satyam, the liquid ratio present a uneven change over the past four years. It was 2.09 in 2007-08 and increased to 4.58 in 2009-10 and then to 2.11 in 2010-11. The decrement in the ratio is not satisfactory, however the ratio 2.11 in 2010-11 is more than the rule of thumb but it should be quite more than the rule of thumb.
.
WORKING CAPITAL TURNOVER RATIO – Working capital turnover ratio indicates the velocity of the utilization of net working capital. This ratio measures the efficiency with which the working capital is being used by a firm.
Working Capital Turnover Ratio = COGS OR Sales
Net Working Capital
YEAR SALES NET WORKING CAPITAL
WCTR
2012 703988634.61 97084056.34 7.25
2011 593474659.66 106761907.80 5.56
2010 503359979.46 85417950.46 5.89
2009 453662278.70 453662278.70 7.74
2008 356117465.20 50495305.37 7.05

2009 2008 2007 2006 20050
1
2
3
4
5
6
7
8
9
7.25
5.56 5.89
7.747.05
WCTR
ANALYSIS
This ratio indicates the number of times the working capital is turned over in the course of a
year. A high working capital ratio indicates the effective utilization of working capital and less
working capital ratio indicates less utilization. For Satyam, the ratio is quite same for the past
five years. It is 7.05 in 2007-08, 7.74 in years 2008-09 and in2009-10 there was a slight change
came over here and the ratio decreased to 5.89. And in the next year in 2010-11 the ratio stand at
5.56 For Satyam, the ratio is increasing once more in the very next year in 2011-12, It shows
increment to 7.24. the ratio of the company is satisfactory.
STOCK TURNOVER RATIO
This ratio tells the story by which stock is converted into sales. A high stock turnover ratio
reveals the liquidity of the inventory i.e., how many times on an average, inventory is turned
over or sold during the year.
STOCK OR INVENTORY TURNOVER RATIO = COGS OR SALES
AVERAGE STOCK
YEAR SALES AVERAGE STOCK
STR or ITR

2012 703988634.61 55810428.5 12.61
2011 593474659.66 23981268.5 24.75
2010 503359979.46 31409661 16.03
2009 453662278.70 24291109 18.68
2008 356117465.20 18964744.11 18.78
2012 2011 2010 2009 20080
5
10
15
20
25
30
12.61
24.75
16.0318.68 18.78
STR
ANALYSIS: -
By analyzing the five-year data it seen, that it is seen that that from the year
2008 to 2009 & 2009 to 2010, it moves on a slow pace means, the ratio is increased in very
nominal figures i.e. (.10) times and (2) times, which has been rectified in the year 2011.
In 2011 there is a huge increase in inventory due to this ratio the company maintains is very high
in 2011 and the company is required to take measures to lower down this ratio as it affects the
working capital cycle of company and the flow of cash in the company. In 2012, company take
measure to lower down its ratio which is good for company because a low stock turnover ratio
reveals undesirable accumulation of obsolete stock.
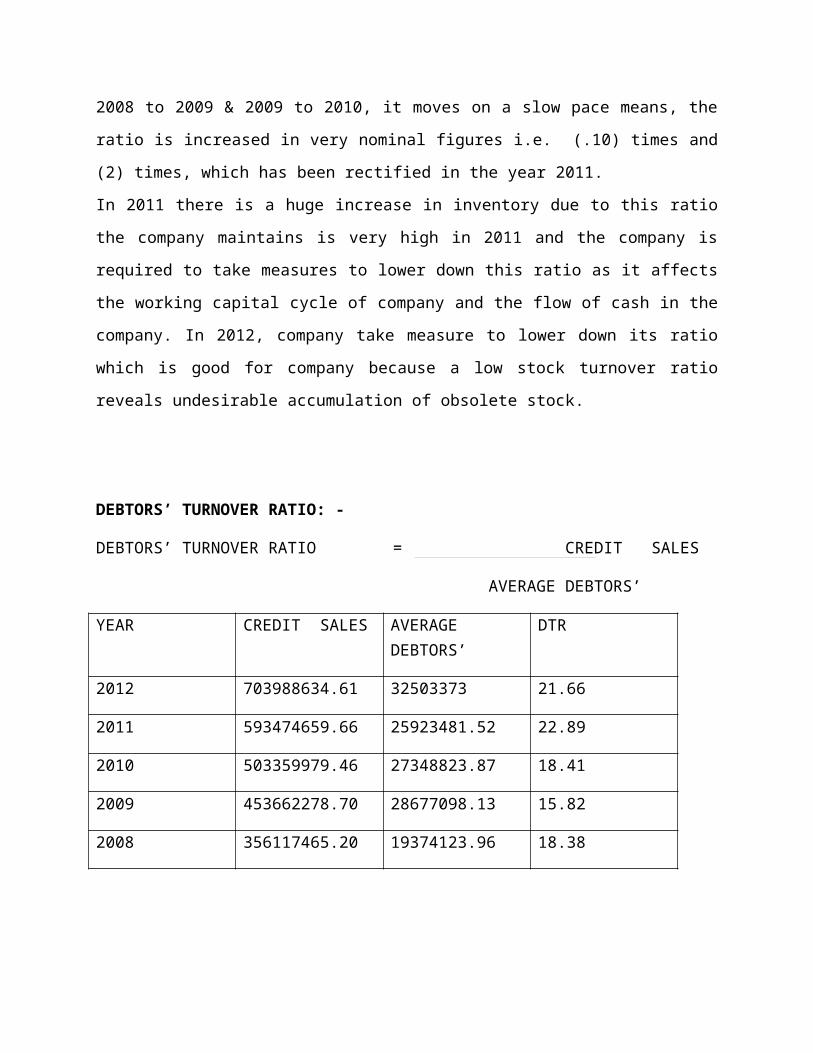
DEBTORS’ TURNOVER RATIO: -

DEBTORS’ TURNOVER RATIO = CREDIT SALES
AVERAGE DEBTORS’
YEAR CREDIT SALES AVERAGE DEBTORS’
DTR
2012 703988634.61 32503373 21.66
2011 593474659.66 25923481.52 22.89
2010 503359979.46 27348823.87 18.41
2009 453662278.70 28677098.13 15.82
2008 356117465.20 19374123.96 18.38
2012 2011 2010 2009 20080
5
10
15
20
2521.66
22.89
18.4115.82
18.38
DTR
ANALYSIS
Generally a low debtor’s turnover ratio implies that it considered congenial for the business as it
implies better cash flow. The ratio indicates the time at which the debts are collected on an
average during the year. Needless to say that a high Debtors Turnover Ratio implies a shorter
collection period which indicates prompt payment made by the customer.
Now by analyzing the five year data it is said that company holds a good position while receivin
its money from its debtors. The ratios are in variation trend, which implies that recovery

position is good and company should maintain these positions.
CREDITORS’ TURNOVER RATIO: -
Actually this ratio reveals the ability of the firm to avail the credit facility from the suppliers
throughout the year. Generally a low creditor’s turnover ratio implies favorable since the firm
enjoys lengthy credit period.
CREDITORS’ TURNOVER RATIO = NET CREDIT PURCHASE
AVERAGE CREDITORS’
YEAR CREDIT PURCHASE
AVERAGE CREDITORS’
CTR
2012 567750535.58 20914713.21 27.15
2011 505412322.46 19426820.02 26.02
2010 421557817.32 10672311.95 39.50
2009 358037616.35 15724391.01 22.77
2008 300672597.42 12906200.48 23.30
ANALYSIS
2012 2011 2010 2009 20080
5
10
15
20
25
30
35
40
45
27.15 26.02
39.5
22.77 23.3
CTR

Actually, this ratio reveals the ability of the firm to avail the credit facility from the suppliers
throughout the year. Generally, a low creditor’s turnover ratio implies favorable since the firm
enjoys lengthy credit period.
Now by analyzing the three years data it is found that in the year 2010 the ratio was very high
which means that its position of creditors that year was not good only in the year 2010, but the
other years creditor’s turnover ratio is in pretty good position.
In the all four years it has followed, a decreasing trend, which is very good, sign for the
company. Therefore, it is said that company enjoys a very good credit facility from the suppliers.
ANALYSIS ON THE BASIS OF SCHEDULE OF CHANGES IN WORKING CAPITAL
PARTICULARS 2008-09 2009-10 INCREASE DECREASE
CURRENT ASSETS:
Inventories 21642098.00 41177224.00 19535126
S. debtors 30359548.69 22158429.16 8201119.53
Cash & Bank Balances
3407307.32 2297697.88 1109609.44
Loans & Advances
16926496.21 32127724.16 15201227.95
Total current assets (A)
72335450.22 97761075.20
CURRENT LIABILITIES:
S. creditors 11585162.05 9759461.84 1825700.21
Provisions 2072970.04 2483662.90 410692.86
Security deposits & Retention money
100000 100000 ----- ------
Total current liabilities (B)
13758132.09 12343124.74
Working capital (A-B)
58577318.13 85417950.46 36562054.16 9721421.83
Net increase in working capital
26840632.33 26840632.33
85417950.46 85417950.46 36562054.16 36562054.16

ANALYSIS ON THE BASIS OF SCHEDULE OF CHANGES IN WORKING CAPITAL
PARTICULARS 2010-11 2011-12 INCREASE DECREASE
CURRENT ASSETS:
Inventories 67853213 43767644 24085569
S. debtors 27508864 37497882 9989018
Cash & Bank Balances
3665403.60 6891449.29 3226045.69
Loans & Advances
42907011.40 27455698.27 15451313.13
Total current assets (A)
141934492.00 115612673.56
CURRENT LIABILITIES:
S. creditors 29094178.20 12735248.22 16358929.98
Advance from customers
2439050 722054 1716996
Provisions 3539356.00 4971315.00 1431959
Security deposits & Retention money
100000.00 100000 ----- -----
Total current liabilities (B)
35172584.20 18528617.22
Working capital (A-B)
106761907.8 97084056.34 31290989.67 40968841.13
Net Decrease in working capital
9677851.46 9677851.46
106761907.8 106761907.8 40968841.13 40968841.13

FOR YEARS 2009 AND 2010:
As a look on the schedule of changes in working capital for the Satyam over the years 2008-09
and 2009-10, it is found that, among current assets, inventories, loans and advances have shown
increment from year 2008-09 to year 2009-10. The sundry debtors and cash & bank balances
have decreased in the same years. Among the current liabilities, the sundry creditors and other
liabilities have decreased and provisions were increased. Therefore, the overall net working
capital has increased.
FOR YEARS 2010-11 AND 2011-12:
Among the current assets, debtors and cash & bank balances have increased and inventories and
loans & advances have shown decrement. The total current assets have increased. Among the
current liabilities, sundry creditors and other liabilities have decreased which made a positive
effect on networking capital and it increases, on the other hand, the provision increased which
not directly but overall made a good effect on company. Therefore, the net working capital has
also increased.

ANALYSIS OF VARIOUS COMPONENTS OF WORKING CAPITAL
INVENTORY ANALYSIS
Inventory is total amount of goods and materials. Inventory means stock of three:-1. Raw materials2. Semi finished goods.3. Finished goods.Position of inventory in Satyam: -
PARTICULARS 2012 2011 2010 2009 2008Raw material 28833211 37297025 29407402 12230900 13921225W.I.P 5912280 9756023 6270176 4901850 4735793Finished goods 9022153 20800165 5499646 4509348 8283102TOTAL 43767644 67853213 41177224 21642098 26940120
2012 2011 2010 2009 20080
10000000
20000000
30000000
40000000
50000000
60000000
70000000
80000000
STOCK
INTERPRETATION:
By analyzing the 5 years data it is seen that the inventories are increased/decreased year by year. .The inventories are grown in2011-12 and 2010-11 respectively from previous year in figures it increases up to19535126 in2010 and inyear2011 it increases to 26675989 in comparison of 2010. . A company uses inventory when they have demand in market and Satyam is having a demand in industry market. That is biggest reason for increase inInventories. From other point of view we can say that the liquidity of firm is blocked ininventories but to stock is very good due to uncertainty of availability of raw material in time.
SUNDRY DEBTORS ANALYSISDebtors or an account receivable is an important component of working capital and fall under

Current assets. Debtors will arise only when credit sales made.Position of Sundry Debtors in Satyam
PARTICULARS 2012 2011 2010 2009 2008DEBTS O/S FOR A PERIOD OF SIX MONTHS
0.00 203547.00 118028.00 85124.00 262290.00
OTHER DEBTS
37497882.00 27305317.00 22040401.16 30274424.69 26732357.57
TOTAL 37497882.00 27508864.00 22158429.16 30359548.69 26994647.57
2012 2011 2010 2009 20080
5000000
10000000
15000000
20000000
25000000
30000000
35000000
40000000
DEBTORS
INTERPRETATIONIn the table and figure, it is seen that there are continuous variations in the debtors of Satyam in
five (5) successive years. A simple logic is that debtors increase only when sales increase and if
sales increases it is good sign for growth. It is seen that in the year 2009-10 the Debtors are at
minimum level. Moreover, in next two years in 2011 & 2012 the debtors are continuously
increasing.
It is a good sign as well as negative also. Company policy of debtors is very
good but a risk of bad debts is always present in high debtors. When sales are increasing with a
great speed the profit also increases. If company decreases the Debtors, they can use the money
in many investment plans. So, this variation is good from the firm prospect
CASH AND BANK BALANCE ANALYSIS
Cash called the liquid asset and vital current assets; it is an important component of
Working capital. In a narrow sense, cash includes notes, bank draft, cheque etc.

Position of Cash and Bank Balance in Satyam: -
PARTICULARS 2012 2011 2010 2009 2008Cash & Bank 6891449.29 3665403.60 2297697.88 3407307.32 6617777.19TOTAL 6891449.29 3665403.60 2297697.88 3407307.32 6617777.19
2012 2011 2010 2009 20080
1000000
2000000
3000000
4000000
5000000
6000000
7000000
8000000
CASH & BANK
INTERPRETATION
If we analyze the above table and chart it is find that it follows an increasing trend. In the year
2008, it had maintained a huge amount of cash and bank balance which has decreases in the year
2009, 2010 and 2011. Although company’s cash position in the year2009, 2010 & 2011 was not
sound so, this is not a very good sign for company. The analysis shows that the fix deposits of
company are rapidly fallen in the year as 42.3% in 08- 09 respectively from year 2008 that is
why company is have minimum balance in 2010 in comparison of all. Through analysis, it shows
that company is utilizing the fixed cash for exploding the Projects that is good for growth.
LOANS AND ADVANCES ANALYSIS
Loans and Advances here refers to any to amount given to different parties, company, employees
For a specific period of time and in return they will be liable to make timely repayment of that
Amount in addition to interest on that loan.
PARTICULARS 2012 2011 2010 2009 2008LOANS & ADVANCES
27455698.27 42907011.40 32127724.16 16926496.21 11619189.30
TOTAL 27455698.27 42907011.40 32127724.16 16926496.21 11619189.30
2012 2011 2010 2009 20080
5000000
10000000
15000000
20000000
25000000
30000000
35000000
40000000
45000000
50000000
LOANS & AD...
INTERPRETATION
If we analyze the table and the chart it is seen that it follows an increasing trend which is a
Good sign for the company. The increase of loans and advances are increases year by year
except the year 2012. In the year 2011 there is more than Rs 4 crore given as loan, due to this a
lot of amount was blocked. But it used for expansion of business.
The increasing pattern shows that company is giving advances for the expansion of plants and
Machinery which is good sign for better production. Although company’s cash is blocked but
This is good that company is doing modernization of plan competitors in market.
CURRENT LIABILITIES ANALYSIS
Current liabilities are any liabilities that are incurred by the firm on a short term basis or current
Liabilities that has to be paid by the firm within one year.
CREDITORS: -
PARTICULARS 2012 2011 2010 2009 2008SUNDRY CREDITORS
12735248.22 29094178.20 9759461.84 11585162.05 19863619.97
TOTAL 12735248.22 29094178.20 9759461.84 11585162.05 19863619.97

2012 2011 2010 2009 20080
5000000
10000000
15000000
20000000
25000000
30000000
CREDITORS
INTERPRETATION
If we analyze the above table then it is seen that it follow an uneven trend in the sundry creditors
and other liabilities. In 2009 it decreased by 75% and in 2010 it further decreased by more
then100%. In 09-10 it was increased because of growth in other liabilities. This is done because
in the year2011 company purchased a bulk of raw material due to market variations. When
company has minimum liabilities it creates a better goodwill in market. High current liabilities
indicate that company is using credit facilities by creditors.
PROVISIONS ANALYSIS
Position of Other Provisions in Satyam
PARTICULARS 2012 2011 2010 2009 2008PROVISIONS 4971315.00 3539356.00 2483662.90 2072970.04 1812808.72TOTAL 4971315.00 3539356.00 2483662.90 2072970.04 1812808.72

2012 2011 2010 2009 20080
1000000
2000000
3000000
4000000
5000000
6000000
PROVISIONS
INTERPRETATION
From the above table it is seen that provision shows a growing trend and the huge amount is
being kept in these provisions. Though the profits of the company are increased, income tax is
also increased. Therefore, there is a great need of maintaining proper provisions, which is good
that company is creating in time. The provisions are increasing as the tax increases. Although
company is paying more income tax that is why because company also earning more. This is
good sign for Company.

FINDINGS
By conducting the study about working capital management, It is found out that working
capital management of SATYAM is good. SATYAM has sufficient funds to meet its
current obligation every time, which is due to sufficient profits and efficient management
of SATYAM.
Company is cash rich but as there are expansion and diversification plans , company is
not utilizing these funds. For meeting the working capital needs and capacity expansion
needs, it has borrowed from banks.
Lack of advertisement can be considered to be a weak point for the Sathe Synthetics.
The amount of stock is increasing per year, which is a good sign, as it would help them in the tough competition coming ahead.
Firm profitability can be increase by shortening accounts receivables and inventory periods.

CONCLUSION
By concluding the study about the working capital it is find that working capital management of Satyam
cottex pvt. ltd. is too good. Satyam cottex pvt ltd. has sufficient funds to meet its current obligation
every time which is due to sufficient profits and efficient management of Satyam.
Cash management and receivable management are too good because of centralized control on these.
Safety measures for inventories are also quiet sufficient in company. Overall the working capital
management of satyam cottex pvt ltd is efficient.
SUGGESTIONS
Management should make the proper use of inventory control techniques like fixation of
minimum, maximum and ordering levels for all the items for less blockage of money.
The company should also adopt proper inventory control like ABC analysis etc. This
inventory system can make the inventory management more result oriented. The EOQ
should also follow in stores.
The company should train its work force properly, which would enable the company to
utilize its resources properly and in the interim help in minimizing wastage, and hence
result in the expansion of its market share.
Due to competition, prices are market driven and for earning more margin company
should give the more concentration on cost reduction by improving its efficiency.
The investments of surplus funds made by the corporate office and the units are not
generally involved while taking decisions with regard to structure of investment of
surplus funds. The corporate office should involve the units to better ascertain the future
requirements of funds and accordingly the investments made in different securities.
The company is losing its overseas customers due to decrease in exports so; the sufficient
amount of exports should the maintained.
Company’s Average debtor collection period of company is 19 days. Therefore, it would
be the one of the positive point for company and company should maintain it for future.

RECOMMENDATIONS
The essence of effective working capital management is proper cash flow forecasting. This should take into account the impact of unforeseen events, market cycles, loss of a prime customer and actions by competitors. So, the effect of unforeseen demands of working capital should be factored by company. This was one of its reasons for the variation of its revised working capital projection from the earlier projection.
It pays to have contingency plans to tide over unexpected events. While market-leaders can manage uncertainty better, even other companies must have risk-management procedures. These must be based on objective and realistic view of the role of working capital.
Addressing the issue of working capital on a corporate-wide basis has certain advantages. Cash generated at one location can well be utilized at another. For this to happen, information access, efficient banking channels, good linkages between production and billing, internal systems to move cash and good treasury practices should be in place.
An innovative approach, combining operational and financial skills and an all-encompassing view of the company’s operations will help in identifying and implementing strategies that generate short-term cash. This can be achieved by having the right set of executives who are responsible for setting targets and performance levels. They could be then held accountable for delivering, encouraged to be enterprising and to act as change agents.
Effective dispute management procedures in relation to customers will go along way in freeing up cash otherwise locked in due to disputes. It will also improve customer service and free up time for legitimate activities like sales, order entry and cash collection. Overall, efficiency will increase due to reduced operating costs.
Working capital management is an important yardstick to measure a company operational and financial efficiency. This aspect must form part of the strategic and operational thinking. Efforts should constantly be made to improve the working capital position. This will yield greater efficiencies and improve customer satisfaction.

BIBLIOGRAPHY
WEBSITES:-
Lazaridis, Ioannis and Tryfonidis, Dimitrios, Relationship between Working Capital Management
and Profitability of Listed Companies in the Athens Stock Exchange. Journal of Financial Management and Analysis, Vol. 19, No. 1, January-June 2006. Available at SSRN: http://ssrn.com/abstract=931591
http://papers.ssrn.com/sol3/papers.cfm? abstract_id=931591&rec=1&srcabs=966188
http://www.emeraldinsight.com/Insight/ViewContentServlet? contentType=Article&S.Sename=/published/emeraldfulltextarticle/pdf/2910030202.pdf
BOOKS AND JOURNALS
Anand, M. 2001. “Working Capital performance of corporate India: An empirical survey”, Management & Accounting Research, Vol. 4(4), pp. 35-65
Berryman, J. 1983. “Small Business Failure and Bankruptcy: A survey of the Literature”, European Small Business Journal, 1(4), pp47-59
Bhattacharya, H. 2001. Working Capital Management: Strategies and Techniques, Prentice Hall, New Delhi.
Grablowsky, B. J. 1976. “Mismanagement of Accounts Receivable by Small Business”, Journal of Small Business, 14, pp.23-28
Grablowsky, B. J. 1984. “Financial Management of Inventory”, Journal of Small Business Management, July, pp. 59-65
Shields, Patricia and Hassan Tajalli. 2006. Intermediate Theory: The Successful Student Scholarship. Journal of Public Affairs Education. Vol. 12, No. 3. Pp. 313-334.

ANNEXURES
BALANCE SHEET AS ATPARTICULARS 2012-11 2010-11 2009-10 2008-09 2007-08SOURCES OF FUNDS
SHARE CAPITAL 19901000.00 19901000.00 19901000.00 19901000.00 19901000.00RESERVE AND SURPLUS
345519604.82 29625127.98 15253853.53 21829192.29 20785949.94
LOAN FUNDSSECURED LOANS 72686105.58 88539002.13 94535519.74 55323395.23 54399581.72DEFERED TAX LIABILITY
3383097.00 3449412.00 3080483.00 662332.00 ---------
UNSECURED LOANS
43486673.00 46947616.00 28872233.00 15703501.00 14408414.70
TOTAL 173976583.65 188462261.36 171643192.52 113419523.77 109495049.61APPLICATION OF FUNDSFIXED ASSETSA: GROSS BLOCK 178453951.93 172240571.18 164888412.68 126570061.76 123370584.96B: less DEPRICIATION
101561424.62 90540217.62 78663170.62 71729938.62 64380715.62
C: NET BLOCK 76892527.31 81700353.56 86225242.06 54840123.14 58989869.34D:CURRENT ASSETSINVENTORY 43767644.00 67853213.00 41177224.00 21642098.00 26940120.00SUNDRY DEBTORS 37497882.00 27508864.00 24338099.04 30359548.69 26994647.57CASH IN HAND & BANK
6891449.29 3665403.60 2297697.88 3407307.32 6617777.19
LOANS AND ADVANCES
27455698.27 42907011.40 32127724.16 16926496.21 11619189.30
E:CURRENT LIABILITIESSUNDRY CREDITORS
12735248.22 29094178.20 9759461.84 11585162.05 19863619.97
ADVANCE FROM CUSTOMERS/DLR’S
822054.00 2539050.00 100000.00 100000.00 --------------
PROVISIONS 4971315.00 3539356.00 2483662.90 2072970.04 1812808.72(D-E)NET CURRENT ASSETS
97084056.34 106761907.80 85417950.46 58577318.13 50495305.37
MISCELLANEOUS EXPENSES
--------- --------- -------- 2082.50 9874.90
TOTAL 173976583.65 188462261.36 171643192.52 113419523.77 10945049.61