Satisfaction. 1984). - ERIC - Education Resources … · · 2013-11-23AUTHOR Palmgreen, Philip;...
28
DOCUMENT RESUME ED 247 575 CS 208 432 AUTHOR Palmgreen, Philip; Rayburn, J. D., II TITLE A Comparison of'Gratification Models of Media Satisfaction. PUB DATE Aug 84 NOTE 29p.; Paper presented at the Annual Meeting of the Association for Education in Journalism and Mass Communication (67th, Gainesville, FL, August 5-8, 1984). PUB TYPE Reports - Research/Technical (143) -- Speeches/Conference Papers (150) EDRS PRICE MF01/PCO2 Plus Postage. DESCRIPTORS Comparative Analysis; Higher Education; Mass Media; *Mass Media Effects; Media Research; *Models; News Reporting; Prediction; *Predictive Validity; *Research Methodology; *Television; Use Studies IDENTIFIERS Media Use; *.Television News; *Uses and Gratifications Research ABSTRACT To enhance knowledge of media consumption processes, a study compared the abilities of six alternative gratification models to predict media satisfaction, specifically, satisfaction with television news. The models were three different formulations of gratifications sought/obtained discrepancies--two emphasizing gratifications obtained and one expectancy-value model. Two of the models also contained evaluation components in an effort to determine \whether inclusion on these components increased the predictive powers of gratification models. Subjects, 178 college students, completed a gratifications sought scale concerning television in general, and a ,gratifications obtained scale concerning each respondent's most frequently watched evening news program. After a two-day period, the subjects completed evaluations of gratifications obtained from television news in general. In addition, the subjects completed a satisfaction scale dealing with television news. Taken as a whole, the findings provided suppoit for a combined ?; expectancy-value/gratifications obtained pproach to explaining and predicting media satisfaction. Direct co arison of several theoretical models was found to be party ularly useful in exploring tile strengths and weaknesses of the different formulations. (FL) *********************************************************************** Reproductions supplied by EDRS are the best that can be made from the original document. **********************************************************************
Transcript of Satisfaction. 1984). - ERIC - Education Resources … · · 2013-11-23AUTHOR Palmgreen, Philip;...

DOCUMENT RESUME
ED 247 575 CS 208 432
AUTHOR Palmgreen, Philip; Rayburn, J. D., IITITLE A Comparison of'Gratification Models of Media
Satisfaction.PUB DATE Aug 84NOTE 29p.; Paper presented at the Annual Meeting of the
Association for Education in Journalism and MassCommunication (67th, Gainesville, FL, August 5-8,1984).
PUB TYPE Reports - Research/Technical (143) --Speeches/Conference Papers (150)
EDRS PRICE MF01/PCO2 Plus Postage.DESCRIPTORS Comparative Analysis; Higher Education; Mass Media;
*Mass Media Effects; Media Research; *Models; NewsReporting; Prediction; *Predictive Validity;*Research Methodology; *Television; Use Studies
IDENTIFIERS Media Use; *.Television News; *Uses and GratificationsResearch
ABSTRACTTo enhance knowledge of media consumption processes,
a study compared the abilities of six alternative gratificationmodels to predict media satisfaction, specifically, satisfaction withtelevision news. The models were three different formulations ofgratifications sought/obtained discrepancies--two emphasizinggratifications obtained and one expectancy-value model. Two of themodels also contained evaluation components in an effort to determine\whether inclusion on these components increased the predictive powersof gratification models. Subjects, 178 college students, completed agratifications sought scale concerning television in general, and a,gratifications obtained scale concerning each respondent's mostfrequently watched evening news program. After a two-day period, thesubjects completed evaluations of gratifications obtained fromtelevision news in general. In addition, the subjects completed asatisfaction scale dealing with television news. Taken as a whole,the findings provided suppoit for a combined
?;
expectancy-value/gratifications obtained pproach to explaining andpredicting media satisfaction. Direct co arison of severaltheoretical models was found to be party ularly useful in exploringtile strengths and weaknesses of the different formulations. (FL)
***********************************************************************Reproductions supplied by EDRS are the best that can be made
from the original document.**********************************************************************
.
$ 4
A COMPARISON OF GRATIFICATION MODELS
OF MEDIA SATISFACTION
U.S. DEPARTMENT OF EDUCATIONNATIONAL INSTITUTE OF EDUCATION
EDUCATIONAL RESOURCES INFORMATION
)1(
CENTER (ERIC)
This document has been reproduced asreceived from the person or organizationOriginating it.
r i Minor changes have been made to improvereproduction quality.
Points of view or opinions stated in this Ow-ment do not necessarily represent official NIE)position or policy.
Philip PalmgreenDepartment of Communication
Univereity of Kentucky
Lexington, KY
J.D. Rayburn IIDepartment of Communication
University of Miami,Coral Gables, FL
"PERMISSION TO REPRODUCE THISMATERIAL HAS BEEN GRANTED BY
Philip Palmgreen
J. D. Rayburn II
TO THE EDUCATIONAL RESOURCESINFORMATION CENTER (ERIC)."
(S.
Par submitted for presentation to the Association for Education in
en Journalism and Mass Communication, Theory and Methodology Division,
"4- G&inesville, Florida, August, 1984.
,
V) , \ 2
461
1
A COMPARISON OF GRATIFICATION MODELS OF MEDIA SATISFACTJ.ON
An examination of the recent uses and gratifications literature reveals
-
that an increasing number of studies are concerned with the specification.47
0
and testing of hypotheses about the interrelationships among gratifications
sought and obtained, media behavior, and the antecedentptand consequences
of both media behavior and gratifications (e.g., Wenner, 1982; Rubin, 19811
Rubin and Rubin, 1982; Palmgreen and Rayburn, 1979, 1982; Palmgreen, et al.,
1980, 1981; McLeod and Becker, 1974; Blood and Galloway, 1983; Levy and
4Windahl, 1983; Windahl et..a1.1 1983; Rayburn and Palmgreen, 1983). Ihile
much conceptual,'integrative, and methodological work remains to b done,
the uses and gratifications tradition seems to be embarking unon an era of
vigorous theoretical growth. Indications of this growth include a number
of attempts at developing and testing models of gratifications sought and
obtained (Palmgreen and Raybdrn, 1979; Palmgreen, et al., 1980, 1981,414;
McLeod, et al., 1982; Rayburn et al., forthcoming; Wenner, 1982; Levy and
'Windahl, 1985), and still mire recent work on expectancy-value approaches1
to uses and gratifications phenomena (Galloway and Meek, 1981; Van Leuven,,,,
1981; Palmgreen and Rayburn, 1982; Rayburn and Palmgreen, 1983; Blood and
Galloway, 1983).
Frew studies, however, have attempted an empirical comparison of
alternative gratification-models. Among the exceptions, McLeod, et al.
(1982) sought to compare drive-reduction and exposure-learning models of
gratifications sought and received from debate viewing. Wenner (1983) has
contrasted the ability of transactional and discrepancy models of gratifi-
cations to predict exposure to and dependency on network evening news
3
U
2 6
programs and 60 Minutes. As Wenner points out, one of the more important
theoretical issues faced by uses and eatificaiions 'researchers concerns
the question of Model specification. As he observes, "there has been ."
no clear articulation ofwhat the modeling alternatives are and no systematic
A
testing of these alternatives" (p.2). Wenner's on results are an indication
of the considerable benefits to be derived from such testing.
The present study endeavors in similar fashion to enhance knoWledge
of media consumption processes by comparing the abilities of six- alterna-
tive gratification models to predict media satisfaction (in this case,
satisfaction with televisicn news). the
formulations' of GS-GO discrepancies, two
obtained, and an expectancy77alue model.
six models include three different
models which emphasize gratifications
Twollof the five gratificationLmodels
also contain evaluation componentt in an effort to determine whether inclusion
of the evaluation components increases the predictive powers of gratificationv.
models.
Om!
4.
Media Satisfaction
A variable which has been largely overlooked in mass media research is
satisfaction with the media experience. While fairly frequent referenCe to
media satisfaction is made in the uses and gratifications literature, there
t. have been few attempts at operationalization. At best, satisfaction has been
equated with gratifications obtained, a theoretically ambiguous and unappealing
solution.1
This is somewhat puzZYing given the popularity and utility of the
satisfaction\concept in other social science areas. Satisfaction is a key
concept in areas such as organizational psychology (job satisfaction),
organizational /communication (communication satisfaction), and social
4

indicator research (life satisfaction). SatisfaotiOn is also an important
concept in marketing, wher4agreat deal of work has been done in recenta
yeari on conceptualizing and'ireasuPing he satisfaction variable, particularly
consumer satisfaction.
Oliver (1981) offers an excellent Qyerview of marketing researchers'
attempts to define consumer satisfaction. Satisfaction has been defined
variously as "need fulfillment, pleasure/displeasure, exi6e4ation-performance
interactions, evaluation of the purchase /consumption experience, evaluation
of the benefits of consumption, comparison of actual with ideal outcomes,
and the attribute 'deficit/surplus' 'obtained from the purchaser (Oliver,
1981,'p.27). According to Oliver, current marketing perspectives view
satisfaction'as a complex emotional response following experience with a
product, fahich is distinct from attitude: "attitude is the consumer's
relatively enduring affective orientation for a product, store, or process'
(e.g., customer service), while satisfaction is the emotional reaction
f011owing a disconfirmation experience which acts on the base attitude,
level and is consumption- specific'.' (1981,p.40). Moreover,-Oliver (1980)
has shown that satisfaction is an antecedent to attitude change, and is
an important correlate of behavioral intention to purchase and other
marketing variables.
Since the outputs of mass,. media systems are often viewed as "products"
subject to "consumption" by audience members, the potential applicability
of marketing Conceptualizations of satisfaction to mass communication
research is obvious. .We might expect satisfaction with a newspaper,
television program or series, or magazine to be determined at least partially
Co
a,
14
11
ei
P
by the gratifications perceived te obtained from these media products.
The discrepancy between gratifications sough and obt6.ined may also be
,
related to media satisfaction; perhaps more strongly thanGO alone.
Satisfaction may also turn out to be an important' correlate of media
dependency, exposure, and various
research canvas which at present
media consequences. This is a broad
is largely empty. The present study
attempts to sketch in certain essential features by testing six alternative
gratification/expectancy-value models of media satisfaction.
c.
A Gratifications Obtained Model
cp
As we-have noted, media satisfaction has often been equated by uses4
and gratifications researeilers withigratifications obtained. The gratifi-
'tations derived from media experience are extremely diversg.c.however, as1, .
indicated by their relatively complex dimensional structure (PS.lmgreen,
et al., 1981; Levy, 1978; Katz, et al., 1973) and it hardly seems sensible
to subsume such concepts.as information, entertainment, parasocial interaction,
and interpersonal utility under the single heading "media satisfaction."
A more reasonable, approach is to uosit that such gratifications _influence
satisfac'tiOn levels; i.e., the extent to which a person actually obtains
sought gratifications from media consumption should contribute to a person's
satisfaction with that experience. Thus satisfaction may be viewed as a
function of the sum of gratifications obtained, as expressed in the following
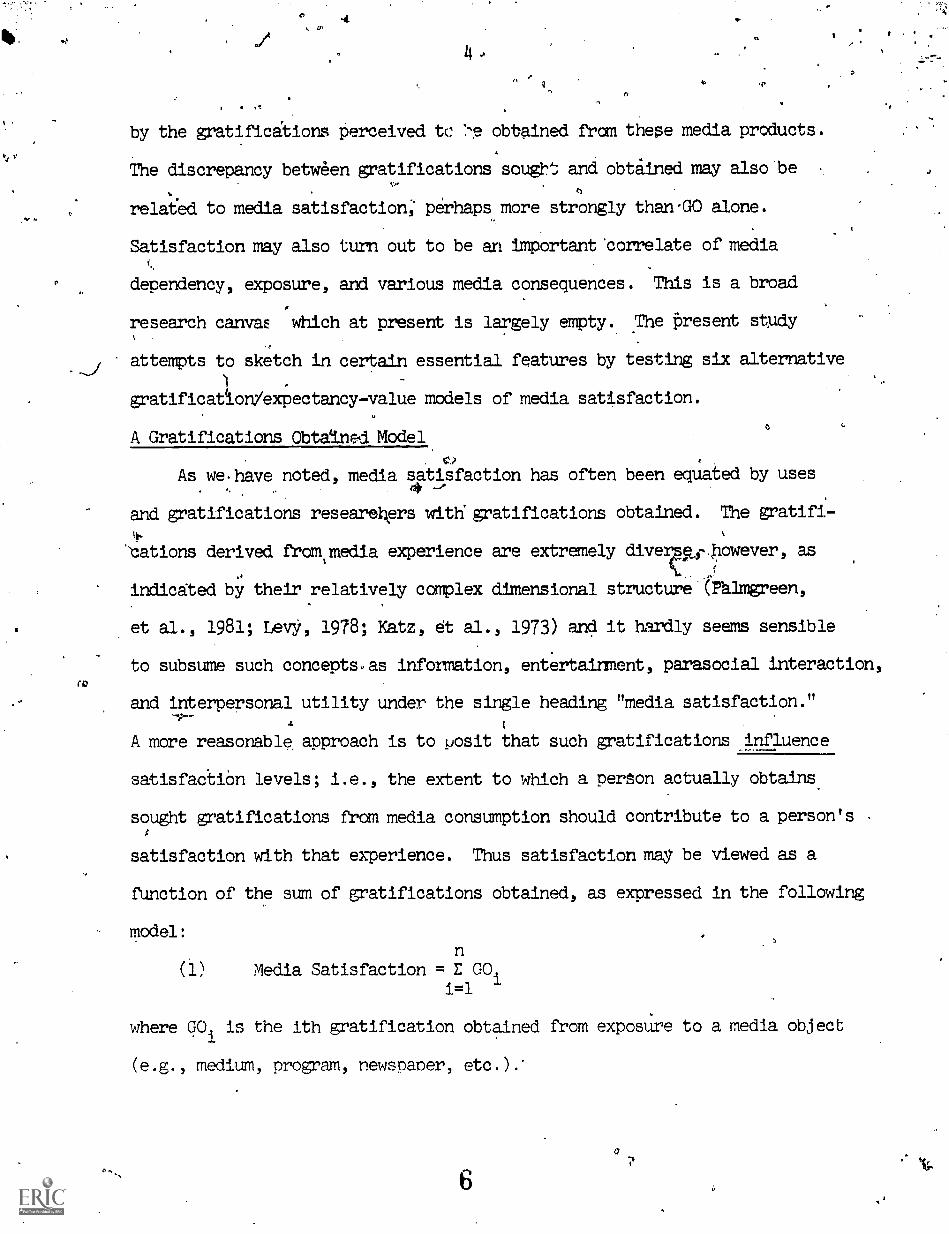
model:n
(1) Media Satisfaction = E GOii=1
where qoi is the ith gratification obtained from exposure to a media object
(e.g., medium, program, newspaper, etc.).*
Min
a
O.
5
A Modified Gratifications Obtained Model
'Model 1 assumes that all %ratifications are equally valued by the'
audience member. This is clearly not the case, as work by Palmgreen and
Rayburn (1982) and Blood and Galloway (1983) has demonstrated. Fran an
expectancy - value perspective we woulq, hypothesize that obtaining a positively
valued gratification, or not obtaining a negatively valued gratification,
0
should lead to satisfaction, while obtaining a negatively valued gratification,,,
or not obtaining a positiv,p gratification should contribute to dissatisfaction.
Thus, including the respondent's affective evaluation of gratifications
obtained in a model should increase that model'sability to predict media
satisfaction, as expre'Ssed below:n
(2) Media Satisfaction = Ee 001=1
where GOi is the same as in Model 1 and ei is the respondent's affective
evaluation of the ith gratification%
An Expectancy-Value-Model
Although expectations (beliefs) about postEively or negatively'evaluated
attributes possessed by a media object are not direct measures of gratifications
actually obtained from media consumption, these beliefs are related to such
gratifications (Rayburn and Palmgreen, 1983), and thus might be expected to be
related to satisfaction, More precisely, beliefs about the gratification
attributes possessed by a media object, when considered in conjunction with
affective evaluations of those attributes, should be associated with satisfaction
7
with that object. This is expresded in the following model:
P
(3) Media-Satisfaction = Eb4e4i=1""
n
cS
where biis the perceived probability (belief) that media object X possesses
a particular attribute, and ei is the affectiveevalUatidn of the attrbute.
This will be recognized as the Fishbein and Ajzen (1975) model which predicts.
attitude. Although we have argued, along marketing theory lines, that
attitude and satisfaction are different concepts, they are nonetheless
related. It is, therefore,, not surprising that the two concepts might-.
share certain antecedents. In addition, Palmgreen and Rayburn (1982)
report that the biei index predicts GS. If it is also found to predict
media satisfaction, then the expectancy-value approach will have received
additional construct validation from a uses and gratifications perspective.
An Absolute Value Discrepancy Modela
None of the preceding models takes into account the extent to which
a paiticular. gratification obtained is actually sought by an audience member.
8
:Park
a
.
4.9r
It may bethat th44.1evel of GS serves as a baseline against which GO levels.
tare compared. i'almgreen and Rayburn (1979) adopted.this approach
ing a OS-GO discrepancy model toprddidt exposure to public' television. In ,
ab
4'
3
.1%
this'model exposure was-hypothesized to be a function of the aveisge,absolute
cliscrepancy between the gratifications the audience member is seeking and
the extent to which he perceives he is obtainin those gratifications. The.
authors state .that "The absolute value. of the discrepqncy is' used because
it is assumed that negative and positive discrepancies cagy equal weight
in determining exposure" (p.159). This assumption is based on Helson's.
(1964) adaptation level theory which posits that once a baseline sate
of homeostasis. is established, exceedingly aversive or pleasant stimuli
will be opposed by the central nervous-system.v
I
c
Such a discrepancy approach is also consistent with marketing conceptuali- .
zations of consumer satisfaction, Marketing researchers " generally agree
that satisfaction results from a subjective comparison o the expected and
received product attribute levels" (Oliver, 1981 p.26). This'suggests the
following model based upon adaptation-level theory principles:,
(4) Media Satisfaction = EICS -GO Ii
1=1
Model 4 predicts a negative correlatiOn with satisfaction, in that the
greater the absolute discrepancy between GS.and GO, the lower the satisfaction
level should be.
A Simplified Discrepancy Model
Wenner. (1983) has questioned Palmgreenand Rayburn's (1979) logic "that
a given level of relative satisfaction (e.g., where GO exceeds GS) is equiva-
lent to a comparable level-of relative deprivation (e.g., where GS exceeds GO)"
,.
a
et,
1
Li
8I. 4
a
0
4 ')' '8
Os
. . .
(Wenner, 1983, p.7)., 'He contends that a distinction should be nide& between .
/
positive (GO > GS) and negative .(GO <X13) discr:epancies, and advocates....
.
simplified discrepancy model which elimihates the absolute value sign. ,This4 .
simplified model was found by Wenner to predict media dependency, even after
controls for a number, of other variables. We might also expect such a model
to predict media satisfaction, as-Wenner (1983) himself notes: "Positive
(greatei than zero) scores would indicate levels of relative satisfaction
(or over-obtention) and 'a negative discrepancy score would indicate relative.I
deprivation (or under-satisfaction or obtention)" (p.11).. "Such a simplified
model 1:s presented below:
n(5) Media Satisfaction = E (G04-GS.,)
J. -L. itA1=1
In this model, GSi is subtracted.fi.am GOi so that GO < GS Ascreehneies
will be ,given negative sign.
An Expectancy-Value Discrepancy Model
While we are inclined bo agree with the basic lOgic behind Wenner's
simplified discrepancy model, 'a serious,drhwback of the model is that it
does riot take, into account the respondentls affeCtil're evaluation of particular
gratifica"ns or gratification-related attributes4 We would not expect
over-obtention of ,a negatively evaluated attribute to produce satisraction,
nor should under-obtention of such an attrute induce dissatitfaction. The
$implified model should work reasonably well when all or most gratifications
measured are positively evaluated (as is often the case in gratifications
research), but should not be'predictive of satisfaction or related variables
when a number of negatively evaluated attributes are included. An alternative
0
C. 0
t..
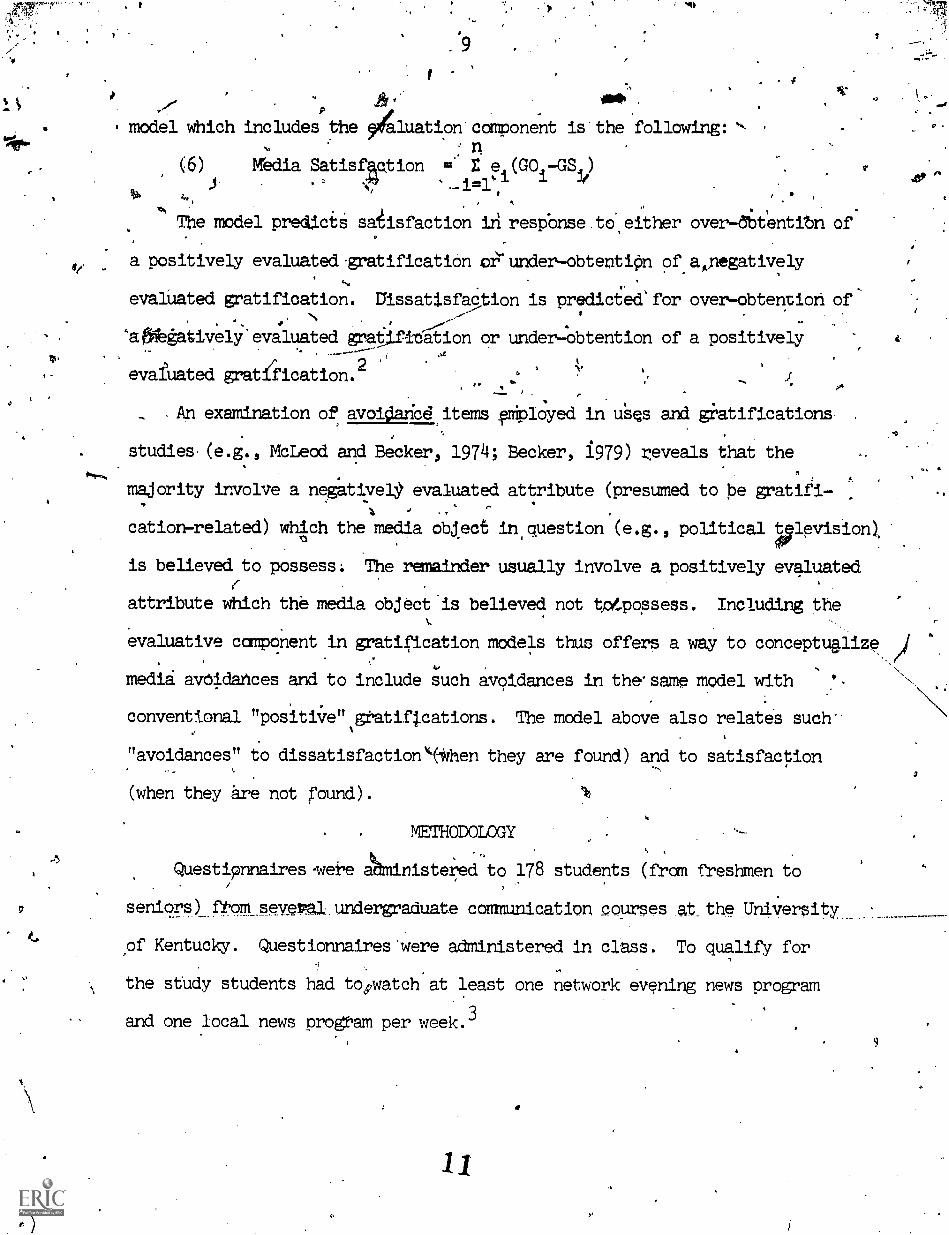
model which includes the Aluation ccuponent is the following:
;
(6) Media Satisfaction E e4(G04-GS1)J
ta, ,
The model predic6 saisfaction iri respOnse to either over-obtlention of
a positively evaluated-gratification ciirunder-obtentiOn of adlegatively
evaluated gratification. Dtssatisfastion is predicted'for overu.obtention of. N
.
`afifegativelysevaluated gratifidation or under-obtention of a positively,
2 ' vevaluated gratification. .
An examination of avoidaricditems Oployed in uses and gratifications
studies.(e.g., McLeod and Becker, 1974; Becker, 1979) reveals that the
majority involve a negatively evaluated attribute (presumed to be gratifi-
cation - related) which the media object in, question (e.g., political plevision).,3
is believed to possess, The remainder usually involve a positively evaluated
attribute which the media object is believed not totpopsess. Including the
evaluative camponent in gratification models thus offers a way to conceptualize /
media avoidances and to include such avoidances in the same model with ",
conventional "positive"%
grati4cations. The model above also relates such-
"avoidances" to dissatisfaction'4(4hen they are found) and to satisfaction
(when they are not round).
METHODOLOGYI
Questipnnaires we're Aministeredto 178 students (from freshmen to
seniors).from several.undergraduate communication courses .at_ the UnVerP.#5'...
of Kentucky. Questionnaires'were administered in cuss. To qualify for
the study students had to,watch at least one network evening news program
and one local news pro !'am per week.3
9

-
a'A,.
s
ip
Measurementv.
GliatificationsZought
Fourteen eiatifiCations sought' it4s from a previous study oftelevision
nevus, .s' describedgin. Palmgreen et al. '(1980),were employed here. Respondents
were asked to estimate on a ,seven-point scale (from "definitely applies' to
"definitely does not apple) ho'w much each gratification statement applied
, . ,
to then (e.g., "I watch TV news' to keep up with current. issues arid events ").. .
Respondents were instructed that television in general (both national network
and local) was the'focus,of tie studyforthe'GS items and the.items dealing
with bel&ef and evaluatidn.47.1
Gratifications Obtained
After measuring gratificatio*sought, gratifications obtained for a
0
respondent's,most,watc'
respondent to reply to
hed evening news program were measured by asking the
gratifications sought.
a reworded statement corresponding tooeach of the
For example, if a respondent reported CBS as his
most - watched' program, he was askeFi to respond to "CBS news helps me to keep
up with current issues and eents'," etc. Again, a seven -point scale was used.,
After a forty-eight hour period, respondents were asked to evaluate
gratifidations--obtained from television news in general. , Here they responded
(on a seven-point scale) to itemgsuch as, uTV news programs help
me to keep up with current issues and events." The two day period was
instituted in order to Minimize' any "learning" that might.have taken place
by asking gratifications obtained items for most-watched programs followedLI
immediately by GO items for television news in general.5 Results eported
in Rayburn and Palmgreen, (1983) indicate that GO from TV news in general
12

and GO-fram the respondent's most-watched evening news program are separate
(though related) concepts. The results also suggest that GS and GO may be
measured at the same level of abstraCtion and empirically separated in
cross-sectional designs.
.Belief aiid Evaluation
° Prior to Measunimg GS and GO,belief and evaluation ratings were
elicited for the say 14 qhiracteristics of television news which were
the focus of the GS and GO items.
For evaluation (e1) respondents were asked to rate each characteristic
on a seven-point scale (ranging from "very bad" to "very good") "according
to whether you feel that feature is a good or bad feature for television
C
news pro to ha.v." For example the characteristic associated with
the sample GS item above was "provide& inforMation about current issues /
and events."
Belief (b )emeasures were obtained by asking respondents to'rate "the
...gxtent to which you feel TV news actually oossesseweach of the previous
characteristics." Seven-point scales were again employed ranging from
"very definitely not" to "very definitely."
Before proceeding we should note an important distinction between
the concepts of "belief" (expectancy) and "gratification obtained." The
concept of belief.as used here refers to the subjective prObability that
a media object possesses a particular attribute in the general sense; i.e.,
as A defining characteristic of an object. By comparison, a gratification
obtained in the abstract sense is not a belief at all, but is some outcome
.(cognitiveaffective or, behavioral) of media behavior. Nonetheless, a
13
A
.12
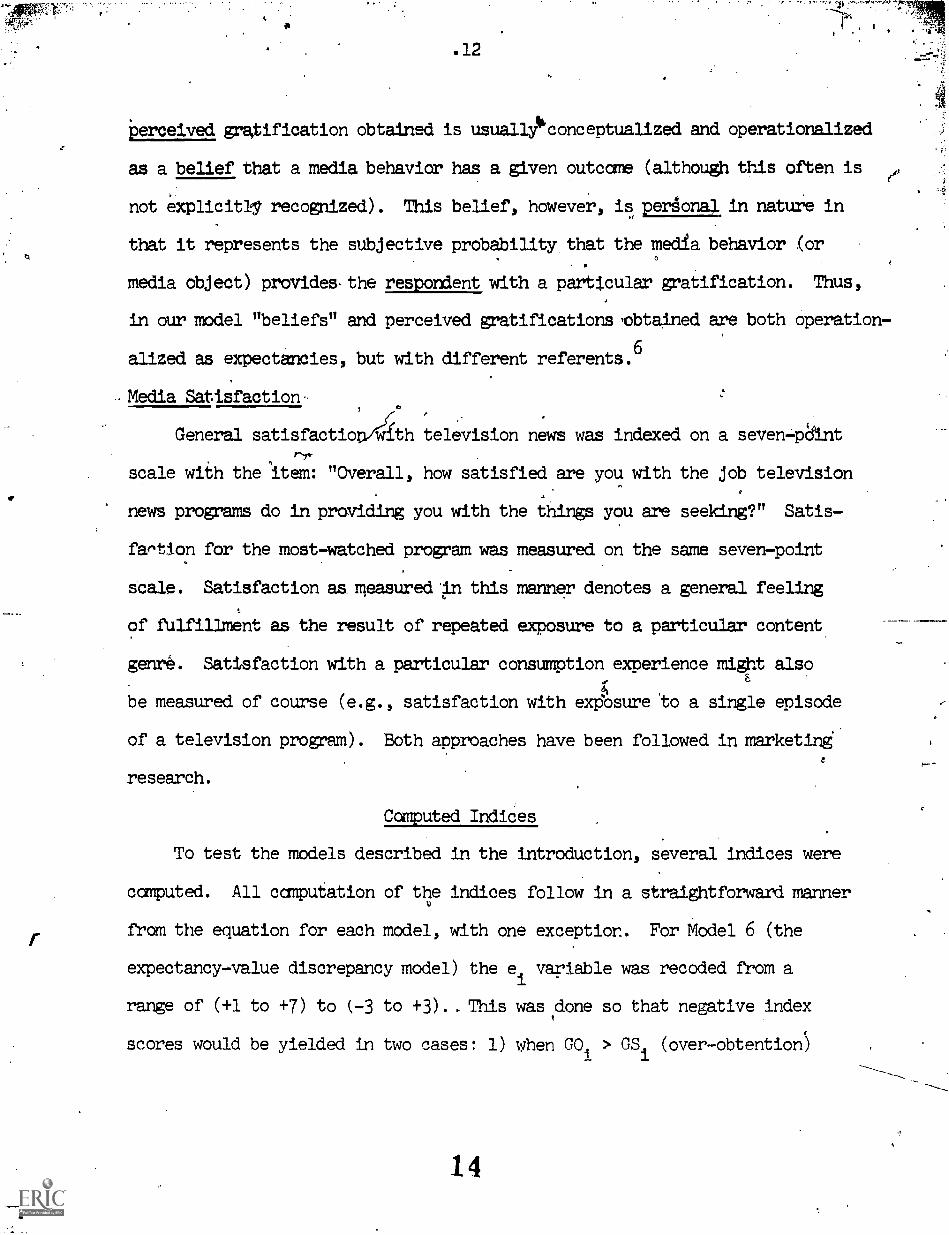
perceived gratification obtained is usuall,Noncebtualized and operationalized
as a belief that a media behavior has a given outcome (although this often is (0
not explicitly recognized). This belief, however, is pergonal in nature in
that it represents the subjective probability that the media behavior .(or
media object) provides the respondent with a particular gratification. Thus,
in our model "beliefs" and perceived gratifications ,obtained are both operation-
alized as expectancies, but with different referents.6
Media Satisfaction
6General satisfaction/lath television news was indexed on a seven - point
rscale with the 'item: "Overall, how satisfied are you with the job television
news programs do in providing you with the things you are seeking?" Satis-
fae,tion for the most watched program was measured on the same seven-point
scale. Satisfaction as measured in this manner denotes a general feeling
of fulfillment as the result of repeated exposure to a particular content.
genre. Satisfaction with a particular consumption experience might alsoF.
be measured of course (e.g., satisfaction with exposure to a single episode
of a television program). Both approaches have been followed in marketing.e
research.
Computed Indices
To test the models described in the introduction, several indices were
computed. All computation of the indices follow in a straightforward manner
from the equation for each model, with one exception. For Model 6 (the
expectancy-value discrepancy model) the ei variable was recoded from a
range of (+1 to +7) to (-3 to +3). This was done so that negative index
scores would be yielded in two cases: 1) when GOi
> GSi
(over-obtention)
14
13
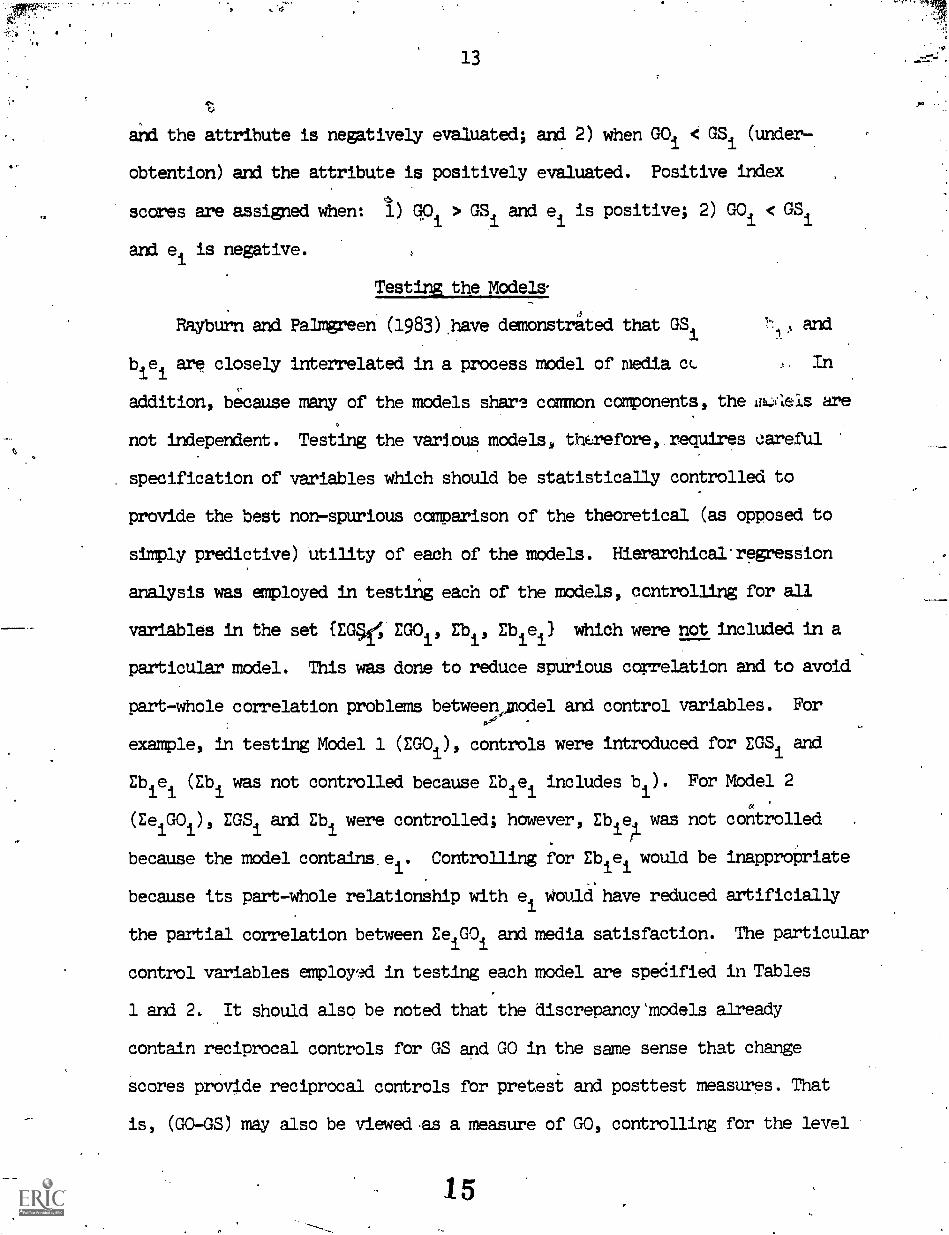
aid the attribute is negatively evaluated; and 2) when GO1 < GSi (under-
obtention) and the attribute is positively evaluated. Positive index
scores are assigned when: 1) goi > GSi and ei is positive; 2) GOi < GSi
and ei is negative.
Testing the Models-
Rayburn and Palmgreen (1983).have demonstr&ted that GSi
biei are closely interrelated in a process model of media cc
, and
addition, because many of the models share common components, the ith_fleis are
not independent. Testing the various models, therefore, requires careful
. specification of variables which should be statistically controlled to
provide the best nor - spurious comparison of the theoretical (as opposed to
simply predictive) utility of each of the models. Hierarchicarregression
analysis was employed in testing each of the models, ccntrolling for all
variables in the set {EGy, EGOi, Ebi, Ebiei} which were not included in a
particular model. This was done to reduce spurious correlation and to avoid
part-whole correlation problems betweervolodel and control variables. For
example, in testing Model 1 (EGOi), controls were introduced for EGSi and
Ebiei
(Ebiwas not controlled because Ebiei includes b ). For Model 2
(EeiGO
i), EGS
iand Eb were controlled; however, Ebie1 was not controlled
because the model contains.eis
Controlling for Ebieiwould be inappropriate
because tts part-whole relationship with ei Mould have reduced artificially
the partial correlation between Ee COi
and media satisfaction. The particular
control variables employed in testing each model are spedified in Tables
1 and 2. It should also be noted that the discrepancy'models already
contain reciprocal controls for GS and GO in the same sense that change
scores provide reciprocal controls for pretest and posttest measures. That
is, (GO-GS) may also be vieweds a measure of GO, controlling for the level
15
114
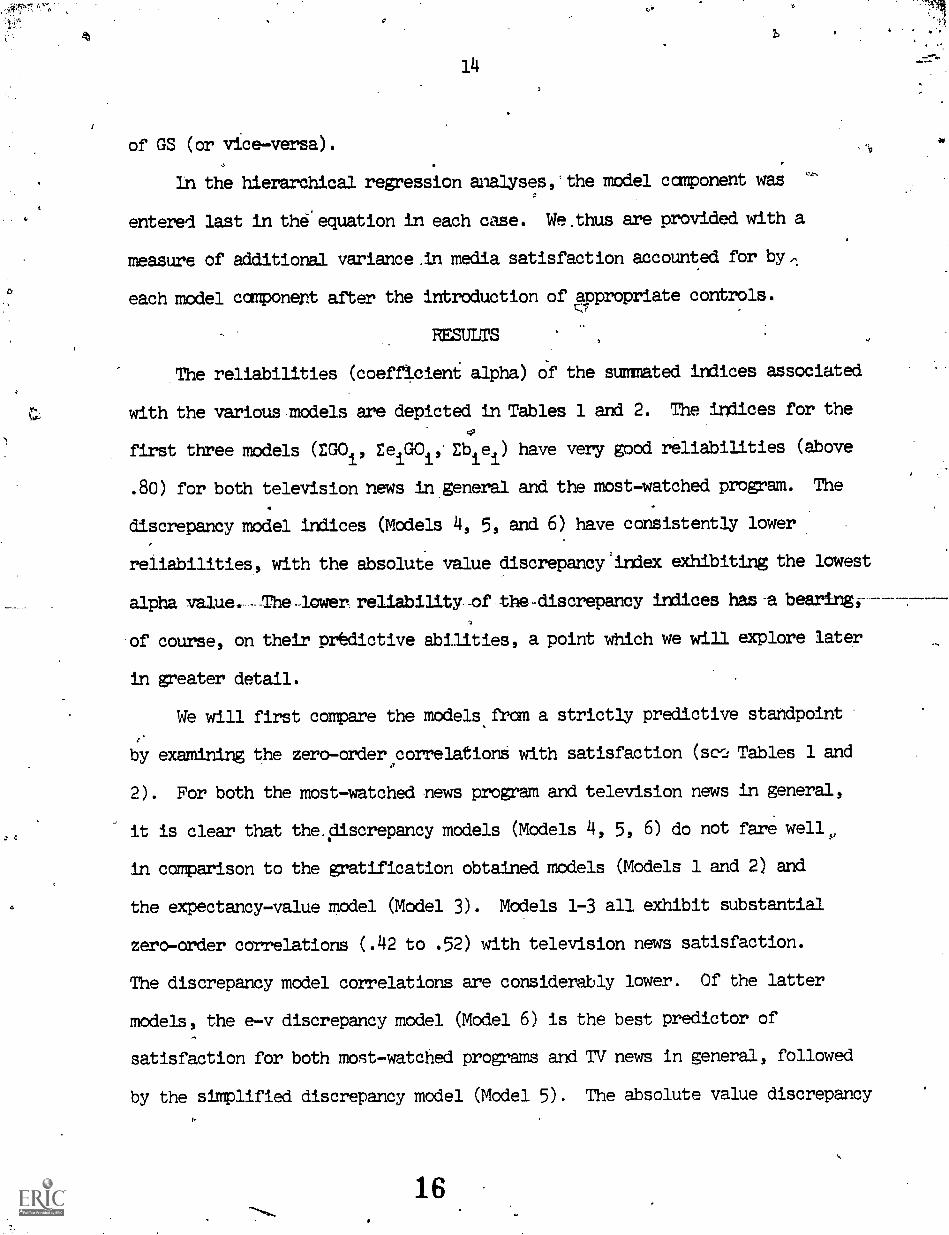
of GS (or vice-versa).
In the hierarchical regression analyses, the model component was "
entered last in the'equation in each case. We.thus are provided with a
measure of additional variance .in media satisfaction accounted for by
each model camponept after the introduction of appropriate controls.
RESULTS
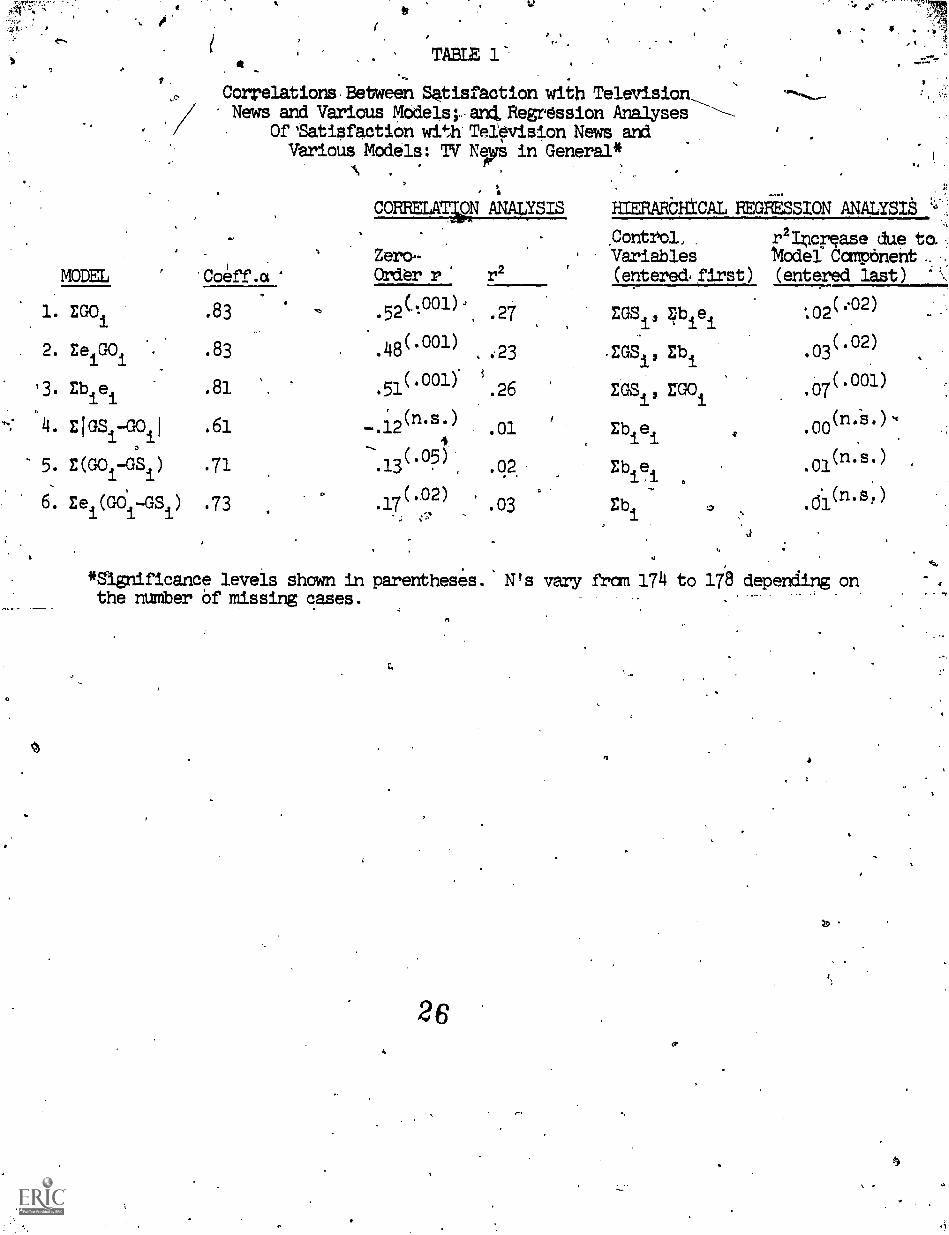
The reliabilities (coefficient alpha) Of the summated indices associated
with the various models are depicted in Tables 1 and 2. The indices for the
first three models (EGOi, Ee GO Eb e ) have very good reliabilities (above
.80) for both television news in general and the most-watched program. The
discrepancy model indices (Models 4, 5, and 6) have consistently lower
reliabilities, with the absolute value discrepancy'index exhibiting the lowest
alpha value, ---The-lower, reliability-of the-discrepancy indices has -a bearingi
of course, on their prbdictive abilities, a point which we will explore later
in greater detail.
We will first compare the models from a strictly predictive standpoint
by examining the zero-ordercorrelations with satisfaction (se:.- Tables 1 and
2). For both the most - watched news program and television news in general,
it is clear that the.cLtscrepancy models (Models 4, 5, 6) do not fare well
in comparison to the gratification obtained models (Models 1 and 2) and
the expectancy-value model (Model 3). Models 1-3 all exhibit substantial
zero-order correlations (.42 to .52) with television news satisfaction.
The discrepancy model correlations are considerably lower. Of the latter
models, the e-v discrepancy model (Model 6) is the best predictor of
satisfaction for both most-watched programs and TV news in general, followed
by the simplified discrepancy model (Model 5). The absolute value discrepancy
f
16
Y,v
15
model (Model 4) exhibits the predicted negative zero-order correlation
in both cases, but these correlations are not statistically significant.
The more important theoretical perspective requires examining the
hierarchical regression analyses. With one exception (Model 3 for the
most-watched program), the gratification obtained and expectancy-value
models. are superior to the discrepancy Models.. In fact, for TV news in
general the increase in r2 due to the addition of the model component to
the equation is non-significant for all three discrepancy models;' while
Models 1-3 all exhibit significant increments (rable.1). For TV news in
general, the expectancy-value model (Ebiei) is clearly the best model-,
accounting for an additional 7 percent of the variance (p <.001).
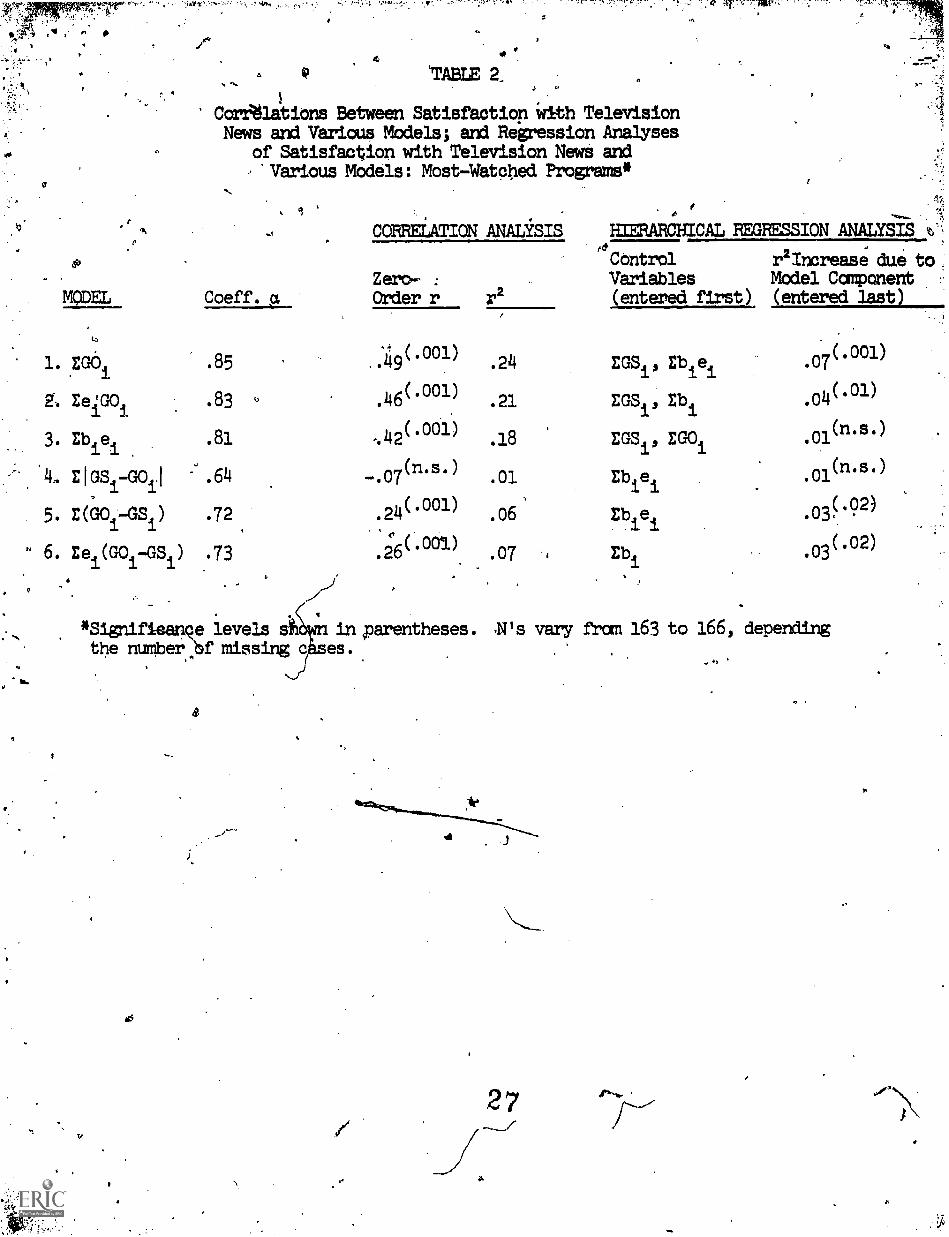
For the most-watched grogram (Table 2), the best predictor is the
EGOimodel. Here-the-simplified7discrepancvand-expectancy-value discre-
pancy mod6ls (Models 5
while the contribution
non-significant.
A
1
6r1U 6) do account for significant
of the absolute value discrepancy
additional variance,
model is gain
Level of Abstraction
Level of abstraction seems to have had a significant influence on
)e findingsof.the hierarchical analyses. Oneexa..,lo of this influence
is Provided by the marked contrast in the oredictive abilities of the
expectancy-vallie model (Ebiei) for TV news in general and for the most-
watched nrogram. Por TV news in general, belief (b ), evaluation (e )
and TV news satisfaction were all measured with respect to the same
referent i.e., television news in reneral. th most-witched
on the other hand, television news ,atisraction is indexod with rosbect
17

16
to this program, while bi and ei are measured with respect to television
news in general. This may account for the fact that,the additional r2
contribution of the Ebieimodel is non-significant for the moat- watched
program.(where the measurement abstractiOn levels do not match),. while
the same Model ranks first in predicting satisfaction with TV news in
general (where the abstraction levels are consistent).
Level of abstraction may also help explain why Models 5 and 6'make
significant contributions to variance in satisfaction with most-watched
program, but do not account for significant variance\increments for
satisfaction with TV news in general. In the latter case the
control variables in the equations, '(Ebiei for Model 5; Ebi for Model 6)
are, measured at the same abstraction level as the satisfaction variable,
thus removing proportionally greater amounts of variance than in the
case of the most-watched program where satisfaction and the control
variables are measured with respect to different referents. If bi and
eihad also been measured with resi!ect to the most-watched program and
such measures ffrployed in the hierarchical analysis for the most-watched
program, it is possible that the additional variance contributions of
Models 5 and 6 would not have been siEnificant. The rAlts, then, would
have been consistent with those in ,Table 1 for television news in general.
DISCUSSION
One puzzling aspect of these findings is that introducing, the
respondent's affective evaluation of gratification-related attributes
did not result in the consistent superiority of Model 2 (Ee.(10.) and
Model 6 (Eei(00.-GS
i) over their non-evaluative counterparts (Models 3
18
17
add 5, respectively). The findings here$..however, may be an artifact,
of the restricted range of.the evaluation measures. In this study, as
in most uses and gratifications studies, themajority of gratificationC.
items were evaluated positively. Only one item ("Television news is often
dramatic") was evaluated below the neutral point on the 7-point scale.
This may have resulted in an underestimate of the predictiye utility of
the evaluative formulations. Research is needed which includes a greater
range of negative versus positive gratifications before any firm conclusions
may be drawn.
A further issue involves the apparent weakness of the discrepancy
'formulations. The failure of the absolute value model in'particular
supports Wenner's criticism that the model's inability to differentiate
between over - obtaining and under- obtaining of gratifications mitigates its
usefulness. The results her suggest that the absolute value model should
not be employed in future research.
A method ogical reason for the low predictive-power of the discrepancy
models as a group is that discrepancy measures in general are prone to
reliability problems similar to those which plague change score measures.
(Cohen and Cohen, 1975; Cronbachand.FUrby, 1970;,Hoge and McCarthy, 1983).
This is confirmed in'this study by the reliability coefficients reported
in Table 1 and Table 2.
As an alternative to diScrepancy models, Wenner (1982, 1983). has
argued for a "transactional" approach in which measures involving GS
and GO are entered separately in hierarchical regression models.

18
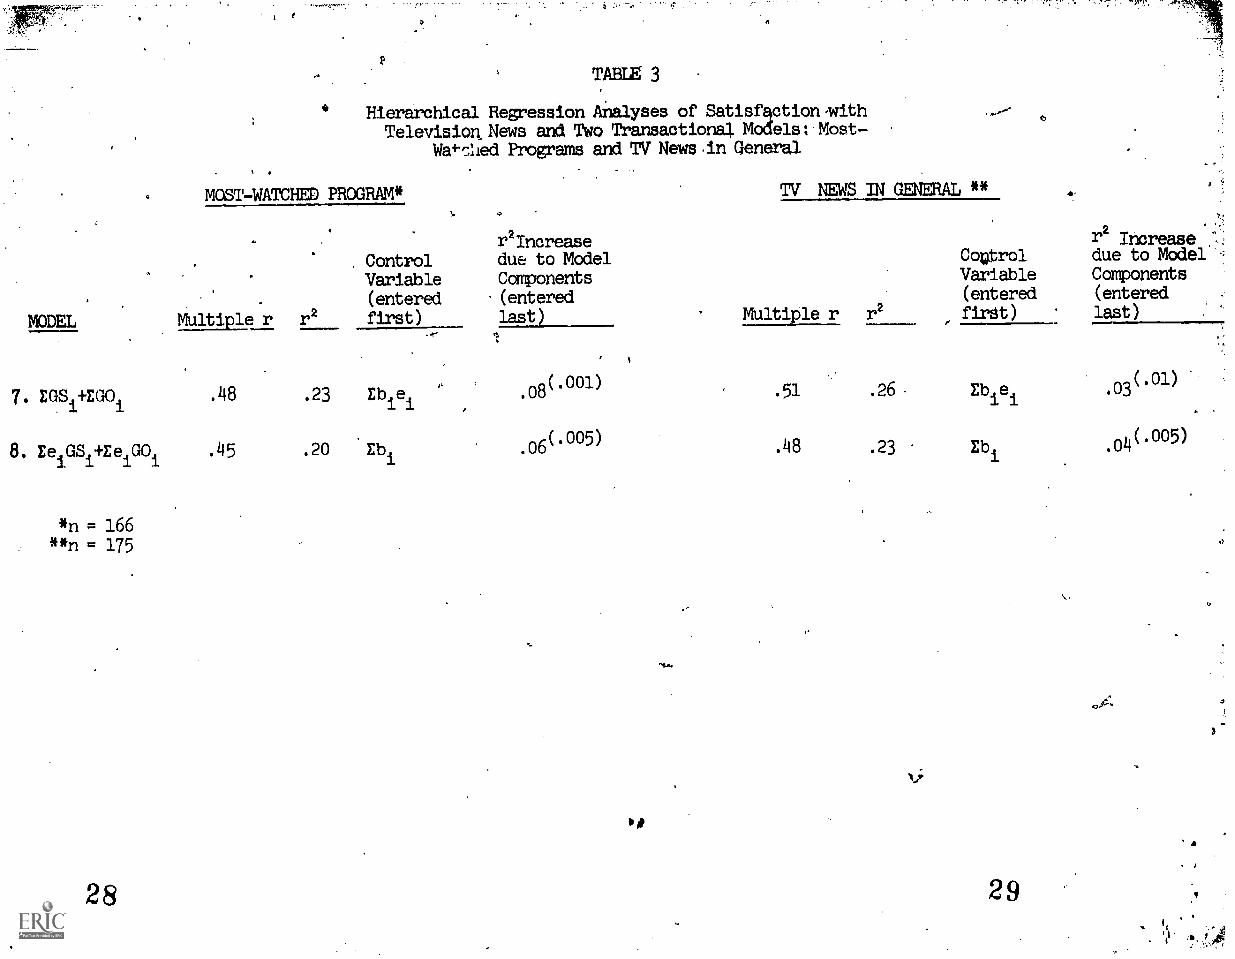
Ex post facto therefore, we tested transactional versions of Models 5
and 6. The transactional version of Model 5 is Model 7: M.S. = EGSi +
EGO1'
The transactional version of Model 6 is Model 8: M.S. = te GSi
+
Ee1GO1. The results are presented in Table 3._ It is clear in both the.
correlational and hierarchical regression analyses (again, with appropriate
controls) that the transactional models are superior to their discrepancy
counterparts.
lt further interesting comparison involves comparing Model 7 (EGSi +
EGOi) with Model 1 (EG0p, and Model 8 (EeiGSi + EeiG0i) with Model 2
(EeiG0i) (see Tables 1 and 2). The inclusion of GS components in Models
7 and 8 results in a slight increase in predictive power for both TV news
in general and for the most-watched program in all four comparisons,
although the'small increments involved perhaps,do not justify the increased
model coMplexity. It.is evident, in fact,' that gratificationS obtained are
much more strongly related to media satisfaction than are gratifications
sought, a theoretically plausible outcome. Parsimony would seem to favpr,
tLrefore, the gratification obtained models (Models 1 and 2) and, in one
canal the expectancy -value model (Model 3), as the theoretically superior
alternatives among the eight models tested.
CONCLUSION
Taken as a whole, the findings here provide support for a combined
expectancy-value/gratifications obtained approach to explaining and
predicting media satisfaction. Direct comparison of several theoretical
models was found to be particularly useful in exploring the strengths and
weaknesses of the different formulations. D'uture studies might well
20

19
investigate the relationships among expectancy-value/gratification models,
media satisfaction, media dependency, and consequences of media consumption.a'
These studies should also test the geneislizability of the findings
Of this study. Although the college students studied here were not found
to differ appreciably fran the generbl population with respect to the
gratifications sought and obtained from television news, the models presented
here should be tested with more heterogeneous samples and with other audience
subgroupingse7 Other media and content typed should also receive attention,
hopefully within the framework of investigations which allow direct across-
media or across-content comparisons.

.1
FOOTNOTES
.Carlson's (1960) study of "psychological satisfaction" and interest
in news exemplifies the gratifications obtained approach.. Burgoonand Burgoon (1979) developed predictive models of "satisfaction" withthe newspaper. Their four -item satisfaction index is ambiguous,
however. One item seems to tap gratifications obtained, while the:other. three seem to be indicants of general attitude.,
2. The expectancy-value discrepancy model is very similar in many'respects to Oliver's (1981) model of consumer satisfaction. Thismodel matches consumer expectations with actual occurrences.Positive disconfArmation (leading to satisfaction) occurs wheneither low probability (unexpected) desirable events occur or highprobability (expected) undesirable events do not occult,. Dissatis-
faction, on the other hand, occurs when low- probability undesirableevents occur, or high probability desirable eitents do notoccur.
Respondehts were asked: "On an average Monday to Friday 5-daydweekabout how many times do you watch ?" Respondents were askedto give separate estimates of frequency of viewing of ABC World NewsTonight, NBC Nightly News, CBS Evening News, and local televisionnews.
4. Three UNE stations_inthe_area_provIded local-news and all three--network evening news programs. Cable television (with CNN) wasnot available at the time of the study. ".
5. A separate study-explored the test-retest reliabilities of thesingle-item GS and GO indides employed here. Eighty studentsin two comminication classes were asked to complete the GS andGO items at the beginning of a regularly scheduled class period.The instructor then presented a 35-40 minute lecture, at whichtime the students again were asked to respond to the gratifjoationscales. Students were not told to expect the second adminntrationof the scales,.and the intervening lectureacted,`a.s considerablerecall interference. The mean test-retest correlation was .65for the GS items, .70 for the GO measures. These are means forsingle-item indices. The reliability of summated indices can beexpected to be higher (as was the case in this study--see Tables1 and 2).
6. Gratifications obtained and beliefs also may be separated empirically,even when the two concepts are measured at the same level of abstraction.In this study, the correlations between each G04(TIZ news in general)and its corresponding b4 ranged from .39 to .641 with a mean of .53.When gratifications sought were controlled, the mean correlation..(partiall> was reduced to .39., While this indicates an expectedmoderate relationship, it does not indicate isamorphigm.
22

Footnotes (continued)
7. number of reasons akto,the tentative conclusiOn that thecollege students in this study do not differ greatly fran thegeneral population with regard to the gratificatibils sought and
'-,obtainedfram television news, and the relationship between these-
, and related variables.. When the GS and. GO means.in this study A
were compared with the means for the correstonding items in thePaingreen, et al. (1980) study which involved a randcm.samPlefrom the general population, the means didAlot differ apprebiablyin absolute value. Moreover, the rank order of GS item means forthe students was quite similar to the rank orderinA found for themore heterogeneous sample '(Spearman's/rho = .79), indicating similarmotivational hierarchies. Similar results were found for the GO4stem means (Spearman's rho = .82). Finally, the correlations '
observed between GS and GO in this study were very similar inmagnitude to the cotrelatiotis observed in studies employing mitreheterogeneous samples (Palmgreen, et al., 1980; Wenner, 1962).
O
ti
23
4
REFERENCES5
Becker, L.B. 1(1979) "Measurement of gratifications." CommunicatiomResearch.6: 54-73. PIP
Blood, R.W: and GalloWay (1983) "Expectancy-Value measures of audienceuses and-gratifications for media content." Presented to the Inter-national Communication AsiOpiation, Dallas, Texas,:
Burgoon, M. and J.K. Burgoon (1979) "Predictive models of wtisfaction withthe newspaper," in D. N1n (ed.) Communication Yearbook 3. New
. I Brunswick, N.J.: Transaction Books.2
Carrson.E.11. (1960) "Psychological satisfAtion and interest in news,"JotIrnalism Quarterly 37: 5A7-551.
Cohen, J. and.P. Cohen (1975) Applied Multiple Regression/CorrelationAnalysis for the Behavioral Sciences. 'New York: John. Wiley and
%.1
Sons.
CronbAch, L.J. and L. Furby (1970) "How should we measshould we?" Psychological Bulletin-74: 68-80.
Fishbein, M. and I. Ajzen (1975) Belief, Attitude,Reading, MA: Addison-Wesley.
Galloway, J.J. and F.L. Meek (1981) "Audience usesexpectancy model." Communication Research 8: 43
I
ntion, and Behavior.
gratifications: an450./ .
Helson, H.t(1964) Adaptation-Level Theory. New York: and Row.
Hoge, D.R. and J.D. McCarthy (1983) ".Issues of validity ar reliability in
Katz,:
Journal of Personality and Social Psychology 44: 1048-1055:
,usGeuroefvirtecahl,:a:nclidi::::::177:70tnolth:a::fe:for important things." American Sociological RevieW, 38: 164-181.
Levi,'M.R. (1978) "The' audience experience with television news."Journalism Monographs, 55.
Levy, M. and S. Windahl (1983) "Audience activity, gratifications andeffects." Presented to the International Communication Association,Dallas, Texas.
McLeod, J.M., C.R. Bybee, and J.A. Durall (1982) "Evaluating media performanceby.gratifications sought and received." Journalism Quarterly 59:3-12:59.
.and L.B. Becker (1974) "Testing the validity of gratification measuresthrough political effects analysis", in J.G. Blumler arjd E. Katz (eds.)The Uses of Mass Communications: Current Perspectives on Gratifications
Y:
Research. Beverly Hills, CA: Sage.
24

Oliver, R.L. (1981) "Measurement and evaluation of satisfaction processesin retail settings.." journal of Retailing 57:25-48.
(1980) "A cognitive model of the antecedents and consequences ofsatisfaction decisions." Journal of Marketing Research 17: 460-469.
Palmgreen, P. ind J.D. Rayburn (1982) "Gratifications sought and mediaexposure: an expectancy value model." Cammunilation Research 9:561-580.
o
Palmgreen, P. and J.D. Rayburn (1979) "Uses and gratifications and exposureto public television: a discrepancy approach." Communication Research6: 155-180.
Palmgreen, P., L.A. Wenner, and J.D. Rayburn (1981) "Gratification0
discrepancies and ,news program choice." Communication Research8: 451-478.
(1980) YRelations between gratifications sought and obtained: a studyof television news." Communication Research 7: 161-192.
Rayburn, J.D. P. Palmgreen, andr. Acker, (forthcoming) "Media gratifi-cations and choosing a morning news program;" Journalism Quarterly.
Rayburn, J.D., and-Palmgreen, P. (1983) "Uses and gratifications andexpectahoy-value theory: merging two traditions:'--Presented to theBroadcast Education Association, Las Vegas, Nevada.
Rubin, A.M. (1981) "An examination of television viewing motivations."Ctmunication Research 8: 141-165.
and R.B. Rubin (1982) "Older persons' TV viewing patterns and motiva-tions." Communication Research'9: 287-313.
Van Leuven, J, (1981) "Expectancy theory in media and message selection."Communication Research 8: 425-434.
Wenner, L.A. (1983) "Gratificationsand theoretical development."Association, Dallas, Texas.
(1982) "Gratifications sought and obtained in program dependency: astudy of network evening news programs and 60 minutes." CommunicationResearch 9: 539-560.
sought and obtained: model specificationPresented to the International Communication
Windahl, S., E. Hedinsson, I. Heterback, and E. Nord (1983) "Perceiveddeprivation and alternative activities during a television strike."Presented to the Jnternational Communication Association, Dallas,Texas.
25
C
1,44
,-,A '
MODEL
1. E GOi
2. Ee iG0i
'3. Eb e
4. EIGS4-G041
5. E(G0i-GSi)
6. Eei(G0i-GSi)
1
TABLE 1es
Correlations Between Satisfaction with Television___News and Various Models;,an4 Regression Analyses '--
Of'Satisfaction with Television News andVarious Models: TV Nip in General*
.
Coeff .a
. 83
. 83
. 81
.61
. 71
. 73
7
1
CORRELATp ANALYSIS
Zero-Order r
52(- .001)
.
.48(.001)
.51(.001)
(n.s.-.12
).01
13(.05)
. . ,
.17(02)
r2
.23
.
.26
.03
4.41.44.0.,
HIERARCHICAL REGRESSION ANALYSIS
Control, r2Alcr.q.ase due to.
Variables Model Component..(entered. first) (entered last)
:02(e02)EGSis Ebiei
EGS Eb
EGS EGOi
Ebie
Eb e
Eb
.03(.02)
.07(.001)
.00(n.S.)s=
.01(n.s.)
.0i(n.s,)
*gnificance levels shown in parentheses. N's vary from 174 to 178 depending onthe number Of missing cases.
t7
26
z,
VrrATRWart,".t t
r
at,
MODE
1. EGO
Ee GO1
3. Ebiei
D.
`TABLE
Contlations Between Satisfaction with TelevisionNews aril Variou.s Models; and Regression Analyses
of Satisfaction with Television News and'Various Models: Most-Watched Programs*
4.1
Coeff. a
.85
.83
.81
4. EIGSi-GOil .64
5. E( G01 -0 ) .72
. 6. Ee (GOi-GS ) .73
*Signifieance levels
CORRELATION ANALYSIS
Zero- :
Order r
.:49(.001)
.46(.001)
-.42(.001)
07(n.s.)
.24(.001)
.6(.001)
,,,,,,, -1:
HIERARCHICAL REGRESSION ANALYSISrtf
r2
ControlVariables(entered first)
r2Increase due to.Model Component(entered last)
.24
.21
.18
.01
.06
.07
EGS Eb e
EGS Ebi
EGS1, EGOi
Ebie
Eb ei
Ebi
.07(.001)
.04(.01)
.01(n.s.)
.01(n.s.)
(.03.
.02)
.03(.02)
in parentheses. 4's vary from 163 to 166, dependingthe numberje missing c es.
6
MODEL
TABU 3
Hierarchical Regression Analyses of Satisf4ctionvithTelevision News and Two Transactional Models; Most-
Weslied Programs and TV News-in General
MCBT-WATCHED PROGRAM* TV NEWS IN GENERAL **
r2lncrease T2 Increase
. Control due to Model CoQtrol due to Model
Variable Components Variable Components
(entered (entered (entered (entered
Multiple r r2 first) last) Multiple r r2 fr8t) last)
.48, .08(.001)
.51 .26 Eb ei
.03('01)7. EGS +Ea°i
.23 Ebie
8. EeiGS
i+Ee GO
i.45 .20 Eb .06(*005) .48 .23 Eb
i.04(*005)
*n = 166**n = 175
if
)
28 29