
Satellite Oceanography: Sea-Surface Temperature and ...
75
Satellite Oceanography: Sea-Surface Temperature and Climate Data Records Peter J Minnett Rosenstiel School of Marine and Atmospheric Science, University of Miami, USA
Transcript of Satellite Oceanography: Sea-Surface Temperature and ...

Satellite Oceanography: Sea-Surface Temperature and
Climate Data Records
Peter J Minnett Rosenstiel School of Marine and
Atmospheric Science, University of Miami, USA

Satellite Oceanography
Passive remote sensing – measuring emitted or reflected electromagnetic radiation.
(Active remote sensing – using artificial illumination radars & lidars)
Three lectures: – Infrared – Visible – Microwave
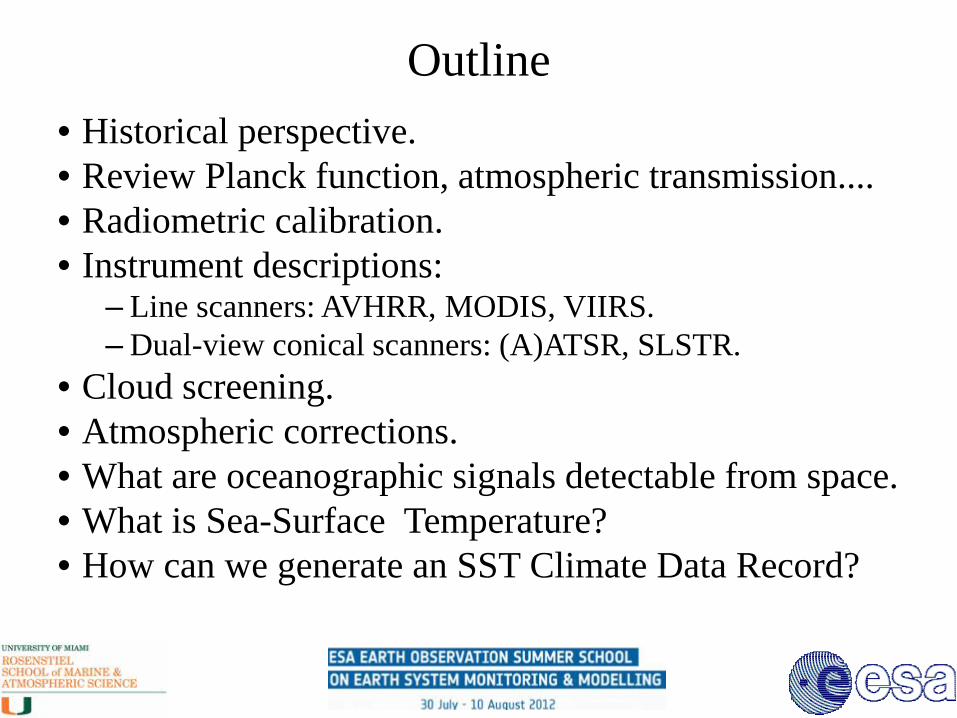
Outline • Historical perspective. • Review Planck function, atmospheric transmission.... • Radiometric calibration. • Instrument descriptions:
– Line scanners: AVHRR, MODIS, VIIRS. – Dual-view conical scanners: (A)ATSR, SLSTR.
• Cloud screening. • Atmospheric corrections. • What are oceanographic signals detectable from space. • What is Sea-Surface Temperature? • How can we generate an SST Climate Data Record?

Early knowledge of SST variability
Franklin-Folger map is at the US Library of Congress
In 1770, Benjamin Franklin and Timothy
Folger published a chart of North
Atlantic Currents, which included a
depiction of the Gulf Stream. In addition to
the surface flow it was realized there were temperature
gradients associated with the Gulf Stream.

SST Variability in IR images
The Gulf Stream is seen as darker water extending to northeast from Cape Hatteras. Very High Resolution Radiometer (VHRR) on the NOAA-3 Satellite, April 28,1974.
(http://www.photolib.noaa.gov/htmls/spac0301.htm)
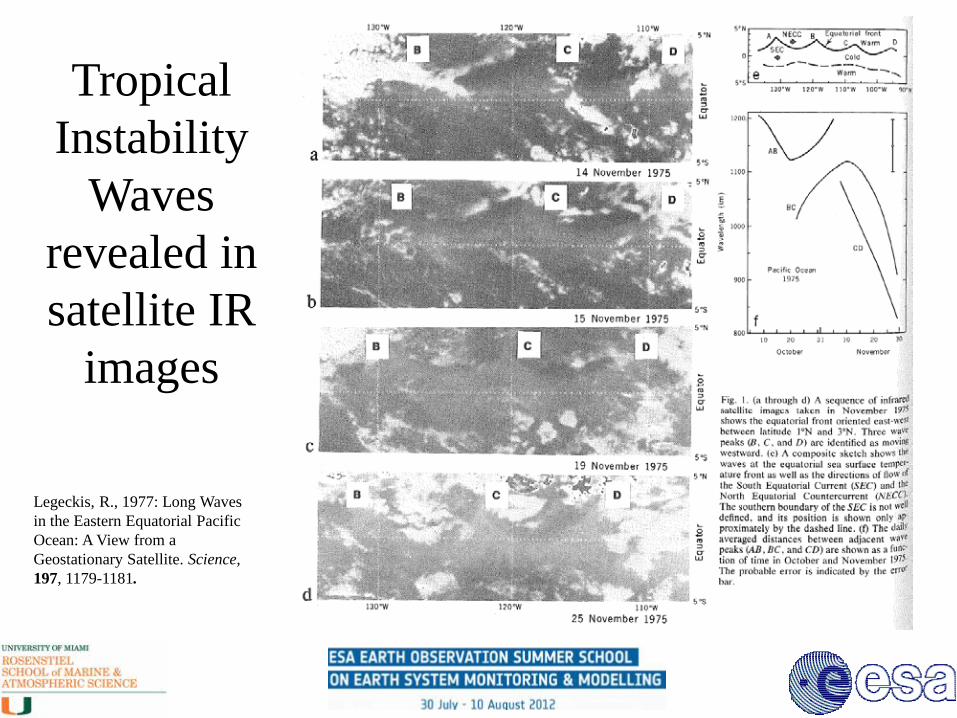
Tropical Instability
Waves revealed in satellite IR
images
Legeckis, R., 1977: Long Waves in the Eastern Equatorial Pacific Ocean: A View from a Geostationary Satellite. Science, 197, 1179-1181.
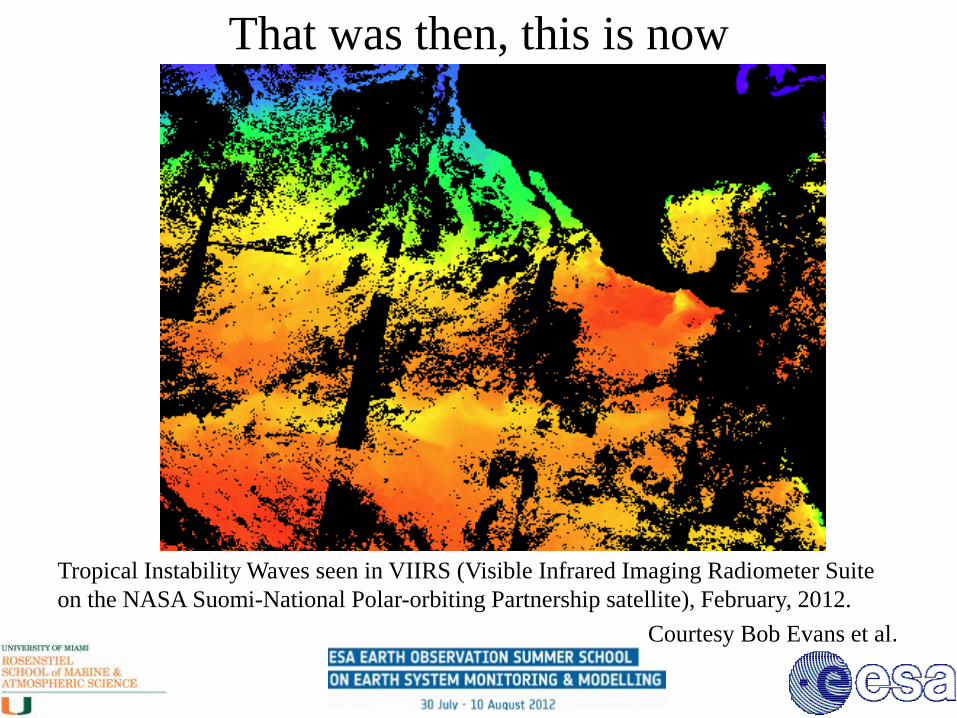
That was then, this is now
Tropical Instability Waves seen in VIIRS (Visible Infrared Imaging Radiometer Suite on the NASA Suomi-National Polar-orbiting Partnership satellite), February, 2012.
Courtesy Bob Evans et al.

Initial SST fields from VIIRS on NPP
Courtesy Bob Evans et al.
Global 4km VIIRS SST (3.7, 11, 12 µm; night-time) for February 4-6, 2012. Processed at the native 0.75km resolution and a 4km output pixel generated as the
average of the 'best' quality retrievals within the 4km cell. SSTs computed using the pre-launch coefficients derived at NGST.

Planck Function

What can happen to a beam of radiation as it passes through the atmosphere ?
There are four processes that can alter the radiation as it passes through an elemental slab of the atmosphere:
– Radiation from the beam can be absorbed by the atmosphere
– Radiation can be scattered out of the beam into other directions
– Radiation can be emitted by the atmosphere – Radiation can scattered into the beam from other directions
Leads to the Radiative Transfer Equation
Applications of infrared radiometry • Infrared radiometry is used to measure
temperature – in oceanography this is of the sea surface (SST) – in meteorology temperature profiles through the
atmosphere can be derived (also humidity profiles, and trace gas concentrations)
– for land studies land surface temperature (LST) and some information about land cover
• Measurements have to be well-calibrated, using on-board black-body targets.

Infrared radiometers • Channels are selected where atmosphere is relatively transparent,
for surface temperatures, and where there are spectral gradients in transmissivity for sounding.
• Reflected and scattered solar radiation is not important in thermal infrared window (10 - 12mm) but leads to contamination in the mid-ir window (3.5 - 4mm). Thermal measurements available night and day, mid-ir only during the night or when there is confidence in lack of sun-glitter or scattering contamination.
• Scattering may be of importance Rayleigh is not significant Aerosols may be a problem
• Clouds (scattering and emission) Þ discard data • Even in atmospheric windows, atmospheric effects (absorption and
emission) are very important for quantitative remote sensing. Water vapor is the main concern - very variable in time and space
• In-flight calibration is tractable, using one or two on-board black-body calibration targets.

Atmospheric transmissivity in the infrared
Spectral dependence of the atmospheric transmission for wavelengths of electro-magnetic radiation from about 1 to 14 µm, for three characteristic atmospheres (above), and (below) the black-body emission for temperatures of 0, 10, 20 and 30oC, and the relative spectral response functions of the bands MODIS (Flight Model 1) on Aqua used to derive SST.

Satellite infrared radiometers for SST
AVHRR Broad swath (>3000km), ~1km2 resolution, operational, 1 blackbody + space view for in-flight calibration, 10-bit digitization, 3 ir SST channels.
MODIS Broad swath (~2330km), ~1km2 resolution, 1 bb + space view for in-flight calibration, 12-bit digitization, 5 ir SST channels
VIIRS Broad swath (>3000km), ~0.75kmxkm resolution, pixel aggregation to try to compensate for pixel growth away from nadir, operational, 1bb + space view for in-flight calibration, 12-bit digitization, 4 ir SST channels
(A)ATSR Narrow swath (~500km), ~1km2 resolution, “experimental”, 2bb for in-flight calibration, 12-bit digitization, 3 ir SST channels, with two views.
SLSTR Narrow swath (1675 km (near-nadir view), 750km (backward view)), ~1km2 resolution, 2bb for in-flight calibration, 12-bit digitization, 3 ir SST channels, with two views.

Calibration of infrared radiometers • In-flight measurements every mirror scan of:
– A black body at a known temperature & view of cold space – Or of two on-board black bodies
• These give a two point calibration for converting the digital outputs of the detectors to calibrated channel radiances.
• Integrals of radiance across each channel’s relative spectral response functions to convert calibrated channel radiances to brightness temperatures.

NOAA-nn Polar Orbiters
AVHRR Advanced Very High Resolution Radiometer

NOAA-N* (broken)

AVHRR- Advanced Very High Resolution Radiometer

Path length effects and scan patterns
From: Minnett, P. J., 2001. Satellite Remote Sensing of Sea Surface Temperature, in "Encyclopedia of Ocean Sciences" Edited by J. Steele, S. Thorpe and K. Turekian, Academic Press Ltd., London, U.K., pp 2552-2563.

AVHRR gaseous absorption spectra

AVHRR Temperature Deficits

MODIS: MODerate-Resolution Imaging Spectroradiometer
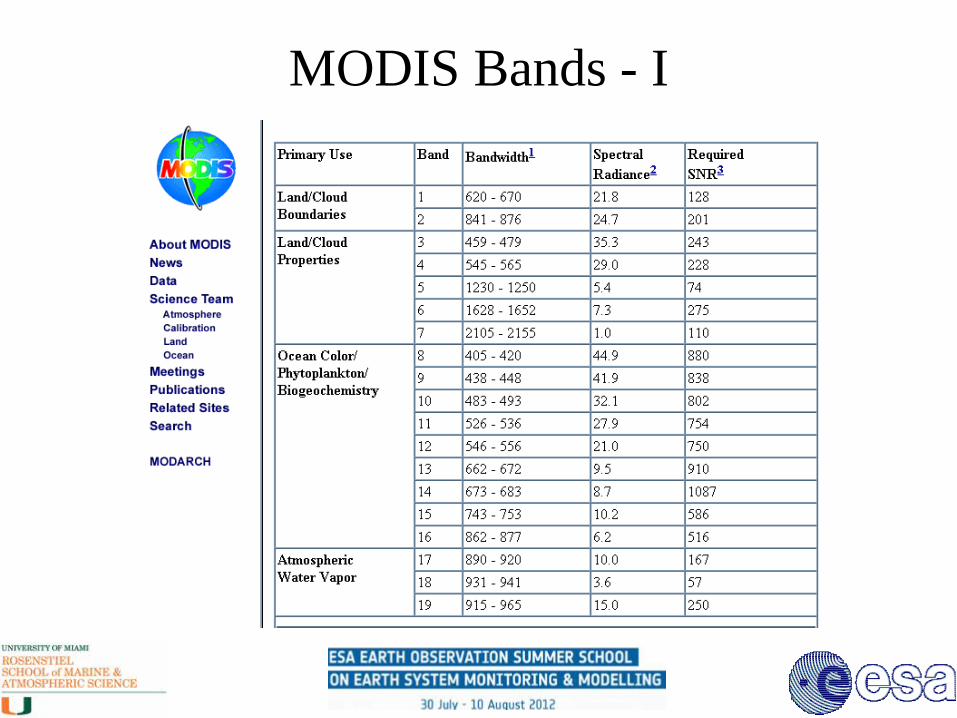
MODIS Bands - I

MODIS Bands - II
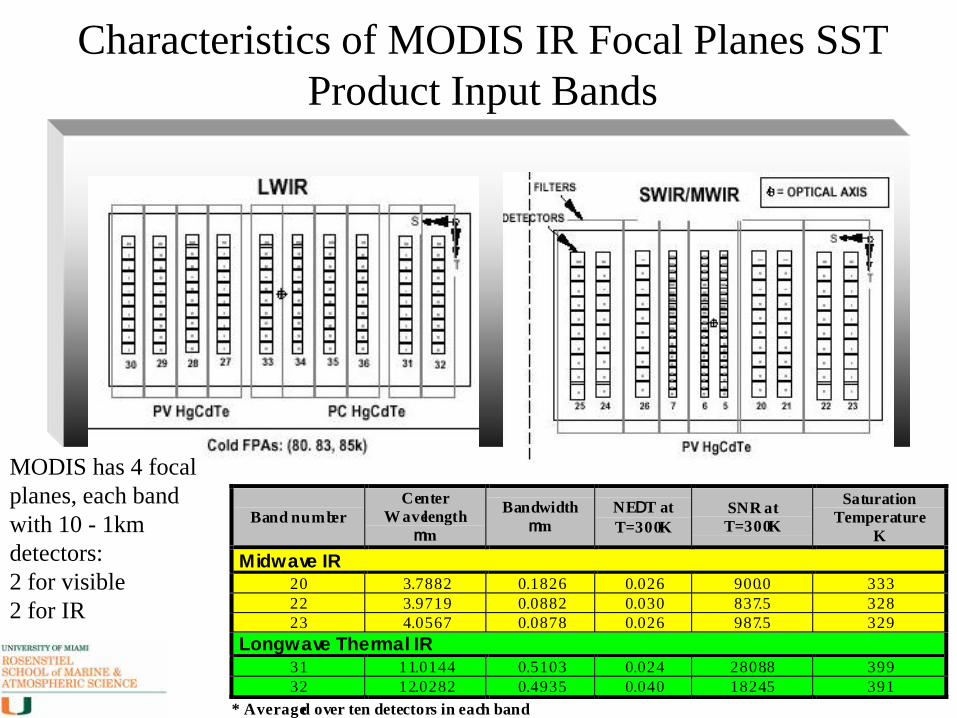
Characteristics of MODIS IR Focal Planes SST Product Input Bands
Band numberCenter
W avelengthmm
Bandwidthmm
NEDT atT=300K
SNR atT=300K
SaturationTemperature
KMidwave IR
20 3.7882 0.1826 0.026 900.0 33322 3.9719 0.0882 0.030 837.5 32823 4.0567 0.0878 0.026 987.5 329
Longwave Thermal IR31 11.0144 0.5103 0.024 2808.8 39932 12.0282 0.4935 0.040 1824.5 391
* Averaged over ten detectors in each band
MODIS has 4 focal planes, each band with 10 - 1km detectors: 2 for visible 2 for IR
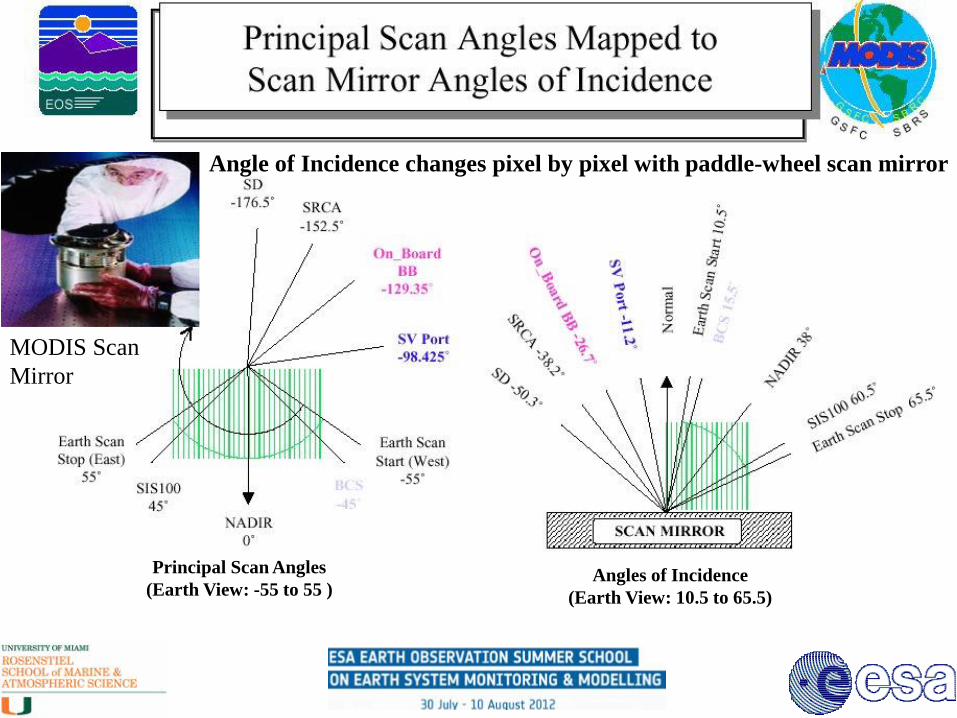
Angles of Incidence (Earth View: 10.5 to 65.5)
Principal Scan Angles (Earth View: -55 to 55 )
MODIS Scan Mirror
Angle of Incidence changes pixel by pixel with paddle-wheel scan mirror

VIIRS Components

VIIRS SST RSRs

VIIRS pixel aggregation
GSD: Ground Sampling Distance HSI: Horizontal Sampling Interval
(A)ATSR
• ATSR – Along-Track Scanning Radiometer – ASTR on ERS-1 – ATSR-2 on ERS-2 – AATSR (Advanced ATSR) on Envisat – SLSTR (Sea Land Surface Temperature
Radiometer) on Sentinal-3a to be launched in 2014.
• Only spacecraft radiometers optimized for SST measurements

Advanced Along Track Scanning Radiometer
• Imaging radiometer • Designed to measure global SST at the
levels of precision and accuracy required for climate research (better than 0.3 K; 1σ)
• Contributes to 20 year unbroken record of accurate SST measurements on a global scale
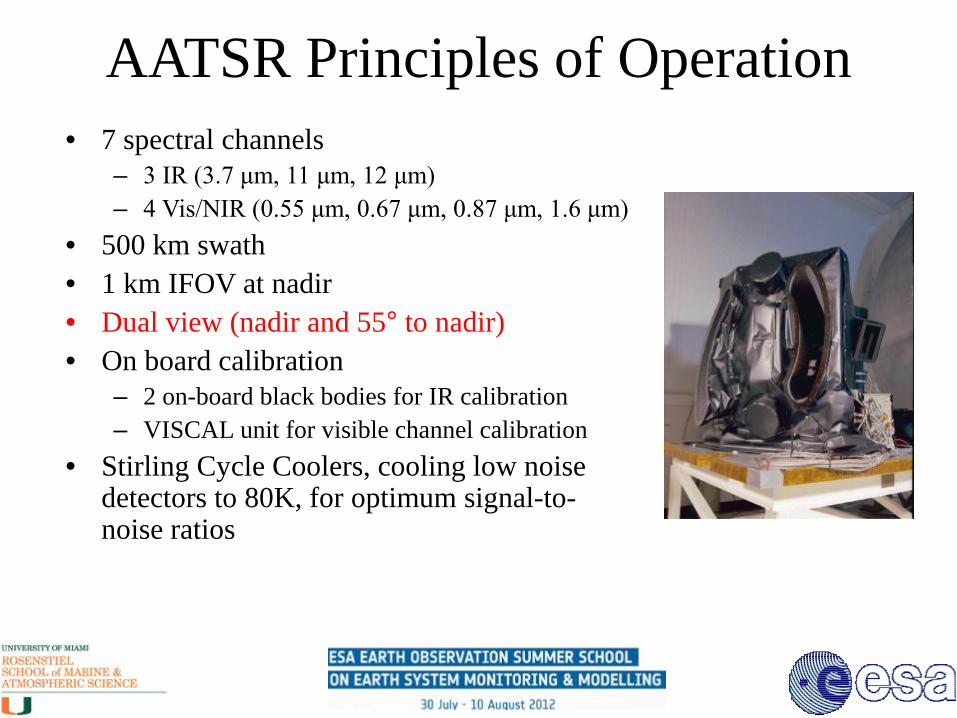
AATSR Principles of Operation • 7 spectral channels
– 3 IR (3.7 μm, 11 μm, 12 μm) – 4 Vis/NIR (0.55 μm, 0.67 μm, 0.87 μm, 1.6 μm)
• 500 km swath • 1 km IFOV at nadir • Dual view (nadir and 55° to nadir) • On board calibration
– 2 on-board black bodies for IR calibration – VISCAL unit for visible channel calibration
• Stirling Cycle Coolers, cooling low noise detectors to 80K, for optimum signal-to-noise ratios

AATSR - SCAN GEOMETRY Nadir View
Along-Track View
Hot Blackbody Cold Blackbody
VISCAL
Scan Direction
Blackbodies viewed every scan.


Sea and Land Surface Temperature Radiometer - SLSTR
• SLSTR has been designed to measure SST and Land Surface Temperature with an equivalent baseline performance to ENVISAT AATSR.
• Designed to extend and improve the (A)ATSR series but maintains fundamental concepts and elements of the original.
• SLSTR is an IR self-calibrating instrument using on-board calibration blackbody cavities.

SLSTR scan geometry • Uses two scan mechanisms and a flip
mirror to enable wider swath. • Nadir swath is offset to cover OLCI
swath. • One VIS channel (865nm) is used for
co-registration with OLCI swath.
• Oblique view 55o inclination maintains a longer atmospheric path length compared to nadir for better atmospheric correction.

S3 SLSTR: Spectral Bands

Cloud Screening for SST
• Spectral and textural information are powerful means for cloud screening (classification problem – cloud-free and cloud-contaminated).
• Several layers of tests needed to identify all pixels contaminated by clouds e.g. temperature thresholds, reflected sunlight (during the day), “spatial coherence”, channel differences (fog and cirrus).
• Problems remain with marine stratus, fog, cirrus, and partially cloud-filled pixels.
• Undetected aerosols remain a problem. • Better to have false positives than false negatives.

AVHRR Pathfinder SST cloud screening
(1)
From: Kilpatrick, K. A., G.P.Podesta and R. H. Evans, 2001. Overview of the NOAA/NASA Pathfinder algorithm for Sea Surface Temperature and associated Matchup Database, Journal of Geophysical Research, 106, 9179-9198
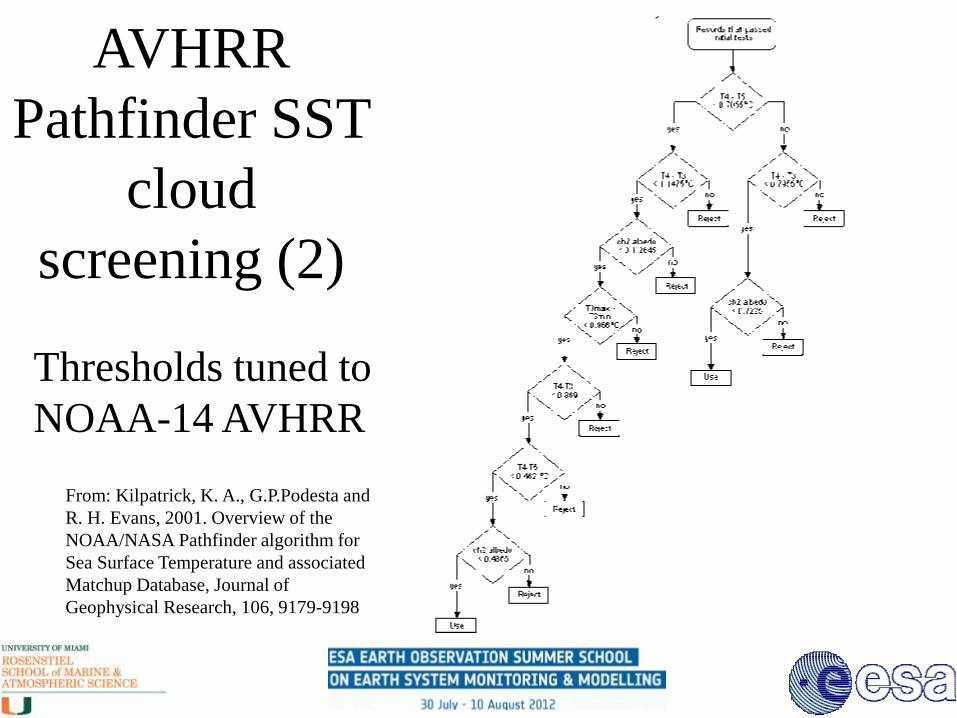
AVHRR Pathfinder SST
cloud screening (2)
Thresholds tuned to NOAA-14 AVHRR
From: Kilpatrick, K. A., G.P.Podesta and R. H. Evans, 2001. Overview of the NOAA/NASA Pathfinder algorithm for Sea Surface Temperature and associated Matchup Database, Journal of Geophysical Research, 106, 9179-9198

Predicted MODIS brightness temperatures at satellite height
At nadir At edge of swath
Tem
pera
ture
def
icit
Surface temperature range, -10 to 40oC N=13950
Change in BT with surface T relatively small for bands 22, 23 - significantly larger for bands 20, 31, 32
3.79µm
11.01µm 11.01µm 12.03µm 12.03µm
3.97µm 3.97µm 3.79µm
4.06µm 4.06µm

The SST atmospheric correction algorithms The form of the daytime and night-time algorithm for measurements in the long wave
atmospheric window is:
SST = c1 + c2 * T11 + c3 * (T11-T12) *Tsfc + c4 * (sec (θ)-1 )* (T11-T12) where Tn are brightness temperatures measured in the channels at n mm wavelength, Tsfc is
a ‘climatological’ estimate of the SST in the area, and θ is the satellite zenith angle. This is based on the Non-Linear SST algorithm.
[Walton, C. C., W. G. Pichel, J. F. Sapper and D. A. May (1998). "The development and operational application of nonlinear algorithms for the measurement of sea surface temperatures with the NOAA polar-orbiting environmental satellites." Journal of Geophysical Research 103 27,999-28,012.]
The MODIS night-time algorithm, using two bands in the 4mm atmospheric window is: SST4 = c1 + c2 * T3.9 + c3 * (T3.9-T4.0) + c4 * (sec (θ)-1) Note, the coefficients in each expression are different. They can be derived in three ways:
– empirically by regression against SST values derived from another validated satellite instrument – empirically by regression against SST values derived surface measurements from ships and buoys – theoretically by numerical simulations of the infrared radiative transfer through the atmosphere.
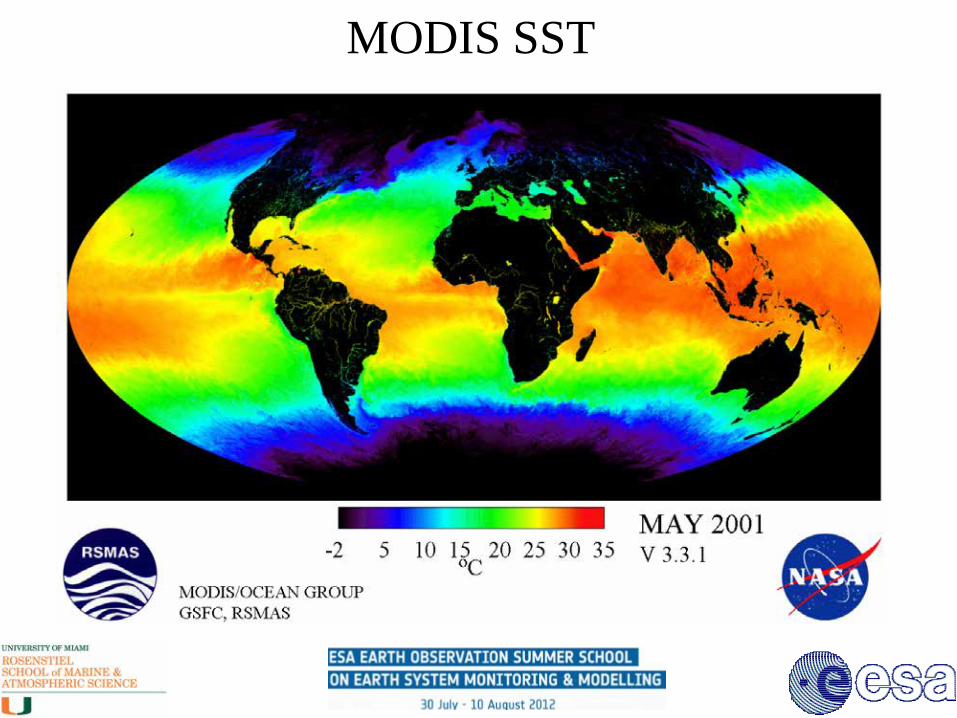
MODIS SST
Typical oceanographic thermal signals
•The El Niño SST signal is an example of a large SST signal and is typically ~3-4K; temperature differences across large ocean fronts are similar. If satellite data are to be used to study such features, the accuracy of the retrieved SSTs should be at one order of magnitude smaller than the signal ~0.3K. •For climate studies:
–Accuracy 0.1K. –Stability 0.04K/decade. (Ohring, G., B. Wielicki, et al. (2005). "Satellite Instrument Calibration for Measuring Global Climate Change: Report of a Workshop." Bulletin of the American Meteorological Society 86(9): 1303-1313).
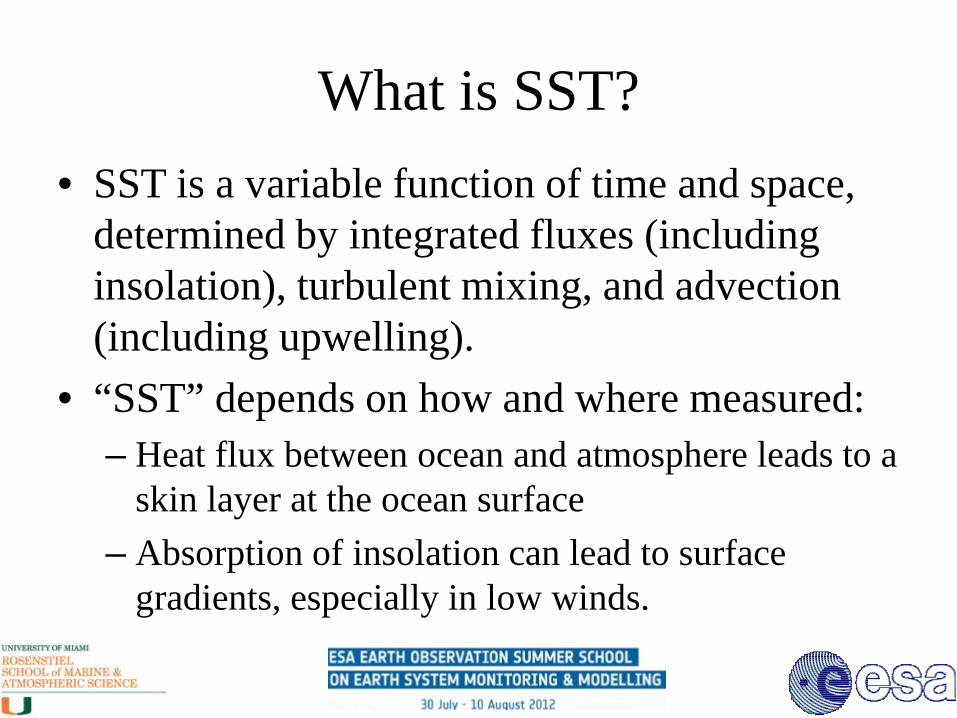
What is SST? • SST is a variable function of time and space,
determined by integrated fluxes (including insolation), turbulent mixing, and advection (including upwelling).
• “SST” depends on how and where measured: – Heat flux between ocean and atmosphere leads to a
skin layer at the ocean surface – Absorption of insolation can lead to surface
gradients, especially in low winds.

SST & the thermal skin layer • The skin layer exists as a consequence of heat
exchange from ocean to atmosphere. • The skin layer is a ‘bottleneck’ in the heat flow
from ocean to atmosphere, and it is this flow of heat that drives evaporation and sensible heat flow.
• The skin-bulk temperature difference, can be a significant fraction of the conventional air-sea temperature difference.
• SST could be an indicator of climate change, and satellite radiometers a global thermometer.
.

What is SST? –skin vs. bulk The optical depth of sea water at infrared wavelengths is < 1mm. The source of the infrared signal used in remote sensing is the skin layer of the ocean, which is generally cooler than the subsurface layer because of heat flow from the ocean to the atmosphere. The conventional meaning of SST is the temperature measured at a depth of a meter or more by a contact thermometer; the so-called bulk temperature. At the levels of accuracy at which SST needs to be,
and can be, measured from space, skin and subsurface temperatures are not the same.

Schematic Temperature Profiles
Donlon, et al. (2007). The Global Ocean Data Assimilation Experiment High-resolution Sea Surface Temperature Pilot Project. Bulletin of the American Meteorological Society, 88, 1197-1213

Wind speed dependence of diurnal & skin
effects
As wind speed increases, magnitude of diurnal
heating decreases and peak moves to later in the
afternoon
See: Minnett, P. J. (2003). "Radiometric measurements of the sea-surface skin temperature - the competing roles of the diurnal thermocline and the cool skin." International Journal of Remote Sensing 24(24): 5033-5047

Terra and Aqua overpass times.
Wind speed dependence of diurnal & skin
effects
As wind speed increases, magnitude of diurnal
heating decreases and peak moves to later in the
afternoon

Wind speed dependence of the skin
effect Note collapse of envelope at moderate to high wind speeds > 7ms-1, asymptotic value ~ -0.15K.

Measurements of Diurnal Warming
• Skin SST measured by M-AERI
• Bulk SST by a thermosalinograph at a depth of ~3m
• Winds and insolation measured on the ships
From Gentemann, C. L. and P. J. Minnett, 2008:
Radiometric measurements of ocean surface thermal variability. Journal of Geophysical Research, 113, C08017. doi:10.1029/2007JC004540.

Examples of large amplitude diurnal heating Large amplitude diurnal heating is identified in independent satellite data. From Gentemann, C. L., P. J. Minnett, P. LeBorgne, and C. J. Merchant, 2008: Multi-satellite measurements of large diurnal warming events. Geophysical Research Letters, 35, L22602. doi:10.1029/2008GL035730

SEVIRI (Spinning Enhanced Visible and Infrared Imager) is on the Meteosat 8 & 9 – geostationary satellites. Images generated every hour. Symbols are where diurnal heating >6K Background color is number of days in the year where wind <1ms-1 at 14:00 LST. From Gentemann, C. L., P. J. Minnett, P. LeBorgne, and C. J. Merchant, 2008: Multi-satellite measurements of large diurnal warming events. Geophysical Research Letters, 35, doi:10.1029/2008GL035730
Large amplitude diurnal heating
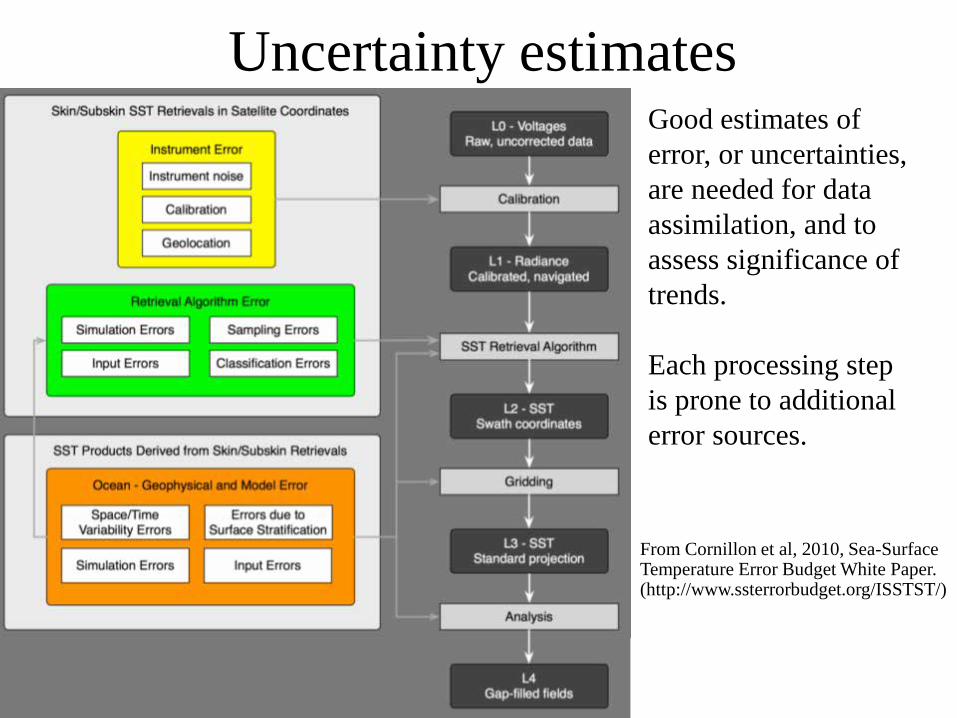
Good estimates of error, or uncertainties, are needed for data assimilation, and to assess significance of trends. Each processing step is prone to additional error sources.
Uncertainty estimates
From Cornillon et al, 2010, Sea-Surface Temperature Error Budget White Paper. (http://www.ssterrorbudget.org/ISSTST/)

L2 is where the uncertainties in the SST retrievals by comparison with independent measurements.
Uncertainty estimates
L4 fields are used to initialize climate models, and in other climate studies.

Climate Data Records
• What does “Climate Data Record” mean? • What is the path to a CDR of SST? • Can we generate a CDR of SST?

Reference to SI units The First Recommendation of the 20th Conférence Générale des Poids et Mesures : “that those responsible for studies of Earth resources, the environment, human well-being and related issues ensure that measurements made within their programs are in terms of well-characterized SI units so that they are reliable in the long term, are comparable world-wide and are linked to other areas of science and technology through the world’s measurement system established and maintained under the Convention du Mètre” See http://www.bipm.org/jsp/en/ListCGPMResolution.jsp?CGPM=20

Laying the foundations
• Provides a basis for consistent long-term records from a variety of sources
• Provides consistency between different groups making related measurements
• For satellite-derived sea-surface temperature, it provides a mechanism for consistent time series to be generated over multiple missions.

Essential Climate Variables

Essential Climate Variables
Climate Data Records • National Academy of Sciences Report (NRC, 2000): “a data set designed
to enable study and assessment of long-term climate change, with ‘long-term’ meaning year-to-year and decade-to-decade change. Climate research often involves the detection of small changes against a background of intense, short-term variations.”
• “Calibration and validation should be considered as a process that encompasses the entire system, from the sensor performance to the derivation of the data products. The process can be considered to consist of five steps: – instrument characterization, – sensor calibration, – calibration verification, – data quality assessment, and – data product validation.”

How can we generate SST CDRs? • Satellite radiometers may be well-calibrated and
well-characterized prior to launch, but is this sustained through launch and on orbit?
• Satellite instruments are not recovered for post-deployment re-calibration…
• Accurate brightness temperatures measured in space do not necessarily mean accurate SSTs, as effects of imperfect atmospheric corrections dominate.
• SST CDRs require SI traceability: can only be achieved through validation programs.

Temperature measurements from drifting buoys
• Deployed from ships and aircraft. • Telemeter data via satellite links. • Measure SST and Po • Satellites determine position. • Changes in positions from day-to-day
give surface currents; often with a drogue.

Drifting buoys
Before & After

M-AERI cruises for MODIS, AATSR & AVHRR validation
Explorer of the Seas: near continuous operation December 2000 – December 2007.
Explorer of the Seas

ISAR cruises for MODIS, AATSR & AVHRR validation

International radiometer workshops • There have been three international workshop on infrared
radiometry held at RSMAS, University of Miami. – The first was held prior to the launch of Terra – The second in 2001, before the launch of Aqua – The third took place in May 2009, under the auspices of the GEO/CEOS
(Group on Earth Observations / Committee on Earth Observation Satellites)
• The data from the third workshop were analyzed at the National Physical Laboratory (NPL), Teddington, UK, and the results have been published in reports of the NPL
• Through the participation of NIST these workshops provide traceability to national radiometric and thermodynamic temperature standards through the characterization of the laboratory radiometers used to assess the validity of the internal calibration of the radiometers used at sea. This traceability to SI standards is achieved by using the NIST Transfer Radiometer (TXR)

The NIST EOS TXR
Rice, J. P. and B. C. Johnson, 1998. The NIST EOS Thermal-Infrared Transfer Radiometer, Metrologia, 35, 505-509.
Unique EOS Standard Cryogenic detectors (liquid N2)
λ= 5 & 10µm
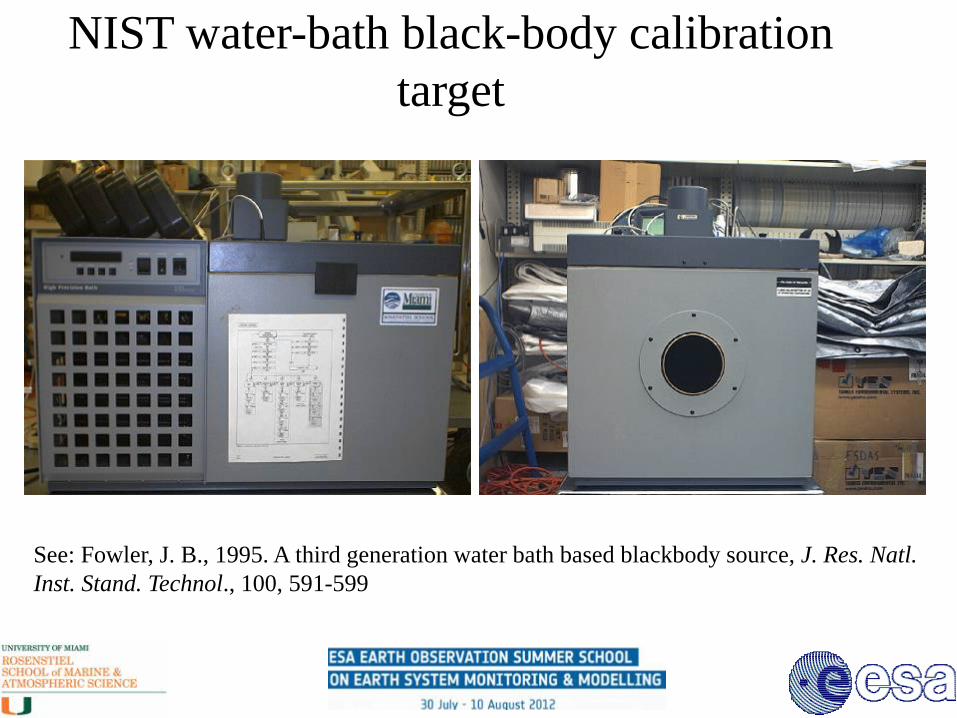
NIST water-bath black-body calibration target
See: Fowler, J. B., 1995. A third generation water bath based blackbody source, J. Res. Natl. Inst. Stand. Technol., 100, 591-599
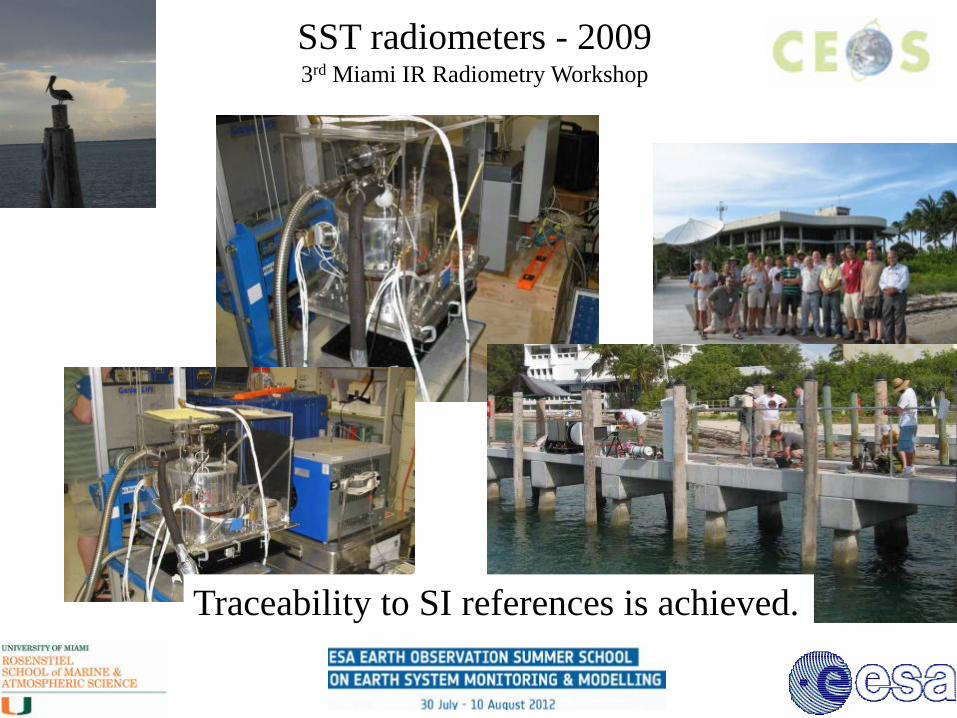
SST radiometers - 2009 3rd Miami IR Radiometry Workshop
Traceability to SI references is achieved.

Significant differences between
SI & non-SI uncertainties ?
Ship radiometer
measurements
Laboratory water-bath blackbody calibrator
Satellite-derived
SSTs and uncertainties
SI-traceable thermometers
Laboratory calibration
Matchup analysis of non-SI collocated measurements
CDR of SST
SI Traceable uncertainty budget
Derivation of SST from satellite measurements
Multi-year satellite
radiometer measurements
Non-SI traceable in
situ measurements
Matchup analysis of SI collocated
measurements
SI-standard blackbody calibrator
Non – SI Traceable uncertainty budget
Radiometric characterization e.g. NIST TXR
Y
N

Significant differences
between SI & non-SI
uncertainties ?
CDR of SST
SI Traceable uncertainty budget
Multi-year satellite
radiometer measurements
of SST
Non – SI Traceable uncertainty budget
Y
N
CDR Summary
• Generation of SST CDRs requires validation with NIST-traceable radiometers.
• NIST TXR is the transfer reference standard for infrared radiometry
• The Miami Infrared Workshops have provided a mechanism for traceability to NIST standards of satellite-derived SSTs.
• SST CDRs are a reality.
Questions ?


