Satellite Meteorology & Ocean Applications and...
28
Raj Kumar Space Applications Centre Ahmedabad Satellite Meteorology & Ocean Applications and MOSDAC [email protected] CEOS WG-CapD -8Meeting, IIRS, Dehradun, March 6-8, 2019
Transcript of Satellite Meteorology & Ocean Applications and...

Raj KumarSpace Applications Centre
Ahmedabad
Satellite Meteorology & Ocean Applications and MOSDAC
CEOS WG-CapD -8Meeting, IIRS, Dehradun, March 6-8, 2019

Coastal Altimeter product on MOSDAC
Predictions at various scales
Extreme events
Retrieval /Data Assimilation
Physical Oceanography
Biological, Coastal oceanography
Agriculture
Environment & Forests
Water Resources / Snow & Glaciers
Geology & Minerals / Archeology
Renewable Energy
Disaster Management Support R&D
Climate Change
Planetary Sciences
Alpine Treeline
Atlas
Desertification and Land
Degradation Status Atlas

GEOPHYSICAL-PARAMETER RETRIEVALS OF ISRO MISSIONS
❖INSAT-3D/3DR SATELLITES❖GISAT❖SCATSAT❖Oceansat-1/2/3❖MEGHA-TROPIQUES❖IRNSS/GNSS❖TSU/HSU❖MOP3 & TDP(Projects)❖NISAR/RISAT❖FUTURE/ OTHER MISSIONS
MISSIONS/PROGRAMMESActivities pertain to➢Simulations➢Sensitivity studies➢Algorithms development➢Operational retrievals➢Calibration – climate quality➢Quality evaluation / Validation ➢Value-addition➢Process studies ➢Applications
Mis
sio
ns
➢ Major Work Involvements in Recent PastImager: SST, Rain, UTH, OLR, TPW, Fog, CSBTSounder: T, WV, O3 profiles, Total O3, TPW, Cloud
Products, Other Thermodynamic Products
Humidity Profiles
INSAT-3D Sounder – T-φ gram
Cyclone: Verdha
SAPHIR - Rain
SAPHIR: Rain ROSA: T & RH ProfilesMADRAS: TPW, CLW, OWS & Rain
Humidity Profiles
SAPHIR: RH Profile

CEOS WGCapD-8, March 6-8, 2019
ImagerO
LRU
THIN
SOLA
TIO
N
SST
Clo
ud
Win
ds
Wat
er V
apo
r W
ind
s
QP
E (R
ain
)H
E-R
ain
Fire
& S
mo
ke
Ae
roso
lsFo
gSn
ow
Temperature (K) 850 hPa
Water vapor (g/kg) 850 hPa
Surface Skin temperature (K)
Total column ozone (dob.)
SounderINSAT-3D/3DR Data Products
Clo
ud
To
p P
res
su
re
We
ek
ly R
ain
fall M
ap
Cle
ar
Sk
y B
T
Clo
ud
To
p T
em
p

Retrievals of geophysical parameters & essential climate variables from space-borne data
• INSAT 3D/3DR – New ProductsClear Sky Brightness Temperatures (CSBT), Cloud Top Pressure (CTP), Cloud Top Height (CTH), and TPW
• SCATSAT-1: Correction in Winds for RainBayesian approach for correcting rain corrupted wind from SCATSAT-1.
Range L2B 25 km (3-30 m/s) WS BIAS (m/s) WS RMSE WS URMSE NP(#) (*106)
Rain free 0.02 1.10 1.10 124.21
Rain flagged – w/o Corr. 2.12 3.79 3.16 5.98
Rain flagged – With Corr. -0.07 1.93 1.93 5.96
Rain-Free
Rainy
ECMWFW/o corrWith corr
• GNSS: RO RetrievalsRetrieval of T, P and RH from M-T and O2 ROSA . Also retrieval of T and P from Akatsuki mission for
Venusian atmosphere carried out.

Retrievals from Passive Microwave Sensors
m/s
Daily mean rain-land (mm/day)
Bayesian-rainSAPHIR-operational-rainIMERG-rain
Wind Speed from L-band SMAP Sea Surface Salinity from SMAP MT-SAPHIR using Bayesian algorithm.
• Algorithm development for Met/Ocean parameters from
• Oceansat-3, GISAT, TSU/HSU, and PMR
• Inclusion of sounding over cloud top from 3D/3DR sounder
• Sensor definition studies for future EO Missions, i.e., 4th Gen-INSAT,
Microwave Radiometers, Soil moisture/Salinity missions,
• Cloud-cleared radiances for partially cloudy pixels
• GNSS Reflectometry for sea surface wind retrieval
Future Missions
SST Retrieval: Sensitivity to NEDT and Channel Width
Humidity retrieval from Multispectral and Hyperspectral Sounder

CEOS WGCapD-8, March 6-8, 2019
Short Range Weather PredictionWRF model with 3DVAR
Weather Prediction using satellite data
Monsoon PredictionCommunity Atmosphere Model
(CAM)
Comparison of predicted seasonal monsoonrainfall for 2016 with the satelliteobservations
NowcastingAlgorithms developed at SAC
Prediction of cold waveconditions
Prediction of heat waveconditions.
Heavy rainfall over Kashmir Jul 2015 Relative Humidity
Winds
Cloudburst Alert over Pithoragarh, 01 July 2016

CEOS WGCapD-8, March 6-8, 2019
❖ Algorithm development for Doppler Weather Radar (DWR) image processing and its application to storm tracking
High Impact Weather Events: Satellite and Radar based storm tracking, Nowcasting and cloud microphysical studies
Observed MaxZ
Lightening Activities: Using INSAT, GPM and WWLLN Data
Observed MaxZNowcasted MaxZ
Cyclone centric images fromdifferent channels of INSAT-3D
Ship avoidance region guidanceduring TC LUBAN
Aerosol Effect on CycloneAssimilation of ISRO TERLS DWR data on TC Ockhi

CEOS WGCapD-8, March 6-8, 2019
Monitoring and Prediction of Extreme Weather
9
3/6/2019
Nowcasting & Short-range Prediction of Mumbai Heavy Rainfall
28-29 Aug 2017
Hurricane IRMA Observed by SCATSAT
0915 UTC0715 UTC
T
I
R
-
INSAT-3D/3DR Clear-Sky radiances for
assimilation in global weather prediction model
at NCMRWF for improved weather prediction
High resolution
urban surface
temperature
monitoring and
prediction using
INSAT-3D/3DR
Urban Heat Island Observed by INSAT 3D

CEOS WGCapD-8, March 6-8, 2019
Cyclogenesis Prediction
Real-Time Monitoring and Prediction of TC MEKUNU (Active in Arabian Sea)
Cyclone Track Prediction Cyclone Intensity Prediction
Genesis Prediction: 16 Z, 19 MAYCyclone formation: 18 Z 22 MAYLead prediction time: ~72 hours
Real-time cyclone Track prediction at 00 during 22 and 23 MAY using in-house developed SAC-Lagrangian track prediction model. Real-time cyclone intensity prediction using NCEP-
operational HWRF model Forecasts
Center Estimation Cyclone centric satellite Products Generation
Real-time TC centerwas estimated and TC centric products were generated using INSAT-3D Imager data
INSAT-3D Imager SCATSAT-1MT-SAPHIR

CEOS WGCapD-8, March 6-8, 2019
Research Activities
• All-Sky Assimilation of SAPHIR
radiances
• Development of assimilation
system for INSAT-3R radiances
• Assimilation of ISRO TERLS DWR
for extreme weather events
• Development of assimilation
system for Martian & Venusian
Atmosphere
• Seasonal forecast using CESM
Model
• Lightening Estimate and
Forecasting
Weather Forecast
Heat/Cold
WaveCyclone
Prediction
Air Quality
Prediction
Monsoon Prediction
Modeling of Mars and
Venus Atm.
CMP and Nowcasting
3-hourly Lightning Potential
15-minutes Wind/Solar
Energy
MOU’s: KSNDMC, Gujarat Weather Watch, Agriculture,
Indian Navy, NIWE, NISE etc.
Atmospheric Sciences : Weather Forecasting and Data Assimilation

CEOS WGCapD-8, March 6-8, 2019
Satellite based Marine process understanding, development, Research and Applications for Blue Economy (SAMUDRA)
Scope & Objectives
▪ Identification of zones which are
susceptible to extreme conditions using
site specific wave and circulation models.
▪ Provide outlook of potential fishery zones;
development & demonstration of
FISHTRACK module
▪ Generation of very high resolution ocean
state for Naval and Shipping operations
▪ Tracking of oil spill; development &
demonstration of OILTRACK module
▪ Identify potential zones for wind, wave
and thermal energy
▪ Synthetic temperature and salinity profile
generation using satellite observations
▪ Optimize model parameters for better
mixed layer simulation.
▪ Development of improved algorithms for
momentum, latent and sensible heat flux
computation using satellite and in-situ
measurements.
Targeted Outcomes
Energy Sector (wind/wave/thermal)
Marine Ecosystem, Potential Fishing Zones
Oil Exploration, Naval Operations & Ship Routing
Ocean Hazards (RIP currents, extreme waves, oil-spill
forecasting, )
Ocean Reanalysis , accurate models for OSF
Disaster Monitoring and Prediction
New Sensor Definition / Retrieval / Infrastructure /
capacity building
Ocean observing systems for satellite cal-val and model optimization
OIL-TRACK
LCS strain lines: Barrier zones
Pathways of Chennai oil spill
Satellite based new methodology for identifying PFZ locations (in
blue lines)
Titli Track (WRF)
Coastline
Simulated Coastal Inundation Forecast for Titli Cyclone upon Landfall on 10/10/2018 06:00:00 IST
Titli Track (WRF)
Coastline
SAMUDRA: Coastal Inundation Forecast for 10/10/2018,0600 GMT associated with TITLI (Forecast generated on09/10/2018, 0600 GMT) Validation to be done and plan tohost it on MOSDAC

CEOS WGCapD-8, March 6-8, 2019
RIP CURRENTSRip current hotspot detection from satellite RS
Rip current measurements from low-cost GNSS drifters
4 May 2018
iPOWER hosted on VEDAS
Ocean Eye (MoU with SCI)
Sub-surface projection of Density Anomaly(blue to orange in increasing order of its value)from satellite parameters (sea level, sea surface
temperature and surface salinity)
Coastal inundation forecast for TITLI cyclone (left); Validation using
RADARSAT image (right); Operationalized on MOSDAC

CEOS WGCapD-8, March 6-8, 2019
Beach Erosion Forecast
Ramakrishna Beach Visakhapatnam
Beach Erosion Advisory (lead period of 10 days)
Validation of Beach Erosion Forecast
• Initial conditions using DGPS profiles at every 5 m
interval along 4 km beach. Morphodynamic model is
simulated using forecast wave parameters.
• Beach erosion forecast/advisories are provided in a test mode
for monsoon season, 2018 all with a lead period of 10 days.
Work is planned for operational beach erosion forecasting system forselected beach with INCOIS

CEOS WGCapD-8, March 6-8, 2019
Ocean Modelling (wave, circulation, biogeochemistry and coupled): AOSF (Multi-nested interactive modelling set-up)
25 km global (SCI, IN)
10 km Indian Ocean (IN)2 km wave IO coastal operational
Very high resolution process
modelling (~ 100m)
Coupled Bio physical modelling
R&D Components:
(i) Assimilation of sea level (altimeter obs),
currents, SST, SSS & Argo Profiles (T & S), ocean
color--- A complete assimilation package
(ii) HR-Satellite image assimilation (GISAT & SWOT)
Motivation:➢Observing System Simulation Experiment (OSSE): Defining the Future Ocean Sensors
➢High Resolution Site/Event – ISRO’s Satellite Recovery Program
➢Naval and Shipping Needs
➢Development of Model : Optimising model parameters using non-linear data assimilation Methods
Data Assimilation Module operationalized at INCOIS Wave Model Set up
Very high res. circulation and wave modeling
Coupled ocean atmosphere modelling for El-Nino forecasting
• Forecast generated using initial conditions of April, May and June
• 6 month lead time forecast for December 2017 predicted neutral conditions in the Pacific.
Dashed lines ensemble members thick red line is ensemble mean
El-Nino Forecast for December 2018 using coupled ocean-atmosphere model : Mild El Nino
CEOS WGCapD-8, March 6-8, 2019
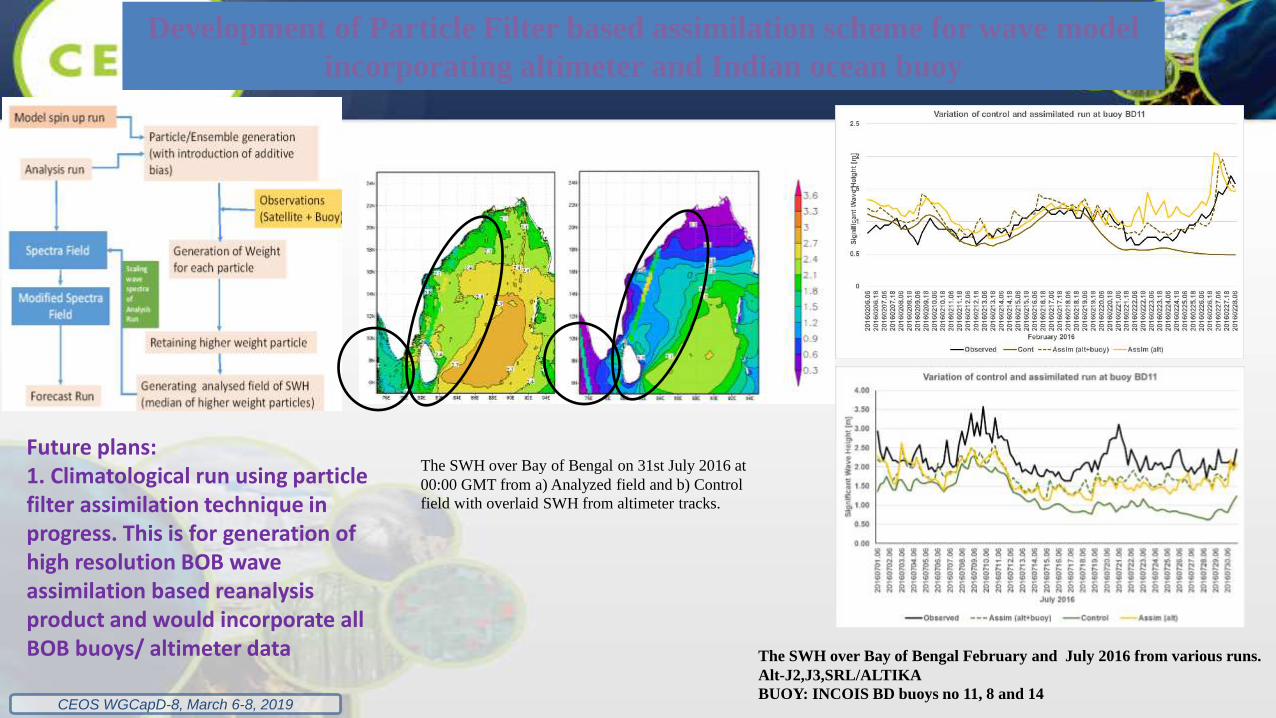
The SWH over Bay of Bengal on 31st July 2016 at
00:00 GMT from a) Analyzed field and b) Control
field with overlaid SWH from altimeter tracks.
The SWH over Bay of Bengal February and July 2016 from various runs.
Alt-J2,J3,SRL/ALTIKA
BUOY: INCOIS BD buoys no 11, 8 and 14
Future plans: 1. Climatological run using particle filter assimilation technique in progress. This is for generation of high resolution BOB wave assimilation based reanalysis product and would incorporate all BOB buoys/ altimeter data
Development of Particle Filter based assimilation scheme for wave model
incorporating altimeter and Indian ocean buoy

CEOS WGCapD-8, March 6-8, 2019
Renewable Energy from SpaceSolar Energy
Ocean Wave Power
I-POWER GUI
Offshore Wind Energy
Onshore Wind Energy

CEOS WGCapD-8, March 6-8, 2019
Solar Energy Potential on Mobile & Solar Site Selection Tool
Geo-spatial analysis based site selection tool using following layers of information
1. Distance from Power line2. Distance from Road3. Maximum Slope4. Minimum Solar Insolation5. Type of Land Use
Tabular Description
Graphical Representation
Forecast

CEOS WGCapD-8, March 6-8, 2019
How Urbanization is affecting the rainfall, mainly the Heavy Rain Events
During past 5 decades, there have been a significantly increasing trend in heavy rainfall events over urban events during monsoon.
Satellite observations fromrecent years also confirm thaturban areas (indicated by highdensity of population) havehigher (almost twice as high)proportion of heavy rainfallevents compared to ruralareas.
Rural
Urban

CEOS WGCapD-8, March 6-8, 2019
How global climate change has affected the tropical cyclone behavior ?
• A Study carried out at SAC concluded that the global warming has enhanced the rate of cyclone intensification in most of the global basins.
• The rate of cyclone intensification was found to be largest in the Southern Indian Ocean followed by North Atlantic Ocean.
• In some basins (like North Atlantic) now it takes a cyclone about 24-hour less time to intensify from severe cyclone to super cyclone, than it did 25 years ago.

CEOS WGCapD-8, March 6-8, 2019
INDIAN Storehouse for Space based Weather and Ocean Data
मॉसडकेअतंरिक्षआधारित मौसम एवं समदु्र ववज्ञानीयआँकडे का भाितीय भडंाि
MOSDAC - Meteorological and Oceanographic Satellite Data Archival Centre
CEOS WGCapD-8, March 6-8, 2019
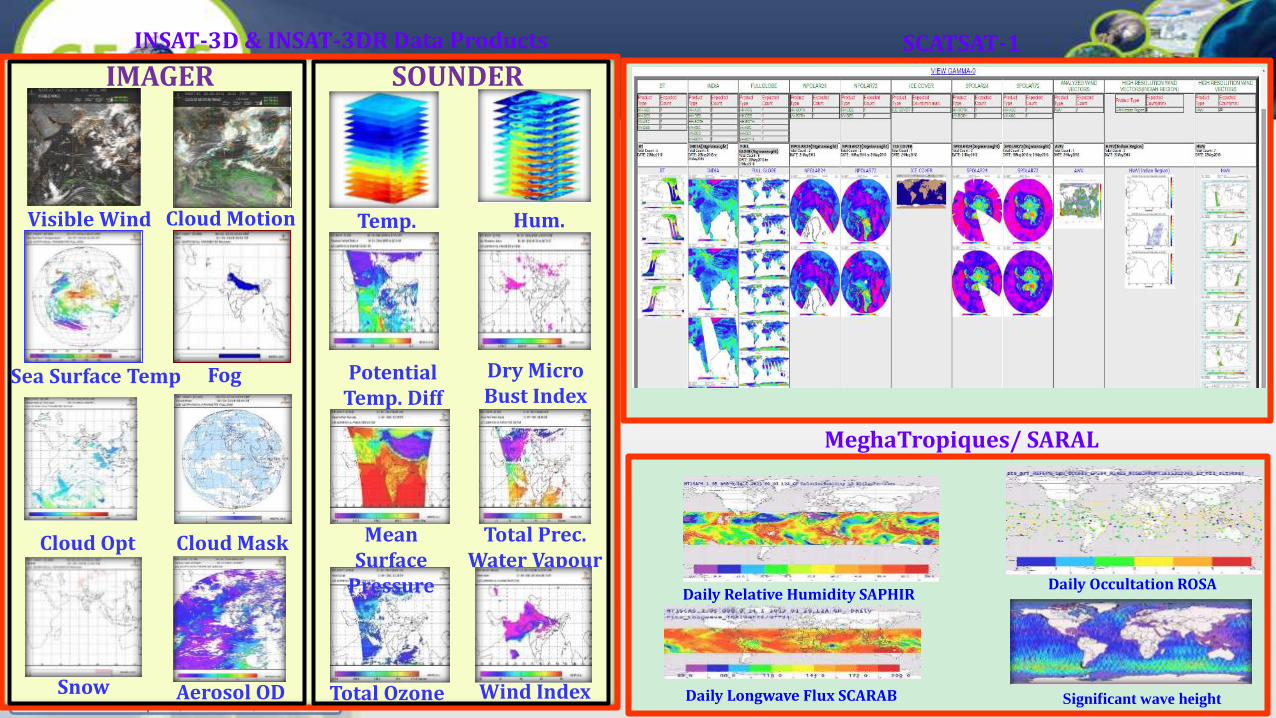
Dry Micro Bust Index
Total Ozone
Potential Temp. Diff
Mean Surface
Pressure
Wind Index
Total Prec. Water Vapour
Cloud Opt Thick
Cloud Motion Wind
Sea Surface Temp Fog
Snow
Visible Wind
Aerosol OD
Cloud Mask
Temp. Profile
Hum. Profile
IMAGER SOUNDER
Significant wave height
MeghaTropiques/ SARAL
Daily Occultation ROSADaily Relative Humidity SAPHIR
Daily Longwave Flux SCARAB
INSAT-3D & INSAT-3DR Data Products SCATSAT-1

CEOS WGCapD-8, March 6-8, 2019
MOSDAC SERVICES मॉसडके की सेवाएँनौकास्ट
वततमान घटनाएं
Met ApplicationsOcean Applications

CEOS WGCapD-8, March 6-8, 2019
Cyclogenesis
• Oceanic eddy parameter information - visualized for 24 years (1993 - 2016) over Bay of Bengal
• Menu based selection: date wise, Eddy id, Eddy type (cyclonic, anti-cyclonic)
• Animation of eddies on the basis of selected eddy id or eddy type.
• Point probing - Display information regarding amplitude and radius of eddy
• Value addition by adding Ports, Bathymetry & other overlay layers
VARDAH - Cyclone
SCORPIO Satellite based Cyclone Observations & Real-time Prediction over Indian Ocean
Alert broadcast on MOSDAC and by EMAIL to authorities
Eddy Visualization
CEOS WGCapD-8, March 6-8, 2019
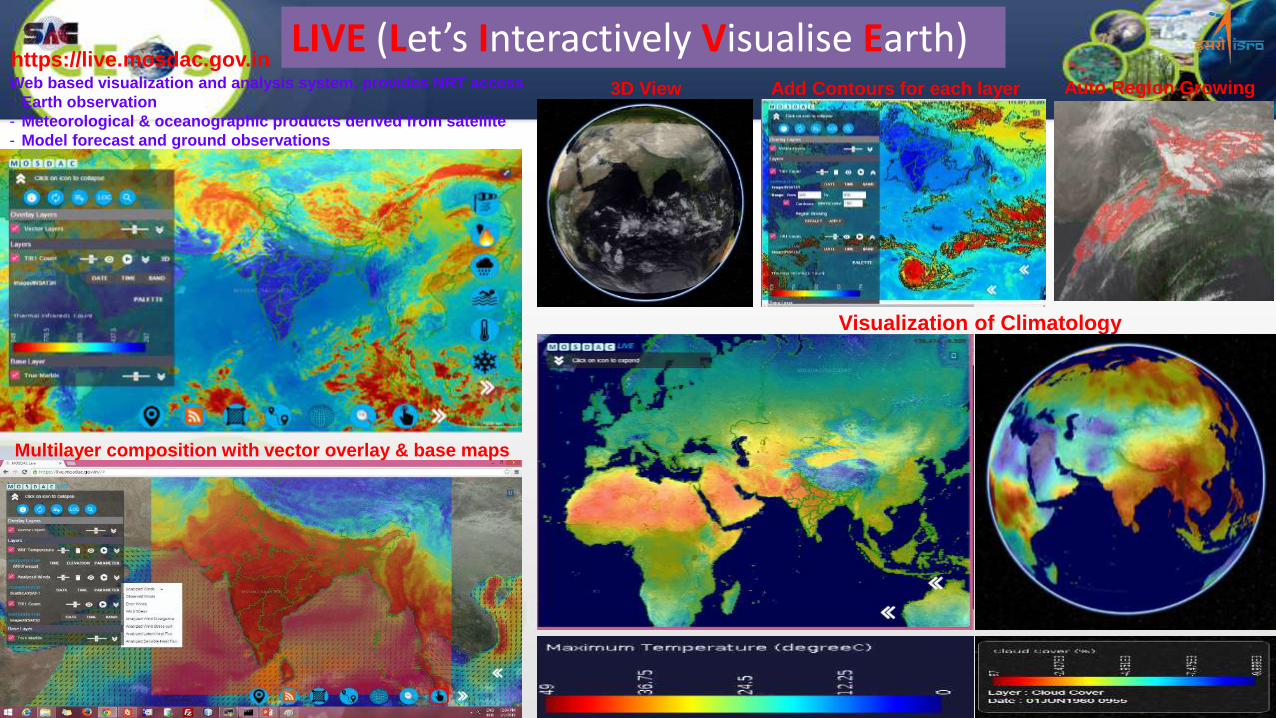
Web based visualization and analysis system, provides NRT access
- Earth observation
- Meteorological & oceanographic products derived from satellite
- Model forecast and ground observations
https://live.mosdac.gov.in LIVE (Let’s Interactively Visualise Earth)
Visualization of Climatology
Multilayer composition with vector overlay & base maps
Add Contours for each layer3D View Auto Region Growing

CEOS WGCapD-8, March 6-8, 2019
Analysis: Point Probes & Time Series
Thermodynamic Diagrams
T-Phi & Skew-T Plots using Sounder Profiles
Information Products: Heavy Rain Nowcast Wind Forecast
Search and Measurements Ground observation

CEOS WGCapD-8, March 6-8, 2019
https://mosdac.gov.in/live
Visualization of Climatology
ECVs Category Satellite Start Date End Date
LST LANDKalpana-1, INSAT3D,3DR
August 2010 till date
AOD ATMOSPHERE INSAT3D , 3DR Oct 2013 till date
Rain ATMOSPHEREKalpana-1, INSAT3D, 3DR
May 2010 till date
UPPER AIR Winds
ATMOSPHEREKalpana-1, INSAT3D,3DR
Nov 2009 till date
ERB ATMOSPHERE M-T Nov 2011 Dec 2018
Sea Ice OCEAN SCATSAT1 Nov 2016 till date
SST OCEANKalpana-1, INSAT3D, 3DR
June 2008 till date

CEOS WGCapD-8, March 6-8, 2019