Self-Supervised Difference Detection for Weakly-Supervised ...

SATELLITE IMAGE SIMULATIONS FOR MODEL-SUPERVISED, DYNAMIC
RETRIEVAL OF CROP TYPE AND LAND USE INTENSITY
H. Bach a, P. Klug a, T. Ruf a, S. Migdall a, F. Schlenz b, T. Hank b, W. Mauser b
a Vista Geowissenschaftliche Fernerkundung GmbH, Gabelsbergerstr. 51, 80333 München, Germany – [email protected],
[email protected], [email protected], [email protected] b Ludwig-Maximilians-Universität München, Luisenstraße 37, 80333 München, Germany –
[email protected], [email protected], [email protected]
KEY WORDS: M4Land, land management classification system, Sentinel, canopy reflectance model SLC, crop growth model
PROMET
ABSTRACT:
To support food security, information products about the actual cropping area per crop type, the current status of agricultural
production and estimated yields, as well as the sustainability of the agricultural management are necessary. Based on this
information, well-targeted land management decisions can be made. Remote sensing is in a unique position to contribute to this task
as it is globally available and provides a plethora of information about current crop status.
M4Land is a comprehensive system in which a crop growth model (PROMET) and a reflectance model (SLC) are coupled in order to
provide these information products by analyzing multi-temporal satellite images. SLC uses modelled surface state parameters from
PROMET, such as leaf area index or phenology of different crops to simulate spatially distributed surface reflectance spectra. This is
the basis for generating artificial satellite images considering sensor specific configurations (spectral bands, solar and observation
geometries). Ensembles of model runs are used to represent different crop types, fertilization status, soil colour and soil moisture. By
multi-temporal comparisons of simulated and real satellite images, the land cover/crop type can be classified in a dynamically,
model-supervised way and without in-situ training data. The method is demonstrated in an agricultural test-site in Bavaria. Its
transferability is studied by analysing PROMET model results for the rest of Germany. Especially the simulated phenological
development can be verified on this scale in order to understand whether PROMET is able to adequately simulate spatial, as well as
temporal (intra- and inter-season) crop growth conditions, a prerequisite for the model-supervised approach.
This sophisticated new technology allows monitoring of management decisions on the field-level using high resolution optical data
(presently RapidEye and Landsat). The M4Land analysis system is designed to integrate multi-mission data and is well suited for the
use of Sentinel-2’s continuous and manifold data stream.
1. INTRODUCTION
To support food security, information products about the actual
cropping area per crop type, the current status of agricultural
production and estimated yields, as well as the sustainability of
the agricultural management are necessary. Based on this
information, well-targeted land management decisions can be
made. Remote sensing is in a unique position to contribute to
this task as it is globally available and provides a plethora of
information about current crop status.
With the SENTINEL sensor family, a fleet of Earth Observation
(EO) satellites is starting to become available, which will
continuously monitor the land surface at different spatial scales
(10 – 300 m) and with different systems (optical, microwave)
(Berger, 2011). For an optimal translation of this data stream of
different resolutions and wavelength ranges into land
management information, an integrated analysis of the complete
image data stream is required. This can be achieved through
embedding the analysis in a continuous spatial modeling of land
surface processes covering also the intervals between
acquisitions.
In the frame of the M4Land project (Model based, Multi-
temporal, Multi scale and Multi sensorial retrieval of
continuous land management information), a method to derive
products for a sustainable management of the land surface is
being developed. The method combines the full bandwidth of
the spatial information provided by the future SENTINEL series
within a land surface process model to generate spatially
explicit and temporally continuous land surface management
information products, such as dynamic land use, degree of
ecological intensification, irrigation status, calamities etc. The
system uses a dynamic classification of land cover, which is
physically based and without training by a combination of the
reflectance model SLC (Soil-Leaf-Canopy) (Verhoef, 2003) and
(Verhoef, 2007) and the land surface process model PROMET
(Processes of Radiation, Mass and Energy Transfer) (Mauser,
2009).
Figure 1. The M4Land concept, showing the sensors employed
during the development phase as well as in the pre-operational
phase after the SENTINEL launch (Klug, 2014)
The International Archives of the Photogrammetry, Remote Sensing and Spatial Information Sciences, Volume XL-7/W3, 2015 36th International Symposium on Remote Sensing of Environment, 11–15 May 2015, Berlin, Germany
This contribution has been peer-reviewed. doi:10.5194/isprsarchives-XL-7-W3-1-2015
1
This paper explains the M4Land concept and demonstrates it
using time series of high resolution, optical data (RapidEye).
Focus is laid on the principle of the new methodology as well as
on its geographical transferability, for which the model-based
approach is essential. This leads us to calling the methodology a
“model-supervised” classification in contrast to common
supervised or unsupervised classifications. Our assumption is
that when we understand the land surface processes, which
cause crop growth and phenological development as well as the
radiative transfer of the canopy and soils (absorption, scattering
and reflectance) adequately, we are able to simulate satellite
images that are similar to real observations. Using this
technique in an inverse mode we are then able to derive
management information (like decisions on land use or seeding
dates) that cannot be perfectly simulated and therefore rely on
e.g. satellite image information. This synergistic concept shall
be demonstrated in this paper.
2. METHODS
Two types of physically-based models are used in M4Land in an
integrative way, a crop growth agro-hydrological model and a
radiative transfer model for simulating satellite measurements
of reflectances. They are introduced below.
2.1 Crop growth modeling with PROMET
PROMET allows simulating all relevant water and energy
fluxes related to radiation balance, vegetation, soil, snow and
aerodynamic exchange processes on the land surface in a
spatially distributed way. A detailed description of the model
physics and components is given in (Mauser, 2009). The model
results have been validated in different test sites on different
scales (from 5 m to 1 km) with good results (Hank, 2015),
(Migdall, 2009), (Mauser, 2009).
PROMET uses spatial data like soil maps and a digital terrain
model as well as meteorological forcing data as input for hourly
simulations. The meteorological data consists of hourly
information on temperature, precipitation, relative humidity,
wind speed and cloud cover, as offered by national weather
services.
The development of crops is simulated in PROMET
dynamically depending on the environmental conditions
(mainly temperature, radiation and moisture conditions) while
standard farming practices (e.g. seeding and harvest dates) are
taken into account. The growth and accumulation of biomass is
the result of an explicit simulation of photosynthetic processes
based on the Farquhar concept (Farquhar, 1980). The
assimilates are distributed within the canopy depending on the
phenological progress of the different crop types.
The necessary parameterization of the crop types (from which
23 are implemented in PROMET) are kept generic and not
optimized for a specific site, in order to allow for the
geographical transferability of the M4Land approach.
2.2 Radiative transfer modeling with SLC
The used surface reflectance model SLC (Soil-Leaf-Canopy) is
an integrated radiative transfer model for the simulation of top-
of-canopy spectral reflectance. The model consists of a
modified Hapke soil BRDF model, a robust version of the
PROSPECT leaf optical properties model, and the canopy
radiative transfer model 4SAIL2, a two-layer robust version of
SAILH (Verhoef, 2003).
In the M4Land system, SLC is configured to use spectral
configurations and acquisition parameters from the used
satellite sensors (in this case RapidEye), soil spectral properties
(single scattering albedo values for various soil types), as well
as leaf parameters like chlorophyll content, leaf water, leaf dry
matter and mesophyll structure, which can be predefined for
every simulated crop type. SLC also allows to use PROMET
outputs as input, like canopy parameters such as leaf area index
(LAI), leaf angle distribution (connected to phenological
development) and degree of maturity (fraction of brown leaves).
2.3 Satellite data and test site
As test site for a first demo application an agricultural area near
Neusling in Bavaria, Germany, is selected. Land use and crop
type were mapped during the growing season of 2010 for an
area of approx. 4 km by 3 km. Winter wheat, winter barley,
silage maize, potato and sugar beet are the relevant crops in this
region.
A total of 10 almost cloud free RapidEye scenes were available
for the growing season of 2010 (Table 1). With exception of
September 2010, at least one RapidEye image is available for
every month, guaranteeing a good and evenly distributed
coverage of the entire growing season. The satellite images
were resampled to a 20 m grid and an atmospheric correction
was carried out using a MODTRAN Interrogation Technique
(Verhoef, 2003) to retrieve bottom of atmosphere reflectance
values.
March 26th July 11th
April 8th July 31st
May 11th August 21st
June 6th October 12th
June 25th October 22nd
Table 1. List of cloud-free RapidEye images used in the test site
Neusling during the growing season 2010.
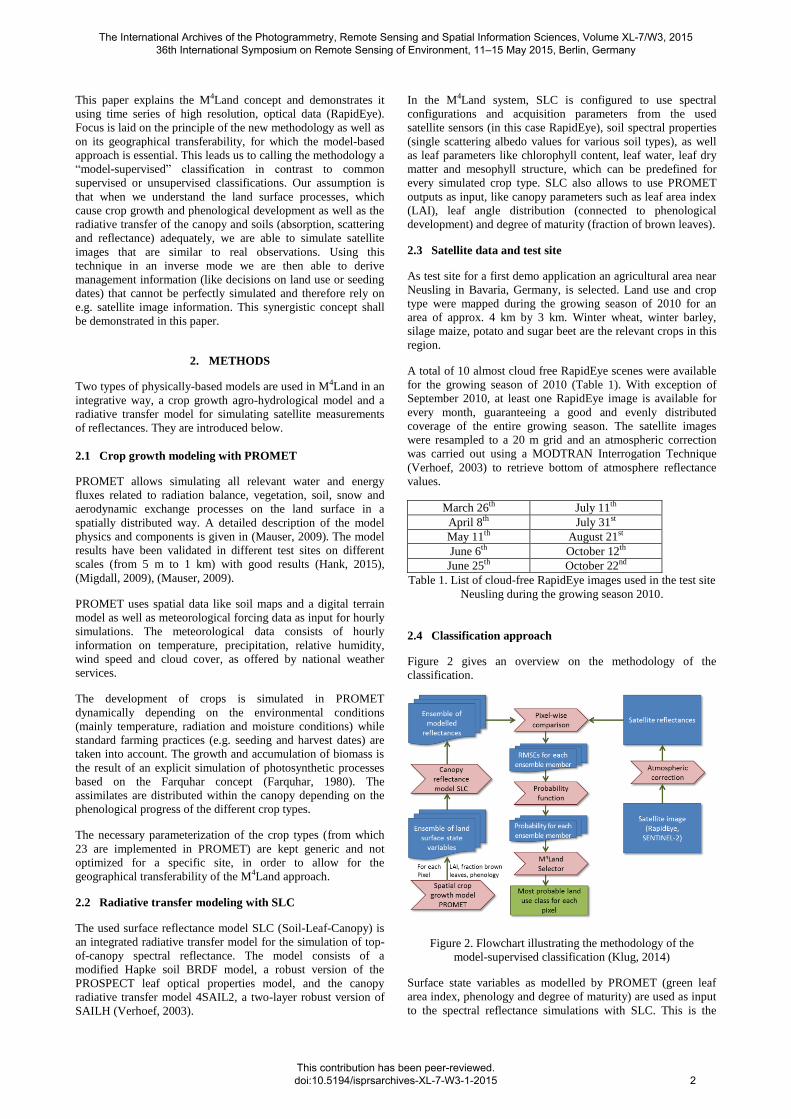
2.4 Classification approach
Figure 2 gives an overview on the methodology of the
classification.
Figure 2. Flowchart illustrating the methodology of the
model-supervised classification (Klug, 2014)
Surface state variables as modelled by PROMET (green leaf
area index, phenology and degree of maturity) are used as input
to the spectral reflectance simulations with SLC. This is the
The International Archives of the Photogrammetry, Remote Sensing and Spatial Information Sciences, Volume XL-7/W3, 2015 36th International Symposium on Remote Sensing of Environment, 11–15 May 2015, Berlin, Germany
This contribution has been peer-reviewed. doi:10.5194/isprsarchives-XL-7-W3-1-2015
2

basis for allowing a pixel-wise comparison of the simulated to
the measured reflectances (after atmospheric correction of
satellite data). The RMSE criterion is used to compare these two
sets of spectral reflectances and is converted into probability via
an arithmetic function (exponential form with a RMSE of less
than 1 assigned a probability of 1, and a RMSE higher than 5 a
probability of 0). The probability thus determines how likely it
is that the respective pixel belongs to a specific land use class.
A multi temporal application of this procedure provides the
most probable land use class for each pixel by averaging the
probabilities in the M4Land selector.
PROMET is used to model the temporal dynamics of state
variables for various crop types in a spatially distributed way.
Figure 3 illustrates such simulation results for the leaf area
index and the crop types of one pixel in the test area and the
investigation period 2010. LAI is selected in this figure, since
this state variable is the most significant factor for the temporal
variation of spectral reflectances on the land surface (in the
absence of snow and flooding). Each crop type in Figure 3
shows a distinctively different temporal pattern of LAI
development that is connected to their phenological
development. These different temporal courses form the
baseline that allows for a model-based multi temporal
classification. In Figure 3 an idealized crop development is
assumed, without nutrient stress and assuming normal
phenological development. In reality, crops are very likely
confronted with nutrient stress at some points during their life
cycle. This can be caused by different fertilization intensities,
but can also be a consequence of poor soil water holding
capacities that lead to insufficient soil moisture. The
phenological development also varies with seeding date, crop
variety, or occurrence of water stress. Accordingly there is a
variability of LAI development in reality that is not yet covered
in Figure 3.
Figure 3. Modelled leaf area index development for the growing
season of 2010 for the crop types in the test site, corresponding
to scenarios with optimal plant development.
In order to consider this variability, the modeling for each crop
type is carried out not only for optimal conditions but also for a
variety of ensemble members (scenarios), in which the nutrition
situation and the pace at which phenological development of the
plants takes place can vary. The results are shown in Figure 4
for maize. Instead of a single curve for the LAI development of
maize a set of possible courses is now provided. Reducing the
nutrition supply of the maize plants, results in a decrease of
biomass accumulation over the growing season and therefore in
a decreased maximum leaf area index. A modified phenological
development pace of the plants shifts the temporal course and
with this also the date of maximum LAI. It can also have an
effect on the harvest date, which is however not the case for
silage maize, since it is harvested before phenological maturity.
Figure 4. PROMET modeled leaf area index development
ensemble for maize for the growing season 2010, with varying
nutrition supply and phenological progress.
The use of scenarios thus allows for the representation of
environmental conditions and management decisions of the
farmer (e.g. fertilization level, crop variety or seeding date)
providing a realistic range of possible land surface
developments for each crop type.
These ensembles of crop developments are further depending on
local meteorological conditions and thus are geographically
variable. They also vary from year to year. This spatial and
inter-annual heterogeneity is again simulated with PROMET,
since the ensemble runs are performed for each individual pixel
and variable meteorological conditions are thus considered.
In PROMET the phenological progress of agricultural crops is
modelled using consecutive growth stages corresponding to the
BBCH phenological classification system (Meier, 2001), a
number system varying from 0 (seeding) to 100 (harvest). How
PROMET is able to simulate geographical variations of
phenological development is illustrated for model results for
Germany in Figure 5. A point in time is selected (5th August
2014) when phenology of maize can range in Germany from
leaf development to maturation. Accordingly also the temporal
LAI development courses will strongly vary throughout
Germany.
Figure 5. Simulated phenological stages for maize in Germany
for the 5th August 2014 illustrating the heterogeneity of
crop development (blue spot indicates location of Neusling)
0
1
2
3
4
5
03.2010 04.2010 05.2010 06.2010 07.2010 08.2010 09.2010 10.2010 11.2010
LAI s
imu
late
d w
ith
PR
OM
ET
Winter wheat Winter barley Maize Potato Sugar beet
The International Archives of the Photogrammetry, Remote Sensing and Spatial Information Sciences, Volume XL-7/W3, 2015 36th International Symposium on Remote Sensing of Environment, 11–15 May 2015, Berlin, Germany
This contribution has been peer-reviewed. doi:10.5194/isprsarchives-XL-7-W3-1-2015
3

3. RESULTS
3.1 Analyses of the transferability of the model-supervised
approach
First the quality of the PROMET simulations shall be validated
and their capability to adequately simulate the spatial and
temporal patterns of crop growth. For this demonstration the
phenological development for maize is selected. The first
question is how well the intra-seasonal and inter-seasonal trends
can be modelled.
For this we use in-situ measurements of phenology from 108
fields distributed over Germany that are provided by the
German Weather Service DWD. To study the inter-annual
variation, 4 years (2011 to 2014) were chosen. These in-situ
observations are then compared with PROMET model results of
the respective region. First averages of all fields were calculated
for each year and related to the multi-annual average to
understand how years can vary. These analyses based on the
DWD observations are illustrated in Figure 6 as solid lines and
compared to PROMET results (dashed lines).
Obviously 2011 showed Germany-wide a retarded phenological
development of up to 7 days delay at stem elongation that is
slowly caught up until ripening. This course is similarly
simulated in PROMET. The accelerated phenological
development of 6 days in 2013 is also simulated in PROMET
but to a lesser degree. 2012 and 2014 are similar to the average,
which is also depicted in the simulations. On average,
measurements and simulated only differ by one day.
Figure 6. Validation of simulated phenological development of
maize using in-situ measurements of the German Weather
service DWD (averages over all 108 sites in Germany)
This validation on Germany-wide averages helps to study
seasonal trends and inter-annual variations. Obviously both are
well captured in the simulations. Another option is to compare
the date of occurrence of a certain phenological state in
measurement and simulation. This is illustrated in Figure 7 for
all measurements of the 4 considered years and all 108 fields. It
is evident that there is a very high concurrence. The points
scatter very close around the 1:1 line. The Root Mean Square
Error (RMSE) amounts to 10.9 days. This RMSE can be
interpreted as the variability of the phenological development
that is connected to management decisions of the farmer
(seeding dates and crop variety for example) or local soil
conditions (water stress leads to accelerated ripening).
Figure 7. Simulated and measured dates (day of year DOY) of
reaching a certain phenological stage for maize during the years
2011 to 2014.
3.2 Model-supervised classification of the Neusling test site
Results of the M4Land concept are presented for the Neusling
test site in Bavaria. For the crop type classification the 10
RapidEye images of Table 1 were used. For each date of
satellite acquisition, for each possible crop type and for each
ensemble member spectral reflectances were simulated using
SLC and the land surface state variables as provided by
PROMET. These simulated spectral signatures can now be
compared to the satellite measurement.
In a first step within one land use class the one ensemble
member with the closest match with satellite derived spectrum
is selected. An example for this step is illustrated in Figure 8. It
shows, for a representative RapidEye acquisition date, the
spectrum of each land use class for the most probable scenario
in comparison to the RapidEye spectrum of one pixel. In this
example the simulated spectrum of a maize pixel shows the
closest congruence to the measured RapidEye spectrum. In
order to quantify the match the RMSE criterion is used and the
RMSE is transferred into a probability that ranges from 0 to 1.
Figure 8. Comparison of a RapidEye observed spectrum (green)
of one pixel on 21th of August 2010 with modelled spectra
(black) for different land cover classes
50
100
150
200
250
300
350
50 100 150 200 250 300 350
day
of y
ear
PR
OM
ET s
imu
lati
on
day of year DWD phenological measurement
The International Archives of the Photogrammetry, Remote Sensing and Spatial Information Sciences, Volume XL-7/W3, 2015 36th International Symposium on Remote Sensing of Environment, 11–15 May 2015, Berlin, Germany
This contribution has been peer-reviewed. doi:10.5194/isprsarchives-XL-7-W3-1-2015
4

The probabilities for each land use class and each acquisition
date are aggregated by averaging the probabilities over all
available image dates during the growing season. Figure 9
shows the aggregated mean probabilities of all crop types for
the same pixel used in Figure 8. The probability for each
acquisition date is calculated as the mean of all probabilities of
the earlier acquisition dates including the current acquisition
date. At the end of the growing season, the pixel is finally
classified as the crop type with the highest aggregated
probability. In our case it is maize. This is identical to the crop
type that was mapped in the field.
Figure 9. Aggregated probabilities for all modelled crop types
of one maize pixel over the whole growing season of 2010.
Grey vertical lines indicate satellite acquisitions.
The methodology demonstrated above for one pixel is repeated
for each pixel in the satellite image. One of the intermediate
outputs are simulated artificial satellite images that show the
spectral reflectances with the best match to the EO data. For
three selected dates these artificial images are compared with
the measured satellite images in Figure 10. A false colour
presentation was chosen with the green band in blue, the red
band in green and the near infrared presented in red colour.
The images almost cover the whole crop cycle and illustrate
well the high temporal dynamics of the spectral reflectance of
agricultural areas. In the SLC simulation the soil reflectance is
not assumed to be fix, however a soil background reflectance is
selected pixel-wise from a set of typical soil spectra. Also the
surface moisture of the soils that change the soil brightness is
allowed to vary. This concept makes it possible to adequately
simulate the soil reflectance and its effect on the canopy
reflectance. Thus negative impacts on the classification
accuracy can be avoided. This is also evident in the high
correspondence between simulated and measured images in
Figure 10.
Figure 11 shows the resulting crop type map from the multi-
temporal analyses. All pixels are classified with the most
probable land cover class by the M4Land framework. If the
highest average probability is below a threshold of 70 %, pixels
are left unclassified. They mostly occur in built-up areas and
few fields that obviously are not sufficiently represented in the
model setup.
The classification results were not filtered in order to be able to
allow a fair evaluation of the model-supervised approach. The
map reveals that most fields are uniformly classified. Only few
fields share several different land cover classes, hardly any
more than two.
Quantitative validation of the resulting land cover / crop type
map was performed by pixel-wise comparing the classification
with the mapped land use. A confusion matrix was created that
allows the analysis of the product accuracy (see Table 2). The
User’s accuracy indicates how many pixels of a classified land
cover class have actually been classified correctly, while the
Producer’s accuracy indicates how many pixels of the mapped
land cover class have been classified correctly. User’s and
Producer’s accuracies are both high. Mis-classifications occur to
a larger extent for potato fields that were misinterpreted as
maize or sugar beet. Winter wheat classification was almost
100 % correct, however some of the winter wheat fields were
assigned winter barley which reduced the Producers’accuracy
for winter wheat to 88 %. The overall accuracy of the achieved
land cover map of the whole area is 85 %, which can be judged
very high for an unsupervised autonomous methodology.
Table 2. Confusion matrix based on the comparison of
in-situ-mapped and modelled land cover maps.
0%
10%
20%
30%
40%
50%
60%
70%
80%
90%
100%
03.2010 04.2010 05.2010 06.2010 07.2010 08.2010 09.2010 10.2010 11.2010
Agg
rega
ted
Pro
bab
ility
Winter wheat Winter barley Maize Potato Sugar beet
Winter
wheat
Winter
barleyMaize Potato
Sugar
beetTotal
Users's
accuracy
Winter wheat 3 249 8 3 2 0 3 262 100%
Winter barley 269 305 0 0 0 574 53%
Maize 8 1 1 354 293 113 1 769 77%
Potato 169 4 42 1 082 288 1 585 68%
Sugar beet 0 0 17 272 2 481 2 770 90%
Total 3 695 318 1 416 1 649 2 882 9 960Producer's
accuracy 88% 96% 96% 66% 86% Overall 85%
GROUNDTRUTH
CLA
SSIF
IED
The International Archives of the Photogrammetry, Remote Sensing and Spatial Information Sciences, Volume XL-7/W3, 2015 36th International Symposium on Remote Sensing of Environment, 11–15 May 2015, Berlin, Germany
This contribution has been peer-reviewed. doi:10.5194/isprsarchives-XL-7-W3-1-2015
5

Figure 11. Land cover map derived by the model-supervised classification approach of assigning crop types to the
highest average probability at the end of the growing season in 2010.
Figure 10. Real (left) compared with simulated (right) satellite images for selected dates during the growing
season.
Winter wheatWinter barleyMaizePotatoesSugar beetunclassified
0 1km 2
The International Archives of the Photogrammetry, Remote Sensing and Spatial Information Sciences, Volume XL-7/W3, 2015 36th International Symposium on Remote Sensing of Environment, 11–15 May 2015, Berlin, Germany
This contribution has been peer-reviewed. doi:10.5194/isprsarchives-XL-7-W3-1-2015
6

4. CONCLUSIONS AND OUTLOOK
The feasibility of the M4Land concept has been successfully
demonstrated. The model-supervised approach is able to
dynamically classify multi-temporal RapidEye images based on
physical and physiological principles and without training. It
uses a combination of the reflectance model SLC and the land
surface process model PROMET. The classification results have
a high overall accuracy of 85%.
The fact that most fields are uniformly classified even though
the M4Land approach works pixel based and no post processing
of the land cover product is performed, suggests that the model-
supervised land cover classification is quite robust.
In a next step, the classification performance will be checked
for other regions in Germany. Also several years shall be
classified in order to allow the monitoring of the cropping cycle.
It is further targeted to derive additional land surface
management information products such as intensity of
agricultural production, irrigation status or calamities using the
ensemble information.
The M4Land system shall also be extended to natural
environments in a mesoscale setup. Demonstrations in
climatologically different areas are currently performed. The
generic character of the M4Land approach will also allow for
the extension towards the use of other satellite data apart from
high resolution optical data (e.g. lower resolution optical or
SAR data).
The required preprocessing chains for the inclusion of current
and near-future optical Earth Observation Systems are already
available within the M4Land system, so that for example the
SENTINEL data sets will be integrated as soon as they become
available.
The M4Land framework is designed to allow for an efficient
handling of the rich data-stream of SENTINEL data that will
soon be available. It therefore enables a continuous monitoring
of non-linear processes at the land surface.
ACKNOWLEDGEMENTS
This work was funded by the German Federal Ministry of
Economics and Technology through the Space Agency of the
German Aerospace Center (DLR) (Grant code: 50 EE 1210).
RapidEye data was kindly provided by ESA as Third Party
Mission. Meteorological data was provided by DWD.
REFERENCES
Berger, M., Moreno, J., Johannessen, J. A., Levelt, P. F. &
Hanssen, R. F., 2012. ESA's sentinel missions in support of
Earth system science. Remote Sensing of Environment. 120, pp.
84-90.
Farquhar, G. D., von Caemmerer, S. & Berry, J. A., 1980. A
biochemical model of photosynthetic CO2 assimilation in leaves
of C3 species. Planta, 149(1), pp. 78-90.
Hank, T., Bach, H., Mauser, W., 2014. Using a remote sensing
supported hydro-agroecological model for field-scale simulation
of heterogeneous crop growth and yield: application for wheat
in Central Europe. Remote Sens. 2015, 7, doi:10.3390/rs60.
Klug, P., Schlenz, F., Hank, T. B., Migdall, S., Bach, H.,
Mauser, W., 2014. Generation of continuous agricultural
information products using multi-temporal high resolution
optical data in a model framework – The M4Land project. ESA
Special Publication SP-726, Frascati (Italy), Proceeding,
published.
Mauser, W., Bach, H., 2009. PROMET – Large scale
distributed hydrological modeling to study the impact of climate
change on the water flows of mountain watersheds. J. of
Hydrology, 376, pp. 362-377.
Meier, U. 2001. Growth Stages of Mono- and Dicotyledonous
Plants; Federal Biological Research Centre for Agriculture and
Forestry: Braunschweig, Germany
Migdall, S., Bach, H., Bobert, J., Wehrhan, M., Mauser, W.
2009. Inversion of a canopy reflectance model using
hyperspectral imagery for monitoring wheat growth and
estimating yield. Precision Agriculture, DOI 10.1007/s11119-
009-9104-6, 2009.
Verhoef, W., Bach, H., 2003. Simulation of hyperspectral and
directional radiance images using coupled biophysical and
atmospheric radiative transfer models. Remote Sensing of
Environment, 87, pp. 23-41.
Verhoef, W., Bach, H., 2007. Coupled soil–leaf-canopy and
atmosphere radiative transfer modeling to simulate
hyperspectral multi-angular surface reflectance and TOA
radiance data. Remote Sensing of Environment, 109, pp. 166-
182.
The International Archives of the Photogrammetry, Remote Sensing and Spatial Information Sciences, Volume XL-7/W3, 2015 36th International Symposium on Remote Sensing of Environment, 11–15 May 2015, Berlin, Germany
This contribution has been peer-reviewed. doi:10.5194/isprsarchives-XL-7-W3-1-2015
7