THE GEOSTATIONARY OPERATIONAL ENVIRONMENTAL SATELLITE DATA COLLECTION SYSTEM
DOCUMENT 1.2.
SATELLITE DATA COLLECTION SYSTEMS
HYDROLOGICAL APPLICATION
Michel TAILLADE-CARRIÈRE
Head of Service ARGOSCentre National d'Études Spatiales
Toulouse. FRANCE

50
SUMMARY
CEFIGRE - Sl:MINAIRE Tl:Ll:TRANSMISSION
In the first section, after a rapid definition of data collection by satellite, the authorreviews the principal systems created since 197I and compares the two types, geosynchronous and low polar orbit.The second portion of the document concerns the application of these systems tohydrology. Using programs in the United States as an example, the author presentsthe different kinds of needs and the measures taken .. he lists the principal technical elements necessary to compare, in these data collection sites, the possibilitiesoffered by each of the two satellite systems.Finally by looking at two large North American users, the author demonstratesresearch and applications already developed in Canada and the U.S.A. for use inhydrology of data collection by satellite.
RESUME
Dans une première partie, après une rapide définition de la collecte de données par satellite,l'auteur passe en revue les systèmes réalisés depuis 1971, puis fait une comparaison entreles deux principaux, c'est-à.<fire les systèmes géostationnaires et ceux à orbite basse.La deuxième partie du document traite de l'application de ces systèmes à l'hydrologie.S'appuyant sur l'exemple des États-Unis, l'auteur introduit les différents types de besoinset les mesures effectuées .. il fournit les principaux éléments techniques nécessaires pourjuger, sur des exemples de stations de mesures, des possibilités de l'un ou l'autre des deuxsystèmes.Enfin, à partir des exemples de deux grands utiliillteurs Nord Américains, l'auteur montreles recherches et les applications déjà réalisées dans ces pays pour l'utilisation en hydrologiedes systèmes de collecte de données par sateilite.

CRM - S - 09 - TAILLADE-CARRIERE
1. DATA COLLECTION DESCRIPTION
51
In a satellite data collection system, parameters such as temperature, pressure or othervariables are sensed at the platform (in situ or direct sensing) and the data encoded, formatted and transmitted to processing facilities via a satellite communications link.
Satellite data collection can be described by several characteristics :• the technique is used to monitor unattended sensory platforms via telecommu
nications,• in situ data is collected data rather than remotely sensed data of the type obtai
ned from radiometers or multispectral scanners,• the systems employ large quantities (hundreds...) of low cost ($ 5,(00) plat
forms,• the platform message durations are short (32 to 1000 bits),• position location can be accomplished by the measurement of Doppler effect
or the measurement of range,• the systems are compatible with both low and geostationary orbits ; thus
possibly offering near real time or real time data as needed.
Many of the applications involve both the tracking of moving platforms (weather balloons,buoys, ice islands, wild animals) as weil as the collection of data from fixed sites (mooredbuoys, water survey stations, volcano surveillance stations...). .
In operation, data is relayed from the remote platforms to a satellite either randomly orupon interrogation commandoData can be stored aboard the satellite for readou t over a central receiving site or can berelayed directly to a control processing facility or to a local regional user terminal. Oncedata is received on the ground, information is formatted and disseminated to users. In thecase of position location, the coordinates are computed and disseminated to the useralong with thecollected sensory information.
2. REVIEW OF EARLY AND PRESENT SYSTEMS
2.1. VARIOUS DATA COLLECTION SYSTEMS
Several systems and techniques have been developed and tested, and others are plannedfor future launch. Figure 2.1. shows a decision tree for distinguishing various datacollection systems.
2.2. INTERROGATION, RECORDING AND LOCATION SYSTEM (IRLS)
The major elements of the system (figure 2.2.) are:• a central ground processing facility
... a satellite carrying receiving equipment• the remote platforms
In operation unique addresses or codes identifying the platforms were programmed intothe satellite [rom a ground acquisition facility at the beginning of each orbit.

• IRLS NIMBUS 3 1979 USANIMBUS 4 1970 USA
IlI'.TA AND ID.::ATICtl EDIE 1971 FRAU:E
RAMS • TI'lERLE NIMBUS 6 1975 USA
IDII ALTI'IUDERI\NDCM
1978ARCnS TIRœ N1 000 J<M " N)M A 1978 USA
" w ... w ... and" N)M G 1985 FRlIlO:
ORDEREll
IlI'.TA CNLY
pomrs 'ID POINl' RI\NDCM ERI'S 1 1972 USA
<:nMlNICATICNS L'lNDSAT USA
OIlDEREllATS1-ATS3 1968l' OPLE USA
IlI'.TA AND ID.::ATICtl
RI\NDCM
SYtOIRNXlS ORDERED SMS 1 1974 USA36 000 J<M
IlI'.TA CNLY 1SMS 2 1975 USAGOES 1 1976 USA
1 SEI:F~ ME:l'EDSAT 1978 ESA<MS 1977 JAPJ\N
Data transmission
Fig. 2.1. -- Various data collection systems
Systems
IRLSRA MSlWERLENOAAERISAISOPLESMSGOESGMS
Interrogation, Recording and Location SystemRandom Access Measurement SYstemTropical Wind Energy Conversion and Reference ExperimentNational Oceanic and Atmospheric AdministrationEarth Research Technology SatelliteApplications Technology SatelliteOmega Position Location Equipment SystemSynchronous meteorological SatelliteGeostationary Operational Environmental SatelliteGeostationary Meteorological Satellite System
ORDERED
SELF-T1ME
RANDOM
upon receipt of a command transmitted via the satellitefrom a ground stationat pre-established intervals under control of an internaiclockat random times at a rate of once per 100 to 200 seconds
'"N
ntT1"Ti
fi;:tltT1
1Vlm;s:Z;l>
~m....,mtm....,;:tl;l>ZVl;s:v;Vl
oz

CRM - S - 09 - TAILLADE-CARRIERE 53
WEATHERSTATION
~~-:i~~,~B~~ ~~~~-- - -::::=-> Fig. 2.2. - IRSLConcept
t;l~ -- ..........-~ USA N!mbus 3 1969~ _ -----.::::::, Nimbus 4 1970
AC~~~~~~ ... ~------:=:--- FRANCEEole 1971-1974AND COMMAND ~ ç-~~ (ReL 5)
STATION :s-:::==- r-
As orbital time elapsed the platfonns were interrogated at predetennined times and thereceived data was stored aboard the satellite for retransmission to the ground facilityat the end of each orbit. Position location was accomplished by a ranging technique with aminimum of two interrogations or range measurements required for each platfonn.
The IRLS was the first global satellite system that demonstrated the worldwide capabilities of satellite data collection. The IRLS and EüLE were ordered system that utilizedreceivers on the platform to initiate the platfonn transmission to the satellites. This resultedin substantial cost, size and power consumption requirements for these platforms..
2.3. RANDOM ACCESS DATA SYSTEM
The data collection system developped for the Landsat satelliteseries was the first random accesssystem. In this system, platfonnstransmit their sensory infonnationto the satellite randomly. Theshort duration transmission initiated by platform timers al10wsmultiple platfonns to be serviced (capacity for 2000 platformssimultaneously in the satellite fieldof view with a 95 % probabilityof data collection from eachplatfonn). The Landsat DCS usesan UHF uplink from platfonns tothe satellite while the data receivedby the satellite is retransmittedimmediately on a S band downlink to the ground tenninal. Fig. 2.3. - Landsat data
collection system(ReL 5)
ERTSSPACECRAFT
SYSTEM(DCS REC ANT.)(DCS RECEIVER)
GROUND STATIONuse RECEIVER
RECEIVING snEQUIPMENT
USER

54 CEFIGRE - slôMINAIRE TlôLlôTRANSMISSION
2.4. RANDOM ACCESS DATA COLLECTION AND LOCATION SYSTEM
«RAMS» system using the multiple access technique was developped to support theTropical Wind Energy conversion and Reference Level Experiment (Meteorological Experiment with approximately 400 balloons). RAMS carried by the Nimbus F satellite waslaunclted in 1975 and is still in operation. RAMS pennits global scale experiments to beperformed utilizing low cost, simple data collection platform equipment.
The platforms transmit a one-second message to the satellite at random times at the rateof once per minute.The satellite records a Doppler frequency measurement and a time tag and fonnats thereceived data. This information is stored aboard the satellite for readout over theFairbanks, Alaska, ground station and transmission for processing.The position location coordinates of each platform are computed and the data istransmitted to investigators.Another application, as shown in fig. 2.4., used the OMEGA system to derivevertical profiles. The Carrier Balloon System (tested in 1975) involved large balloonscarrying dropsondes commanded via SMS satellite.
As the sondes were released, they received and relayed the OMEGA signais to the largeballoon for retransmission to a processing center via SMS satellite (geosynchronous).The phase measurements derived from the sondes during descent were used to computethe vertical wind profile from 20 mb levels to the surface.The position of large balloons were known using RAMS/Nimbus Flow altitude satellite.
NIMBUS FRANDOM ACCESSMEASUREMENTSYSTEM (RAMSI
Fig. 2.4. - Nimbus F. RAMS System (ReL 5)

CRM - S - 09 - TAILLADE-CARRJERE
2.5. ORDERED SYSTEM WITH SELF TIME CAPABILITY
55
'
The SMS data collection system is.: principally an ordered system with.,~r the interrogations initiated by com-
'(\1. ---- SMS mand.___ 6,O~ ~'(\1. --- Interrogated DCPs transmit their~ 6,0'0 "/ data upon receipt of a unique
~>(:o.'\; / address command transmitted via~ 'i\)\)~ ~>(:o.'\; the satellite from the ground
'/\.'1-\)~ station.
go' go' YI /' A1arrn DCPs transmit an alarmDCP'S signal when their sensors exceed
a specified threshold value. Uponreceipt of this alarm signal, the
CDA ground station will interrogate thehg, 2.5, SMS System (ReL 5) platforms to obtain the actual data.
A self-timed capability allows transmissions at pre-established intervals under controlof an internai dock (self·timed DCPs).The system has a UHF platforrn to the satêllite link and data is received at the groundthrough an S band downlink. The system is intended for non-moving applications andcan handle 10,000 platforms.
2.6. COMMERCIALSYNCHRONOUS SATELLITE DATA COLLECfION PROJECf
ln 1977, Comsat General Corporation(USA)engaged in a joint developmentprograrn with the US Geological Survey(USGS) and Telesat CANADA to collect environmental data via satellite.This prograrn represented the first useof present-day commercial satellitecommunications technology to im·prove the management of resourceson earth.Under a six-month evaluation program.Comsat erected 15 self-timed, datacollection platforms.The DCPs automatically transmitteJthe data (mainly hydrological) in random bursts via Anik satellite operatedby Telesat CANADA to control receiving and distribution points. Fig. 2.6. - Comsat cxpcriment (ReL Il)

NO POSITION LOCATION 1971 1972 1973 1974 1975 1976 1977 1970 1979 1900 1981 1982 19l1) 1984
USA ERl'S-LANDSAT LOW ALT A.. .~. --- -- --1 1
2 j ood.. =oo',ou"oo1
USA SHS - GOES (synchronous) (operational) 11\ l' A A
1 ·A B C
ESA HETEOSAT (synchronous) 1\
JAPAN GHS (synchronous)
1 1 spare 1 )
LI......!------.!pare1 >
USA COHMEIlCIALEXp'er' m'ent
POSITION LOCATION
FRANCE EOLE A low altitude ,
1 1AUSA NHlDUS/RAHS low altitude
1 1 1 ~ under construction~M TIROS N / NOM (operational) low altitude A
FRANCE ARGOS
Table 2.7. - DATA COLLECTION MISSIONSTwo satellite data collection systems will be operational after 1978
• GOES System (still operational [rom 1976)• T1ROS N / ARGOS System
v.cr--
n~Ci::cr.I1
enm:s::Z>~r.I...,mr-'m;d>Zen:s::v:enÔZ
CRM - S - 09 - TAILLADE-CARRIERE
2.7. LAUNCH SCHEDULE OF DATA COLLECTION MISSIONS
57
In table 2.7. a launch schedule of early, present and up-<:oming data collection missionsis shown. The systems are grouped on the basis of data collection only and data collectionwith position location.
Assuming a three-to-five-year lifetime for the synchronous missions and two years for thelow altitude, two major operational programmes appeared after 1978.
• GOES programme with eight spacecraft which have been approved to data :- 5 launched successfully- 3 under construction
• TIROS N / NOAA / ARGOS programme with eight spacecraft which have beenapproved to date :
the -first on launched in november 1978,the second in Mai 1979,6 others under construction.
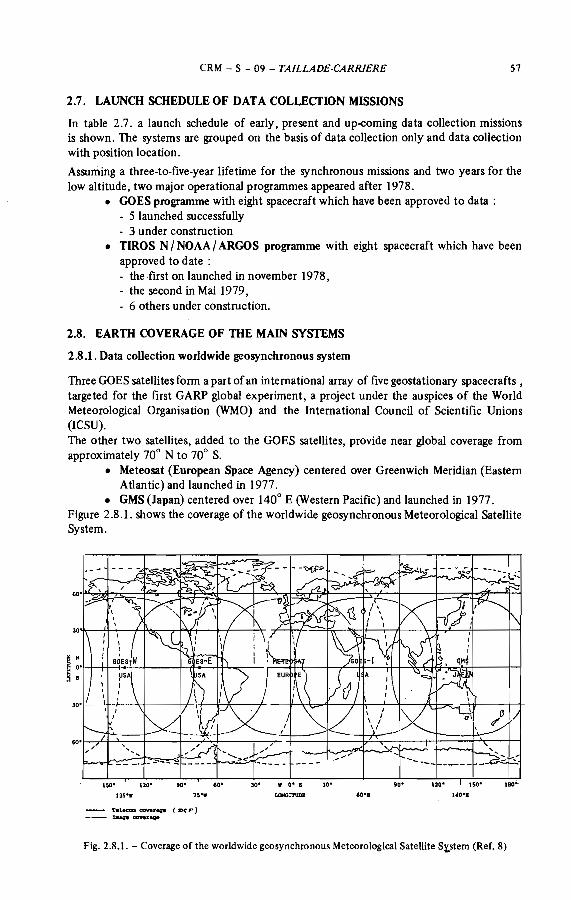
2.8. EARTH COVERAGE OF THE MAIN SYSTEMS
2.8.1. Data collection worldwide geosynchronous system
Three GOES satellites form a part ofan international array of five geostationary spacecrafts ,targeted for the first GARP global experiment, a project under the auspices of the WorldMeteorological Organisation (WMO) and the International Council of Scientific Unions(ICSU).The other two satellites, added to the GOES satellites, provide near global coverage fromapproximately 70° N to 70° S.
• Meteosat (European Space Agency) centered over Greenwich Meridian (EasternAtlantic) and launched in 1977.
• GMS (Japan) centered over 140° E (Western Pacifie) and launched in 1977.Figure 2.8.1. shows the coverage of the worldwide geosynchronous Meteorological SatelliteSystem.
75"
-- Telecaa aoveraQ'. (Z\'C p)-- IalujJe cowrAVe
LONGI'I'\lIlB 140"1
Fig. 2.8.1. - Coverage of the worldwide geosynchronous Meteorological Satellite S~stem (ReL 8)

58 CEFIGRE - SIOMINAIRE TIOLIOTRANSMISSION
2.82. NOAA/ARGOS low orbit operational system
The eight satellites will be launched successively in such a way as· to keep two of themsimultaneously on orbit.The two satellites provide a worldwide converage for data coIlection and location.
2.9. CONCLUSION
Since May 1979, two major data collection sateIlite systems are available .• Geosynchronous system (data coIlection ONLY)
with four satellites simultaneously on orbit providing near global coverage.- 2 operadonal GOES [Fig. 2.9. (l)]- 2 other satellites :
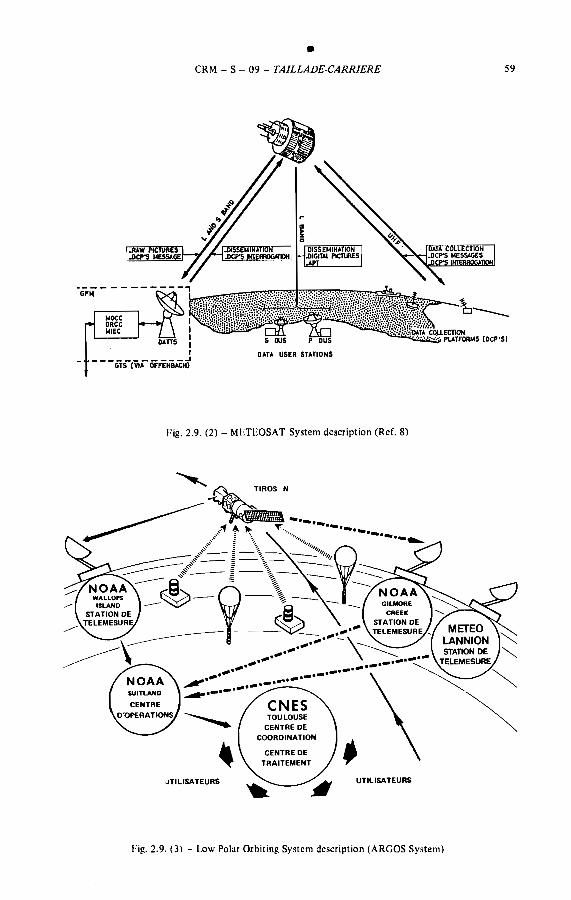
- METEOSAT- GMS [Fig. 2.9. (2)]
• Low Polar Orbiting System (data collection and location)with eight TIROS-N / NOAA / ARGOS satellites providing an operational systemfrom the end of 1979 to 1986 at least (Fig.2.9. (3) and 2.9. (4)].
Fig. 2.9. (1) - GOES/ DCS system description (ReL 7)
•CRM - S - 09 - TAILLADE-CARRIERE 59
11111_ ___________ ..J
GTS CVIA OfFENBACN)
DATA USER STATIONS
Fig. 2.9. (2) - METEOSAT System description (ReL 8)
Fig. 2.9. (3) - Low Polar Orbiting System description (ARGOS System)
60 CEFIGRE - seMINAIRE TeleTRANSMISSION
TI' lE RIAL BIT STREAM13208"10 FRAMESISEC
Ta DIRECT REAOOUTTif IlATlONS
f
VIIFTRANSMIITER
PLAYBACK
140 X l'UOUPI
HRn BERIAL BIT ITREAMCONTINUOUS 885 400 BPI
'FRAMES/SECTa alRECT REAOOUT
HRn STATIONS
rAll DATA MTLAND TOULOUSE
CO-.A.ND& MARYLAND, USA FRANCEDATA ACOUISITION
STATION IPACECRAFT DATAICOAI OPERATIONAL PROCESSINO
AROO' ARGOS r---DATA DATAGllMORE ALASKA, USA CONTROL _SYSTEMOR eENTER IDPlSI .. rROCESSINO
WALLOPS 'S. VA., USA IIOCCI ORBIT CENTERINfORMA TlON
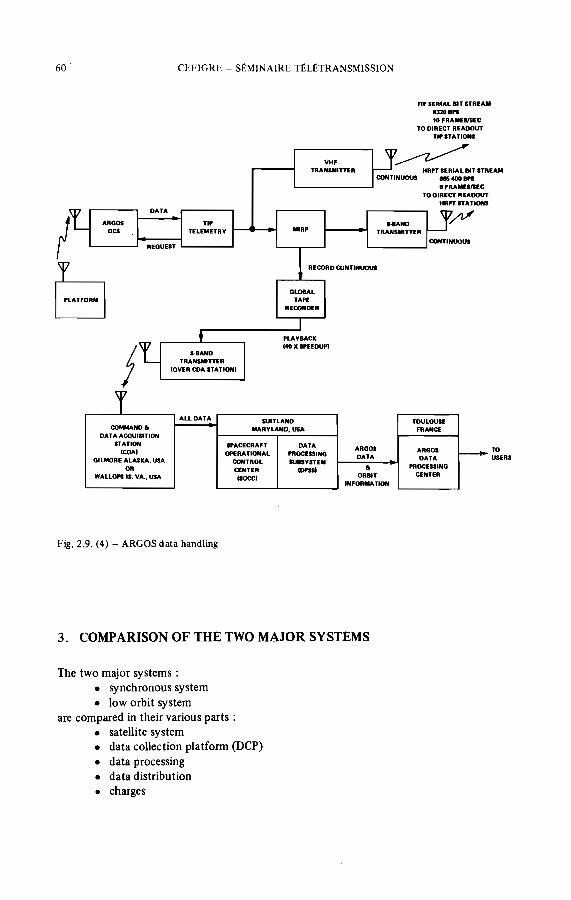
Fig. 2.9. (4) - ARGOS data handling
3. COMPARISON OF THE TWO MAJOR SYSTEMS
The two major systems:• synchronous system• low orbit system
are compared in their various parts:• satellite system• data collection platform (DCP)• data processing• data distribution• charges
tDUIlRI

CRM - S - 09 - TAILLADE·CARRIERE 61
GEOSYNCHRONOUS SYSTEM
3.1. SATELLITE SYSTEM
LOW ORBIT SYSTEM
Name and authority in charge
. GOES NOAA (USA)
. METEOSAT ESA- GMS [MA and NASDA
Geostationary, equatorial orbitAltitude 36 000 km
NASA (USA)NOAA (USA)
. TIROS N/ARGOS CNES (France)Service ArgosToulouse, France
Satellite orbit
1
Near polarAltitude 830 km
Eight satellites programme2 satellites simultaneously on orbit(each one able to assume the data collection operation)
ln orbit redundancy
GOES System: Operational with two space· Operational system (I978-1985)craft on orbit
75° W longitude135° W longitude
3 others satellites planned
METEOSAT : Pre.operationnalOne flight unit: 0° longitudeOne spare
GMS : Pre-operationnalOne flight unit: 140° E longitudeOne spare
Earth
Near global 70° N to 70° S with the wholesystem. See figure 2.8.1. for individual sa·tellite coverage
coverage
Each satellite provides a global coverage
Data collection
10,000 DCP per satellite
OrderedSelf.timed
Capability
1 Data collection and location
DCP capacity
16,000 DCP for the system
Data collection access type
Random
On demand (interrogate)Per 3-6 hours (self·timed) or less
DCP reporting
When data collection platform is visiblefrom one satellite (7 times a day at theequator to 28 times per day at the poles).
62 CEflGRE - SEMINAIRE TELETRANSMISSION
GEOSYNCHRONOUS SYSTEM LOW ORBIT SYSTEM
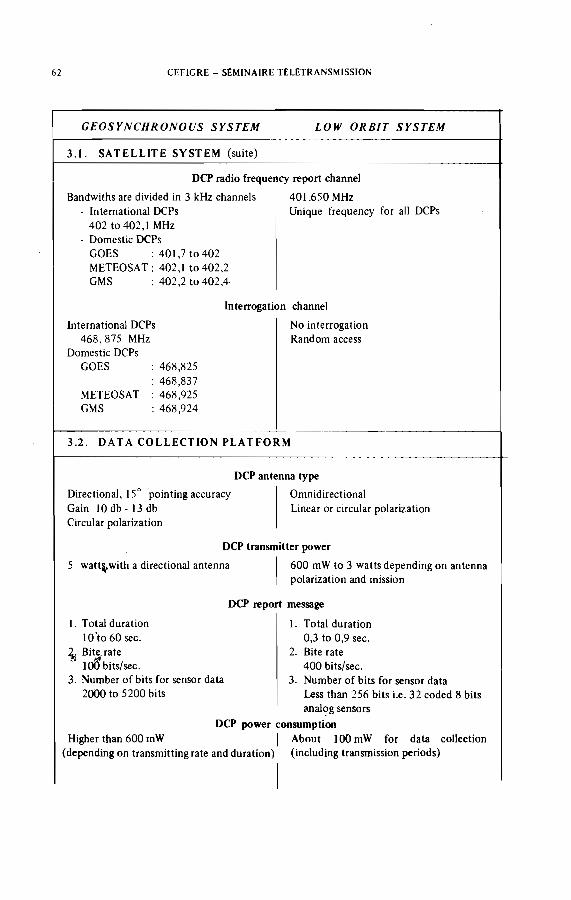
3.1. SATELLITE SYSTEM (suite)
DCP radio frequency report channel
Bandwiths are divided in 3 kHz channels 401.650 MHz. International DCPs Unique frequency for ail DCPs
402 to 402,1 MHz. Domestic DCPs
GOES : 401,7 to 402METEOSAT: 402,1 to 402,2GMS : 402,2 to 402,4
Interrogation channel
No interrogationRandom access
: 468,825: 468,837: 468,925: 468,924
METEOSATGMS
International DCPs468,875 MHz
Domestic DCPsGOES
3.2. DATA COLLECTION PLATFORM
Directional, 15° pointing accuracyGain IO db . 13 dbCircular polarization
DCP antenna type
OmnidirectionalLinear or circular polarization
DCP transmitter power
5 watt~with a directional antenna 1 600 mW to 3 watts depending on antennapolarization and mission
1. Total duration10 'to 60 sec.
~' Bite. rate_. 14
100 bits/sec.3. Number of bits for sensor data
2000 to 5200 bits
DCP report message
1. Total duration0,3 to 0,9 sec.
2. Bite rate400 bits/sec.
3. Number of bits for sensor dataLess than 256 bits i.e. 32 coded 8 bitsanal?g sensors
DCP power consomptionHigher than 600 mW 1 About 100 mW for data col1ection
(depending on transmitting rate and duration) (including transmission periods)

CRM - S - 09 - TAILLADE-CARRIERE 63
GEOSYNCHRONOUSSYSTEM LOW ORBIT SYSTEM
3.2. DATA COLLECTION PLATFORM (suite)
• parallel digi talseriai digitalanalog
3.3. DATA PROCESSING
DCP sensor inputs
- parallel digi talseriai digital
- analog
GOES
The sensor outputs are converted to anASCII coded seriai message by the DCPfor transmission to the satellite.Once the message is received the dataprocessing system :- checks for the correctness of the
platforms address- examines for error cond.itions- stores the message on disk in an area
allocated to the User (or owner)platform.
system
The sensor ou tpu ts are converted into abinary coded seriaI message by the OCPfor transmission to the satellite.Once the message is received the dataprocessing system :
checks for the correctness of theplatform address and errors conditionsprocesses the data according to theUser's need
Three types of processing are available inincreasing order of complexity :
coding of sensor data in decimal, octalhexadecimal, BCDconversion into physical parametersusing the calibration curve of eachsensor with possibility of inside-outsideIimits checkingspecial processing (each one must bediscussed separately)
The results of sensor data processing(and also location if needed) are brokendown into «experimenters fIles» andstored.
Time delay for disponibility of the results(at the processing center)
Near real time between measurement and 1 Between 2h to 6h measurement to distri-distribution bution delay
Locations for the data processing centersand results dissemination outputs
GOES (SUITLAND) USAMETEOSAT (DARMSTAD)GERMANYGMS JAPAN
Each center processes and disseminatesthe data of the OCPs in view of thecorresponding satellite.
NOAA/ARGOSService Argos - Centre Spatial de Toulouse18 av. Edouard Belin31055 TOULOUSE CEDEX, FRANCEUnique ARGOS center (Toulouse) processes and disseminates the data of ailthe DCPs in operation wherever on Earth.
r:lt"!"1.."
ëi::<l!Tl
1
[J)t"T>:::Z>:;;!Tl...,t"T>rt"T>...,::<l>Z[J)
~[J)[J)
oz
0-,....
- __ 1'1""
.. ::..':~=.-:&
1::"=·-= ---__R
o ...c:...-==__ '_c:.oM~ ......._,-.!:!!!!!!'
IQJ ~,
~..::.1__1
c-*1Ql:i:u ..·
P'lIlIE5IJ[NTf FRE.-'" 0Ul00....,..,NCl.ClDUNA....ClIlCAOOS
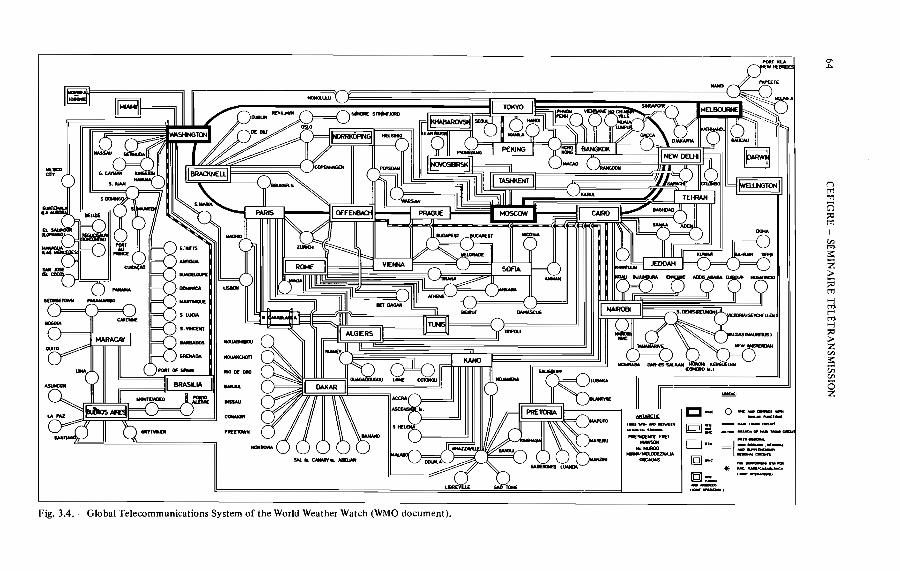
Fig. 3.4. - Global Telecommunications System of the World Weather Watch (WMO document).

CRM - S - 09 - TAILLADE-CARRIERE 65
GEOSYNCHRONOUSSYSTEM
3.3. DATA PROCESSING (suite)
Charges
Data processingGOES: Free of charge
Data disseminationAt User's charge
3.4. DATA DISTRIBUTION
Once the data is stored, it can be accessedby a User «dialling in» to the system.
Alternatively, data can be immediatelyrouted directly to the User via one ofthe dedieated Iines, or stored on magnetietapes to be sent by mail.
3.5. CONCLUSION
LOW ORB1T SYSTEM
Data processingData collection
raw data (Le. coding in decimal,octal hexadecimal, free of chargeresults in physieal parameters : 1$ perplatform per day
Location: 20 $per platform per dayspecial contracts possible
Data disseminationAt User's charge
Two cases must be considered :Real time distribution using :
telephone (cali from the USER anddirect access to the computer)
- international or private telexcomputer to computer dedicatedIinesGlobal Telecommunications Systemof the World Weather Watch (auto.matie connection in Paris) withagreement of French MeteorologicalOffice(see Fig. 3.4.).
Differed distribution by mail :It applies to listings magnetie tapesobtained through the weekly endingof Data Bank.
Major advantages of each system
- Operational for GOES System ..- Data available in real time (alarm
possibility at any time) .- Data available on in terrogation. The
rate of reports can be variable onrequest ..
- Self-timed DCP capability. Allows DCPto be used without command receiver ,lower cost·.70° N to 70° S near global coverageusing international DCP .Length of sensor data DCP message2000 to 5000 bits.
- Operational and redundant.- Global coverage .- Simple data collection platform .. Low cost (2000 $) .- Low weight.( 1000 g for "electronies).- Low consumption : 100 mW in average
for 8 sensors data collection platform.

66 CEFIGRE - SlèMINAIRE TlèLlèTRANSMISSION
GEOSYNCHRONOUS SYSTEM LOW ORBIT SYSTEM
3.5. CONCLUSION (suite)
Major parameters choice between the two systems
Low latitudes (70 0 N to 70° S) DCP Operational 1979-1987.operation. High latitudes (data collection everyReal time needs. 50 minutes in the polar areas andAlarm need without delay . only 7 times per day at the Equator) .Large messages (2000 to 5000 bits) . Two to six hours measurements distri·Operational (GOES system) . bution delay acceptable.
Measurement only when satellite invisibility acceptable.Global scale data collection programLocation needed (moving DCO) .~ess than 256 bits message 1(32 x 8 bitsanalogie sensors).Lower cost of DCPs.
4. HYDROLOGIC DATA COLLECTION
4.1. HYDROWGIC DATA
The water data collection programs are designed to provide . generally national - waterdata bases to guide the development and conservation of a critieal natural resource.Hydrologieaf-data collection can be divided in two groupings :
• that required for archiving for future use (historieal data)• that required for real time decision making (real time data)
Historical water data are used for design of dams, reservoirs, water supply sources, wastetreatment facilities, flood prevention structures, irrigation projects, flood-plain management plans, navigation facilities. Or in other words historical hydrologie data are beingcollected and archived for : planning, designing, constructing, operating water resourcessystems and for forecasting of hydrologie conditions ranging from droughts to floods.A small but growing part of the water data collection programs presently is structuredto provide real-time hydrologie data.Real time data are being collected for real time decision making and provided to computermodels that attempt to prediet river conditions and optimize the operation of waterresource..systems.These models involve flood control operations, flood warnings and forecasts, and riverforecasts, and river forecasts for the management, of electric power generation,navigation, water supply, irrigation and water quality.
CRM - S - 09 - TAILLADE-CARRIERE 67
Hydrologie data also are eoUeeted to support interdisciplinary research, in such as :• Agriculture (rain, snow, hail)• Biology : monitoring of water systems: water flow and temperature for study of
migration route of animais and nutrient budget, rates of water release from impoundments influence both wann and cold waterfisheries, competing uses of waterfor man and animais have to be evaluated (Ecosystem cost/usé analysis)
• Ecology : monitoring water quality parameters : water pollution arising from theactivities of man by industrial effluents
• Meteorology: precipitation, snow accumulations...
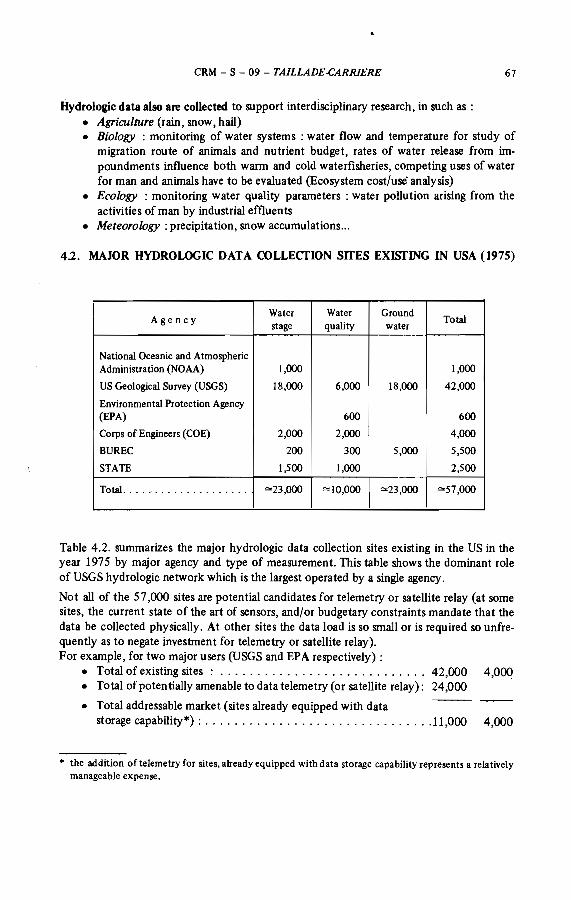
4.2. MAJOR HYDROLOGIe DATA COLLECTION SITES EXISTING IN USA (1975)
1 Water Water GroundTotalAgency
stage quality water
National Oceanic and AtmosphericAdministration (NOAA) 1,000 1,000
US Geological Survey (USGS) 18,000 6,000 18,000 42,000
Environmental Protection Agency(EPA) 600 600
Corps of Engineers (COE) 2,000 2,000 4,000
BUREC 200 300 5,000 5,500
STATE 1,500 1,000 2,500
Total.................... ""23,000 ""10,000 ""23,000 ""57,000
Table 4.2. summarizes the major hydrologie data collection sites existing in the US in theyear 1975 by major agency and type of measurement. This table shows the dominant roleof USGS hydrologie network which is the largest operated by a single agency.
Not all of the 57,000 sites are potential candidates for telemetry or satellite relay (at sornesites, the current state of the art of sensors, and/or budgetary constraints mandate that thedata be collected physically. At other sites the data load is so small or is required so unfrequently as to negate investment for telemetry or satellite relay).For example , for two major users (USGS and EPA respectively) :
• Total of existing sites : . . . . . . . . . . . . . . . . . . . . . . . . . . . . 42,000 4,000• Total of potentially amenable to data telemetry (or satellite relay): 24,000
• Total addressable market (sites already equipped with datastorage capability*) : 11 ,000 4,000
• the addition of telemetry for sites, already equipped with data storage capability represents a relativelymanageable expense.

1USA - CANADA HEASUREMENT
SENSORTYPE
1975Total number of si tes Sampling rrequency of REMARJ(S
ta be needed rate tra.nsmission LIFE REPAIRINTERVAL
Pree ipi tation ~ 15 minutes 3 hourly10 years 1 month5%-10% on demanù
Water level ~:m 15 minutes 3 hours cIO years 6 months5% - 10%3'm 30 minutes 3 hours
" " requlred on demand
3,000 1 heur 3 heurs " "400Ground water
~o f~~O 1 heur DailyDepth ta water table 10 years 6 months
Snow depth 300 DatIy Daily<TIl" 10 vears 1 vear
Snow mol sture2'm;f
Daily DatIy9 years 1 yeareaulvalent
Evaporation l, ~~O Daily Daily 5 years 1 Weekly--
Water temperature 9001 hour 3 hours 1 year i 1 week100
Wlnd direction 500 5 minutes 1 heur 5 years 1 6 menthe11iO
Wlnd velee! ty 500 5 minutes 1 heur 5 years ~ 6 monthe11iOt----~~- --- - -_._._-- - -,---~_.------
SolI moisture500 12 hours 12 hours 5 years i 1 month<lO
!--
Specifie conductance 400 1 hour 3 hours 1 month---or; 1 year
tee thickness 300 Dai1y Daily 5 years i<ID 1 year
3001 hour 1 hour
:Air temperature 1mr 10 years 1 year
Dew point-frost point 3001 hour 1 hour 10 years 6 months11iO
Disso1ved oxyqen200)'/
1 hour 3 hours---;]f 6 months l week
PH150 fi
1 hour 3 hours 1 year 1 week---;]f
Water ve10city 100 6 minutes 3 hours USA only<TIl" 5 yea.rs 1 mon th
tneominq solar radiation <TI Daily Daily 1 yeu 1 month.._-
Net radia tion 25Daily Daily 6 monthe 1 month
~
River diseharqe ~ 3 minutes 3 hours 5 years 6 mOnthe
tee Dresenee 5 Dailv Dailv 1 year 1 year
Table 4.3. - Types of hydr<;>logical parameters and estimale 01 the total number of stations of each type 10 be needed in North America in 1975.
a-.00
n["1'1"'1
Ci;>:l["1'1
1
UlM3:Z>;;;["1'1
-lMr-'m-l;>:l>ZUl3:t:iiUloZ
CRM - S - 09 - TAILLADE-CARRIERE 69
4.3. TYPES OF HYDROLOGIC PARAMETERS AND ESTIMATE OF THE TOTALNUMBER OF STATIONS OF EACH TYPE TO BE NEEDED IN NORTH
AMERICA IN 1975
The hydrologie parameters listed in table 4.3. are essential to measure the phenomenadescribed in paragraph 4.1. The numerator under the heading «Total number of sites»is the estimate of the total number of stations of that parameter type, to be needed inNorth Ameriea in 1975. The denominator is the estimate of the number of stations of thatparameter type where real time data is required.The table 4.3. gives also :
• For measurement :- The sampling rate : number of measurements taken from a single sensor per unit
time.- Frequency of transmission: number of measurement (or collection) transmissions
per unit time (when real time is not needed this frequency is not critical and canbe once a day or less often).
• Forsensor(developpedin 1975)- Life : period of operation of the sensor with repair or attention (c1eaning...)- Repair interval : period of time without repair or attention.
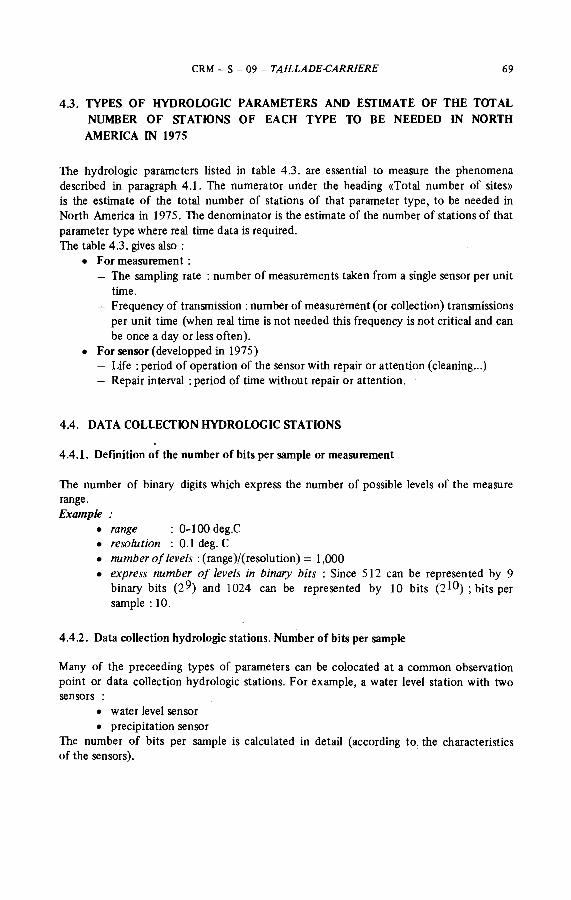
4.4. DATA COLLECTION HYDROLOGIC STATIONS
4.4.1. Definition of the number of bits per sample or measurement
The number of binary digits which express the number of possible levels of the measurerange.Example
• range : 0-100 deg.C• resolution : 0.1 deg. C• number of levels : (range)/(resolution) = 1,000• express number of levels in binary bits : Since 512 can be represented by 9
binary bits (2 9) and 1024 can be represented by 10 bits (2 10) ; bits persample : 10.
4.4.2. Data collection hydrologie stations. Number of bits per sample
Many of the preceeding types of parameters can be colocated at a common observationpoint or data collection hydrologie stations. For example, a water level station with twosensors :
• water level sensor• precipitation sensor
The number of bits per sample is calculated in detail (according to: the characteristiesof the sensors).

70 CEFIGRE - S€MINAIRE T€L€TRANSMISSION
• Water level station
Water level sensorRange 0 to 99 feet
- Resolution: 0.01 foot- Number of levels : 99/0.01 "" 10,000- Bits per sample : since 213 = 8,192 levels and 214 = 16,284 levels, 14
bits per sample are necessary
Precipitation sensorRange 0 to 99 inches/hrResolution: 0.1 inches/hrNumber oflevels : 99/0.1 = 1,000Bits per sample : 10
Total number ofbits per sampleEach sample induding water level and precipitation measurements : 24 bits.
The same evaluation has been done for other types of stations such as :
Number of bits per sample(see definition)
• Snow stationSnow moisture equivalent. . . . . . . . . . . . . . . . . 10
- Snow deph . . . . . . . . . . . . . . . . . . . . . . . . . . 122T
• Atmospheric station- Air temperature . . . . . . . . . . . . . . . . . . . . . . . 12- DEW/FROST point. . . . . . . . . . . . . . . . . . . . . Il- Wind direction. . . . . . . . . . . . . . . . . . . . . . . . 9- Wind velocity. . . . . . . . . . . . . . . . . . . . . . . . . 8
Incoming solar radiation. . . . . . . . . . . . . . . . . . 7Net radiation. . . . . . . . . . . . . . . . . . . . . . . . . 7
54• Water quality station
- Water temperature . . . . . . . . . . . . . . . . . . . . . 10Specific conductance. . . . . . . . . . . . . . . . . . . . 6
- Dissolved oxygen . . . . . . . . . . . . . . . . . . . . . . 6- pH .. " .. . .. . . .. . .. .. 7- Water level. . . . . . . . . . . . . . . . . . . . . . . . . . . 14
43
• Water level station- Water level. . . . . . . . . . . . . . . . . . . . . . . . . . . 14- Precipitation . . . . . . . . . . . . . . . . . . . . . . . . . 10
24
• Ice presenceIce presence. . . . . . . . . . . . . . . . . . . . . . . . . . 1
- Ice thickness . . . . . . . . . . . . . . . . . . . . . . . . . 8
-9
These numbers of bits must be compared to the characteristics of satellite DCP.

CRM - S - 09 - TAILLADE·CARRIERE 71
Latitude Number of passesper 24 h
± 0° 7± 15° 8± 30° 9± 45° 11± 55° 16± 65: 22
1
± 7S 28[ ± 90° 28
Report messageNumber ofbits for sensor data (per message) (see 3.2.)
• 2000 to 5200 bits for synchronous system• 256 bits for ARGOS System.
There is no data limitation problem with the two systems if each message sent by thencp is really received by the satellite. That is a1ways the case for geosynchronous systems:the satellite remains in view of the ncp.For low altitude systems using drifting satellites, a satellite is not generally in view of thencp when the measurements are made so that ncp must have storage capability.
4.4.3. Limitations of low orbit system. Characteristics of TIROS N-ARGOS system
(a) Collection transmission frequency Table 4.4.3.
The visibility performance of the TIROS/ARGOS System is depending on thehydrologie site latitude.The number of passes per day is summa·rized in table 4.4.3. (the average durationof a pass is ten minutes)At the Equator transmitted data is collected 7 times per dayAt the poles transmitted data is collected 28 times a day or every 50 minutes.The collection transmission frequencies per 24 hours (according to the latitude) areroughly, the numbers of passes.At the poles, the collection period is 50 minutes (in average). At the Equator, the timebetween each of the 7 passes is not constant (variation from 1()() minutes to 300 minutes).
Law orbit satellites cannot beused for real time monitoring
(b) Number of somples per collection interval
Definition : total number of measurements of the parameters taken during the collectioninterval (or period).(Number of bits per sample) x (Number of samples per collection interval*) = Number ofof bits to be transmitted.The ARGOS message capacity for sensor data is 256 bitsExample : Data [rom ~water quality station»One can see 4.4.2. that 43 bits per measurement are necessary, 256/43 "'" 5 successivemeasurements can be stored without exceeding the ARGOS messaj!;e.The needed sampling rate for water quality parameters (see table 4.3.) is 1 hour.The maximum collection interval can be 5 hours (without exceeding the 256 bits Argosmessage capacity).
• assuming that DCP has a storage capability.
72 CEFIGRE - S~MINAIRE T~L~TRANSMISSION
Argos low orbit satellite system meets the data requirements (for the «water qualitystatioO)) at any latitude for the number of bits to be collected and transmitted (maximumtime interval between two passes 5 hours).Argos low orbit satellite system does not meet the data frequency transmission requirements of 3 hours (see table 4.3.).This exarnple shows the capability of this system in tenns of data collection (in the worstcase Le. at the Equator). It shows also the limitations of this system in tenns ofmeasurement-to-eollection delays.
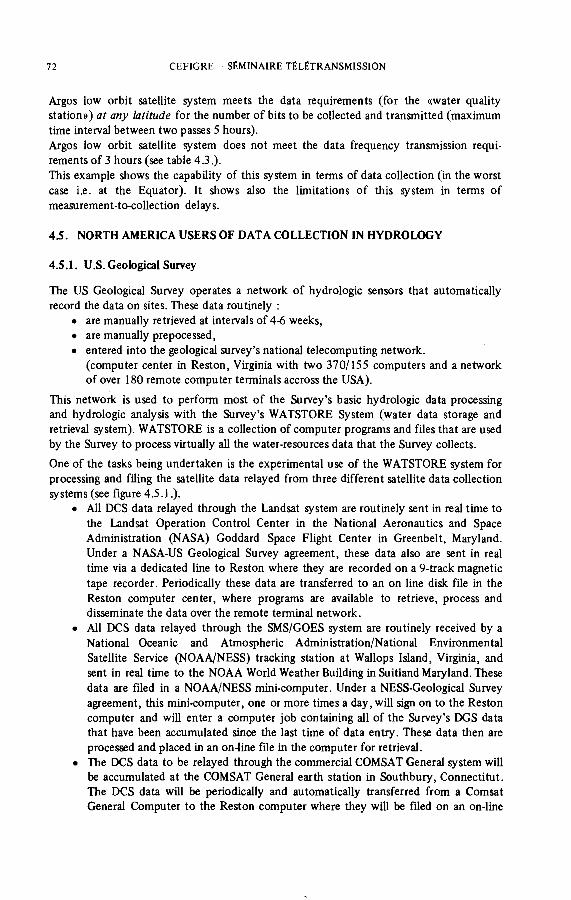
45. NORTH AMERICA USERS OF DATA COLLECTION IN HYDROLOGY
4.5.1. U.S. Geological Survey
The US Geological Survey operates a network of hydrologie sensors that automaticallyrecord the data on sites. These data routinely :
• are manually retrieved at intervals of 4-6 weeks,• are manually prepocessed,• entered into the geologieal survey's national telecomputing network.
(computer center in Reston, Virginia with two 370/155 computers and a networkof over 180 remote computer tenninals accross the USA).
This network is used to perfonn most of the Survey's basic hydrologie data processingand hydrologie analysis with the Survey's WATSTORE System (water data storage andretrieval system). WATSTORE is a collection of computer prograrns and files that are usedby the Survey to process virtually ail the water-resources data that the Survey collects.
One of the tasks being undertaken is the experimental use of the WATSTORE system forprocessing and filing the satellite data relayed from three different satellite data collectionsystems (see figure 4.5.1.).
• AlI DCS data relayed through the Landsat system are routinely sent in real time tothe Landsat Operation Control Center in the National Aeronautics and SpaceAdministration (NASA) Goddard Space Flight Center in Greenbelt, Maryland.Under a NASA-US Geological Survey agreement, these data also are sent in realtime via a dedieated line to Reston where they are recorded on a 9-track magnetictape recorder. Periodically these data are transferred to an on line disk file in theReston computer center, where prograrns are available to retrieve, process anddisseminate the data over the remote tenninal network.
• AlI DCS data relayed through the SMS/GOES system are routinely received by aNational Oceanic and Atmospheric Administration/National EnvironmentalSatellite Service (NOAAlNESS) tracking station at Wallops Island, Virginia, andsent in real time to the NOAA World Weather Building in Suitland Maryland. Thesedata are filed in a NOAA/NESS mini-computer. Under a NESS-Geological Surveyagreement, this mini-computer, one or more times a day, will sign on to the Restoncomputer and will enter a computer job containing all of the Survey's DGS datathat have been accumulated sinee the last time of data entry. These data then areprocessed and placed in an on-line file in the computer for retrieval.
• The DCS data to be relayed through the commercial COMSAT General system willhe accumulated at the COMSAT General earth station in Southbury, Connectitut.The DCS data will he periodieally and automatically transferred from a ComsatGeneral Computer to the Reston computer where they will he filed on an on-line

cRM - S - 09 - TAILLADE-CARRIERE 73
llLANDSAT l
DCP
~ ~LANDSATsatellite
NASACONTROLCENTER
GSFC
Maryland
~Dedicated line
Ilreal tirne
~MAGNETIC
TAPERECORDER
1 1 rData from
USGS network
ll GOES l
DCP
~ ~GOES
satellites
NOAATRACKINGSTATION
WALLOPSISLANDVirginie
NOAA. WWBSUITLANDMaryland
one or more
timr'"RES TON USGS Computer Center
llCOMMERCIAL 1
DCP t
~ ~COMSAT
satellite
COMSATEARTH
STATION
SOUTHBURY
Connectitut
\4 Real tirne for3 . district of
periodicallyand
automatically
Fig. 4.5.1. - Testing of the satellite Data Collection Systems by USGS
74 CEFIGRE - S~MINAIRE T~L~TRANSMISSION
disk: me. In addition to the data being made available to the Reston computer, italso will be possible for the two US Geological Survey district offices in Harrisburg,Pensylvania, and Fortland, Oregon, to use their Reston computer - compatibleterminals to occasionnally connect to the COMSAT computer to directly retrieveunprocessed real-tirne data.
The automatic collection of data in real tirne offers two benefits :• the first is that the real tirne processed data can be used to m'onitor the perfor
mance of the instrument network (stations are visited only when instrumentsfail or conditions warrant the collection of supplementary data - when waterquality or discharge is outside the normal range).
• the second is that a real tirne data service can be offered to the water resourcesmanagement community (growing pressure of municipal, industrial use and environmental protection).
The increasing cost of manpower, the decreasing cost of electronics, and cost effectivenessof satellite telemetry probably will result in an eventual automation of the collection ofhydrologie data.Notel: USGS made in 1975 an experirnental integration of the LANDSAT data collectionsystem with the geological survey's network. The objective of this experirnent was tosirnulate an operational system for collecting, relaying, processing and disseminationhydrologie data. About 90 DCP in 24 USGS districts, were used for the experirnent.Note 2 : The water resources division of the USGS in installing (1977) over 120 self-tirnedDCPs to operate with GOES for the collection of hydrologie data.
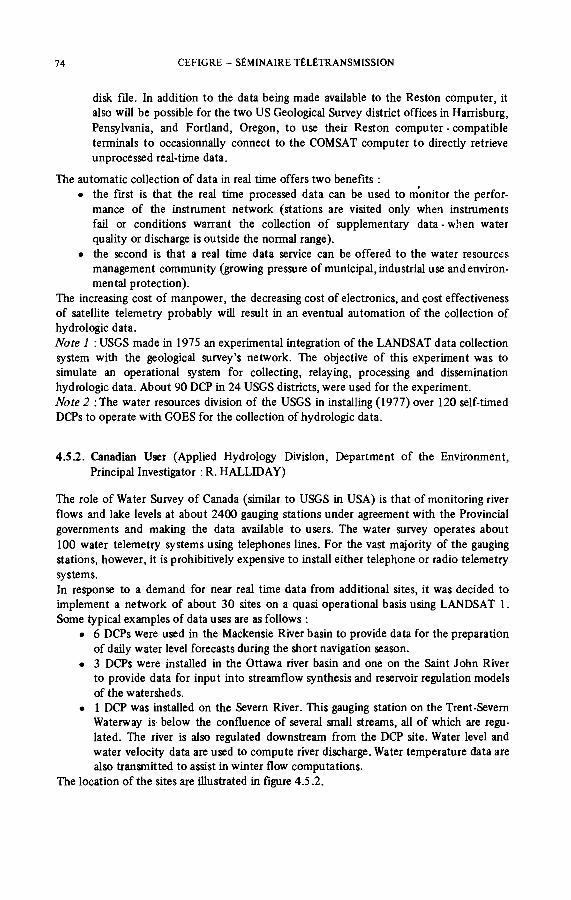
4.5.2. Canadian User (Applied Hydrology Division, Department of the Environment,Principal Investigator : R. HALLIDAY)
The role of Water Survey of Canada (similar to USGS in USA) is that of monitoring riverflows and lake levels at about 2400 gauging stations under agreement with the Provincialgovernments and making the data available to users. The water survey operates about100 water telemetry systems using telephones lines. For the vast majority of the gaugingstations, however, it is prohibitively expensive to install either telephone or radio telemetrysystems.In response to a demand for near real tirne data from additional sites, it was decided toirnplement a network of about 30 sites on a quasi operational basis using LANDSAT 1.Sorne typical examples of data uses are as follows :
• 6 DCPs were used in the Mackensie River basin to provide data for the preparationof daily water level forecasts during the short navigation season.
• 3 DCPs were installed in the Ottawa river basin and one on the Saint John Riverto provide data for input into streamflow synthesis and reservoir regulation modelsof the watersheds.
• 1 DCP was installed on the Severn River. This gauging station on the Trent·SevernWaterway is below the confluence of several small streams, all of which are regu.lated. The river is also regulated downstream from the DCP site. Water level andwater velocity data are used to compute river discharge. Water temperature data arealso transmitted to assist in winter flow computations.
The location of the sites are illustrated in figure 4.5.2.

."
n::c:::
,oï1
Cf)
10'oC
1
~t:::t-<:t.I:::J\'lQ~~
hi:>ci
•1
t>,
...//
.//
:-/
,..
\,\
,\
\
\\.y/
Ü- --40-)" ;0·/",-" "
DATA COLLECTION PLATFORMS
AT WATER,SURVEY OF CANADA STATIONS, . , ,\"
00''0'
10'-_. ----------I~tt·.
c-'oS''~
/
....
~,
'\0, ..... ,, ' ...
1II.E::::t:::::::E::i~ -- .! 0.00 400 .1l.0tI.' .
!..!.!.:.- 110·
, I~, 4.5.2. (Rel'. 16).-JV>
76 CEFIGRE - SfMINAIRE TfLfTRANSMISSION
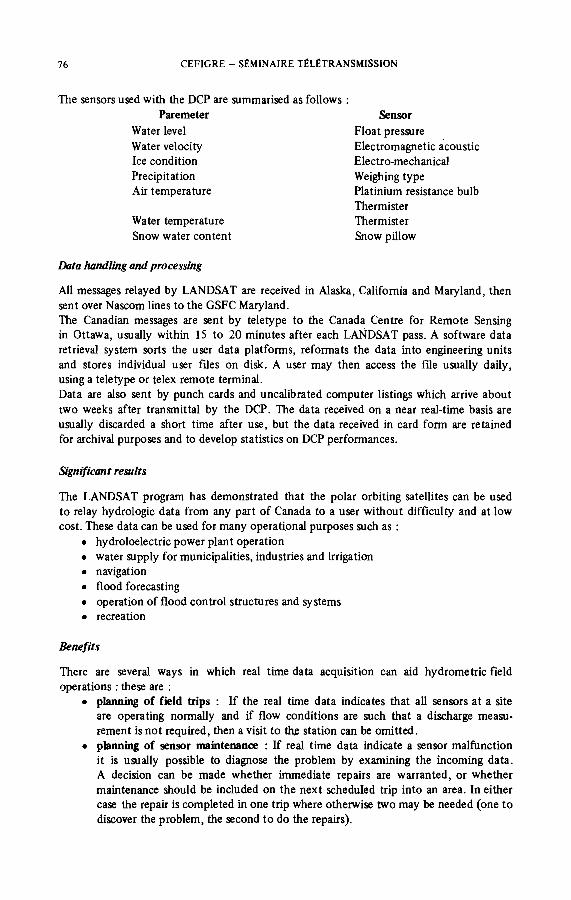
The sensors used with the DCP are summarised as follows :Paremeter
Water levelWater velocityIce conditionPrecipitationAir temperature
Water temperatureSnow water content
Data handling and processing
SensorFloat pressureElectromagnetic acousticElectro-mechanicalWeighing typePlatinium resistance bulbThermisterThermisterSnow pillow
AlI messages relayed by LANDSAT are received in Alaska, Califomia and Maryland, thensent over Nascom lines to the GSFC Maryland.The Canadian messages are sent by teletype to the Canada Centre for Remote Sensingin Ottawa, usually within 15 to 20 minutes after each LANDSAT pass. A software dataretrieval system sorts the user data platforms, reformats the data into engineering unitsand stores individual user mes on disk. A user may then access the me usually daily,using a teletype or telex remote terminal.Data are also sent by punch cards and uncalibrated computer listings which arrive abouttwo weeks after transmittal by the DCP. The data received on a near real-time basis areusually discarded a short time after use, but the data received in card form are retainedfor archival purposes and to develop statistics on DCP performances.
Significant results
The LANDSAT program has demonstrated that the polar orbiting satellites can be usedto relay hydrologie data from any part of Canada to a user without difficulty and at lowcost. These data can be used for many operational purposes such as :
• hydroloelectric power plant operation• water supply for municipalities, industries and irrigation• navigation• flood forecasting• operation of flood control structures and systems• recreation
Benefits
There are several ways in which real time data acquisition can aid hydrometric fieldoperations: these are :
• planning of field trips: If the real time dàta indicates that aH sensors at a siteare operating normally and if flow conditions are such that a discharge measurement is not required, then a visit to the station can be omitted.
• planning of sensor maintenance : If real time data indicate a sensor malfunctionit is usually possible to diagnose the problem by examining the incoming data.A decision can be made whether immédiate repairs are warranted, or whethermaintenance should be included on the next scheduIed trip into an area. In eithercase the repair is completed in one trip where otherwise two may he needed (one todiscover the problem, the second to do the repairs).

CRM - S - 09 - TAILLADE-CARRIERE 77
• Filling in missing record : when field recorders have stopped but sensors conti·nue to function, the real time data can be used to fill in data that would other·wise be missing.
• Primary collection of data : If the cost of acquiring real time data and the reliabilityof the system proved better than using in situ recorders, then satellite te1emetrycou1d be used as a prirnary means of data collection.
The current capital cost of satellite te1emetry of water level data in Canada is about $5,000for a DCP plus $1,000 for a water level encoder.
·Operating costs of a DCP are smal1 and about $100 a year (repairs). These costs does notinclude processing and dissemination charges.
Future
The deployment of DCPs in Canada proceeded at a re1ative1y slow pace. The principalreason has been the lack of an operational satellite system. The service provided byLANDSAT is excellent but the system is experimental and therefore cannot be usedas the basis for any long term project.The operational GOES system often cannot be used in mountainous or high latitude areasbecause of antenna aiming prob1ems. It now seems 1ikely that the Water Survey of Canadawill select GOES self-timed DCPs at all sites where it is technieally feasible and will use theTIROS N-NOAA-ARGOS system where GOES is not feasib1e (this assumes of course, thatthe ARGOS System meets published specifications). A contract for development of anARGOS·GOES DCP has recently been awarded to a Canadian company.
5. REFERENCES
Ref. 1 - Use of earth satellites for automation of hydrologie data collection (USGS),Richard PAULSON, Ju1y 1976, NASA Report.
Ref. 2 - Performance of the Landsat Data Collection System in a total system context(USGS), Richard W. PAULSON and Charles F. MERK, November 1975, International Seminar on Organization and Operation of Hydrologie Services, Ottawa,Canada.
Ref. 3 - Potential impact of satellite data relay systems or the operation of hydrologiedata programs, D.H. MOODY and DM. PREBLE (USGS), December 1975, 2ndWorld Congress on Water Resources of the International Water ResourcesAssociation, New Dellii, India.
Ref. 4 - Retransmission of hydrometrie data in Canada, Notes for an oral report toNASA, November 1976, Applied Hydro10gy Division, Department of the Environment, Ottawa, Canada, R.A. HALLIDAY, Principal Investigator.
Ref. 5 - Satellite Data Collection User Requirements Workshop, Final report, June1975, Edward A. WOLFF, Charles E. COTE, J. Earle PAINTER.
Ref. 6 - Satellite Data Collection Newsletter, edited by Dr Enrico P. MERCANTI, code952, NASA-GSFC, Greenbelt Md. USA.
Ref. 7 - GOES DCP User's Guide, NOAA NESS, November 1976.Ref. 8 - METEOSAT DCP User's Guide ESA - MPO, March 1977.Ref. 9 - ARGOS DCP User's Guide, Service Argos, CNES, 18 av. E. Belin, Toulouse,
France.

78 CEFIGRE - S[MINAIRE T[L[TRANSMISSION
ReL 10 - Second Argos User's Meeting, November 2-3, 1977.ReL Il - New ventures in satellite communications, Comsat General COlp., 950 L'Enfant
Plaza S.W., Washington, DC 20024, USA.ReL 12 - Use of ERTS and data collection system imagery in reservoir management and
operation, Saul COOPER, US Army Corps of Engineers, Waltham, Massachussetts.ReL 13 - Water quality parameter study in Warrior river and Mobile bay using DCP's
& ERTS imagery ; Harrold HENRY, Alabama Geological Survey, Univ. ofAlabama, Tuscaloosa, AL 35486 ; R.C. «red» BAMBERG, DirectOl, AlabamaDevelopment Office, State Office Building, Montgomery, AL 36104 ; USA.
ReL 14 - DCS platfonn.s were used to provide operational data to control water flowduring flood stages of Salt River in March 1973. DCS System proved morereliable and useful than microwave system now in use.State Department ofWater Resources USGS; Watershed Division, Salt River Project ; William WARSKOW, Lead Watershed Specialist, Watershed Div. Salt RiverProject, Po Box 1950, Phoenix, Arizona 85001, (602) 273-5680 ; HerbSCHUMAN, USGS, Phoenix, Arizona, 8 (602) 262-318 b ; USA.
ReL 15 -A DCP network (20 platforms) and ERTS imagery are being used to monitorand make environmental assessments and manage the water resaurces of3500 sq.kilometers in the Everglades. Proved particularly useful during the 1973-74winter spring draught where damage was minimized by planning based uponaccurate knowledge of the water stored in the various lakes, canals and conservation areas. Soil moisture sensors on the DCP's are alsa being used to warm ofpotential [ire hazards.Florida Fish & Wildlife Office USGS, Corps of Engineers US Forest Service.David COX (305) 724-1571, Edward VOSATKA, Florida Game and Fresh WaterFish Commission, 7630 Coral Drive, West Melbourne, Florida 32901, USA.
ReL 16 - Retransmission of Hydrometrie Data in Canada, Final Report, April 1978,Principal Investigator RA. HALLIDAY, Applied Hydrology Division, Department of Fisheries and of the Environment, Ottawa, Ontario, Canada KIA OE7.