SAS Q1 2017/2018 · GROSS EARNINGS IMPACT SEK bn Achieved FY17-FY18 Remaining effect 0,2 0,4 3,0...
29
1 SAS Q1 2017/2018 27.02.2018 EBT bef. non-recurring items Capacity, ASK in millions Unit cost 1 , SEK PASK 2 , SEK 2 Q1 in Summary: Improved earnings MSEK +334 MSEK -373 11,139 0.61 -0% -1% 0% 0.63 Q1 CHANGE VS. Q1 FY17 Note: 1) Excluding jet fuel and currency adjusted; 2) Currency adjusted POSITIVES + Passenger revenue up 1% (FX adj.) + Cargo and EB-point sale revenue increased MSEK 109 + Efficiency program delivered MSEK 165 + Positive currency effects of MSEK 205 + Operation from the new London base commenced + Positive cash flow from operating activities + 70% redemption of the preference shares completed NEGATIVES - Lower passenger numbers and load factor - Low punctuality and regularity due to very challenging weather conditions
Transcript of SAS Q1 2017/2018 · GROSS EARNINGS IMPACT SEK bn Achieved FY17-FY18 Remaining effect 0,2 0,4 3,0...

1
SAS Q1 2017/2018
27.02.2018
EBT bef. non-recurring items
Capacity, ASK in millions
Unit cost1, SEK
PASK2, SEK
2
Q1 in Summary: Improved earnings
MSEK +334MSEK -373
11,139
0.61
-0%
-1%
0%0.63
Q1
CHANGE VS.
Q1 FY17
Note: 1) Excluding jet fuel and currency adjusted; 2) Currency adjusted
POSITIVES
+ Passenger revenue up 1% (FX adj.)
+ Cargo and EB-point sale revenue increased MSEK 109
+ Efficiency program delivered MSEK 165
+ Positive currency effects of MSEK 205
+ Operation from the new London base commenced
+ Positive cash flow from operating activities
+ 70% redemption of the preference shares completed
NEGATIVES
- Lower passenger numbers and load factor
- Low punctuality and regularity due to very challenging
weather conditions

2
3
Improved earnings due to seasonal adjustments
DEPARTURES IN Q1 FY16 – FY18Q1 FY16 = Index 100
EBT BEFORE NONRECURRING ITEMSMSEK
100
103
9895
100
90
Q1 FY16
-5%
Q1 FY18Q1 FY17
-404 -707 -373
5,976 6,513 6,141
0.97 0.90 0.94
Note: 1) EBT before non-recurring items; MSEK 2) Nominal; SEK
-707
-373
Q1 FY18Q1 FY17
47%EBT1
PAX
YIELD2
4
Implementation of efficiency program according to plan
Flight operation, charges and fuel, MSEK 80
• Cimber divestment, long haul manning reduction,
increased crew productivity and fuel efficiencies
Ground handling and technical, MSEK 55
• Renegotiated line station contracts, digitalization
of ticket office & arrival service
• Optimization of engine maintenance, improved
scheduling and admin reduction
Commercial and overhead, MSEK 30
• Ban of wholesale cards, reduced logistical costs
for catering and marketing
• Renegotiated facility contracts
CASK, nom.
EXAMPLES OF SAVING INITIATIVES
Q1
Q1 savings
MSEK 165 -5.6%
EFFICIENCY PROGRAM
GROSS EARNINGS IMPACT
SEK bn
Remaining effectAchieved FY17-FY18
0,2
3,00,4
1,1
0,8
0.7
Total
effect
FY18FY17 FY19 FY20

3
5
Successful launch of SAS Ireland in Q1
KEY HIGHLIGHTS
• AOC approved in December
• First commercial flight on 20 Dec 2017 – now four
aircraft in traffic
• 80,000 passengers transported until mid February 2018
• 800 flights completed
• Positive customer response in line with SAS’s
Scandinavian based production
• Punctuality in line with the Scandinavian based
operation
MALAGA BASE UNDERWAY
• First flight expected during summer 2018
6
Looking ahead, SAS maintains its strategic direction and steers
towards a single type fleet
Improve core
operations
Rightsizing
Fleet renewal
Complementing
production
platform
SAS ACTIONS
• Greater seasonal and network
adjustments
• > SEK 3bn efficiency program
• Focus on broadening revenue base
using EuroBonus
• Strategic wet lease partners
complementing SK operation
• Maintain and improve schedule at
regional destinations
• Launched SAS Ireland
• Production platform without legacy
• Single type fleet
• Asset company to enable effective
financing
Increased leisure travel
Increased demand for
non-stop routes
New Production models
Legacy costs
MARKET TRENDS AND SAS CONDITIONS
Aging fleet and significant
financing need
EX
TE
RN
AL
INT
ER
NA
L

4
Building blocks to future proof SAS beyond 2020
Sustainability
A step toward lower emissions
for a sustainable future.
Growth and flexibility
Greater seasonal adjustments and
participate in growing markets.
PRODUCTION OPTIMIZATION
7
Increased competitiveness
Improved efficiency and product
offering.
OUTCOME
Core
operations
(SK)
Regional
platforms
(External partners)
Single type
fleet
(Asset company)
European
platform
(SAS Ireland)
FINANCIALS

5
Breakdown of the income statement – Q1
Note: * Before non-recurring items
Income statement Nov 17-Jan 18 Nov 16-Jan 17 Change vs. LY Currency
Total operating revenue 8,978 8,957 +21 -225
Payroll expenditure -2,268 -2,398 +130
Jet fuel -1,555 -1,579 +24
Government charges -921 -970 +49
Other operating expenditure -3,383 -3,526 +143
Total operating expenses* -8,127 -8,473 +346 +372
EBITDAR before non-recurring items 851 484 +367 +147
EBITDAR-margin* 9.5% 5.4% +4.1 p.u.
Leasing costs, aircraft -760 -733 -27
Depreciation -353 -327 -26
Share of income in affiliated companies -9 -11 +2
EBIT before non-recurring items -271 -587 +316 +201
EBIT-margin* -3.0% -6.6% +3.6 p.u.
Financial items -102 -120 +18
EBT before non-recurring items -373 -707 +334 +205
Non-recurring items 100 10 +90
EBT -273 -697 +424 +205
9
Breakdown of the income statement – rolling 12 months
Note: * Before non-recurring items
Income statement Feb 17-Jan 18 Feb 16-Jan 17 Change vs. LY Currency
Total operating revenue 42,675 40,141 +2,534 +184
Payroll expenditure -9,001 -9,135 +134
Jet fuel -6,812 -6,800 -12
Government charges -4,213 -4,165 -48
Other operating expenditure -15,330 -14,816 -514
Total operating expenses* -35,356 -34,916 -440 +197
EBITDAR before non-recurring items 7,319 5,225 +2,094 +381
EBITDAR-margin* 17.1% 13.0% +4.1 p.u.
Leasing costs, aircraft -3,143 -2,873 -270
Depreciation -1,453 -1,298 -155
Share of income in affiliated companies 6 40 -34
EBIT before non-recurring items 2,729 1,094 +1,635 +396
EBIT-margin* 6.4% 2.7% +3.7 p.u.
Financial items -444 -458 +14
EBT before non-recurring items 2,285 636 +1,649 +409
Non-recurring items -136 407 -543
EBT 2,149 1,043 +1,106 +409
10

6
Total Revenue Q1
MSEK
11
Revenue analysis
8,732
Other traffic
revenue
+427
8,957
+102
Scheduled
capacity
change*
Total
revenue
Q1 FY17
8,978
+96
Total
revenue
Q1 FY17,
FX adj.
Other
operating
revenue
Yield*Currency
-225
+47
-426
Total load
factor*
Total
revenue
Q1 FY18
-4.5 p.u.+0.7%
Note: * Based on average yield in Q1 FY17
+6.8%
MSEK 246
Total Operating Expenses Q1
MSEK
12
Operating expense analysis
Inflation
-78
+65
Volume Efficiency
programOperating expenses Q1 FY18
-8,127
Other
-162
-8,101
Currency
-8,473
-16
Fuel ex
currency,
volume
Operating
expenses
Q1 FY17,
FX adj.
Operating
expenses,
Q1 FY17
+372+165

7
13
SAS meets all its financial targets, rolling 12 months
Return on Invested Capital (ROIC) at 14%
• Improved in line with earnings during Q1
• Capital base to increase going forward
– Requires improved earnings to maintain ROIC above
target
Adjusted financial Net Debt/EBITDAR at 2.9x
• Improved 0.2 units during Q1
– 12 months rolling EBITDAR up SEK 0.9bn
• Aircraft deliveries to increase the adjusted financial net
debt going forward
Financial preparedness at 38%
• Stable level in Q1
– Cash position at SEK 9.3bn
– Unutilized credit facilities of SEK 2.5bn
• Financial preparedness to decrease following the
redemption of SEK 2.6bn in preference shares in Feb 18
13%
Q3
FY17
9%
Q1
FY17
12%
Q4
FY17
Q2
FY17
13% 14%
Q1
FY18
10%
2.9x
Q4
FY17
3x3.3x
4.0x
Q3
FY17
Q2
FY17
3.1x
Q1
FY17
3.4x
Q1
FY18
Q4
FY17
25%
Q3
FY17
37%37%
Q1
FY18
38%37%33%
Q2
FY17
Q1
FY17
14
Positive cash flow in Q1 – in addition, financing spend being
reduced
184
-365
-589
-425
-908
-441
-662
Q1
FY17
Q1
FY16
Q1
FY18
Q1
FY14
Q1
FY12
Q1
FY13
Q1
FY15
IMPROVED CASH FLOW1 BY MSEK 549
MSEKCredit rating upgraded following equity
private placement in November 2017
• Moody’s and S&P upgraded SAS’s credit rating to B1
and B+
New non-secured bond of MSEK 1,500
issued
• Replaces an existing bond and reduces interest
costs annually by more than MSEK 50
Redemption of SEK 2.6bn preference shares
in February 2018 completed
• Reduces dividend payment by MSEK 245 annually
• Ambition to redeem remaining preference shares
using retained earnings
Driven by earning
improvements and larger
volumes of pre-booked tickets
LOWER FINANCING SPEND; MSEK ~300
Note: 1) Cash flow from operating activities

8
15
Debt profile and capex
Interest bearing liabilities repayments
SEK bn
FY19 FY21
2.0
0.11.6
0.5 1.2
1.3
FY20
0.5
FY18
0.3
0.9
1.3
Unsecured loans Secured loans
Maturity profile
• Financing options for the convertible bond in
FY19 of SEK 1.6 bn being considered
• SEK 0.2bn of secured maturing loans in FY18
relates to pre-delivery payments
Investments and aircraft financing
• SAS to finance last ten A320neo and Airbus
A350
• Gross investment expected at SEK 6bn
– Non-aircraft capex of SEK ~0.5bn
Further aircraft investments considered
• Final negotiations being held with Airbus and
lessors
– Need to invest in about 50 aircraft from FY19
Aircraft firm order deliveries as at 31 Jan 2018
5
3
77
FY21FY20FY18 FY19
Airbus A350Airbus A320neo
Interest expenses (quarter), MSEK
16
Pension liabilities, SEK bn
FTE
16
SAS has evolved over the last seven years
CASK, SEK
Revenue/passenger, SEK
Aircraft
Interest bearing liabilities, MSEK
Passengers (SK), LTM, million
0.85 0.75
229
210
13,843
14,972
32
1,120
155
136
8,234
9,929
17
1,120
23.3 28.3
MAR 2011 JAN 2018

9
Market environment
• Aviation industry undergoes significant change
• Geo-political uncertainty
• Introduction of aviation taxes
• Volatile USD and jet fuel prices
Main assumptions
• Slightly less negative earnings than expected in Q1 FY18
• ASK +1-3%
• Fuel 580 USD/MT1) (550 USD/MT)
• FX rate 8 SEK/USD
• Gross investments of approximately SEK 6bn
• The introduction of an aviation tax in Sweden
• Continued stable macro trend
17
Maintained outlook for FY18 - Despite increased jet fuel prices
SAS expects to deliver
income before tax and
nonrecurring items in
the interval of SEK
1.5–2.0 billion
Note: The outlook is based on no unexpected events occurring 1) Including SAS hedge portfolio.

10
19
SAS has undergone a significant transformation during the last
five years
37%FINANCIAL
PREPAREDNESS 3.1xFINANCIAL NET
DEBT/EBITDAR 13% ROIC
30m
FY17
25m # PAX
FY12
272 183 ROUTES
SERVED
10,32414,903# FTEs
37A/C TYPES
9.68.2A/C BLOCK
HOURS/DAY
>5m<3m # EUROBONUS
MEMBERS
433940
38
4242
0
5
10
15
20
25
30
35
40
45
-2%
-1%
0%
1%
2%
3%
4%
5%
6%
FY17FY14FY12 FY15FY13 FY16
REVENUE AND EBT MARGIN (SEK bn)
16.833.5Pension commit.
SEK bn
Typical low cost carrier strategy
20
SAS strategy is to focus on Scandinavia’s frequent travelers
Strategy of SAS
• Multimarket focus, general low yield,
especially leisure
Market • Focus on Scandinavia’s frequent
travelers
• One type fleet, operate traffic flows
that fit fleet
• Fleet designed to fit best network and
schedule for customers
Growth • New destinations, anywhere • Improve offer for primary customer base
to increase loyalty
Operational
platform

11
21
SAS is implementing efficiency measures of SEK 3bn with full
effect in FY20
0.7
FY17
0.8
0.4
FY19
1.1
FY18 Total
effect
3.0
FY20
Gross earnings impact,
SEK bn• Increased use of cabin crew resource pool
• Increase flexibility in flight deck scheduling
• Optimize long-haul manning and address
demographic cost
• Increased use of lean processes
• Improve IT contracts and license mgmt
• Transform IT (e.g. cloud migration,
infrastructure consolidation)
EXAMPLES OF INITIATIVESFOCUS AREA
Flight ops,
wet lease,
charges & fuel
• Increase work task flexibility in Ground
• Increased ambition on external spend
• Full roll out of lean within Tech
• Minimize a/c phase out maintenance cost
Ground
handling &
Technical
maintenance
Admin
& IT
Product, sales
and distribution
• Differentiate product offering
• Reduce distribution and wholesale card costs
• Reduce logistic costs for onboard catering
• Reduce back-office and call centre
expenditure
22
Status of the efficiency program, January 31, 2018
• Increase use of resource pool
• Increase flexibility in flight deck scheduling
• Align manning on long-haul and address
demographic cost
• Increased use of lean processes and system
improvements
• Improve IT contracts and license management
• Transform IT (e.g. cloud migration, infrastructure)
EXAMPLES OF IMPLEMENTED INITIATIVESFOCUS AREA
Flight ops,
wet lease,
charges & fuel
EST.
POTENTIAL
SEK
~0.5bn
SEK
~0.9bn
SEK
~1.2bn
• Increase work task flexibility and mobility
• Increased ambition on external spend
• Full role out of lean within Tech
• Minimize aircraft phase out maintenance cost
Ground
handling &
Technical
maintenance
Admin
& IT
Product, sales
and distribution
• Differentiate product offering to increase
individualization
• Reduce distribution and wholesale card costs
• Reduce logistic costs for onboard catering
• Reduce back-office and call centre expenditure
SEK
~0.4bn
1
ACHIEVED
SEK ~0.12bn
SEK ~0.33bn
SEK~0.39bn
SEK ~0.1bn
12
23
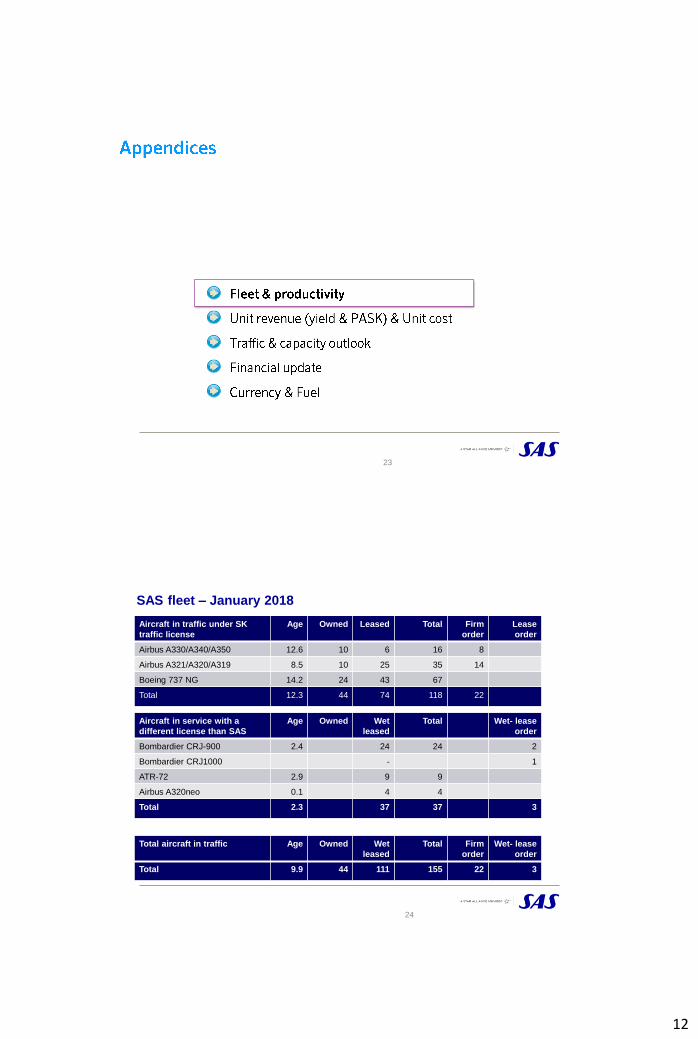
SAS fleet – January 2018
24
Aircraft in traffic under SK
traffic license
Age Owned Leased Total Firm
order
Lease
order
Airbus A330/A340/A350 12.6 10 6 16 8
Airbus A321/A320/A319 8.5 10 25 35 14
Boeing 737 NG 14.2 24 43 67
Total 12.3 44 74 118 22
Aircraft in service with a
different license than SAS
Age Owned Wet
leased
Total Wet- lease
order
Bombardier CRJ-900 2.4 24 24 2
Bombardier CRJ1000 - 1
ATR-72 2.9 9 9
Airbus A320neo 0.1 4 4
Total 2.3 37 37 3
Total aircraft in traffic Age Owned Wet
leased
Total Firm
order
Wet- lease
order
Total 9.9 44 111 155 22 3

13
Productivity development
25
26

14
Yield and PASK development vs. last year
27
Quarterly yield development
28

15
Long term yield and passenger load development
0,90
0,95
1,00
1,05
1,10
1,15
1,20
1,25
1,30
1,35
60%
70%
80%
January2005
January2006
January2007
January2008
January2009
January2010
January2011
January2012
January2013
January2014
January2015
January2016
January2017
January2018
29
Yield (SEK)Load Factor
Load Factor (12 months rolling)Yield (12 months rolling)
Capacity and FTE
30
Capacity
ASK total, millionsSAS FTEs
11 13911 154
-0.1%
Nov-Jan 2017 Nov-Jan 2018
9 92910 538
Nov-Jan 2018Nov-Jan 2017
-5.8%

16
Quarterly unit cost development
31
Breakdown of unit cost, Nov 2017 – Jan 2018
SAS, SEK, currency adjusted
32

17
Summary of key drivers
SAS
Q3
2016/17
-0.5%
-1.3%
+6.9%
-5.9%
-0.6p.u.
Q4
2016/17
0.0%
-2.8p.u.
+5.5%
+1.7%
+4.5%
Q1
2017/18
-5.7%
-4.5 p.u.
+6.8%
0.0%
-0.9%
Q2
2016/17
+12.9%
+3.1 p.u.
-7.5%
-3.3%
-7.4%
Breakdown of payroll expenses
Payroll expenses excl. restructuring costs
(MSEK)Payroll expenses significantly reduced
• New pension and remuneration
agreements in November 2012
• Outsourcing significant parts of operation
and administration
• Increased productivity in all areas
Opportunities going forward
• Digitalization and automation of operation
on the ground and administration and
where possible also for flying personal
34
2,087 (18%)
2,979 (26%)
Ground
Admin
Tech
Pilots
Crew
-24%
2,435 (28%)
11,502
3,168 (28%)
2,069 (18%)
FY12
1,199 (10%) 1,613 (18%)
2,606 (30%)
1,214 (14%)
FY17
8,793
925 (11%)
Avg. number of FTEs
Admin
Ground
Tech
-24%
2,589 (19%)
1,080 (10%)
2,635 (26%)
FY12
1,345 (13%)
13,649
Crew
FY17
10,324
1,286 (12%)
3,978 (39%)
Pilots 1,340 (10%)
5,621 (41%)
1,500 (11%)
2,599 (19%)

18
35
36
SAS geographical traffic development in Q1 FY18
Total scheduled traffic
RPK -5.7%
ASK +0.7%
Passengers -5.5%
PASK 0.0%
Intercontinental routes
RPK -10.0%
ASK -1.2%
Europe/Intrascand
RPK -1.9%
ASK +3.0%
Domestic
RPK -4.2%
ASK -0.5%

19
Scheduled passenger, 12 months rolling
(Million)
22
23
24
25
26
27
28
29
jan
-12
mar-
12
may-1
2ju
l-12
se
p-1
2n
ov-1
2ja
n-1
3m
ar-
13
may-1
3ju
l-13
jul-
15
13-s
ep
13-n
ov
jan
-14
mar-
14
may-1
41
4-j
ul
14-s
ep
Nov-1
4Ja
n-1
5M
ar-
15
May-1
5
Ju
ly-1
5S
ep
-15
Nov-1
5Ja
n-1
6M
ar-
16
May-1
6Ju
l-1
6S
ep
-16
No
v-1
6Ja
n-1
7M
ar-
17
May-1
7Ju
l-1
7
Se
p-1
7N
ov-1
7Ja
n-1
8
Mill
ion
s
SAS passenger development
38
Market seat capacity
Supply and demand in Scandinavia, vs LY
FY17FY16
3%
4%
5%
Q1
4%
Q4 Q3
4%
Q2
4%
Q3Q3
5%
3%
Q2
7%
3%
Q1 Q2Q4
4%
6%
3%
0%
2%
4%
5%
7%
6%
7%
Q1
Seats Passengers
Source: Innovata Schedule data, June 2017
FY18

20
39
In recent years, growth has come from the leisure segment driven
by increased LCC capacity
27
59
12
20
2016
71
20
38
12
2011
Majors
SAS
LCCs
Capacity Scandinavia-
Europe (Seats in millions)
Purpose of travel – Scandinavia
(Passengers in millions; CAGR %)
47
61
29
32
Busi-
ness
2011
93
Leisure
75
2016
Source: Innovata schedule data; airport statistics from Swedavia, Avinor and Copenhagen Airport (sub-set of total market)
+7%
+1%
+1%
CAGR
2011-2016
+2%
+6%
CAGR
2011-2016
ASK outlook for 2017/2018
40
ASK outlook for November 2017 – October 2018

21
41
Financial targets
To reach this, SAS pursues three strategic priorities to meet trends and
industry developments, ensure competitiveness and create the
prerequisites for long-term sustainable profitability.

22
Overview of credit facilities – January 2018
43
Cash seasonality
Seasonality of SAS cash flow from
operating activities, MSEK* • Cash flow from operating activities strongest
in Q2 and Q4
• Seasonality has increased due to
–
–
• For the first time, positive cash flow from
operating activities in Q1 FY18
-1000
-500
0
500
1000
1500
Q1 Q2 Q3 Q4
44
* Average between 2010 and 2017

23
Amortization profile
>FY23FY22
0.3
0.5
FY21
2.6
1.3
0.2
0.5
FY20
0.5
1.2
1.6
Q2-Q4 FY18
1.3
2.0
0.1
FY19
0.3
0.9
2.6
0.1
Secured loansUnsecured loans
45
Gearing ratios
-150%
-50%
50%
150%
250%
350%
450%
dec-98 dec-02 dec-03 dec-04 dec 06-dec 07-dec 01-dec 09-dec 10-dec dec-11 Oct-12 Oct-13 Oct-14 Oct-15 Oct-16 Oct-17
Fin Net Debt / Equity
Equity / Total Assets
Fin. Net Debt + 7*Op lease / Equity
46

24
SAS GroupFinancial Net November- January
47
Development and Break Down Financial Net Debt
48

25
Development of financial net debt 1992-2017 as reported on a quarterly basis
49
-10 000
-5 000
0
5 000
10 000
15 000
20 000
25 000
1992 1994 1996 1998 2000 2002 2004 2006 2008 2010 2012 2014 2016 2018
Equity / Assets Ratio1993-2018 as report on a quarterly basis
50
0%
5%
10%
15%
20%
25%
30%
35%
40%
45%
50%
1994 1996 1998 2000 2002 2004 2006 2008 2010 2012 2014 2016 2018

26
Financial Net Debt / Equity1993-2018 as reported on a quarterly basis
51
-0,5
-0,3
0,0
0,3
0,5
0,8
1,0
1,3
1,5
1,8
2,0
2,3
1993 1995 1997 1999 2001 2003 2005 2007 2009 2011 2013 2015 2017
Fleet & productivity
Unit revenue (yield & PASK) & Unit cost
Traffic & capacity outlook
Financial update
Currency & Fuel
52
27
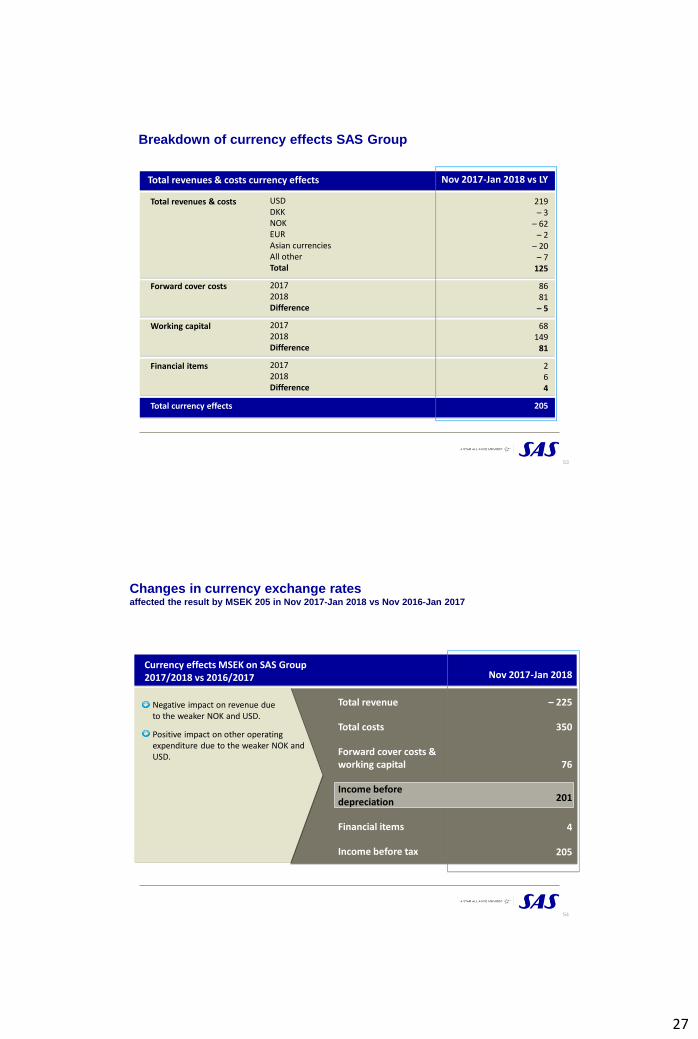
Breakdown of currency effects SAS Group
Total revenues & costs currency effects
USDDKKNOKEURAsian currenciesAll otherTotal
20172018Difference
20172018Difference
20172018Difference
Total revenues & costs
Forward cover costs
Working capital
Financial items
Total currency effects
Nov 2017-Jan 2018 vs LY
219– 3
– 62– 2
– 20– 7
125
8681– 5
68149
81
264
205
53
Currency effects MSEK on SAS Group 2017/2018 vs 2016/2017
Changes in currency exchange rates affected the result by MSEK 205 in Nov 2017-Jan 2018 vs Nov 2016-Jan 2017
54
Negative impact on revenue dueto the weaker NOK and USD.
Positive impact on other operating expenditure due to the weaker NOK and USD.
Nov 2017-Jan 2018
– 225
350
76
201
4
205
Total revenue
Total costs
Forward cover costs &working capital
Income beforedepreciation
Financial items
Income before tax

28
SAS currency distribution
- Nov 2016 – Oct 2017
Revenue Expenses
55
8%
3%
USD
GBP30%
27%
NOK
14%
SEK
DKK
11%
EUR6%
Other
36%
2%
USD
GBP
22%
15%
NOK
15%
SEK
DKK
9%
EUR1%
Other
-1,579
-1,450
Curr. adj.
Q1 FY17
-18
Currency
+129
Other
-302
Q1 FY18Hedging &
time value
+162
PriceVolume
+53
-1,555
Q1 FY17
56
Jet fuel costs decreased MSEK 24 in Q1
Fuel cost Q4
MSEK
2018: +156
2017: -5

29
USD 500-520/MT 80% - - -
USD 590-620/MT - 73% 39% -
Jet fuel and currencies
Jet fuel cost sensitivity FY18, SEK bn*
Average
spot price
7.0
SEK/USD
8.0
SEK/USD
9.0
SEK/USD
USD 500/MT 6.1 6.8 7.4
USD 600/MT 6.5 7.3 8.0
USD 700/MT 6.8 7.6 8.4
* Based on hedge position as at 31 January 2018
Currency hedges*
• 57% of USD hedged next twelve months
• 70% of NOK hedged next twelve months
Jet fuel
• Policy to hedge 40-80% of expected fuel
consumption for the next 12 months and up
to 50% for the following six months
• Hedge position as at January 2018
– 64% of expected jet fuel consumption
hedged next 12 months
– Mixture of call options and swaps
Currency
• Policy to hedge 40-80% of expected
currency deficit/surplus for the next 12
months
57
Max jet fuel price Q4 FY18Q2 FY18 Q3 FY18 Q1 FY19