![LBT brochure contourz web-1 - Lunada Bay Tile · 2019. 3. 27. · Contourz [kon-toors] Lunada Bay Tile elevates concrete tile design through engineering and artistry to deliver tactile](https://static.fdocuments.in/doc/165x107/5ffc5e3766fd7c4aed240076/lbt-brochure-contourz-web-1-lunada-bay-2019-3-27-contourz-kon-toors-lunada.jpg)
SARC Report for Lunada Bay Elementary - 1.cdn.edl.io · reading poetry, building robots with ......
20
Lunada Bay Elementary By February 1 of each year, every school in California is required by state law to publish a School Accountability Report Card (SARC).The SARC contains information about the condition and performance of each California public school. Under the Local Control Funding Formula (LCFF) all local educational agencies (LEAs) are required to prepare a Local Control and Accountability Plan (LCAP), which describes how they intend to meet annual school-specific goals for all pupils, with specific activities to address state and local priorities. Additionally, data reported in an LCAP is to be consistent with data reported in the SARC. For more information about SARC requirements, see the California Department of Education (CDE) SARC Web page at http://www.cde.ca.gov/ta/ac/sa/ . For more information about the LCFF or LCAP, see the CDE LCFF Web page at http://www.cde.ca.gov/fg/aa/lc/ . For additional information about the school, parents/guardians and community members should contact the school principal or the district office. DataQuest Internet Access California Department of Education School Accountability Report Card Reported Using Data from the 2016-17 School Year DataQuest is an online data tool located on the CDE DataQuest Web page that contains additional information about this school and comparisons of the school to the district and the county. Specifically, DataQuest is a dynamic system that provides reports for accountability (e.g., test data, enrollment, high school graduates, dropouts, course enrollments, staffing, and data regarding English learners). Internet access is available at public libraries and other locations that are publicly accessible (e.g., the California State Library). Access to the Internet at libraries and public locations is generally provided on a first-come, first-served basis. Other use restrictions may include the hours of operation, the length of time that a workstation may be used (depending on availability), the types of software programs available on a workstation, and the ability to print documents. Mrs. Julie Tarango, Principal Principal, Lunada Bay Elementary As principal of Lunada Bay Elementary School, I would like to welcome you to our school! Lunada Bay Elementary is beautifully situated on the coast of the Pacific Ocean above the bay for which it was named. Built in 1958, the school has been the heart of the Lunada Bay community in Palos Verdes Estates for over fifty years. Our school prides itself on the notion that, “We are Lunada Bay: We are one school, one team, one family.” As you walk around our school, you will hear teachers and staff encouraging students with positive reinforcement echoing a common language utilizing Coach Wooden’s pyramid success. Each month, we identify character traits like “hard work” and identify students demonstrating these qualities to represent their class at our monthly flag ceremony. At the ceremony, our community gathers to recognize our outstanding students and staff, recite the Pledge of Allegiance, and sing our school song (with some help from our mascot, Splash the Dolphin!). In our classrooms, you will find busy students engaged in research projects, math discussions, Writer’s Workshop lessons, reading poetry, building robots with our STEM kits, or performing with our Fine Arts program. Our teachers are often collaborating with each other to implement contemporary math instruction utilizing our rigorous curriculum, Math in Focus to secure deeper levels of mathematical understanding and application. You will often hear our teachers ask the students, “How do you know that is the right answer? Can you show me another way to solve it?” Parents of Lunada Bay students have high expectations for their children and the school that educates them. Parents and teachers mutually respect one another’s interests and expertise, ensuring that the best interest of students is the cornerstone for all programs and pedagogy at Lunada Bay. The Parent-Teacher Association (PTA) is critical to the continued success of the school, and parents at Lunada Bay contribute generously of their time and resources. Lunada Bay offers an extensive fine arts program that supplements vocal and instrumental music programs and Art at Your Fingertips provided by the Palos Verdes Arts Center. Each year, students in every grade study for twelve weeks with a professional, working artist from the Los Angeles area. This experience fosters teamwork, promotes brain connectivity, and increases self-esteem while exposing students to a wide variety of visual and performing arts. Come visit us at Lunada Bay, the home of the Dolphins. We look forward to meeting you! About Our School About Our School
Transcript of SARC Report for Lunada Bay Elementary - 1.cdn.edl.io · reading poetry, building robots with ......

Lunada Bay Elementary
By February 1 of each year, every school in California is required by state law to publish a School Accountability Report Card (SARC).The SARC contains information aboutthe condit ion and performance of each California public school. Under the Local Control Funding Formula (LCFF) all local educat ional agencies (LEAs) are required toprepare a Local Control and Accountability Plan (LCAP), which describes how they intend to meet annual school-specific goals for all pupils, w ith specific act ivit ies toaddress state and local priorit ies. Addit ionally, data reported in an LCAP is to be consistent w ith data reported in the SARC.
For more information about SARC requirements, see the California Department of Educat ion (CDE) SARC Web page at http://www.cde.ca.gov/ta/ac/sa/.
For more information about the LCFF or LCAP, see the CDE LCFF Web page at http://www.cde.ca.gov/fg/aa/lc/.
For addit ional information about the school, parents/guardians and community members should contact the school principal or the district office.
DataQuest
Internet Access
California Department of Education
School Accountability Report CardReported Using Data from the 2016-17 School Year
DataQuest is an online data tool located on the CDE DataQuest Web page that contains addit ional information about this school and comparisons of the school tothe district and the county. Specifically, DataQuest is a dynamic system that provides reports for accountability (e.g., test data, enrollment, high school graduates,dropouts, course enrollments, staffing, and data regarding English learners).
Internet access is available at public libraries and other locat ions that are publicly accessible (e.g., the California State Library). Access to the Internet at librariesand public locat ions is generally provided on a first-come, first-served basis. Other use restrict ions may include the hours of operat ion, the length of t ime that aworkstat ion may be used (depending on availability), the types of software programs available on a workstat ion, and the ability to print documents.
Mrs. Julie Tarango, PrincipalPrincipal, Lunada Bay Elementary
As principal of Lunada Bay Elementary School, I would like to welcome you to our school! Lunada Bay Elementary isbeaut ifullysituated on the coast of the Pacific Ocean above the bay for which it was named. Built in 1958, the school has been theheart of the Lunada Bay community in Palos Verdes Estates for over fifty years. Our school prides itself on the not ionthat, “We are Lunada Bay: We are one school, one team, one family.”
As you walk around our school, you w ill hear teachers and staff encouraging students w ith posit ive reinforcement echoinga common language ut ilizing Coach Wooden’s pyramid success. Each month, we ident ify character traits like “hard work”and ident ify students demonstrat ing these qualit ies to represent their class at our monthly flag ceremony. At theceremony, our community gathers to recognize our outstanding students and staff, recite the Pledge of Allegiance, andsing our school song (w ith some help from our mascot, Splash the Dolphin!).
In our classrooms, you w ill find busy students engaged in research projects, math discussions, Writer’s Workshop lessons,reading poetry, building robots w ith our STEM kits, or performing w ith our Fine Arts program. Our teachers are oftencollaborat ing w ith each other to implement contemporary math instruct ion ut ilizing our rigorous curriculum, Math in Focusto secure deeper levels of mathematical understanding and applicat ion. You w ill often hear our teachers ask thestudents, “How do you know that is the right answer? Can you show me another way to solve it?”
Parents of Lunada Bay students have high expectat ions for their children and the school that educates them. Parents andteachers mutually respect one another’s interests and expert ise, ensuring that the best interest of students is thecornerstone for all programs and pedagogy at Lunada Bay.The Parent-Teacher Associat ion (PTA) is crit ical to the cont inued success of the school, and parents at Lunada Baycontribute generously of their t ime and resources. Lunada Bay offers an extensive fine arts program that supplements vocal and instrumental music programs and Art at YourFingert ips provided by the Palos Verdes Arts Center. Each year, students in every grade study for twelve weeks w ith a professional, working art istfrom the Los Angeles area. This experience fosters teamwork, promotes brain connect ivity, and increases self-esteem while exposing studentsto a w ide variety of visual and performing arts.
Come visit us at Lunada Bay, the home of the Dolphins. We look forward to meeting you!
About Our SchoolAbout Our School
Julie Tarango, Principal
Lunada Bay Elementary520 Paseo LunadoPalos Verdes Estates, CA 90274-4377
Phone: 310-377-3005E-mail: [email protected]
ContactContact
2016-17 SARC - Lunada Bay Elementary
Page 2 of 20

Last updated: 1/3/2018
Last updated: 1/3/2018
About This School
Contact Information (School Year 2017-18)Contact Information (School Year 2017-18)
District Contact Information (School Year 2017-18)
District Name Palos Verdes Peninsula Unified
Phone Number (310) 378-9966
Superintendent Don Aust in
E-mail Address aust [email protected]
Web Site www.pvpusd.net
School Contact Information (School Year 2017-18)
School Name Lunada Bay Elementary
Street 520 Paseo Lunado
City, State, Zip Palos Verdes Estates, Ca, 90274-4377
Phone Number 310-377-3005
Principal Mrs. Julie Tarango, Principal
E-mail Address [email protected]
Web Site http://lunadabay.pvpusd.net
County-District-School(CDS) Code
19648656021240
School Description and Mission Statement (School Year 2017-18)School Description and Mission Statement (School Year 2017-18)
It is the mission of Lunada Bay School to develop students of character w ith the ability to think crit ically, be creat ive, communicate, and collaborate w ith others, both personally and through use of technology, to prepare them to be contribut ing cit izens of a global society.
All schools in Palos Verdes Peninsula Unified School District are highly successful academically, as is Lunada Bay due to a highly qualified staff that cont inually focuseson improvement of craft and the changing needs of today’s learner. Beginning in kindergarten, children are instructed and cont inually assessed formally andinformally to determine the appropriate supports and/or extensions necessary for cont inued success w ith appropriate challenge. As students proceed into primaryand intermediate grades, programs that address California State Standards and the incoming Common Core Standards are evaluated and the onus of responsibilityshifts from the teacher to the learner through a st imulat ing environment that focuses on different iat ion, intervent ion, and inclusion of our visual and performingarts program. Integrat ion of technology is carefully planned and evaluated to determine effect iveness and efficacy that goes beyond novelty. All changes indelivery of instruct ion and integrat ion of technology are shared w ith parents to maintain transparency and cont inue the open and trust ing partnerships w ithfamilies that ensure our students are highly successful and confident. As early as 2000, Lunada Bay was prescient in its approach to instruct ion and learning. Ut ilizing experts from UCLA’s University Elementary School, administrat ionand staff examined the processes and init ial skills necessary for moving students into the 21st Century. Pedagogy was examined to address a need to changefrom information provider, “sage on the stage,” to learning facilitator. This vision into the future included, and cont inues to include, integrat ion of technology as atool to facilitate learning. Lunada Bay Elementary, though quaint ly nostalgic on the outside, uses SMARTBoard® technology in every classroom. A minimum of fourdesktop computers and six iPads® are used in every classroom and laptops can be checked out and used as needed. A thirty-eight-stat ion computer lab iscurrent ly under construct ion. Our library houses Mac and PC computer stat ions and a complete science lab is available for hands-on experiences for all students.
2016-17 SARC - Lunada Bay Elementary
Page 3 of 20
Last updated: 1/3/2018
Last updated: 1/3/2018
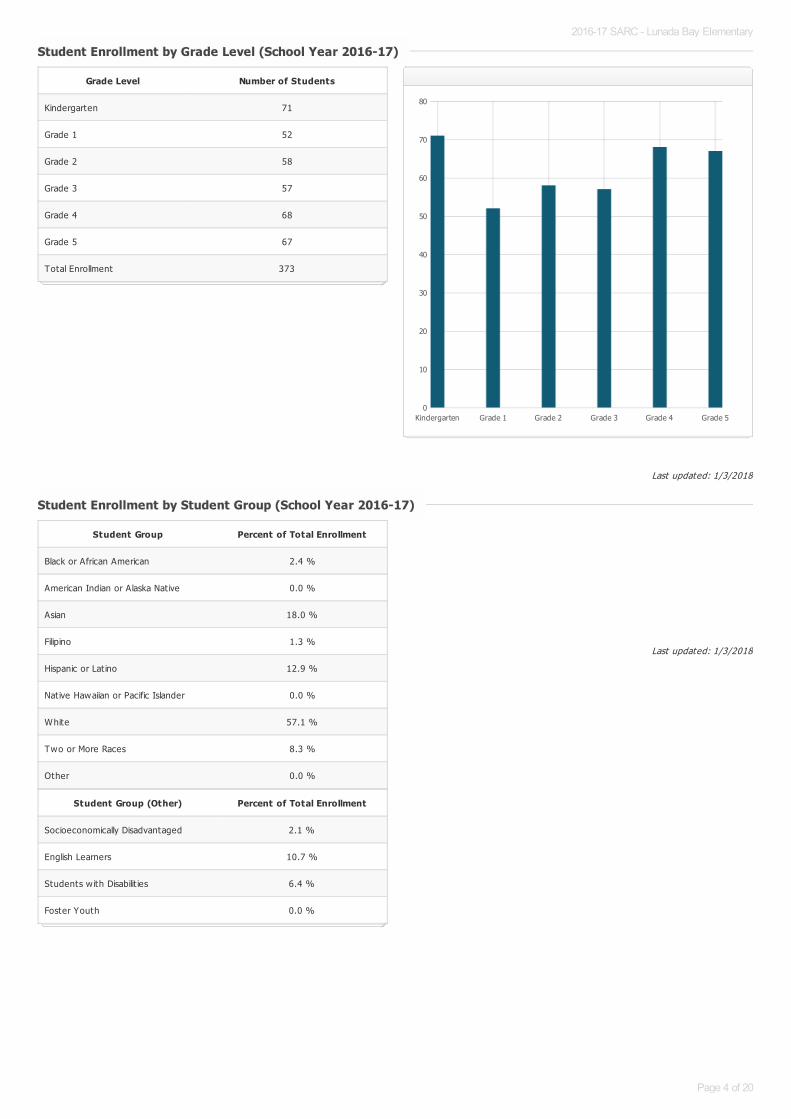
Student Enrollment by Grade Level (School Year 2016-17)Student Enrollment by Grade Level (School Year 2016-17)
Grade Level Number of Students
Kindergarten 71
Grade 1 52
Grade 2 58
Grade 3 57
Grade 4 68
Grade 5 67
Total Enrollment 373
Kindergarten Grade 1 Grade 2 Grade 3 Grade 4 Grade 50
10
20
30
40
50
60
70
80
Student Enrollment by Student Group (School Year 2016-17)Student Enrollment by Student Group (School Year 2016-17)
Student Group Percent of Total Enrollment
Black or African American 2.4 %
American Indian or Alaska Nat ive 0.0 %
Asian 18.0 %
Filipino 1.3 %
Hispanic or Lat ino 12.9 %
Native Hawaiian or Pacific Islander 0.0 %
White 57.1 %
Two or More Races 8.3 %
Other 0.0 %
Student Group (Other) Percent of Total Enrollment
Socioeconomically Disadvantaged 2.1 %
English Learners 10.7 %
Students w ith Disabilit ies 6.4 %
Foster Youth 0.0 %
2016-17 SARC - Lunada Bay Elementary
Page 4 of 20

Last updated: 1/5/2018
Last updated: 1/5/2018
A. Conditions of Learning
State Priority: Basic
The SARC provides the follow ing information relevant to the State priority: Basic (Priority 1):
Degree to which teachers are appropriately assigned and fully credent ialed in the subject area and for the pupils they are teaching;Pupils have access to standards-aligned instruct ional materials; andSchool facilit ies are maintained in good repair
Note: “Misassignments” refers to the number of posit ions filled by teachers who lack legal authorizat ion to teach that grade level, subject area, student group, etc.
* Total Teacher Misassignments includes the number of Misassignments of Teachers of English Learners.
Teacher CredentialsTeacher Credentials
Teachers School District
2015-16
2016-17
2017-18
2017-18
With Full Credent ial 15 15 16 504
Without Full Credent ial 0 0 0 1
Teachers Teaching Outside SubjectArea of Competence (w ith fullcredent ial)
0 0 0 0
2015-16 2016-17 2017-180.0
2.5
5.0
7.5
10.0
12.5
15.0
17.5Teachers with Full Credential
Teachers without Full Credential
Teachers Teaching Outside Subject Area of Competence
Teacher Misassignments and Vacant Teacher PositionsTeacher Misassignments and Vacant Teacher Positions
Indicator2015-
162016-
172017-
18
Misassignments of Teachers of EnglishLearners
0 0 0
Total Teacher Misassignments* 0 0 0
Vacant Teacher Posit ions 0 0 0
2015-16 2016-17 2017-18-1.0
-0.5
0.0
0.5
1.0Misassignments of Teachers of English Learners
Total Teacher Misassignments
Vacant Teacher Positions
2016-17 SARC - Lunada Bay Elementary
Page 5 of 20

Year and month in which the data were collected: October 2017
Quality, Currency, Availability of Textbooks and Instructional Materials (School Year 2017-18)Quality, Currency, Availability of Textbooks and Instructional Materials (School Year 2017-18)
Subject Textbooks and Instructional Materials/year of AdoptionFrom Most Recent
Adoption?Percent Students Lacking Own
Assigned Copy
Reading/Language ArtsGrade K
Pract ice Book Student Edit ion, Level K, Houghton Mifflin, 2003
Grade 1
Student Anthology, Here We Go, Level 1, Houghton Mifflin,2003
Student Anthology, Lets Be Friends Level 1.2, Houghton Mifflin,2003
Student Anthology, Surprises, Level 1.3, Houghton Mifflin, 2003
Student Anthology, Treasures, Level 1.4, Houghton Mifflin,2003
Grade 2
Student Anthology, Adventures, Level 2.1, Houghton Mifflin,2003
Student Anthology, Delights, Level 2.2, Houghton Mifflin, 2003
Grade 3
Student Anthology, Rewards, Level 3.1, Houghton Mifflin, 2003
Student Anthology, Horizons, Level 3.2, Houghton Mifflin, 2003
Grade 4
Student Anthology, Tradit ions, Level 4, Houghton Mifflin, 2003
Grade 5
Student Anthology, Expedit ions, Level 5, Houghton Mifflin, 2003
Yes 0.0 %
MathematicsGrades K-5
Math In Focus, Singapore Math, Houghton Mifflin Harcourt
Math In Focus, HMH, 2012 Student Ed 978-0-547-64680-0 –Set of 4 – Kdg
Student Edit ion, Book A Part 1
Student Edit ion, Book A Part 2
Student Edit ion, Book B Part 1
Student Edit ion, Book B Part 2
Math In Focus, HMH, 2015 Student Ed 978-0-544-22396-7 –Grade 1
Math In Focus, HMH, 2015 Workbooks Bundle A&B 978-0-544-22400-1 – Grade 1
Math In Focus, HMH, 2015 Student Ed 978-0-544-22406-3 –Grade 2
Math In Focus, HMH, 2015 Workbooks Bundle A&B 978-0-544-22410-0 – Grade 2
Math In Focus, HMH, 2015 Student Ed 978-0-544-22416-2 –Grade 3
Math In Focus, HMH, 2015 Workbooks Bundle A&B 978-0-544-22420-9 – Grade 3
Math In Focus, HMH, 2015 Student Ed 978-0-544-22426-1 –Grade 4
Yes 0.0 %
2016-17 SARC - Lunada Bay Elementary
Page 6 of 20

Last updated: 1/5/2018
Note: Cells w ith N/A values do not require data.
Math In Focus, HMH, 2015 Workbooks Bundle A&B 978-0-544-22430-8 – Grade 4
Math In Focus, HMH, 2015 Student Ed 978-0-544-22440-7 –Grade 5
Math In Focus, HMH, 2015 Workbooks Bundle A&B978-0-544-22430-8 – Grade 5
ScienceGrade K
California Science Big Book Flip Chart, Pearson-Scott Foresman,2008
Grades 1-2
California Science, Pupil Edit ion, Pearson-Scott Foresman, 2008
Grades 3-5
California Science, Pupil Edit ion, MacMillan/McGraw-Hill, 2008
Yes 0.0 %
History-Social ScienceGrade K
History-Social Science for California, Pearson-Scott Foresman2007
Grade 1
California Vistas, MacMillan/McGraw-Hill, 2007Unit Big Book Package
Grade 2
California Vistas, MacMillan/McGraw-Hill, 2007
Grade 3
California Vistas, MacMillan/McGraw-Hill, 2007
Grade 4
California Vistas, MacMillan/McGraw-Hill, 2007
Grade 5
California Vistas, MacMillan/McGraw-Hill, 2007
Yes 0.0 %
Foreign Language 0.0 %
HealthGrade TK
Health and Wellness, McMillan/McGraw Hill, 2006
Grades K-5
Health and Fitness, Harcourt School Publishers, 2006
Yes 0.0 %
Visual and Performing ArtsGrades K-5
Making Music, Silver Burdett
Yes 0.0 %
Science Lab Eqpmt(Grades 9-12)
N/A N/A 0.0 %
2016-17 SARC - Lunada Bay Elementary
Page 7 of 20

Last updated: 1/8/2018
Last updated: 1/3/2018
School Facility Good Repair StatusYear and month of the most recent FIT report: January 2018
Overall Facility RateYear and month of the most recent FIT report: January 2018
School Facility Conditions and Planned ImprovementsSchool Facility Conditions and Planned Improvements
Maintenance and Repair:
District maintenance staff ensures that the repairs necessary to keep the school in good repair and working order are completed in a t imely manner. An onlinework order process is used to ensure efficient service and that emergency repairs are given the highest priority.
Cleaning Process and Schedule:
The District 's Board of Educat ion has adopted cleaning standards for all schools in the district . A summary of these standards is available at the school office or atthe district office. The principal works daily w ith the custodial staff to develop cleaning schedules to ensure a clean and safe school.
Facility Improvements:
In the 2013-2014 school year, a computer lab was added w ith upgraded electrical and Internet capabilit ies. In the summer of 2015, three buildings received anew roof. The staff parking lot was repaved in 2015. A security gate was installed between the MPR and our staff parking lot in January of 2016. The studentbathroom buildings received roof repair during the summer of 2016. Improved lightening systems and a new projector was installed in the MPR in 2016.
Repair Status:
Lunada Bay is a fifty-seven year old facility w ith seven permanent buildings and four portable classrooms. All academic classrooms are housed in five of thepermanent buildings. The kitchen/mult i-purpose room are in one building and the office is in another. All system are in good repair.
System Inspected RatingRepair Needed and
Action Taken or Planned
Systems: Gas Leaks, Mechanical/HVAC,Sewer
Good
Interior: Interior Surfaces Good
Cleanliness: Overall Cleanliness,Pest/Vermin Infestat ion
GoodIncreased treatment for
gophers and squirrelsprovided.
Electrical: Electrical Good
Restrooms/Fountains: Restrooms,Sinks/Fountains
GoodInstalled three water bott le
filling stat ions.
Safety: Fire Safety, HazardousMaterials
Good
Structural: Structural Damage, Roofs Good
External: Playground/School Grounds,W indows/Doors/Gates/Fences
GoodPlay structure surfacing is
old and regular repairsrequired.
Overall Rat ing Good
2016-17 SARC - Lunada Bay Elementary
Page 8 of 20

Last updated: 1/3/2018
B. Pupil Outcomes
State Priority: Pupil Achievement
The SARC provides the follow ing information relevant to the State priority: Pupil Achievement (Priority 4):
Statewide assessments (i.e., California Assessment of Student Performance and Progress [CAASPP] System, which includes the Smarter Balanced SummativeAssessments for students in the general educat ion populat ion and the California Alternate Assessments [CAAs] for English language arts/literacy [ELA] andmathematics given in grades three through eight and grade eleven. Only eligible students may part icipate in the administrat ion of the CAAs. CAAs items arealigned w ith alternate achievement standards, which are linked w ith the Common Core State Standards [CCSS] for students w ith the most significant cognit ivedisabilit ies); and
The percentage of students who have successfully completed courses that sat isfy the requirements for entrance to the University of California and the CaliforniaState University, or career technical educat ion sequences or programs of study.
Note: Percentages are not calculated when the number of students tested is ten or less, either because the number of students in this category is too small forstat ist ical accuracy or to protect student privacy.
CAASPP Test Results in ELA and Mathematics for All StudentsCAASPP Test Results in ELA and Mathematics for All Students
Grades Three through Eight and Grade Eleven Grades Three through Eight and Grade Eleven (School Year 2016-17)(School Year 2016-17)
Subject
Percentage of Students Meeting or Exceeding the State Standards
School District State
2015-16 2016-17 2015-16 2016-17 2015-16 2016-17
English Language Arts / Literacy (grades 3-8 and 11) 80% 72% 80% 78% 48% 48%
Mathematics (grades 3-8 and 11) 69% 60% 73% 72% 36% 37%
2016-17 SARC - Lunada Bay Elementary
Page 9 of 20
Last updated: 1/3/2018
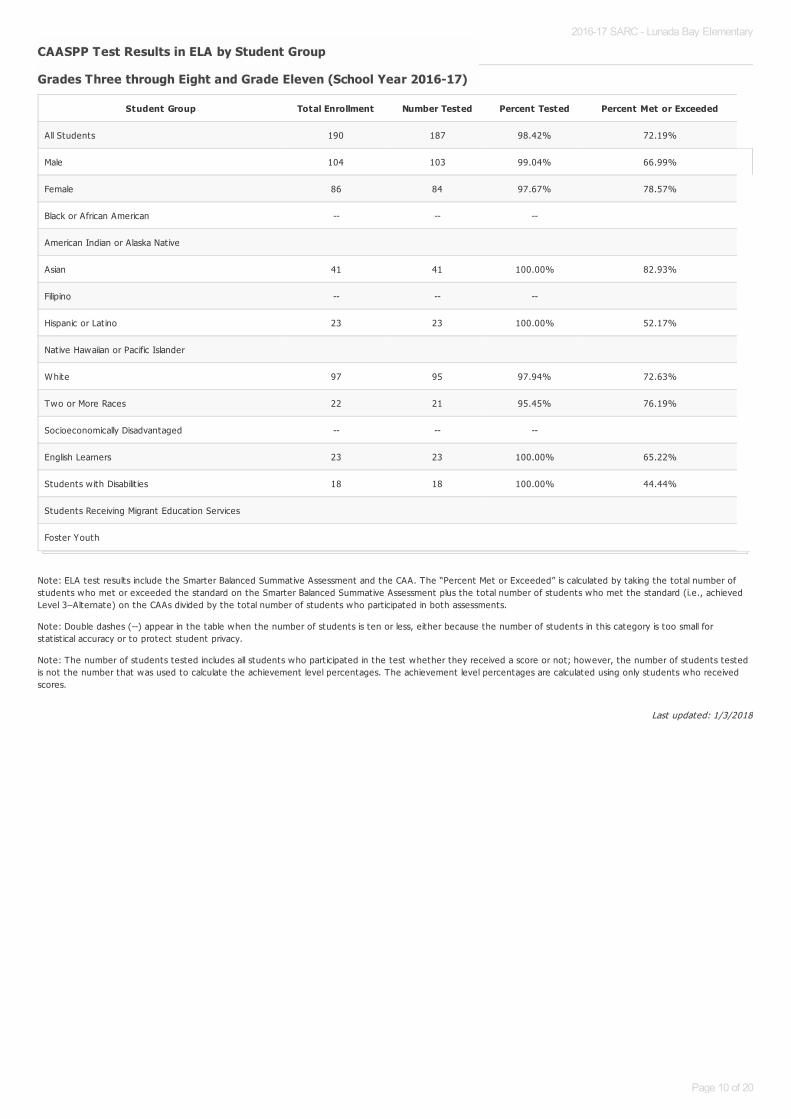
Note: ELA test results include the Smarter Balanced Summative Assessment and the CAA. The “Percent Met or Exceeded” is calculated by taking the total number ofstudents who met or exceeded the standard on the Smarter Balanced Summative Assessment plus the total number of students who met the standard (i.e., achievedLevel 3–Alternate) on the CAAs divided by the total number of students who part icipated in both assessments.
Note: Double dashes (--) appear in the table when the number of students is ten or less, either because the number of students in this category is too small forstat ist ical accuracy or to protect student privacy.
Note: The number of students tested includes all students who part icipated in the test whether they received a score or not; however, the number of students testedis not the number that was used to calculate the achievement level percentages. The achievement level percentages are calculated using only students who receivedscores.
CAASPP Test Results in ELA by Student Group CAASPP Test Results in ELA by Student Group
Grades Three through Eight and Grade Eleven (School Year 2016-17)Grades Three through Eight and Grade Eleven (School Year 2016-17)
Student Group Total Enrollment Number Tested Percent Tested Percent Met or Exceeded
All Students 190 187 98.42% 72.19%
Male 104 103 99.04% 66.99%
Female 86 84 97.67% 78.57%
Black or African American -- -- --
American Indian or Alaska Nat ive
Asian 41 41 100.00% 82.93%
Filipino -- -- --
Hispanic or Lat ino 23 23 100.00% 52.17%
Native Hawaiian or Pacific Islander
White 97 95 97.94% 72.63%
Two or More Races 22 21 95.45% 76.19%
Socioeconomically Disadvantaged -- -- --
English Learners 23 23 100.00% 65.22%
Students w ith Disabilit ies 18 18 100.00% 44.44%
Students Receiving Migrant Educat ion Services
Foster Youth
2016-17 SARC - Lunada Bay Elementary
Page 10 of 20
Last updated: 1/3/2018
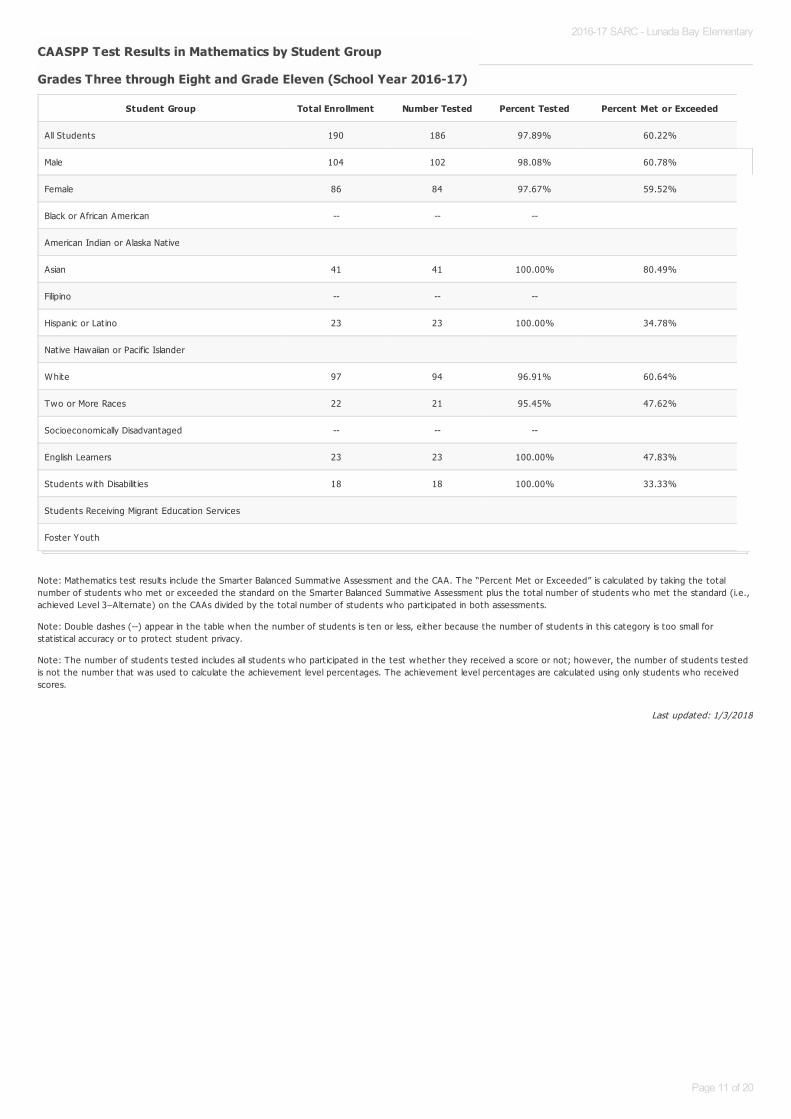
Note: Mathematics test results include the Smarter Balanced Summative Assessment and the CAA. The “Percent Met or Exceeded” is calculated by taking the totalnumber of students who met or exceeded the standard on the Smarter Balanced Summative Assessment plus the total number of students who met the standard (i.e.,achieved Level 3–Alternate) on the CAAs divided by the total number of students who part icipated in both assessments.
Note: Double dashes (--) appear in the table when the number of students is ten or less, either because the number of students in this category is too small forstat ist ical accuracy or to protect student privacy.
Note: The number of students tested includes all students who part icipated in the test whether they received a score or not; however, the number of students testedis not the number that was used to calculate the achievement level percentages. The achievement level percentages are calculated using only students who receivedscores.
CAASPP Test Results in Mathematics by Student GroupCAASPP Test Results in Mathematics by Student Group
Grades Three through Eight and Grade Eleven (School Year 2016-17)Grades Three through Eight and Grade Eleven (School Year 2016-17)
Student Group Total Enrollment Number Tested Percent Tested Percent Met or Exceeded
All Students 190 186 97.89% 60.22%
Male 104 102 98.08% 60.78%
Female 86 84 97.67% 59.52%
Black or African American -- -- --
American Indian or Alaska Nat ive
Asian 41 41 100.00% 80.49%
Filipino -- -- --
Hispanic or Lat ino 23 23 100.00% 34.78%
Native Hawaiian or Pacific Islander
White 97 94 96.91% 60.64%
Two or More Races 22 21 95.45% 47.62%
Socioeconomically Disadvantaged -- -- --
English Learners 23 23 100.00% 47.83%
Students w ith Disabilit ies 18 18 100.00% 33.33%
Students Receiving Migrant Educat ion Services
Foster Youth
2016-17 SARC - Lunada Bay Elementary
Page 11 of 20

Last updated: 1/3/2018
Note: Science test results include California Standards Tests (CSTs), California Modified Assessment (CMA), and California Alternate Performance Assessment (CAPA) ingrades five, eight, and ten.
Note: Scores are not shown when the number of students tested is ten or less, either because the number of students in this category is too small for stat ist icalaccuracy or to protect student privacy.
Note:The 2016-17 data are not available. The California Department of Educat ion is developing a new science assessment based on the Next Generat ion ScienceStandards for California Public Schools (CA NGSS). The new California Science Test (CAST) was piloted in spring 2017. The CST and CMA for Science w ill no longer beadministered.
CAASPP Test Results in Science for All StudentsCAASPP Test Results in Science for All Students
Grades Five, Eight and TenGrades Five, Eight and Ten
Subject
Percentage of Students Scoring at Proficient or Advanced
School District State
2014-15 2015-16 2014-15 2015-16 2014-15 2015-16
Science (grades 5, 8, and 10) 86.0% 86.0% 87.0% 87.0% 56% 54%
2016-17 SARC - Lunada Bay Elementary
Page 12 of 20

Last updated: 1/3/2018
State Priority: Other Pupil Outcomes
The SARC provides the follow ing information relevant to the State priority: Other Pupil Outcomes (Priority 8):
Pupil outcomes in the subject area of physical educat ion
Note: Percentages are not calculated when the number of students tested is ten or less, either because the number of students in this category is too small forstat ist ical accuracy or to protect student privacy.
California Physical Fitness Test Results (School Year 2016-17)California Physical Fitness Test Results (School Year 2016-17)
Grade Level
Percentage of Students Meeting Fitness Standards
Four of Six Fitness Standards Five of Six Fitness Standards Six of Six Fitness Standards
5 9.1% 16.7% 68.2%
2016-17 SARC - Lunada Bay Elementary
Page 13 of 20

Last updated: 1/3/2018
C. Engagement
State Priority: Parental Involvement
The SARC provides the follow ing information relevant to the State priority: Parental Involvement (Priority 3):
Efforts the school district makes to seek parent input in making decisions for the school district and each schoolsite
State Priority: Pupil Engagement
The SARC provides the follow ing information relevant to the State priority: Pupil Engagement (Priority 5):
High school dropout rates; andHigh school graduat ion rates
Opportunities for Parental Involvement (School Year 2017-18)Opportunities for Parental Involvement (School Year 2017-18)
Parent part icipat ion and support is crit ical to the success and performance of Lunada Bay Elementary. Parents are welcome volunteers at every grade level,working w ith small groups of students, running learning centers, assist ing w ith art projects, edit ing writ ing projects w ith young writers, and complet ing clericaltasks. Lunada Bay's PTA is act ive year round. Montly meetings are held on campus the second Tuesday of the month at 8:30 am and all parents are invited toattend. PTA plans and provides both educat ional and recreat ional act ivit ies that range from assemblies to bicycle safety checks to Family Fun Nights. There isalways some way parents can be involved. Please contact the school office at 310-377-3005 to be connected to a person who can match your desire to assistw ith the appropriate programs. THe PTA webiste can be found at: http://lunadabaypta.com/Home
2016-17 SARC - Lunada Bay Elementary
Page 14 of 20
Last updated: 1/3/2018
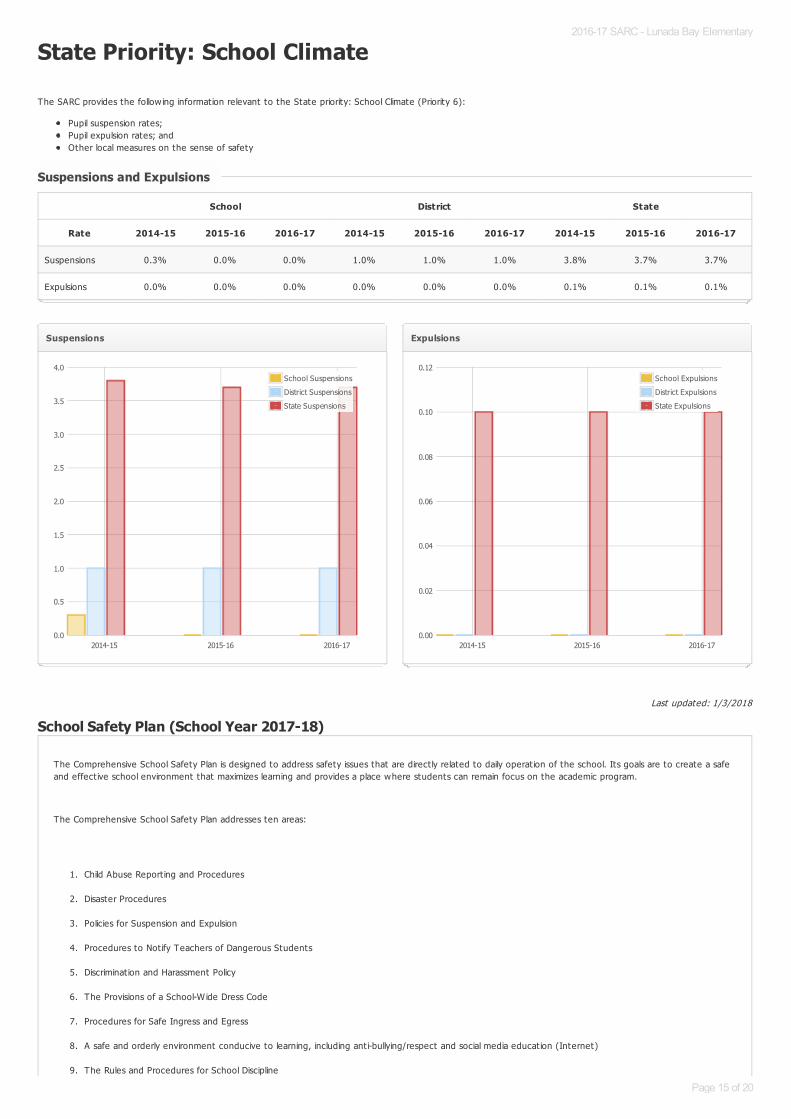
State Priority: School Climate
The SARC provides the follow ing information relevant to the State priority: School Climate (Priority 6):
Pupil suspension rates;Pupil expulsion rates; andOther local measures on the sense of safety
School Safety Plan (School Year 2017-18)
Suspensions and ExpulsionsSuspensions and Expulsions
School District State
Rate 2014-15 2015-16 2016-17 2014-15 2015-16 2016-17 2014-15 2015-16 2016-17
Suspensions 0.3% 0.0% 0.0% 1.0% 1.0% 1.0% 3.8% 3.7% 3.7%
Expulsions 0.0% 0.0% 0.0% 0.0% 0.0% 0.0% 0.1% 0.1% 0.1%
Suspensions
2014-15 2015-16 2016-170.0
0.5
1.0
1.5
2.0
2.5
3.0
3.5
4.0School Suspensions
District Suspensions
State Suspensions
Expulsions
2014-15 2015-16 2016-170.00
0.02
0.04
0.06
0.08
0.10
0.12School Expulsions
District Expulsions
State Expulsions
The Comprehensive School Safety Plan is designed to address safety issues that are direct ly related to daily operat ion of the school. Its goals are to create a safeand effect ive school environment that maximizes learning and provides a place where students can remain focus on the academic program.
The Comprehensive School Safety Plan addresses ten areas:
1. Child Abuse Report ing and Procedures
2. Disaster Procedures
3. Policies for Suspension and Expulsion
4. Procedures to Not ify Teachers of Dangerous Students
5. Discriminat ion and Harassment Policy
6. The Provisions of a School-W ide Dress Code
7. Procedures for Safe Ingress and Egress
8. A safe and orderly environment conducive to learning, including ant i-bullying/respect and social media educat ion (Internet)
9. The Rules and Procedures for School Discipline
2016-17 SARC - Lunada Bay Elementary
Page 15 of 20
Last updated: 1/3/2018
10. Hate Crime Report ing Procedures
A copy of the Comprehensive School Safety Plan is available for public inspect ion, upon request, in the main office of the school. This plan was last reviewed andupdated in September 2017.
2016-17 SARC - Lunada Bay Elementary
Page 16 of 20
Last updated: 1/3/2018
Last updated: 1/3/2018
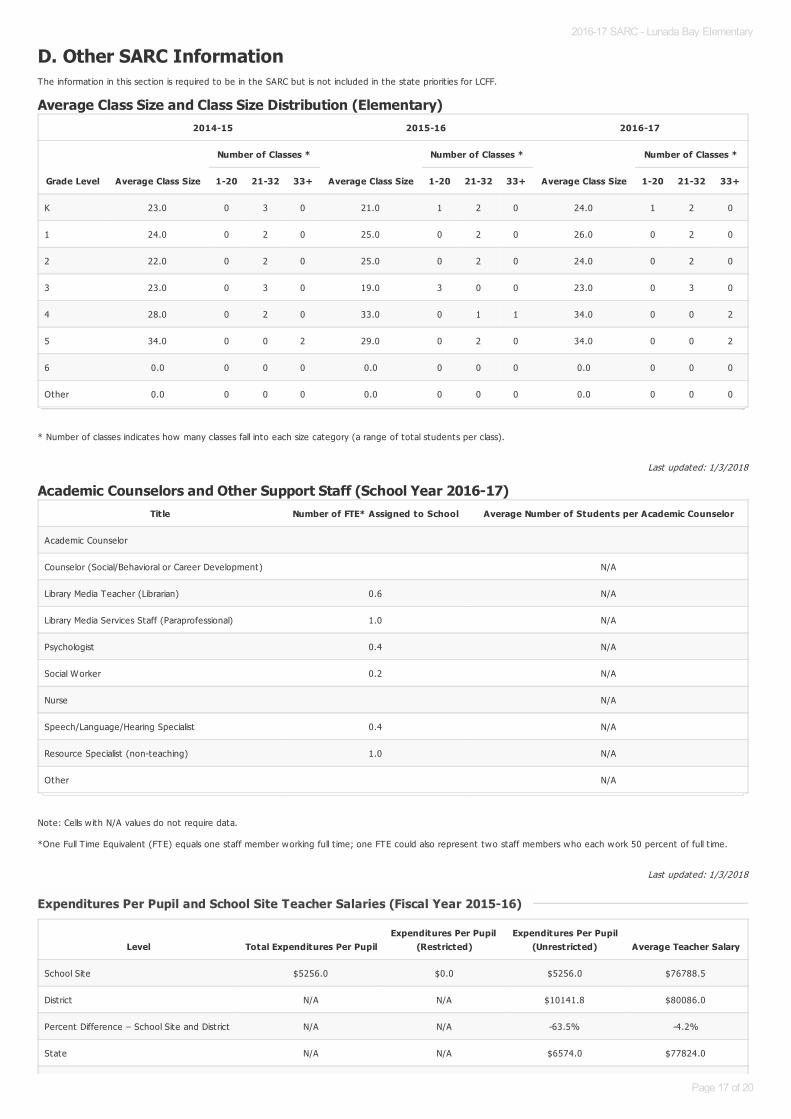
D. Other SARC InformationThe information in this sect ion is required to be in the SARC but is not included in the state priorit ies for LCFF.
Average Class Size and Class Size Distribution (Elementary)
* Number of classes indicates how many classes fall into each size category (a range of total students per class).
Academic Counselors and Other Support Staff (School Year 2016-17)
Note: Cells w ith N/A values do not require data.
*One Full T ime Equivalent (FTE) equals one staff member working full t ime; one FTE could also represent two staff members who each work 50 percent of full t ime.
2014-15 2015-16 2016-17
Grade Level Average Class Size
Number of Classes *
Average Class Size
Number of Classes *
Average Class Size
Number of Classes *
1-20 21-32 33+ 1-20 21-32 33+ 1-20 21-32 33+
K 23.0 0 3 0 21.0 1 2 0 24.0 1 2 0
1 24.0 0 2 0 25.0 0 2 0 26.0 0 2 0
2 22.0 0 2 0 25.0 0 2 0 24.0 0 2 0
3 23.0 0 3 0 19.0 3 0 0 23.0 0 3 0
4 28.0 0 2 0 33.0 0 1 1 34.0 0 0 2
5 34.0 0 0 2 29.0 0 2 0 34.0 0 0 2
6 0.0 0 0 0 0.0 0 0 0 0.0 0 0 0
Other 0.0 0 0 0 0.0 0 0 0 0.0 0 0 0
Title Number of FTE* Assigned to School Average Number of Students per Academic Counselor
Academic Counselor
Counselor (Social/Behavioral or Career Development) N/A
Library Media Teacher (Librarian) 0.6 N/A
Library Media Services Staff (Paraprofessional) 1.0 N/A
Psychologist 0.4 N/A
Social Worker 0.2 N/A
Nurse N/A
Speech/Language/Hearing Specialist 0.4 N/A
Resource Specialist (non-teaching) 1.0 N/A
Other N/A
Expenditures Per Pupil and School Site Teacher Salaries (Fiscal Year 2015-16)Expenditures Per Pupil and School Site Teacher Salaries (Fiscal Year 2015-16)
Level Total Expenditures Per PupilExpenditures Per Pupil
(Restricted)Expenditures Per Pupil
(Unrestricted) Average Teacher Salary
School Site $5256.0 $0.0 $5256.0 $76788.5
District N/A N/A $10141.8 $80086.0
Percent Difference – School Site and District N/A N/A -63.5% -4.2%
State N/A N/A $6574.0 $77824.0
2016-17 SARC - Lunada Bay Elementary
Page 17 of 20

Last updated: 1/8/2018
Note: Cells w ith N/A values do not require data.
Percent Difference – School Site and State N/A N/A -22.3% -1.3%2016-17 SARC - Lunada Bay Elementary
Page 18 of 20
Last updated: 1/8/2018
For detailed information on salaries, see the CDE Cert ificated Salaries & Benefits Web page at http://www.cde.ca.gov/ds/fd/cs/ .
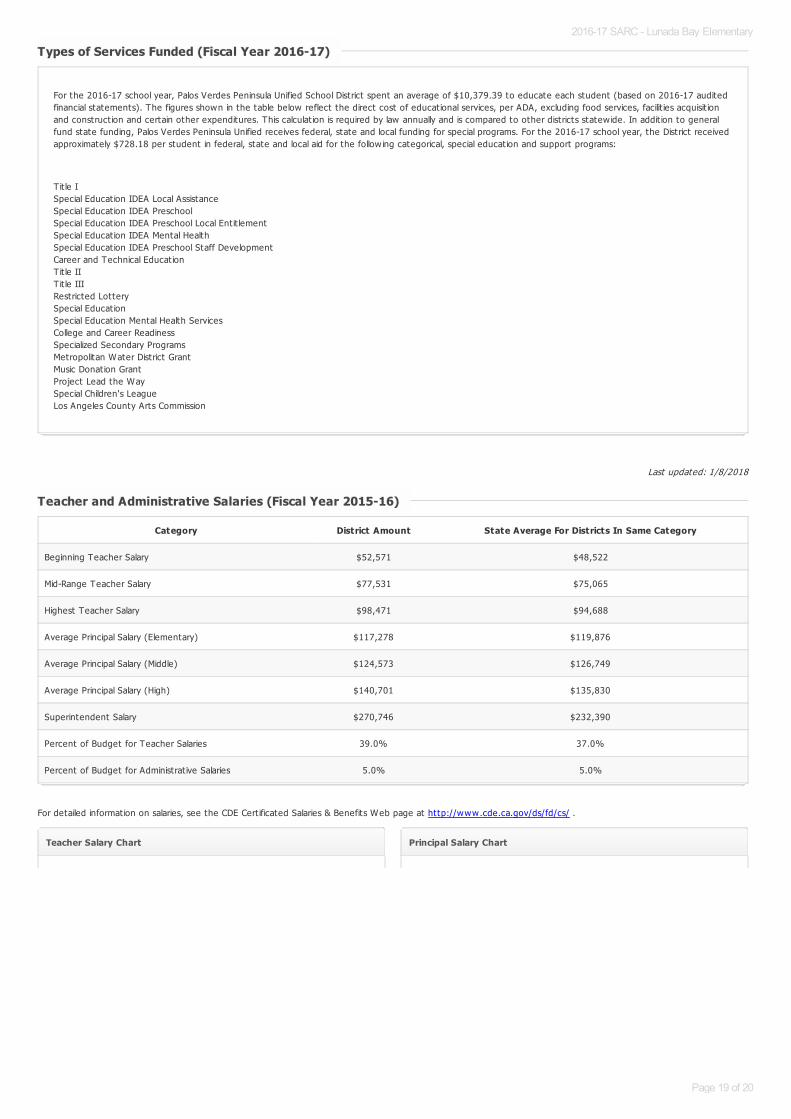
Types of Services Funded (Fiscal Year 2016-17)Types of Services Funded (Fiscal Year 2016-17)
For the 2016-17 school year, Palos Verdes Peninsula Unified School District spent an average of $10,379.39 to educate each student (based on 2016-17 auditedfinancial statements). The figures shown in the table below reflect the direct cost of educat ional services, per ADA, excluding food services, facilit ies acquisit ionand construct ion and certain other expenditures. This calculat ion is required by law annually and is compared to other districts statew ide. In addit ion to generalfund state funding, Palos Verdes Peninsula Unified receives federal, state and local funding for special programs. For the 2016-17 school year, the District receivedapproximately $728.18 per student in federal, state and local aid for the follow ing categorical, special educat ion and support programs:
Tit le ISpecial Educat ion IDEA Local AssistanceSpecial Educat ion IDEA PreschoolSpecial Educat ion IDEA Preschool Local Ent it lementSpecial Educat ion IDEA Mental HealthSpecial Educat ion IDEA Preschool Staff DevelopmentCareer and Technical Educat ionTit le IIT it le IIIRestricted LotterySpecial Educat ionSpecial Educat ion Mental Health ServicesCollege and Career ReadinessSpecialized Secondary ProgramsMetropolitan Water District GrantMusic Donat ion GrantProject Lead the WaySpecial Children's LeagueLos Angeles County Arts Commission
Teacher and Administrative Salaries (Fiscal Year 2015-16)Teacher and Administrative Salaries (Fiscal Year 2015-16)
Category District Amount State Average For Districts In Same Category
Beginning Teacher Salary $52,571 $48,522
Mid-Range Teacher Salary $77,531 $75,065
Highest Teacher Salary $98,471 $94,688
Average Principal Salary (Elementary) $117,278 $119,876
Average Principal Salary (Middle) $124,573 $126,749
Average Principal Salary (High) $140,701 $135,830
Superintendent Salary $270,746 $232,390
Percent of Budget for Teacher Salaries 39.0% 37.0%
Percent of Budget for Administrat ive Salaries 5.0% 5.0%
Teacher Salary Chart
120000
Principal Salary Chart
150000
2016-17 SARC - Lunada Bay Elementary
Page 19 of 20

Last updated: 1/3/2018
Last updated: 1/3/2018
Professional Development
Beginning Teacher Salary Mid-Range Teacher Salary Highest Teacher Salary0
20000
40000
60000
80000
100000
120000
Average Principal Salary
(Elementary)
Average Principal Salary
(Middle)
Average Principal Salary
(High)
0
25000
50000
75000
100000
125000
150000
Professional Development focused on the implementat ion of the teaching and learning strategies associated w ith the California State Standards. All teachers, K-12 have been developing an understanding of close reading strategies, depth of designing lessons/assessments, and implementing curriculum support ing thestandards. Teachers have been provided opportunit ies to observe lessons taught by colleagues and district TOSAs. Curriculum mapping and teacher art iculat ionhas been a significant part of the Professional Development. There has been an effort to provide CAASP training and pract ice for teachers and studentsregarding performance tasks in both English Language Arts and Mathematics.
Professional Development has been provided by the school district and TOSAs to assist teachers in understanding the claims made in State Standards regardingwhat students w ill be able to do in English Language Arts and Mathematics. Committees of in-service teachers meet regularly to delve into standards andmaterials. Teachers are supported in after-school workshops, conferences, and through individual mentoring to perfect skills and deepen understanding ofstudent learning in the 21st Century. New materials and technologies have been piloted w ith regular examinat ion of the effect iveness of the materials andtechnologies to determine further use. Evaluat ion of data from programs used w ithin the school affirms students are making progress. During the 2016-17 schoolyear, professional development has focused on conversat ions about how to support and foster a growth mindset w ith students to bolster thier academicachievement. Teachers also spent several days of training on how to support a Writer's Workshop model in thier classroom and enhance their writ inginstruct ion.
2016-17 SARC - Lunada Bay Elementary
Page 20 of 20

![AGATE PATTERNS - Lunada Bay Tile · 2019 Agate [ægit] Geological patterns are the rock stars of today's design. As the name suggests, the Agate glass collection is evocative of the](https://static.fdocuments.in/doc/165x107/6051e8d883e5ee10060d01f0/agate-patterns-lunada-bay-2019-agate-git-geological-patterns-are-the-rock.jpg)
![LBT brochure origami mosaic 1 - Lunada Bay TileOrigami [or ə 'ga mē] Field noun origin: Japanese 1. The Japanese art or process of folding squares of paper into representational](https://static.fdocuments.in/doc/165x107/5e6442be38c517298f22e971/lbt-brochure-origami-mosaic-1-lunada-bay-origami-or-ga-m-field-noun-origin.jpg)