SARC Report for John Adams Academy - Edl Accountability Report Card ... By combining classical...
36
John Adams Academy By February 1 of each year, every school in California is required by state law to publish a School Accountability Report Card (SARC).The SARC contains information about the condition and performance of each California public school. Under the Local Control Funding Formula (LCFF) all local educational agencies (LEAs) are required to prepare a Local Control Accountability Plan (LCAP), which describes how they intend to meet annual school-specific goals for all pupils, with specific activities to address state and local priorities. Additionally, data reported in an LCAP is to be consistent with data reported in the SARC. For more information about SARC requirements, see the California Department of Education (CDE) SARC Web page at http://www.cde.ca.gov/ta/ac/sa/ . For more information about the LCFF or LCAP, see the CDE LCFF Web page at http://www.cde.ca.gov/fg/aa/lc/ . For additional information about the school, parents/guardians, and community members should contact the school principal or the district office. DataQuest Internet Access California Department of Education School Accountability Report Card Reported Using Data from the 2015-16 School Year DataQuest is an online data tool located on the CDE DataQuest Web page that contains additional information about this school and comparisons of the school to the district and the county. Specifically, DataQuest is a dynamic system that provides reports for accountability (e.g., test data, enrollment, high school graduates, dropouts, course enrollments, staffing, and data regarding English learners). Internet access is available at public libraries and other locations that are publicly accessible (e.g., the California State Library). Access to the Internet at libraries and public locations is generally provided on a first-come, first-served basis. Other use restrictions may include the hours of operation, the length of time that a workstation may be used (depending on availability), the types of software programs available on a workstation, and the ability to print documents. Heather Brown, Headmaster Principal, John Adams Academy It is great privilege to serve as the Headmaster for Northern California’s only classical, servant leadership education public charter school and a huge responsibility to be entrusted with so many great lives. The mission of restoring America’s heritage is a lofty goal but is one that is necessary if we are to pass down the first principles of freedom for which our Founding Fathers pledged their lives, fortunes and sacred honors. A nation that intends to retain its liberty must be held together by empathetic, caring leaders, who are prepared to serve for the common good. Classics allow us to engage the great mentors throughout history. Through these great mentors our scholars come face to face with some of the most profound ideas mankind has ever conceived. Combined with their zeal for academics and virtue, our scholars are restoring America's heritage everyday. Our scholars have taught us that when a child finds their special excellence, or calling in life, they become a self-directed, servant leader with cause. Our discussions of mission and service perfect what is ordinarily seen as an end and makes a classical education the means for creating lifelong learners who put the needs of others before their own. Whether you are a parent, community member or business person, I personally invite you to come experience the magic that happens at the Academy every day, so that you too may join us on the journey of servant leadership. Yours in Service, Heather Brown John Adams Academy One Sierragate Plaza Roseville, CA 95678-5423 Phone: 916-780-6800 E-mail: [email protected] About Our School About Our School Contact Contact
Transcript of SARC Report for John Adams Academy - Edl Accountability Report Card ... By combining classical...

John Adams Academy
By February 1 of each year, every school in California is required by state law to publish a School Accountability Report Card (SARC).The SARC contains information aboutthe condit ion and performance of each California public school. Under the Local Control Funding Formula (LCFF) all local educat ional agencies (LEAs) are required toprepare a Local Control Accountability Plan (LCAP), which describes how they intend to meet annual school-specific goals for all pupils, w ith specific act ivit ies to addressstate and local priorit ies. Addit ionally, data reported in an LCAP is to be consistent w ith data reported in the SARC.
For more information about SARC requirements, see the California Department of Educat ion (CDE) SARC Web page at http://www.cde.ca.gov/ta/ac/sa/.
For more information about the LCFF or LCAP, see the CDE LCFF Web page at http://www.cde.ca.gov/fg/aa/lc/.
For addit ional information about the school, parents/guardians, and community members should contact the school principal or the district office.
DataQuest
Internet Access
California Department of Education
School Accountability Report CardReported Using Data from the 2015-16 School Year
DataQuest is an online data tool located on the CDE DataQuest Web page that contains addit ional information about this school and comparisons of the school tothe district and the county. Specifically, DataQuest is a dynamic system that provides reports for accountability (e.g., test data, enrollment, high school graduates,dropouts, course enrollments, staffing, and data regarding English learners).
Internet access is available at public libraries and other locat ions that are publicly accessible (e.g., the California State Library). Access to the Internet at librariesand public locat ions is generally provided on a first-come, first-served basis. Other use restrict ions may include the hours of operat ion, the length of t ime that aworkstat ion may be used (depending on availability), the types of software programs available on a workstat ion, and the ability to print documents.
Heather Brown, HeadmasterPrincipal, John Adams Academy
It is great privilege to serve as the Headmaster for Northern California’s only classical, servant leadership educat ion publiccharter school and a huge responsibility to be entrusted w ith so many great lives. The mission of restoring America’sheritage is a lofty goal but is one that is necessary if we are to pass down the first principles of freedom for which ourFounding Fathers pledged their lives, fortunes and sacred honors.
A nat ion that intends to retain its liberty must be held together by empathet ic, caring leaders, who are prepared to servefor the common good. Classics allow us to engage the great mentors throughout history. Through these great mentorsour scholars come face to face w ith some of the most profound ideas mankind has ever conceived. Combined w ith theirzeal for academics and virtue, our scholars are restoring America's heritage everyday.
Our scholars have taught us that when a child finds their special excellence, or calling in life, they become a self-directed,servant leader w ith cause. Our discussions of mission and service perfect what is ordinarily seen as an end and makes aclassical educat ion the means for creat ing lifelong learners who put the needs of others before their own.
Whether you are a parent, community member or business person, I personally invite you to come experience the magicthat happens at the Academy every day, so that you too may join us on the journey of servant leadership.
Yours in Service,Heather Brown
John Adams AcademyOne Sierragate PlazaRoseville, CA 95678-5423
Phone: 916-780-6800E-mail: [email protected]
About Our SchoolAbout Our School
ContactContact

Last updated: 1/30/2017
About This School
Contact Information (School Year 2016-17)Contact Information (School Year 2016-17)
District Contact Information (School Year 2016-17)
District Name Loomis Union Elementary
Phone Number (916) 652-1800
Superintendent Gordon Medd
E-mail Address [email protected]
Web Site http://www.loomis-usd.k12.ca.us
School Contact Information (School Year 2016-17)
School Name John Adams Academy
Street One Sierragate Plaza
City, State, Zip Roseville, Ca, 95678-5423
Phone Number 916-780-6800
Principal Heather Brown, Headmaster
E-mail Address [email protected]
Web Site www.johnadamsacademy.org
County-District-School (CDS) Code
31668450121418
School Description and Mission Statement (School Year 2016-17)School Description and Mission Statement (School Year 2016-17)
Mission
John Adams Academy is restoring America's heritage by developing servant-leaders who are keepers and defenders of the principles of freedom for which ourFounding Fathers pledged their lives, fortunes, and sacred honor. By combining classical educat ion w ith servant leadership training and core values, John AdamsAcademy develops scholars who are leaders in their homes, communit ies and country. Through classics, mentoring, and modeling, scholars are inspired to preparefor their unique mission and w ill naturally hunger for oncoming responsibilit ies and future contribut ions in society.
Core ValuesJohn Adams Academy is preparing future leaders and statesmen through principle-based educat ion.
Our core values include:• Appreciat ion of our nat ional heritage• Public and private virtue• Emphasis on mentors and classics• Scholar-empowered learning• Fostering creat ivity and entrepreneurial spirit• High standards of academic excellence• Modeling what we teach• Abundance mentality• Building a culture of greatness• Self governance, personal responsibility, and accountability
“All men, who have turned out worth anything, have had the chief hand in their own education.” - Sir Walter Scott
The educat ion of tomorrow ’s leaders determines the level of freedom and prosperity of the next generat ion. Leaders select the goals of a nat ion and the meansof achieving those goals. Leadership Educat ion trains thinkers, leaders, inventors, cit izens, entrepreneurs and statesman. It educates individuals “how to think”and teaches them why it is important. Robert Hutchins said this type of educat ion is “the educat ion of free men in the knowledge and skills that are needed toremain free.” Classically educated leaders are prepared to motivate and inspire individuals, communit ies and nat ions to a greater good in an environment offreedom and prosperity that naturally produces the best society has to offer. This awakening is achieved through enduring principles of success. It is not toeducate effect ively but great ly through the internalizat ion of principles exemplified in the lives of great individuals that accomplished great things.
Leadership Educat ion presupposes that each individual is born w ith a unique and individual mission to fulfill. Leadership Educat ion consists of discovering, preparingfor and fulfilling this mission. It is not the role of Leadership Educat ion to fill scholars w ith a pre-determined set of facts, beliefs, or processes, but to inspire themto discover their own potent ial and unique abilit ies that only he or she has to contribute to society. Our Founding Fathers and the great leaders of historyreceived a Leadership Educat ion. In the twenty first century it falls to us to choose what kind of leaders we w ill produce. The liberty, prosperity and stability of
2015-16 SARC - John Adams Academy
Page 2 of 36

Last updated: 1/30/2017
our nat ion and even future civilizat ions are dependent upon the leaders of tomorrow gett ing a Leadership Educat ion today. These principles and the w isdom ofhistory are st ill available to all who are w illing to pay the price to educate, work and implement the t imeless principles of a Classical Leadership Educat ion to make adifference in the world.
2015-16 SARC - John Adams Academy
Page 3 of 36
Last updated: 1/30/2017
Last updated: 1/30/2017
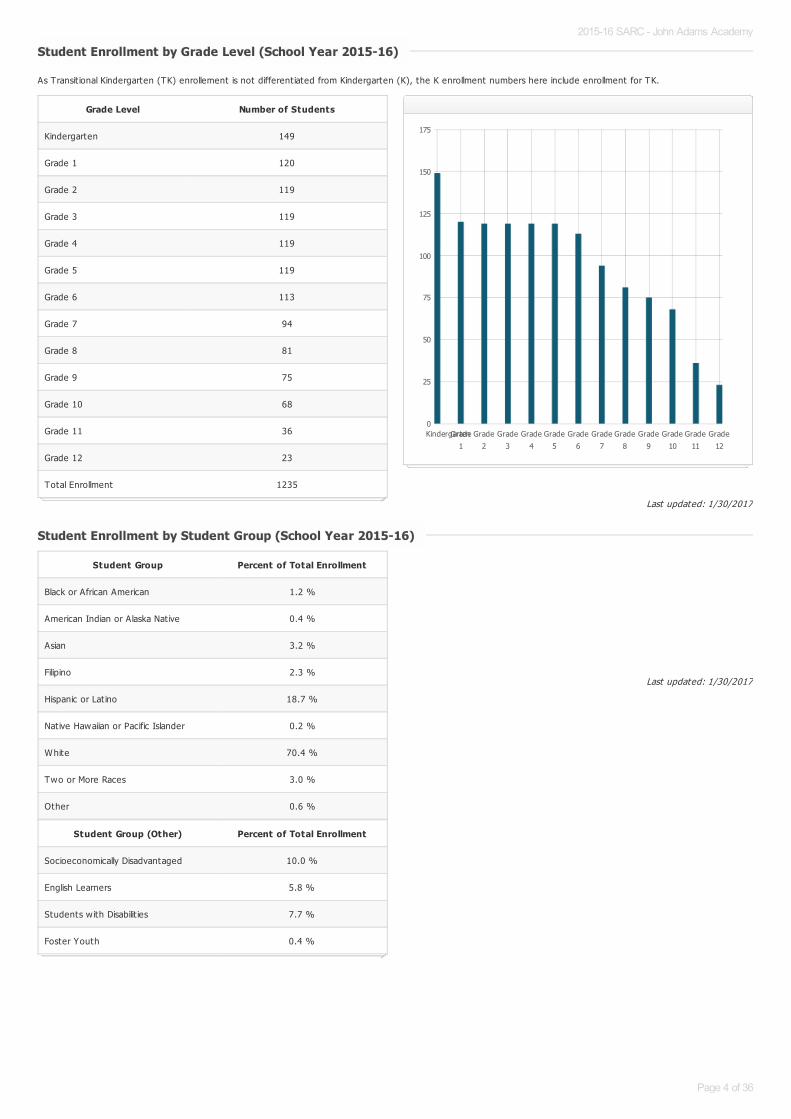
As Transit ional Kindergarten (TK) enrollement is not different iated from Kindergarten (K), the K enrollment numbers here include enrollment for TK.
Student Enrollment by Grade Level (School Year 2015-16)Student Enrollment by Grade Level (School Year 2015-16)
Grade Level Number of Students
Kindergarten 149
Grade 1 120
Grade 2 119
Grade 3 119
Grade 4 119
Grade 5 119
Grade 6 113
Grade 7 94
Grade 8 81
Grade 9 75
Grade 10 68
Grade 11 36
Grade 12 23
Total Enrollment 1235
KindergartenGrade
1
Grade
2
Grade
3
Grade
4
Grade
5
Grade
6
Grade
7
Grade
8
Grade
9
Grade
10
Grade
11
Grade
12
0
25
50
75
100
125
150
175
Student Enrollment by Student Group (School Year 2015-16)Student Enrollment by Student Group (School Year 2015-16)
Student Group Percent of Total Enrollment
Black or African American 1.2 %
American Indian or Alaska Nat ive 0.4 %
Asian 3.2 %
Filipino 2.3 %
Hispanic or Lat ino 18.7 %
Native Hawaiian or Pacific Islander 0.2 %
White 70.4 %
Two or More Races 3.0 %
Other 0.6 %
Student Group (Other) Percent of Total Enrollment
Socioeconomically Disadvantaged 10.0 %
English Learners 5.8 %
Students w ith Disabilit ies 7.7 %
Foster Youth 0.4 %
2015-16 SARC - John Adams Academy
Page 4 of 36

Last updated: 1/30/2017
Last updated: 1/30/2017
A. Conditions of Learning
State Priority: Basic
The SARC provides the follow ing information relevant to the State priority: Basic (Priority 1):
Degree to which teachers are appropriately assigned and fully credent ialed in the subject area and for the pupils they are teaching;Pupils have access to standards-aligned instruct ional materials; andSchool facilit ies are maintained in good repair
Note: “Misassignments” refers to the number of posit ions filled by teachers who lack legal authorizat ion to teach that grade level, subject area, student group, etc.
* Total Teacher Misassignments includes the number of Misassignments of Teachers of English learners.
Teacher CredentialsTeacher Credentials
Teachers School District
2014-15
2015-16
2016-17
2016-17
With Full Credent ial 41 57
Without Full Credent ial 0 1
Teachers Teaching Outside SubjectArea of Competence (w ith fullcredent ial)
0 1
2014-15 2015-16 2016-170
10
20
30
40
50
60Teachers with Full Credential
Teachers without Full Credential
Teachers Teaching Outside Subject Area of Competence
Teacher Misassignments and Vacant Teacher PositionsTeacher Misassignments and Vacant Teacher Positions
Indicator2014-
152015-
162016-
17
Misassignments of Teachers of EnglishLearners
0 0
Total Teacher Misassignments* 0 1
Vacant Teacher Posit ions 0 0
2014-15 2015-16 2016-170.0
0.2
0.4
0.6
0.8
1.0
1.2Misassignments of Teachers of English Learners
Total Teacher Misassignments
Vacant Teacher Positions
2015-16 SARC - John Adams Academy
Page 5 of 36

Last updated: 1/30/2017
Last updated: 1/31/2017
Note: High-poverty schools are defined as those schools w ith student eligibility of approximately 40 percent or more in the free and reduced price meals program. Low-poverty schools are those w ith student eligibility of approximately 39 percent or less in the free and reduced price meals program.
Year and month in which data were collected: December 2016
Core Academic Classes Taught by Highly Qualified Teachers (School Year 2015-16)Core Academic Classes Taught by Highly Qualified Teachers (School Year 2015-16)
Location of ClassesPercent of Classes In Core Academic Subjects Taught by
Highly Qualified TeachersPercent of Classes In Core Academic Subjects Not Taught by
Highly Qualified Teachers
This School 98.0% 2.0%
All Schools in District 100.0% 0.0%
High-Poverty Schoolsin District
0.0% 0.0%
Low-Poverty Schoolsin District
100.0% 0.0%
Quality, Currency, Availability of Textbooks and Instructional Materials (School Year 2016-17)Quality, Currency, Availability of Textbooks and Instructional Materials (School Year 2016-17)
Note: Cells w ith N/A values do not require data.
Subject Textbooks and Instructional Materials/year of Adoption
From MostRecent
Adoption?
PercentStudentsLacking
OwnAssigned
Copy
Reading/LanguageArts Charter schools were intended to have the freedom and flexibility of ut ilizing their own curriculum and are exempted
from the requirement to use or approve the State required texts. As a public charter school the Academy is notrequired to adopt or use the State curriculum as out lined in EC Sect ion 60119. The Academy ut ilizes its own process
for ident ifying and approving curriculum as well as inclusion of stakeholders in that process.
The John Adams Academy ut ilizes an array of classic books, which are in support of and in alignment w ith the CCSS inall subject areas. In addit ion to the foundat ional use of classics, CCSS-aligned textbooks are used in supplement.The core use of classics is preferred to textbooks in that the latter, almost w ithout except ion, are “secondary
sources,” two steps removed from reality. They are, as it were, thoughts about thoughts. Classics, by contrast, aremuch closer to common experience in its fullness; they raise quest ions and pursue inquiries, which arise direct ly froma wonder about things themselves. On this account, they are of the greatest importance to scholars, for they begin
where thought itself must begin: in the original context.
From Aristot le to Montesquieu and Locke to Adams, great individuals studied other great individuals. A classic is awork that can be experienced many t imes over and give something new each t ime. A classic or great book has three
essent ial qualit ies: great theme, noble language, and universality.
Scholars are also given "Keep Books" of primary source literature used in class each year as a means of building theirown personal library at home.
To view recommended reading lists and scope & sequence documents, please refer to the follow ing:
visit ing: http://roseville.johnadamsacademy.org/apps/pages/index.jsp?uREC_ID=292790&type=d&pREC_ID=674561.
0.0 %
Mathematics 0.0 %
Science 0.0 %
History-SocialScience
0.0 %
Foreign Language 0.0 %
Health 0.0 %
Visual andPerforming Arts
0.0 %
Science LabEqpmt (Grades 9-12)
N/A N/A 0.0 %
2015-16 SARC - John Adams Academy
Page 6 of 36

2015-16 SARC - John Adams Academy
Page 7 of 36

Last updated: 1/31/2017
School Facility Good Repair StatusYear and month of the most recent FIT report: November 2016
School Facility Conditions and Planned ImprovementsSchool Facility Conditions and Planned Improvements
Upon entering John Adams Academy, one finds an external environment that denotes the value of educat ion and an inst itut ion that embraces formality, civilityand the highest ideals of academic excellence. The leadership and staff seek to be intent ional in applying a detailed, pract ical and effect ive approach to allfacilit ies tasks in support of the overall mission. From décor to maintenance, every personal interact ion w ith the environment points to an inst itut ion buildingtoward a culture of greatness.
School Facilit ies: The John Adams Academy facilit ies are owned and operated by John Adams Academies, Inc. The facility current ly includes four buildings ofapproximately 104,000 square feet, w ith 63 classrooms, high school and elementary libraries, 2 mult i-purpose rooms, elect ive classrooms, 2 staff lounges, variousspecialty labs, special educat ion conference room, SPED breakout rooms, administrat ive offices and playground spaces. The facility meets ADA guidelines and is incompliance w ith all applicable state and local guidelines.
Cleaning Process and Schedule: The Headmaster works w ith facilit ies director in the creat ion and implementat ion of daily cleaning schedules. The Facilit iesDirector ensures that facilit ies are clean, safe and well maintained.
Maintenance and Repair: Maintenance staff ensures that the repairs necessary to keep the school in good repair and working order are completed in a t imelymanner. A work order process is used to ensure efficient service and that emergency repairs are given the highest priority.The Maintenance team not onlyensures that the school facilit ies are maintained in good repair as required by law, but approaches their job w ith a servant 's heart and desire to ensure thatscholars and staff have the best environment possible. A copy of the cleaning schedule and repair plans are available at the Washington Building facilit ies office.
The academy completed the replacement of 28 HVAC parapet glue laminate beams that had significant dry rot damage. This project was begun in the 2014-15school year and completed in the 2015-16 school year.
Modernization Projects: The Academy has improved its facility each year by working to create an invit ing and funct ional environment. In the 15-16 academicyear, the Academy began the process of retro fit t ing light ing from incandescent to LED, making energy efficiency improvements via Proposit ion 39. A newirrigat ion drip system for water efficiency was also installed.
New School Construction Projects (if applicable): The Academy is preparing for the construct ion of a new Mult i-Purpose Room that w ill funct ion as a gym,performance center and physical educat ion learning center.
Copies of facility surveys, cleaning schedules or maintenance plan, as well as information for the new Mult i-Purpose Room are available at the Washington BuildingAdministrat ive offices.
System Inspected Rating
Repair Needed andAction Taken or
Planned
Systems: Gas Leaks, Mechanical/HVAC,Sewer
Good
Interior: Interior Surfaces GoodHealth Room and staff
lounge cabinetryimproved.
Cleanliness: Overall Cleanliness,Pest/Vermin Infestat ion
Good
Electrical: Electrical GoodLarge exhaust fan failed
and was replaced.
Restrooms/Fountains: Restrooms,Sinks/Fountains
GoodPlayground drinkingfountains installed.
Safety: Fire Safety, Hazardous Materials Good
Structural: Structural Damage, Roofs GoodHVAC Parapet beams
replaced
2015-16 SARC - John Adams Academy
Page 8 of 36
Last updated: 1/30/2017
Overall Facility RateYear and month of the most recent FIT report: November 2016
External: Playground/School Grounds,W indows/Doors/Gates/Fences
Good
Overall Rat ing Exemplary
2015-16 SARC - John Adams Academy
Page 9 of 36
Last updated: 1/30/2017
B. Pupil Outcomes
State Priority: Pupil Achievement
The SARC provides the follow ing information relevant to the State priority: Pupil Achievement (Priority 4):
Statewide assessments (i.e., California Assessment of Student Performance and Progress [CAASPP] System, which includes the Smarter Balanced SummativeAssessments for students in the general educat ion populat ion and the California Alternate Assessments [CAAs] for English language arts/literacy [ELA] andmathematics given in grades three through eight and grade eleven. The CAAs have replaced the California Alternate Performance Assessment [CAPA] for ELA andmathematics, which were eliminated in 2015. Only eligible students may part icipate in the administrat ion of the CAAs. CAA items are aligned w ith alternateachievement standards, which are linked w ith the Common Core State Standards [CCSS] for students w ith significant cognit ive disabilit ies); and
The percentage of students who have successfully completed courses that sat isfy the requirements for entrance to the University of California and the CaliforniaState University, or career technical educat ion sequences or programs of study.
Note: Percentages are not calculated when the number of students tested is ten or less, either because the number of students in this category is too small forstat ist ical accuracy or to protect student privacy.
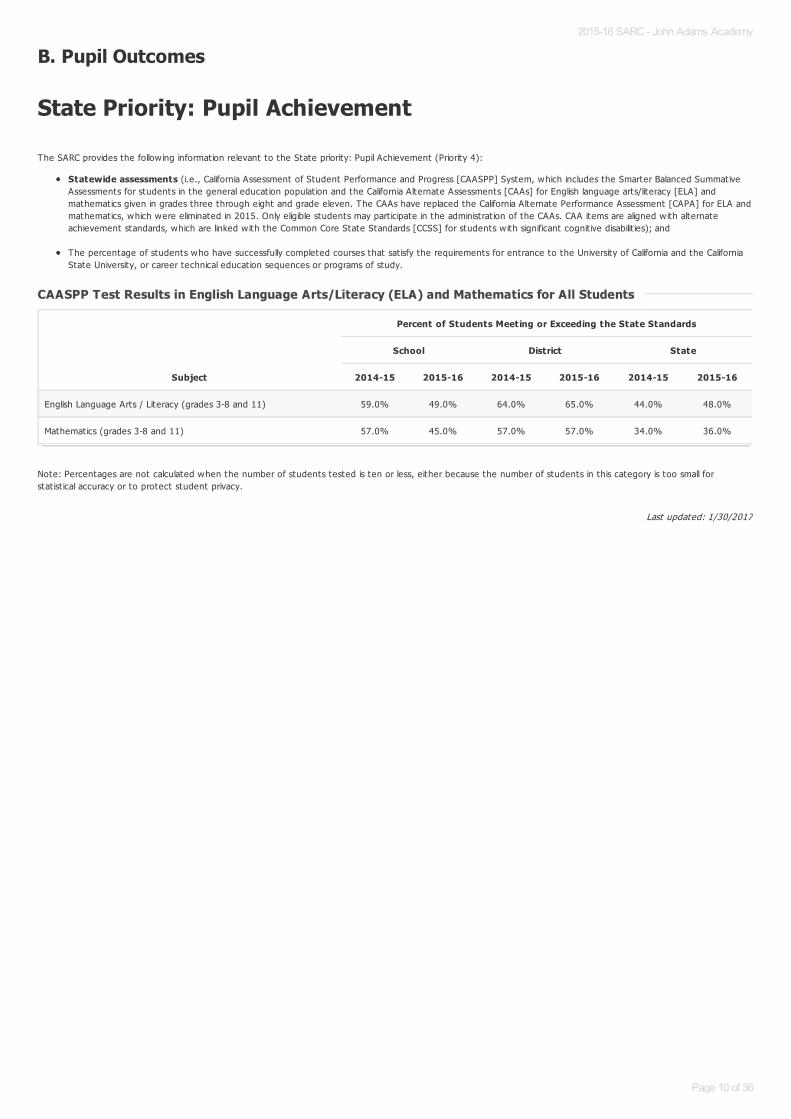
CAASPP Test Results in English Language Arts/Literacy (ELA) and Mathematics for All StudentsCAASPP Test Results in English Language Arts/Literacy (ELA) and Mathematics for All Students
Subject
Percent of Students Meeting or Exceeding the State Standards
School District State
2014-15 2015-16 2014-15 2015-16 2014-15 2015-16
English Language Arts / Literacy (grades 3-8 and 11) 59.0% 49.0% 64.0% 65.0% 44.0% 48.0%
Mathematics (grades 3-8 and 11) 57.0% 45.0% 57.0% 57.0% 34.0% 36.0%
2015-16 SARC - John Adams Academy
Page 10 of 36

Last updated: 1/11/2017
Note: ELA test results include the Smarter Balanced Summative Assessment and the CAA. The “Percent Met or Exceeded” is calculated by taking the total number ofstudents who met or exceeded the standard on the Smarter Balanced Summative Assessment plus the total number of students who met the standard on the CAAsdivided by the total number of students who part icipated in both assessments.
Double dashes (--) appear in the table when the number of students is ten or less, either because the number of students in this category is too small for stat ist icalaccuracy or to protect student privacy.
Note: The number of students tested includes all students who part icipated in the test whether they received a score or not; however, the number of students testedis not the number that was used to calculate the achievement level percentages. The achievement level percentages are calculated using only students who receivedscores.
CAASPP Test Results in ELA by Student Group CAASPP Test Results in ELA by Student Group
Grades Three through Eight and Grade Eleven (School Year 2015-16)Grades Three through Eight and Grade Eleven (School Year 2015-16)
ELA - Grade 3ELA - Grade 3
Student Group Total Enrollment Number Tested Percent Tested Percent Met or Exceeded
All Students 120 117 97.5% 41.0%
Male 64 62 96.9% 40.3%
Female 56 55 98.2% 41.8%
Black or African American -- -- -- --
American Indian or Alaska Nat ive -- -- -- --
Asian -- -- -- --
Filipino -- -- -- --
Hispanic or Lat ino 15 15 100.0% 20.0%
Native Hawaiian or Pacific Islander -- -- -- --
White 96 93 96.9% 46.2%
Two or More Races -- -- -- --
Socioeconomically Disadvantaged -- -- -- --
English Learners -- -- -- --
Students w ith Disabilit ies 20 19 95.0% 36.8%
Students Receiving Migrant Educat ion Services -- -- -- --
Foster Youth -- -- -- --
2015-16 SARC - John Adams Academy
Page 11 of 36

Last updated: 1/11/2017
Note: ELA test results include the Smarter Balanced Summative Assessment and the CAA. The “Percent Met or Exceeded” is calculated by taking the total number ofstudents who met or exceeded the standard on the Smarter Balanced Summative Assessment plus the total number of students who met the standard on the CAAsdivided by the total number of students who part icipated in both assessments.
Double dashes (--) appear in the table when the number of students is ten or less, either because the number of students in this category is too small for stat ist icalaccuracy or to protect student privacy.
Note: The number of students tested includes all students who part icipated in the test whether they received a score or not; however, the number of students testedis not the number that was used to calculate the achievement level percentages. The achievement level percentages are calculated using only students who receivedscores.
ELA - Grade 4ELA - Grade 4
Student Group Total Enrollment Number Tested Percent Tested Percent Met or Exceeded
All Students 122 117 95.9% 46.6%
Male 55 55 100.0% 49.1%
Female 67 62 92.5% 44.3%
Black or African American -- -- -- --
American Indian or Alaska Nat ive -- -- -- --
Asian -- -- -- --
Filipino -- -- -- --
Hispanic or Lat ino 26 25 96.2% 28.0%
Native Hawaiian or Pacific Islander -- -- -- --
White 80 76 95.0% 52.0%
Two or More Races -- -- -- --
Socioeconomically Disadvantaged 16 16 100.0% 40.0%
English Learners 12 12 100.0% 16.7%
Students w ith Disabilit ies -- -- -- --
Students Receiving Migrant Educat ion Services -- -- -- --
Foster Youth -- -- -- --
2015-16 SARC - John Adams Academy
Page 12 of 36

Last updated: 1/11/2017
Note: ELA test results include the Smarter Balanced Summative Assessment and the CAA. The “Percent Met or Exceeded” is calculated by taking the total number ofstudents who met or exceeded the standard on the Smarter Balanced Summative Assessment plus the total number of students who met the standard on the CAAsdivided by the total number of students who part icipated in both assessments.
Double dashes (--) appear in the table when the number of students is ten or less, either because the number of students in this category is too small for stat ist icalaccuracy or to protect student privacy.
Note: The number of students tested includes all students who part icipated in the test whether they received a score or not; however, the number of students testedis not the number that was used to calculate the achievement level percentages. The achievement level percentages are calculated using only students who receivedscores.
ELA - Grade 5ELA - Grade 5
Student Group Total Enrollment Number Tested Percent Tested Percent Met or Exceeded
All Students 119 117 98.3% 55.6%
Male 58 56 96.6% 51.8%
Female 61 61 100.0% 59.0%
Black or African American -- -- -- --
American Indian or Alaska Nat ive -- -- -- --
Asian -- -- -- --
Filipino -- -- -- --
Hispanic or Lat ino 22 22 100.0% 40.9%
Native Hawaiian or Pacific Islander -- -- -- --
White 83 81 97.6% 59.3%
Two or More Races -- -- -- --
Socioeconomically Disadvantaged 12 10 83.3% 30.0%
English Learners -- -- -- --
Students w ith Disabilit ies 12 12 100.0% 41.7%
Students Receiving Migrant Educat ion Services -- -- -- --
Foster Youth -- -- -- --
2015-16 SARC - John Adams Academy
Page 13 of 36

Last updated: 1/11/2017
Note: ELA test results include the Smarter Balanced Summative Assessment and the CAA. The “Percent Met or Exceeded” is calculated by taking the total number ofstudents who met or exceeded the standard on the Smarter Balanced Summative Assessment plus the total number of students who met the standard on the CAAsdivided by the total number of students who part icipated in both assessments.
Double dashes (--) appear in the table when the number of students is ten or less, either because the number of students in this category is too small for stat ist icalaccuracy or to protect student privacy.
Note: The number of students tested includes all students who part icipated in the test whether they received a score or not; however, the number of students testedis not the number that was used to calculate the achievement level percentages. The achievement level percentages are calculated using only students who receivedscores.
ELA- ELA- Grade 6Grade 6
Student Group Total Enrollment Number Tested Percent Tested Percent Met or Exceeded
All Students 122 113 92.6% 46.0%
Male 58 56 96.6% 37.5%
Female 64 57 89.1% 54.4%
Black or African American -- -- -- --
American Indian or Alaska Nat ive -- -- -- --
Asian -- -- -- --
Filipino -- -- -- --
Hispanic or Lat ino 30 30 100.0% 50.0%
Native Hawaiian or Pacific Islander -- -- -- --
White 79 71 89.9% 43.7%
Two or More Races -- -- -- --
Socioeconomically Disadvantaged 16 14 87.5% 28.6%
English Learners -- -- -- --
Students w ith Disabilit ies 11 9 81.8% 11.1%
Students Receiving Migrant Educat ion Services -- -- -- --
Foster Youth -- -- -- --
2015-16 SARC - John Adams Academy
Page 14 of 36

Last updated: 1/11/2017
Note: ELA test results include the Smarter Balanced Summative Assessment and the CAA. The “Percent Met or Exceeded” is calculated by taking the total number ofstudents who met or exceeded the standard on the Smarter Balanced Summative Assessment plus the total number of students who met the standard on the CAAsdivided by the total number of students who part icipated in both assessments.
Double dashes (--) appear in the table when the number of students is ten or less, either because the number of students in this category is too small for stat ist icalaccuracy or to protect student privacy.
Note: The number of students tested includes all students who part icipated in the test whether they received a score or not; however, the number of students testedis not the number that was used to calculate the achievement level percentages. The achievement level percentages are calculated using only students who receivedscores.
ELA - Grade 7ELA - Grade 7
Student Group Total Enrollment Number Tested Percent Tested Percent Met or Exceeded
All Students 105 100 95.2% 51.0%
Male 49 47 95.9% 42.6%
Female 56 53 94.6% 58.5%
Black or African American -- -- -- --
American Indian or Alaska Nat ive -- -- -- --
Asian -- -- -- --
Filipino -- -- -- --
Hispanic or Lat ino 22 21 95.5% 47.6%
Native Hawaiian or Pacific Islander -- -- -- --
White 71 67 94.4% 52.2%
Two or More Races -- -- -- --
Socioeconomically Disadvantaged -- -- -- --
English Learners -- -- -- --
Students w ith Disabilit ies -- -- -- --
Students Receiving Migrant Educat ion Services -- -- -- --
Foster Youth -- -- -- --
2015-16 SARC - John Adams Academy
Page 15 of 36

Last updated: 1/11/2017
Note: ELA test results include the Smarter Balanced Summative Assessment and the CAA. The “Percent Met or Exceeded” is calculated by taking the total number ofstudents who met or exceeded the standard on the Smarter Balanced Summative Assessment plus the total number of students who met the standard on the CAAsdivided by the total number of students who part icipated in both assessments.
Double dashes (--) appear in the table when the number of students is ten or less, either because the number of students in this category is too small for stat ist icalaccuracy or to protect student privacy.
Note: The number of students tested includes all students who part icipated in the test whether they received a score or not; however, the number of students testedis not the number that was used to calculate the achievement level percentages. The achievement level percentages are calculated using only students who receivedscores.
ELA - Grade 8ELA - Grade 8
Student Group Total Enrollment Number Tested Percent Tested Percent Met or Exceeded
All Students 82 80 97.6% 48.1%
Male 36 35 97.2% 42.9%
Female 46 45 97.8% 52.3%
Black or African American -- -- -- --
American Indian or Alaska Nat ive -- -- -- --
Asian -- -- -- --
Filipino -- -- -- --
Hispanic or Lat ino 16 15 93.8% 33.3%
Native Hawaiian or Pacific Islander -- -- -- --
White 56 55 98.2% 51.9%
Two or More Races -- -- -- --
Socioeconomically Disadvantaged 11 11 100.0% 45.5%
English Learners -- -- -- --
Students w ith Disabilit ies -- -- -- --
Students Receiving Migrant Educat ion Services -- -- -- --
Foster Youth -- -- -- --
2015-16 SARC - John Adams Academy
Page 16 of 36

Last updated: 1/11/2017
Note: ELA test results include the Smarter Balanced Summative Assessment and the CAA. The “Percent Met or Exceeded” is calculated by taking the total number ofstudents who met or exceeded the standard on the Smarter Balanced Summative Assessment plus the total number of students who met the standard on the CAAsdivided by the total number of students who part icipated in both assessments.
Double dashes (--) appear in the table when the number of students is ten or less, either because the number of students in this category is too small for stat ist icalaccuracy or to protect student privacy.
Note: The number of students tested includes all students who part icipated in the test whether they received a score or not; however, the number of students testedis not the number that was used to calculate the achievement level percentages. The achievement level percentages are calculated using only students who receivedscores.
ELA - Grade 11ELA - Grade 11
Student Group Total Enrollment Number Tested Percent Tested Percent Met or Exceeded
All Students 36 34 94.4% 76.5%
Male 19 18 94.7% 72.2%
Female 17 16 94.1% 81.3%
Black or African American -- -- -- --
American Indian or Alaska Nat ive -- -- -- --
Asian -- -- -- --
Filipino -- -- -- --
Hispanic or Lat ino -- -- -- --
Nat ive Hawaiian or Pacific Islander -- -- -- --
White 25 24 96.0% 83.3%
Two or More Races -- -- -- --
Socioeconomically Disadvantaged -- -- -- --
English Learners -- -- -- --
Students w ith Disabilit ies -- -- -- --
Students Receiving Migrant Educat ion Services -- -- -- --
Foster Youth -- -- -- --
2015-16 SARC - John Adams Academy
Page 17 of 36

Last updated: 1/11/2017
Note: Mathematics test results include the Smarter Balanced Summative Assessment and the CAA. The “Percent Met or Exceeded” is calculated by taking the totalnumber of students who met or exceeded the standard on the Smarter Balanced Summative Assessment plus the total number of students who met the standard onthe CAAs divided by the total number of students who part icipated in both assessments.
Double dashes (--) appear in the table when the number of students is ten or less, either because the number of students in this category is too small for stat ist icalaccuracy or to protect student privacy.
Note: The number of students tested includes all students who part icipated in the test whether they received a score or not; however, the number of students testedis not the number that was used to calculate the achievement level percentages. The achievement level percentages are calculated using only students who receivedscores.
CAASPP Test Results in Mathematics by Student GroupCAASPP Test Results in Mathematics by Student Group
Grades Three through Eight and Grade Eleven (School Year 2015-16)Grades Three through Eight and Grade Eleven (School Year 2015-16)
Mathematics - Grade 3Mathematics - Grade 3
Student Group Total Enrollment Number Tested Percent Tested Percent Met or Exceeded
All Students 120 117 97.5% 50.4%
Male 64 62 96.9% 56.5%
Female 56 55 98.2% 43.6%
Black or African American -- -- -- --
American Indian or Alaska Nat ive -- -- -- --
Asian -- -- -- --
Filipino -- -- -- --
Hispanic or Lat ino 15 15 100.0% 26.7%
Native Hawaiian or Pacific Islander -- -- -- --
White 96 93 96.9% 54.8%
Two or More Races -- -- -- --
Socioeconomically Disadvantaged -- -- -- --
English Learners -- -- -- --
Students w ith Disabilit ies 20 19 95.0% 36.8%
Students Receiving Migrant Educat ion Services -- -- -- --
Foster Youth -- -- -- --
2015-16 SARC - John Adams Academy
Page 18 of 36

Last updated: 1/11/2017
Note: Mathematics test results include the Smarter Balanced Summative Assessment and the CAA. The “Percent Met or Exceeded” is calculated by taking the totalnumber of students who met or exceeded the standard on the Smarter Balanced Summative Assessment plus the total number of students who met the standard onthe CAAs divided by the total number of students who part icipated in both assessments.
Double dashes (--) appear in the table when the number of students is ten or less, either because the number of students in this category is too small for stat ist icalaccuracy or to protect student privacy.
Note: The number of students tested includes all students who part icipated in the test whether they received a score or not; however, the number of students testedis not the number that was used to calculate the achievement level percentages. The achievement level percentages are calculated using only students who receivedscores.
Mathematics - Grade 4Mathematics - Grade 4
Student Group Total Enrollment Number Tested Percent Tested Percent Met or Exceeded
All Students 122 117 95.9% 37.1%
Male 55 55 100.0% 47.3%
Female 67 62 92.5% 27.9%
Black or African American -- -- -- --
American Indian or Alaska Nat ive -- -- -- --
Asian -- -- -- --
Filipino -- -- -- --
Hispanic or Lat ino 26 25 96.2% 24.0%
Native Hawaiian or Pacific Islander -- -- -- --
White 80 76 95.0% 40.0%
Two or More Races -- -- -- --
Socioeconomically Disadvantaged 16 16 100.0% 26.7%
English Learners 12 12 100.0% 8.3%
Students w ith Disabilit ies -- -- -- --
Students Receiving Migrant Educat ion Services -- -- -- --
Foster Youth -- -- -- --
2015-16 SARC - John Adams Academy
Page 19 of 36
Last updated: 1/11/2017
Note: Mathematics test results include the Smarter Balanced Summative Assessment and the CAA. The “Percent Met or Exceeded” is calculated by taking the totalnumber of students who met or exceeded the standard on the Smarter Balanced Summative Assessment plus the total number of students who met the standard onthe CAAs divided by the total number of students who part icipated in both assessments.
Double dashes (--) appear in the table when the number of students is ten or less, either because the number of students in this category is too small for stat ist icalaccuracy or to protect student privacy.
Note: The number of students tested includes all students who part icipated in the test whether they received a score or not; however, the number of students testedis not the number that was used to calculate the achievement level percentages. The achievement level percentages are calculated using only students who receivedscores.
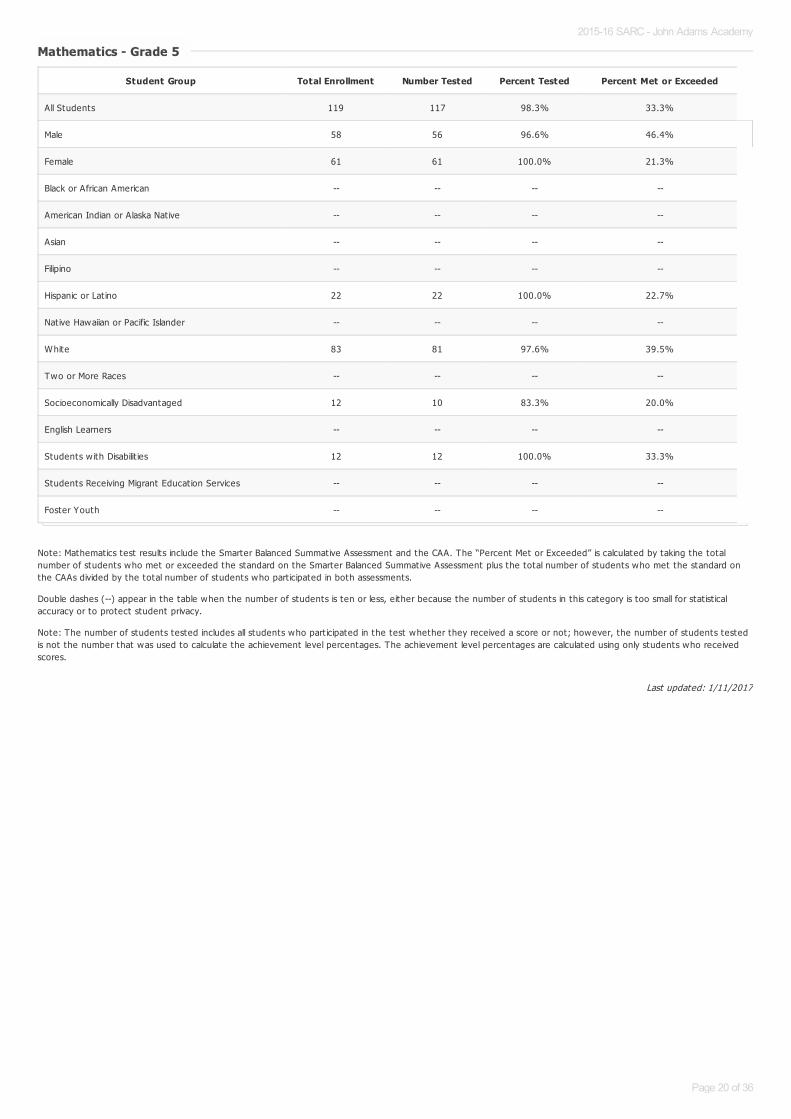
Mathematics - Grade 5Mathematics - Grade 5
Student Group Total Enrollment Number Tested Percent Tested Percent Met or Exceeded
All Students 119 117 98.3% 33.3%
Male 58 56 96.6% 46.4%
Female 61 61 100.0% 21.3%
Black or African American -- -- -- --
American Indian or Alaska Nat ive -- -- -- --
Asian -- -- -- --
Filipino -- -- -- --
Hispanic or Lat ino 22 22 100.0% 22.7%
Native Hawaiian or Pacific Islander -- -- -- --
White 83 81 97.6% 39.5%
Two or More Races -- -- -- --
Socioeconomically Disadvantaged 12 10 83.3% 20.0%
English Learners -- -- -- --
Students w ith Disabilit ies 12 12 100.0% 33.3%
Students Receiving Migrant Educat ion Services -- -- -- --
Foster Youth -- -- -- --
2015-16 SARC - John Adams Academy
Page 20 of 36

Last updated: 1/11/2017
Note: Mathematics test results include the Smarter Balanced Summative Assessment and the CAA. The “Percent Met or Exceeded” is calculated by taking the totalnumber of students who met or exceeded the standard on the Smarter Balanced Summative Assessment plus the total number of students who met the standard onthe CAAs divided by the total number of students who part icipated in both assessments.
Double dashes (--) appear in the table when the number of students is ten or less, either because the number of students in this category is too small for stat ist icalaccuracy or to protect student privacy.
Note: The number of students tested includes all students who part icipated in the test whether they received a score or not; however, the number of students testedis not the number that was used to calculate the achievement level percentages. The achievement level percentages are calculated using only students who receivedscores.
Mathematics - Grade 6Mathematics - Grade 6
Student Group Total Enrollment Number Tested Percent Tested Percent Met or Exceeded
All Students 122 114 93.4% 51.3%
Male 58 56 96.6% 55.4%
Female 64 58 90.6% 47.4%
Black or African American -- -- -- --
American Indian or Alaska Nat ive -- -- -- --
Asian -- -- -- --
Filipino -- -- -- --
Hispanic or Lat ino 30 30 100.0% 36.7%
Native Hawaiian or Pacific Islander -- -- -- --
White 79 72 91.1% 54.9%
Two or More Races -- -- -- --
Socioeconomically Disadvantaged 16 14 87.5% 35.7%
English Learners -- -- -- --
Students w ith Disabilit ies 11 9 81.8% 22.2%
Students Receiving Migrant Educat ion Services -- -- -- --
Foster Youth -- -- -- --
2015-16 SARC - John Adams Academy
Page 21 of 36

Last updated: 1/11/2017
Note: Mathematics test results include the Smarter Balanced Summative Assessment and the CAA. The “Percent Met or Exceeded” is calculated by taking the totalnumber of students who met or exceeded the standard on the Smarter Balanced Summative Assessment plus the total number of students who met the standard onthe CAAs divided by the total number of students who part icipated in both assessments.
Double dashes (--) appear in the table when the number of students is ten or less, either because the number of students in this category is too small for stat ist icalaccuracy or to protect student privacy.
Note: The number of students tested includes all students who part icipated in the test whether they received a score or not; however, the number of students testedis not the number that was used to calculate the achievement level percentages. The achievement level percentages are calculated using only students who receivedscores.
Mathematics - Grade 7Mathematics - Grade 7
Student Group Total Enrollment Number Tested Percent Tested Percent Met or Exceeded
All Students 105 100 95.2% 53.0%
Male 49 47 95.9% 59.6%
Female 56 53 94.6% 47.2%
Black or African American -- -- -- --
American Indian or Alaska Nat ive -- -- -- --
Asian -- -- -- --
Filipino -- -- -- --
Hispanic or Lat ino 22 21 95.5% 57.1%
Native Hawaiian or Pacific Islander -- -- -- --
White 71 67 94.4% 55.2%
Two or More Races -- -- -- --
Socioeconomically Disadvantaged -- -- -- --
English Learners -- -- -- --
Students w ith Disabilit ies -- -- -- --
Students Receiving Migrant Educat ion Services -- -- -- --
Foster Youth -- -- -- --
2015-16 SARC - John Adams Academy
Page 22 of 36

Last updated: 1/11/2017
Note: Mathematics test results include the Smarter Balanced Summative Assessment and the CAA. The “Percent Met or Exceeded” is calculated by taking the totalnumber of students who met or exceeded the standard on the Smarter Balanced Summative Assessment plus the total number of students who met the standard onthe CAAs divided by the total number of students who part icipated in both assessments.
Double dashes (--) appear in the table when the number of students is ten or less, either because the number of students in this category is too small for stat ist icalaccuracy or to protect student privacy.
Note: The number of students tested includes all students who part icipated in the test whether they received a score or not; however, the number of students testedis not the number that was used to calculate the achievement level percentages. The achievement level percentages are calculated using only students who receivedscores.
Mathematics - Grade 8Mathematics - Grade 8
Student Group Total Enrollment Number Tested Percent Tested Percent Met or Exceeded
All Students 82 79 96.3% 43.0%
Male 36 35 97.2% 40.0%
Female 46 44 95.7% 45.5%
Black or African American -- -- -- --
American Indian or Alaska Nat ive -- -- -- --
Asian -- -- -- --
Filipino -- -- -- --
Hispanic or Lat ino 16 15 93.8% 33.3%
Native Hawaiian or Pacific Islander -- -- -- --
White 56 54 96.4% 48.2%
Two or More Races -- -- -- --
Socioeconomically Disadvantaged 11 11 100.0% 36.4%
English Learners -- -- -- --
Students w ith Disabilit ies -- -- -- --
Students Receiving Migrant Educat ion Services -- -- -- --
Foster Youth -- -- -- --
2015-16 SARC - John Adams Academy
Page 23 of 36

Last updated: 1/11/2017
Note: Mathematics test results include the Smarter Balanced Summative Assessment and the CAA. The “Percent Met or Exceeded” is calculated by taking the totalnumber of students who met or exceeded the standard on the Smarter Balanced Summative Assessment plus the total number of students who met the standard onthe CAAs divided by the total number of students who part icipated in both assessments.
Double dashes (--) appear in the table when the number of students is ten or less, either because the number of students in this category is too small for stat ist icalaccuracy or to protect student privacy.
Note: The number of students tested includes all students who part icipated in the test whether they received a score or not; however, the number of students testedis not the number that was used to calculate the achievement level percentages. The achievement level percentages are calculated using only students who receivedscores.
Mathematics - Grade 11Mathematics - Grade 11
Student Group Total Enrollment Number Tested Percent Tested Percent Met or Exceeded
All Students 36 34 94.4% 55.9%
Male 19 18 94.7% 55.6%
Female 17 16 94.1% 56.3%
Black or African American -- -- -- --
American Indian or Alaska Nat ive -- -- -- --
Asian -- -- -- --
Filipino -- -- -- --
Hispanic or Lat ino -- -- -- --
Nat ive Hawaiian or Pacific Islander -- -- -- --
White 25 24 96.0% 62.5%
Two or More Races -- -- -- --
Socioeconomically Disadvantaged -- -- -- --
English Learners -- -- -- --
Students w ith Disabilit ies -- -- -- --
Students Receiving Migrant Educat ion Services -- -- -- --
Foster Youth -- -- -- --
2015-16 SARC - John Adams Academy
Page 24 of 36

Last updated: 1/11/2017
Last updated: 1/11/2017
Note: Science test results include California Standards Tests (CSTs), California Modified Assessment (CMA), and California Alternate Performance Assessment (CAPA) ingrades five, eight, and ten.
Note: Scores are not shown when the number of students tested is ten or less, either because the number of students in this category is too small for stat ist icalaccuracy or to protect student privacy.
CAASPP Tests Results in Science by Student GroupGrades Five, Eight and Grade Ten (School Year 2015-16)
Note: Science test results include CSTs, CMA, and CAPA in grades five, eight, and ten. The “Proficient or Advanced” is calculated by taking the total number of studentswho scored at Proficient or Advanced on the science assessment divided by the total number of students w ith valid scores.
Note: Scores are not shown when the number of students tested is ten or less, either because the number of students in this category is too small for stat ist icalaccuracy or to protect student privacy.
CAASPP Test Results in Science for All StudentsCAASPP Test Results in Science for All Students
Subject
Percentage of Students Scoring at Proficient or Advanced
School District State
2013-14 2014-15 2015-16 2013-14 2014-15 2015-16 2013-14 2014-15 2015-16
Science (grades 5, 8, and 10) 87.0% 78.0% 67.0% 83.0% 78.0% 75.0% 60.0% 56.0% 54.0%
Student GroupTotal
EnrollmentNumber of Students with Valid
ScoresPercent of Students with Valid
ScoresPercent Proficient or
Advanced
All Students 266 253 95.1% 67.2%
Male 126 121 96.0% 66.1%
Female 140 132 94.3% 68.2%
Black or African American -- -- -- --
American Indian or Alaska Nat ive -- -- -- --
Asian -- -- -- --
Filipino -- -- -- --
Hispanic or Lat ino 49 46 93.9% 50.0%
Native Hawaiian or Pacific Islander -- -- -- --
White 188 179 95.2% 73.2%
Two or More Races -- -- -- --
Socioeconomically Disadvantaged 33 29 87.9% 51.7%
English Learners 11 11 100.0% 9.1%
Students w ith Disabilit ies 20 19 95.0% 42.1%
Students Receiving Migrant Educat ionServices
0 0 0.0% 0.0%
Foster Youth -- -- -- --
Courses for University of California (UC) and/or California State University (CSU) AdmissionCourses for University of California (UC) and/or California State University (CSU) Admission
UC/CSU Course Measure Percent
2015-16 Pupils Enrolled in Courses Required for UC/CSU Admission 100.0%
2014-15 Graduates Who Completed All Courses Required for UC/CSU Admission 100.0%
2015-16 SARC - John Adams Academy
Page 25 of 36

Last updated: 1/31/2017
Last updated: 1/27/2017
State Priority: Other Pupil Outcomes
The SARC provides the follow ing information relevant to the State priority: Other Pupil Outcomes (Priority 8):
Pupil outcomes in the subject area of physical educat ion
Note: Percentages are not calculated when the number of students tested is ten or less, either because the number of students in this category is too small forstat ist ical accuracy or to protect student privacy.
California Physical Fitness Test Results (School Year 2015-16)California Physical Fitness Test Results (School Year 2015-16)
Grade Level
Percentage of Students Meeting Fitness Standards
Four of Six Standards Five of Six Standards Six of Six Standards
5 22.7% 35.3% 13.4%
7 18.1% 13.8% 9.6%
9 19.7% 42.1% 25.0%
2015-16 SARC - John Adams Academy
Page 26 of 36

C. Engagement
State Priority: Parental Involvement
The SARC provides the follow ing information relevant to the State priority: Parental Involvement (Priority 3):
Efforts the school district makes to seek parent input in making decisions for the school district and each schoolsite
Opportunities for Parental Involvement (School Year 2016-17)Opportunities for Parental Involvement (School Year 2016-17)
The John Adams Academy is a service community and the most visible sign of servant leadership is parent involvement.
Communication with Parents:
The Academy communicates regularly w ith parents through email not ificat ions, phone calls, website announcements, the parent web based communicat ion tooland parent/student portal on the student information system. In addit ion, not ices are sent home w ith scholars and mailed to parents. Teachers alsocommunicate regularly w ith parents direct ly and through web based tools such as Google Classroom/Collaborize Classroom etc. about their scholars needs.
Engaging Parents:
While parents are not required to part icipate at the school, it is highly encouraged. Parents are provided an extensive amount of opportunit ies to be involved andengaged in their scholars educat ion and academic outcomes.
Volunteers can contribute at a variety of t imes and in several ways, such as:· Weekdays on campus (monitoring drop off and pickup, assist ing in a classroom, mentoring on Fridays, complet ing office administrat ive work, supervising in thehealth room, etc.),· Weeknights on campus (evening school maintenance or volunteering at events),· Weekends on campus (monthly campus work part ies),· Throughout the year, on and off campus.
In addit ion there are several ways to find volunteer opportunit ies:
Email Communication Tool: JAA ut ilizes an electronic email communicat ion tool that has a webpage applicat ion to keep parents aware of ongoing Academyact ivit ies, website for academy-w ide opportunit ies, and event volunteer needs. Some volunteer opportunit ies that require a specific number of volunteers or t imeslots to be filled w ill have links to sign-ups on this website.
Classroom: Communicate w ith your scholar’s teacher to determine needs and arrange t imes.
Urgent Needs: Emails w ill go out to families when an urgent need for volunteers occurs.
Surveys: Parents may be asked to complete a survey so that they may be contacted regarding specific expert ise related needs.
Volunteer Project Ideas: If you have an area of expert ise and would like to contribute products or services through a volunteer project please contact our SiteSecretary at [email protected] in advance to coordinate your project. (For example, construct ing something for the academy, designing software,etc.)
Parent Service Organization
The Parent Service Organizat ion (PSO), is a fundamental driver of a parent 's experience at the Academy. Parent teams support classroom teachers, are involvedin day to day operat ions that include traffic docents, fund raising and hospitality. Parents play a significant role in creat ing the uniqueness of our community.The PSO's primary object ive focuses on our Academy’s 7th Core Value: Modeling what we Teach. As they strive to develop servant leaders, they set an examplefor our children through the offering of meaningful service, thereby putt ing into pract ice the very values we uphold and strengthening bonds between scholars,teachers and families.
Object ives of the PSO are:
2015-16 SARC - John Adams Academy
Page 27 of 36

Last updated: 1/31/2017
Last updated: 1/27/2017
State Priority: Pupil Engagement
The SARC provides the follow ing information relevant to the State priority: Pupil Engagement (Priority 5):
High school dropout rates; andHigh school graduat ion rates
To provide supplemental supplies, programs and act ivit ies for the benefit and use of scholars and staff.To assist and encourage service opportunit ies, promoting student leadership and strengthening bonds between families, staff and community members.To implement a forum of communicat ion between teachers, parents and the administrat ion of John Adams Academy.
Addit ional information regarding the JAA PSO can be found at http://roseville.johnadamsacademy.org/apps/pages/index.jsp?uREC_ID=182250&type=d&pREC_ID=379188
Stakeholder Input:
Parents are an integral stakeholder in the performance and success of academic programs in their children's school. As such, parents are give opportunit iesthroughout the year to provide insight, feedback and recommendations on Academy programming and school w ide plans.
Dropout Rate and Graduation Rate (Four-Year Cohort Rate)Dropout Rate and Graduation Rate (Four-Year Cohort Rate)
Indicator
School District State
2012-13 2013-14 2014-15 2012-13 2013-14 2014-15 2012-13 2013-14 2014-15
Dropout Rate 0.0% 7.7% 11.8% 0.0% 0.0% 0.0% 11.4% 11.5% 10.7%
Graduat ion Rate 0.00 84.60 76.50 0.00 0.00 0.00 80.44 80.95 82.27
Dropout/Graduation Rate (Four-Year Cohort Rate) Chart
2012-13 2013-14 2014-150
10
20
30
40
50
60
70
80
90Dropout Rate
Graduation Rate
2015-16 SARC - John Adams Academy
Page 28 of 36

Completion of High School Graduation Requirements - Graduating Class of 2015 Completion of High School Graduation Requirements - Graduating Class of 2015
(One-Year Rate)(One-Year Rate)
Student Group School District State
All Students 21 0 85
Black or African American 0 0 77
American Indian or Alaska Nat ive 0 0 75
Asian 0 0 99
Filipino 1 0 97
Hispanic or Lat ino 3 0 84
Native Hawaiian or Pacific Islander 0 0 85
White 17 0 87
Two or More Races 1 0 91
Socioeconomically Disadvantaged 1 0 77
English Learners 1 0 51
Students w ith Disabilit ies 0 0 68
Foster Youth 0 0 --
2015-16 SARC - John Adams Academy
Page 29 of 36

Last updated: 1/31/2017
Last updated: 1/13/2017
State Priority: School Climate
The SARC provides the follow ing information relevant to the State priority: School Climate (Priority 6):
Pupil suspension rates;Pupil expulsion rates; andOther local measures on the sense of safety
School Safety Plan (School Year 2016-17)
Suspensions and ExpulsionsSuspensions and Expulsions
School District State
Rate 2013-14 2014-15 2015-16 2013-14 2014-15 2015-16 2013-14 2014-15 2015-16
Suspensions 2.3 2.5 2.3 2.3 2.5 2.1 4.4 3.8 3.7
Expulsions 0.0 0.0 0.0 0.0 0.0 0.0 0.1 0.1 0.1
Suspensions
2013-14 2014-15 2015-160.0
1.0
2.0
3.0
4.0
5.0School Suspensions
District Suspensions
State Suspensions
Expulsions
2013-14 2014-15 2015-160.00
0.02
0.04
0.06
0.08
0.10
0.12School Expulsions
District Expulsions
State Expulsions
Since March of 2016, the Academy has cont inued to make great strides in improving the level of safety on campus. As we prepare to open addit ional campuslocat ions, we have begun the process of creat ing the standard for safety that w ill apply to all future John Adams Academy facilit ies.
The Academy has made significant improvements in campus monitoring, adding addit ional resources and improving staff technique.
Act ion items completed in the past 10 months include:
Director of Safety and a part t ime staff member were hired w ith traffic and safety as their primary duty
Surveillance system upgraded
Increased perimeter fencing
Direct ional traffic signage improved
Pick-up and Drop-off procedures revised
Made road improvements to ease traffic flow
Conducted monthly fire drills lockdown/lockout drill and every other month
2015-16 SARC - John Adams Academy
Page 30 of 36

Last updated: 1/31/2017
Created traffic and safety videos that are posted website to educate families
Purchased addit ional radios and improved response groups to aid safety and traffic communicat ion
Established a Standard Response Protocol (SRP) (Lockdown, Lockout, Evacuat ion, Shelter)
Conducted mult iple staff trainings regarding SRP.
Began a complete update of the comprehensive JAA Safety Plan
2015-16 SARC - John Adams Academy
Page 31 of 36

Last updated: 1/10/2017
Last updated: 1/30/2017
D. Other SARC InformationThe information in this sect ion is required to be in the SARC but is not included in the state priorit ies for LCFF.
Note: Cells w ith NA values do not require data.
Average Class Size and Class Size Distribution (Elementary)
* Number of classes indicates how many classes fall into each size category (a range of total students per class).
Federal Intervention Program (School Year 2016-17)Federal Intervention Program (School Year 2016-17)
Indicator School District
Program Improvement Status Not in PI Not in PI
First Year of Program Improvement
Year in Program Improvement
Number of Schools Current ly in Program Improvement N/A 1
Percent of Schools Current ly in Program Improvement N/A 33.3%
2013-14 2014-15 2015-16
Grade Level Average Class Size
Number of Classes *
Average Class Size
Number of Classes *
Average Class Size
Number of Classes *
1-20 21-32 33+ 1-20 21-32 33+ 1-20 21-32 33+
K 27.0 0 3 0 30.0 0 4 0 30.0 0 4 0
1 29.0 0 3 0 28.0 0 3 0 30.0 0 4 0
2 29.0 0 3 0 30.0 0 3 0 30.0 0 4 0
3 29.0 0 3 0 29.0 0 3 0 30.0 0 4 0
4 27.0 0 3 0 29.0 0 3 0 30.0 0 4 0
5 29.0 0 3 0 28.0 0 3 0 30.0 0 4 0
6 25.0 0 3 0 30.0 3 2 0 30.0 0 4 0
Other 0.0 0 0 0 0.0 0 0 0 0.0 0 0 0
2015-16 SARC - John Adams Academy
Page 32 of 36

Last updated: 1/30/2017
Last updated: 1/13/2017
Last updated: 1/23/2017
* Number of classes indicates how many classrooms fall into each size category (a range of total students per classroom). At the secondary school level, this information isreported by subject area rather than grade level.
Academic Counselors and Other Support Staff (School Year 2015-16)
Note: Cells w ith N/A values do not require data.
*One Full T ime Equivalent (FTE) equals one staff member working full t ime; one FTE could also represent two staff members who each work 50 percent of full t ime.
Note: Cells w ith N/A values do not require data.
Average Class Size and Class Size Distribution (Secondary)Average Class Size and Class Size Distribution (Secondary)
2013-14 2014-15 2015-16
Subject Average Class Size
Number of Classes *
Average Class Size
Number of Classes *
Average Class Size
Number of Classes *
1-22 23-32 33+ 1-22 23-32 33+ 1-22 23-32 33+
English 17.0 6 1 0 20.0 4 3 0 20.0 19 7 0
Mathematics 13.0 10 1 0 11.0 9 0 0 19.0 14 7 0
Science 24.0 2 6 0 22.0 3 6 0 24.0 7 13 0
Social Science 19.0 5 2 0 22.0 4 6 0 22.0 11 10 0
Title Number of FTE* Assigned to School Average Number of Students per Academic Counselor
Academic Counselor 1.0 202.0
Counselor (Social/Behavioral or Career Development) 1.0 N/A
Library Media Teacher (librarian) 1.0 N/A
Library Media Services Staff (paraprofessional) 1.0 N/A
Psychologist 0.5 N/A
Social Worker 0.0 N/A
Nurse 30.0 N/A
Speech/Language/Hearing Specialist 1.6 N/A
Resource Specialist (non-teaching) 1.0 N/A
Other 7.0 N/A
Expenditures Per Pupil and School Site Teacher Salaries (Fiscal Year 2014-15)Expenditures Per Pupil and School Site Teacher Salaries (Fiscal Year 2014-15)
LevelTotal Expenditures Per
PupilExpenditures Per Pupil
(Supplemental/Restricted)
Expenditures PerPupil
(Basic/Unrestricted)Average Teacher
Salary
School Site $8399.0 $683.0 $7716.0 $48691.0
District N/A N/A $5980.0 $65347.0
Percent Difference – School Site andDistrict
-- -- 0.0% 3.9%
State N/A N/A $5677.0 $71610.0
Percent Difference – School Site and State -- -- -- --
2015-16 SARC - John Adams Academy
Page 33 of 36

Last updated: 1/30/2017
Last updated: 1/13/2017
For detailed information on salaries, see the CDE Cert ificated Salaries & Benefits Web page at http://www.cde.ca.gov/ds/fd/cs/ .
Types of Services Funded (Fiscal Year 2015-16)Types of Services Funded (Fiscal Year 2015-16)
At John Adams Academy, scholar support is an integral and internally provided service. We believe that all scholars can achieve at the academy and we arecommitted to engaging scholars at all levels of learning. W ith a focus on classical educat ion, academics are challenging and engaging. To support this, theAcademy has staffed the Elementary School w ith Educat ional Instruct ional Aides and provides Learning Labs and Academic Advisors for grades 7th-12th.Addit ionally, intervent ion support staff is available and a rigorous Response to Intervent ion structure is in place. Scholars who may not be meeting success areprovided addit ional supports necessary for intervent ion. The John Adams Academy is fully staffed to support all scholars including those w ith IEP’s and 504’s.
Teacher and Administrative Salaries (Fiscal Year 2014-15)Teacher and Administrative Salaries (Fiscal Year 2014-15)
Category District Amount State Average For Districts In Same Category
Beginning Teacher Salary $40,620 $44,507
Mid-Range Teacher Salary $61,040 $68,910
Highest Teacher Salary $84,995 $88,330
Average Principal Salary (Elementary) $101,200 $111,481
Average Principal Salary (Middle) $ $115,435
Average Principal Salary (High) $ $113,414
Superintendent Salary $164,252 $169,821
Percent of Budget for Teacher Salaries 40.0% 39.0%
Percent of Budget for Administrat ive Salaries 6.0% 6.0%
Teacher Salary Chart
Beginning Teacher Salary Mid-Range Teacher Salary Highest Teacher Salary0
10000
20000
30000
40000
50000
60000
70000
80000
90000
Principal Salary Chart
Average Principal Salary
(Elementary)
Average Principal Salary
(Middle)
Average Principal Salary
(High)
0
20000
40000
60000
80000
100000
120000
2015-16 SARC - John Adams Academy
Page 34 of 36

Last updated: 1/31/2017
Note: Cells w ith N/A values do not require data.
*Where there are student course enrollments of at least one student.
Advanced Placement (AP) Courses (School Year 2015-16)Advanced Placement (AP) Courses (School Year 2015-16)
Subject Number of AP Courses Offered* Percent of Students In AP Courses
Computer Science N/A
English 1 N/A
Fine and Performing Arts N/A
Foreign Language N/A
Mathematics N/A
Science N/A
Social Science 2 N/A
All Courses 3 7.5%
2015-16 SARC - John Adams Academy
Page 35 of 36

Last updated: 1/31/2017
Professional DevelopmentProfessional Development
The John Adams Academy staff part icipates in ongoing professional development. Scholars are released early on Friday and teachers have a regular rotat ion ofmonthly department meetings, grade level meetings, safety trainings and principal-teacher meetings. Addit ionally, staff part icipates in quarterly Socrat ic discussionson classical book studies. Grade level meetings focus on evaluat ion of assessment data, different iated instruct ion methods, lesson planning, assessments,curriculum and scholar supports. At the elementary level, through assessment and curriculum review, it was determined that addit ional curriculum and support wasnecessary to enhance our writ ing program. Lucy Calkins writ ing was purchased and teachers part icipated in professional development focused on this curriculum.Outside training professionals worked w ith staff to implement the new writ ing curriculum and quarterly staff trainings, observat ions, workshops, coaching andgrade level meetings provided ongoing support and training throughout the school year. Mentor teachers are paired w ith new staff and use in-class coaching,teacher work days, support workshops and BTSA as means of professional development. Staff has attended off-site workshops including, but not limited to: PCOEProfessional Development Trainings, Great Books, PARC (Placer Area Reading Council), PBIS Training, CPR/First Aid, Act ive Shooter Training, SELPA sponsoredMTSS training, ACSA Conference, CCSA Conference.
2015-16 SARC - John Adams Academy
Page 36 of 36