SARC Report for Endeavor College Preparatory Charter College Preparatory Charter ... Endeavor...
28
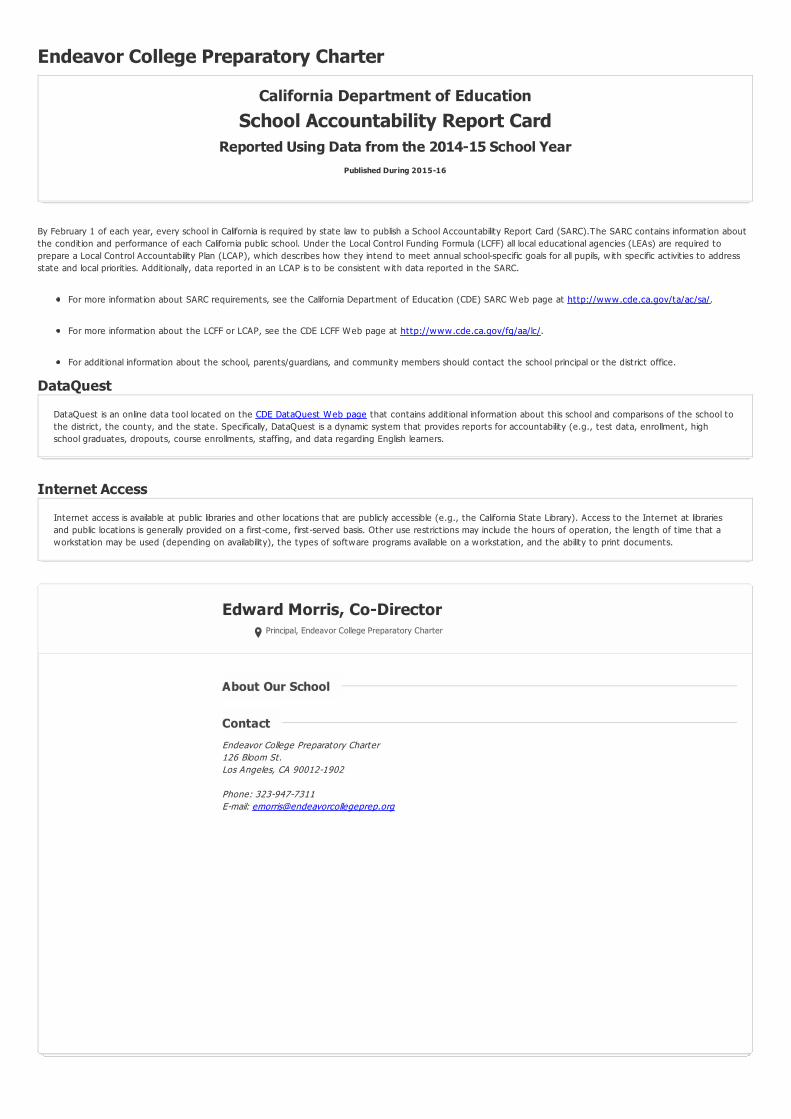
Endeavor College Preparatory Charter By February 1 of each year, every school in California is required by state law to publish a School Accountability Report Card (SARC).The SARC contains information about the condition and performance of each California public school. Under the Local Control Funding Formula (LCFF) all local educational agencies (LEAs) are required to prepare a Local Control Accountability Plan (LCAP), which describes how they intend to meet annual school-specific goals for all pupils, with specific activities to address state and local priorities. Additionally, data reported in an LCAP is to be consistent with data reported in the SARC. For more information about SARC requirements, see the California Department of Education (CDE) SARC Web page at http://www.cde.ca.gov/ta/ac/sa/ . For more information about the LCFF or LCAP, see the CDE LCFF Web page at http://www.cde.ca.gov/fg/aa/lc/ . For additional information about the school, parents/guardians, and community members should contact the school principal or the district office. DataQuest Internet Access California Department of Education School Accountability Report Card Reported Using Data from the 2014-15 School Year Published During 2015-16 DataQuest is an online data tool located on the CDE DataQuest Web page that contains additional information about this school and comparisons of the school to the district, the county, and the state. Specifically, DataQuest is a dynamic system that provides reports for accountability (e.g., test data, enrollment, high school graduates, dropouts, course enrollments, staffing, and data regarding English learners. Internet access is available at public libraries and other locations that are publicly accessible (e.g., the California State Library). Access to the Internet at libraries and public locations is generally provided on a first-come, first-served basis. Other use restrictions may include the hours of operation, the length of time that a workstation may be used (depending on availability), the types of software programs available on a workstation, and the ability to print documents. Edward Morris, Co-Director Principal, Endeavor College Preparatory Charter Endeavor College Preparatory Charter 126 Bloom St. Los Angeles, CA 90012-1902 Phone: 323-947-7311 E-mail: [email protected] About Our School About Our School Contact Contact
Transcript of SARC Report for Endeavor College Preparatory Charter College Preparatory Charter ... Endeavor...
Endeavor College Preparatory Charter
By February 1 of each year, every school in California is required by state law to publish a School Accountability Report Card (SARC).The SARC contains information aboutthe condit ion and performance of each California public school. Under the Local Control Funding Formula (LCFF) all local educat ional agencies (LEAs) are required toprepare a Local Control Accountability Plan (LCAP), which describes how they intend to meet annual school-specific goals for all pupils, w ith specific act ivit ies to addressstate and local priorit ies. Addit ionally, data reported in an LCAP is to be consistent w ith data reported in the SARC.
For more information about SARC requirements, see the California Department of Educat ion (CDE) SARC Web page at http://www.cde.ca.gov/ta/ac/sa/.
For more information about the LCFF or LCAP, see the CDE LCFF Web page at http://www.cde.ca.gov/fg/aa/lc/.
For addit ional information about the school, parents/guardians, and community members should contact the school principal or the district office.
DataQuest
Internet Access
California Department of Education
School Accountability Report CardReported Using Data from the 2014-15 School Year
Published During 2015-16
DataQuest is an online data tool located on the CDE DataQuest Web page that contains addit ional information about this school and comparisons of the school tothe district , the county, and the state. Specifically, DataQuest is a dynamic system that provides reports for accountability (e.g., test data, enrollment, highschool graduates, dropouts, course enrollments, staffing, and data regarding English learners.
Internet access is available at public libraries and other locat ions that are publicly accessible (e.g., the California State Library). Access to the Internet at librariesand public locat ions is generally provided on a first-come, first-served basis. Other use restrict ions may include the hours of operat ion, the length of t ime that aworkstat ion may be used (depending on availability), the types of software programs available on a workstat ion, and the ability to print documents.
Edward Morris, Co-DirectorPrincipal, Endeavor College Preparatory Charter
Endeavor College Preparatory Charter126 Bloom St.Los Angeles, CA 90012-1902
Phone: 323-947-7311E-mail: [email protected]
About Our SchoolAbout Our School
ContactContact
Last updated: 1/29/2016
Last updated: 1/29/2016
About This School
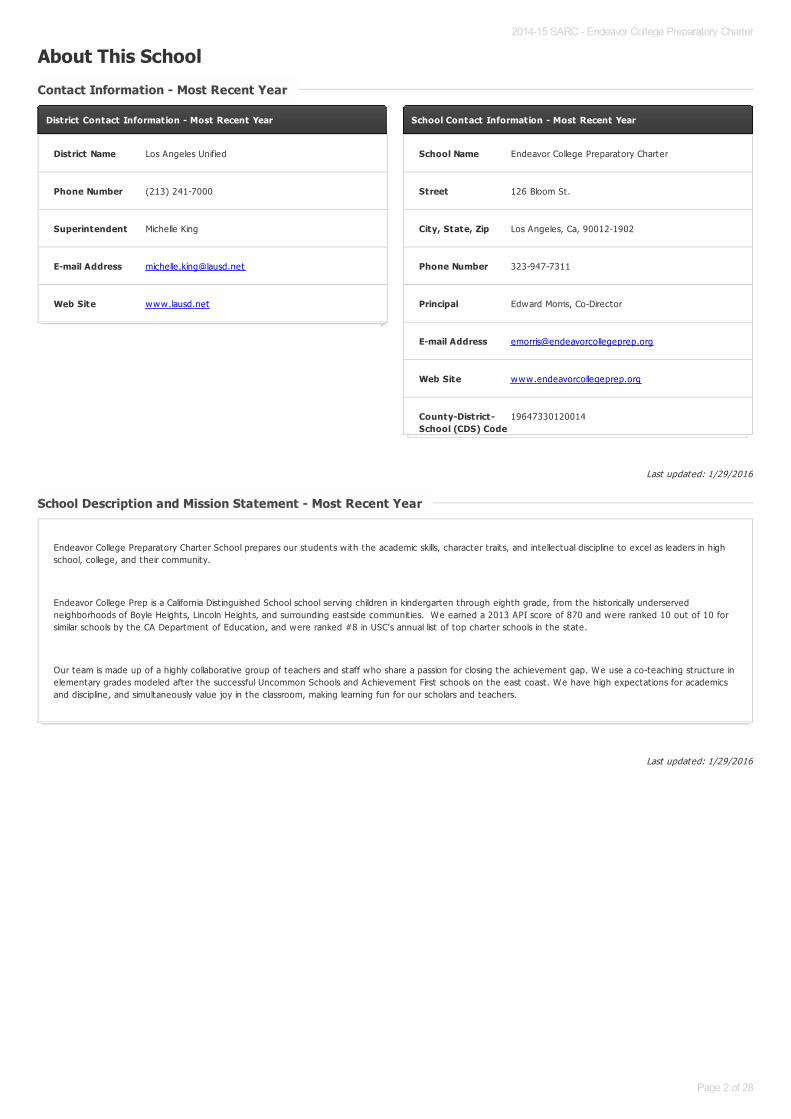
Contact Information - Most Recent YearContact Information - Most Recent Year
District Contact Information - Most Recent Year
District Name Los Angeles Unified
Phone Number (213) 241-7000
Superintendent Michelle King
E-mail Address [email protected]
Web Site www.lausd.net
School Contact Information - Most Recent Year
School Name Endeavor College Preparatory Charter
Street 126 Bloom St.
City, State, Zip Los Angeles, Ca, 90012-1902
Phone Number 323-947-7311
Principal Edward Morris, Co-Director
E-mail Address [email protected]
Web Site www.endeavorcollegeprep.org
County-District-School (CDS) Code
19647330120014
School Description and Mission Statement - Most Recent YearSchool Description and Mission Statement - Most Recent Year
Endeavor College Preparatory Charter School prepares our students w ith the academic skills, character traits, and intellectual discipline to excel as leaders in highschool, college, and their community.
Endeavor College Prep is a California Dist inguished School school serving children in kindergarten through eighth grade, from the historically underservedneighborhoods of Boyle Heights, Lincoln Heights, and surrounding eastside communit ies. We earned a 2013 API score of 870 and were ranked 10 out of 10 forsimilar schools by the CA Department of Educat ion, and were ranked #8 in USC’s annual list of top charter schools in the state.
Our team is made up of a highly collaborat ive group of teachers and staff who share a passion for closing the achievement gap. We use a co-teaching structure inelementary grades modeled after the successful Uncommon Schools and Achievement First schools on the east coast. We have high expectat ions for academicsand discipline, and simultaneously value joy in the classroom, making learning fun for our scholars and teachers.
2014-15 SARC - Endeavor College Preparatory Charter
Page 2 of 28
Last updated: 1/29/2016
Last updated: 1/30/2016
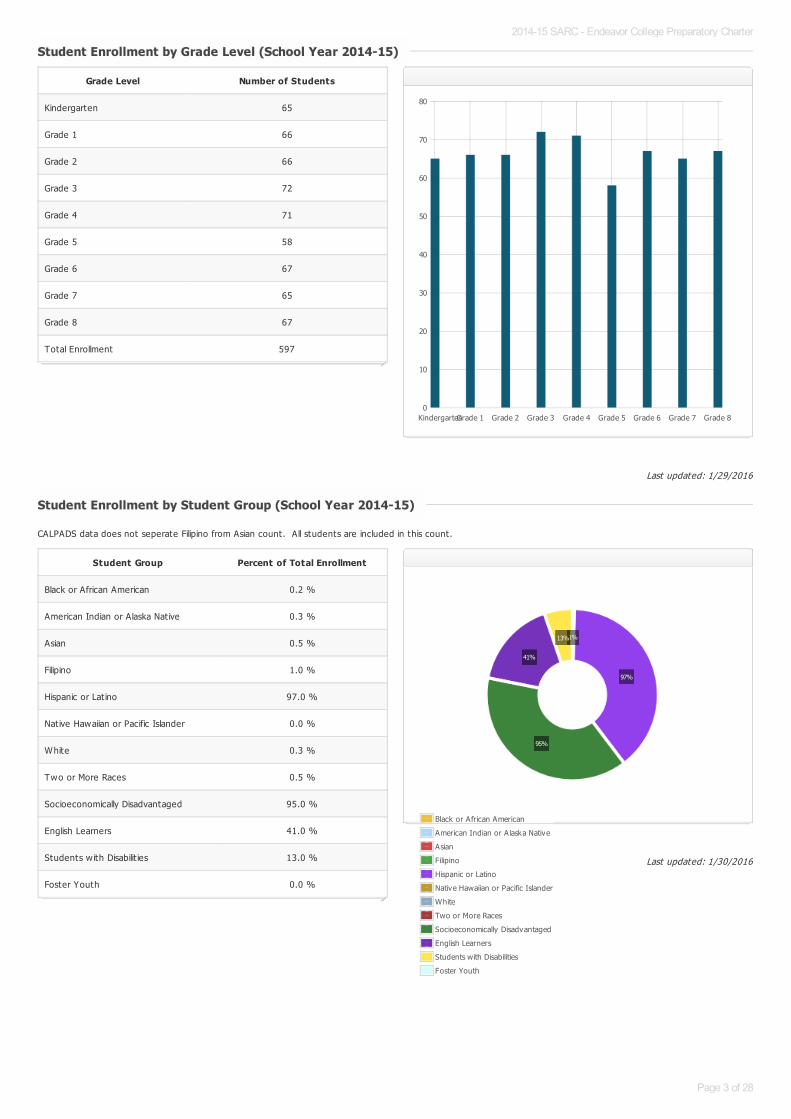
CALPADS data does not seperate Filipino from Asian count. All students are included in this count.
Student Enrollment by Grade Level (School Year 2014-15)Student Enrollment by Grade Level (School Year 2014-15)
Grade Level Number of Students
Kindergarten 65
Grade 1 66
Grade 2 66
Grade 3 72
Grade 4 71
Grade 5 58
Grade 6 67
Grade 7 65
Grade 8 67
Total Enrollment 597
KindergartenGrade 1 Grade 2 Grade 3 Grade 4 Grade 5 Grade 6 Grade 7 Grade 80
10
20
30
40
50
60
70
80
Student Enrollment by Student Group (School Year 2014-15)Student Enrollment by Student Group (School Year 2014-15)
Student Group Percent of Total Enrollment
Black or African American 0.2 %
American Indian or Alaska Nat ive 0.3 %
Asian 0.5 %
Filipino 1.0 %
Hispanic or Lat ino 97.0 %
Native Hawaiian or Pacific Islander 0.0 %
White 0.3 %
Two or More Races 0.5 %
Socioeconomically Disadvantaged 95.0 %
English Learners 41.0 %
Students w ith Disabilit ies 13.0 %
Foster Youth 0.0 %
Black or African American
American Indian or A laska Native
Asian
Filipino
Hispanic or Latino
Native Hawaiian or Pacific Islander
White
Two or More Races
Socioeconomically Disadvantaged
English Learners
Students with Disabilities
Foster Youth
1%
97%
95%
41%
13%
2014-15 SARC - Endeavor College Preparatory Charter
Page 3 of 28
Last updated: 1/30/2016
Last updated: 1/29/2016
A. Conditions of Learning
State Priority: Basic
The SARC provides the follow ing information relevant to the State priority: Basic (Priority 1):
Degree to which teachers are appropriately assigned and fully credent ialed in the subject area and for the pupils they are teaching;Pupils have access to standards-aligned instruct ional materials; andSchool facilit ies are maintained in good repair
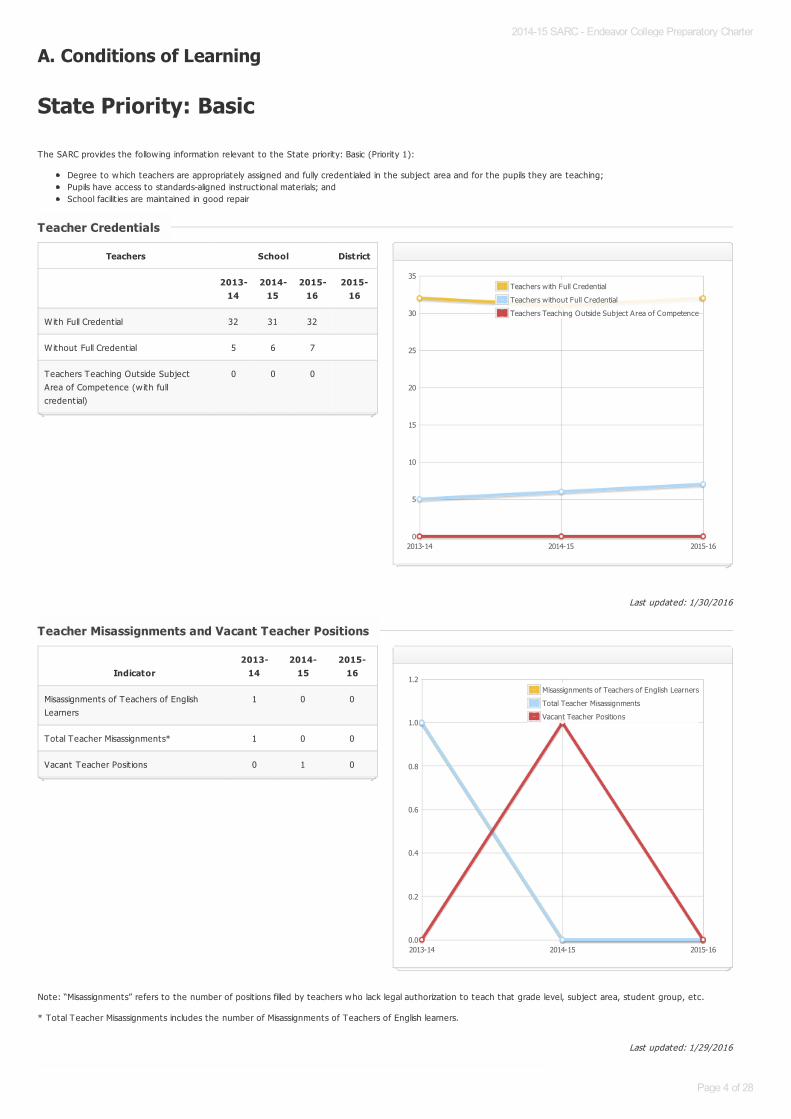
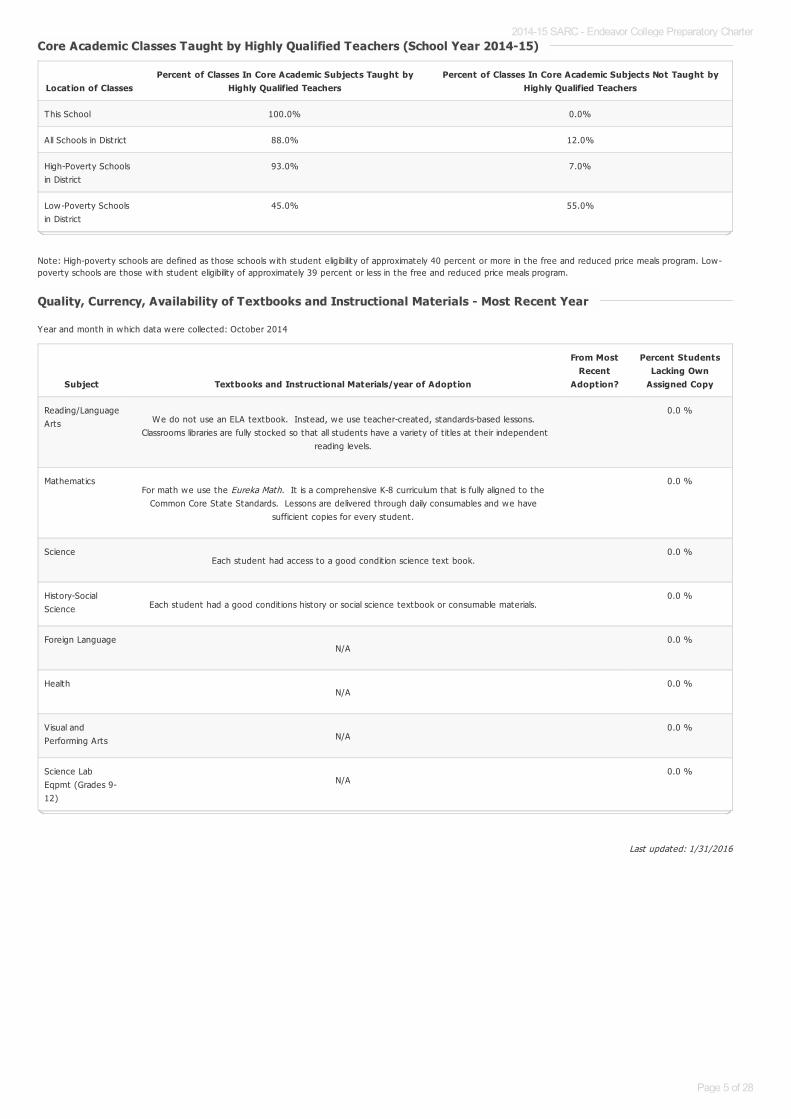
Note: “Misassignments” refers to the number of posit ions filled by teachers who lack legal authorizat ion to teach that grade level, subject area, student group, etc.
* Total Teacher Misassignments includes the number of Misassignments of Teachers of English learners.
Teacher CredentialsTeacher Credentials
Teachers School District
2013-14
2014-15
2015-16
2015-16
With Full Credent ial 32 31 32
Without Full Credent ial 5 6 7
Teachers Teaching Outside SubjectArea of Competence (w ith fullcredent ial)
0 0 0
2013-14 2014-15 2015-160
5
10
15
20
25
30
35Teachers with Full Credential
Teachers without Full Credential
Teachers Teaching Outside Subject Area of Competence
Teacher Misassignments and Vacant Teacher PositionsTeacher Misassignments and Vacant Teacher Positions
Indicator2013-
142014-
152015-
16
Misassignments of Teachers of EnglishLearners
1 0 0
Total Teacher Misassignments* 1 0 0
Vacant Teacher Posit ions 0 1 0
2013-14 2014-15 2015-160.0
0.2
0.4
0.6
0.8
1.0
1.2Misassignments of Teachers of English Learners
Total Teacher Misassignments
Vacant Teacher Positions
2014-15 SARC - Endeavor College Preparatory Charter
Page 4 of 28
Last updated: 1/31/2016
Note: High-poverty schools are defined as those schools w ith student eligibility of approximately 40 percent or more in the free and reduced price meals program. Low-poverty schools are those w ith student eligibility of approximately 39 percent or less in the free and reduced price meals program.
Year and month in which data were collected: October 2014
Core Academic Classes Taught by Highly Qualified Teachers (School Year 2014-15)Core Academic Classes Taught by Highly Qualified Teachers (School Year 2014-15)
Location of ClassesPercent of Classes In Core Academic Subjects Taught by
Highly Qualified TeachersPercent of Classes In Core Academic Subjects Not Taught by
Highly Qualified Teachers
This School 100.0% 0.0%
All Schools in District 88.0% 12.0%
High-Poverty Schoolsin District
93.0% 7.0%
Low-Poverty Schoolsin District
45.0% 55.0%
Quality, Currency, Availability of Textbooks and Instructional Materials - Most Recent YearQuality, Currency, Availability of Textbooks and Instructional Materials - Most Recent Year
Subject Textbooks and Instructional Materials/year of Adoption
From MostRecent
Adoption?
Percent StudentsLacking Own
Assigned Copy
Reading/LanguageArts We do not use an ELA textbook. Instead, we use teacher-created, standards-based lessons.
Classrooms libraries are fully stocked so that all students have a variety of t it les at their independentreading levels.
0.0 %
MathematicsFor math we use the Eureka Math. It is a comprehensive K-8 curriculum that is fully aligned to the
Common Core State Standards. Lessons are delivered through daily consumables and we havesufficient copies for every student.
0.0 %
ScienceEach student had access to a good condit ion science text book.
0.0 %
History-SocialScience Each student had a good condit ions history or social science textbook or consumable materials.
0.0 %
Foreign LanguageN/A
0.0 %
HealthN/A
0.0 %
Visual andPerforming Arts N/A
0.0 %
Science LabEqpmt (Grades 9-12)
N/A0.0 %
2014-15 SARC - Endeavor College Preparatory Charter
Page 5 of 28
Last updated: 1/29/2016
Last updated: 1/29/2016
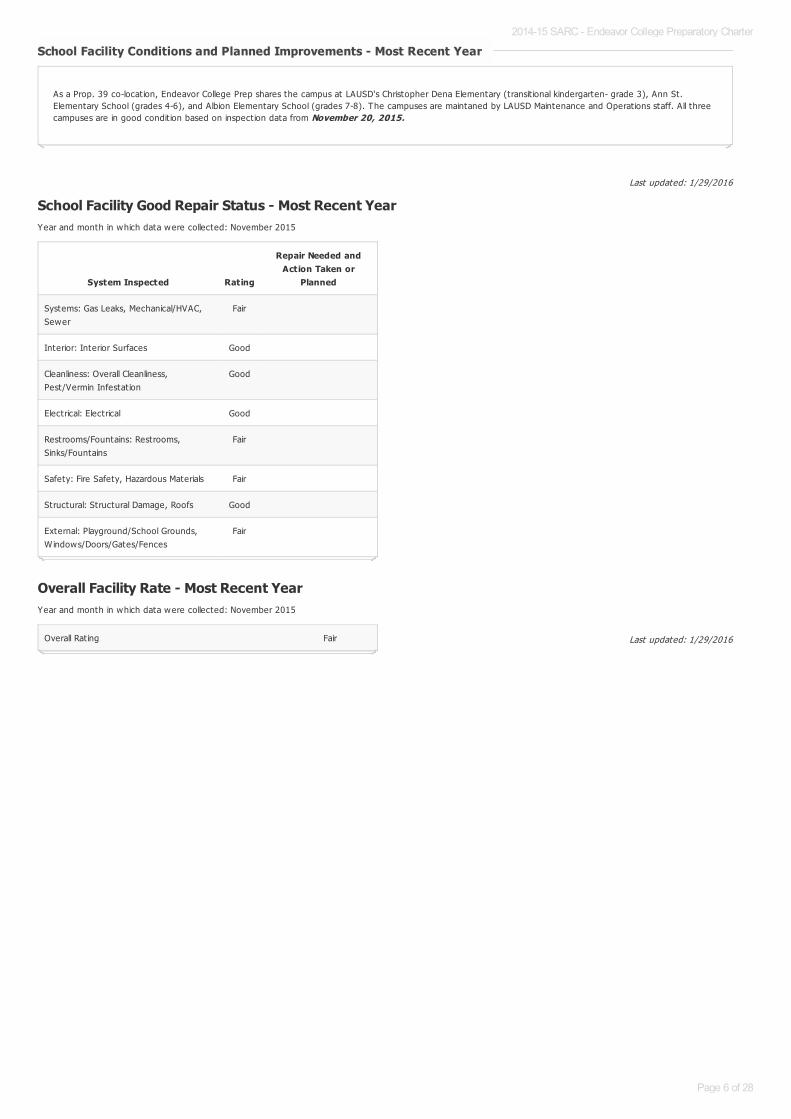
School Facility Good Repair Status - Most Recent YearYear and month in which data were collected: November 2015
Overall Facility Rate - Most Recent YearYear and month in which data were collected: November 2015
School Facility Conditions and Planned Improvements - Most Recent YearSchool Facility Conditions and Planned Improvements - Most Recent Year
As a Prop. 39 co-locat ion, Endeavor College Prep shares the campus at LAUSD's Christopher Dena Elementary (transit ional kindergarten- grade 3), Ann St.Elementary School (grades 4-6), and Albion Elementary School (grades 7-8). The campuses are maintaned by LAUSD Maintenance and Operat ions staff. All threecampuses are in good condit ion based on inspect ion data from November 20, 2015.
System Inspected Rating
Repair Needed andAction Taken or
Planned
Systems: Gas Leaks, Mechanical/HVAC,Sewer
Fair
Interior: Interior Surfaces Good
Cleanliness: Overall Cleanliness,Pest/Vermin Infestat ion
Good
Electrical: Electrical Good
Restrooms/Fountains: Restrooms,Sinks/Fountains
Fair
Safety: Fire Safety, Hazardous Materials Fair
Structural: Structural Damage, Roofs Good
External: Playground/School Grounds,W indows/Doors/Gates/Fences
Fair
Overall Rat ing Fair
2014-15 SARC - Endeavor College Preparatory Charter
Page 6 of 28
Last updated: 1/29/2016
B. Pupil Outcomes
State Priority: Pupil Achievement
The SARC provides the follow ing information relevant to the State priority: Pupil Achievement (Priority 4):
Statew ide assessments (i.e., California Assessment of Student Performance and Progress [CAASPP], Science California Standards Tests); andThe percentage of pupils who have successfully completed courses that sat isfy the requirements for entrance to the University of California and the CaliforniaState University, or career technical educat ion sequences or programs of study
Note: Percentages are not calculated when the number of students tested is ten or less, either because the number of students in this category is too small forstat ist ical accuracy or to protect student privacy. Double dashes (--) appear in the table when the number of students tested is ten or less.
California Assessment of Student Performance and Progress Results for All Students (School Year 2014-15)California Assessment of Student Performance and Progress Results for All Students (School Year 2014-15)
Subject
Percent of Students Meeting or Exceeding the State Standards
School District State
English Language Arts / Literacy (grades 3-8 and 11) 36.0% 33.0% 44.0%
Mathematics (grades 3-8 and 11) 26.0% 25.0% 33.0%
2014-15 SARC - Endeavor College Preparatory Charter
Page 7 of 28
Last updated: 1/30/2016
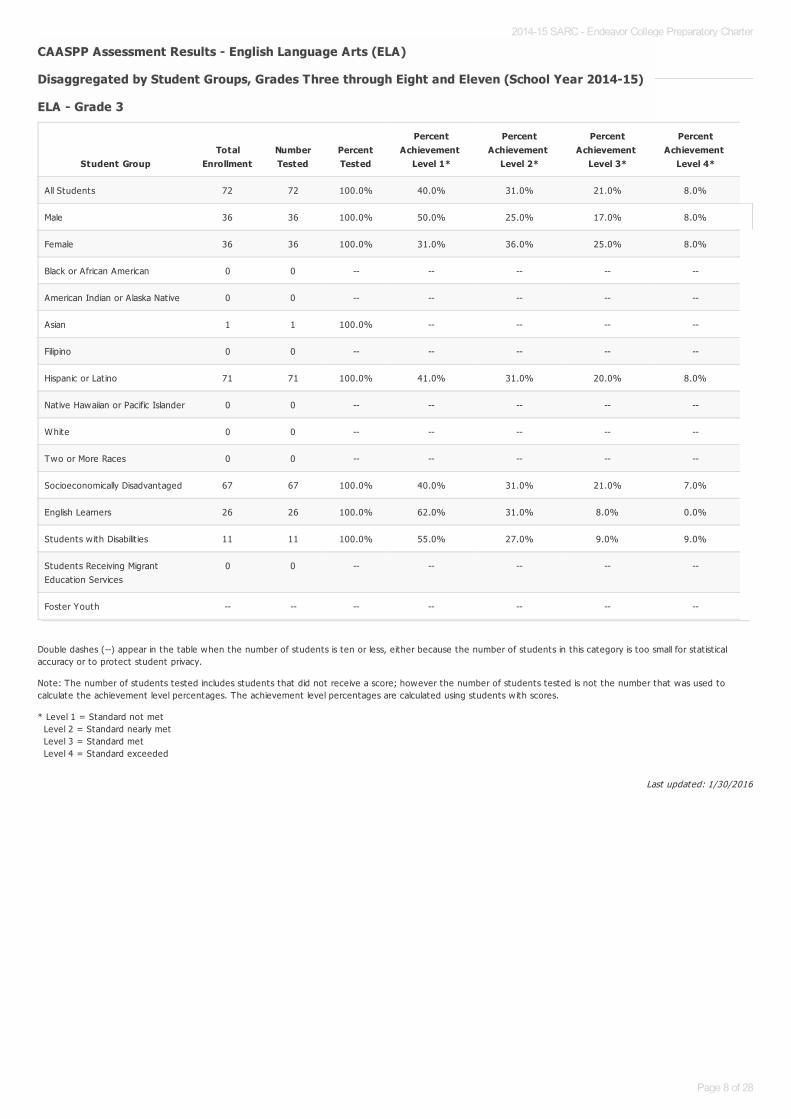
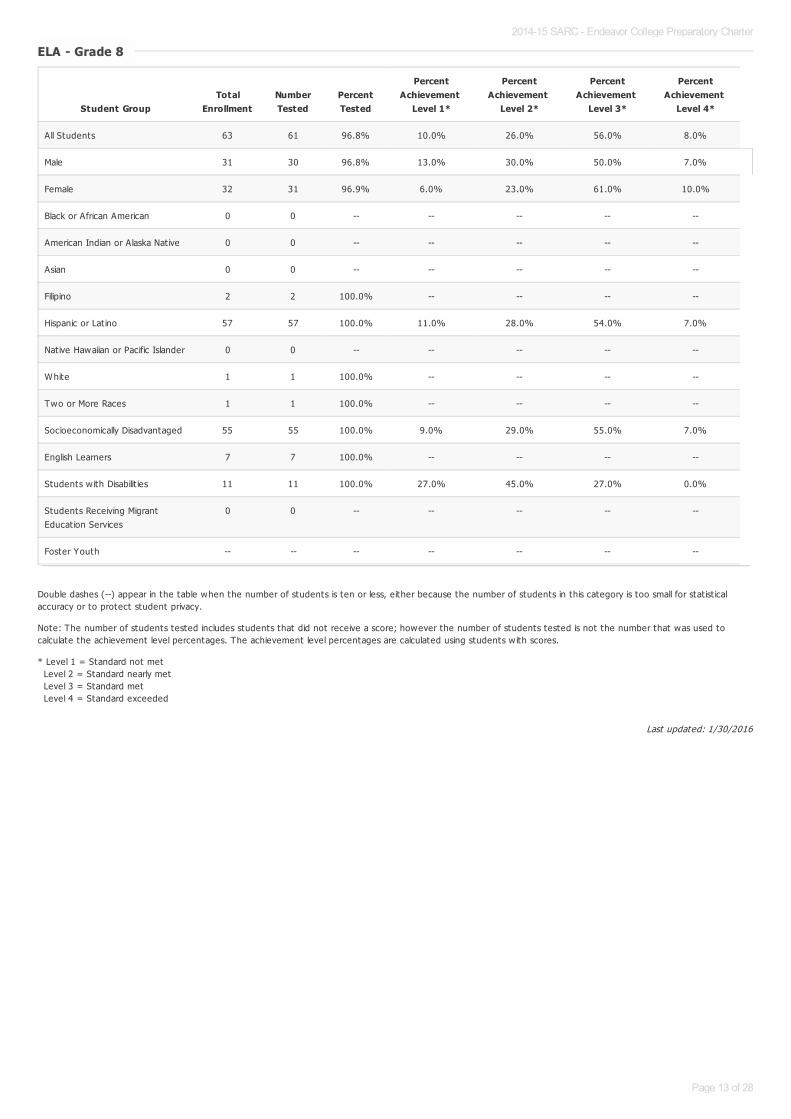
Double dashes (--) appear in the table when the number of students is ten or less, either because the number of students in this category is too small for stat ist icalaccuracy or to protect student privacy.
Note: The number of students tested includes students that did not receive a score; however the number of students tested is not the number that was used tocalculate the achievement level percentages. The achievement level percentages are calculated using students w ith scores.
* Level 1 = Standard not met Level 2 = Standard nearly met Level 3 = Standard met Level 4 = Standard exceeded
CAASPP Assessment Results - English Language Arts (ELA) CAASPP Assessment Results - English Language Arts (ELA)
Disaggregated by Student Groups, Grades Three through Eight and Eleven (School Year 2014-15)Disaggregated by Student Groups, Grades Three through Eight and Eleven (School Year 2014-15)
ELA - Grade 3ELA - Grade 3
Student GroupTotal
EnrollmentNumberTested
PercentTested
PercentAchievement
Level 1*
PercentAchievement
Level 2*
PercentAchievement
Level 3*
PercentAchievement
Level 4*
All Students 72 72 100.0% 40.0% 31.0% 21.0% 8.0%
Male 36 36 100.0% 50.0% 25.0% 17.0% 8.0%
Female 36 36 100.0% 31.0% 36.0% 25.0% 8.0%
Black or African American 0 0 -- -- -- -- --
American Indian or Alaska Nat ive 0 0 -- -- -- -- --
Asian 1 1 100.0% -- -- -- --
Filipino 0 0 -- -- -- -- --
Hispanic or Lat ino 71 71 100.0% 41.0% 31.0% 20.0% 8.0%
Native Hawaiian or Pacific Islander 0 0 -- -- -- -- --
White 0 0 -- -- -- -- --
Two or More Races 0 0 -- -- -- -- --
Socioeconomically Disadvantaged 67 67 100.0% 40.0% 31.0% 21.0% 7.0%
English Learners 26 26 100.0% 62.0% 31.0% 8.0% 0.0%
Students w ith Disabilit ies 11 11 100.0% 55.0% 27.0% 9.0% 9.0%
Students Receiving MigrantEducat ion Services
0 0 -- -- -- -- --
Foster Youth -- -- -- -- -- -- --
2014-15 SARC - Endeavor College Preparatory Charter
Page 8 of 28
Last updated: 1/30/2016
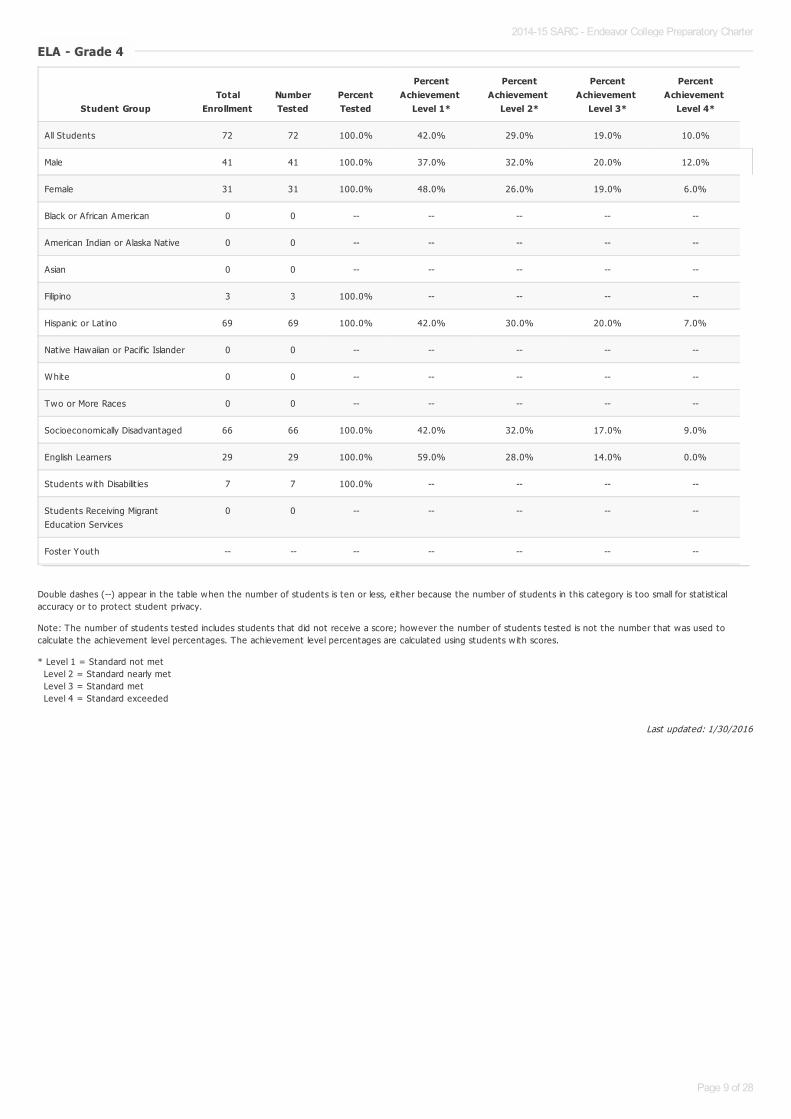
Double dashes (--) appear in the table when the number of students is ten or less, either because the number of students in this category is too small for stat ist icalaccuracy or to protect student privacy.
Note: The number of students tested includes students that did not receive a score; however the number of students tested is not the number that was used tocalculate the achievement level percentages. The achievement level percentages are calculated using students w ith scores.
* Level 1 = Standard not met Level 2 = Standard nearly met Level 3 = Standard met Level 4 = Standard exceeded
ELA - Grade 4ELA - Grade 4
Student GroupTotal
EnrollmentNumberTested
PercentTested
PercentAchievement
Level 1*
PercentAchievement
Level 2*
PercentAchievement
Level 3*
PercentAchievement
Level 4*
All Students 72 72 100.0% 42.0% 29.0% 19.0% 10.0%
Male 41 41 100.0% 37.0% 32.0% 20.0% 12.0%
Female 31 31 100.0% 48.0% 26.0% 19.0% 6.0%
Black or African American 0 0 -- -- -- -- --
American Indian or Alaska Nat ive 0 0 -- -- -- -- --
Asian 0 0 -- -- -- -- --
Filipino 3 3 100.0% -- -- -- --
Hispanic or Lat ino 69 69 100.0% 42.0% 30.0% 20.0% 7.0%
Native Hawaiian or Pacific Islander 0 0 -- -- -- -- --
White 0 0 -- -- -- -- --
Two or More Races 0 0 -- -- -- -- --
Socioeconomically Disadvantaged 66 66 100.0% 42.0% 32.0% 17.0% 9.0%
English Learners 29 29 100.0% 59.0% 28.0% 14.0% 0.0%
Students w ith Disabilit ies 7 7 100.0% -- -- -- --
Students Receiving MigrantEducat ion Services
0 0 -- -- -- -- --
Foster Youth -- -- -- -- -- -- --
2014-15 SARC - Endeavor College Preparatory Charter
Page 9 of 28

Last updated: 1/30/2016
Double dashes (--) appear in the table when the number of students is ten or less, either because the number of students in this category is too small for stat ist icalaccuracy or to protect student privacy.
Note: The number of students tested includes students that did not receive a score; however the number of students tested is not the number that was used tocalculate the achievement level percentages. The achievement level percentages are calculated using students w ith scores.
* Level 1 = Standard not met Level 2 = Standard nearly met Level 3 = Standard met Level 4 = Standard exceeded
ELA - Grade 5ELA - Grade 5
Student GroupTotal
EnrollmentNumberTested
PercentTested
PercentAchievement
Level 1*
PercentAchievement
Level 2*
PercentAchievement
Level 3*
PercentAchievement
Level 4*
All Students 59 57 96.6% 35.0% 27.0% 27.0% 11.0%
Male 25 24 96.0% 33.0% 25.0% 33.0% 8.0%
Female 34 33 97.0% 33.0% 30.0% 24.0% 12.0%
Black or African American 0 0 -- -- -- -- --
American Indian or Alaska Nat ive 1 1 100.0% -- -- -- --
Asian 0 0 -- -- -- -- --
Filipino 0 0 -- -- -- -- --
Hispanic or Lat ino 59 55 93.2% 35.0% 27.0% 27.0% 11.0%
Native Hawaiian or Pacific Islander 0 0 -- -- -- -- --
White 0 0 -- -- -- -- --
Two or More Races 1 1 100.0% -- -- -- --
Socioeconomically Disadvantaged 53 53 100.0% 34.0% 28.0% 28.0% 9.0%
English Learners 20 20 100.0% 60.0% 30.0% 10.0% 0.0%
Students w ith Disabilit ies 8 8 100.0% -- -- -- --
Students Receiving MigrantEducat ion Services
0 0 -- -- -- -- --
Foster Youth -- -- -- -- -- -- --
2014-15 SARC - Endeavor College Preparatory Charter
Page 10 of 28
Last updated: 1/30/2016
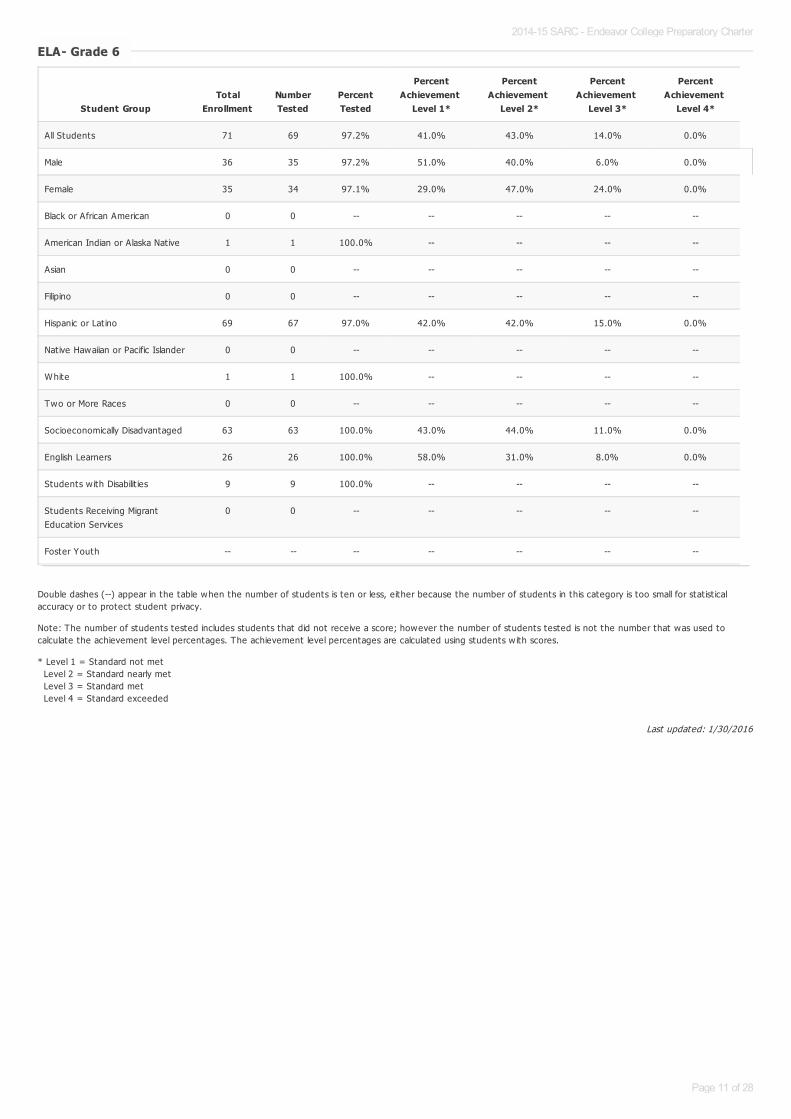
Double dashes (--) appear in the table when the number of students is ten or less, either because the number of students in this category is too small for stat ist icalaccuracy or to protect student privacy.
Note: The number of students tested includes students that did not receive a score; however the number of students tested is not the number that was used tocalculate the achievement level percentages. The achievement level percentages are calculated using students w ith scores.
* Level 1 = Standard not met Level 2 = Standard nearly met Level 3 = Standard met Level 4 = Standard exceeded
ELA- ELA- Grade 6Grade 6
Student GroupTotal
EnrollmentNumberTested
PercentTested
PercentAchievement
Level 1*
PercentAchievement
Level 2*
PercentAchievement
Level 3*
PercentAchievement
Level 4*
All Students 71 69 97.2% 41.0% 43.0% 14.0% 0.0%
Male 36 35 97.2% 51.0% 40.0% 6.0% 0.0%
Female 35 34 97.1% 29.0% 47.0% 24.0% 0.0%
Black or African American 0 0 -- -- -- -- --
American Indian or Alaska Nat ive 1 1 100.0% -- -- -- --
Asian 0 0 -- -- -- -- --
Filipino 0 0 -- -- -- -- --
Hispanic or Lat ino 69 67 97.0% 42.0% 42.0% 15.0% 0.0%
Native Hawaiian or Pacific Islander 0 0 -- -- -- -- --
White 1 1 100.0% -- -- -- --
Two or More Races 0 0 -- -- -- -- --
Socioeconomically Disadvantaged 63 63 100.0% 43.0% 44.0% 11.0% 0.0%
English Learners 26 26 100.0% 58.0% 31.0% 8.0% 0.0%
Students w ith Disabilit ies 9 9 100.0% -- -- -- --
Students Receiving MigrantEducat ion Services
0 0 -- -- -- -- --
Foster Youth -- -- -- -- -- -- --
2014-15 SARC - Endeavor College Preparatory Charter
Page 11 of 28
Last updated: 1/30/2016
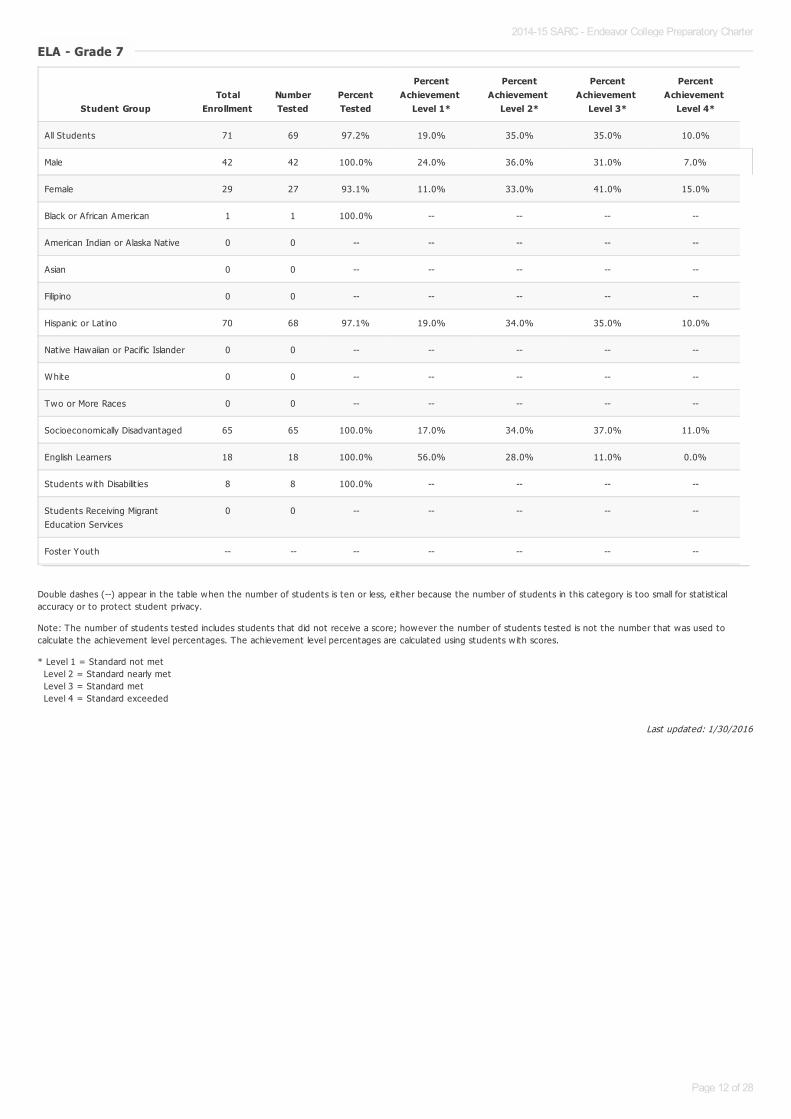
Double dashes (--) appear in the table when the number of students is ten or less, either because the number of students in this category is too small for stat ist icalaccuracy or to protect student privacy.
Note: The number of students tested includes students that did not receive a score; however the number of students tested is not the number that was used tocalculate the achievement level percentages. The achievement level percentages are calculated using students w ith scores.
* Level 1 = Standard not met Level 2 = Standard nearly met Level 3 = Standard met Level 4 = Standard exceeded
ELA - Grade 7ELA - Grade 7
Student GroupTotal
EnrollmentNumberTested
PercentTested
PercentAchievement
Level 1*
PercentAchievement
Level 2*
PercentAchievement
Level 3*
PercentAchievement
Level 4*
All Students 71 69 97.2% 19.0% 35.0% 35.0% 10.0%
Male 42 42 100.0% 24.0% 36.0% 31.0% 7.0%
Female 29 27 93.1% 11.0% 33.0% 41.0% 15.0%
Black or African American 1 1 100.0% -- -- -- --
American Indian or Alaska Nat ive 0 0 -- -- -- -- --
Asian 0 0 -- -- -- -- --
Filipino 0 0 -- -- -- -- --
Hispanic or Lat ino 70 68 97.1% 19.0% 34.0% 35.0% 10.0%
Native Hawaiian or Pacific Islander 0 0 -- -- -- -- --
White 0 0 -- -- -- -- --
Two or More Races 0 0 -- -- -- -- --
Socioeconomically Disadvantaged 65 65 100.0% 17.0% 34.0% 37.0% 11.0%
English Learners 18 18 100.0% 56.0% 28.0% 11.0% 0.0%
Students w ith Disabilit ies 8 8 100.0% -- -- -- --
Students Receiving MigrantEducat ion Services
0 0 -- -- -- -- --
Foster Youth -- -- -- -- -- -- --
2014-15 SARC - Endeavor College Preparatory Charter
Page 12 of 28
Last updated: 1/30/2016
Double dashes (--) appear in the table when the number of students is ten or less, either because the number of students in this category is too small for stat ist icalaccuracy or to protect student privacy.
Note: The number of students tested includes students that did not receive a score; however the number of students tested is not the number that was used tocalculate the achievement level percentages. The achievement level percentages are calculated using students w ith scores.
* Level 1 = Standard not met Level 2 = Standard nearly met Level 3 = Standard met Level 4 = Standard exceeded
ELA - Grade 8ELA - Grade 8
Student GroupTotal
EnrollmentNumberTested
PercentTested
PercentAchievement
Level 1*
PercentAchievement
Level 2*
PercentAchievement
Level 3*
PercentAchievement
Level 4*
All Students 63 61 96.8% 10.0% 26.0% 56.0% 8.0%
Male 31 30 96.8% 13.0% 30.0% 50.0% 7.0%
Female 32 31 96.9% 6.0% 23.0% 61.0% 10.0%
Black or African American 0 0 -- -- -- -- --
American Indian or Alaska Nat ive 0 0 -- -- -- -- --
Asian 0 0 -- -- -- -- --
Filipino 2 2 100.0% -- -- -- --
Hispanic or Lat ino 57 57 100.0% 11.0% 28.0% 54.0% 7.0%
Native Hawaiian or Pacific Islander 0 0 -- -- -- -- --
White 1 1 100.0% -- -- -- --
Two or More Races 1 1 100.0% -- -- -- --
Socioeconomically Disadvantaged 55 55 100.0% 9.0% 29.0% 55.0% 7.0%
English Learners 7 7 100.0% -- -- -- --
Students w ith Disabilit ies 11 11 100.0% 27.0% 45.0% 27.0% 0.0%
Students Receiving MigrantEducat ion Services
0 0 -- -- -- -- --
Foster Youth -- -- -- -- -- -- --
2014-15 SARC - Endeavor College Preparatory Charter
Page 13 of 28
Last updated: 1/30/2016
Double dashes (--) appear in the table when the number of students is ten or less, either because the number of students in this category is too small for stat ist icalaccuracy or to protect student privacy.
Note: The number of students tested includes students that did not receive a score; however the number of students tested is not the number that was used tocalculate the achievement level percentages. The achievement level percentages are calculated using students w ith scores.
* Level 1 = Standard not met Level 2 = Standard nearly met Level 3 = Standard met Level 4 = Standard exceeded
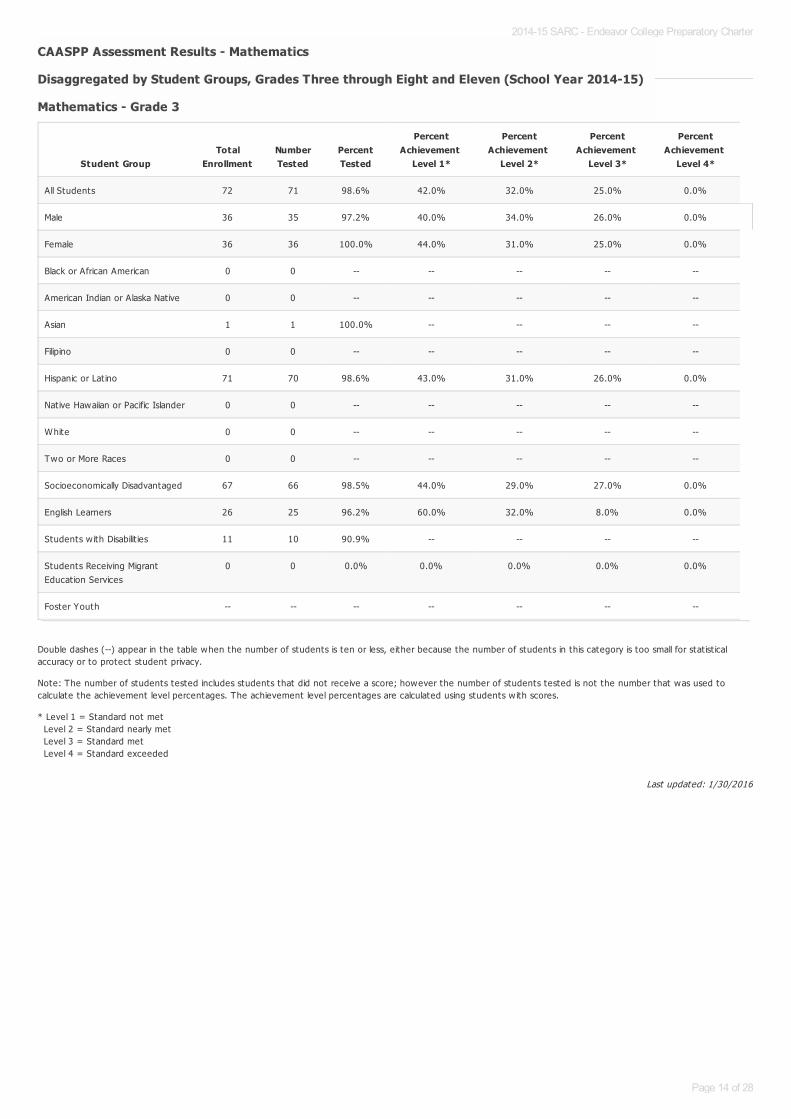
CAASPP Assessment Results - Mathematics CAASPP Assessment Results - Mathematics
Disaggregated by Student Groups, Grades Three through Eight and Eleven (School Year 2014-15)Disaggregated by Student Groups, Grades Three through Eight and Eleven (School Year 2014-15)
Mathematics - Grade 3Mathematics - Grade 3
Student GroupTotal
EnrollmentNumberTested
PercentTested
PercentAchievement
Level 1*
PercentAchievement
Level 2*
PercentAchievement
Level 3*
PercentAchievement
Level 4*
All Students 72 71 98.6% 42.0% 32.0% 25.0% 0.0%
Male 36 35 97.2% 40.0% 34.0% 26.0% 0.0%
Female 36 36 100.0% 44.0% 31.0% 25.0% 0.0%
Black or African American 0 0 -- -- -- -- --
American Indian or Alaska Nat ive 0 0 -- -- -- -- --
Asian 1 1 100.0% -- -- -- --
Filipino 0 0 -- -- -- -- --
Hispanic or Lat ino 71 70 98.6% 43.0% 31.0% 26.0% 0.0%
Native Hawaiian or Pacific Islander 0 0 -- -- -- -- --
White 0 0 -- -- -- -- --
Two or More Races 0 0 -- -- -- -- --
Socioeconomically Disadvantaged 67 66 98.5% 44.0% 29.0% 27.0% 0.0%
English Learners 26 25 96.2% 60.0% 32.0% 8.0% 0.0%
Students w ith Disabilit ies 11 10 90.9% -- -- -- --
Students Receiving MigrantEducat ion Services
0 0 0.0% 0.0% 0.0% 0.0% 0.0%
Foster Youth -- -- -- -- -- -- --
2014-15 SARC - Endeavor College Preparatory Charter
Page 14 of 28

Last updated: 1/30/2016
Double dashes (--) appear in the table when the number of students is ten or less, either because the number of students in this category is too small for stat ist icalaccuracy or to protect student privacy.
Note: The number of students tested includes students that did not receive a score; however the number of students tested is not the number that was used tocalculate the achievement level percentages. The achievement level percentages are calculated using students w ith scores.
* Level 1 = Standard not met Level 2 = Standard nearly met Level 3 = Standard met Level 4 = Standard exceeded
Mathematics - Grade 4Mathematics - Grade 4
Student GroupTotal
EnrollmentNumberTested
PercentTested
PercentAchievement
Level 1*
PercentAchievement
Level 2*
PercentAchievement
Level 3*
PercentAchievement
Level 4*
All Students 72 71 97.3% 34.0% 45.0% 17.0% 4.0%
Male 41 40 97.6% 30.0% 43.0% 20.0% 8.0%
Female 31 31 100.0% 39.0% 48.0% 13.0% 0.0%
Black or African American 0 0 -- -- -- -- --
American Indian or Alaska Nat ive 0 0 -- -- -- -- --
Asian 0 0 -- -- -- -- --
Filipino 3 3 100.0% -- -- -- --
Hispanic or Lat ino 69 68 98.6% 34.0% 47.0% 16.0% 3.0%
Native Hawaiian or Pacific Islander 0 0 -- -- -- -- --
White 0 0 -- -- -- -- --
Two or More Races 0 0 -- -- -- -- --
Socioeconomically Disadvantaged 66 66 100.0% 35.0% 47.0% 15.0% 3.0%
English Learners 29 28 96.6% 43.0% 46.0% 11.0% 0.0%
Students w ith Disabilit ies 7 7 100.0% -- -- -- --
Students Receiving MigrantEducat ion Services
0 0 -- -- -- -- --
Foster Youth -- -- -- -- -- -- --
2014-15 SARC - Endeavor College Preparatory Charter
Page 15 of 28
Last updated: 1/30/2016
Double dashes (--) appear in the table when the number of students is ten or less, either because the number of students in this category is too small for stat ist icalaccuracy or to protect student privacy.
Note: The number of students tested includes students that did not receive a score; however the number of students tested is not the number that was used tocalculate the achievement level percentages. The achievement level percentages are calculated using students w ith scores.
* Level 1 = Standard not met Level 2 = Standard nearly met Level 3 = Standard met Level 4 = Standard exceeded
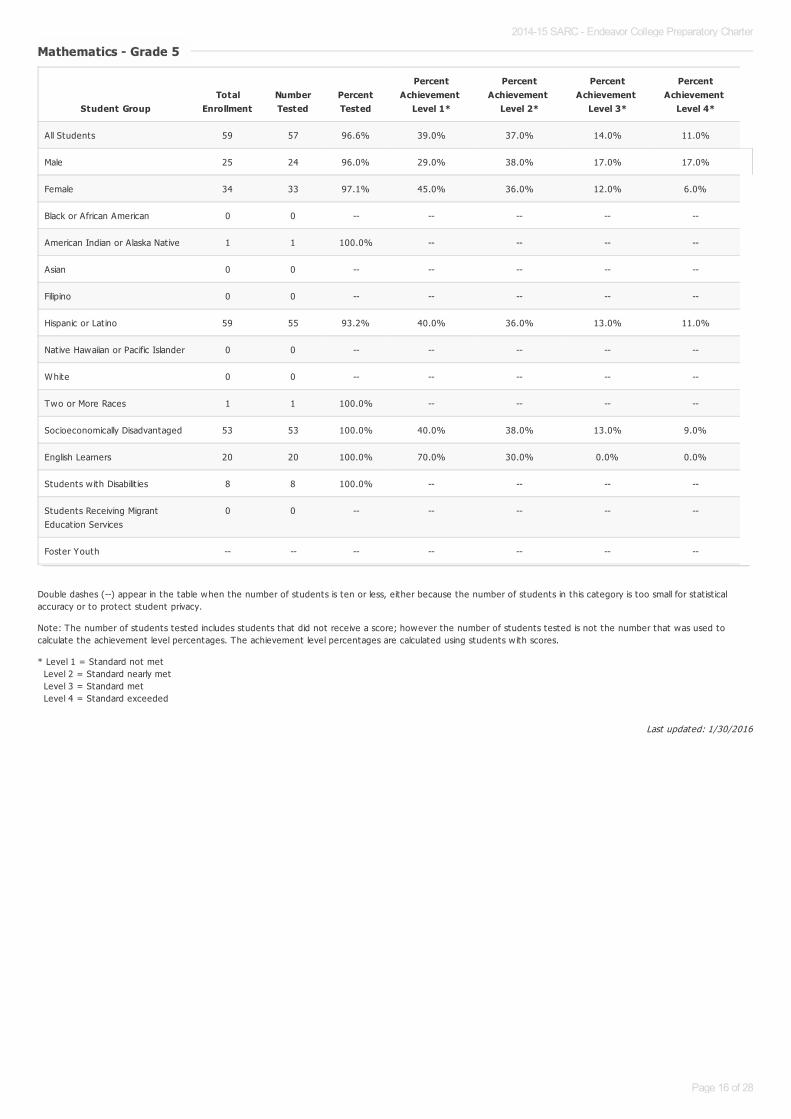
Mathematics - Grade 5Mathematics - Grade 5
Student GroupTotal
EnrollmentNumberTested
PercentTested
PercentAchievement
Level 1*
PercentAchievement
Level 2*
PercentAchievement
Level 3*
PercentAchievement
Level 4*
All Students 59 57 96.6% 39.0% 37.0% 14.0% 11.0%
Male 25 24 96.0% 29.0% 38.0% 17.0% 17.0%
Female 34 33 97.1% 45.0% 36.0% 12.0% 6.0%
Black or African American 0 0 -- -- -- -- --
American Indian or Alaska Nat ive 1 1 100.0% -- -- -- --
Asian 0 0 -- -- -- -- --
Filipino 0 0 -- -- -- -- --
Hispanic or Lat ino 59 55 93.2% 40.0% 36.0% 13.0% 11.0%
Native Hawaiian or Pacific Islander 0 0 -- -- -- -- --
White 0 0 -- -- -- -- --
Two or More Races 1 1 100.0% -- -- -- --
Socioeconomically Disadvantaged 53 53 100.0% 40.0% 38.0% 13.0% 9.0%
English Learners 20 20 100.0% 70.0% 30.0% 0.0% 0.0%
Students w ith Disabilit ies 8 8 100.0% -- -- -- --
Students Receiving MigrantEducat ion Services
0 0 -- -- -- -- --
Foster Youth -- -- -- -- -- -- --
2014-15 SARC - Endeavor College Preparatory Charter
Page 16 of 28
Last updated: 1/30/2016
Double dashes (--) appear in the table when the number of students is ten or less, either because the number of students in this category is too small for stat ist icalaccuracy or to protect student privacy.
Note: The number of students tested includes students that did not receive a score; however the number of students tested is not the number that was used tocalculate the achievement level percentages. The achievement level percentages are calculated using students w ith scores.
* Level 1 = Standard not met Level 2 = Standard nearly met Level 3 = Standard met Level 4 = Standard exceeded
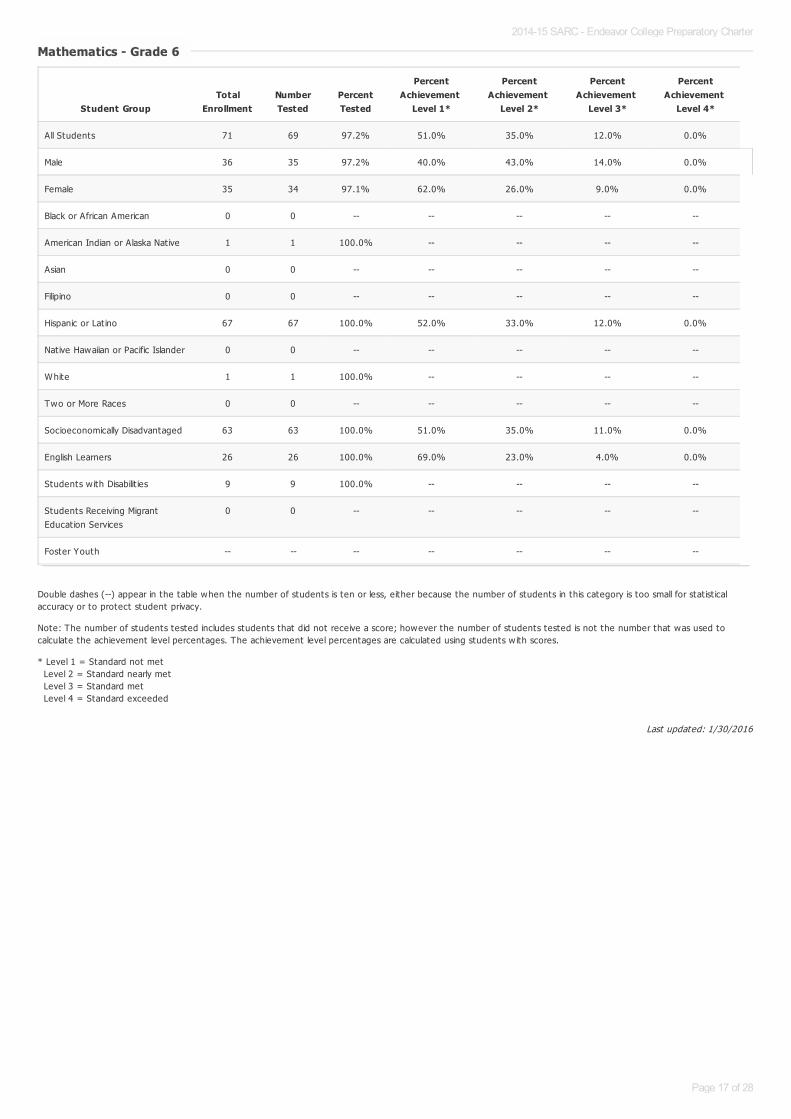
Mathematics - Grade 6Mathematics - Grade 6
Student GroupTotal
EnrollmentNumberTested
PercentTested
PercentAchievement
Level 1*
PercentAchievement
Level 2*
PercentAchievement
Level 3*
PercentAchievement
Level 4*
All Students 71 69 97.2% 51.0% 35.0% 12.0% 0.0%
Male 36 35 97.2% 40.0% 43.0% 14.0% 0.0%
Female 35 34 97.1% 62.0% 26.0% 9.0% 0.0%
Black or African American 0 0 -- -- -- -- --
American Indian or Alaska Nat ive 1 1 100.0% -- -- -- --
Asian 0 0 -- -- -- -- --
Filipino 0 0 -- -- -- -- --
Hispanic or Lat ino 67 67 100.0% 52.0% 33.0% 12.0% 0.0%
Native Hawaiian or Pacific Islander 0 0 -- -- -- -- --
White 1 1 100.0% -- -- -- --
Two or More Races 0 0 -- -- -- -- --
Socioeconomically Disadvantaged 63 63 100.0% 51.0% 35.0% 11.0% 0.0%
English Learners 26 26 100.0% 69.0% 23.0% 4.0% 0.0%
Students w ith Disabilit ies 9 9 100.0% -- -- -- --
Students Receiving MigrantEducat ion Services
0 0 -- -- -- -- --
Foster Youth -- -- -- -- -- -- --
2014-15 SARC - Endeavor College Preparatory Charter
Page 17 of 28

Last updated: 1/30/2016
Double dashes (--) appear in the table when the number of students is ten or less, either because the number of students in this category is too small for stat ist icalaccuracy or to protect student privacy.
Note: The number of students tested includes students that did not receive a score; however the number of students tested is not the number that was used tocalculate the achievement level percentages. The achievement level percentages are calculated using students w ith scores.
* Level 1 = Standard not met Level 2 = Standard nearly met Level 3 = Standard met Level 4 = Standard exceeded
Mathematics - Grade 7Mathematics - Grade 7
Student GroupTotal
EnrollmentNumberTested
PercentTested
PercentAchievement
Level 1*
PercentAchievement
Level 2*
PercentAchievement
Level 3*
PercentAchievement
Level 4*
All Students 71 69 97.2% 28.0% 29.0% 33.0% 9.0%
Male 42 42 100.0% 31.0% 29.0% 33.0% 5.0%
Female 29 27 93.1% 22.0% 30.0% 33.0% 15.0%
Black or African American 1 1 100.0% -- -- -- --
American Indian or Alaska Nat ive 0 0 -- -- -- -- --
Asian 0 0 -- -- -- -- --
Filipino 0 0 -- -- -- -- --
Hispanic or Lat ino 68 68 100.0% 26.0% 29.0% 34.0% 9.0%
Native Hawaiian or Pacific Islander 0 0 -- -- -- -- --
White 0 0 -- -- -- -- --
Two or More Races 0 0 -- -- -- -- --
Socioeconomically Disadvantaged 65 65 100.0% 25.0% 31.0% 34.0% 9.0%
English Learners 18 18 100.0% 67.0% 17.0% 11.0% 0.0%
Students w ith Disabilit ies 8 8 100.0% -- -- -- --
Students Receiving MigrantEducat ion Services
0 0 -- -- -- -- --
Foster Youth -- -- -- -- -- -- --
2014-15 SARC - Endeavor College Preparatory Charter
Page 18 of 28

Last updated: 1/30/2016
Double dashes (--) appear in the table when the number of students is ten or less, either because the number of students in this category is too small for stat ist icalaccuracy or to protect student privacy.
Note: The number of students tested includes students that did not receive a score; however the number of students tested is not the number that was used tocalculate the achievement level percentages. The achievement level percentages are calculated using students w ith scores.
* Level 1 = Standard not met Level 2 = Standard nearly met Level 3 = Standard met Level 4 = Standard exceeded
Mathematics - Grade 8Mathematics - Grade 8
Student GroupTotal
EnrollmentNumberTested
PercentTested
PercentAchievement
Level 1*
PercentAchievement
Level 2*
PercentAchievement
Level 3*
PercentAchievement
Level 4*
All Students 63 60 95.2% 22.0% 47.0% 17.0% 15.0%
Male 31 30 96.8% 23.0% 50.0% 10.0% 17.0%
Female 32 30 93.8% 20.0% 43.0% 23.0% 13.0%
Black or African American 0 0 -- -- -- -- --
American Indian or Alaska Nat ive 0 0 -- -- -- -- --
Asian 0 0 -- -- -- -- --
Filipino 2 2 100.0% -- -- -- --
Hispanic or Lat ino 57 56 98.2% 23.0% 48.0% 16.0% 13.0%
Native Hawaiian or Pacific Islander 0 0 -- -- -- -- --
White 1 1 100.0% -- -- -- --
Two or More Races 1 1 100.0% -- -- -- --
Socioeconomically Disadvantaged 55 54 98.2% 22.0% 50.0% 15.0% 13.0%
English Learners 7 7 100.0% -- -- -- --
Students w ith Disabilit ies 11 11 100.0% 45.0% 36.0% 9.0% 9.0%
Students Receiving MigrantEducat ion Services
0 0 -- -- -- -- --
Foster Youth -- -- -- -- -- -- --
2014-15 SARC - Endeavor College Preparatory Charter
Page 19 of 28
Last updated: 1/30/2016
Last updated: 1/30/2016
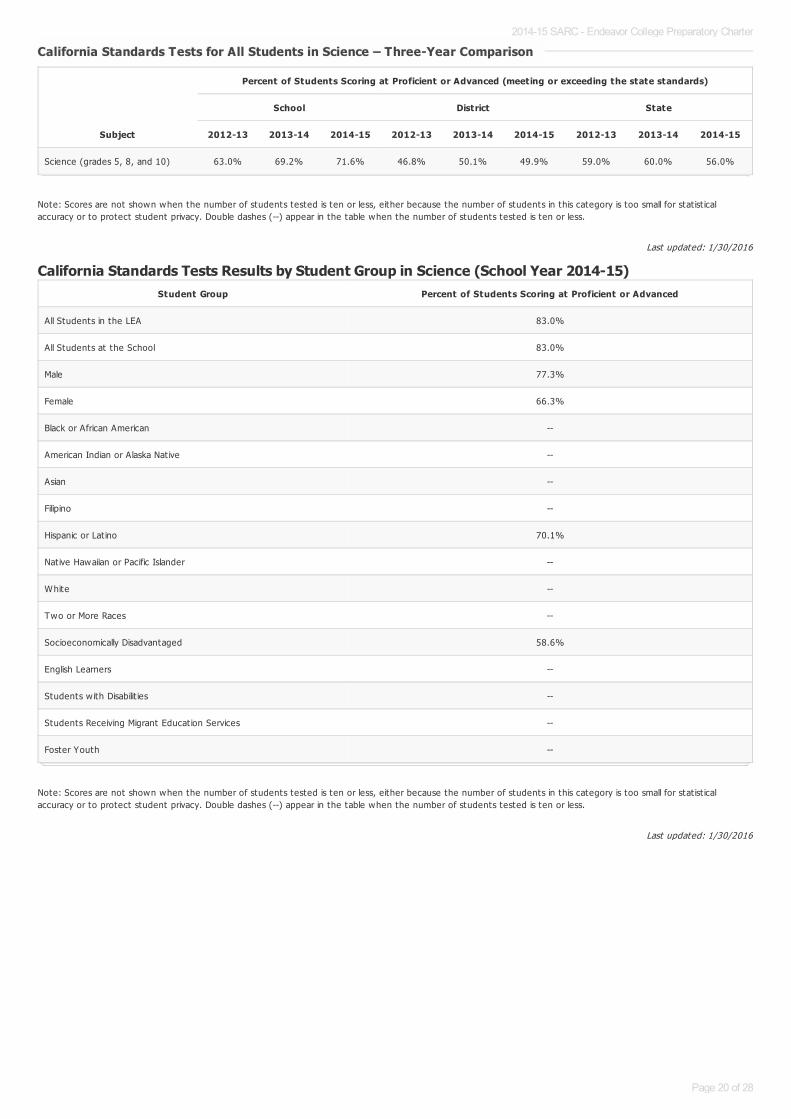
Note: Scores are not shown when the number of students tested is ten or less, either because the number of students in this category is too small for stat ist icalaccuracy or to protect student privacy. Double dashes (--) appear in the table when the number of students tested is ten or less.
California Standards Tests Results by Student Group in Science (School Year 2014-15)
Note: Scores are not shown when the number of students tested is ten or less, either because the number of students in this category is too small for stat ist icalaccuracy or to protect student privacy. Double dashes (--) appear in the table when the number of students tested is ten or less.
California Standards Tests for All Students in Science – Three-Year ComparisonCalifornia Standards Tests for All Students in Science – Three-Year Comparison
Subject
Percent of Students Scoring at Proficient or Advanced (meeting or exceeding the state standards)
School District State
2012-13 2013-14 2014-15 2012-13 2013-14 2014-15 2012-13 2013-14 2014-15
Science (grades 5, 8, and 10) 63.0% 69.2% 71.6% 46.8% 50.1% 49.9% 59.0% 60.0% 56.0%
Student Group Percent of Students Scoring at Proficient or Advanced
All Students in the LEA 83.0%
All Students at the School 83.0%
Male 77.3%
Female 66.3%
Black or African American --
American Indian or Alaska Nat ive --
Asian --
Filipino --
Hispanic or Lat ino 70.1%
Native Hawaiian or Pacific Islander --
White --
Two or More Races --
Socioeconomically Disadvantaged 58.6%
English Learners --
Students w ith Disabilit ies --
Students Receiving Migrant Educat ion Services --
Foster Youth --
2014-15 SARC - Endeavor College Preparatory Charter
Page 20 of 28
Last updated: 1/20/2016
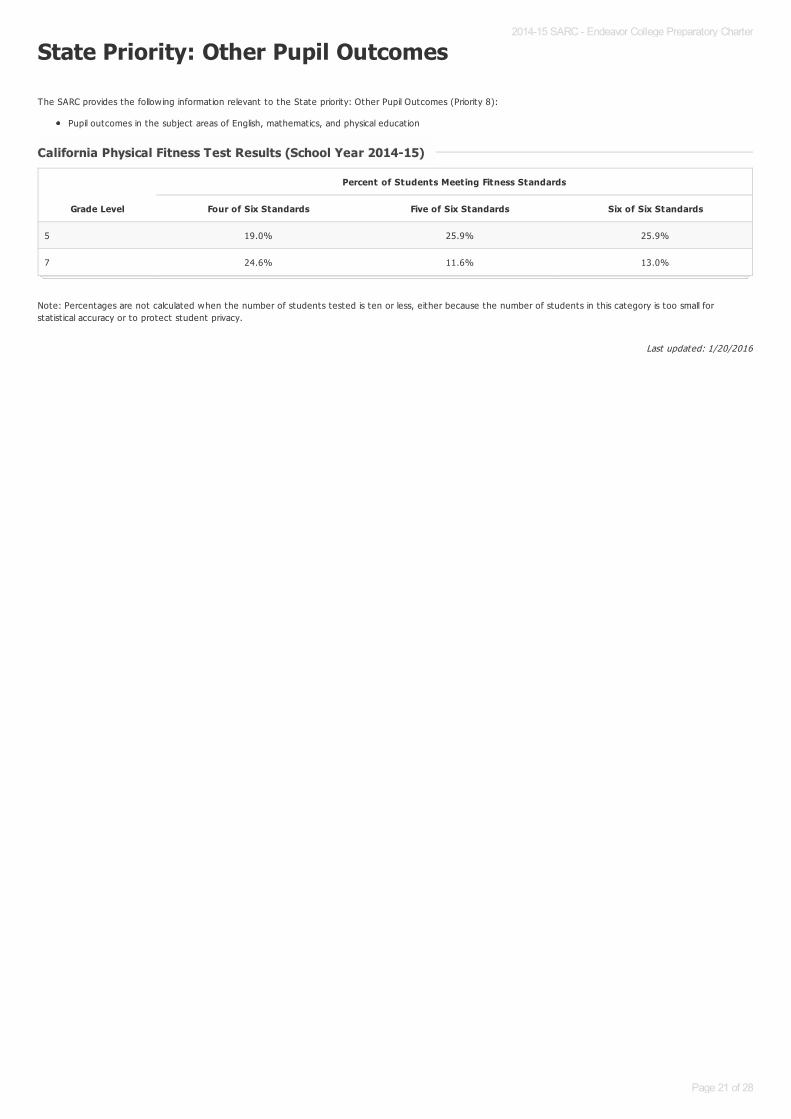
State Priority: Other Pupil Outcomes
The SARC provides the follow ing information relevant to the State priority: Other Pupil Outcomes (Priority 8):
Pupil outcomes in the subject areas of English, mathematics, and physical educat ion
Note: Percentages are not calculated when the number of students tested is ten or less, either because the number of students in this category is too small forstat ist ical accuracy or to protect student privacy.
California Physical Fitness Test Results (School Year 2014-15)California Physical Fitness Test Results (School Year 2014-15)
Grade Level
Percent of Students Meeting Fitness Standards
Four of Six Standards Five of Six Standards Six of Six Standards
5 19.0% 25.9% 25.9%
7 24.6% 11.6% 13.0%
2014-15 SARC - Endeavor College Preparatory Charter
Page 21 of 28
Last updated: 1/20/2016
C. Engagement
State Priority: Parental Involvement
The SARC provides the follow ing information relevant to the State priority: Parental Involvement (Priority 3):
Efforts the school district makes to seek parent input in making decisions for the school district and each schoolsite
State Priority: Pupil Engagement
The SARC provides the follow ing information relevant to the State priority: Pupil Engagement (Priority 5):
High school dropout rates; andHigh school graduat ion rates
Opportunities for Parental Involvement - Most Recent YearOpportunities for Parental Involvement - Most Recent Year
Endeavor College Prep makes several efforts to communicate w ith families and engage them in our on-going school improvement:
Teachers communicate w ith their students’ families on a daily basis through a formal agenda and behavior report to keep them up-to-date on their child’sperformance. Families are invited to responded, either via writ ing a response on the agenda, or calling the teacher direct ly. All of our teachers are issued a schoolphone number and these numbers are shared w ith all families so that parents and/or students can get assistance from our team after school hours.
We send home a letter to all families every Friday w ith announcements, updates, volunteer opportunit ies, and upcoming events.
All families are expected to be act ive part icipants in each trimester’s Family Report Card Conferences. At these meetings, the student, family, and teachers worktogether to create an Act ion Plan to increase the student ’s success in the coming trimester.
About once a month we hold morning “Cafecitos” where families are invited to join us in an informal sett ing to talk w ith the school and campus leaders, learnmore about our school, see the teachers and students working in their classrooms, and share concerns and suggest ions.
Also about once a month we host evening Family Nights that bring our families, students, and teachers together. Topics include Back-to-School Night, FamilyReading Night, Family Math Night, Family Game Night, Family Appreciat ion Night, High School Fairs, etc. These nights engage families in hands-on ways to supporttheir children’s development. We also occasionally host family social events like a hike on the weekend and our end-of-year barbecue.
Finally, parents/guardians looking to be even more involved at our school can become regular volunteers and help us on a day-to-day basis, or may also join ourSchool Site Council, which meets monthly to review, discuss, and help us improve key school decisions and documents.
2014-15 SARC - Endeavor College Preparatory Charter
Page 22 of 28
Last updated: 1/30/2016
Last updated: 1/30/2016
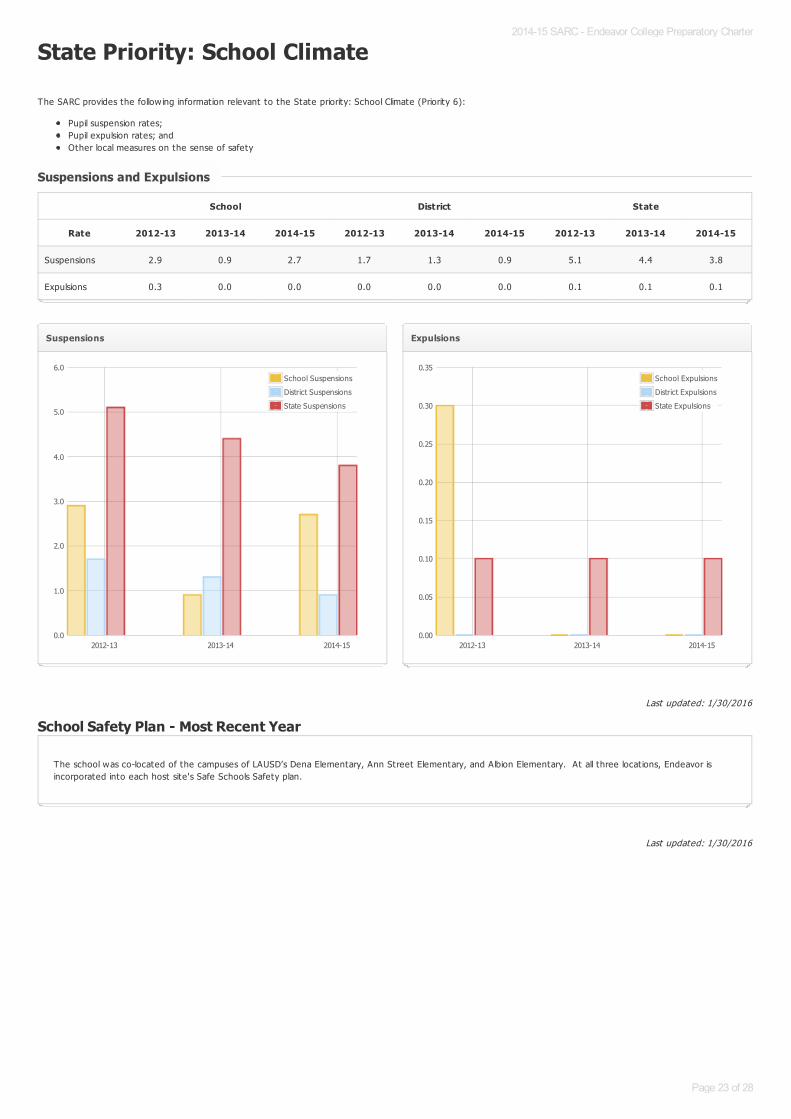
State Priority: School Climate
The SARC provides the follow ing information relevant to the State priority: School Climate (Priority 6):
Pupil suspension rates;Pupil expulsion rates; andOther local measures on the sense of safety
School Safety Plan - Most Recent Year
Suspensions and ExpulsionsSuspensions and Expulsions
School District State
Rate 2012-13 2013-14 2014-15 2012-13 2013-14 2014-15 2012-13 2013-14 2014-15
Suspensions 2.9 0.9 2.7 1.7 1.3 0.9 5.1 4.4 3.8
Expulsions 0.3 0.0 0.0 0.0 0.0 0.0 0.1 0.1 0.1
Suspensions
2012-13 2013-14 2014-150.0
1.0
2.0
3.0
4.0
5.0
6.0School Suspensions
District Suspensions
State Suspensions
Expulsions
2012-13 2013-14 2014-150.00
0.05
0.10
0.15
0.20
0.25
0.30
0.35School Expulsions
District Expulsions
State Expulsions
The school was co-located of the campuses of LAUSD’s Dena Elementary, Ann Street Elementary, and Albion Elementary. At all three locat ions, Endeavor isincorporated into each host site's Safe Schools Safety plan.
2014-15 SARC - Endeavor College Preparatory Charter
Page 23 of 28
Last updated: 1/20/2016
Last updated: 1/30/2016
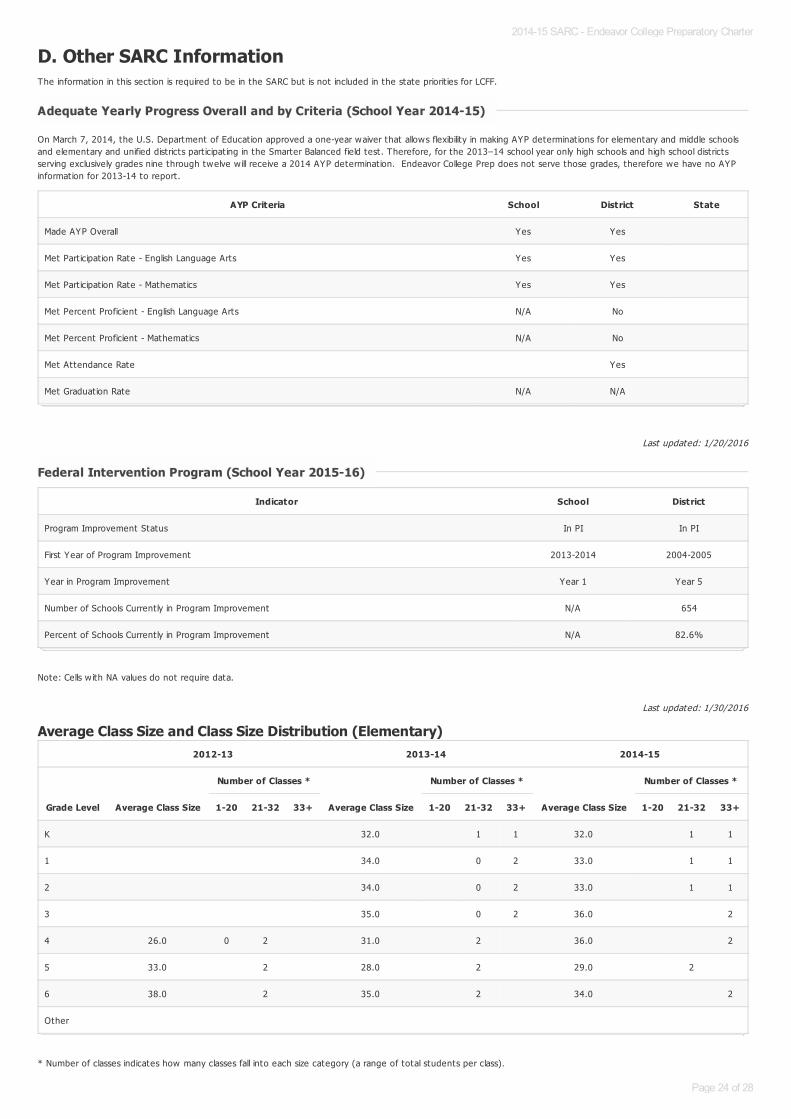
D. Other SARC InformationThe information in this sect ion is required to be in the SARC but is not included in the state priorit ies for LCFF.
On March 7, 2014, the U.S. Department of Educat ion approved a one-year waiver that allows flexibility in making AYP determinat ions for elementary and middle schoolsand elementary and unified districts part icipat ing in the Smarter Balanced field test. Therefore, for the 2013–14 school year only high schools and high school districtsserving exclusively grades nine through twelve w ill receive a 2014 AYP determinat ion. Endeavor College Prep does not serve those grades, therefore we have no AYPinformation for 2013-14 to report.
Note: Cells w ith NA values do not require data.
Average Class Size and Class Size Distribution (Elementary)
* Number of classes indicates how many classes fall into each size category (a range of total students per class).
Adequate Yearly Progress Overall and by Criteria (School Year 2014-15)Adequate Yearly Progress Overall and by Criteria (School Year 2014-15)
AYP Criteria School District State
Made AYP Overall Yes Yes
Met Part icipat ion Rate - English Language Arts Yes Yes
Met Part icipat ion Rate - Mathematics Yes Yes
Met Percent Proficient - English Language Arts N/A No
Met Percent Proficient - Mathematics N/A No
Met Attendance Rate Yes
Met Graduat ion Rate N/A N/A
Federal Intervention Program (School Year 2015-16)Federal Intervention Program (School Year 2015-16)
Indicator School District
Program Improvement Status In PI In PI
First Year of Program Improvement 2013-2014 2004-2005
Year in Program Improvement Year 1 Year 5
Number of Schools Current ly in Program Improvement N/A 654
Percent of Schools Current ly in Program Improvement N/A 82.6%
2012-13 2013-14 2014-15
Grade Level Average Class Size
Number of Classes *
Average Class Size
Number of Classes *
Average Class Size
Number of Classes *
1-20 21-32 33+ 1-20 21-32 33+ 1-20 21-32 33+
K 32.0 1 1 32.0 1 1
1 34.0 0 2 33.0 1 1
2 34.0 0 2 33.0 1 1
3 35.0 0 2 36.0 2
4 26.0 0 2 31.0 2 36.0 2
5 33.0 2 28.0 2 29.0 2
6 38.0 2 35.0 2 34.0 2
Other
2014-15 SARC - Endeavor College Preparatory Charter
Page 24 of 28

Last updated: 1/30/2016
2014-15 SARC - Endeavor College Preparatory Charter
Page 25 of 28
Last updated: 1/20/2016
Last updated: 1/20/2016
Last updated: 1/20/2016
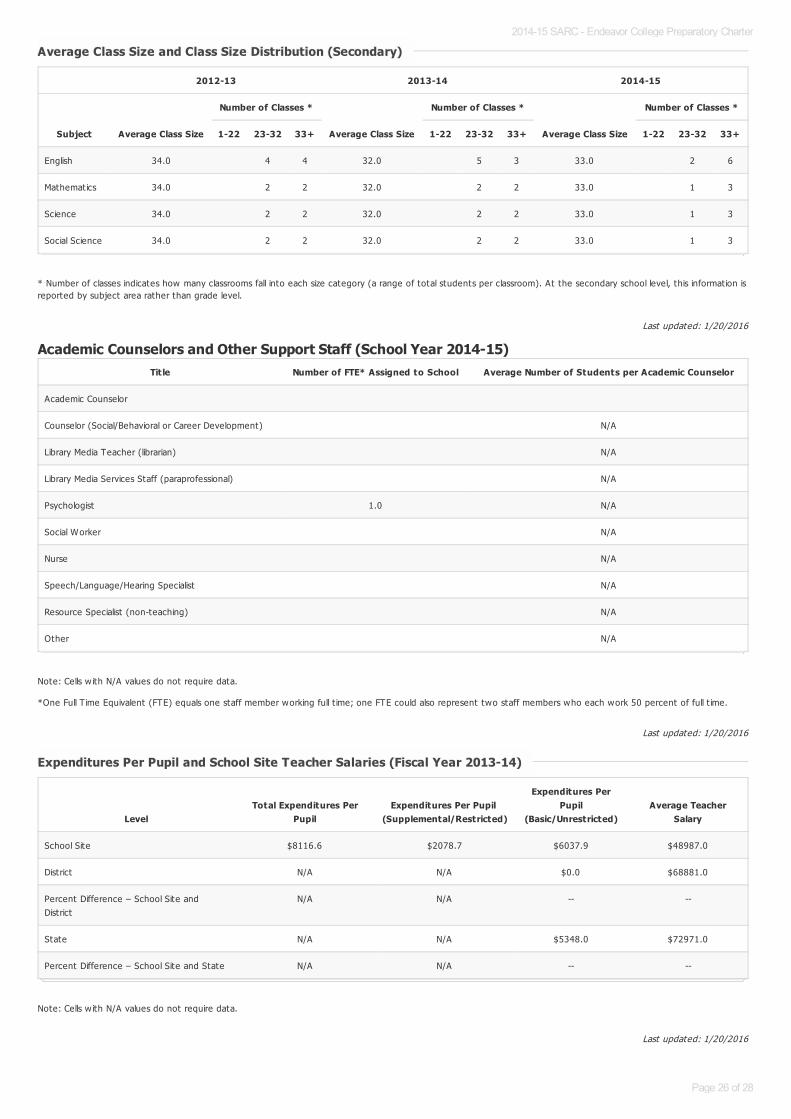
* Number of classes indicates how many classrooms fall into each size category (a range of total students per classroom). At the secondary school level, this information isreported by subject area rather than grade level.
Academic Counselors and Other Support Staff (School Year 2014-15)
Note: Cells w ith N/A values do not require data.
*One Full T ime Equivalent (FTE) equals one staff member working full t ime; one FTE could also represent two staff members who each work 50 percent of full t ime.
Note: Cells w ith N/A values do not require data.
Average Class Size and Class Size Distribution (Secondary)Average Class Size and Class Size Distribution (Secondary)
2012-13 2013-14 2014-15
Subject Average Class Size
Number of Classes *
Average Class Size
Number of Classes *
Average Class Size
Number of Classes *
1-22 23-32 33+ 1-22 23-32 33+ 1-22 23-32 33+
English 34.0 4 4 32.0 5 3 33.0 2 6
Mathematics 34.0 2 2 32.0 2 2 33.0 1 3
Science 34.0 2 2 32.0 2 2 33.0 1 3
Social Science 34.0 2 2 32.0 2 2 33.0 1 3
Title Number of FTE* Assigned to School Average Number of Students per Academic Counselor
Academic Counselor
Counselor (Social/Behavioral or Career Development) N/A
Library Media Teacher (librarian) N/A
Library Media Services Staff (paraprofessional) N/A
Psychologist 1.0 N/A
Social Worker N/A
Nurse N/A
Speech/Language/Hearing Specialist N/A
Resource Specialist (non-teaching) N/A
Other N/A
Expenditures Per Pupil and School Site Teacher Salaries (Fiscal Year 2013-14)Expenditures Per Pupil and School Site Teacher Salaries (Fiscal Year 2013-14)
LevelTotal Expenditures Per
PupilExpenditures Per Pupil
(Supplemental/Restricted)
Expenditures PerPupil
(Basic/Unrestricted)Average Teacher
Salary
School Site $8116.6 $2078.7 $6037.9 $48987.0
District N/A N/A $0.0 $68881.0
Percent Difference – School Site andDistrict
N/A N/A -- --
State N/A N/A $5348.0 $72971.0
Percent Difference – School Site and State N/A N/A -- --
2014-15 SARC - Endeavor College Preparatory Charter
Page 26 of 28
Last updated: 1/20/2016
Last updated: 1/20/2016
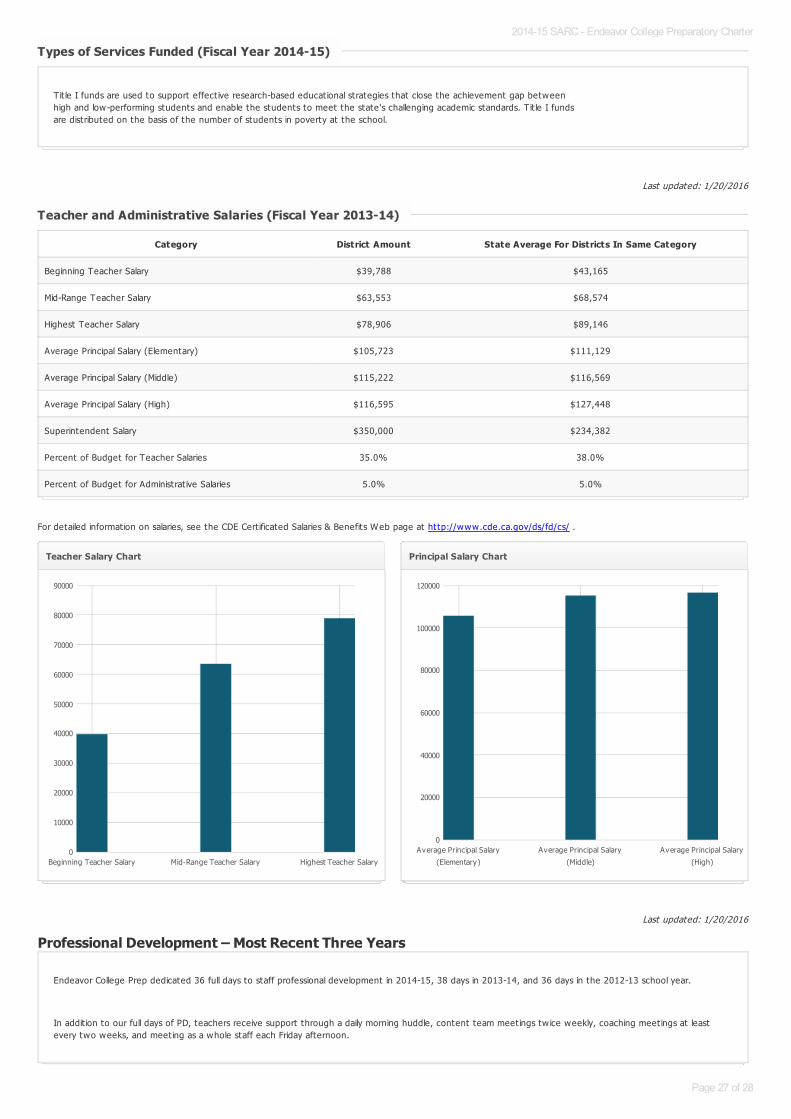
For detailed information on salaries, see the CDE Cert ificated Salaries & Benefits Web page at http://www.cde.ca.gov/ds/fd/cs/ .
Professional Development – Most Recent Three Years
Types of Services Funded (Fiscal Year 2014-15)Types of Services Funded (Fiscal Year 2014-15)
Tit le I funds are used to support effect ive research-based educat ional strategies that close the achievement gap between high and low-performing students and enable the students to meet the state's challenging academic standards. T it le I funds are distributed on the basis of the number of students in poverty at the school.
Teacher and Administrative Salaries (Fiscal Year 2013-14)Teacher and Administrative Salaries (Fiscal Year 2013-14)
Category District Amount State Average For Districts In Same Category
Beginning Teacher Salary $39,788 $43,165
Mid-Range Teacher Salary $63,553 $68,574
Highest Teacher Salary $78,906 $89,146
Average Principal Salary (Elementary) $105,723 $111,129
Average Principal Salary (Middle) $115,222 $116,569
Average Principal Salary (High) $116,595 $127,448
Superintendent Salary $350,000 $234,382
Percent of Budget for Teacher Salaries 35.0% 38.0%
Percent of Budget for Administrat ive Salaries 5.0% 5.0%
Teacher Salary Chart
Beginning Teacher Salary Mid-Range Teacher Salary Highest Teacher Salary0
10000
20000
30000
40000
50000
60000
70000
80000
90000
Principal Salary Chart
Average Principal Salary
(Elementary)
Average Principal Salary
(Middle)
Average Principal Salary
(High)
0
20000
40000
60000
80000
100000
120000
Endeavor College Prep dedicated 36 full days to staff professional development in 2014-15, 38 days in 2013-14, and 36 days in the 2012-13 school year.
In addit ion to our full days of PD, teachers receive support through a daily morning huddle, content team meetings tw ice weekly, coaching meetings at leastevery two weeks, and meeting as a whole staff each Friday afternoon.
2014-15 SARC - Endeavor College Preparatory Charter
Page 27 of 28

Last updated: 1/30/2016
2014-15 SARC - Endeavor College Preparatory Charter
Page 28 of 28


![Course Selection [Grade 11] - Crestwood Preparatory College](https://static.fdocuments.in/doc/165x107/6251e0fb3b45b96f755a9526/course-selection-grade-11-crestwood-preparatory-college.jpg)