SARASOTA BAY Numeric Nutrient Criteria · and the results of each analysis, and the recommended TP...
31
SARASOTA BAY Numeric Nutrient Criteria: Task 1 - TN and TP Concentration and Loading Based Criteria Letter Memorandum Prepared for: Sarasota Bay Estuary Program Prepared by: Janicki Environmental, Inc.
Transcript of SARASOTA BAY Numeric Nutrient Criteria · and the results of each analysis, and the recommended TP...
SARASOTA BAY
Numeric Nutrient Criteria:
Task 1 - TN and TP Concentration
and Loading Based Criteria
Letter Memorandum
Prepared for:
Sarasota Bay Estuary Program
Prepared by:
Janicki Environmental, Inc.

January 2011 2
17March 2011
17March 2011 3
FOREWORD
This letter memo was produced in partial fulfillment of SBEP Contract 2011SBEP04 -
Development of Numeric Nutrient Criteria for Sarasota Bay, Task 1.
January 2011 4
ACKNOWLEDGEMENTS
We wish to thank the partners of the Sarasota Bay Estuary Program (SBEP) for the numerous
conversations providing direction and insight into concerns regarding numeric nutrient criteria
establishment and appropriate methodology for developing the proposed criteria. We would
particularly like to thank the following individuals who serve on the water quality subcommittee
of the Technical Advisory Committee: Mark Alderson, Dr. Jay Leverone, Jack Merriam, Rob
Brown, Lizanne Garcia, Kris Kaufmann, Veronica Craw, John Ryan, Gary Serviss, Amber Whittle,
Pete Wenner, Charles Kovach, and Jon Perry.
January 2011 5
EXECUTIVE SUMMARY
The Sarasota Bay Estuary Program (SBEP) has recommended numeric nutrient criteria for
Sarasota Bay as segment-specific mean annual total nitrogen concentrations (Janicki
Environmental, 2010). EPA has noted its intention to develop numeric criteria for estuarine TP
concentrations. SBEP stakeholders have also requested that loading-based TN and TP criteria
be developed. This document provides segment-specific TP criteria as well as TN and TP criteria
expressed as loads.
Establishment of numeric nutrient criteria is dependent on an understanding of the limiting
nutrient within the water body of concern. For Sarasota Bay, extensive data exist for evaluation
of which nutrient, nitrogen or phosphorus, is limiting. Ambient water quality data strongly
indicate that four of the SBEP segments are nitrogen limited while a fifth (Palma Sola Bay)
displays some degree of co-limitation.
The following conclusions can be drawn from the analyses and results presented herein:
Nutrient Concentrations
The relationships between segment TN concentrations and segment TP concentrations
are not evident within any bay segment, and thus cannot be used to translate
established TN concentration criteria to TP concentration criteria.
The relationships between chlorophyll a concentrations and segment TP concentrations
are not sufficient to derive TP concentration criteria based on established chlorophyll a
thresholds.
The Reference Period approach provides an internally consistent method for establishing
concentration-based TP criteria. The following are the proposed numeric TP
concentration criteria for the respective SBEP bay segments:
- Palma Sola Bay 0.26 mg/L
- Sarasota Bay 0.19 mg/L
- Roberts Bay 0.23 mg/L
- Little Sarasota Bay 0.21 mg/L
- Blackburn Bay 0.21 mg/L
Nutrient Loadings
On a monthly time scale, the relationships between either TN or TP loadings and
chlorophyll a concentrations do not explain a significant proportion of the variability in
January 2011 6
the chlorophyll a concentrations to support development of loading-based numeric
nutrient criteria based on these relationships in any bay segment.
The relationships between TN and TP loadings and in-bay TN and TP concentrations do
not provide a defensible approach for establishing loading-based numeric nutrient
criteria in any bay segment.
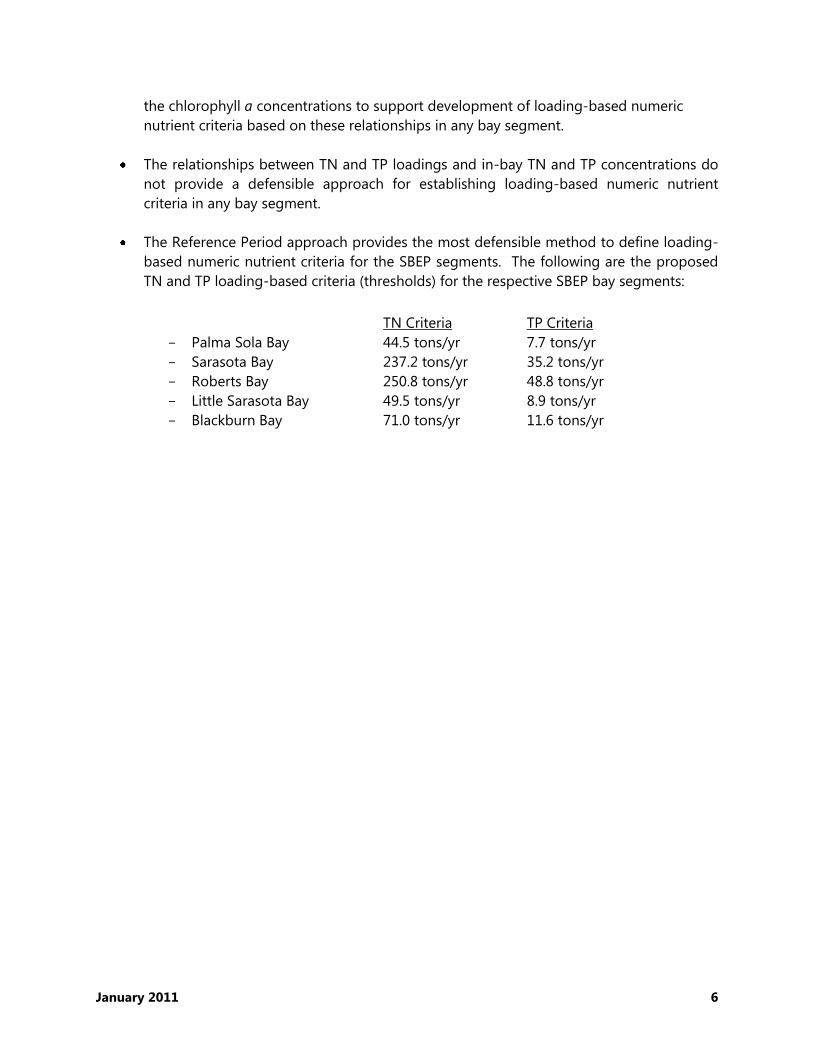
The Reference Period approach provides the most defensible method to define loading-
based numeric nutrient criteria for the SBEP segments. The following are the proposed
TN and TP loading-based criteria (thresholds) for the respective SBEP bay segments:
TN Criteria TP Criteria
- Palma Sola Bay 44.5 tons/yr 7.7 tons/yr
- Sarasota Bay 237.2 tons/yr 35.2 tons/yr
- Roberts Bay 250.8 tons/yr 48.8 tons/yr
- Little Sarasota Bay 49.5 tons/yr 8.9 tons/yr
- Blackburn Bay 71.0 tons/yr 11.6 tons/yr
January 2011 7
1.0 Introduction and Objective
The Sarasota Bay Estuary Program (SBEP) has developed recommended numeric nutrient criteria
for Sarasota Bay (Janicki Environmental, 2010a). The criteria are segment-specific (Figure 1)
and are expressed as mean annual total nitrogen (TN) concentrations. The segment-specific TN
concentrations are those commensurate with the segment-specific chlorophyll a thresholds, also
described in Janicki Environmental (2010b).
The objective of this task is to develop segment-specific TP concentration criteria, and segment-
specific TN and TP loading criteria to be recommended as numeric nutrient criteria by the SBEP.
This will provide the U.S. Environmental Protection Agency (EPA) both concentration and
loading criteria for TN and TP, as are currently being developed for Tampa Bay and Charlotte
Harbor in addition to Sarasota Bay. This is in keeping with recognition of the importance of
maintaining consistency with existing management goals, and specifically with the recent
chlorophyll a thresholds developed for Sarasota Bay.
The following provides a discussion of nutrient limitation, description of the analyses completed
and the results of each analysis, and the recommended TP numeric nutrient criteria, expressed
as concentrations, and TN and TP loading criteria, for each of the five bay segments.
2.0 Nutrient Limitation
The establishment of numeric nutrient criteria depends upon knowledge of the nutrient most
likely limiting in the waterbodies of concern. Three major factors control whether nitrogen or
phosphorus is more likely to be limiting (National Research Council, 2000):
the N:P ratio in external nutrient inputs;
the preferential loss from the photic zone of nitrogen or phosphorus due to
biogeochemical processes such as denitrification, sedimentation, or absorption of
phosphorus; and
the amount of nitrogen fixation.
Marine systems, including estuaries, are generally considered nitrogen limited (Thomas, 1970a,b;
Ryther and Dunstan, 1971; Boynton et al., 1982; Smith, 1984; Howarth, 1988, 2008; Howarth et
al., 1988a,b; Nixon et al., 1996; Howarth and Marino, 2006; Chapra, 1997; National Research
Council, 2000;), although there may be times and locations when phosphorus limitation may
occur (Conley, 2000; Conley et al., 2009; Malone et al., 1996).
January 2011 8
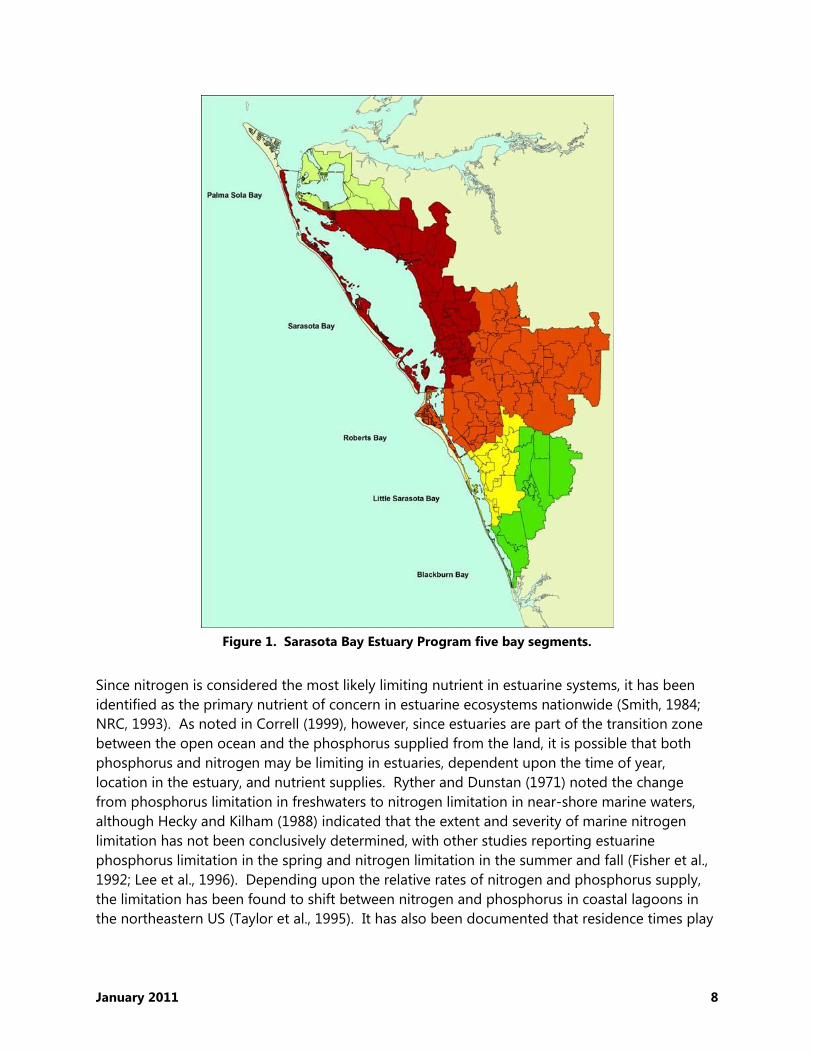
Figure 1. Sarasota Bay Estuary Program five bay segments.
Since nitrogen is considered the most likely limiting nutrient in estuarine systems, it has been
identified as the primary nutrient of concern in estuarine ecosystems nationwide (Smith, 1984;
NRC, 1993). As noted in Correll (1999), however, since estuaries are part of the transition zone
between the open ocean and the phosphorus supplied from the land, it is possible that both
phosphorus and nitrogen may be limiting in estuaries, dependent upon the time of year,
location in the estuary, and nutrient supplies. Ryther and Dunstan (1971) noted the change
from phosphorus limitation in freshwaters to nitrogen limitation in near-shore marine waters,
although Hecky and Kilham (1988) indicated that the extent and severity of marine nitrogen
limitation has not been conclusively determined, with other studies reporting estuarine
phosphorus limitation in the spring and nitrogen limitation in the summer and fall (Fisher et al.,
1992; Lee et al., 1996). Depending upon the relative rates of nitrogen and phosphorus supply,
the limitation has been found to shift between nitrogen and phosphorus in coastal lagoons in
the northeastern US (Taylor et al., 1995). It has also been documented that residence times play

January 2011 9
a significant role in determining the estuarine responses to nutrient loads ((Monson et al., 2002;
Hagy et al., 2000; Borsuck et al., 2004; Boynton and Kemp, 2008).
2.1 Methods to Determine Limitation
There are two general methods that have been used to define which nutrient is limiting in a
water body. They include:
a method that depends upon ambient water quality data collected over a wide range of
environmental conditions, and
a method that involves experimental manipulation of nutrient conditions, either in the
laboratory or in situ.
2.1.1 Ambient Water Quality Data Methods
This method depends upon a metric typically used to evaluate nutrient limitation: the nitrogen
to phosphorus ratio (N:P ratio). The N:P ratio indicative of balanced conditions is typically taken
to be 16:1 (molar), based on the work of Redfield (1934, 1958). This N:P ratio was based on the
elemental composition of algae, under both laboratory and natural conditions. When N:P ratios
are greater than 16:1 in a system, this is indicative of phosphorus limitation. However, there
may be considerable variation in this ratio within an algal culture, dependent upon cell division
status, light conditions, and precedent conditions (Correll, 1999; Correll and Tolbert, 1962; Terry
et al., 1985).
Molar ratios of N:P are easily determined from water quality monitoring data. In freshwater
systems, the N:P ratio is usually higher than 16:1, indicating that phosphorus is usually most
limiting to primary production in these ecosystems (Schindler, 1977; Elser et al., 2007). This
becomes evident by examining the concentrations of the forms of nitrogen and phosphorus that
are available for algal uptake. Little if any dissolved inorganic phosphorus (DIP) is generally
found in relatively productive freshwaters while measurable concentrations of dissolved
inorganic nitrogen (DIN) remain.
Most marine systems are nitrogen limited because there are relatively low concentrations of
dissolved inorganic nitrogen compared to dissolved phosphorus. Since Redfield’s observations
were published, research has shown that ratios from 10:1 to 20:1 for N:P are typically found in
estuaries (Parsons et al., 1984). Howarth (1988) observed that the correlation between nitrogen
and the primary production was better for estuaries that received nutrient concentrations with
smaller N:P ratios than the one studied by Redfield. Several studies have led to the conclusion
that estuaries receiving nutrient concentrations with high N:P ratios were limited by phosphorus
and only those with low ratios are limited by nitrogen (Boynton et al., 1982). Boynton et al.
(1982) and Howarth (1988) compiled data on the ratio of inorganic nitrogen to phosphorus in a
variety of estuaries. Of the 27 studied by Howarth, 22 had N:P ratios below the Redfield ratio
and may have been nitrogen limited. Because phytoplankton can assimilate some organic
January 2011 10
nutrient forms and all forms are relatively labile, it is useful to examine the ratio of total nutrient
concentrations (TN:TP).
Reductions of nutrient levels in a water body will usually result in reduction in algal growth.
Reducing phosphorus, however, will have no effect unless the reduction results in an N:P ratio
greater than 16:1. Phosphorus would then become the limiting nutrient. In contrast, a
reduction of nitrogen concentrations will result in a reduction of primary productivity when the
ratio is less than 16:1. There are exceptions to this general rule. Some coastal areas are
phosphorus limited due to strict phosphorus control measures or natural conditions and some
freshwaters are nitrogen limited due to natural sources of phosphorus.
2.1.2 Experimental Methods
Experimental manipulation of nutrient conditions, either in the lab or in situ, typically involves
nitrogen and phosphorus additions to either a test alga or a phytoplankton assemblage
singularly and in combination. The responses to the additions determine the limiting nutrient.
If growth is found only during nitrogen addition, nitrogen limitation is indicated. Conversely, if
growth is found only during phosphorus addition, phosphorus limitation is indicated.
In situ methods have included:
limnocorrals or bags in which nutrient additions are made and resultant growth
responses are measured (Shapiro, 1980; Lynch and Shapiro, 1981; Havens and DeCosta,
1986; Perez et al., 1994);
mesocosm studies in which water is collected and placed in separate containers or
enclosures for application of separate treatments over multiple day time scales (Oviatt et
al., 1986; Taylor et al., 1995); and
whole-lake studies performed on entire lakes or portions of lakes separated by curtains
(Schindler, 1974, 1975).
In Florida, as part of its TMDL process, the Florida Department of Environmental Protection
(FDEP) attempts to identify the limiting nutrient(s) in impaired waterbodies. The TMDL for a
specific waterbody specifies the maximum amount of the limiting nutrient that may enter the
waterbody, with this limitation being defined with the aim of improving water quality. If the N:P
ratio does not clearly suggest the limiting nutrient, TMDLs for both nitrogen and phosphorus
are typically defined. The primary method for determining the limiting nutrient employed by
the FDEP is use of existing water quality data to derive ambient N:P ratios, but more complicated
methods, including field tests and laboratory algal growth potential bioassays, have been
employed. Per FDEP guidelines, receiving waters with ratios less than 10:1 (molar) are
considered nitrogen limited, ratios of greater than 30:1 (molar) indicate phosphorus limitation,
and ratios of 10-30:1 (molar) indicate co-limitation (FDEP, 2002).
2.2 Confounding Factors
January 2011 11
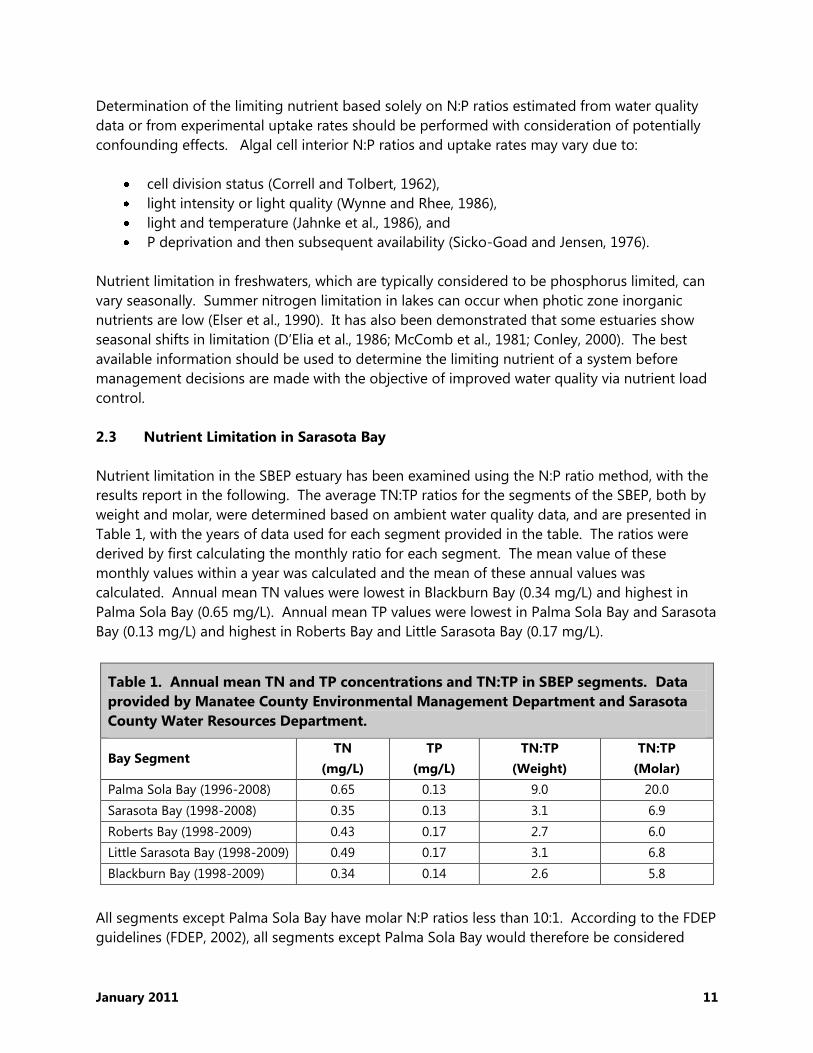
Determination of the limiting nutrient based solely on N:P ratios estimated from water quality
data or from experimental uptake rates should be performed with consideration of potentially
confounding effects. Algal cell interior N:P ratios and uptake rates may vary due to:
cell division status (Correll and Tolbert, 1962),
light intensity or light quality (Wynne and Rhee, 1986),
light and temperature (Jahnke et al., 1986), and
P deprivation and then subsequent availability (Sicko-Goad and Jensen, 1976).
Nutrient limitation in freshwaters, which are typically considered to be phosphorus limited, can
vary seasonally. Summer nitrogen limitation in lakes can occur when photic zone inorganic
nutrients are low (Elser et al., 1990). It has also been demonstrated that some estuaries show
seasonal shifts in limitation (D’Elia et al., 1986; McComb et al., 1981; Conley, 2000). The best
available information should be used to determine the limiting nutrient of a system before
management decisions are made with the objective of improved water quality via nutrient load
control.
2.3 Nutrient Limitation in Sarasota Bay
Nutrient limitation in the SBEP estuary has been examined using the N:P ratio method, with the
results report in the following. The average TN:TP ratios for the segments of the SBEP, both by
weight and molar, were determined based on ambient water quality data, and are presented in
Table 1, with the years of data used for each segment provided in the table. The ratios were
derived by first calculating the monthly ratio for each segment. The mean value of these
monthly values within a year was calculated and the mean of these annual values was
calculated. Annual mean TN values were lowest in Blackburn Bay (0.34 mg/L) and highest in
Palma Sola Bay (0.65 mg/L). Annual mean TP values were lowest in Palma Sola Bay and Sarasota
Bay (0.13 mg/L) and highest in Roberts Bay and Little Sarasota Bay (0.17 mg/L).
Table 1. Annual mean TN and TP concentrations and TN:TP in SBEP segments. Data
provided by Manatee County Environmental Management Department and Sarasota
County Water Resources Department.
Bay Segment TN
(mg/L)
TP
(mg/L)
TN:TP
(Weight)
TN:TP
(Molar)
Palma Sola Bay (1996-2008) 0.65 0.13 9.0 20.0
Sarasota Bay (1998-2008) 0.35 0.13 3.1 6.9
Roberts Bay (1998-2009) 0.43 0.17 2.7 6.0
Little Sarasota Bay (1998-2009) 0.49 0.17 3.1 6.8
Blackburn Bay (1998-2009) 0.34 0.14 2.6 5.8
All segments except Palma Sola Bay have molar N:P ratios less than 10:1. According to the FDEP
guidelines (FDEP, 2002), all segments except Palma Sola Bay would therefore be considered
January 2011 12
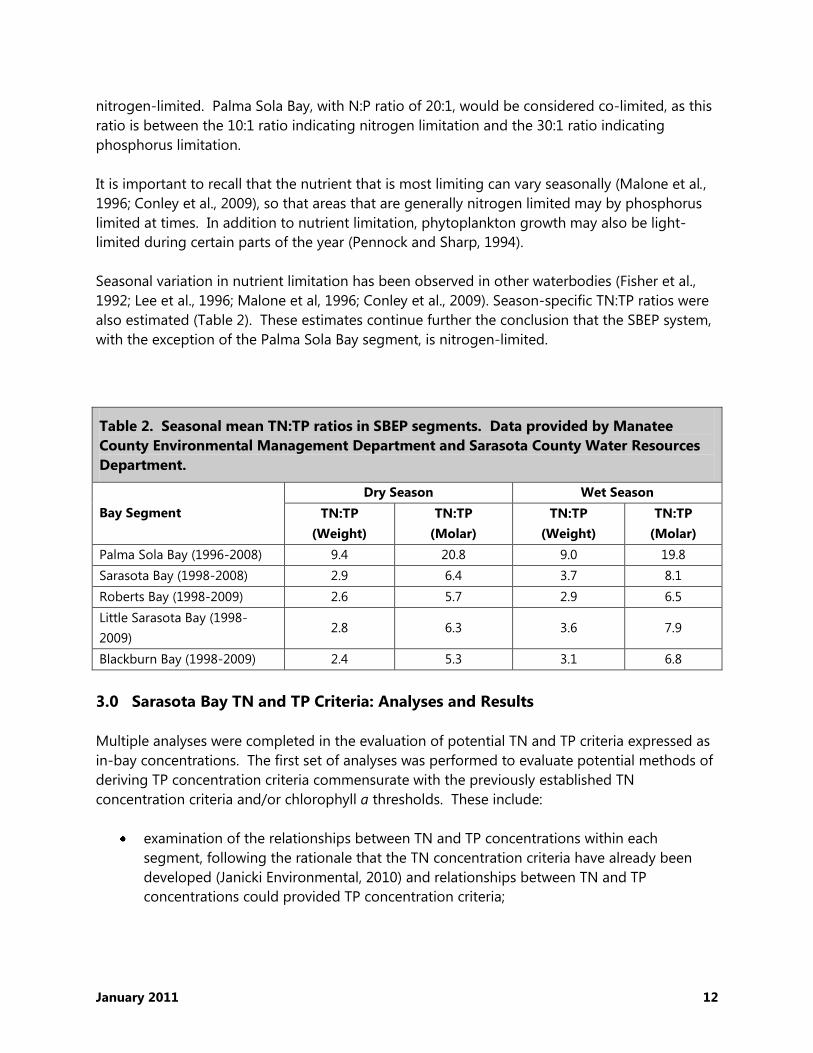
nitrogen-limited. Palma Sola Bay, with N:P ratio of 20:1, would be considered co-limited, as this
ratio is between the 10:1 ratio indicating nitrogen limitation and the 30:1 ratio indicating
phosphorus limitation.
It is important to recall that the nutrient that is most limiting can vary seasonally (Malone et al.,
1996; Conley et al., 2009), so that areas that are generally nitrogen limited may by phosphorus
limited at times. In addition to nutrient limitation, phytoplankton growth may also be light-
limited during certain parts of the year (Pennock and Sharp, 1994).
Seasonal variation in nutrient limitation has been observed in other waterbodies (Fisher et al.,
1992; Lee et al., 1996; Malone et al, 1996; Conley et al., 2009). Season-specific TN:TP ratios were
also estimated (Table 2). These estimates continue further the conclusion that the SBEP system,
with the exception of the Palma Sola Bay segment, is nitrogen-limited.
Table 2. Seasonal mean TN:TP ratios in SBEP segments. Data provided by Manatee
County Environmental Management Department and Sarasota County Water Resources
Department.
Bay Segment
Dry Season Wet Season
TN:TP
(Weight)
TN:TP
(Molar)
TN:TP
(Weight)
TN:TP
(Molar)
Palma Sola Bay (1996-2008) 9.4 20.8 9.0 19.8
Sarasota Bay (1998-2008) 2.9 6.4 3.7 8.1
Roberts Bay (1998-2009) 2.6 5.7 2.9 6.5
Little Sarasota Bay (1998-
2009) 2.8 6.3 3.6 7.9
Blackburn Bay (1998-2009) 2.4 5.3 3.1 6.8
3.0 Sarasota Bay TN and TP Criteria: Analyses and Results
Multiple analyses were completed in the evaluation of potential TN and TP criteria expressed as
in-bay concentrations. The first set of analyses was performed to evaluate potential methods of
deriving TP concentration criteria commensurate with the previously established TN
concentration criteria and/or chlorophyll a thresholds. These include:
examination of the relationships between TN and TP concentrations within each
segment, following the rationale that the TN concentration criteria have already been
developed (Janicki Environmental, 2010) and relationships between TN and TP
concentrations could provided TP concentration criteria;
January 2011 13
examination of relationships between monthly TP concentrations with chlorophyll a
concentrations, with the potential to derive TP concentration criteria based on
chlorophyll a thresholds (Janicki Environmental, 2010); and
application of a reference period approach to establishing TP concentration criteria.
Following selection of the most appropriate method for developing TP concentration criteria,
additional analyses were completed in the evaluation of potential TN and TP criteria expressed
as loadings to the bay segments, as requested by the SBEP. These include:
examination of the relationships between chlorophyll a concentrations within each
segment and TN and TP loadings to the segment, following the rationale that the
chlorophyll a thresholds have already been developed (Janicki Environmental, 2010) and
relationships between chlorophyll a and TN and TP loadings could provide TN and TP
loading criteria;
examination of relationships between monthly TN and TP concentrations with TN and TP
loadings, respectively, with the potential to derive TP and TN loading criteria based on
the selected TP concentration criteria (from results of analyses above) and the previously
established TN concentration criteria (Janicki Environmental, 2010); and
application of a reference period approach to establishing TN and TP loading criteria.
The data used in these analyses are defined in Attachments 1-4. The following describes these
analyses and the results obtained.
3.1 Evaluation of Relationships Between In-bay TN and TP Concentrations
Since the current proposed TN criteria are expressed as concentrations (Janicki Environmental,
2010), the simplest method to propose TP criteria expressed as in-bay concentrations would be
based on the potential relationships between in-bay TN and TP concentrations within each
segment. If significant relationships are found between the TN concentrations and the TP
concentrations, then the TP concentration criteria can be derived based on the TN concentration
criteria already established.
Plots of monthly segment-specific TP concentrations as functions of TN concentrations were
inspected, with TN and TP concentrations as functions of TN and TP loads, respectively,
including various lag and cumulative load effects. Graphical results for each segment are
provided in Attachment 1. The graphical representations of the relationships were then used to
guide evaluation of relationships between TN and TP concentrations.
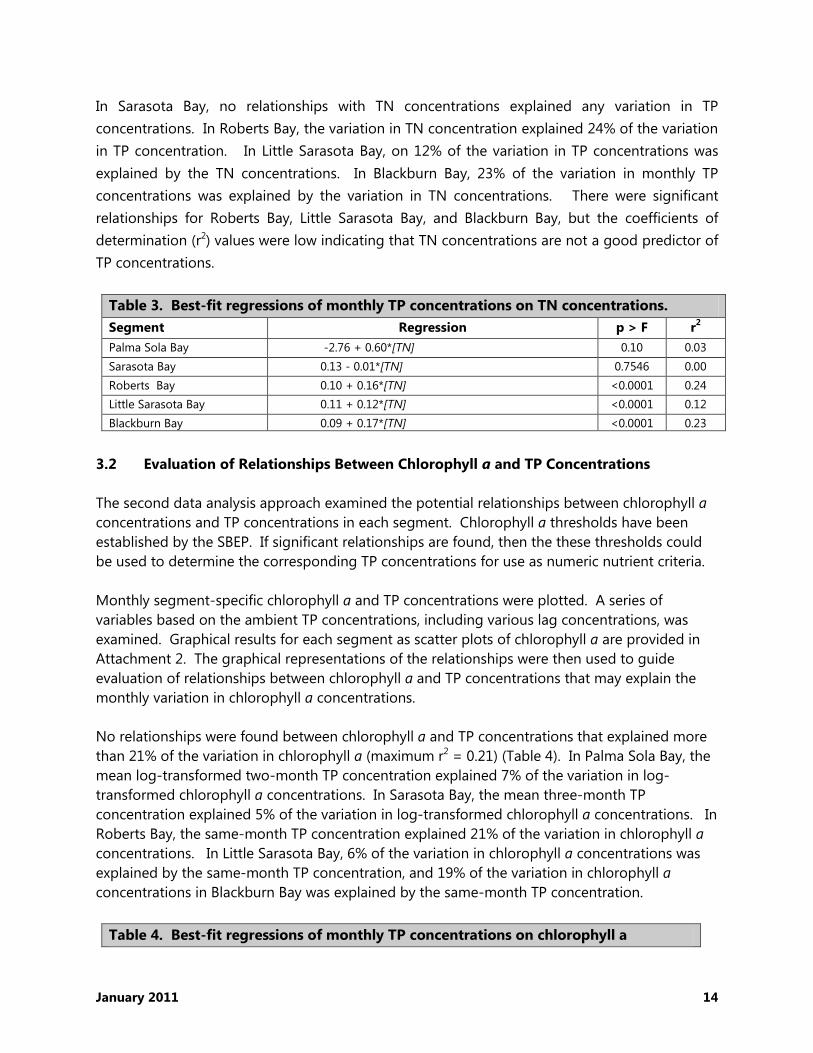
No relationships were found between TP concentrations and potential TN concentration that
explained more than 24% of the variation in TP concentrations (Table 3). In Palma Sola Bay, the
TN concentration explained only 3% of the variation in the log-transformed TP concentrations.
January 2011 14
In Sarasota Bay, no relationships with TN concentrations explained any variation in TP
concentrations. In Roberts Bay, the variation in TN concentration explained 24% of the variation
in TP concentration. In Little Sarasota Bay, on 12% of the variation in TP concentrations was
explained by the TN concentrations. In Blackburn Bay, 23% of the variation in monthly TP
concentrations was explained by the variation in TN concentrations. There were significant
relationships for Roberts Bay, Little Sarasota Bay, and Blackburn Bay, but the coefficients of
determination (r2) values were low indicating that TN concentrations are not a good predictor of
TP concentrations.
Table 3. Best-fit regressions of monthly TP concentrations on TN concentrations.
Segment Regression p > F r2
Palma Sola Bay -2.76 + 0.60*[TN] 0.10 0.03
Sarasota Bay 0.13 - 0.01*[TN] 0.7546 0.00
Roberts Bay 0.10 + 0.16*[TN] <0.0001 0.24
Little Sarasota Bay 0.11 + 0.12*[TN] <0.0001 0.12
Blackburn Bay 0.09 + 0.17*[TN] <0.0001 0.23
3.2 Evaluation of Relationships Between Chlorophyll a and TP Concentrations
The second data analysis approach examined the potential relationships between chlorophyll a
concentrations and TP concentrations in each segment. Chlorophyll a thresholds have been
established by the SBEP. If significant relationships are found, then the these thresholds could
be used to determine the corresponding TP concentrations for use as numeric nutrient criteria.
Monthly segment-specific chlorophyll a and TP concentrations were plotted. A series of
variables based on the ambient TP concentrations, including various lag concentrations, was
examined. Graphical results for each segment as scatter plots of chlorophyll a are provided in
Attachment 2. The graphical representations of the relationships were then used to guide
evaluation of relationships between chlorophyll a and TP concentrations that may explain the
monthly variation in chlorophyll a concentrations.
No relationships were found between chlorophyll a and TP concentrations that explained more
than 21% of the variation in chlorophyll a (maximum r2 = 0.21) (Table 4). In Palma Sola Bay, the
mean log-transformed two-month TP concentration explained 7% of the variation in log-
transformed chlorophyll a concentrations. In Sarasota Bay, the mean three-month TP
concentration explained 5% of the variation in log-transformed chlorophyll a concentrations. In
Roberts Bay, the same-month TP concentration explained 21% of the variation in chlorophyll a
concentrations. In Little Sarasota Bay, 6% of the variation in chlorophyll a concentrations was
explained by the same-month TP concentration, and 19% of the variation in chlorophyll a
concentrations in Blackburn Bay was explained by the same-month TP concentration.
Table 4. Best-fit regressions of monthly TP concentrations on chlorophyll a
January 2011 15
concentrations.
Segment Regression p > F r2
Palma Sola Bay 2.60 + 0.31*ln Mean 2-month TP Concentration 0.0045 0.07
Sarasota Bay 0.93 + 3.67*Mean 3-month TP Concentration 0.0155 0.05
Roberts Bay -3.17 + 61.13*Mean TP Concentrations <0.0001 0.21
Little Sarasota Bay 2.41 + 29.09*Mean TP Concentration 0.0035 0.06
Blackburn Bay -0.55 + 39.51*Mean TP Concentration <0.0001 0.19
The results of these analyses do not provide adequate evidence to support recommendations
for TP concentration criteria based on the relationships between the chlorophyll a and TP
concentrations.
3.3 Reference Period Concentration Criteria
The third approach to developing concentration-based numeric nutrient criteria for TP is the
reference period approach. Segment-specific chlorophyll a targets (values at this level or below
indicate desirable conditions) have been previously established. These targets were based on a
2001-2005 reference period. This period was deemed appropriate due to the seagrass coverage
observed during this period (Janicki Environmental,. The SBEP also considered the year-to-year
variability in chlorophyll a concentrations and arrived at segment-specific chlorophyll a
thresholds (values above this level indicate undesirable conditions). The threshold was the sum
of the chlorophyll a target and one standard deviation of the long-term chlorophyll a
concentrations.
Following this approach, numeric nutrient criteria expressed as TP concentrations for the five
bay segments were derived. Targets were based on 2001-2005 reference period data, and the
standard deviations in each segment were based on the annual means. The TP concentration
target, standard deviation, and threshold for each segment are provided in Table 5.
Table 5. TP targets and thresholds based on the Reference Period approach. The
reference period was 2001-2005.
Segment TP Target
(mg/L)
Standard Deviation of Long-term
Annual TP Concentrations
TP Threshold
(mg/L)
Palma Sola Bay 0.13 0.13 (1996-2008) 0.26
Sarasota Bay 0.15 0.04 (1998-2008) 0.19
Roberts Bay 0.19 0.04 (1998-2009) 0.23
Little Sarasota Bay 0.18 0.03 (1998-2009) 0.21
Blackburn Bay 0.17 0.04 (1998-2009) 0.21
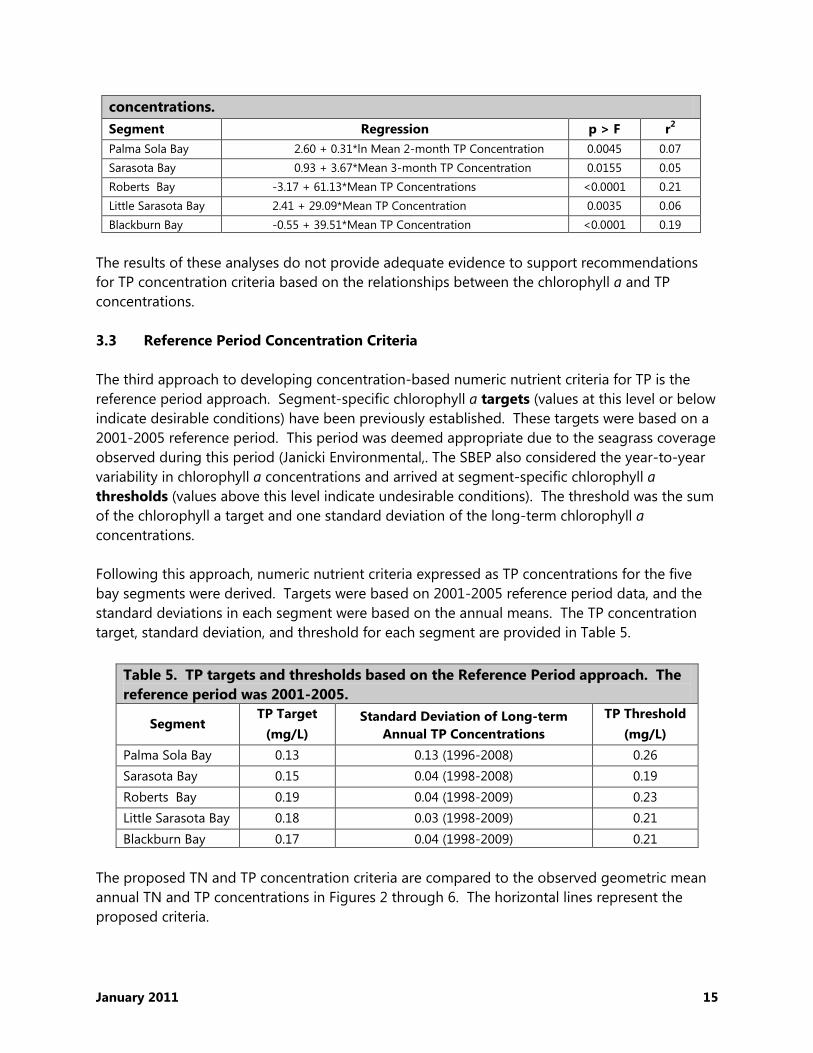
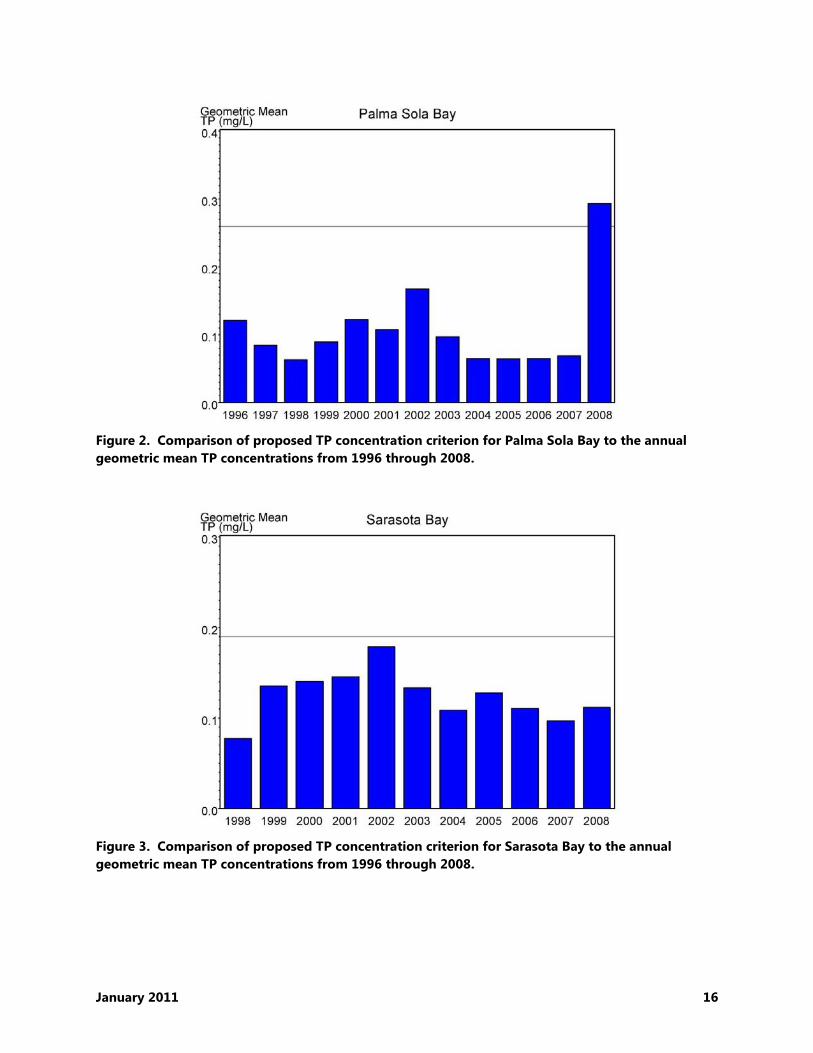
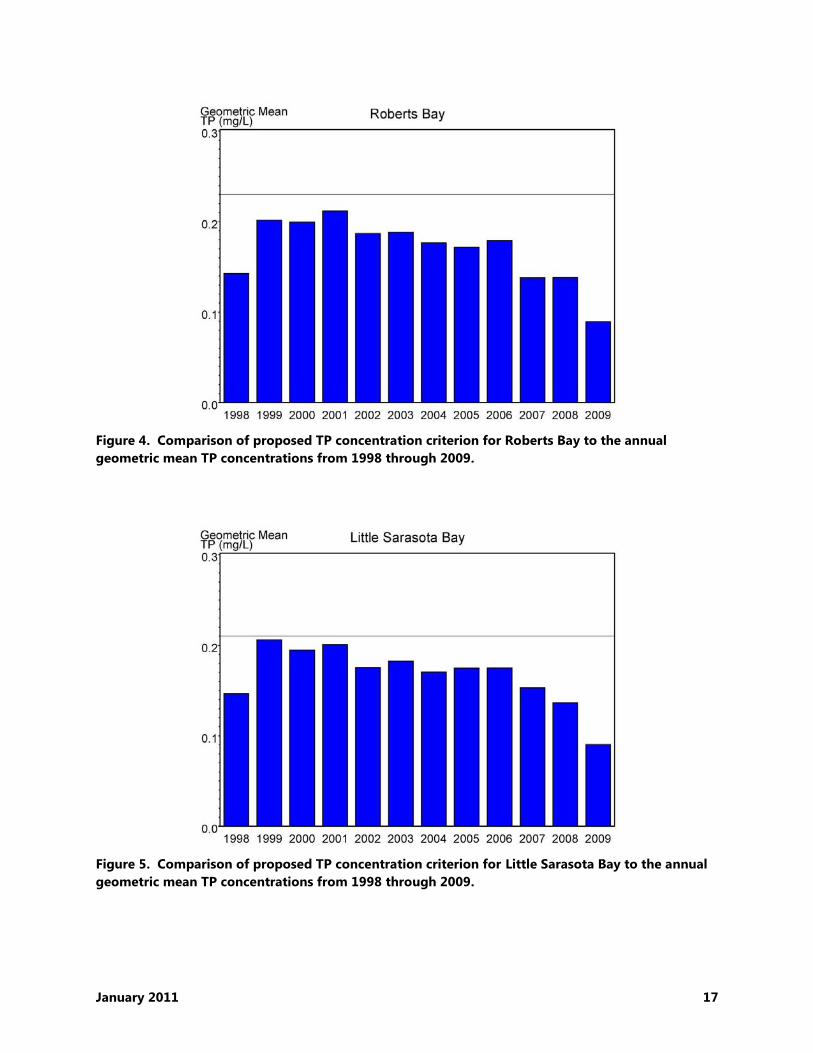
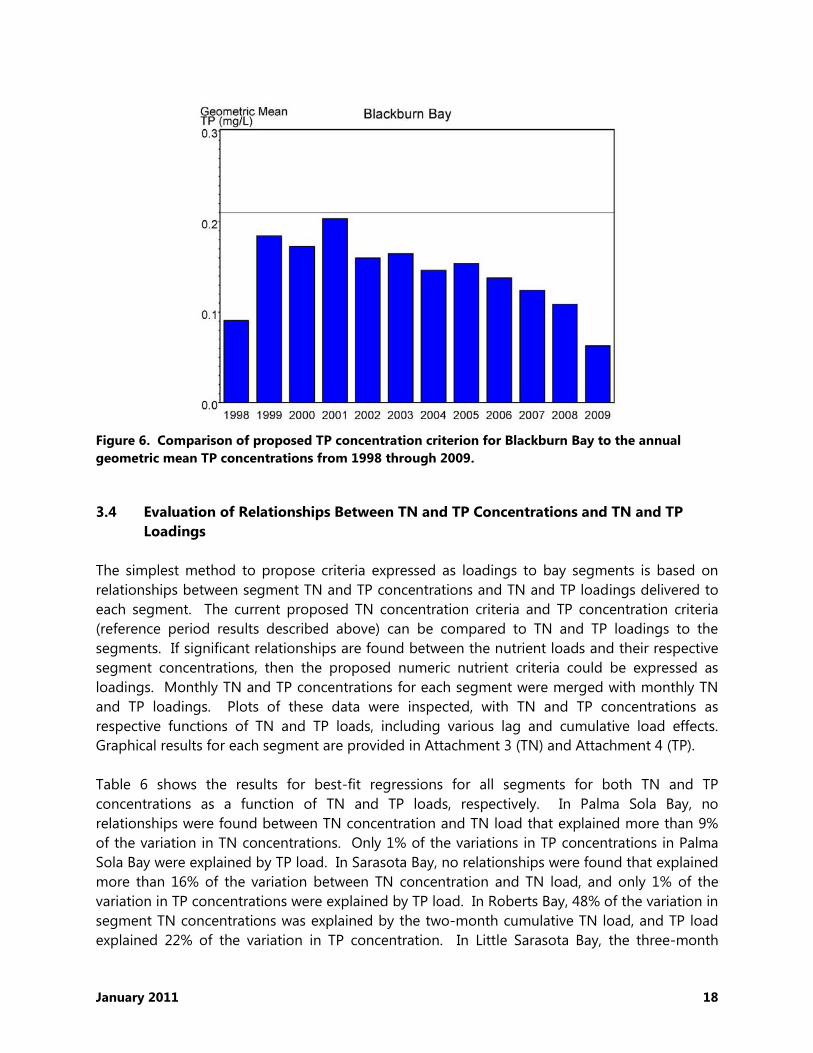
The proposed TN and TP concentration criteria are compared to the observed geometric mean
annual TN and TP concentrations in Figures 2 through 6. The horizontal lines represent the
proposed criteria.
January 2011 16
Figure 2. Comparison of proposed TP concentration criterion for Palma Sola Bay to the annual
geometric mean TP concentrations from 1996 through 2008.
Figure 3. Comparison of proposed TP concentration criterion for Sarasota Bay to the annual
geometric mean TP concentrations from 1996 through 2008.
January 2011 17
Figure 4. Comparison of proposed TP concentration criterion for Roberts Bay to the annual
geometric mean TP concentrations from 1998 through 2009.
Figure 5. Comparison of proposed TP concentration criterion for Little Sarasota Bay to the annual
geometric mean TP concentrations from 1998 through 2009.
January 2011 18
Figure 6. Comparison of proposed TP concentration criterion for Blackburn Bay to the annual
geometric mean TP concentrations from 1998 through 2009.
3.4 Evaluation of Relationships Between TN and TP Concentrations and TN and TP
Loadings
The simplest method to propose criteria expressed as loadings to bay segments is based on
relationships between segment TN and TP concentrations and TN and TP loadings delivered to
each segment. The current proposed TN concentration criteria and TP concentration criteria
(reference period results described above) can be compared to TN and TP loadings to the
segments. If significant relationships are found between the nutrient loads and their respective
segment concentrations, then the proposed numeric nutrient criteria could be expressed as
loadings. Monthly TN and TP concentrations for each segment were merged with monthly TN
and TP loadings. Plots of these data were inspected, with TN and TP concentrations as
respective functions of TN and TP loads, including various lag and cumulative load effects.
Graphical results for each segment are provided in Attachment 3 (TN) and Attachment 4 (TP).
Table 6 shows the results for best-fit regressions for all segments for both TN and TP
concentrations as a function of TN and TP loads, respectively. In Palma Sola Bay, no
relationships were found between TN concentration and TN load that explained more than 9%
of the variation in TN concentrations. Only 1% of the variations in TP concentrations in Palma
Sola Bay were explained by TP load. In Sarasota Bay, no relationships were found that explained
more than 16% of the variation between TN concentration and TN load, and only 1% of the
variation in TP concentrations were explained by TP load. In Roberts Bay, 48% of the variation in
segment TN concentrations was explained by the two-month cumulative TN load, and TP load
explained 22% of the variation in TP concentration. In Little Sarasota Bay, the three-month
January 2011 19
cumulative TN load explained 45% of the variation in TN concentration, and the two-month
cumulative TP load explained 3% of the variation in TP concentrations. In Blackburn Bay, 45% of
the variation in TN concentrations was explained by the variation in three-month cumulative TN
load, and the cumulative two-month TP loading explained 8% of the variation in TP
concentrations.
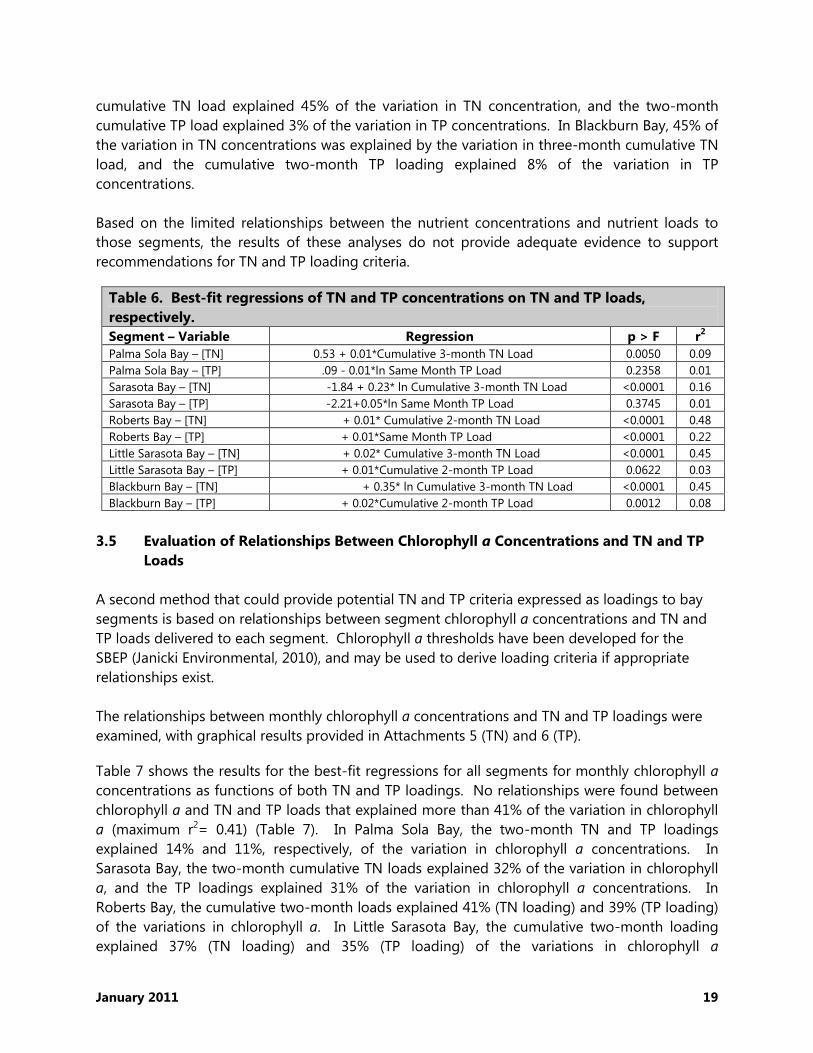
Based on the limited relationships between the nutrient concentrations and nutrient loads to
those segments, the results of these analyses do not provide adequate evidence to support
recommendations for TN and TP loading criteria.
Table 6. Best-fit regressions of TN and TP concentrations on TN and TP loads,
respectively.
Segment – Variable Regression p > F r2
Palma Sola Bay – [TN] 0.53 + 0.01*Cumulative 3-month TN Load 0.0050 0.09
Palma Sola Bay – [TP] .09 - 0.01*ln Same Month TP Load 0.2358 0.01
Sarasota Bay – [TN] -1.84 + 0.23* ln Cumulative 3-month TN Load <0.0001 0.16
Sarasota Bay – [TP] -2.21+0.05*ln Same Month TP Load 0.3745 0.01
Roberts Bay – [TN] + 0.01* Cumulative 2-month TN Load <0.0001 0.48
Roberts Bay – [TP] + 0.01*Same Month TP Load <0.0001 0.22
Little Sarasota Bay – [TN] + 0.02* Cumulative 3-month TN Load <0.0001 0.45
Little Sarasota Bay – [TP] + 0.01*Cumulative 2-month TP Load 0.0622 0.03
Blackburn Bay – [TN] + 0.35* ln Cumulative 3-month TN Load <0.0001 0.45
Blackburn Bay – [TP] + 0.02*Cumulative 2-month TP Load 0.0012 0.08
3.5 Evaluation of Relationships Between Chlorophyll a Concentrations and TN and TP
Loads
A second method that could provide potential TN and TP criteria expressed as loadings to bay
segments is based on relationships between segment chlorophyll a concentrations and TN and
TP loads delivered to each segment. Chlorophyll a thresholds have been developed for the
SBEP (Janicki Environmental, 2010), and may be used to derive loading criteria if appropriate
relationships exist.
The relationships between monthly chlorophyll a concentrations and TN and TP loadings were
examined, with graphical results provided in Attachments 5 (TN) and 6 (TP).
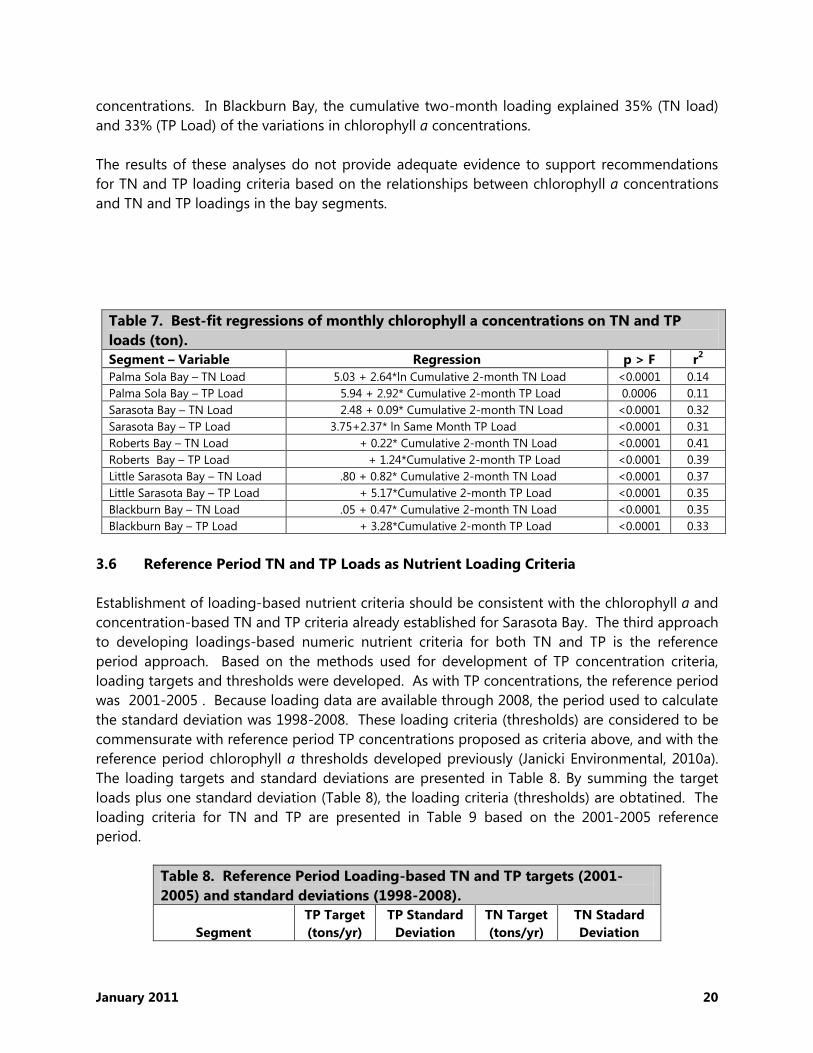
Table 7 shows the results for the best-fit regressions for all segments for monthly chlorophyll a
concentrations as functions of both TN and TP loadings. No relationships were found between
chlorophyll a and TN and TP loads that explained more than 41% of the variation in chlorophyll
a (maximum r2= 0.41) (Table 7). In Palma Sola Bay, the two-month TN and TP loadings
explained 14% and 11%, respectively, of the variation in chlorophyll a concentrations. In
Sarasota Bay, the two-month cumulative TN loads explained 32% of the variation in chlorophyll
a, and the TP loadings explained 31% of the variation in chlorophyll a concentrations. In
Roberts Bay, the cumulative two-month loads explained 41% (TN loading) and 39% (TP loading)
of the variations in chlorophyll a. In Little Sarasota Bay, the cumulative two-month loading
explained 37% (TN loading) and 35% (TP loading) of the variations in chlorophyll a
January 2011 20
concentrations. In Blackburn Bay, the cumulative two-month loading explained 35% (TN load)
and 33% (TP Load) of the variations in chlorophyll a concentrations.
The results of these analyses do not provide adequate evidence to support recommendations
for TN and TP loading criteria based on the relationships between chlorophyll a concentrations
and TN and TP loadings in the bay segments.
Table 7. Best-fit regressions of monthly chlorophyll a concentrations on TN and TP
loads (ton).
Segment – Variable Regression p > F r2
Palma Sola Bay – TN Load 5.03 + 2.64*ln Cumulative 2-month TN Load <0.0001 0.14
Palma Sola Bay – TP Load 5.94 + 2.92* Cumulative 2-month TP Load 0.0006 0.11
Sarasota Bay – TN Load 2.48 + 0.09* Cumulative 2-month TN Load <0.0001 0.32
Sarasota Bay – TP Load 3.75+2.37* ln Same Month TP Load <0.0001 0.31
Roberts Bay – TN Load + 0.22* Cumulative 2-month TN Load <0.0001 0.41
Roberts Bay – TP Load + 1.24*Cumulative 2-month TP Load <0.0001 0.39
Little Sarasota Bay – TN Load .80 + 0.82* Cumulative 2-month TN Load <0.0001 0.37
Little Sarasota Bay – TP Load + 5.17*Cumulative 2-month TP Load <0.0001 0.35
Blackburn Bay – TN Load .05 + 0.47* Cumulative 2-month TN Load <0.0001 0.35
Blackburn Bay – TP Load + 3.28*Cumulative 2-month TP Load <0.0001 0.33
3.6 Reference Period TN and TP Loads as Nutrient Loading Criteria
Establishment of loading-based nutrient criteria should be consistent with the chlorophyll a and
concentration-based TN and TP criteria already established for Sarasota Bay. The third approach
to developing loadings-based numeric nutrient criteria for both TN and TP is the reference
period approach. Based on the methods used for development of TP concentration criteria,
loading targets and thresholds were developed. As with TP concentrations, the reference period
was 2001-2005 . Because loading data are available through 2008, the period used to calculate
the standard deviation was 1998-2008. These loading criteria (thresholds) are considered to be
commensurate with reference period TP concentrations proposed as criteria above, and with the
reference period chlorophyll a thresholds developed previously (Janicki Environmental, 2010a).
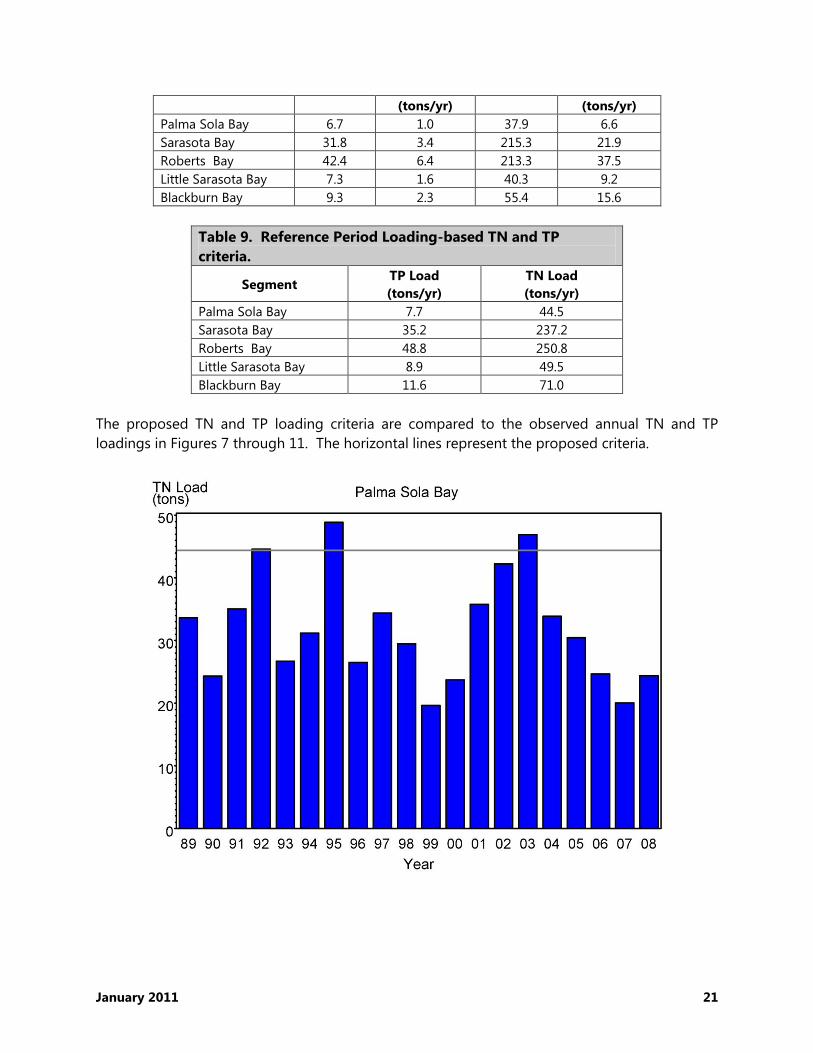
The loading targets and standard deviations are presented in Table 8. By summing the target
loads plus one standard deviation (Table 8), the loading criteria (thresholds) are obtatined. The
loading criteria for TN and TP are presented in Table 9 based on the 2001-2005 reference
period.
Table 8. Reference Period Loading-based TN and TP targets (2001-
2005) and standard deviations (1998-2008).
Segment
TP Target
(tons/yr)
TP Standard
Deviation
TN Target
(tons/yr)
TN Stadard
Deviation
January 2011 21
(tons/yr) (tons/yr)
Palma Sola Bay 6.7 1.0 37.9 6.6
Sarasota Bay 31.8 3.4 215.3 21.9
Roberts Bay 42.4 6.4 213.3 37.5
Little Sarasota Bay 7.3 1.6 40.3 9.2
Blackburn Bay 9.3 2.3 55.4 15.6
Table 9. Reference Period Loading-based TN and TP
criteria.
Segment TP Load
(tons/yr)
TN Load
(tons/yr)
Palma Sola Bay 7.7 44.5
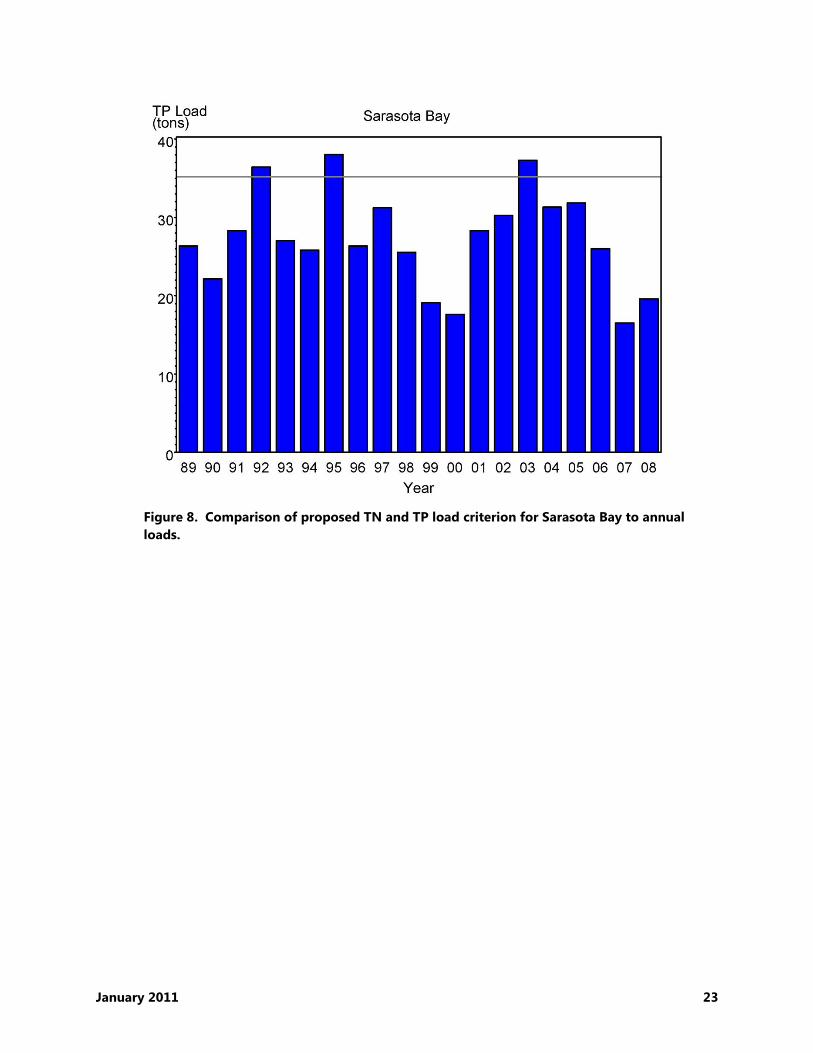
Sarasota Bay 35.2 237.2
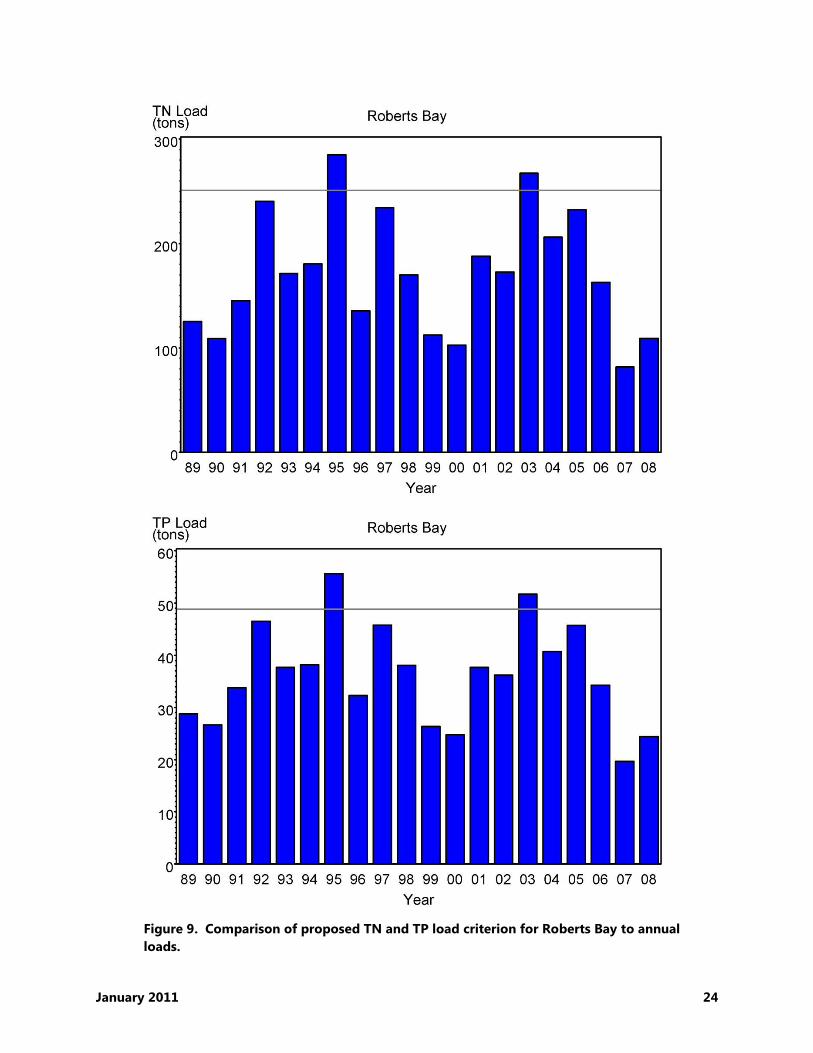
Roberts Bay 48.8 250.8
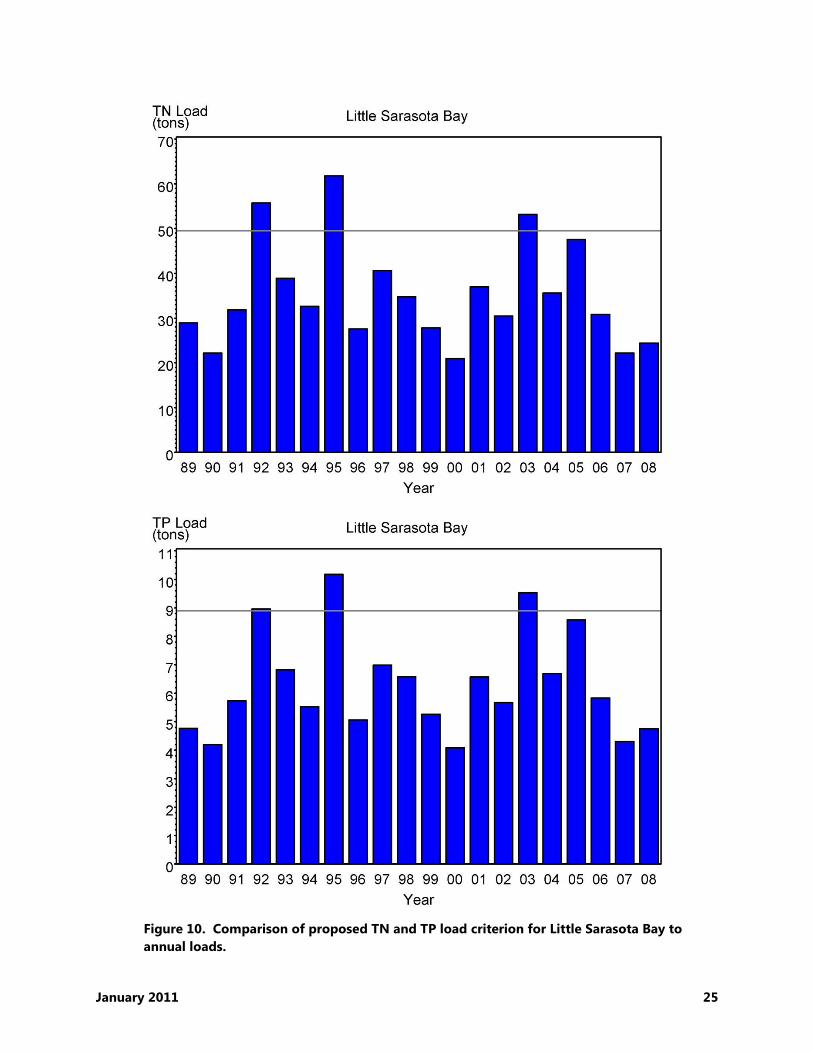
Little Sarasota Bay 8.9 49.5
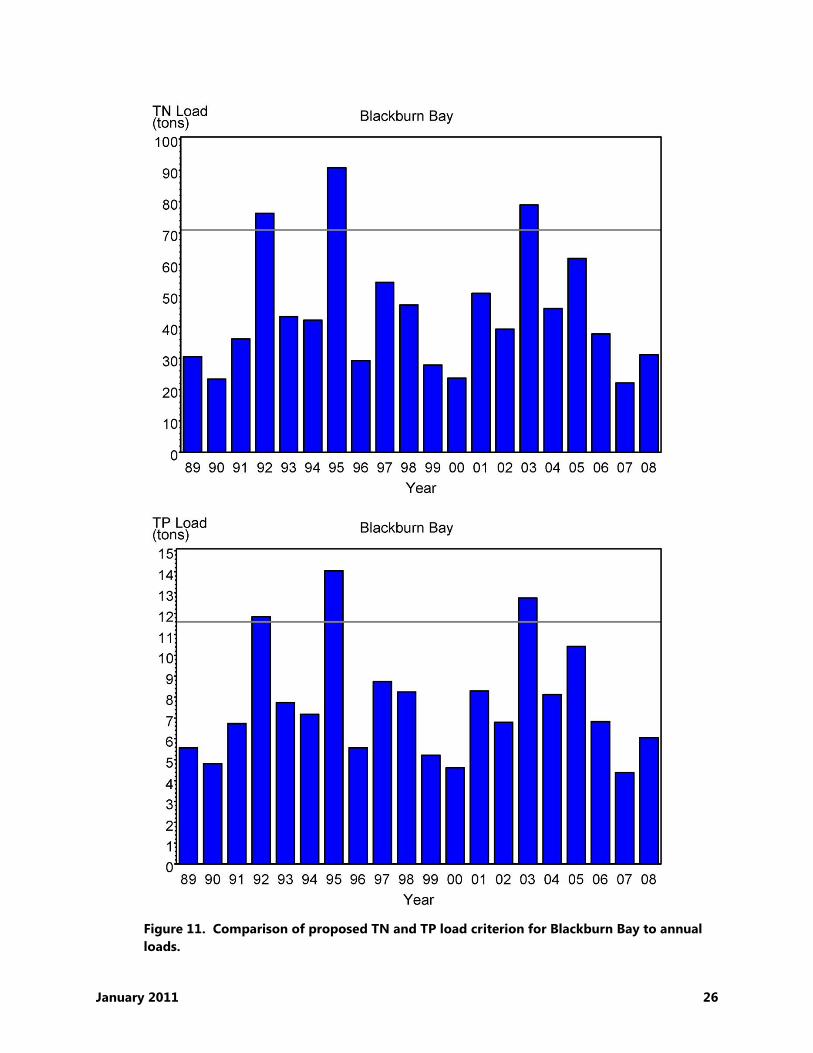
Blackburn Bay 11.6 71.0
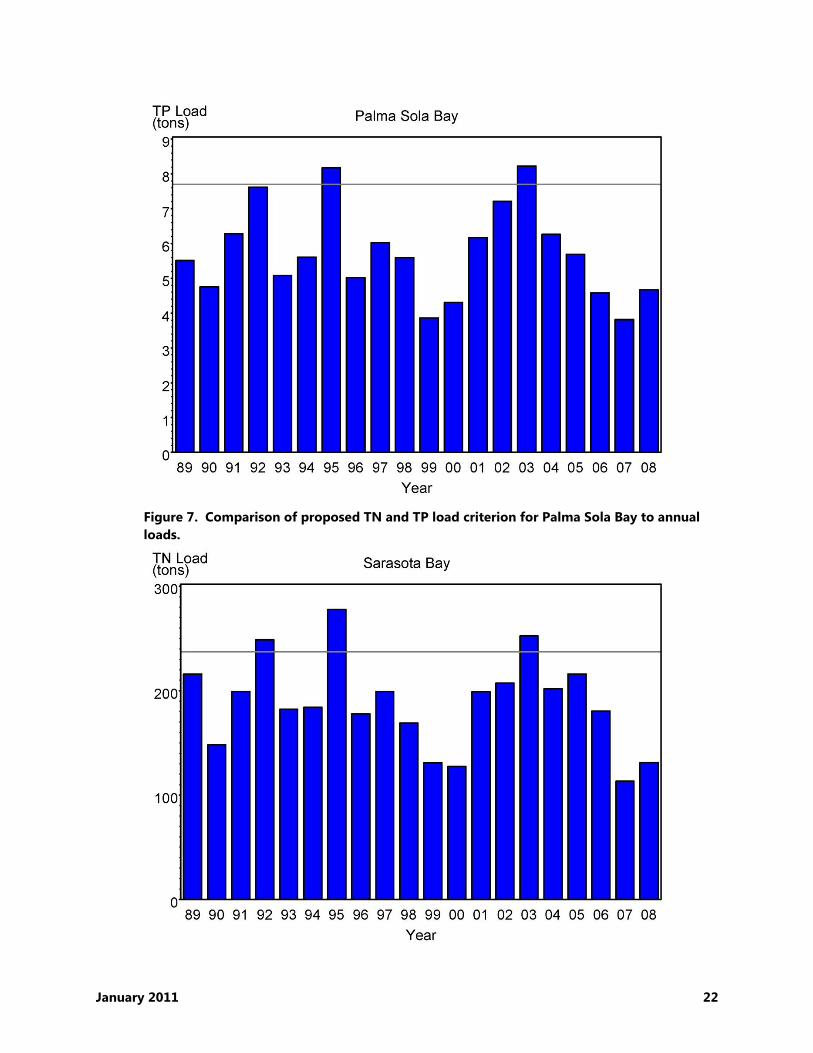
The proposed TN and TP loading criteria are compared to the observed annual TN and TP
loadings in Figures 7 through 11. The horizontal lines represent the proposed criteria.
January 2011 22
Figure 7. Comparison of proposed TN and TP load criterion for Palma Sola Bay to annual
loads.
January 2011 23
Figure 8. Comparison of proposed TN and TP load criterion for Sarasota Bay to annual
loads.
January 2011 24
Figure 9. Comparison of proposed TN and TP load criterion for Roberts Bay to annual
loads.
January 2011 25
Figure 10. Comparison of proposed TN and TP load criterion for Little Sarasota Bay to
annual loads.
January 2011 26
Figure 11. Comparison of proposed TN and TP load criterion for Blackburn Bay to annual
loads.
January 2011 27
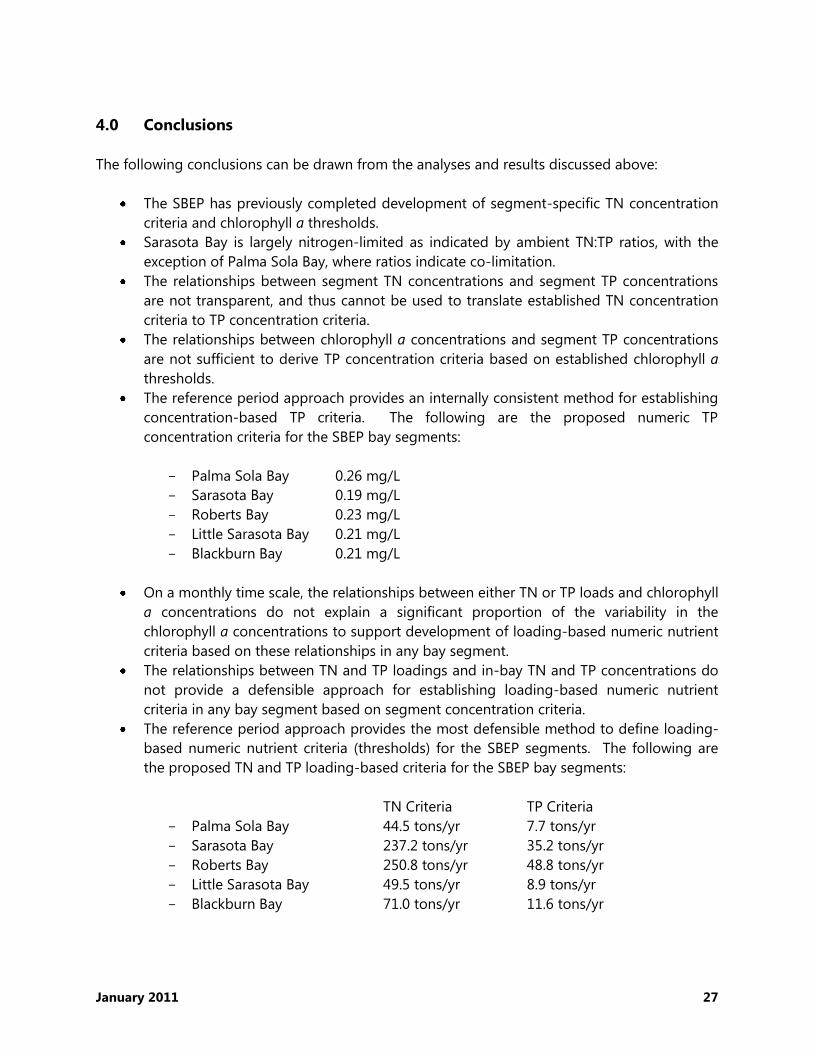
4.0 Conclusions
The following conclusions can be drawn from the analyses and results discussed above:
The SBEP has previously completed development of segment-specific TN concentration
criteria and chlorophyll a thresholds.
Sarasota Bay is largely nitrogen-limited as indicated by ambient TN:TP ratios, with the
exception of Palma Sola Bay, where ratios indicate co-limitation.
The relationships between segment TN concentrations and segment TP concentrations
are not transparent, and thus cannot be used to translate established TN concentration
criteria to TP concentration criteria.
The relationships between chlorophyll a concentrations and segment TP concentrations
are not sufficient to derive TP concentration criteria based on established chlorophyll a
thresholds.
The reference period approach provides an internally consistent method for establishing
concentration-based TP criteria. The following are the proposed numeric TP
concentration criteria for the SBEP bay segments:
- Palma Sola Bay 0.26 mg/L
- Sarasota Bay 0.19 mg/L
- Roberts Bay 0.23 mg/L
- Little Sarasota Bay 0.21 mg/L
- Blackburn Bay 0.21 mg/L
On a monthly time scale, the relationships between either TN or TP loads and chlorophyll
a concentrations do not explain a significant proportion of the variability in the
chlorophyll a concentrations to support development of loading-based numeric nutrient
criteria based on these relationships in any bay segment.
The relationships between TN and TP loadings and in-bay TN and TP concentrations do
not provide a defensible approach for establishing loading-based numeric nutrient
criteria in any bay segment based on segment concentration criteria.
The reference period approach provides the most defensible method to define loading-
based numeric nutrient criteria (thresholds) for the SBEP segments. The following are
the proposed TN and TP loading-based criteria for the SBEP bay segments:
TN Criteria TP Criteria
- Palma Sola Bay 44.5 tons/yr 7.7 tons/yr
- Sarasota Bay 237.2 tons/yr 35.2 tons/yr
- Roberts Bay 250.8 tons/yr 48.8 tons/yr
- Little Sarasota Bay 49.5 tons/yr 8.9 tons/yr
- Blackburn Bay 71.0 tons/yr 11.6 tons/yr
January 2011 28
5.0 References
Borsuck, M.E., C.A.Stow, and K.E. Reckhow. 2004. Confounding effect of flow on estuarine
response to nitrogen loading. Jour. Environ. Eng. 130:605-614.
Boynton, W.R. and W.M. Kemp. 2008. Estuaries. pp. 809-856. In: Nitrogen in the Marine
Environment. 2nd Edition. Capone, D.G., Bronk, D.A., Mulholland, M.R., and Carpenter, E.J. (eds.),
Elsevier Inc., Burlington, Massachusetts.
Boynton, W.R., W.M. Kemp, and C.W. Keefe. 1982. A comparative analysis of nutrients and
other factors influencing estuarine phytoplankton production. In: Estuarine Comparisons.
Kennedy, V.S. (ed.). Academic Press, San Diego.
Chapra, S.C. 1997. Surface Water-Quality Modeling, McGraw-Hill, New York, N.Y.
Conley, D.J. 2000. Biogeochemical nutrient cycles and nutrient management strategies.
Hydrobiologia. 410:87-96.
Conley, D.J., H.W. Paerl, R.W. Howarth, D.F. Boesch, S.P. Seitzinger, K.E. Havens, C. Lancelot, and
G.E. Likens. 2009. Controlling Eutrophication: Nitrogen and Phosphorus. Science. 323:1014-
1015.
Correll, D.L. 1999. Phosphorus: A rate limiting nutrient in surface waters. Poultry Science.
78:674-682.
Correll, D.L., and N.E. Tolbert. 1962. Ribonucleic acid-polyphosphate from algae. I. Isolation
and physiology. Plant Physiol. 37:627-636.
D’Elia, C.F., J.G. Sanders, and W.R. Boynton. 1986. Nutrient enrichment studies in a coastal plain
estuary: Phytoplankton growth in large-scale continuous cultures. Can. J. Fish. Aquat. Sci.
43:397-406.
Elser, J.J., E.R. Marzolf, and C.R. Goldman. 1990. Phosphorus and nitrogen limitation of
phytoplankton growth in the freshwaters of North America: a review and critique of
experimental enrichments. Can. J. Fish. Aquat. Sci. 47:1468-1477.
Elser, J.J., M.E.S. Bracken, L.L Cleland, D.S. Gruner, W.S. Harpole, H. Hillebrand, J.T. Ngai, E.W.
Seabloom, J.B. Shurin, and J.E. Smith. 2007. Global analysis of nitrogen and phosphorus
limitation of primary producers in freshwater, marine and terrestrial ecosystems. Ecology Letters
10, doi: 10.1111/j.1461-0248.2007.01113x.
FDEP. 2002. Unpublished guidelines for determining nutrient limitations in waterbodies under
the Impaired Waters Rule. Watershed Assessment Division. Tallahassee.
January 2011 29
Fisher, T.R., E.R. Peele, J.W. ammerman, and L.W. Harding, Jr. 1992. Nutrient limitation of
phytoplankton in Chesapeake Bay. Mar. Ecol. Prog. Ser. 82:51-63.
Hagy, J.D., L.P. Sanford, and W.R. Boynton. 2000. Estimation of net physical transport and
hydraulic residence times for a coastal plain estuary using box models. Estuaries. 23:328-340.
Havens, K.E., and J. DeCosta. 1986. A comparison of phytoplankton responses to nutrient
additions in acidic and circumneutral pH lakewater. Hydrobiologia. 137:211-222.
Hecky, R.E., and P. Kilham. 1988. Nutrient limitation of phytoplankton in freshwater and marine
environment: A review of recent evidence on the effects of enrichment. Limnol. Oceanogr.
33:796-822.
Howarth, R.W. 1988. Nutrient limitation of net primary productivity in marine ecosystems.
Annual Review of Ecology and Systematics. 19:89-110.
Howarth, R. W. 2008. Coastal nitrogen pollution: A review of sources and trends globally and
regionally. Harmful Algae. 8:14-20.
Howarth, R.W., and R. Marino. 2006. Nitrogen as the limiting nutrient for eutrophication in
coastal marine ecosystems: Evolving views over three decades. Limnol. Oceanogr. 51:364-376.
Howarth, R.W., R. Marino, J. Land, and J.J. Cole. 1988a. Nitrogen fixation in freshwater,
estuarine, and marine ecosystems. 1. Rates and importance. Limnol. Oceanogr. 33:669-687.
Howarth, R.W., R. Marino, and J.J. Cole. 1988b. Nitrogen fixation in freshwater, estuarine, and
marine ecosystems. 2. Biogeochemical controls. Limnol. Oceanogr. 33:688-701.
Jahnke, J., H.J. Rick, and L. Aletsee. 1986. On the light and temperature dependence of the
minimum and maximum phosphorus contents in cells of the marine plankton diatom
Thalassiosira rotula Meunier. J. Plankton Res. 8:549-555.
Janicki Environmental, Inc. 2010a. Chlorophyll Endpoints to Support the Development of
Numeric Nutrient Criteria for the Sarasota Bay Estuary Program. Prepared for the Sarasota Bay
Estuary Program.
Janicki Environmental, Inc. 2010b. Numeric Nutrient Criteria for Sarasota Bay. Prepared for
Sarasota Bay Estuary Program, Sarasota, FL.
Lee, Y.S., T. Seiki, T. Mukai, K. Takimoto, and M. Okada. 1996. Limiting nutrients of
phytoplankton community in Hiroshima Bay, Japan. Water Res. 30:1490-1494.
January 2011 30
Lynch, M., and J. Shapiro. 1981. Predation, enrichment, and phytoplankton community structure.
Limnol. Oceanogr. 26:86-102.
Malone, T.C., D.J. Conley, T.R. Fisher, P.M. Glibert, L.W. Harding, and K.G. Sellner. 1996. Scales of
Nutrient-Limited Phytoplankton Productivity in Chesapeake Bay. Estuaries. Vol. 19, No. 2.
Dedicated Issue: Nutrients in Coastal Waters. pp. 371-385.
McComb, A.J., R.P. Atkins, P.B. Birch, and R.J. Lukatelich. 1981. Eutrophication in the Peel-Harvey
estuarine system, Western Australia. In: Estuaries and Nutrients. Nielsen, B.J., and L.E. Cronin
(eds). Humana Press. Clifton, NJ, p 569-582.
Monsen, N.E., J.E. Cloern, and L.V. Lucus. 2002. A comment on the use of flushing time,
residence time, and age as transport time scales. Limnol. Oceanogr. 47:1545-1553.
National Research Council (NRC), 1993. Managing wastewater in coastal urban areas. National
Academy Press. Washington, D.C.
National Research Council (NRC), 2000. Clean Coastal Waters: Understanding and Reducing the
Effects of Nutrient Pollution. National Academy Press. Washington, D.C.
Nixon, S.W., et al. (15 co-authors). 1996. The fate of nitrogen and phosphorus at the land-sea
margin of the North Atlantic Ocean. Biogeochemistry. 35:141-180.
Oviatt, C.A., A.A. Keller, P.A. Sampou, and L.L. Beatty. 1986. Patterns of productivity during
eutrophication: a mesocosm experiment. Mar. Ecol. Prog. Ser. 28:69-80.
Parsons, T.R., Y. Maita, and C.M. Lalli. 1984. A manual of chemical and biological methods for
seawater analysis. Pergamon Press.
Pennock, J.R., and J.H. Sharp. 1994. Temporal alternation between light- and nutrient-limitation
of phytoplankton production in a coastal plain estuary. Mar. Ecol. Prog. Ser. 111:275-288.
Perez, E.A.A., J. DeCosta, and K.E. Havens. 1994. The effects of nutrient addition and pH
manipulation in bag experiments on the phytoplankton of a small acidic lake in West Virginia,
USA. Hydrobiologia. 291:93-103.
Redfield, A.C. 1934. On the proportion of organic derivatives in sea water and their relation to
the composition of plankton. James Johnstone Memorial Volume. Liverpool University Press.
pp. 176-192.
Redfield, A.C. 1958. The biological control of chemical factors in the environment. Am. Sci.
46:205-222.
Ryther, J.H., and W.M. Dunstan. 1971. Nitrogen, phosphorus, and eutrophication in the coastal
marine environment. Science. 171:1008–1013.
January 2011 31
Schindler, D.W. 1974. Eutrophication and recovery in experimental lakes: Implications for lake
management. Science. 184:897-899.
Schindler, D.W. 1975. Whole-lake eutrophication experiments with phosphorus, nitrogen and
carbon. Verh. Int. Verein. Limnol. 19:3221-3231.
Schindler, D.W. 1977. The evolution of phosphorus limitations in lakes. Science. 195:260-262.
Shapiro, J. 1980. The importance of trophic-level interactions to the abundance and species
composition of algae in lakes. In: Hypertrophic Ecosystems, Developments in Hydrobiology.
Barica, J. and L.R. Mur (eds). Junk, The Netherlands Vol. 2. pp.105-116.
Sicko-Goad, L., and T.E. Jensen. 1976. Phosphate metabolism in blue-green algae. II. Changes
in phosphate distribution during starvation and the “polyphosphate overplus” phenomenon in
Plectonema boryanum. Am. J. Bot. 63:183-188.
Smith, S.V. 1984. Phosphorus versus nitrogen limitation in the marine environment. Limnol.
Oceanogr. 29:1149-1160.
Taylor, D., S. Nixon, S. Granger, and B. Buckley. 1995. Nutrient limitation and the eutrophication
of coastal lagoons. Mar. Ecol. Prog. Ser. 127:235-244.
Terry, K.L., J. Hirate, and E.A. Laws. 1985. Light-, nitrogen-, and phosphorus-limited growth of
Phaeodactylum tricornutum Bohlin strain TFX-1: chemical composition, carbon partitioning, and
the diel periodicity of physiological processes. J. Exp. Mar. Biol. Ecol. 86:85-100.
Thomas, W. H. 1970a. On nitrogen deficiency in tropical parameters in poor and rich water.
Limnol. Oceanogr. 15:380-385.
Thomas, W. H. 1970b. Effect of ammonium and nitrate concentration on chlorophyll increases
in natural tropical Pacific phytoplankton populations. Limnol. Oceanogr. 15:386-394.
Wynne, D., and G.Y. Rhee. 1986. Effects of light intensity and quality on the relative N and P
requirement (the optimum N:P ratio) of marine planktonic algae. J. Plankton Res. 8:91-103.