Sarah Hall, Jessica Pettersson,...
26
1 23 Natural Hazards Journal of the International Society for the Prevention and Mitigation of Natural Hazards ISSN 0921-030X Volume 89 Number 1 Nat Hazards (2017) 89:473-496 DOI 10.1007/s11069-017-2975-3 Awareness of tsunami natural warning signs and intended evacuation behaviors in Java, Indonesia Sarah Hall, Jessica Pettersson, William Meservy, Ron Harris, Diannitta Agustinawati, Jennie Olson & Allayna McFarlane
-
Upload
nguyenkhanh -
Category
Documents
-
view
214 -
download
0
Transcript of Sarah Hall, Jessica Pettersson,...

1 23
Natural HazardsJournal of the International Societyfor the Prevention and Mitigation ofNatural Hazards ISSN 0921-030XVolume 89Number 1 Nat Hazards (2017) 89:473-496DOI 10.1007/s11069-017-2975-3
Awareness of tsunami natural warningsigns and intended evacuation behaviors inJava, Indonesia
Sarah Hall, Jessica Pettersson, WilliamMeservy, Ron Harris, DiannittaAgustinawati, Jennie Olson & AllaynaMcFarlane
1 23
Your article is protected by copyright andall rights are held exclusively by SpringerScience+Business Media B.V.. This e-offprintis for personal use only and shall not be self-archived in electronic repositories. If you wishto self-archive your article, please use theaccepted manuscript version for posting onyour own website. You may further depositthe accepted manuscript version in anyrepository, provided it is only made publiclyavailable 12 months after official publicationor later and provided acknowledgement isgiven to the original source of publicationand a link is inserted to the published articleon Springer's website. The link must beaccompanied by the following text: "The finalpublication is available at link.springer.com”.

ORIGINAL PAPER
Awareness of tsunami natural warning signsand intended evacuation behaviors in Java, Indonesia
Sarah Hall1 • Jessica Pettersson1 • William Meservy2 •
Ron Harris2 • Diannitta Agustinawati3 • Jennie Olson1 •
Allayna McFarlane2
Received: 16 March 2017 /Accepted: 20 June 2017 / Published online: 26 June 2017! Springer Science+Business Media B.V. 2017
Abstract The south coast of Java has a long history of deadly seismogenic tsunamis. Themost recent tsunami events in 1994 and 2006 killed hundreds due to lack of awareness andimplementation of disaster mitigation strategies. Community-based tsunami hazard edu-cation programs founded on observation of natural warning signs and self-evacuation arecritical to saving lives. Students at middle and high schools in three cities along thesouthern coast of Java (N = 887) participated in a pen/paper survey that included criticalawareness, risk perception, self-efficacy, response efficacy, evacuation intentions, pastparticipation in evacuation simulations, communication channels, and warning prefer-ences. Participants generally had high perceived tsunami risk and efficacy. Overall, par-ticipants who associated tsunamis with earthquakes know that a receding ocean is a sign ofan impending tsunami and believed that vertical evacuation was more important thaninland evacuation. School, Internet, and social media were most often reported as infor-mation sources. However, the majority of participants believed that an earthquake had tobe dramatic to cause a tsunami. Participants overestimated both the duration of groundshaking prior to a tsunami event and the suggested evacuation window. Differencesbetween cities were found for evacuation simulation history and personal experience withtsunamis; however, neither increased critical awareness. Evacuation simulations, coupledwith education of under what circumstances to evacuate (20/20/20 principle), should beimplemented throughout Java. Short messages stressing that even weak earthquakes can
Electronic supplementary material The online version of this article (doi:10.1007/s11069-017-2975-3)contains supplementary material, which is available to authorized users.
& Sarah [email protected]
1 Utah Valley University, HP 101h 800 W. University Parkway, Orem, UT 84058, USA
2 Brigham Young University, S389 ESC, Provo, UT 84602, USA
3 Pacitan BPBD, JL. Walanda Maramis, No. 09, Sidoharjo, Kec. Pacitan, Kabupaten Pacitan,Jawa Timur 63514, Indonesia
123
Nat Hazards (2017) 89:473–496DOI 10.1007/s11069-017-2975-3
Author's personal copy

cause tsunamis should be communicated through a variety of channels such as TV, radio,Internet, and social media.
Keywords Tsunami ! Preparedness assessment ! Disaster mitigation ! Communityeducation ! Preparedness interventions ! Java ! Indonesia ! Public health ! Warnings ! Riskperception ! Critical awareness ! Efficacy perception ! Evacuation
1 Background
1.1 2004 Indian Ocean tsunami
The 2004 mega-tsunami that struck the Indian Ocean region was a wake-up call for thedisaster mitigation community. Geoscientists studying the history of earthquakes andtsunamis in the region forecasted the event (Newcomb and McCann 1987; Harris andPrasetyadi 2002; Ortiz and Bilham 2003), but little of this research was disseminated tothose in harm’s way, and little to nothing was done to increase tsunami hazards resilienceon the coast of Sumatra and other areas further from the epicenter (Harris 2016). In total,over 280,000 lives were lost (Lay et al. 2005).
This unequaled tsunami disaster calls for an emphasis on the importance of strength-ening both the ‘‘hard’’ and ‘‘soft’’ aspects of tsunami disaster mitigation by empoweringthose most threatened by natural hazards to build resiliency to these hazards. Within2 weeks of the 2004 tsunami, the American Geophysical Union (AGU) published astatement addressing the need for broadening the responsibility of the geoscience com-munity for all aspects of natural disaster prevention. The statement calls for the following:‘‘(1) fundamental research on Earth and space, and monitoring of natural hazards; (2)dissemination of the relevant results to the public, especially vulnerable communities; and(3) implementation of multidisciplinary efforts needed to apply effective mitigationstrategies worldwide’’ (Sorooshian 2005, p. 14).
This statement articulated the responsibility of geoscientists to not only conduct moreresearch on forecasting and monitoring geological hazards, but spearhead collaborativeefforts with experts in a wide variety of fields to strengthen tsunami preparedness.Effective behavior change strategies should include assessment of current knowledgelevels, implementation of culturally tailored mitigation strategies, and evaluation andrefinement of efforts (Edberg 2013). This paper, a collaborative effort between publichealth and geoscience experts, focuses on theory-based assessment of current knowledgelevels in coastal areas of Java, Indonesia.
1.2 Present risk in Java, Indonesia
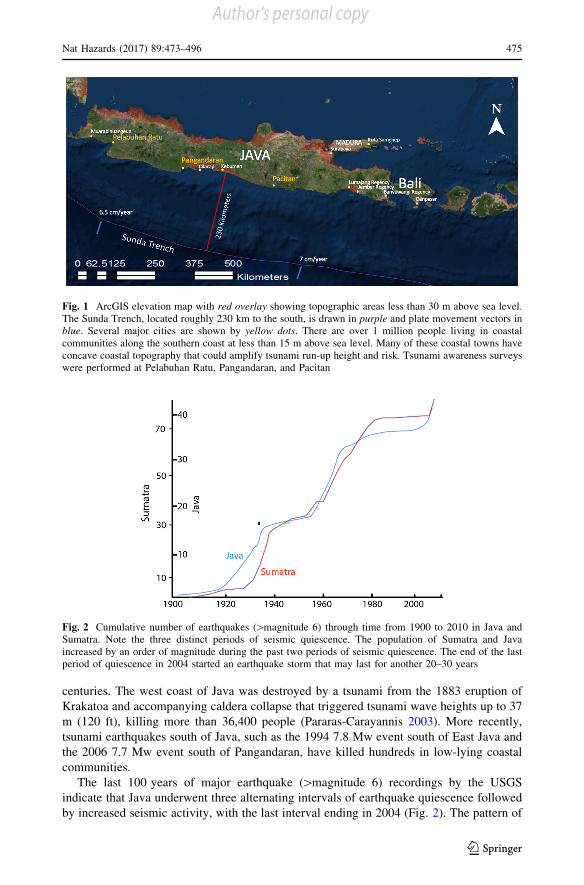
There are approximately 4.35 million Indonesians imperiled by tsunamis along thesouthern coasts of Sumatra, Java, and Bali. These individuals may have as little as 20 minto reach safe high ground (Post et al. 2009). Due to its high population density and manylow-lying, coastal communities, the south coast of Java, in particular, is one of the most at-risk areas in Indonesia (Fig. 1) and has a long history of deadly seismogenic and vol-canogenic tsunamis (Wichmann 1918, 1922; Harris and Major 2016). Of note is the highrate of earthquakes and tsunamis that struck Java in the mid-nineteenth and twentieth
474 Nat Hazards (2017) 89:473–496
123
Author's personal copy
centuries. The west coast of Java was destroyed by a tsunami from the 1883 eruption ofKrakatoa and accompanying caldera collapse that triggered tsunami wave heights up to 37m (120 ft), killing more than 36,400 people (Pararas-Carayannis 2003). More recently,tsunami earthquakes south of Java, such as the 1994 7.8 Mw event south of East Java andthe 2006 7.7 Mw event south of Pangandaran, have killed hundreds in low-lying coastalcommunities.
The last 100 years of major earthquake ([magnitude 6) recordings by the USGSindicate that Java underwent three alternating intervals of earthquake quiescence followedby increased seismic activity, with the last interval ending in 2004 (Fig. 2). The pattern of
Fig. 1 ArcGIS elevation map with red overlay showing topographic areas less than 30 m above sea level.The Sunda Trench, located roughly 230 km to the south, is drawn in purple and plate movement vectors inblue. Several major cities are shown by yellow dots. There are over 1 million people living in coastalcommunities along the southern coast at less than 15 m above sea level. Many of these coastal towns haveconcave coastal topography that could amplify tsunami run-up height and risk. Tsunami awareness surveyswere performed at Pelabuhan Ratu, Pangandaran, and Pacitan
Fig. 2 Cumulative number of earthquakes ([magnitude 6) through time from 1900 to 2010 in Java andSumatra. Note the three distinct periods of seismic quiescence. The population of Sumatra and Javaincreased by an order of magnitude during the past two periods of seismic quiescence. The end of the lastperiod of quiescence in 2004 started an earthquake storm that may last for another 20–30 years
Nat Hazards (2017) 89:473–496 475
123
Author's personal copy
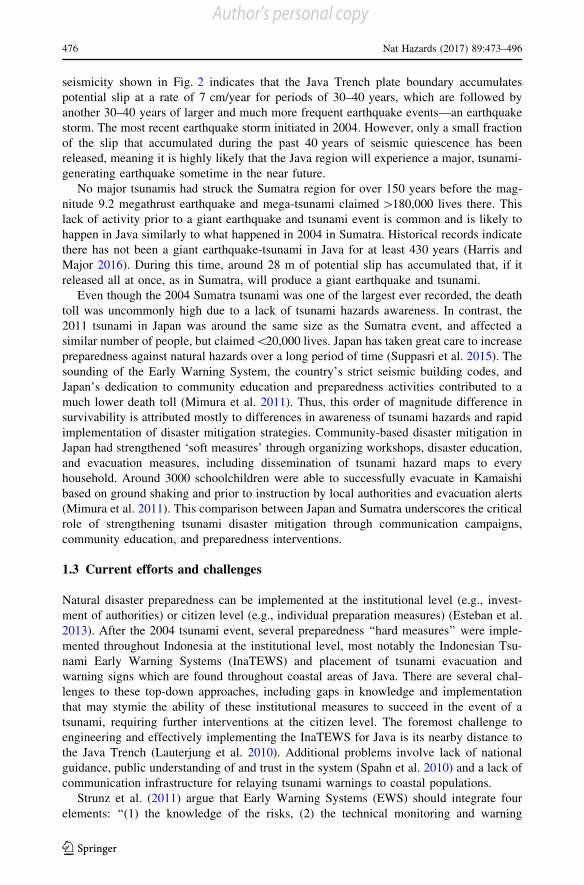
seismicity shown in Fig. 2 indicates that the Java Trench plate boundary accumulatespotential slip at a rate of 7 cm/year for periods of 30–40 years, which are followed byanother 30–40 years of larger and much more frequent earthquake events—an earthquakestorm. The most recent earthquake storm initiated in 2004. However, only a small fractionof the slip that accumulated during the past 40 years of seismic quiescence has beenreleased, meaning it is highly likely that the Java region will experience a major, tsunami-generating earthquake sometime in the near future.
No major tsunamis had struck the Sumatra region for over 150 years before the mag-nitude 9.2 megathrust earthquake and mega-tsunami claimed[180,000 lives there. Thislack of activity prior to a giant earthquake and tsunami event is common and is likely tohappen in Java similarly to what happened in 2004 in Sumatra. Historical records indicatethere has not been a giant earthquake-tsunami in Java for at least 430 years (Harris andMajor 2016). During this time, around 28 m of potential slip has accumulated that, if itreleased all at once, as in Sumatra, will produce a giant earthquake and tsunami.
Even though the 2004 Sumatra tsunami was one of the largest ever recorded, the deathtoll was uncommonly high due to a lack of tsunami hazards awareness. In contrast, the2011 tsunami in Japan was around the same size as the Sumatra event, and affected asimilar number of people, but claimed\20,000 lives. Japan has taken great care to increasepreparedness against natural hazards over a long period of time (Suppasri et al. 2015). Thesounding of the Early Warning System, the country’s strict seismic building codes, andJapan’s dedication to community education and preparedness activities contributed to amuch lower death toll (Mimura et al. 2011). Thus, this order of magnitude difference insurvivability is attributed mostly to differences in awareness of tsunami hazards and rapidimplementation of disaster mitigation strategies. Community-based disaster mitigation inJapan had strengthened ‘soft measures’ through organizing workshops, disaster education,and evacuation measures, including dissemination of tsunami hazard maps to everyhousehold. Around 3000 schoolchildren were able to successfully evacuate in Kamaishibased on ground shaking and prior to instruction by local authorities and evacuation alerts(Mimura et al. 2011). This comparison between Japan and Sumatra underscores the criticalrole of strengthening tsunami disaster mitigation through communication campaigns,community education, and preparedness interventions.
1.3 Current efforts and challenges
Natural disaster preparedness can be implemented at the institutional level (e.g., invest-ment of authorities) or citizen level (e.g., individual preparation measures) (Esteban et al.2013). After the 2004 tsunami event, several preparedness ‘‘hard measures’’ were imple-mented throughout Indonesia at the institutional level, most notably the Indonesian Tsu-nami Early Warning Systems (InaTEWS) and placement of tsunami evacuation andwarning signs which are found throughout coastal areas of Java. There are several chal-lenges to these top-down approaches, including gaps in knowledge and implementationthat may stymie the ability of these institutional measures to succeed in the event of atsunami, requiring further interventions at the citizen level. The foremost challenge toengineering and effectively implementing the InaTEWS for Java is its nearby distance tothe Java Trench (Lauterjung et al. 2010). Additional problems involve lack of nationalguidance, public understanding of and trust in the system (Spahn et al. 2010) and a lack ofcommunication infrastructure for relaying tsunami warnings to coastal populations.
Strunz et al. (2011) argue that Early Warning Systems (EWS) should integrate fourelements: ‘‘(1) the knowledge of the risks, (2) the technical monitoring and warning
476 Nat Hazards (2017) 89:473–496
123
Author's personal copy

service, (3) the dissemination and communication of meaningful warnings to those at risk,and (4) the public awareness and preparedness to react to warnings’’ (p. 67). Accordingly,even if warning systems were technically reliable, without knowledge and efficacy to reactto the warnings, there could still be significant loss of life. According to the BadanMeterologi Klimatalogi dan Geofisika of Indonesia (2010), several hundred people werekilled during the 2010 Mentawai tsunami after an early warning generated by the systemfailed to reach isolated coastal communities, thus demonstrating that reliance on thetechnical ability of the EWS to effectively warn the population could result in unnecessaryloss of life. An additional challenge faced by EWS is when to terminate the warning afterthe initial alarm. For example, during both the Mentawai (2010) and Japan (2011) tsunami,warnings were terminated prematurely although tsunamis were still occurring hours later(Suppasri et al. 2015). A shortcoming of this model is that even if EWS works as intended,the mitigation strategy relies mostly on top-down dissemination of warnings heavily relianton national institutions. This focus fosters dependency and is likely to fail and/or delayevacuation.
The placement of tsunami evacuation signs throughout Java is another effort imple-mented at the institutional level. These signs typically include an arrow in the direction ofevacuation and an image of a steep wave with an individual running uphill away from thewave. This effort has likely increased awareness of uphill evacuation. However, infor-mation about under what circumstances to evacuate is lacking from the signage. If peoplefail to recognize natural warning signs or evacuate too late to reach safe ground in time,current efforts alone will be insufficient to prevent disaster. Additionally, Cox (2001)argues that the depiction of steep tsunami waves in such images are likely to create a falseimpression of incoming tsunamis, whereas tsunamis approaching shore are often perceivedas gradual rises and falls in water level rather than a distinguishable wave. Cox argues that‘‘failure to realize that tsunami waves often have such small steepness that they cannot berecognized as waves has undoubtedly contributed to the loss of life associated with tsu-namis’’ (p. 92). These institutional efforts should be accompanied by increased educationand knowledge of natural warning signs, the nature of tsunamis, and evacuation protocol atthe citizen level.
1.4 Response capabilities and preparedness
Sullivan and Hakkinen (2006) argue that the level of study put into physical sciencedisaster research should be accompanied by research that seeks to understand the psy-chological elements behind the human response to disaster. Response capabilities consistof three main points: ‘‘warning dissemination (do people receive and understand thewarning?), anticipated response (do people respond to warnings and evacuate?) andevacuation (are people able to reach safe areas on time?)’’ (Strunz et al. 2011, p. 72).Factors such as low risk perception are likely to decrease evacuation response speed (Dashand Gladwin 2007). Several of these critical factors can be addressed through communityeducation campaigns. Considering past failures of the InaTEWS, educational effortsstressing observation of natural warning signs and self-evacuation are critical to quickwarning dissemination and response.
This paper offers an assessment of tsunami hazard awareness, risk and efficacy per-ceptions, and preparedness in schools along the southern coast of Java. We conductedsurveys to determine baseline perceptions of tsunami risk and efficacy, tsunami causes andwarning signs, previous participation in evacuation simulations, perceptions of when andhow to evacuate, evacuation intentions, communication channels, and warning preferences.
Nat Hazards (2017) 89:473–496 477
123
Author's personal copy
Results of this survey can be used to address knowledge gaps and design appropriatecommunity-level interventions.
2 Methods
2.1 Survey development
We developed a 20-question survey based on several relevant preparation model constructsthat have been previously applied to tsunami preparedness (Paton 2003; Johnston et al.2005). Constructs included risk perception, self-efficacy, response efficacy, criticalawareness, and evacuation intentions. We also included questions about history of par-ticipation in evacuation simulations, communication channels, and warning preferences.Lastly, we asked basic demographic questions to account for any differences in demo-graphic distribution between our three study sites. Surveys were created in English andindependently translated by three individuals fluent in both English and Bahasa Indonesia.Discrepancies in word choices were resolved by agreement between the three translators.Surveys were pretested on Indonesian geology students from the Universitas PembangunanNasional (UPN). The final surveys were conducted in Bahasa Indonesia.
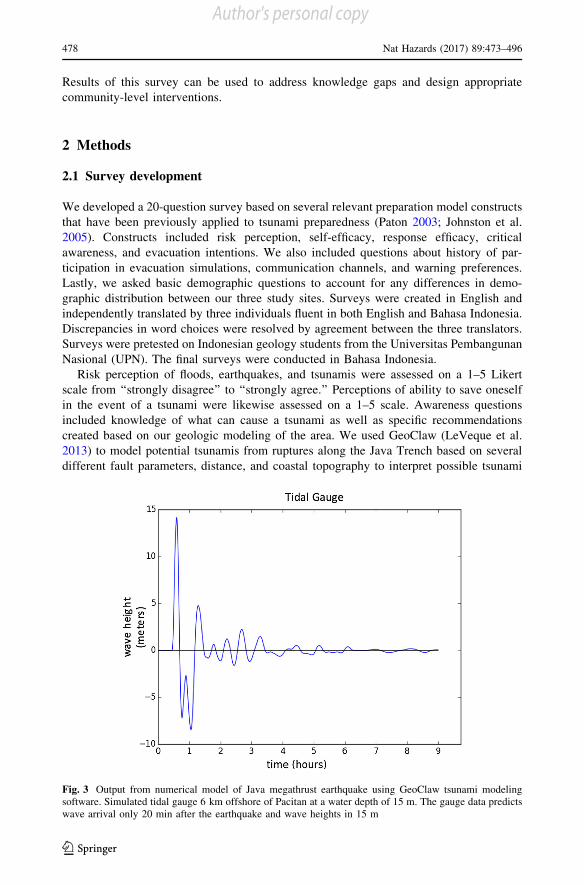
Risk perception of floods, earthquakes, and tsunamis were assessed on a 1–5 Likertscale from ‘‘strongly disagree’’ to ‘‘strongly agree.’’ Perceptions of ability to save oneselfin the event of a tsunami were likewise assessed on a 1–5 scale. Awareness questionsincluded knowledge of what can cause a tsunami as well as specific recommendationscreated based on our geologic modeling of the area. We used GeoClaw (LeVeque et al.2013) to model potential tsunamis from ruptures along the Java Trench based on severaldifferent fault parameters, distance, and coastal topography to interpret possible tsunami
Fig. 3 Output from numerical model of Java megathrust earthquake using GeoClaw tsunami modelingsoftware. Simulated tidal gauge 6 km offshore of Pacitan at a water depth of 15 m. The gauge data predictswave arrival only 20 min after the earthquake and wave heights in 15 m
478 Nat Hazards (2017) 89:473–496
123
Author's personal copy

arrival times, run-up heights and inundation (Fig. 3). These parameters include the loca-tion, orientation, and extent of the earthquake, and the amount and direction of slip of thefault that produced it. Based on the numerical models of likely tsunami events, we createdsurvey questions to determine baseline perceptions of duration of earthquake shakingbefore evacuation should take place (20 s), length of time to evacuate (20 min), andevacuation height (20 m) or the ‘‘20/20/20 principle.’’ Because duration of continuousshaking correlates with length of rupture and actual earthquake magnitude, and not feltintensity of shaking, we developed questions about what is most important in determiningwhether or not to evacuate (intensity vs. length of shaking). We also developed questionsregarding awareness of how long to stay on high ground after a tsunami occurs (at least 3 hbased on our modeling after a long-duration—20 s or greater—earthquake to avoid anyadditional incoming tsunami waves after the first arrivals). We also assessed awareness ofnatural warning signs, such as the ocean receding.
To assess evacuation intentions, we developed questions such as ‘‘when would youevacuate,’’ ‘‘what would you do if a tsunami was coming,’’ and ‘‘how would you evacu-ate.’’ To gather additional information and aid in future intervention planning, we assessedhistory of participation in tsunami evacuation simulations in each area. We also asked whatinformation sources have previously taught them about tsunamis and how they wouldprefer to be warned in the event of a future tsunami.
2.2 Study participants and site selection
Students at middle (SMP) and high schools (SMA) aged 14–18 (N = 887) were surveyedalong three tsunami-vulnerable coastal towns in Java, Indonesia: Pelabuhan Ratu(N = 326), Pangandaran (N = 323), and Pacitan (N = 238). Surveys were carried out incollaboration with the National Disaster Mitigation Agency (BPBD). Pencil/paper surveyswere distributed during school and individually completed in the classroom.
A total of 372 of the respondents were male (41.9%), 488 were female (55.0%), and 27did not answer (3.0%). All respondents were between 14 and 18 years of age. In total, 842of the respondents (94.9%) identified as Muslim, while 30 respondents (3.4%) did notanswer. Fewer than 1.0% identified in each of the remaining categories including Buddhist,Catholic, Hindu, Protestant, and Other.
The selected locations were cities along the south coast of Java. Each of the threegeographic areas had different backgrounds with the potential to lead to different per-ceptions of risk, efficacy, and knowledge. Pangandaran had experienced a tsunami thatkilled more than 600 people in 2006, while Pelabuhan Ratu and Pacitan had not experi-enced a tsunami in recent memory. Pacitan BPBD had been recognized by the governmentas a model of preparedness and won several disaster resiliency awards. Pelabuhan Ratu,which has had no recent tsunamis and no strong history of governmental tsunami pre-paredness interventions, was selected as a control.
2.3 Statistical analysis
The pen/paper surveys were manually entered into Excel. These data were cleaned anduploaded to SPSS. Pearson’s Chi-square was used to assess differences in sampling dis-tribution across the three geographic areas, and no significant differences (p\ 0.05) werefound. Scale variables were analyzed using one-way ANOVAs to investigate mean dif-ferences in perceptions of threat of natural hazards and tsunami efficacy across geographiclocations. Significant results were probed with Tukey’s Honest Significant Difference
Nat Hazards (2017) 89:473–496 479
123
Author's personal copy

(HSD) tests. Cross-tabulation was used to determine the number of people in each geo-graphic location, along with the total number of people, for each categorical response forall additional questions.
3 Results
3.1 Perceptions of threat and efficacy
Participants in the three survey locations were asked to rate their level of agreement withthe following statements: ‘‘it is likely my community will be affected by a flood/earth-quake/tsunami’’ (1 = strongly disagree, 5 = strongly agree). Overall results indicatedperceptions of flood risk (M = 3.75, SD = 1.04) and earthquake risk (M = 3.86,SD = 0.97), to be lower than perceptions of tsunami risk (M = 4.00, SD = 1.09) withparticipants overall agreeing that they are susceptible to tsunami. The mean for the‘‘control’’ location was lower than those of the other two regions: Pelabuhan Ratu(M = 3.79), Pangandaran (M = 4.03), and Pacitan (M = 4.21). Participants were alsoasked to rate their level of agreement with the statement ‘‘if a tsunami happened, I wouldbe able to save myself’’. The overall mean for all three locations fell between ‘‘neutral’’and ‘‘agree’’ (M = 3.44, SD = 1.11). While Pacitan showed the highest perception of risk,it also showed the lowest perception of efficacy: Pacitan (M = 3.29), Pelabuhan Ratu(M = 3.41), Pangandaran (M = 3.54) (Fig. 4).
3.2 Perceptions of tsunami causes and warning signs
To assess perceptions of possible causes of tsunamis, participants were given the select-all-that-apply question ‘‘what could cause a tsunami?’’ The majority (89.2%) of participantsrecognized that earthquakes could cause tsunamis, and this was consistently high acrosslocations (86.6–92.9%). The next most common responses were ‘‘Will of God’’ (75.3%),volcanic eruption below sea (73.1%), meteorite/asteroid strike into the ocean (56.4%),
1
2
3
4
5
Pelabuhan Ratu Pangandaran Pacitan Total1= S
trong
ly D
isag
ree
- 5 =
Stro
ngly
Agr
ee Perceptions of Threat and Efficacy
Flood Risk Earthquake Risk Tsunami Risk Tsunami Efficacy
Fig. 4 Perceptions of threat and efficacy
480 Nat Hazards (2017) 89:473–496
123
Author's personal copy
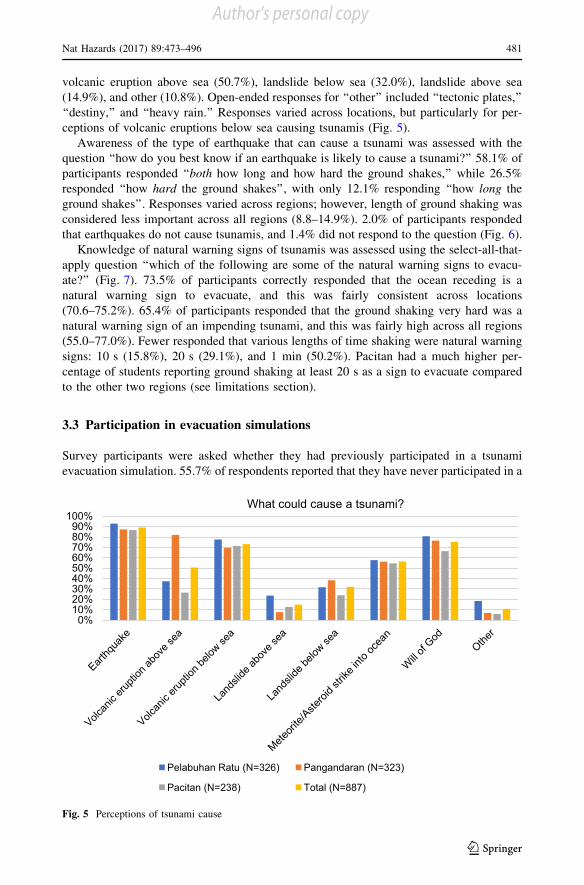
volcanic eruption above sea (50.7%), landslide below sea (32.0%), landslide above sea(14.9%), and other (10.8%). Open-ended responses for ‘‘other’’ included ‘‘tectonic plates,’’‘‘destiny,’’ and ‘‘heavy rain.’’ Responses varied across locations, but particularly for per-ceptions of volcanic eruptions below sea causing tsunamis (Fig. 5).
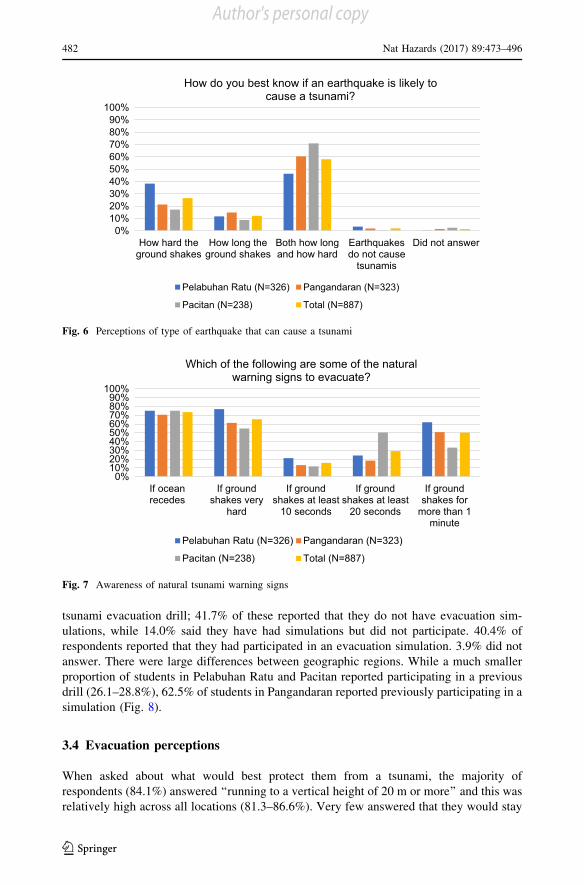
Awareness of the type of earthquake that can cause a tsunami was assessed with thequestion ‘‘how do you best know if an earthquake is likely to cause a tsunami?’’ 58.1% ofparticipants responded ‘‘both how long and how hard the ground shakes,’’ while 26.5%responded ‘‘how hard the ground shakes’’, with only 12.1% responding ‘‘how long theground shakes’’. Responses varied across regions; however, length of ground shaking wasconsidered less important across all regions (8.8–14.9%). 2.0% of participants respondedthat earthquakes do not cause tsunamis, and 1.4% did not respond to the question (Fig. 6).
Knowledge of natural warning signs of tsunamis was assessed using the select-all-that-apply question ‘‘which of the following are some of the natural warning signs to evacu-ate?’’ (Fig. 7). 73.5% of participants correctly responded that the ocean receding is anatural warning sign to evacuate, and this was fairly consistent across locations(70.6–75.2%). 65.4% of participants responded that the ground shaking very hard was anatural warning sign of an impending tsunami, and this was fairly high across all regions(55.0–77.0%). Fewer responded that various lengths of time shaking were natural warningsigns: 10 s (15.8%), 20 s (29.1%), and 1 min (50.2%). Pacitan had a much higher per-centage of students reporting ground shaking at least 20 s as a sign to evacuate comparedto the other two regions (see limitations section).
3.3 Participation in evacuation simulations
Survey participants were asked whether they had previously participated in a tsunamievacuation simulation. 55.7% of respondents reported that they have never participated in a
0%10%20%30%40%50%60%70%80%90%
100%What could cause a tsunami?
Pelabuhan Ratu (N=326) Pangandaran (N=323)
Pacitan (N=238) Total (N=887)
Fig. 5 Perceptions of tsunami cause
Nat Hazards (2017) 89:473–496 481
123
Author's personal copy
tsunami evacuation drill; 41.7% of these reported that they do not have evacuation sim-ulations, while 14.0% said they have had simulations but did not participate. 40.4% ofrespondents reported that they had participated in an evacuation simulation. 3.9% did notanswer. There were large differences between geographic regions. While a much smallerproportion of students in Pelabuhan Ratu and Pacitan reported participating in a previousdrill (26.1–28.8%), 62.5% of students in Pangandaran reported previously participating in asimulation (Fig. 8).
3.4 Evacuation perceptions
When asked about what would best protect them from a tsunami, the majority ofrespondents (84.1%) answered ‘‘running to a vertical height of 20 m or more’’ and this wasrelatively high across all locations (81.3–86.6%). Very few answered that they would stay
0%10%20%30%40%50%60%70%80%90%
100%
How hard theground shakes
How long theground shakes
Both how longand how hard
Earthquakesdo not cause
tsunamis
Did not answer
How do you best know if an earthquake is likely to cause a tsunami?
Pelabuhan Ratu (N=326) Pangandaran (N=323)
Pacitan (N=238) Total (N=887)
Fig. 6 Perceptions of type of earthquake that can cause a tsunami
0%10%20%30%40%50%60%70%80%90%
100%
If oceanrecedes
If groundshakes very
hard
If groundshakes at least
10 seconds
If groundshakes at least
20 seconds
If groundshakes for
more than 1minute
Which of the following are some of the natural warning signs to evacuate?
Pelabuhan Ratu (N=326) Pangandaran (N=323)
Pacitan (N=238) Total (N=887)
Fig. 7 Awareness of natural tsunami warning signs
482 Nat Hazards (2017) 89:473–496
123
Author's personal copy

where they were (0.3%) or that there was nothing they could to do protect themselves(2.6%). However, 9.1% of respondents answered that ‘‘running inland 20 m or more’’would best protect them from a tsunami (Fig. 9). It should be noted that this question wasdesigned for selection of only one response; however, 3.5% of participants selectedmultiple responses (the majority of these selected both inland and vertical). These par-ticipants (N = 29) were dropped from the analysis for this question only.
To assess perceptions of the evacuation window, respondents were asked ‘‘about howlong would you have to evacuate from the time the earth starts shaking until the time thewave hits?’’ While 13.9% thought they had only 5 min and 39.6% said they had 20 min,42.2% of respondents thought they had an hour or more to evacuate (Fig. 10). More thantwice the proportion of people located in Pacitan (67.6%) answered 20 min as the amountof time they had to evacuate compared to Pelabuhan Ratu (27.9%) and Pangandaran(30.7%) (see limitations section).
0%10%20%30%40%50%60%70%80%90%
100%
Never, do not havedrills
Never, but havehad drills
Yes, I haveparticipated
No answer
Have you participated in a tsunami evacuation simulation?
Pelabuhan Ratu (N=326) Pangandaran (N=323)
Pacitan, (N=238) Total (N=887)
Fig. 8 Participation in previous tsunami evacuation simulations
0%10%20%30%40%50%60%70%80%90%
100%
Running inland20 meters or
more
Running to avertical height
of 20 meters ormore
Staying where Iam
There isnothing I cando to protect
myself
No answer
What would best protect you from a tsunami?
Pelabuhan Ratu (N=315) Pangandaran (N=311)
Pacitan, (N=232) Total (N=858)
Fig. 9 Perceptions of where to go for evacuation
Nat Hazards (2017) 89:473–496 483
123
Author's personal copy

Participants were asked ‘‘after a tsunami happens, how long should I wait before I gohome?’’ 69.4% of participants answered correctly with 3 h or more, while 14.3, 8.0, and3.3% responded 1 h, 20 min, and 5 min, respectively (Fig. 11).
3.5 Evacuation intentions
To assess participant evacuation intentions, we asked ‘‘when would you evacuate?’’ Themost common responses were ‘‘an alert or order of the authorities to evacuate’’ (85.0%),‘‘if I saw natural warning signs’’ (76.4%), ‘‘if I saw that other people were evacuating’’(43.9%), and ‘‘information from family or friend’’ (37.7%). Few students (2.9%) reportedthat they would not evacuate (Fig. 12).
0%10%20%30%40%50%60%70%80%90%
100%
5 minutes 20 minutes 1 hour 2 hours 3 or morehours
No answer
About how long would you have to evacuate from the time the earth starts shaking until the time the
wave hits?
Pelabuhan Ratu (N=326) Pangandaran (N=323)
Pacitan, (N=238) Total (N=887)
Fig. 10 Evacuation window perceptions
0%10%20%30%40%50%60%70%80%90%
100%
5 minutes 20 minutes 1 hour 3 hours ormore
No answer
After a tsunami happens, how long should I wait before I go home?
Pelabuhan Ratu (N=326) Pangandaran (N=323)
Pacitan, (N=238) Total (N=887)
Fig. 11 Perceptions of how long to stay on high ground after a tsunami wave hits
484 Nat Hazards (2017) 89:473–496
123
Author's personal copy

To assess more specific evacuation intentions, participants were asked ‘‘what would youdo if a tsunami was coming?’’ The majority of respondents (93.5%) responded that theywould go up a hill or mountain. The next most common response was evacuating inland(84.9%) and climbing up stairs of a tall building (23.8%). Fewer participants answered gotoward the ocean (2.4%), stay inside (1.6%), or other (9.8%) (Fig. 13). ‘‘Other’’ responses,in order of most to least common, were ‘‘climb a tree,’’ ‘‘evacuate from the shore/ocean,’’‘‘run,’’ ‘‘pray,’’ ‘‘helicopter,’’ ‘‘get on the roof,’’ ‘‘prepare a life vest,’’ and ‘‘mosque.’’
Participants were asked how they would evacuate if a tsunami was coming. Themajority of participants reported that they would evacuate by foot (34.5%) or motorcycle(34.5%). Fewer reported that they would evacuate by car (13.6%), that they would notevacuate (6.3%), or other (21.8%) (Fig. 14). The vast majority of ‘‘other’’ responses were
0%10%20%30%40%50%60%70%80%90%
100%
An alert ororder of the
authorities toevacuate
Informationfrom family or
friend
If I saw thatother people
wereevacuating
If I saw naturalwarning signs
I would notevacuate
When would you evacuate?
Pelabuhan Ratu (N=326) Pangandaran (N=323)
Pacitan (N=238) Total (N=887)
Fig. 12 Participant’s intentions of actions to take in the event of a tsunami
0%10%20%30%40%50%60%70%80%90%
100%
Climb upstairs of a
tall building
Go up a hillor mountain
Go towardthe ocean
Go inland Stay inside Other
What would you do if a tsunami was coming? Select as many as you want.
Pelabuhan Ratu (N=326)Pangandaran (N=323)
Pacitan (N=238)
Fig. 13 Participant’s reports of under what conditions they would intend to evacuate
Nat Hazards (2017) 89:473–496 485
123
Author's personal copy

‘‘run,’’ ‘‘run quickly,’’ or ‘‘evacuate.’’ Additional ‘‘other’’ responses included ‘‘any type oftransportation,’’ ‘‘helicopter,’’ ‘‘airplane,’’ and ‘‘mosque.’’
3.6 Communication channels
Students were asked to select sources from which they had learned about tsunamis.Overall, the largest portion of students reported learning about tsunamis in school (71.5%).Over half of the participants reported learning about tsunamis through TV or radio (55.1%)and Internet (52.2%) with the next most popular communication channel being socialmedia (42.7%). More than one-third of participants reported hearing about tsunamisthrough family (37.4%) and the BPBD (34.3%). The least reported communicationchannels were friends (15.9%), personal experience (13.2%), neighbors (8.0%), and other(6.0%) (Fig. 15).
0%10%20%30%40%50%60%70%80%90%
100%
I would notevacuate
By foot By motorcycle By car Other
How would you evacuate if a tsunami was coming?
Pelabuhan Ratu (N=326) Pangandaran (N=323)
Pacitan (N=238) Total (N=887)
Fig. 14 Intentions to use various evacuation transportation methods in the event of a tsunami
0%10%20%30%40%50%60%70%80%90%
100%
Where have you learned about tsunamis? Select all that apply.
Pelabuhan Ratu (N=326) Pangandaran (N=323)
Pacitan (N=238) Total (N=887)
Fig. 15 Sources of tsunami-related information
486 Nat Hazards (2017) 89:473–496
123
Author's personal copy

In line with our site selection criteria, more participants reported learning about tsu-namis from personal experience in Pangandaran (22.9%) compared to Pelabuhan Ratu(8.0%) and Pacitan (7.1%). Similarly, more students in Pangandaran reported hearingabout tsunamis from their family (41.2% in Pangandaran; 35.3% in the other two loca-tions). Again in line with our selection criteria, more students reported hearing abouttsunamis from the BPBD in Pacitan (66.8%) compared to Pelabuhan Ratu (18.1%) andPangandaran (26.6%). A higher percentage of students in Pacitan also reported TV/radio,Internet, and Social Media as communication sources.
3.7 Warning preferences
Participants were asked ‘‘how would you most like to be warned about a tsunami that iscoming?’’ The preferred warning method was through a siren (47.8%). This was followedby TV (22.4%) and self-observing natural warning signs (21.4%). Radio (12.4%), personalcell phone warning (11.5%), local leader (8.9%), and other (4.5%) were lesser preferredmethods (Fig. 16). ‘‘Other’’ responses included ‘‘government’’ and ‘‘observing ocean.’’
4 Discussion
4.1 Perceptions of risk and efficacy
The majority of participants reported that they believed they are at risk of a tsunami.Participants in the ‘‘control’’ region (Pelabuhan Ratu) had a lower perceived risk of tsu-nami than those in Pangandaran and Pacitan. Personal experience with tsunami in Pan-gandaran and disaster education measures in Pacitan likely heightened perceived risk oftsunami. However, Pacitan participants had the lowest perceived efficacy, despite being themodel city of preparedness. Our results are in line with a New Zealand study that showedpublic education campaigns resulting in a high awareness of risk but low levels of pre-paredness (Johnston et al. 2013). The authors concluded that risk perception does not
0%10%20%30%40%50%60%70%80%90%
100%
Localleader
Personalcell phonewarning
Radio Siren (Self)Observing
naturalwarning
signs
TV Other
How would you most like to be warned about tsunami that is coming?
Pelabuhan Ratu (N=326) Pangandaran (N=323)
Pacitan, (N=238) Total (N=887)
Fig. 16 Preferred tsunami warning method
Nat Hazards (2017) 89:473–496 487
123
Author's personal copy

usually link directly with preparedness. Our results similarly suggest that tsunamiawareness interventions should include, at the very least, confidence-building componentsof self-efficacy and response efficacy. Citizens must not only believe they are at risk of adeadly tsunami, but also that they are able to save themselves and that suggested evacu-ation protocols will effectively spare them.
4.2 Perceptions of tsunami causes and warning signs
There was a high level of knowledge among participants regarding earthquakes as a sourceof tsunamis (89.2%) and the ocean receding (73.5%) as a sign of an impending tsunami.‘‘Will of God’’ was the second most popularly selected answer after earthquakes inresponse to what could cause a tsunami. Most people surveyed did not view landslides asbeing able to cause a tsunami (under sea 32.0%, above sea 14.9%). Although volcanoesand landslides could cause localized tsunamis in the region, a further-reaching, regionaltsunami is most likely to result from an earthquake, and participants overall were aware ofthe link.
A key finding with significant implications is that survey participants believed that theymust feel intense shaking for an earthquake to cause a tsunami. The most recent earth-quakes in Java that generated tsunamis (1994 and 2006) were slow-rupture events (Fujiiand Satake 2006), which do not produce intense shaking but do produce larger thanexpected tsunamis. In some cities with hundreds of fatalities these earthquakes were barelyfelt. Only 12.1% of our sample believed that the length of shaking was most important indetermining if a tsunami may come, and 84.6% believed the ground had to be shaking hardor both long and hard to cause a tsunami. To prevent loss of life, educational interventionsshould emphasize that earthquakes do not have to feel strong or dramatic to cause atsunami, and that evacuation should take place if the earth shakes for 20 s or more,regardless of the strength of the shaking.
4.3 Reported evacuation simulation history
The percentage of people who have participated in evacuation simulations differed sig-nificantly between regions. In a location where a tsunami had occurred in recent memory(Pangandaran), more people reported participating in simulations (62.5 vs. 26.1 and28.8%). Over half of participants in Pelabuhan Ratu and Pacitan reported that they do nothave simulations. Even though a higher proportion of students in Pangandaran reportedparticipating in simulations, these students were no more aware of other recommendedevacuation protocols (such as evacuating within 20 min, that weak earthquakes can causetsunamis, and staying on high ground for 3 h or more) when compared to the otherlocations.
These results suggests that although participation in simulations may allow students toknow where to evacuate, the simulations have not improved knowledge of under whatcircumstances they should evacuate and other vital warnings signs and recommendedbehaviors. Education is more important than experience with regard to knowledge oftsunami evacuation recommendations. Our findings suggest that there is a need forevacuation simulations; however, it is vital these simulations are combined with educationabout other tsunami warning signs and evacuation recommendations (e.g., 20/20/20principle, weak earthquakes can cause tsunamis, stay on high ground for 3 h or more afterthe first wave hits).
488 Nat Hazards (2017) 89:473–496
123
Author's personal copy

4.4 Evacuation protocol perceptions
An encouraging finding was that when participants were asked what would best protectthem from a tsunami, the vast majority chose vertical evacuation over running inland orother options. This result indicates a high level of knowledge of where to go to evacuateamong our study participants. However, although the majority of students were aware theyneed to evacuate to high ground, one key finding with significant implications is thatalmost 42.2% of participants believed they would have an hour or more to evacuate; morethan 20% believed they would have 3 h or more to evacuate.
Our reported pre-intervention knowledge levels of the suggested evacuation window(20 min) were inflated in Pacitan because our 20/20/20 intervention travelled ahead of usthrough word-of-mouth. Results for baseline knowledge of the suggested 20-min evacu-ation window in Pacitan are likely much too high. A truer reflection of baseline knowledgeis likely closer to the baseline knowledge level of respondents from our first two sites. Inthese two locations, 53.3% (Pelabuhan Ratu) and 50.5% (Pangandaran) thought they hadan hour or more to evacuate. Teaching the 20/20/20 principle is needed as an educationalintervention to alert people that they have less time to evacuate than they think in order tobest protect themselves from a tsunami. Our confounded baseline data in Pacitan suggeststhat the 20/20/20 intervention does indeed improve knowledge about the suggested tsunamievacuation windows.
Although nearly 70% of participants stated that they should wait for 3 h or more beforereturning home after a tsunami wave, there is still room to improve the 30% who did notrespond that they should wait for 3 h or more. Geoscientists should work with the localBPBD organizations and communities to establish evacuation protocols based on geologicmodeling, and disaster mitigation specialists should work with locals to effectively dis-seminate these protocols to the general public.
4.5 Evacuation intentions
Most individuals (85.0%) surveyed responded that they would evacuate due to an order/alert from the authorities, while fewer reported that they would evacuate if they observednatural warning signs (76.4%). Although a relatively high percentage reported they wouldevacuate based on natural warning signs, our data indicate that natural warning signs arenot well understood. While the majority (73.5%) of participants indicated that theybelieved a receding ocean indicated an approaching tsunami, if these individuals are notnear the ocean prior to the tsunami event, or the tsunami happens at night, they are unlikelyto observe the warning sign. Furthermore, respondents overall believed there had to bestrong or dramatic shaking for an earthquake to cause a tsunami. Experiencing a long butweak earthquake is unlikely to prompt self-evacuation. Increased communication andeducation are required to provide increased knowledge of natural warning signs to com-munity members and encourage self-evacuation.
While the majority of people knew that they should go uphill if a tsunami was coming,about 85% also believed that going inland would help them, which may not be the case ifthey do not gain vertical ground as well. However, the majority of respondents chosevertical over inland when asked what would best protect them (84.1%) over inland (9.1%).Vertical evacuation in buildings was not generally viewed as an option and varied widelyby region (e.g., 9.2% in Pacitan vs. 31.9% Pelabuhan Ratu). Educational interventionsshould stress that vertical evacuation is more important than going inland or simply away
Nat Hazards (2017) 89:473–496 489
123
Author's personal copy

from the shore. More research is needed on perceptions and knowledge of vertical evac-uation shelters.
Evacuation by foot or motorcycle was the most common evacuation intention. Althoughthis is often encouraged in order to avoid unnecessary deaths due to traffic jams, it shouldbe noted that our sample consisted of junior high and high school students who may notdrive or own a car. More research is required to address what transportation methods adultsin Java intend to use for tsunami evacuation.
4.6 Communication channels
‘‘School’’ (71.5%) was reported as the most common communication channel from whichstudents have learned about tsunamis, suggesting that tsunami education for youth is apriority on the island of Java. These data may indicate that older adults (especially thosewho attended school prior to 2004) may not be as educated about tsunamis as the youth.However, TV and radio, which are generally more available to a broader demographic,were also reported as common channels (55.1%). The Internet (52.2%) and Social Media(42.7%) were also frequently reported as sources of information. Indonesia is ‘‘one of thehighest users of mobile technology and social networking’’ (Beger et al. 2012, p. 4). Inregard to technology and social media use, adolescents and youth are the two top groups ofconsumers (Beger et al. 2012). For those on the island of Java, TV and radio, Internet, andsocial media alerts have the potential to effectively reach this population.
Word-of-mouth channels such as family (37.4%), friends (15.9%), and neighbors(8.0%), were less commonly reported. Students in Pangandaran were approximately threetimes as likely to report personal experience as a source of knowledge; however, sincethese individuals did not perform better on critical awareness questions, this suggests thateducation is more important than experience with regard to disaster mitigation.
The most notable difference in communication channels between cities was the per-centage of students that reported learning about tsunamis through the government disastermitigation agency (BPBD) (66.8% in Pacitan, 26.6% in Pangandaran, and 18.1% inPelabuhan Ratu). Pacitan BPBD was a large factor in our 20/20/20 intervention travellingahead of us by word-of-mouth, which was reflected by significantly increased studentknowledge of evacuation window times. This evidence suggests that local political will isan important factor in improving critical awareness of tsunamis and evacuation protocols.
Pacitan also showed a higher percentage of students who reported learning about tsu-namis through channels such as TV or radio, Internet, and social media. In contrast,students in Pelabuhan Ratu were less likely to report hearing about tsunamis from socialmedia, Internet, TV or radio, compared to the other study sites. These data suggest regionaldifferences in exposure to tsunami-related information. Interventions should take advan-tage of communication channels such as TV, radio, Internet, and social media to increasetsunami preparedness communication. In addition, it may be advantageous to identify andwork with schools and local BPBD organizations that show a commitment to tsunamieducation.
4.7 Warning preferences
The majority of participants responded that they would prefer to be warned of animpending tsunami through a siren (47.8%). In contrast, fewer than half as many (21.4%)selected ‘‘self-observing natural warning signs.’’ This is problematic considering the lackof reliability that sirens have had in this area in the past. Issues such as sirens sounding too
490 Nat Hazards (2017) 89:473–496
123
Author's personal copy

late, ending too early, or not sounding at all during a tsunami have and could result infurther loss of life if local communities rely on these federal government initiatives toinitiate evacuation. Outside interventions aimed at shifting local tsunami warning prefer-ences away from federal warning and toward self-observation may prove difficult con-sidering cultural clashes between ‘‘Western’’ individualistic cultures and the culturallyhierarchical Java (Irawanto 2011). Only 8.9% of survey respondents selected ‘‘localleaders’’ as a warning preference, and our informal interviews with local leaders found thatthey do not want the responsibility or accountability of warning their communities. Oneconcern of local leaders was that if they urge community evacuation based on naturalwarning signs and a tsunami does not come, they will ‘‘lose trust’’ of individuals withintheir community. It is unlikely that a widespread initiative training local communityleaders will significantly improve tsunami evacuation. However, interventions workingwith local preparedness initiatives and committed local BPBD organizations may beuseful.
5 Conclusions and recommendations
Our surveys indicate that adolescents on tsunami-vulnerable coastal areas of Java alreadybelieve there is a high risk of tsunami, but perceptions of efficacy with regard to tsunamievacuation could be improved. Overall, students who associate tsunamis with earthquakesand tectonic plates know that a receding ocean is a sign of an impending tsunami, andbelieve vertical evacuation is more important than inland evacuation.
However, several knowledge gaps exist, such as misconceptions regarding the type ofearthquake that can cause a tsunami (e.g., the belief that shaking has to feel strong ordramatic), that the time of shaking is relatively unimportant, believing that they have moretime to evacuate than the suggested evacuation window (20 min), and not knowing theyshould remain on high ground for 3 h or more after a wave hits. Additionally, the pref-erence for being warned by sirens rather than observing natural warning signs is a chal-lenging issue that must be addressed by working alongside locals and in culturally sensitiveways.
Our data showed regional differences in evacuation simulation history, personalexperience with tsunamis, and the local BPBD as a source of tsunami education infor-mation. However, neither participation in evacuation simulations nor personal experiencewith tsunamis translated to increased knowledge of when or how to evacuate. We arguethat education is more important than experience with regard to tsunami readiness. There isopportunity to more effectively disseminate information addressing tsunami preparednessthrough TV, radio, Internet, and Social Media.
We conclude that evacuation simulations, coupled with education on the 20/20/20principle, be implemented throughout Java in partnership with local disaster mitigationagencies. In addition, short messages stressing that even weak earthquakes can causetsunamis should be communicated through a variety of channels, as this is a misunderstoodbut critically important component of information with regard to self-evacuation. Inter-ventions should take care when using educational material showing dramatic or strongearthquakes when discussing the relationship between earthquakes and tsunamis, ascommunity members may interpret this as a prerequisite for a tsunami, which could lead todecreased intentions to evacuate if the earthquake is not strong. In addition, education
Nat Hazards (2017) 89:473–496 491
123
Author's personal copy

measures should provide awareness of how a tsunami might look as it approaches shore inorder to correct misconceptions.
6 Limitations
There are several limitations to our preparedness assessment. First, the assessment wasconducted among youth aged 14–18 and should not be more broadly applied to the generalpopulation of Java. Since school was the most frequently reported source for tsunami-related information among our study population, it is likely that the general adult popu-lation is less knowledgeable than this sample suggests. Further assessment is required atthe community level for intervention programs aimed at the general population. Further-more, our study population may have been too young to fully realize the devastation of the2004 Indian Ocean tsunami or 2006 Pangandaran tsunami. However, our data is useful forplanning tsunami preparedness interventions among at-risk adolescents in Java. Addi-tionally, this assessment reveals knowledge gaps about preparedness that do not appear tobe taught in school or received from other communication channels that can be used toplan future community-level interventions.
Some questions in our study were confounded because our 20/20/20 intervention fol-lowing our assessments in each city travelled ahead of us via word-of-mouth. Althoughdata from Pelabuhan Ratu and Pangandaran accurately reflect baseline knowledge, thePacitan data are confounded in some instances due to word-of-mouth education throughlocal government organizations, school headmasters, and community leaders. Severalresults showed heightened knowledge of the 20/20/20 principle in Pacitan compared to theother locations. For example, a much higher percentage of students in Pacitan (67.6%)answered ‘‘20 min’’ as the amount of time they had to evacuate compared to PelabuhanRatu (27.9%) and Pangandaran (30.7%). Judging by the relative consistency between theother two locations, it is likely that overall baseline data perceptions of length of time toevacuate are lower than that suggested by our combined percentage of all three locationsand closer to the percentages suggested by Pelabuhan Ratu and Pangandaran. This suggeststhat there is even more need for intervention than our overall results demonstrate. Althoughthis is a data limitation, it is encouraging that the 20/20/20 principle spread via word-of-mouth so quickly and improved knowledge of several tsunami evacuation principles sodrastically.
Finally, while educational efforts are invaluable in disaster mitigation, education aloneis not the only solution. Evacuation behaviors are determined not only by knowledgelevels, but also by response capability influenced by geography and infrastructure, popu-lation demographics, and policy and planning. Geography and infrastructure, such as landcover, slope, population density, access to transportation networks, evacuation bottlenecks,and density of critical facilities (e.g., primary schools, hospitals), influence responsecapability (Løvholt et al. 2014; Post et al. 2009). Particularly, vulnerable groups includewomen, children, the elderly, low-income groups, individuals with disabilities and specialneeds, and people living near the coast (Løvholt et al. 2014; Sullivan and Hakkinen 2006).Policy and planning influence tsunami resilience through preparedness, relief, and recoveryplanning (e.g., community preparedness plan, risk maps, medical help planning). Otherpolicy efforts such as flood defenses, land use planning, decreasing settlements close to thesea, and creating building and home standards are important (Esteban et al. 2013). Aholistic approach to tsunami disaster mitigation efforts should include working with local
492 Nat Hazards (2017) 89:473–496
123
Author's personal copy

organizations to address these factors, in addition to providing educational assessments,interventions, and evaluation.
Acknowledgement Funding was provided by Utah Valley University (Grant No. GEL Grant 629).
Appendix
See Table 1.
Table 1 Survey Results
Survey results (N) (%) Pel. Ratu(N = 326)
Pangandaran(N = 323)
Pacitan(N = 238)
Total(N = 887)
What could cause a tsunami?
Earthquake 303: 92.9% 282: 87.3% 206: 86.6% 791: 89.2%
Volcanic eruption above sea 122: 37.4% 265: 82.0% 63: 26.5% 450: 50.7%
Volcanic eruption below sea 253: 77.6% 225: 69.7% 170: 71.4% 648: 73.1%
Landslide above sea 77: 23.6% 25: 7.7% 30:12.6% 132: 14.9%
Landslide below sea 103: 31.6% 124: 38.4% 57: 23.9% 284: 32.0%
Meteorite/Asteroid strike intoocean
188: 57.7% 182: 56.3% 130: 54.6% 500: 56.4%
Will of God 263: 80.7% 247: 76.5% 158: 66.4% 668: 75.3%
Other 60: 18.4% 22: 6.8% 14: 5.9% 96: 10.8%
How do you best know if an earthquake is likely to cause a tsunami?
How hard the ground shakes 125: 38.3% 69: 21.4% 41: 17.2% 235: 26.5%
How long the ground shakes 38: 11.7% 48: 14.9% 21: 8.8% 107: 12.1%
Both how long and how hard 151: 46.3% 195: 60.4% 169: 71.0% 515: 58.1%
Earthquakes do not causetsunamis
11: 3.4% 6: 1.9% 1: 0.4% 18: 2.0%
Did not answer 1: 0.3% 5: 1.5% 6: 2.5% 12: 1.4%
Which of the following are some of the natural warning signs to evacuate?
If ocean recedes 245: 75.2% 228: 70.6% 179: 75.2% 652: 73.5%
If ground shakes very hard 251: 77.0% 198: 61.3% 131: 55.0% 580: 65.4%
If ground shakes at least 10 s 69: 21.2% 43:13.3% 28: 11.8% 140: 15.8%
If ground shakes at least 20 s 79: 24.2% 59: 18.3% 120: 50.4% 258: 29.1%
If ground shakes for more than1 min
202: 62.0% 164: 50.8% 79: 33.2% 445: 50.2%
Have you participated in a tsunami evacuation simulation?
Never, do not have drills 182: 55.8% 69: 21.4% 119: 50.0% 370: 41.7%
Never, but have had drills 44: 13.5% 40: 12.4% 40: 16.8% 124: 14.0%
Yes, I have participated 94: 28.8% 202: 62.5% 62: 26.1% 358: 40.4%
No answer 6: 1.8% 12: 3.7% 17: 7.1% 35: 3.9%
What would best protect you from a tsunami?a
Running inland 20 m or more 33: 10.5% 36: 11.6% 9: 3.9% 78: 9.1%
Running to a vertical height of20 m…
256: 81.3% 265: 85.2% 201: 86.6% 722: 84.1%
Nat Hazards (2017) 89:473–496 493
123
Author's personal copy

Table 1 continued
Survey results (N) (%) Pel. Ratu(N = 326)
Pangandaran(N = 323)
Pacitan(N = 238)
Total(N = 887)
Staying where I am 0: 0% 2: 0.6% 1: 0.4% 3: 0.3%
There is nothing I can do toprotect…
20: 6.3% 2: 0.6% 0: 0% 22: 2.6%
No answer 6: 1.9% 6: 1.9% 19: 8.2% 31: 3.6%
About how long would you have to evacuate from the time the earth starts shaking until the time the wavehits?b
5 min 53: 16.3% 47: 14.6% 23: 9.7% 123: 13.9%
20 min 91: 27.9% 99: 30.7% 161: 67.6% 351: 39.6%
1 h 61: 18.7% 51: 15.8% 11: 4.6% 123: 13.9%
2 h 19: 5.8% 38: 11.8% 5: 2.1% 62: 7.0%
3 or more hours 94: 28.8% 74: 22.9% 21: 8.8% 189: 21.3%
No answer 8: 2.5% 14: 4.3% 17: 7.1% 39: 4.4%
After a tsunami happens, how long should you wait before you go home?
5 min 16: 4.9% 10: 3.1% 3: 1.3% 29: 3.3%
20 min 34: 10.4% 24: 7.4% 13: 5.5% 71: 8.0%
1 h 58: 17.8% 40: 12.4% 29: 12.2% 127: 14.3%
3 h or more 209: 64.1% 234: 72.4% 173: 72.7% 616: 69.4%
No answer 9: 2.8% 15: 4.6% 20: 8.4% 44: 5.0%
When would you evacuate? Select all that apply
An alert or order of theauthorities…
270: 82.8% 280: 86.7% 204: 85.7% 754: 85.0%
Information from family orfriend
135: 41.4% 148: 45.8% 51: 21.4% 334: 37.7%
If I saw that other people wereevacuating
159: 48.8% 163: 50.5% 67: 28.2% 389: 43.9%
If I saw natural warning signs 269: 82.5% 229: 70.9% 180: 75.6% 678: 76.4%
I would not evacuate 15: 4.6% 9: 2.8% 2: 0.8% 26: 2.9%
What would you do if a tsunami was coming? Select all that apply
Climb up stairs of a tall building 104: 31.9% 85: 26.3% 22: 9.2% 211: 23.8%
Go up a hill or mountain 306: 93.9% 300: 92.9% 223: 93.7% 829: 93.5%
Go toward the ocean 7: 2.1% 10: 3.1% 4: 1.7% 21: 2.4%
Go inland 277: 85.0% 286: 88.5% 190: 79.8% 753: 84.9%
Stay inside 10: 3.1% 2: 0.6% 2: 0.8% 14: 1.6%
Other 49: 15.0% 22: 6.8% 16: 6.7% 87: 9.8%
How would you evacuate if a tsunami was coming?
I would not evacuate 40: 12.3% 12: 3.7% 4: 1.7% 56: 6.3%
By foot 98: 30.1% 122: 37.8% 86: 36.1% 306: 34.5%
By motorcycle 91: 27.9% 110: 34.1% 105: 44.1% 306: 34.5%
By car 52: 16.0% 30: 9.3% 39: 16.4% 121: 13.6%
Other 91: 27.9% 72: 22.3% 30:12.6% 193: 21.8%
Where have you learned about tsunamis? Select all that apply
Family 115: 35.3% 133: 41.2% 84: 35.3% 332: 37.4%
Friends 47: 14.4% 52: 16.1% 42: 17.6% 141: 15.9%
494 Nat Hazards (2017) 89:473–496
123
Author's personal copy
References
Badan Meteorologi Klimatologi dan Geofisika (2010) Laporan Gempabumi Mentawai, 25 Oktober 2010,p 18
Beger G, Priscillia KH, Akshay S (2012) Indonesian youth online—an exploratory study of the Indonesiandigital landscape. UNICEF New York, Division of Communication, Social and Civic Media Section
Cox D (2001) The inappropriate tsunami icon. Sci Tsunami HazardsDash N, Gladwin H (2007) Evacuation decision making and behavioral responses: individual and household.
Nat Hazards Rev 8(3):69–77. doi:10.1061/(asce)1527-6988Edberg M (2013) Essentials of health behavior. Jones & Bartlett PublishersEsteban M, Tsimopoulou V, Mikami T, Yun NY, Suppasri A, Shibayama T (2013) Recent tsunamis events
and preparedness: development of tsunami awareness in Indonesia, Chile and Japan. Int J Disaster RiskReduct 5:84–97
Fujii Y, Satake K (2006) Source of the July 2006 west Java tsunami estimated from tide gauge records.Geophys Res Lett. doi:10.1029/2006GL028049
Harris RA (2016) Not that kind of doctor: a story of natural disaster prevention in Indonesia. As EnvironEng Geol (AEG) 59(2):30–36
Harris R, Major J (2016) Waves of destruction in the East Indies: the Wichmann catalogue of earthquakesand tsunami in the Indonesian region from 1538 to 1877. In: Cummins PR, Meilano I (eds) Geohazardsin Indonesia: earth science for disaster risk reduction. Geological Society, London, Special Publica-tions, pp 441. doi:10.1144/SP441.2
Harris RA, Prasetyadi C (2002) Who’s next? Assessing vulnerability to geophysical hazards in denselypopulated regions of Indonesia. Bridges 2:14–17. doi:10.1144/SP441.2
Irawanto DW (2011) An analysis of national culture and leadership practices in Indonesia. J Divers Manag(JDM) 4(2):41–48
Table 1 continued
Survey results (N) (%) Pel. Ratu(N = 326)
Pangandaran(N = 323)
Pacitan(N = 238)
Total(N = 887)
School 245: 75.2% 239: 74.0% 150: 63.0% 634: 71.5%
BPBD 59: 18.1% 86: 26.6% 159: 66.8% 304: 34.3%
TV or Radio 157: 48.2% 182: 56.3% 150: 63.0% 489: 55.1%
Internet 137: 42.0% 165: 51.1% 161: 67.6% 463: 52.2%
Personal experience 26: 8.0% 74: 22.9% 17: 7.1% 117: 13.2%
Neighbors 20: 6.1% 32: 1.0% 19: 7.9% 71: 8.0%
Social Media 121: 37.1% 133: 41.2% 125: 52.5% 379: 42.7%
Other 24: 7.4% 21: 6.5% 8: 3.4% 53: 6.0%
How would you most like to be warned about tsunami that is coming?
Local leader 32: 9.8% 17: 5.3% 30: 12.6% 79: 8.9%
Personal cell phone warning 43: 13.2% 24: 7.4% 35: 14.7% 102: 11.5%
Radio 49: 15.0% 29: 9.0% 32: 13.4% 110: 12.4%
Siren 82: 25.2% 180: 55.7% 162: 68.1% 424: 47.8%
(Self) Observing natural warningsigns
88: 27.0% 47: 14.6% 55: 23.1% 190: 21.4%
TV 102: 31.3% 68: 21.1% 29: 12.2% 199: 22.4%
Other 21: 6.4% 10: 3.1% 9: 3.8% 40: 4.5%
a Twenty-nine participants who selected more than one response were dropped from this question (Pe-labuhan Ratu N = 11, Pangandaran N = 12, Pacitan N = 6). Total N = 856 for this questionb Pacitan numbers are likely inflated due to our 20/20/20 intervention travelling ahead of us. Baselineknowledge levels are better reflected in the Pelabuhan Ratu and Pangandaran data
Nat Hazards (2017) 89:473–496 495
123
Author's personal copy

Johnston D, Paton D, Crawford GL, Ronan K, Houghton B, Burgelt P (2005) Measuring tsunami pre-paredness in coastal Washington, United States. Nat Hazards 35:173–184. doi:10.1007/1-4020-3607-8_12
Johnston D, Becker J, McClure J, Paton D, McBride S, Wright K, Leonard G, Hughes M (2013) Communityunderstanding of, and preparedness for, earthquake and tsunami risk in Wellington, New Zealand. In:Joffe H, Rosetto T, Adams J (eds) Cities at risk: living with perils in the 21st century. Springer,Netherlands, pp 131–148
Lauterjung J, Munch U, Rudloff A (2010) The challenge of installing a tsunami early warning system in thevicinity of the Sunda Arc, Indonesia. Nat Hazards Earth Syst Sci 10:641–646. doi:10.5194/nhess-10-641-2010
Lay T, Kanamori H, Ammon C, Nettles M, Ward S, Aster R, Beck S, Bilek S, Brudzinski M, Butler R,Deshon H, Ekstrom G, Satake K, Sipkin S (2005) The great Sumatra-Andaman earthquake of 26December 2004. Science 308:1127–1133
LeVeque RJ, Berger MJ et al (2013) Clawpack software 4.6.3. www.clawpack.org. Mar 26, 2013Løvholt F, Setiadi NJ, Birkmann J, Harbitz CB, Bach C, Fernando N, Kaiser G, Nadim F (2014) Tsunami
risk reduction—Are we better prepared today than in 2004? Int J Disaster Risk Sci 10(A):127–142Mimura N, Yasuhara K, Kawagoe S et al (2011) Damage from the great East Japan earthquake and
tsunami—a quick report. Mitig Adapt Strateg Glob Change 16:803–818. doi:10.1007/s11027-011-9297-7
Newcomb KR, McCann WR (1987) Seismic history and seismotectonics of the Sunda Arc. J Geophys Res92(B1):421–439. doi:10.1029/JB092iB01p00421
Ortiz M, Bilham R (2003) Source area and rupture parameters of the 31 December 1881 Mw = 7.9 CarNicobar earthquake estimated from tsunamis recorded in the Bay of Bengal. J Geophys Res. doi:10.1029/2002JB001941
Pararas-Carayannis G (2003) Near and far-field effects of tsunamis generated by the paroxysmal eruptions,explosions, caldera collapses and massive slope failures of the Krakatau volcano in Indonesia onAugust 26–27, 1883. Sci Tsunami Hazards 21:191–211
Paton D (2003) Disaster preparedness: a social-cognitive perspective. Disaster Prev Manag Int J12(3):210–216. doi:10.1108/09653563310489686
Post J, Wegscheider S, Muck M, Zosseder K, Kiefl R, Steinmetz T, Strunz G (2009) Assessment of humanimmediate response capability related to tsunami threats in Indonesia at a sub-national scale. NatHazards Earth Syst Sci 9(4):1075–1086
Sorooshian S (2005) Meeting the challenges of natural hazards in the wake of the tsunami disaster. EOSTrans AGU 86(2):14. doi:10.1029/2005EO020005
Spahn H, Hoppe M, Vidiarina HD, Usdianto B (2010) Experience from three years of local capacitydevelopment for tsunami early warning in Indonesia: challenges, lessons and the way ahead. NatHazards Earth Syst Sci 10(7):1411–1429. doi:10.5194/nhess-10-1411-2010
Strunz G, Post J, Zosseder K, Wegscheider S, Muck M, Riedlinger T, Mehl H, Dech S, Birkmann J, GebertN, Harjono H, Anwar HZ, Sumaryono G, Khomarudin RM, Muhari A (2011) Tsunami risk assessmentin Indonesia. Nat Hazards Earth Syst Sci 11:67–82
Sullivan HT, Hakkinen MT (2006) Disaster preparedness for vulnerable populations: determining effectivestrategies for communicating risk, warning, and response. In: Third annual Magrann research con-ference at Rutgers University, vol 4, pp 21-04
Suppasri A, Goto K, Muhari A, Ranasinghe P, Riyaz M, Affan M et al (2015) A decade after the 2004 IndianOcean tsunami: the progress in disaster preparedness and future challenges in Indonesia, Sri Lanka,Thailand and the Maldives. Pure appl Geophys 172(12):3313–3341. doi:10.1007/s00024-015-1134-6
Wichmann CEA (1918) Die Erdbeben des Indishen Archipels Bis Zum Johpe 1857, (in Dutch), Koninkl.Nederlandse Akad. Wetensch. Verh. 2nd Sect. 20, p 193
Wichmann CEA (1922) Die Erdbeben des Indischen Archipels von 1858 bis 1877, (in Dutch) Amsterdam:Konink. Nederlandse Akad. Wetensch. Verh. 2nd Sect. 22, p 209
496 Nat Hazards (2017) 89:473–496
123
Author's personal copy