Sara Maria de Jesus Freitas Rocha DIFFERENTIATION OF ... · Tese para grau de Doutor em Ciências...
112
1 Sara Maria de Jesus Freitas Rocha DIFFERENTIATION OF RETICULATE AND FLANGE INGROWTHS OF MAIZE ENDOSPERM TRANSFER CELLS Tese para grau de Doutor em Ciências Agrárias, Especialização em Biotecnologia. Orientador: Professor Doutor Paulo Ferreira Mendes Monjardino Orientador: Professor Doutor Artur da Câmara Machado Universidade dos Açores Departamento de Ciências Agrárias Centro de Biotecnologia dos Açores Angra do Heroísmo, 2013
-
Upload
nguyendien -
Category
Documents
-
view
216 -
download
0
Transcript of Sara Maria de Jesus Freitas Rocha DIFFERENTIATION OF ... · Tese para grau de Doutor em Ciências...
1
Sara Maria de Jesus Freitas Rocha
DIFFERENTIATION OF RETICULATE AND FLANGE INGROWTHS OF MAIZE ENDOSPERM
TRANSFER CELLS
Tese para grau de Doutor em Ciências Agrárias,
Especialização em Biotecnologia.
Orientador: Professor Doutor Paulo Ferreira Mendes Monjardino
Orientador: Professor Doutor Artur da Câmara Machado
Universidade dos Açores
Departamento de Ciências Agrárias
Centro de Biotecnologia dos Açores
Angra do Heroísmo, 2013
2
AGRADECIMENTOS INSTITUCIONAIS
Ao director do Centro de Biotecnologia dos Açores (CBA),
Professor Doutor Artur da Câmara Machado, agradeço todo
o apoio institucional e logístico.
Ao Professor Doutor Roberto Salema, à Doutora Paula
Sampaio e ao Dr. Rui Fernandes, agradeço o apoio científico
e logístico.
À Fundação para a Ciência e a Tecnologia que financiou este
trabalho através da minha bolsa de doutoramento
SFRH/BD/8122/2002.
À Direcção Regional da Ciência e Tecnologia que financiou
este trabalho pela bolsa BIIC M3.1.6/F/038/2009.
AGRADECIMENTOS
Ao Professor Doutor Paulo Monjardino, meu orientador, que me ensinou com
dedicação parte do que sei, bem como pela disponibilidade, incansável incentivo e
amizade demonstradas ao longo destes anos de trabalho. É um prazer trabalhar
consigo.
Ao Professor Doutor Artur da Câmara Machado, meu orientador, pela possibilidade de
realização do presente trabalho, por todos os meios colocados à disposição e amizade
demonstrada.
Ao Professor Doutor Roberto Salema por ser como um amigo Paternal para mim. A
confiança que depositou em mim ao longo destes anos ajudou-me a crescer como
pessoa e os conhecimentos científicos que me transmitiu foram essenciais à realização
deste trabalho.
À Doutora Paula Sampaio que ajudou a encontrar informações e soluções que em
muito contribuíram para a execução deste estudo.
À Mestre Ana Carolina Tavares pelas muitas horas que passou a dar apoio técnico a
este trabalho na fria sala do microscópio confocal.
Ao Dr. Rui Fernandes pelo apoio técnico e por toda a sua simpatia e boa disposição nas
muitas horas de intenso trabalho no microscópio electrónico de transmissão.
À Doutora Maria Susana Lopes, à Doutora Sílvia Bettencourt e ao Doutor Duarte
Mendonça pela revisão que fizeram a este trabalho.
A todos os meus colegas do Centro de Biotecnologia dos Açores pelo companheirismo
e amizade.

4
Ao Raúl, à Ana, à Catarina, ao Miguel, à Verónica e à família do Professor Doutor Paulo
Monjardino a vossa amizade.
À Sra. D. Guiomar Rosa por ser a minha Mãe Açoriana.

5
Aos meus Pais

6
PARTS OF THIS WORK ARE COMPILED IN THE FOLLOWING PUBLICATION:
Monjardino P, Rocha S, Tavares Ana C., Fernandes R, Sampaio P, Salema R, da Câmara
Machado A. (2013). Development of flange and reticulate wall ingrowths in maize (Zea
mays L.) endosperm transfer cells. Protoplasma 250(2):495-503. doi:10.1007/s00709-
012-0432-4
TABLE OF CONTENTS
TABLE OF CONTENTS
GENERAL ABSTRACT ………………………………………………………………………………………………... 11
RESUMO GERAL ……………………………………………………………………………………………………… 14
GENERAL INTRODUCTION …….…………………………………………………………………………………… 17
References …………………………………………………………….…………………………. 21
CHAPTER I ……………………………………………………………..……………………………………………… 25
1. DEVELOPMENT OF FLANGE AND RETICULATE WALL INGROWTHS IN MAIZE (ZEA MAYS L.)
ENDOSPERM TRANSFER CELLS ………….…………………………………………………………………
26
1.1. ABSTRACT …………………………………………………………………………………………… 26
1.2. INTRODUCTION …………………………………………………….……………………………… 27
1.3. MATERIALS AND METHODS ……………………………………….……………………………. 31
Plant material, growth conditions, and sampling ……………………………… 31
Bright field microscopy ……………………………………….……………………………. 31
Transmission electron microscopy ……………………………………………………. 32
Confocal laser scanning microscopy …………………………………………………. 33
1.4. RESULTS …………………………………………………………………………………………….. 34
Reticulate ingrowths ……………………………………….……………………………….. 34
Flange ingrowths ……………………………………….…………………………………….. 36
1.5. DISCUSSION ………………………………………………………………………………………… 42
1.6. ACKNOWLEDGMENTS ……………………………………….…………………………………… 45
1.7. REFERENCES ………………………………………………………………………………………… 46
TABLE OF CONTENTS
8
CHAPTER II ……………………………………………………………..……………………….…………………… 50
2. CORTICAL MICROTUBULE AND γ-TUBULIN ORGANIZATION PATTERNS OF DEVELOPING
TRANSFER CELLS AND STARCHY CELLS OF MAIZE (ZEA MAYS L.) ENDOSPERM …………………
51
2.1. ABSTRACT ………………………………………………………….………………………………. 51
2.2. INTRODUCTION …………………………………………………….……………………………… 53
2.3. MATERIALS AND METHODS ……………………………………….……………………………. 59
Plant material, growth conditions and sampling ………………………………. 59
Confocal laser scanning microscopy (CLSM) ……………………………………… 59
Transmission electron microscopy (TEM) …………………………………………. 60
2.4. RESULTS …………………………………………………………………………………………….. 62
2.5. DISCUSSION ………………………………………………………………………………………… 69
2.6. REFERENCES ………………………………………………………………………………………… 79
CHAPTER III ……………………………………………………………..…………………………………………… 85
3. LIGNIFICATION AND GROWTH OF MAIZE (ZEA MAYS L.) ENDOSPERM TRANSFER CELLS AND
STARCHY CELLS ……………………………………………………………………………………………….
86
3.1. ABSTRACT ………………………………………………………….………………………………. 86
3.2. INTRODUCTION …………………………………………………….……………………………… 87
3.3. MATERIALS AND METHODS ……………………………………….……………………………. 91
Plant material, growth conditions and sampling ………………………………. 91
Transmission electron microscopy with EDX …………………………………….. 91
Transmission electron microscopy with H2O2 treatment …………………. 92
Confocal laser scanning microscopy …………………………………………………. 92
TABLE OF CONTENTS
9
3.4. RESULTS AND DISCUSSION ………………………………………………………………………. 94
Transmission electron microscopy – EDX analysis …………………………….. 94
Confocal laser scanning microscopy analysis of acriflavine stained
samples …………………………………………………………………………………………….
98
Transmission electron microscopy analysis of H2O2 treated samples . 98
Cell growth analysis …………………………………………………………………………. 99
Further support for the presence of lignin ………………………………………… 101
3.5. REFERENCES ………………………………………………………………………………………… 104
GENERAL CONCLUSIONS …………………………………………………………………………………………… 110
LIST OF ABBREVIATIONS
10
LIST OF ABBREVIATIONS
MBETC Most basal endosperm transfer cells
CLSM Confocal laser scanning microscopy
DAP Days after pollination
EDX Energy dispersive X-ray technique
GDD Growing degree days
OPW Outer periclinal wall
SC Starchy cells
SD Standard deviation
TC Transfer cells
TEM Transmission electron microscopy

GERAL ABSTRACT
11
GENERAL ABSTRACT
Transfer cells of maize (Zea mays L.) endosperm are optimized to transport great
quantities of assimilates essential to the growth and development of the grain.
Considering their importance, these cells have been the subject of many studies.
Nevertheless, recent scientific data associated with new technologies enabled us to re-
evaluate old concepts and explore new ones about the processes of transfer cell
formation.
In the first chapter of this study the development of maize endosperm transfer
cells was characterized by bright field microscopy, transmission electron microscopy
(TEM) and confocal laser scanning microscopy (CLSM). This has enabled us, and against
previous studies, to detect the presence of reticulate and flange ingrowths arising from
distinct walls in the most basal endosperm transfer cells. As much as we can tell no
one has reported this before, although it is possible that other species from the
Poaceae family may have the same trait. The inner transfer cells form only flange
ingrowths. The structure and ultrastructure of both ingrowths is also reported, namelly
its cellulose microfibrils orientation and compaction throughout development.
Recently it was demonstrated that cortical microtubules guide the movements of
celulose sintethase complexes, therefore controlling the size and shape of cell walls.
On the other hand γ-tubulin complexes were associated with the synthesis of new
microtubules. Therefore in the second chapter we describe how cortical microtubules
and γ-tubulin complexes are associated with the formation of both types of ingrowths
and comparisons are made against the cell wall formation of the starchy cells that do
not form ingrowths. The CLSM allowed us to determine that the microtubules
associated with flange ingrowths form long and mostly longitudinal bundles, whereas
GERAL ABSTRACT
12
the microtubules associated with the reticulate ingrowths form individual or narrower
bundles and often curvilinear microtubules that are entangled and seem to surround
the tips of these ingrowths. The γ-tubulin complexes associated with the synthesis of
flange ingrowths are located preferentially along such structures, whereas those
associated with the reticulate ingrowths have not a clear pattern. In the starchy cells
the microtubules at earlier developmental stages are randomly organized, becoming
progressively bundled and arranged in cross arrays that rapidly evolved to parallel
arrays by the time they start accumulating starch and zeins. Later in development the
microtubule bundles become narrower and individual and are arranged in tight parallel
arrays. With these data we developed models of microtubule and γ-tubulin
organization patterns of transfer cells and starchy cells of maize endosperm. Our
analysis of the organization pattern of the cortical microtubules and of the γ-tubulin
complexes led to present models for the reticulate and flange ingrowths formation and
for the formation of maize endosperm starchy cell walls.
In the third chapter we present results indicating that the transfer cells and the
starchy cells are lignified and that it increases as they approach physiological maturity.
In case of the transfer cells, lignification levels were similar between the ingrowths and
adjacent walls. These results dispute previous findings that claimed that the transfer
cells were not lignified. We have used different techniques and very sensitive for lignin
detection, namely staining with potassium permanganate and acriflavine, and
visualization on the TEM plus energy dispersive X-ray technique and CLSM,
respectively. Both techniques provide concurrent results. We have determined that
the treatment with hydrogen peroxide specifically removed the content of some
vesicles adjacent to reticulate ingrowths, but not of the cell walls and respective
GERAL ABSTRACT
13
ingrowths, therefore supporting partially the previous findings. The cell growth
analysis revealed that lignification occurs simultaneously with the stages of active
growth of transfer and starchy cells, thus it is no impediment to cell growth.
This study provided a deeper understanding of the structure and the
composition of the wall ingrowths during transfer cells development and also provided
important insights on biological mechanisms involved in the development of these
cells essential for kernel yield.
RESUMO GERAL
14
RESUMO GERAL
As células de transferência do endosperma do milho (Zea mays L.) são
especializadas no transporte de elevadas quantidades de assimilados para o grão.
Devido à importância destas células para a produção dos grãos de milho vários estudos
foram realizados para tentar compreender a formação deste tipo de células. No
entanto, conhecimentos científicos recentes associados a novas tecnologias
permitiram reavaliar conceitos antigos e explorar novos sobre a formação das células
de transferência.
No primeiro capítulo deste estudo caracterizámos o desenvolvimento das células
de transferência do milho utilizando microscopia de campo largo, microscopia
electrónica de transmissão (TEM) e microscopia confocal a laser de varrimento (CLSM).
Desta forma foi-nos possível perceber pela primeira vez e contrariamente a estudos
prévios que as células de transferência do milho na sua camada mais basal formam
invaginações reticuladas e flangeadas em paredes distintas. Tanto quanto sabemos
esta característica ainda não foi descrita nas células de transferências até agora
estudadas, embora suspeitemos que outras espécies da família Poaceae possam ter
caraterística idêntica. As camadas mais interiores das células de transferência formam
unicamente invaginações flangeadas. Descreve-se também a estrutura e a
ultrastrutura das invaginações, nomeadamente a compactação e a orientação das
microfibrilas de celulose em ambos os tipos de invaginações durante o
desenvolvimento das células de transferência.
Recentemente foi demonstrado que os microtúbulos corticais orientam os
movimentos dos complexos enzimáticos de celulose sintetase, controlando assim o
tamanho e a forma das paredes celulares. Por seu lado, os complexos proteicos de γ-
RESUMO GERAL
15
tubulina foram associados à síntese de novos microtúbulos. Assim no segundo capítulo
descrevemos como os microtúbulos corticais e os complexos proteicos de γ-tubulina se
associam à formação dos dois tipos distintos de invaginações comparando os
resultados com as paredes celulares das células do endosperma amiláceo do milho que
não desenvolvem invaginações. A utilização do CLSM permitiu-nos observar que os
microtúbulos associados à síntese de invaginações flangeadas formam feixes longos e
predominantemente longitudinais, enquanto os microtúbulos envolvidos no
desenvolvimento de invaginações reticuladas são caracterizados por formarem um
emaranhado de microtúbulos individuais ou em feixes curtos e frequentemente
curvilíneos que muitas vezes parecem rodear as extremidades das invaginações. Os
complexos de γ-tubulina associados à síntese de invaginações flangeadas encontram-
se preferencialmente ao longo dos feixes de microtúbulos, enquanto no
desenvolvimento das invaginações reticuladas não apresentam um padrão definido.
Nas células amiláceas os microtúbulos tendem nas fases iniciais a ter uma organização
ao acaso, formando posteriormente feixes essencialmente cruzados que, à medida que
estas células progridem no seu desenvolvimento, quando começam a acumular amido
e zeínas, tendem a ser paralelos. Nas fases finais de desenvolvimento, os feixes de
microtúbulos tornam-se mais finos ou apresentam-se individualmente e dispõe-se
paralelamente de forma muito compacta. Com estes dados foi possível elaborar
modelos de organização de microtúbulos e γ-tubulina na formação de invaginações
reticuladas e flangeadas e na formação das paredes das células amiláceas do
endosperma do milho.
No terceiro capítulo apresentamos resultados em que determinámos que as
células de transferência e as amiláceas são lenhificadas e que essa característica
RESUMO GERAL
16
acentua-se à medida que os grãos se aproximam da maturação fisiológica. No caso das
células de transferência, os níveis de lenhificação das invaginações são semelhantes
aos das paredes adjacentes. Estes resultados entram em contradição com publicações
anteriores que afirmavam que estas células não são lenhificadas. Neste estudo foram
utilizadas tecnologias diferentes e mais sensíveis para a detecção de lenhina,
nomeadamente a contrastação com permanganato de potássio e marcação com
acriflavina, com visualização no TEM acoplado à espectroscopia de raios X por
dispersão em energia e CLSM, respectivamente. Ambas as técnicas produziram
resultados concordantes. A estes acresce a determinação de que o tratamento com
peróxido de hidrogénio remove especificamente o conteúdo de algumas vesículas
adjacentes às invaginações reticuladas, mas não das paredes celulares e respetivas
invaginações, contribuindo por isso para apoiar parcialmente as descobertas
anteriores. A análise de crescimento revelou que a lenhificação ocorre
simultaneamente com as fases de crescimento mais ativo, por isso não impede o
crescimento celular.
Este estudo contribuiu para aprofundar o conhecimento sobre a estrutura e a
composição das invaginações durante o desenvolvimento das células de transferência
assim como aumentar a percepção dos mecanismos biológicos envolvidos no
desenvolvimento destas células essenciais à produção dos grãos de milho.

GENERAL INTRODUCTION
17
GENERAL INTRODUCTION
Human society’s sustainability is in part supported on plant production. Maize is
one of the most important crops worldwide, its grain is mostly used in animal feed,
food and several other purposes, in which biofuels is becoming increasingly important.
This is the most yielding grain crop in the world, followed by rice and wheat. In the last
five decades there has been a significant increase of this crop’s yield (+298,5%) which
is mainly due to the increase in productivity (+163,7%), but also to the increase in
cultivated area (+51,1%) (FAO 2011). Therefore there has been a need to understand
the mechanisms that determine yield.
In all taxonomic groups of the vascular plants and also in algae and fungi there
are transfer cells which are specialized in the transport of large quantities of nutrients
(Pate and Gunning 1972). These cells develop wall ingrowths in order to increase
plasma membrane surface area, which in turn supports high density of membrane
transporters.
In the case of the maize kernel, transfer cells develop at the chalazal region of
the endosperm with the main purpose of facilitating the flux of assimilates from the
phloem cells through the parenchyma of the pedicel into the endosperm, which
accumulates large quantities of assimilates that will nourish the developing seedling.
Considering the importance of the transfer cells in grain yield, several studies
have been conducted in these cells regarding cell wall anatomy using several
microscopy techniques (Davis et al. 1990; Felker and Shannon 1980; Charlton et al.
1995; Talbot et al. 2001, 2002, 2007a,b; Offler et al. 2003; McCurdy et al. 2008; Kang et
al. 2009). Most of these studies were conducted in kernels at mid developmental
stages (c.a. 20 days after pollination - DAP), whereas only a few studies were
GENERAL INTRODUCTION
18
conducted at earlier developmental stages, at 0-10 DAP (Charlton et al. 1995) and 7-17
DAP (Kang et al. 2009). Considering that the transfer cells start differentiating at 5-6
DAP we decided to conduct a study that would enable to understand the earlier
developmental stages for a more extended period, from 5 to 20 DAP (Chapter I), once
that no other group had done it before.
For the first time in 2006, Paredez et al. were able to demonstrate that cortical
microtubules guide the movements of cellulose synthase, which are responsible for
the deposition of the cellulose in the cell walls. The morphology of some of the
ingrowths of the transfer cells have no parallel in plant kingdom, therefore the interest
in determining the contribution of the microtubules, namely by orientation of cellulose
deposition, which is the main constituent of the cell walls (DeWitt et al. 1999). Studies
have been conducted that tried to relate the organization pattern of microtubules with
ingrowth formation in epidermal transfer cells of Vicia fava L. cotyledons (Bulbert et al.
1998), in transfer cells of Lilium spp placenta (Singh et al. 1999) and in xylem transfer
cells of wheat (Triticum aestivum) stem nodes (Talbot et al. 2007a); to our knowledge,
no such study has been conducted on maize endosperm transfer cells. The γ-tubulin
complexes are considered essential to the nucleation of the microtubules (Erhardt et
al. 2002; Murata et al. 2005; Nakamura et al. 2010) and despite its importance no
studies are known on their organizational pattern in relation to ingrowth formation.
Considering the importance of γ-tubulin complexes in microtubule organizational
pattern, and considering the importance of the microtubules in the orientation of
cellulose, in this study the organizational pattern of these molecular structures will be
determined during ingrowth formation (Chapter II). With this information comparisons
will be done with studies conducted in other transfer cells and with the maize starchy
GENERAL INTRODUCTION
19
cells. The transfer cells and starchy cells belong to the same tissue, the endosperm, but
have very distinct functions. Moreover, the structure and ultrastructure of both types
of cells are also very distinct. Understanding the contribution of microtubules and γ-
tubulin to their differentiation is relevant information.
Another subject that has been a study topic for several research groups is the
composition of the ingrowths. Until recently these structures were considered
secondary walls (Offler et al. 2003) but once their composition does not differ much
from the adjacent cell walls, they are now considered as primary walls (Vaughn et al.
2007). The absence of lignin in the transfer cells has been considered a specific trait of
these cells in comparison of those with secondary walls (Fineran and Calvin 2000;
Offler et al. 2003; Vaughn et al. 2007).
The presence of lignin is associated with wall stiffness, although some studies
report its presence in growing cells (Müsel et al. 1997). In this study (Chapter III) lignin
content will be determined using high sensitivity techniques, once that less sensitive
techniques failed to detect it (Gunning and Pate 1974; Vaughn et al. 2007). Lignin
content will also be determined in the starchy cells, and in both types of cells it will be
related to cell growth.
Therefore the main objectives of this study were:
Chapter I:
a) To study, at structural and ultrastructural levels, the development of
maize endosperm transfer cells from 5 to 20 DAPS;
Chapter II:
b) To study the organization patterns of cortical microtubules and γ-tubulin
complexes next to ingrowths of developing transfer cells;

GENERAL INTRODUCTION
20
c) To determine the organization patterns of the microtubules and γ-tubulin
complexes of developing starchy cells;
d) To compare these results with others reported for different species;
Chapter III:
e) To determine the possible lignin content of transfer cell walls and
ingrowths, and of starchy cells;
f) To determine the association between transfer and starchy cells growth
and possible lignin content.
GENERAL INTRODUCTION
21
References
Bulbert MW, Offler CE, McCurdy DW (1998) Polarized microtubule deposition
coincides with wall ingrowth formation in transfer cells of Vicia faba L.
cotyledons. Protoplasma 201(1-2):8-16. doi:10.1007/BF01280706
Charlton WL, Keen CL, Merriman C, Lynch AJ, Grennland AJ, Dickinson HG (1995)
Endosperm development in Zea mays; implication of gametic imprinting and
paternal excess in regulation of transfer layer development. Development
121:3089–3097
Davis RW, Smith JD, Cobb BG (1990) A light and electron microscope investigation of
the transfer cell region of maize caryopses. Can J Bot 68:471–479.
doi:10.1139/B90-063
DeWitt G, Richards J, Mohnen D, Jones AM (1999) Comparative compositional analysis
of walls with two different morphologies: archetypical versus transfer-cell-like.
Protoplasma 209:238–245. doi:10.1007/BF01453452
Erhardt M, Stoppin-Mellet V, Campagne S, Canaday J, Mutterer J, Fabian T, Sauter M,
Muller T, Peter C, Lambert AM, Schmit AC (2002) The plant Spc98p homologue
colocalizes with gamma-tubulin at microtubule nucleation sites and is required
for microtubule nucleation. J Cell Sci 115:2423-2431.
FAO. (2011). Faostat [disponível online] http://faostat3.fao.org/home/index.html
[acedido a 24 Fevereiro de 2013].
Felker FC, Shannon JC (1980) Movement of 14 C-labeled assimilates into kernels of Zea
mays L. III. An anatomical examination and microautoradiographic study of
assimilate transfer. Plant Physiol 65:864–870. doi:10.1104/pp.65.5.864
GENERAL INTRODUCTION
22
Fineran BA, Calvin CL (2000). Transfer cells and flange cells in sinkers of Phoradendron
macrophyllum (Viscaceae), and their novel combination. Protoplasma 211:76-93.
doi:10.1007/BF01279901
Gunning BES, Pate JS (1974) Transfer cells. In: Robards AW (ed) Dynamic aspects of
plant ultrastructure. McGraw-Hill, London, pp 441–479
Kang B-H, Xiong Y, Williams DS, Pozueta-Romero D, Chourey PS (2009) Miniature1-
encoded cell wall invertase is essential for assembly and function of wall-in-
growth in the maize endosperm transfer cell. Plant Phys 151:1366–1376.
doi:10.1104/pp.109.142331
McCurdy DW, Patrick JW, Offler CE (2008) Wall ingrowth formation in transfer cells:
novel examples of localized wall deposition in plant cells. Curr Opin Plant Biol
11:653–661. doi:10.1016/j.pbi.2008.08.005
Müsel G, Schindler T, Bergfeld R, Ruel K, Jacquet G, Lapierre C, Speth V, Schpfer P
(1997) Structure and distribution of lignin in primary and secondary cell walls of
maize coleoptiles analized by chemical and immunological probes. Planta 20:146-
159. doi:10.1007/BF01007699
Murata T, Sonobe S, Baskin TI, Hyodo S, Hasezawa S, Nagata T, Horio T, Hasebe M
(2005) Microtubule-dependent microtubule nucleation based on recruitment of
gamma-tubulin in higher plants. Nat Cell Biol 7:961-968. doi:10.1038/ncb1306
Nakamura M, Ehrhardt DW, Hashimoto T (2010) Microtubule and katanin-dependent
dynamics of microtubule nucleation complexes in the acentrosomal Arabidopsis
cortical array. Nat Cell Biol 12:1064-1070. doi:10.1038/ncb2110
GENERAL INTRODUCTION
23
Offler CE, McCurdy DW, Patrick JW, Talbot MJ (2003) Transfer cells: cells specialized for
a special purpose. Annu Rev Plant Biol 54:431-454.
doi:10.1146/annurev.arplant.54.031902.134812
Pate JS, Gunning BES (1972) Transfer cells. Annu. Rev. Plant Physiol. 23:173–96
Paredez AR, Somerville CR, Ehrhardt DW (2006) Visualization of cellulose synthase
demonstrates functional association with microtubules. Science 312:1491-1495.
doi:10.1126/science.1126551
Singh S, Lazzaro MD, Walles B (1999) Microtubule organization in the differentiating
transfer cells of the placenta in Lilium spp.. Protoplasma 207:75-83.
doi:10.1007/BF01294715
Talbot MJ, Franceschi VR, McCurdy DW, Offler CE (2001) Wall ingrowth architecture in
epidermal transfer cells of Vicia faba cotyledons. Protoplasma 215:191–203.
doi:10.1007/BF01280314
Talbot MJ, Offler CE, McCurdy DW (2002) Transfer cell architecture: a contribution
towards understanding localized wall deposition. Protoplasma 219:197–209.
doi:10.1007/s007090200021
Talbot MJ, Wasteneys GO, McCurdy DW, Offler CE (2007a) Deposition patterns of
cellulose microfibrils in flange wall ingrowths of transfer cells indicate clear
parallels with those of secondary wall thickenings. Funct Plant Biol 34:307–313.
doi:10.1071/FP06273
Talbot MJ, Wasteneys GO, Offler CE, McCurdy DW (2007b) Cellulose synthesis is
required for deposition of reticulate wall ingrowths in transfer cells. Plant Cell
Physiol 48:147–158. doi:10.1093/pcp/pcl046
GENERAL INTRODUCTION
24
Vaughn KC, Talbot MJ, Offler CE, McCurdy DW (2007) Wall ingrowths in epidermal
transfer cells of Vicia faba cotyledons are modified primary walls marked by
localized accumulations of arabinogalactan proteins. Plant Cell Physiol 48:159–
168. doi:10.1093/pcp/pcl047
CHAPTER I
25
______________________________________________________________________
CHAPTER I
DEVELOPMENT OF FLANGE AND RETICULATE WALL INGROWTHS IN MAIZE (ZEA MAYS L.) ENDOSPERM
TRANSFER CELLS
______________________________________________________________________
CHAPTER I ABSTRACT
26
1. DEVELOPMENT OF FLANGE AND RETICULATE WALL INGROWTHS IN MAIZE (ZEA MAYS L.) ENDOSPERM
TRANSFER CELLS
1.1. Abstract
Maize (Zea mays L.) endosperm transfer cells are essential for kernel growth and
development so they have a significant impact on grain yield. Although structural and
ultrastructural studies have been published, little is known about the development of
these cells, and prior to this study, there was a general consensus that they contain
only flange ingrowths. We characterized the development of maize endosperm
transfer cells by bright field microscopy, transmission electron microscopy, and
confocal laser scanning microscopy. The most basal endosperm transfer cells (MBETC)
have flange and reticulate ingrowths, whereas inner transfer cells only have flange
ingrowths. Reticulate and flange ingrowths are mostly formed in different locations of
the MBETC as early as 5 days after pollination, and they are distinguishable from each
other at all stages of development. Ingrowth structure and ultrastructure and cellulose
microfibril compaction and orientation patterns are discussed during transfer cell
development. This study provides important insights into how both types of ingrowths
are formed in maize endosperm transfer cells.
Keywords: Transfer cells, Maize endosperm, Reticulate ingrowths, Flange ingrowths
CHAPTER I INTRODUCTION
27
1.2. INTRODUCTION
Maize endosperm is a triploid storage tissue accounting for up to 80% of the
kernel biomass. There are three major cell types in the endosperm: the cells that
accumulate starch and protein (starchy endosperm), the aleurone layer, and the
transfer cells (Becraft 2001; Becraft and Yi 2011). The starchy endosperm is further
divided into specialized regions known as the subaleurone, the embryo-surrounding
region, and the conducting zone (Becraft 2001).
The transfer cells are located in the placento-chalazal region adjacent to the
main vascular tissues of the pedicel, they extend up to six cells in depth (Davis et al.
1990) and are the first cells to differentiate in the endosperm, commencing
approximately 6 days after pollination (DAP) (Charlton et al. 1995; Becraft 2001). These
cells have adapted to transport assimilates into the starchy endosperm cells and they
undergo a characteristic form of cell wall growth in which uneven thickenings
ultimately develop into distinct ingrowths. Potentially, the transport capacity is
enhanced by amplification of plasmalemma surface area and by enrichment of
transporters, thus facilitating the apo/symplasmic transport of solutes (Offler et al.
2003). After several weeks, the transfer cells undergo senescence during the stage at
which most of the endosperm is at an advanced stage of apoptosis (Young and Gallie
2000).
Reticulate or flange ingrowths form in transfer cells of many species (Gunning
and Pate 1969; Talbot et al. 2002; Offler et al. 2003;McCurdy et al. 2008), although in
only a few studies has it been recognized that they coexist in the same cells (Talbot et
al. 2002; Pugh et al. 2010). Reticulate wall ingrowths are more common and have a
unique morphology, emerging as small projections or papillae from the underlying wall
CHAPTER I INTRODUCTION
28
at discrete but apparently random loci, then branching and often fusing laterally to
form a fenestrated layer of wall material that will ultimately become a multi-layered
labyrinth (Talbot et al. 2001, 2007b; Offler et al. 2003; McCurdy et al. 2008). Cellulose
deposition is the driving force in the prevailing model for reticulate wall ingrowth
formation following the emergence of discrete papillae (Talbot et al. 2007b; McCurdy
et al. 2008). Tangled and apparently disorganized microfibrils form near the plasma
membrane with no relationship to the microfibrils of the underlying primary cell wall,
and the papillae emerge from raised patches that accumulate more material than
surrounding areas (Talbot et al. 2001, 2007b), probably reflecting that cellulose
synthase complexes are delivered to the plasma membrane randomly and directed by
microtubules (McCurdy et al. 2008).
Flange wall ingrowths form thin ribs as well as broad flat or thick and
anastomosed sheet structures (Talbot et al. 2002, 2007a) superficially resembling the
secondary wall thickenings of tracheary elements, although they may not be lignified
(Gunning and Pate 1974; Vaughn et al. 2007). The wall material appears to be
deposited progressively along the full length of these structures, eventually producing
a complex, dense network of ingrowth material characterizing the elaborate and often
branched/interwoven flange morphology (Talbot et al. 2002; McCurdy et al. 2008).
Flange wall ingrowths involve the organization of cellulose microfibrils that are more
densely packed than reticulate ingrowths as revealed by transmission electron
microscopy (TEM) (Davis et al. 1990; Talbot et al. 2002; Offler et al. 2003). Flange
ingrowth projections arise from the addition of more microfibrils, the cellulose must
be deposited by cellulose synthase complexes following microtubules (Offler et al.
2003; Talbot et al. 2007a; McCurdy et al. 2008).
CHAPTER I INTRODUCTION
29
Wall ingrowths have a very similar composition as compared with the adjacent
primary walls. Studies showed that cellulose, xyloglucan, and pectins are distributed
uniformly within the wall (Vaughn et al. 2007), but extensins, arabinogalactan proteins,
and callose are distributed with distinct patterns in reticulate ingrowths (Dahiya and
Brewin 2000; Vaughn et al. 2007). The chemical composition of transfer cell wall
ingrowths is essentially the same as that of archetypical cell walls, suggesting any
morphological differences do not reflect underlying differences in composition (DeWitt
et al. 1999; Vaughn et al. 2007).
Maize endosperm transfer cells are considered to contain flange ingrowths that
are thin and rib shaped, becoming progressively crossed-linked and fused towards the
base of the cell (Davis et al. 1990; Felker and Shannon 1980; Talbot et al. 2002, 2007a;
Offler et al. 2003; McCurdy et al. 2008; Kang et al. 2009). Next to the outer periclinal
wall (i.e., the peripheral periclinal wall of the most basal endosperm transfer cells
(MBETC) adjacent to the placental cavity—outer periclinal wall (OPW)), lateral
protrusions that resemble those in reticulate wall ingrowths, appear to be spatially
coordinated and will create an extensive branching of the flange ingrowths (Talbot et
al. 2002; McCurdy et al. 2008). In the MBETC, the wall material fills most of the cell
lumen, comprising anastomosed ribs in the apical portion and a dense network of wall
material in the basal portion (Talbot et al. 2002, 2007a), but in the inner transfer cells,
there is a gradual reduction on the numbers and extension of ingrowths the further
they are away from the OPW (Davis et al. 1990). Our developmental analysis of maize
endosperm transfer cell differentiation showed that the MBETC develop flange and
reticulate wall ingrowths simultaneously but in separate regions, whereas the inner
CHAPTER I INTRODUCTION
30
transfer cells only form flange ingrowths. The formation patterns of both ingrowths are
discussed.
CHAPTER I MATERIAL AND METHODS
31
1.3. MATERIALS AND METHODS
Plant material, growth conditions, and sampling
Maize seeds (Zea mays L., inbred W64A) were planted in a naturally lit
greenhouse in 20-L pots containing Andosol loam soil (in 2009 and 2011) at the
Universidade dos Açores campus of Angra do Heroísmo. Plants were fertilized weekly,
alternating 3 g of commercial fertilizer (20/5/10) with 100 mL of Hoagland's solution
per pot (Hoagland and Arnon 1938). Controlled pollinations were carried out on all test
plants.
The temperature was recorded daily during early kernel development allowing
the calculation of growing degree days (GDD) according to the formula
GDD=Σ(ADT−BT), where ADT is the average daily temperature and BT is the base
temperature of 10 °C (Gilmore and Rogers 1958). Minimum temperatures <10 °C were
adjusted to 10 °C, and maximum temperatures >30 °C were adjusted to 30 °C. The
developmental stages were therefore described as DAP and references were made to
GDD.
For each sampling date, 35 to 50 kernels were collected from at least 9 different
ears, and endosperm transfer cells located between the germinal side and the mid
placentochalazal region were analyzed.
Bright field microscopy
Tissues were prepared and fixed in two alternative ways: (1) kernels were
sectioned longitudinally (200–500 μm thickness) with a Leica VT 1200 vibratome (Leica
Microsystems, Wetzlar, Germany) in 4% paraformaldehyde plus 0.1% glutaraldehyde
CHAPTER I MATERIAL AND METHODS
32
in a buffer containing 60 mM PIPES, 25 mM HEPES, 2 mM MgCl2, 10 mM EGTA and 5%
dimethylsulfoxide at pH 6.9 (PHEM/DMSO), and after sectioning were fixed in 4%
glutaraldehyde plus 4% paraformaldehyde in PIPES buffer and second postfixed in 2%
osmium tetroxide in the same buffer (Salema and Brandão 1973) for 2 h at room
temperature in each step (Monjardino et al. 2007); (2) kernels were hand sectioned
with a razor blade, discarding most of the endosperm tissue except for the basal
endosperm region, and were immediately fixed in 4% glutaraldehyde plus 2% osmium
tetroxide for 2 h. The fixed sections were dehydrated in acetone and progressively
infiltrated in Spurr's resin over 8 days at room temperature (Monjardino et al. 2007)
before polymerization at 60 °C. Most of the images were obtained from samples that
were prepared with the first methodology.
Semi thin sections (400–800 nm thickness) were obtained on a LKB 2188 NOVA
Ultramicrotome (LKB NOVA, Bromma, Sweden) using glass knives. The sections were
transferred to glass slides, stained with toluidine blue, examined under a Zeiss
microscope Axioimager A1 (Carl Zeiss Oberkochen, Germany) and images were
recorded with a Zeiss digital camera Axiocam MRc.
Transmission electron microscopy
Samples were obtained as in bright field microscopy, but most of the images
were obtained from samples that were prepared and fixed with the second
methodology. Ultrathin sections (40–60 nm thickness) were prepared on a LKB 2188
NOVA Ultramicrotome (LKB NOVA, Bromma, Sweden) using diamond knives (DDK,
Wilmington, DE, USA). The sections were mounted on 200 mesh copper or nickel grids,
stained with uranyl acetate and lead citrate for 15 min each, and examined under a
CHAPTER I MATERIAL AND METHODS
33
JEOL JEM 1400 TEM (Tokyo, Japan). Images were digitally recorded using a Gatan SC
1000 ORIUS CCD camera (Warrendale, PA, USA).
Confocal laser scanning microscopy
Kernels were sectioned longitudinally (70–100 μm thicknesses) on a Leica VT
1200 vibratome in 4% paraformaldehyde plus 0.1% glutaraldehyde in PHEM/DMSO
buffer (Brown and Lemmon 1995) for 2 h, after which the sections were washed in a
buffer containing 137 mM NaCl, 2.7 mM KCl, 40.2 mM Na2HPO4, and 17.6 mM KH2PO4
at pH 7.4 (PBS), stained with filtered 0.01% calcofluor white for 1 min, and washed
again in PBS buffer. Sections were visualized under a Zeiss confocal laser scanning
microscopy (CLSM) 510 with excitation λ at 405 nm (UV diode laser) and detection at
420–480 nm. The projected images were obtained from Z stacks at a resolution of
1,024×1,024 pixels. The Z stacks contained 22–60 planes at 0.37 μm intervals. All
selected images were imported into Adobe Photoshop CS software (Adobe Systems,
San Jose, CA) for presentation and photomontages were produced in the same
software.
CHAPTER I RESULTS
34
1.4. RESULTS
Flange and reticulate ingrowth development occurred mostly from 5 to 12 DAP
(75–192 GDD), although there were still some variations in their ultrastructure up to
20 DAP (302–318 GDD, Figs. 1, 2, and 3). The MBETC developed both flange and
reticulate ingrowths, whereas the inner transfer cells only developed flange ingrowths
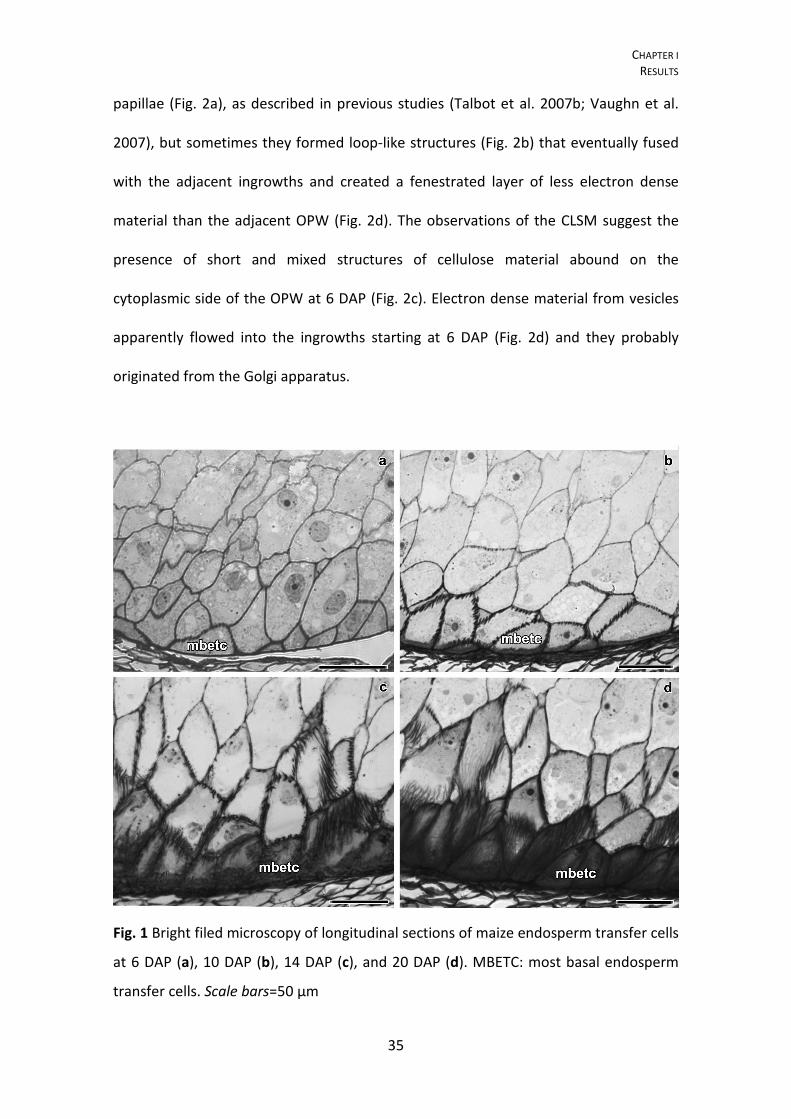
(Figs. 2 and 3). The higher density of ingrowths in the MBETC must have been
responsible for staining more intensively, especially after 10 DAP (Fig. 1b–d). Ingrowth
composition, regardless of being reticulate or flange, probably is not the cause of such
differences (Offler et al. 2003) because it usually is similar to the adjacent primary wall
(DeWitt et al. 1999; Dahiya and Brewin 2000; Vaughn et al. 2007).
The further away the transfer cells were from the OPW, the shorter the flange
ingrowths (Fig. 1). Considering that the MBETC are the only cells that contain both
types of ingrowths and where the flange ingrowths are more extensive, the
experiments focused on these cells.
Reticulate ingrowths
At 5 DAP and using TEM, in many sections, the cells of the placento-chalazal
region were initiating reticulate ingrowth formations (Fig. 2a–b). However at the CLSM,
most of the walls of the cells from this region labeled lightly and uniformly with
calcofluor white (data not shown), unlike later development stages where the
ingrowths were clearly identified (Fig. 2c, e, g). Reticulate ingrowths started developing
at this stage, with the formation of randomly distributed initiation sites (Fig. 2a–b), but
rapidly increasing their numbers to a point that they no longer could be individualized
(6 DAP, Fig. 2c–d). The initiation sites were normally characterized by the formation of
CHAPTER I RESULTS
35
papillae (Fig. 2a), as described in previous studies (Talbot et al. 2007b; Vaughn et al.
2007), but sometimes they formed loop-like structures (Fig. 2b) that eventually fused
with the adjacent ingrowths and created a fenestrated layer of less electron dense
material than the adjacent OPW (Fig. 2d). The observations of the CLSM suggest the
presence of short and mixed structures of cellulose material abound on the
cytoplasmic side of the OPW at 6 DAP (Fig. 2c). Electron dense material from vesicles
apparently flowed into the ingrowths starting at 6 DAP (Fig. 2d) and they probably
originated from the Golgi apparatus.
Fig. 1 Bright filed microscopy of longitudinal sections of maize endosperm transfer cells
at 6 DAP (a), 10 DAP (b), 14 DAP (c), and 20 DAP (d). MBETC: most basal endosperm
transfer cells. Scale bars=50 μm
CHAPTER I RESULTS
36
At 7 DAP in most of the analyzed cells, the reticulate ingrowths had expanded
approximately 5 μm into the cytosol (Fig. 2e–f). Cellulose predominated mostly near
the OPW, whereas in the inner side multiple vesicles fused with the ingrowths (Fig. 2f).
This is a period of active development of the ingrowths, where a complex labyrinth is
still being formed next to the OPW and up to 5 μm of the adjacent anticlinal walls.
As the kernels reached about one fourth of their development, at 10 and 12 DAP,
reticulate ingrowths were almost fully developed (Fig. 2g–i), because they were very
similar to those at 20 DAP (Fig. 2j; Davis et al. 1990; Talbot et al. 2002; Kang et al.
2009). The orientation of the cellulose microfibrils was variable, but they were
predominantly perpendicular to the cell long axis (Fig. 2i–j). The labyrinth of reticulate
ingrowths had expanded approximately 7 μm into the cytosol (Fig. 2g) and the spaces
were mostly filled with mitochondria (Fig. 2i–j). However, even at 20 DAP, vesicles
were still being added to the reticulate ingrowths (Fig. 2j), which is a sign that these
ingrowths were still being formed, despite the observation that their expansion into
the cytosol had not changed significantly from 10 to 20 DAP.
Flange ingrowths
Flange ingrowths were also initiated at 5 DAP (Fig. 3a–c) and were mostly located
next to the anticlinal walls (at least 5 μm apart from the OPW) and inner periclinal
walls. The initiation sites were dispersed, but contrarily to the reticulate ingrowths, the
flange ingrowths remained mostly individualized later in development. These
ingrowths were made of an electron dense material resembling the adjacent primary
walls, sometimes forming a continuous stretch of wall material (Fig. 3c), which
CHAPTER I RESULTS
37
apparently was mostly cellulose. At this stage, the flange ingrowths were not usually
detected with CLSM (data not shown).
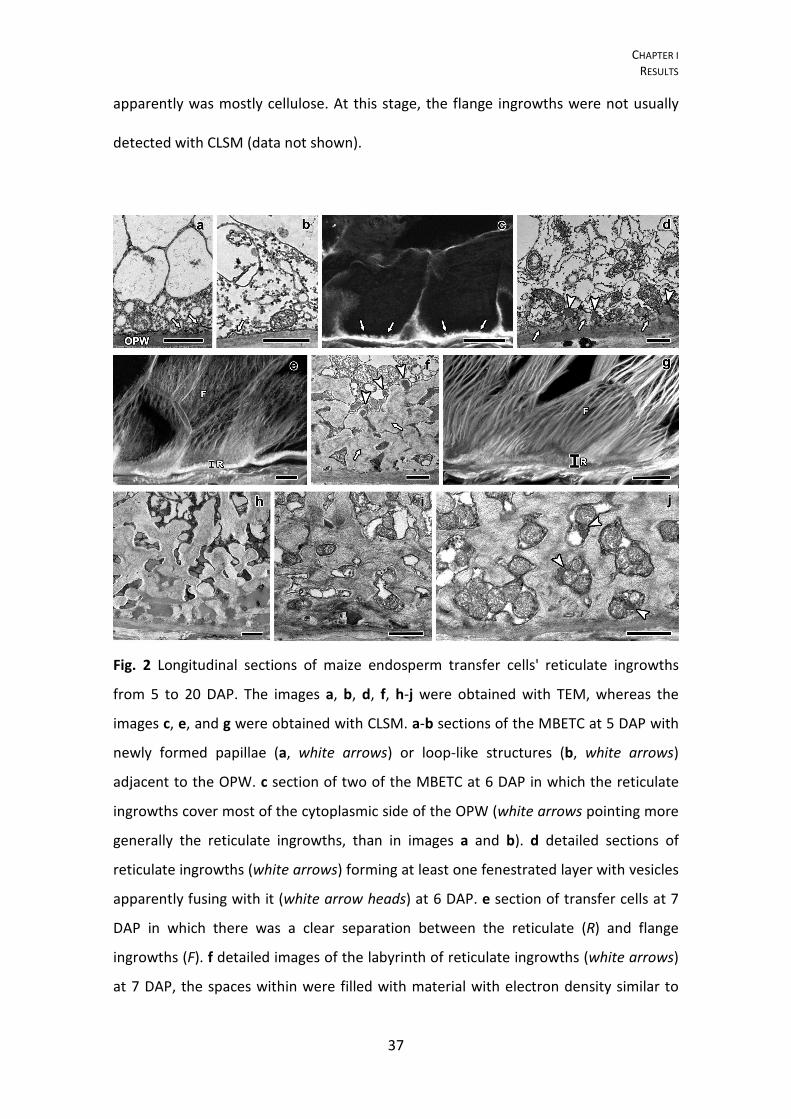
Fig. 2 Longitudinal sections of maize endosperm transfer cells' reticulate ingrowths
from 5 to 20 DAP. The images a, b, d, f, h-j were obtained with TEM, whereas the
images c, e, and g were obtained with CLSM. a-b sections of the MBETC at 5 DAP with
newly formed papillae (a, white arrows) or loop-like structures (b, white arrows)
adjacent to the OPW. c section of two of the MBETC at 6 DAP in which the reticulate
ingrowths cover most of the cytoplasmic side of the OPW (white arrows pointing more
generally the reticulate ingrowths, than in images a and b). d detailed sections of
reticulate ingrowths (white arrows) forming at least one fenestrated layer with vesicles
apparently fusing with it (white arrow heads) at 6 DAP. e section of transfer cells at 7
DAP in which there was a clear separation between the reticulate (R) and flange
ingrowths (F). f detailed images of the labyrinth of reticulate ingrowths (white arrows)
at 7 DAP, the spaces within were filled with material with electron density similar to
CHAPTER I RESULTS
38
the included in vesicles that were apparently still fusing with it (white arrow heads). g
section of the MBETC at 10 DAP, still denoting a clear separation between the
reticulate (R) and flange ingrowths (F). h detailed image of the labyrinth at 10 DAP with
electron dense material filling most of the spaces within. i detailed image of the
labyrinth at 12 DAP with mitochondria filling most of the spaces and cellulose
microfibrils mostly oriented perpendicularly to the cell long axis, although they have
different orientations and they are not very densely packed. j detailed image of the
labyrinth at 20 DAP, mitochondria still fill the spaces in between, but there are also
vesicles (white arrow heads) apparently being added to these structures and other cell
components that cannot be identified. OPW: outer periclinal wall; white arrow:
reticulate ingrowth; white arrow head: vesicles apparently being added to expanding
ingrowths; R: reticulate ingrowths region; F: flange ingrowths. Scale bars: a, b, d, f, h-
j=1 μm; c, e, g=20 μm
At 6 DAP as the flange ingrowths expanded, part of the anticlinal walls more than
doubled in their width (Fig. 3d–f). Ingrowths were predominantly longitudinal, thus
causing extensive wall enlargement, except near the plasmodesmata (Fig. 3e–f). The
expansion of flange ingrowths in the MBETC was variable: in some cells the anticlinal
walls started showing a predominantly longitudinal cellulose microfibril orientation
(Fig. 3g), whereas in others, the ingrowths have expanded and thickened to the point
of projecting into the cytosol (Fig. 3h–i).
At 7 DAP, the ingrowths enlarged significantly; they were mostly formed of
cellulose material (Fig. 3j–k) and vesicles were added to the growing edges (Fig. 3j).
The orientation of cellulose microfibrils was essentially longitudinal, either of
ingrowths adjacent to the anticlinal (Fig. 3j–k) or inner periclinal walls (data no shown),
which were mostly perpendicular to the microfibrils of the reticulate ingrowths (Fig.
2j–k). Frequently, newly added microfibrils ran parallel to the existing ones of the
CHAPTER I RESULTS
39
adjacent primary wall, but at some point they detached from them and projected
inwards (Fig. 3k).
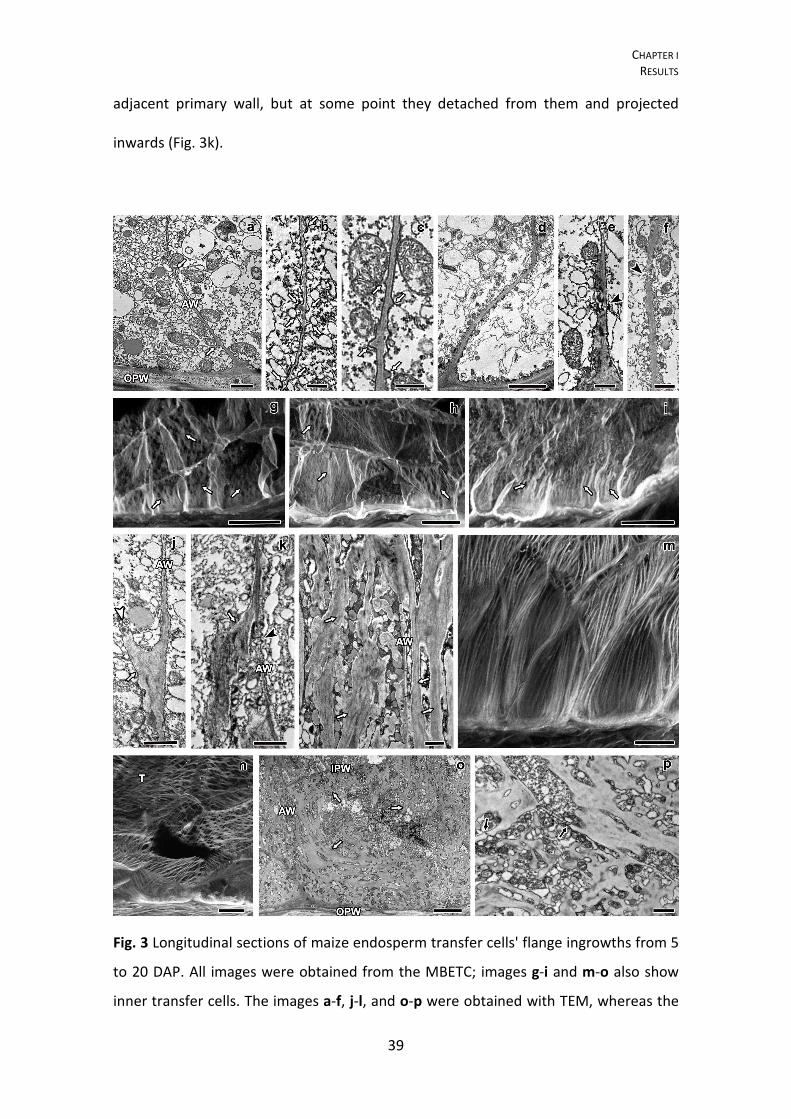
Fig. 3 Longitudinal sections of maize endosperm transfer cells' flange ingrowths from 5
to 20 DAP. All images were obtained from the MBETC; images g-i and m-o also show
inner transfer cells. The images a-f, j-l, and o-p were obtained with TEM, whereas the
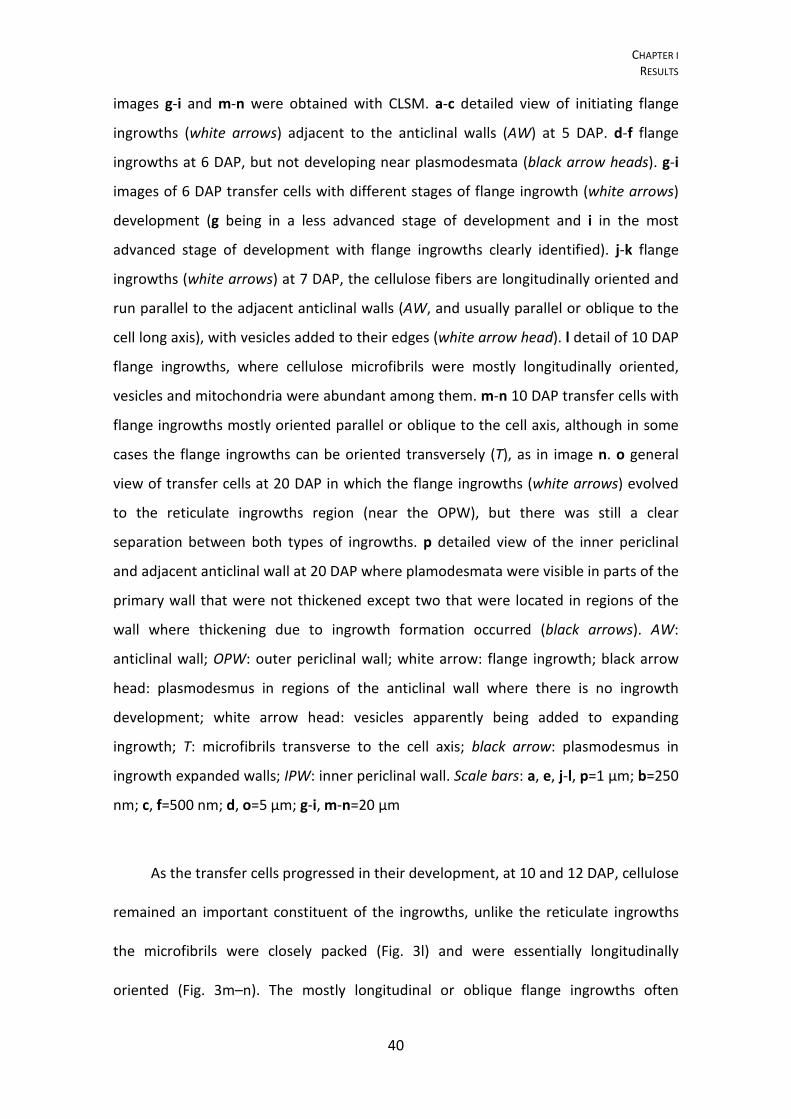
CHAPTER I RESULTS
40
images g-i and m-n were obtained with CLSM. a-c detailed view of initiating flange
ingrowths (white arrows) adjacent to the anticlinal walls (AW) at 5 DAP. d-f flange
ingrowths at 6 DAP, but not developing near plasmodesmata (black arrow heads). g-i
images of 6 DAP transfer cells with different stages of flange ingrowth (white arrows)
development (g being in a less advanced stage of development and i in the most
advanced stage of development with flange ingrowths clearly identified). j-k flange
ingrowths (white arrows) at 7 DAP, the cellulose fibers are longitudinally oriented and
run parallel to the adjacent anticlinal walls (AW, and usually parallel or oblique to the
cell long axis), with vesicles added to their edges (white arrow head). l detail of 10 DAP
flange ingrowths, where cellulose microfibrils were mostly longitudinally oriented,
vesicles and mitochondria were abundant among them. m-n 10 DAP transfer cells with
flange ingrowths mostly oriented parallel or oblique to the cell axis, although in some
cases the flange ingrowths can be oriented transversely (T), as in image n. o general
view of transfer cells at 20 DAP in which the flange ingrowths (white arrows) evolved
to the reticulate ingrowths region (near the OPW), but there was still a clear
separation between both types of ingrowths. p detailed view of the inner periclinal
and adjacent anticlinal wall at 20 DAP where plamodesmata were visible in parts of the
primary wall that were not thickened except two that were located in regions of the
wall where thickening due to ingrowth formation occurred (black arrows). AW:
anticlinal wall; OPW: outer periclinal wall; white arrow: flange ingrowth; black arrow
head: plasmodesmus in regions of the anticlinal wall where there is no ingrowth
development; white arrow head: vesicles apparently being added to expanding
ingrowth; T: microfibrils transverse to the cell axis; black arrow: plasmodesmus in
ingrowth expanded walls; IPW: inner periclinal wall. Scale bars: a, e, j-l, p=1 μm; b=250
nm; c, f=500 nm; d, o=5 μm; g-i, m-n=20 μm
As the transfer cells progressed in their development, at 10 and 12 DAP, cellulose
remained an important constituent of the ingrowths, unlike the reticulate ingrowths
the microfibrils were closely packed (Fig. 3l) and were essentially longitudinally
oriented (Fig. 3m–n). The mostly longitudinal or oblique flange ingrowths often
CHAPTER I RESULTS
41
extended as much as the anticlinal walls (Figs. 2g and 3m–n), thus forming
anastomosed rib-like structures, as reported in other studies (Talbot et al. 2002,
2007a). However, in some cells (less than 10 %), microfibril and ingrowth orientation
was transverse to the long axis of the cell (Fig. 3n), but it is not clear how this occurred.
At mid-endosperm development (20 DAP), the MBETC did not appear changed
from previous stages (10–12 DAP), except that the flange ingrowths have evolved from
the more distal part of OPW to the region where the reticulate ingrowths exist, often
overlapping them and filling much of the cytosol (Fig. 3o). The flange ingrowths'
microfibrils were oriented transverse to the cell long axis, but apparently that was due
to bending of these structures, because as they approached the reticulate ingrowths,
probably due to space constraints, they curved as did their microfibrils (Fig. 3o). The
inner transfer cells continued having a much lower quantity of ingrowths than the
MBETC (Fig. 1); the ingrowths were exclusively flange and became more extensive and
interwoven as these cells developed (Figs. 1 and 3o). At this stage, plasmodesmata
were mostly found in non-thickened regions of the primary wall, but occasionally were
located in slightly thickened regions (Fig. 3p). It is not clear whether the
plasmodesmata constrained ingrowth formation, or if they were restricted to regions
of the primary wall that happened not to contain any ingrowths. Certainly,
plasmodesmata exist between the most basal and inner transfer cells and they should
contribute to assimilate flux to inner transfer cells.
CHAPTER I DISCUSSION
42
1.5. DISCUSSION
Ingrowth initiation started at 5 DAP, whereas it usually is reported to start
around 6 DAP (Charlton et al. 1995; Becraft 2001). The difference may arise from the
fact that the plants used in this study were grown in warmer conditions than previous
studies, therefore they accumulated between 75 and 81 GDD in 5 days, which is
approximately the same for 6 day grown kernels at an average temperature of 23.5 °C.
However, we cannot rule out the possibility of the use of different genotypes
contributes to differences in transfer cell developmental rates.
The reticulate ingrowths started as discrete papillae emerging directly from the
OPW, their numbers increased and rapidly formed a fenestrated layer of apparently
disorganized cell wall structures with various electron densities, but mostly less than in
the adjacent OPW. These data suggest that the compaction of cell wall material in the
reticulate ingrowths is less pronounced than in the adjacent OPW. Other layers were
formed on top of this cell wall material creating a labyrinth that covered the
cytoplasmic side of the OPW. The orientation of cellulose fibers in the reticulate
ingrowths was variable, but predominantly transverse to the long axis of the cell. Apart
from cellulose, other components were added, normally including vesicles that most
likely originated from the Golgi apparatus. Unlike the seed coat of Vicia faba L.
(Wardini et al. 2007; McCurdy et al. 2008), we have not observed a uniform wall layer
on the cytoplasmic side of the OPW prior to or during reticulate ingrowth initiation
(Monjardino et al. 2007; Fig. 2a–b). The variations in electron density of the OPW (Fig.
2a–b, d) were probably due to previous fusions of nucellar and integument cell walls
(Monjardino et al. 2007) and they were thicker and more electron dense than the
unified wall layer reported by Wardini et al. (2007).
CHAPTER I DISCUSSION
43
The flange ingrowths started as localized enlargements of the anticlinal and inner
periclinal walls, the electron density of the structures within was very similar to the
adjacent primary walls and remained for further developmental stages. These
ingrowths were essentially made of cellulose and other constituents probably
originating from vesicles of the Golgi apparatus. Unlike the reticulate ingrowths, the
flange ingrowths remained discrete from adjacent structures throughout
development. They, were also formed in the inner two to six cells, the cellulose fibers
were more densely packed throughout development and oriented longitudinally to the
long axis of the cell, the ingrowths often expanded as much as the length of the cell (in
some cases they reached 60 μm in length) and formed long rib-like structures that
often were anastomosed.
The coexistence of reticulate and flange ingrowths in the MBETC is unique in that
they arose from distinct locations (the reticulate ingrowths were located exclusively
near the OPW and the adjacent 5–10 μm of the anticlinal walls, whereas the flange
ingrowths were located mostly next to the remaining walls of these cells) and they
were both formed at the same time. At least 95 % of the cells of this region contained
both types of ingrowths. However, in a very limited number of samples (less than 1 %),
we observed that both ingrowths arose from the OPW, but the presence of the
reticulate ingrowths significantly outnumbered the flange ingrowths (data not shown).
The coexistence of both types of ingrowths in the same cells has been reported
previously (Talbot et al. 2002; Pugh et al. 2010). In cells of nucellar projections of
Hordeum vulgare L., the reticulate type is prevalent, but in some cells, both types
coexist without clear separation between them (Talbot et al. 2002) as in maize
endosperm transfer cells (Figs. 2 and 3). The transfer cells from the seed coat of
CHAPTER I DISCUSSION
44
Gossypium hirsutum L. also contain both types of ingrowths in the same cells, but the
reticulate ingrowths are formed over the previously existing flange ingrowths (Pugh et
al. 2010), which differs significantly from our data.
Felker and Shannon (1980), Griffith et al. (1987), Felker et al. (1990), and others
have reported the prevalence of passive transport of sugars through these cells during
maize kernel development, mostly due to the activity of cell wallbound invertases
(Thompson et al. 2001). It has been suggested by Cheng et al. (1996) that the sucrose
gradient in MBETC must have a direct impact on the activity of the membrane-bound
and soluble forms of invertase. Considering that the reticulate ingrowths are
concentrated near the OPW, they may be more influenced by the concentration of
sucrose or other assimilates than the flange ingrowths. Alternatively, the reticulate
ingrowths may be more efficient than the flange ingrowths on assimilate uptake into
the endosperm.
Sugars (mostly monosaccharides) are transported into the endosperm by
diffusion and actively by membrane carriers (Felker and Goodwin 1988; Thompson et
al. 2001). Mitochondria were still very abundant next to both ingrowths at 12 and 20
DAP (Figs. 2j–k and 3o–p), and their cisternae were intact (unlike the cellularization
stages when the cisternae were barely visible; Monjardino et al. 2007), suggesting that
they are active. In addition, to assist the synthesis of new cell wall material, which was
still occurring at 20 DAP (Fig. 2k), these organelles must also have contributed to active
transport of assimilates into the endosperm (Thompson et al. 2001). However, the
extent by which it may occur is yet to be determined. Understanding more thoroughly
the mechanisms of assimilate uptake into the endosperm may be greatly improved by
CHAPTER I DISCUSSION
45
considering the existence of the two types of ingrowths in maize endosperm transfer
cells.
In conclusion, reticulate and flange ingrowths coexist from earlier stages of
development in the MBETC; they always differ from each other at ultrastructural level
and are located in different sites of the same cells. The inner transfer cells only
develop flange ingrowths. The reticulate ingrowths form a fenestrated complex next to
the OPW have less densely packed cellulose microfibrils with various orientations, but
still predominantly transverse to the cell's long axis, and are developed at 12 DAP. The
flange ingrowths develop for longer periods, at least until 20 DAP, the microfibrils are
more densely packed, mostly oriented parallel or oblique to the cell long axis, and they
form long and often interwoven structures. The coexistence of both types of ingrowths
in maize MBETC, to our knowledge, has not been reported in any other species.
1.6. ACKNOWLEDGMENTS
This research was supported in part by the Instituto de Biotecnologia e
Bioengenharia - Centro de Biotecnologia dos Açores, by Grant BIIC M3.1.6/F/038/2009
from Direcção Regional de Ciência e Tecnologia, and by Grant SFRH/BD/8122/2002
from Fundação para a Ciência e Tecnologia. The authors thank Richard M. Twyman and
Alan G Smith for critical review of the article and to Fabíola S. Gil for her technical
input.
CHAPTER I REFERENCES
46
1.7. REFERENCES
Becraft PW (2001) Cell fate specification in the cereal endosperm. Cell Dev Biol
12:387–394. doi:10.1006/scdb.2001.0268
Becraft PW, Yi G (2011) Regulation of aleurone development in cereal grains. J Exp Bot
62:1669–1675. doi:10.1093/jxb/erq372
Charlton WL, Keen CL, Merriman C, Lynch AJ, Grennland AJ, Dickinson HG (1995)
Endosperm development in Zea mays; implication of gametic imprinting and
paternal excess in regulation of transfer layer development. Development
121:3089–3097
Cheng WH, Taliercio EW, Chourey PS (1996) The Miniature1 seed locus of maize
encodes a cell wall invertase required for normal development of endosperm and
maternal cells in the pedicel. Plant Cell 8:971–983. doi:10.1105/tpc.8.6.971
Dahiya P, Brewin NJ (2000) Immunogold localization of callose and other cell wall
components in pea nodule transfer cells. Protoplasma 214:210–218.
doi:10.1007/BF01279065
Davis RW, Smith JD, Cobb BG (1990) A light and electron microscope investigation of
the transfer cell region of maize caryopses. Can J Bot 68:471–479.
doi:10.1139/B90-063
DeWitt G, Richards J, Mohnen D, Jones AM (1999) Comparative compositional analysis
of walls with two different morphologies: archetypical versus transfer-cell-like.
Protoplasma 209:238–245. doi:10.1007/BF01453452
Felker FC, Goodwin JC (1988) Sugar uptake by maize endosperm suspension cultures.
Plant Physiol 88:1235–1239

CHAPTER I REFERENCES
47
Felker FC, Shannon JC (1980) Movement of 14 C-labeled assimilates into kernels of Zea
mays L. III. An anatomical examination and microautoradiographic study of
assimilate transfer. Plant Physiol 65:864–870. doi:10.1104/pp.65.5.864
Felker FC, Liu K-C, Shannon JC (1990) Sugar uptake and starch biosynthesis by slices of
developing maize endosperm. Plant Physiol 94:996–1001.
doi:10.1104/pp.94.3.996
Gilmore EC, Rogers JS (1958) Heat units as a method of measuring maturity in corn.
Agron J 50:611–615. doi:10.2134/agronj1958.00021962005000100014x
Griffith SM, Jones RJ, Brenner ML (1987) In vitro sugar transport in Zea mays L. kernels;
I. Characteristics of sugar absorption and metabolism by developing maize
endosperm. Plant Phys 84:467–471. doi:10.1104/pp.84.2.467
Gunning BES, Pate JS (1969) “Transfer cells” plant cells with wall ingrowths in relation
to short distance transport of solutes—their occurrence, structure, and
development. Protoplasma 68:107–133. doi:10.1007/BF01247900
Gunning BES, Pate JS (1974) Transfer cells. In: Robards AW (ed) Dynamic aspects of
plant ultrastructure. McGraw-Hill, London, pp 441–479
Hoagland DR, Arnon DI (1938) The water-culture method for growing plants without
soil. California Agricultural Experiment Station. College of Agriculture. Circ. 347,
University of California, Berkeley
Kang B-H, Xiong Y, Williams DS, Pozueta-Romero D, Chourey PS (2009) Miniature1-
encoded cell wall invertase is essential for assembly and function of wall-in-
growth in the maize endosperm transfer cell. Plant Phys 151:1366–1376.
doi:10.1104/pp.109.142331
CHAPTER I REFERENCES
48
McCurdy DW, Patrick JW, Offler CE (2008) Wall ingrowth formation in transfer cells:
novel examples of localized wall deposition in plant cells. Curr Opin Plant Biol
11:653–661. doi:10.1016/j.pbi.2008.08.005
Monjardino P, Machado J, Gil FS, Fernandes R, Salema R (2007) Structural and
ultrastructural characterization of maize coenocyte and endosperm
cellularization. Can J Bot 85:216–223. doi:10.1139/B06-156
Offler CE, McCurdy DW, Patrick JW, Talbot MJ (2003) Transfer cells: cells specialized for
a special purpose. Annu Rev Plant Biol 54:431.454.
doi:10.1146/annurev.arplant.54.031902.134812
Pugh DA, Offler CE, Talbot MJ, Ruan Y-L (2010) Evidence for the role of transfer cells in
the evolutionary increase in seed and fiber biomass yield in cotton. Mol Plant
3:1075–1086. doi:10.1093/mp/ssq054
Salema R, Brandão I (1973) The use of PIPES buffer in the fixation of plant cells for
electron microscopy. J Submicrosc Cytol 5:79–96
Talbot MJ, Franceschi VR, McCurdy DW, Offler CE (2001) Wall ingrowth architecture in
epidermal transfer cells of Vicia faba cotyledons. Protoplasma 215:191–203.
doi:10.1007/BF01280314
Talbot MJ, Offler CE, McCurdy DW (2002) Transfer cell architecture: a contribution
towards understanding localized wall deposition. Protoplasma 219:197–209.
doi:10.1007/s007090200021
Talbot MJ, Wasteneys GO, McCurdy DW, Offler CE (2007a) Deposition patterns of
cellulose microfibrils in flange wall ingrowths of transfer cells indicate clear
parallels with those of secondary wall thickenings. Funct Plant Biol 34:307–313.
doi:10.1071/FP06273
CHAPTER I REFERENCES
49
Talbot MJ, Wasteneys GO, Offler CE, McCurdy DW (2007b) Cellulose synthesis is
required for deposition of reticulate wall ingrowths in transfer cells. Plant Cell
Physiol 48:147–158. doi:10.1093/pcp/pcl046
Thompson RD, Hueros G, Becker H-A, Maitz M (2001) Development and function of
seed transfer cells. Plant Sci 160:775–783. doi:10.1016/S0168-9452(01)00345-4
Vaughn KC, Talbot MJ, Offler CE, McCurdy DW (2007) Wall ingrowths in epidermal
transfer cells of Vicia faba cotyledons are modified primary walls marked by
localized accumulations of arabinogalactan proteins. Plant Cell Physiol 48:159–
168. doi:10.1093/pcp/pcl047
Wardini T, Wang X-D, Offler CE, Patrick JW (2007) Induction of wall ingrowths of
transfer cells occurs rapidly and depends upon gene expression in cotyledons of
developing Vicia faba seeds. Protoplasma 231:15–23. doi:10.1007/s00709-007-
0244-0
Young TE, Gallie DR (2000) Programmed cell death during endosperm development.
Plant Mol Biol 44:283–301. doi:10.1023/A:1026588408152
CHAPTER II
50
______________________________________________________________________
CHAPTER II
CORTICAL MICROTUBULE AND γ -TUBULIN ORGANIZATION PATTERNS OF DEVELOPING TRANSFER CELLS
AND STARCHY CELLS OF MAIZE (ZEA MAYS L.) ENDOSPERM
______________________________________________________________________
CHAPTER II ABSTRACT
51
2. CORTICAL MICROTUBULE AND γ-TUBULIN ORGANIZATION PATTERNS OF DEVELOPING TRANSFER CELLS
AND STARCHY CELLS OF MAIZE (ZEA MAYS L.) ENDOSPERM
2.1. ABSTRACT
The most basal endosperm transfer cells have both flange and reticulate
ingrowths developing in different cell walls. The starchy cells do not form ingrowths
and were used as reference to the transfer cell ingrowths development. The
organizational pattern of cortical microtubules and γ-tubulin complexes in both cells
types was studied with confocal laser scanning microscopy. The microtubules
associated with flange ingrowths formed long and mostly longitudinal bundles,
whereas the microtubules associated with reticulate ingrowths formed short and
curvilinear bundles that apparently surrounded the ingrowths. The γ-tubulin
complexes were mostly located adjacent to the microtubule bundles next to the flange
ingrowths and that seemed to be the case next to the reticulate ingrowths, but the
organizational pattern was not so clear. In the starchy cells, initially the microtubules
were randomly organized, but as these cells differentiated they bundled and became
mostly organized in a netlike array, then becoming mostly parallel and at final stages of
development they bundled less or even became individualized in tight parallel arrays.
The γ-tubulin complexes at early developmental stages were distributed in a
generalized manner throughout the cell periphery, then becoming organized in more
discrete locations as the microtubules bundled and at later developmental stages
became generally distributed. With these data we updated the models of the
contribution of microtubules and γ-tubulin to reticulate and flange ingrowth formation

CHAPTER II ABSTRACT
52
and proposed a new model for the contribution of microtubules and γ-tubulin to wall
formation in starchy cells of maize endosperm.
Keywords: Maize endosperm, Transfer cells, Starchy cells, Reticulate ingrowths, Flange
ingrowths, Microtubules, γ-tubulin
CHAPTER II INTRODUCTION
53
2.2. INTRODUCTION
There are just a few cereals that were domesticated for agriculture and they
showed to be paramount for the development of mankind and civilization. Moreover
they most likely will continue to play a major role for the future generations. Among all
cultivated cereals, maize stands out as one of the most cultivated worldwide, is the
most yielding and is used for food, feed and countless industrial applications from
biofuels to cosmetics and pharmaceuticals, therefore it deserves particular research
interest. Millenniums of selection led to maize cultivars in which the endosperm
accounts for approximately 80% of the caryopsis biomass. The endosperm is made of
three main types of cells: a) the transfer cells, which are the first to differentiate and
assure the flow of assimilates into the developing endosperm; b) the aleurone layer
cells which are the only ones that will remain alive after physiological maturity and
provide enzymes that will degrade the stored assimilates during germination; c) the
starchy cells which will make the bulk of the endosperm and accumulate starch and
proteins (Becraft 2001).
Transfer cells are the only ones in maize endosperm to develop ingrowths, thus
enhancing membrane surface and the number of transport proteins that provide them
a great capacity to transport assimilates (Offler et al. 2003). The most basal endosperm
transfer cells (MBETC) form reticulate and flange ingrowths (Monjardino et al. 2013)
starting at 5 days after pollination (DAP), whereas the inner transfer cells (up to three
to six cells inwards) form only flange ingrowths (Davis et al. 1990; Talbot et al. 2002;
Offler et al. 2003; Monjardino et al. 2013). The reticulate ingrowths form next to the
outer periclinal wall (OPW) and can extend into the cytosol at least 7 μm, whereas the
flange ingrowths, despite being formed in the other walls, at later developmental

CHAPTER II INTRODUCTION
54
stages may extend to a point of not only occupying almost all the periphery of these
cells, but also to mix with the reticulate ingrowths (Talbot et al. 2002; Monjardino et al.
2013). To our knowledge, the MBETC of maize endosperm are the only known transfer
cells reported to develop simultaneously reticulate and flange ingrowths with this
pattern (Monjardino et al. 2013), although reviewing other lab’s publications we
believe that the same must happen in the endosperm transfer cells of Sorghum bicolor
(Wang et al. 2012) and eventually in other species of the Poaceae family. In any case
the MBETC of maize provide an excellent system to understand the mechanisms that
lead to the development of both types of ingrowths.
The starchy cells differentiate later than the transfer cells, are characterized by
great metabolic activity during kernel development, however they undergo apoptosis
before physiological maturity, leading then to a non-living reserve tissue (Young et al.
1997; Young and Gallie 2000; Sabelli 2012). From 5 to 12 DAP the endosperm grows
very rapidly involving both cell division and cell expansion (Kiesselbach 1949; Young
and Gallie 2000). Cell division ceases within the central endosperm by about 12 DAP,
but continues in the peripheral regions up to 25 DAP. Subsequent to this, cells in the
central endosperm increase in size while the outermost cells of the endosperm
differentiate into the aleurone layer (Duvik 1961; Kyle and Styles 1977; Young and
Gallie 2000; Consonni et al. 2005). Starch begins to accumulate in the central
endosperm cells around 10 DAP and proceeds until they enter into apoptosis
(Kiesselbach 1949; Young and Gallie 2000). Apoptosis begins in the central region of
the endosperm at around 16 DAP and a second wave of apoptosis initiates at the
crown (i.e. the upper region of the endosperm close to the silk scar) around 20 DAP
CHAPTER II INTRODUCTION
55
and proceeds towards the base of the kernel between 24 and 40 DAP (Young et al.
1997; Young and Gallie 2000; Sabelli 2012).
It has recently been demonstrated that microtubules provide orientation to the
bidirectional movement of cellulose synthase complexes, indicating a direct
mechanism for guidance of cellulose deposition by the cytoskeleton (Paredez et al.
2006), thus controlling the shape and size of the cell walls. The microtubules are very
dynamic structures that undergo stochastic shifts between periods of steady growth
and catastrophic depolymerization. Nucleation occurs mostly from existing
microtubules, and it is only on rare occasions that the initiating of microtubules has
been found in the absence of previous ones (Job et al. 2003; Murata et al. 2005;
Nakamura et al. 2010). When nucleation occurs the new microtubules may be
synthesized parallel to the existing ones, forming an instantaneous bundle, or branch
with angles that in most cases vary between 30º and 40º (Wasteneys and Williamson
1989; Murata et al. 2005; Chan et al. 2009; Nakamura et al. 2010). The recently formed
microtubules may detach from those they originated from (Wasteneys and Williamson
1989; Murata et al. 2005), migrating through the cortex by hybrid treadmilling (Shaw
et al. 2003). The older microtubules may also depolymerize leaving the new ones free
(Murata et al. 2005).
The interaction between microtubules can originate different outcomes
depending mainly on the angle of the encounter, the type of cell, the developmental
stage and the species (Shaw et al. 2003; Dixit and Cyr 2004; Chan et al. 2007;
Wightman and Turner 2007; Chan et al. 2009). In encounter angles below 40º,
bundling or ‘zippering’ is a likely outcome and at steeper angles, the contacting
microtubules can depolymerize (Dixit and Cyr 2004), to cross over continuing to grow
CHAPTER II INTRODUCTION
56
in its original direction (Shaw et al. 2003; Chan et al. 2007), or to sever at the crossover
point, leading to the depolymerization of the lagging end (Wightman and Turner 2007;
Chan et al. 2009).
Microtubule bundles were estimated to be more stable than individual ones
(Chan et al. 2007; Ehrhardt 2008). Cellulose synthase complexes are in many cases
associated with microtubule bundles, because they require stability of such structures,
they move slowly along them and the motive force for complex motility is provided
primarily by cellulose polymerization (Lloyd 1984; Paredez et al. 2006). Recently it has
been found that microtubule bundles are subject to depolymerization like individual
microtubules (Shaw and Lucas 2011), and the temporal persistence and length of
microtubule bundles is largely dependent upon recruitment or nucleation of new
treadmilling microtubules (Chan et al. 2009; Nakamura et al. 2010; Shaw and Lucas
2011).
The γ-tubulin has been considered essential in microtubule nucleation (Erhardt
et al. 2002; Murata et al. 2005; Nakamura et al. 2010). Two main γ-tubulin complexes
have been identified in plants, one of approximately 750 kDa and another larger than
1500 kDa (Stoppin-Mellet et al. 2000; Schmit 2002). The γ-tubulin complexes move
through the cytosol, but preferably are situated along existing microtubules, and
transiently are located in other parts of the cytosol (Nakamura et al. 2010). These
complexes have been associated with branch nucleated, parallel nucleated and free
nucleated microtubules (Murata et al. 2005; Chan et al. 2009; Nakamura et al. 2010).
However the new microtubules that arise from branching may detach from the original
microtubules with or without γ-tubulin complexes (Chan et al. 2003). Moreover it does
not seem that γ-tubulin complexes at branching nucleation sites typically persist to

CHAPTER II INTRODUCTION
57
participate in new rounds of nucleation from the same location (Murata et al. 2005;
Nakamura et al. 2010).
A model for flange ingrowth development was proposed by Talbot et al. (2007a)
and later reviewed by McCurdy et al. (2008), based in the differentiation of transfer
cells of wheat xylem and in other cells with secondary growths with parallel
organization of cellulose microfibrils similar to flange ingrowths (Falconer and Seagull
1985; Kremer and Drinnan 2004; Oda et al. 2005). At first the cellulose fibers are
randomly organized and microtubule bundles position next to the walls thus
anticipating the future sites of ingrowth formation. The microtubule bundles will lead
vesicles that carry cellulose synthase complexes to the growing ingrowths. These
complexes run along the microtubule bundles, thus contributing to ingrowth
enlargement. Once the ingrowths reach a certain size, the self-assembly of cellulose
fibers and other polysaccharides of the wall matrix may occur without the assistance of
the microtubules. At this stage the microtubules do not overlie any more the
ingrowths, but instead they can only flank those (Talbot et al. 2007a; Wightman and
Turner 2008; McCurdy et al. 2008).
The reticulate ingrowths are unique structures within the transfer cells and have
deserved multiple and consensual characterization studies (Talbot et al. 2001; Offler et
al. 2003). However the contribution of microtubules in the formation of such
structures has had multiple interpretations, but all considering that cellulose synthesis
is essential (Bulbert et al. 1998; Singh et al. 1999; Talbot et al. 2007b; McCurdy et al.
2008) and that can have an important influence in the assembly of the other wall
components (Delmer 1987; Satiat-Jeunemaitre 1987; Jarvis 1992; Vincent 1999; Baskin
2001). A more recent model (McCurdy et al. 2008) proposes that long and linear

CHAPTER II INTRODUCTION
58
microtubules situate aberrant cellulose synthase complexes that form the papillae. In
the mean time the cortical microtubules are reorganized to random bundles, which
constrain the cellulose synthase complexes to the growing tips of the ingrowth
structures. The constrained rosettes consequently move in a circular fashion around
the papillae tip, thus laying down the whorled patterns of microfibrils. The emerging
ingrowths displace and create ‘holes’ in the cortical microtubule network as they
project into the cytoplasm.
The importance of reticulate and flange ingrowths of maize endosperm transfer
cells to kernel growth is the main reason why we did this study. We have determined
how microtubules contributed to the differentiation of both ingrowths, related that
with the organization pattern of γ-tubulin, and compared with the development of
starchy cells walls. We have reviewed the models for reticulate and flange ingrowth
development and proposed a new model for starchy endosperm wall development.
CHAPTER II MATERIALS AND METHODS
59
2.3. MATERIALS AND METHODS
Plant material, growth conditions and sampling
Maize seeds (inbred W64A) were planted in a naturally lit greenhouse in 20-L
pots containing Andosol loam soil (in 2009 and 2011) at the Universidade dos Açores
campus of Angra do Heroísmo. Plants were fertilized weekly, alternating 3 g of
commercial fertilizer (20/5/10) with 100 mL of Hoagland's solution per pot. Controlled
pollinations were carried out on all test plants.
The temperature was recorded daily during early kernel development allowing
the calculation of growing degree days (GDD) according to the formula
GDD=Σ(ADT−BT), where ADT is the average daily temperature and BT is the base
temperature of 10 °C (Gilmore and Rogers 1958). Minimum temperatures <10 °C were
adjusted to 10 °C, and maximum temperatures >30 °C were adjusted to 30 °C. The
developmental stages were therefore described as DAP and references were made to
GDD.
For each sampling date, 30 to 40 kernels were collected from at least 10 different
ears. Transfer cells located between the germinal side and the mid placentochalazal
region and starchy cells from the central endosperm region were analyzed.
Confocal laser scanning microscopy (CLSM)
Five to 20 DAP kernels were sectioned longitudinally (70–100 μm thicknesses) on
a Leica VT 1200 vibratome (Leica Microsystems, Wetzlar, Germany) in 4%
paraformaldehyde plus 0.1% glutaraldehyde in 60 mM PIPES, 25 mM HEPES, 2 mM
MgCl2, 10 mM EGTA and 5% dimethyl sulfoxide at pH 6.9 (PHEM/DMSO) buffer (Brown

CHAPTER II MATERIALS AND METHODS
60
and Lemmon 1995) for 2 h, after which the sections were washed in the same buffer.
Microtubules were probed with 1:30 rat anti α-tubulin monoclonal antibody YOL1/34
(Accurate Chemical and Scientific Corporation, Westbury, New York) in PHEM/DMSO
(Brown and Lemmon 1995) for 3 hours at room temperature and as secondary
antibody was used 1:150 Alexafluor 546 goat anti-rat (Invitrogen, Carlsbad, CA) in the
same buffer for 2 hours also at room temperature. γ-tubulin was probed with 1:60
mouse monoclonal GTU-88 antibody (Abcam, Cambridge, United Kingdom) in
PHEM/DMSO (Brown and Lemmon 1995) for 3 hours and as secondary antibody was
used 1:150 Alexafluor 488 goat anti-mouse in the same buffer for 2 hours. Sections
were then washed in a buffer containing 137 mM NaCl, 2.7 mM KCl, 40.2 mM
Na2HPO4, and 17.6 mM KH2PO4 at pH 7.4 (PBS) and cellulose was stained with filtered
0.01 % calcofluor white for 1 to 2 min, and washed again in PBS buffer. Sections were
visualized under a Zeiss CLSM 510 (Carl Zeiss Oberkochen, Germany). Alexafluor 546
was excited at 543 nm (He/Ne laser) and detected with a long pass filter 560 nm.
Alexafluor 488 was excited at 488 nm (argon laser) and detected with a band pass filter
505–530 nm. Calcofluor was excited at 405 nm (UV diode laser) and detected with a
band pass filter 420–480 nm. The projected images were obtained from Z stacks at a
resolution of 1,024×1,024 pixels. The Z stacks contained 24–123 planes at 0.37 μm
intervals.
Transmission electron microscopy (TEM)
Kernels were sectioned longitudinally (200–500 μm thicknesses) on a Leica VT
1200 vibratome in 4% paraformaldehyde dissolved in PHEM/DMSO (Brown and
Lemmon 1995) and were immediately fixed in 4% glutaraldehyde plus 4%
CHAPTER II MATERIALS AND METHODS
61
paraformaldehyde in PIPES buffer and second postfixed in 2% osmium tetroxide in the
same buffer for two hours at room temperature in each step (Monjardino et al. 2013).
The fixed sections were dehydrated in acetone and progressively infiltrated in Spurr's
resin over 8 days at room temperature before polymerization at 60 °C.
Ultrathin sections (40–60 nm thickness) were prepared on a LKB 2188 NOVA
Ultramicrotome (LKB NOVA, Bromma, Sweden) using diamond knives (Diatome, Biel,
Switzerland). The sections were mounted on 200 mesh copper or nickel grids (Agar
Scientific, Essex, UK), stained with uranyl acetate and lead citrate for 15 minutes each,
and examined under a JEOL JEM 1400 TEM (Tokyo, Japan). Images were digitally
recorded using a Gatan SC 1000 ORIUS CCD camera (Warrendale, PA, USA). The
observations were made on starchy cells walls of 7, 10, 12 and 20 DAP kernels. For
each sample, cell wall thickness was measured three times, and averaged. The number
of replicates per sampling date varied from 10 to 14.
All selected images were imported into Adobe Photoshop CS software (Adobe
Systems, San Jose, CA) for presentation and photomontages were produced in the
same software.
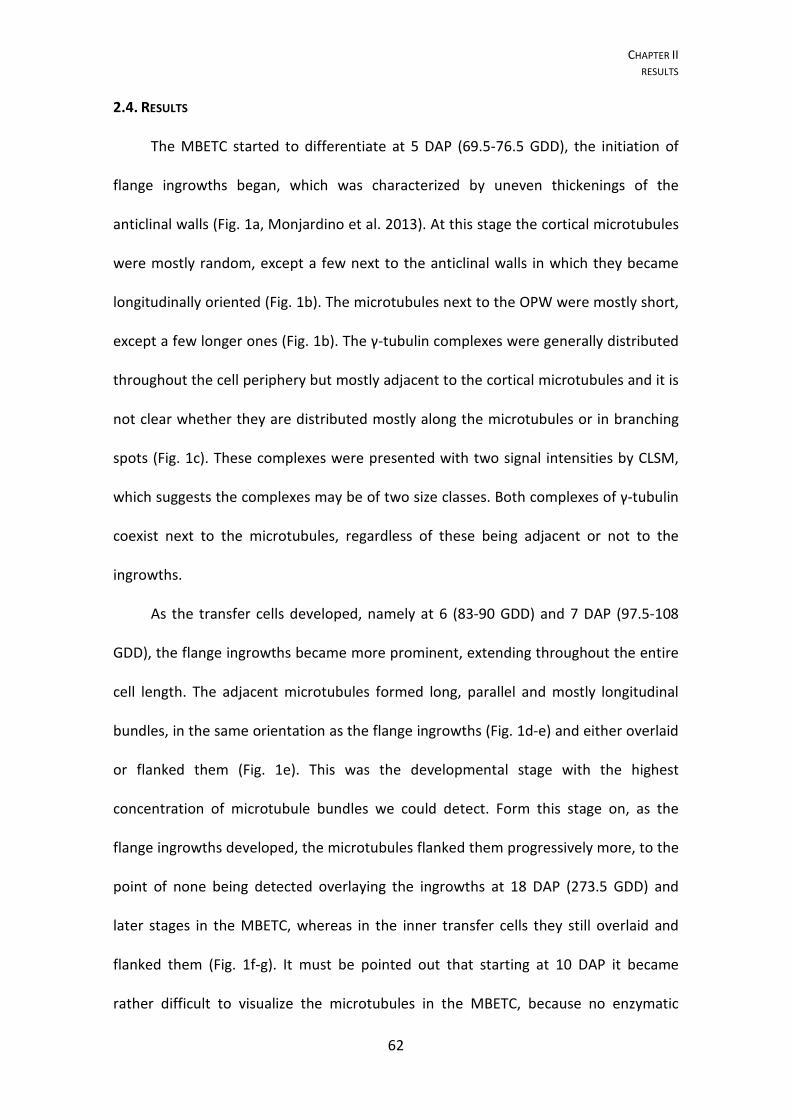
CHAPTER II RESULTS
62
2.4. RESULTS
The MBETC started to differentiate at 5 DAP (69.5-76.5 GDD), the initiation of
flange ingrowths began, which was characterized by uneven thickenings of the
anticlinal walls (Fig. 1a, Monjardino et al. 2013). At this stage the cortical microtubules
were mostly random, except a few next to the anticlinal walls in which they became
longitudinally oriented (Fig. 1b). The microtubules next to the OPW were mostly short,
except a few longer ones (Fig. 1b). The γ-tubulin complexes were generally distributed
throughout the cell periphery but mostly adjacent to the cortical microtubules and it is
not clear whether they are distributed mostly along the microtubules or in branching
spots (Fig. 1c). These complexes were presented with two signal intensities by CLSM,
which suggests the complexes may be of two size classes. Both complexes of γ-tubulin
coexist next to the microtubules, regardless of these being adjacent or not to the
ingrowths.
As the transfer cells developed, namely at 6 (83-90 GDD) and 7 DAP (97.5-108
GDD), the flange ingrowths became more prominent, extending throughout the entire
cell length. The adjacent microtubules formed long, parallel and mostly longitudinal
bundles, in the same orientation as the flange ingrowths (Fig. 1d-e) and either overlaid
or flanked them (Fig. 1e). This was the developmental stage with the highest
concentration of microtubule bundles we could detect. Form this stage on, as the
flange ingrowths developed, the microtubules flanked them progressively more, to the
point of none being detected overlaying the ingrowths at 18 DAP (273.5 GDD) and
later stages in the MBETC, whereas in the inner transfer cells they still overlaid and
flanked them (Fig. 1f-g). It must be pointed out that starting at 10 DAP it became
rather difficult to visualize the microtubules in the MBETC, because no enzymatic
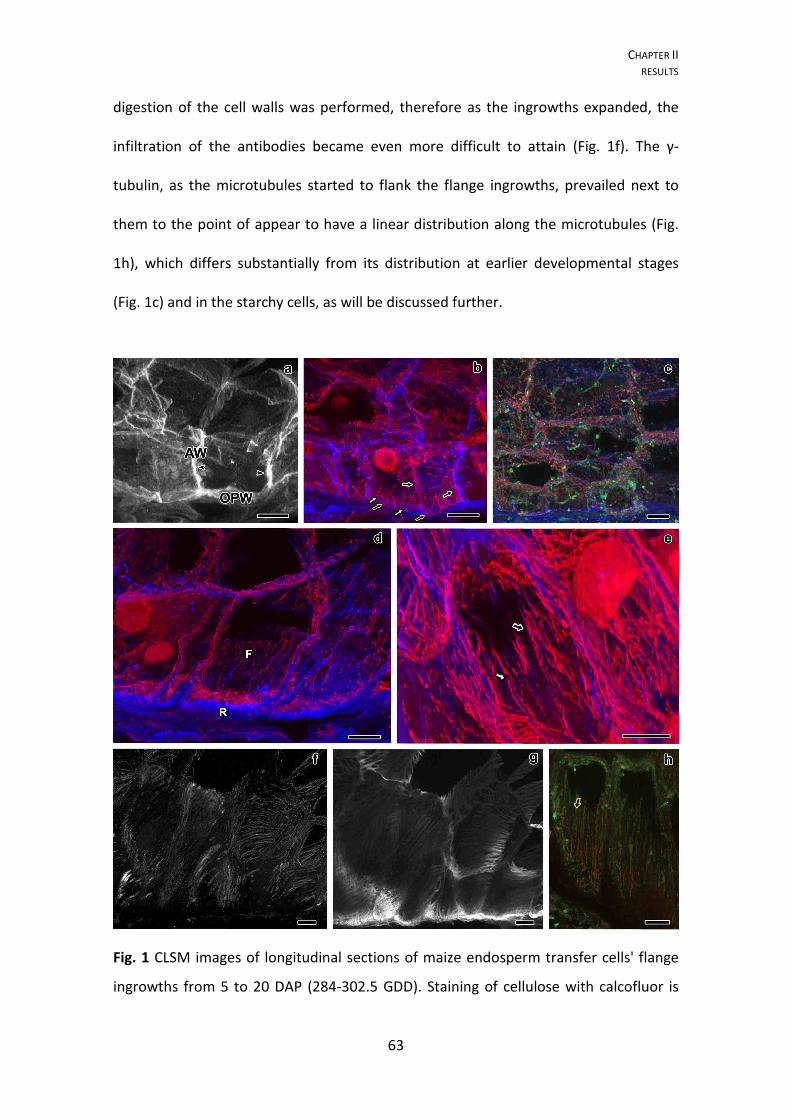
CHAPTER II RESULTS
63
digestion of the cell walls was performed, therefore as the ingrowths expanded, the
infiltration of the antibodies became even more difficult to attain (Fig. 1f). The γ-
tubulin, as the microtubules started to flank the flange ingrowths, prevailed next to
them to the point of appear to have a linear distribution along the microtubules (Fig.
1h), which differs substantially from its distribution at earlier developmental stages
(Fig. 1c) and in the starchy cells, as will be discussed further.
Fig. 1 CLSM images of longitudinal sections of maize endosperm transfer cells' flange
ingrowths from 5 to 20 DAP (284-302.5 GDD). Staining of cellulose with calcofluor is
CHAPTER II RESULTS
64
presented in white (a, g) or blue (b-e); immunolabeling of cortical microtubules is
presented in red (b-e, h) or white (f); immunolabeling of γ-tubulin is presented in
green (c, h). a view of initiating flange ingrowths (black arrow head with white stroke)
adjacent to the anticlinal walls at 5 DAP. b double labeling of cellulose and
microtubules; most of the microtubules in the MBETC at 5 DAP have a random
organization, except a few near the anticlinal walls (black arrows with white stroke);
the microtubules near the OPW (white arrows with black stroke) are usually shorter
than those next to the anticlinal walls, although in rare occasions they may be equally
long (black arrow with yellow stroke). c triple labeling of cellulose, microtubules and γ-
tubulin at 5 DAP. d MBETC at 6 DAP in which flange (F) and reticulate (R) ingrowths
were identified through cellulose labeling, together with microtubule labeling. e
MBETC at 7 DAP in which microtubules flank flange ingrowths (white wide arrow with
black stroke) or overlie them (black wide arrow with white stroke). f cortical
microtubules of endosperm transfer cells at 18 DAP. g cellulose microfibrils of
endosperm transfer cells at 18 DAP (same sample as in f). h endosperm transfer cells
at 20 DAP in which γ-tubulin is mostly linearly distributed near the microtubules (black
arrow with yellow stroke). Scale bars=10 μm.
The reticulate ingrowths developed only in the MBETC, therefore the reported
data is restricted to the first 10 DAP. At 5 DAP we could not detect such structures with
the CLSM (Fig. 1a), but with the transmission electron microscope (TEM) it is possible
to observe them (Monjardino et al. 2013). At this stage most of the microtubules next
to the OPW were short and this trend became even more evident in the following
developmental stages (Fig. 1b). At 6 DAP the reticulate ingrowths were detected by
CLSM and the adjacent microtubules were rather abundant, short and curvilinear (Fig.
2a-b). These microtubules seemed to bundle, but considering that they were so close
to each others, it should not be ruled out the possibility of existing individual ones. At 7
DAP these microtubules became even more abundant and apparently they entangled
CHAPTER II RESULTS
65
with the reticulate ingrowths (Fig. 2c-d), but remained short and curvilinear, which led
us to assume that they may surround the branches and tips of the forming fenestrated
layer (Fig. 2d). At this stage the γ-tubulin complexes were very abundant and uniformly
distributed next to the reticulate ingrowths (Fig. 2e-f), which suggests that there may
be many nucleation spots of microtubules to assist the formation of these ingrowths.
Fig. 2 CLSM observation of longitudinal sections of maize endosperm transfer cells’
reticulate ingrowths from 6 and 7 DAP. All images were obtained from the MBETC.
Immunolabeling of cortical microtubules is shown in red, cellulose with calcofluor
appears in blue, and immunolabeling of γ-tubulin is shown in green. a MBETC of 6 DAP
kernels with very short and curvilinear microtubules (white arrow heads with black
stroke) next to the OPW. b same image as in a plus cellulose labeling. c MBETC of 7
DAP kernels with very short microtubules next to the OPW. d the same image as in c)
plus cellulose labeling. e microtubules and γ-tubulin labeling of 7 DAP MBETC. f same
as in e) plus cellulose labeling. Scale bars=10 μm.
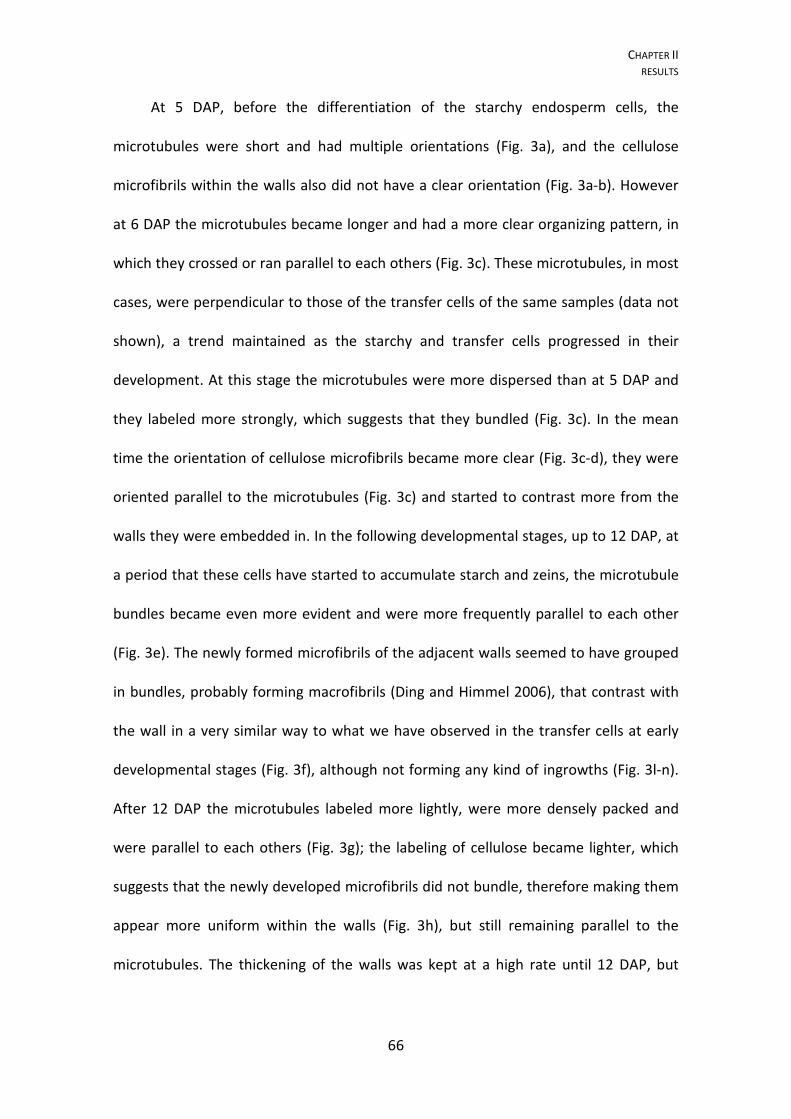
CHAPTER II RESULTS
66
At 5 DAP, before the differentiation of the starchy endosperm cells, the
microtubules were short and had multiple orientations (Fig. 3a), and the cellulose
microfibrils within the walls also did not have a clear orientation (Fig. 3a-b). However
at 6 DAP the microtubules became longer and had a more clear organizing pattern, in
which they crossed or ran parallel to each others (Fig. 3c). These microtubules, in most
cases, were perpendicular to those of the transfer cells of the same samples (data not
shown), a trend maintained as the starchy and transfer cells progressed in their
development. At this stage the microtubules were more dispersed than at 5 DAP and
they labeled more strongly, which suggests that they bundled (Fig. 3c). In the mean
time the orientation of cellulose microfibrils became more clear (Fig. 3c-d), they were
oriented parallel to the microtubules (Fig. 3c) and started to contrast more from the
walls they were embedded in. In the following developmental stages, up to 12 DAP, at
a period that these cells have started to accumulate starch and zeins, the microtubule
bundles became even more evident and were more frequently parallel to each other
(Fig. 3e). The newly formed microfibrils of the adjacent walls seemed to have grouped
in bundles, probably forming macrofibrils (Ding and Himmel 2006), that contrast with
the wall in a very similar way to what we have observed in the transfer cells at early
developmental stages (Fig. 3f), although not forming any kind of ingrowths (Fig. 3l-n).
After 12 DAP the microtubules labeled more lightly, were more densely packed and
were parallel to each others (Fig. 3g); the labeling of cellulose became lighter, which
suggests that the newly developed microfibrils did not bundle, therefore making them
appear more uniform within the walls (Fig. 3h), but still remaining parallel to the
microtubules. The thickening of the walls was kept at a high rate until 12 DAP, but
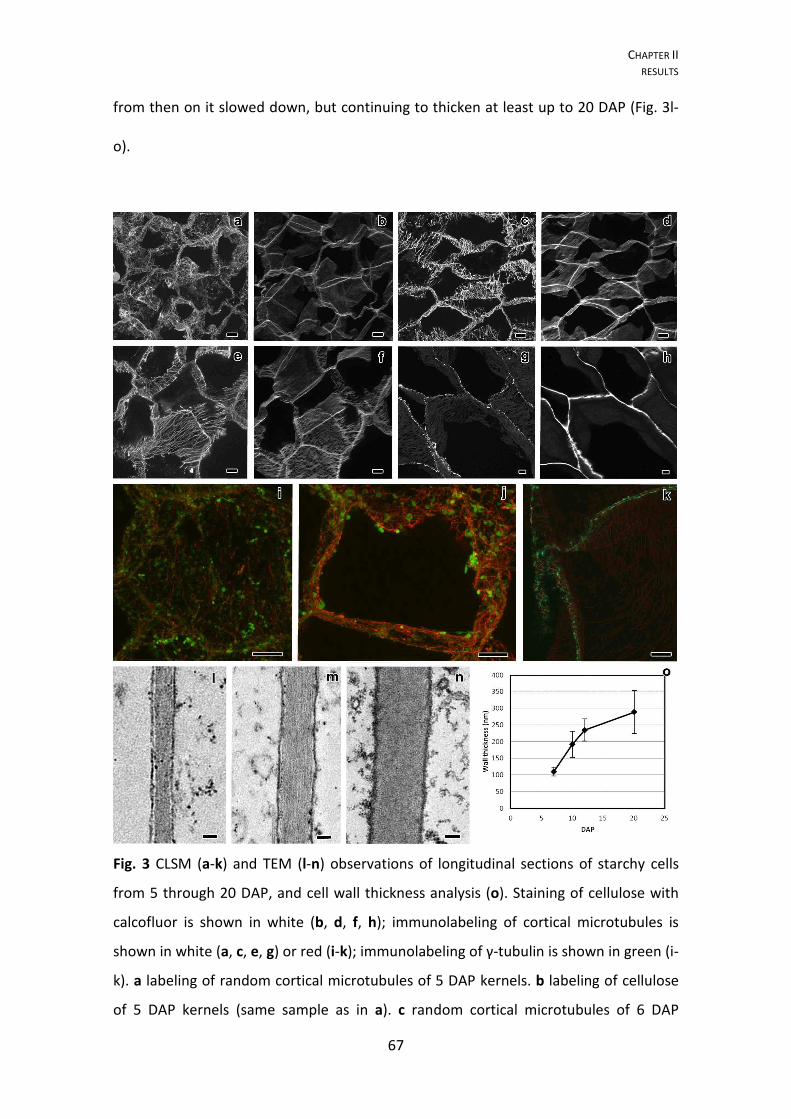
CHAPTER II RESULTS
67
from then on it slowed down, but continuing to thicken at least up to 20 DAP (Fig. 3l-
o).
Fig. 3 CLSM (a-k) and TEM (l-n) observations of longitudinal sections of starchy cells
from 5 through 20 DAP, and cell wall thickness analysis (o). Staining of cellulose with
calcofluor is shown in white (b, d, f, h); immunolabeling of cortical microtubules is
shown in white (a, c, e, g) or red (i-k); immunolabeling of γ-tubulin is shown in green (i-
k). a labeling of random cortical microtubules of 5 DAP kernels. b labeling of cellulose
of 5 DAP kernels (same sample as in a). c random cortical microtubules of 6 DAP
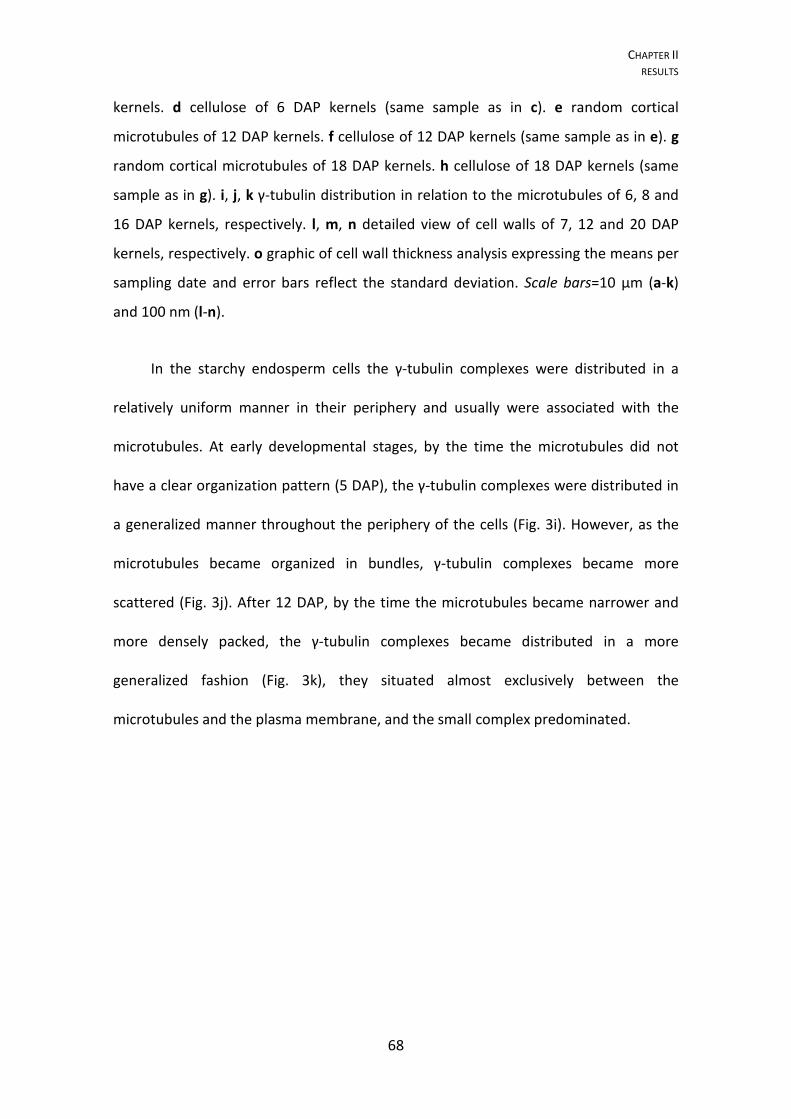
CHAPTER II RESULTS
68
kernels. d cellulose of 6 DAP kernels (same sample as in c). e random cortical
microtubules of 12 DAP kernels. f cellulose of 12 DAP kernels (same sample as in e). g
random cortical microtubules of 18 DAP kernels. h cellulose of 18 DAP kernels (same
sample as in g). i, j, k γ-tubulin distribution in relation to the microtubules of 6, 8 and
16 DAP kernels, respectively. l, m, n detailed view of cell walls of 7, 12 and 20 DAP
kernels, respectively. o graphic of cell wall thickness analysis expressing the means per
sampling date and error bars reflect the standard deviation. Scale bars=10 μm (a-k)
and 100 nm (l-n).
In the starchy endosperm cells the γ-tubulin complexes were distributed in a
relatively uniform manner in their periphery and usually were associated with the
microtubules. At early developmental stages, by the time the microtubules did not
have a clear organization pattern (5 DAP), the γ-tubulin complexes were distributed in
a generalized manner throughout the periphery of the cells (Fig. 3i). However, as the
microtubules became organized in bundles, γ-tubulin complexes became more
scattered (Fig. 3j). After 12 DAP, by the time the microtubules became narrower and
more densely packed, the γ-tubulin complexes became distributed in a more
generalized fashion (Fig. 3k), they situated almost exclusively between the
microtubules and the plasma membrane, and the small complex predominated.

CHAPTER II DISCUSSION
69
2.5. DISCUSSION
Maize endosperm transfer cells are very important to elucidate the causes of the
development of each type of ingrowth, because the most basal ones have reticulate
and flange ingrowths arising from distinct walls. In this study we observed that the
cortical microtubules of the transfer cells presented two main organization patterns: a)
long bundles predominantly longitudinal adjacent to the flange ingrowths; b) short
bundles and individual structures, curvilinear and with multiple orientations adjacent
to the reticulate ingrowths. The first pattern has been referenced during the secondary
growth of xylem elements of several species (Falconer and Seagull 1985; Oda et al.
2005) and during the formation of flange ingrowths of xylem transfer cells of wheat
stem nodes (Talbot et al. 2007a). However the second pattern has been much less
referenced, as is the case of Vicia faba epidermal cells of cotyledons (Bulbert et al.
1998) and placenta transfer cells of Lilium spp (Singh et al. 1999). The microtubule
organization pattern next to the reticulate ingrowths has no parallel in the maize
endosperm cells; therefore we consider it to be specific to these structures. Despite
our data not corroborating part of the model proposed by McCurdy et al. (2008), it is
important to state that this was a consistent pattern next to the reticulate ingrowths of
all analyzed samples.
The bundling process of the microtubules adjacent to the flange ingrowths may
derive from small encounter angles (<40º) which lead to mutual coalignement (Dixit
and Cyr 2004) plus new synthesis of parallel microtubules (Nakamura et al. 2010), and
to selective depolymerization of microtubules that form large encounter angles (Dixit
and Cyr 2004; Wightman and Turner 2007; Chan et al. 2009). The short size of the
microtubules adjacent to the OPW may be due to the high degree of entanglement
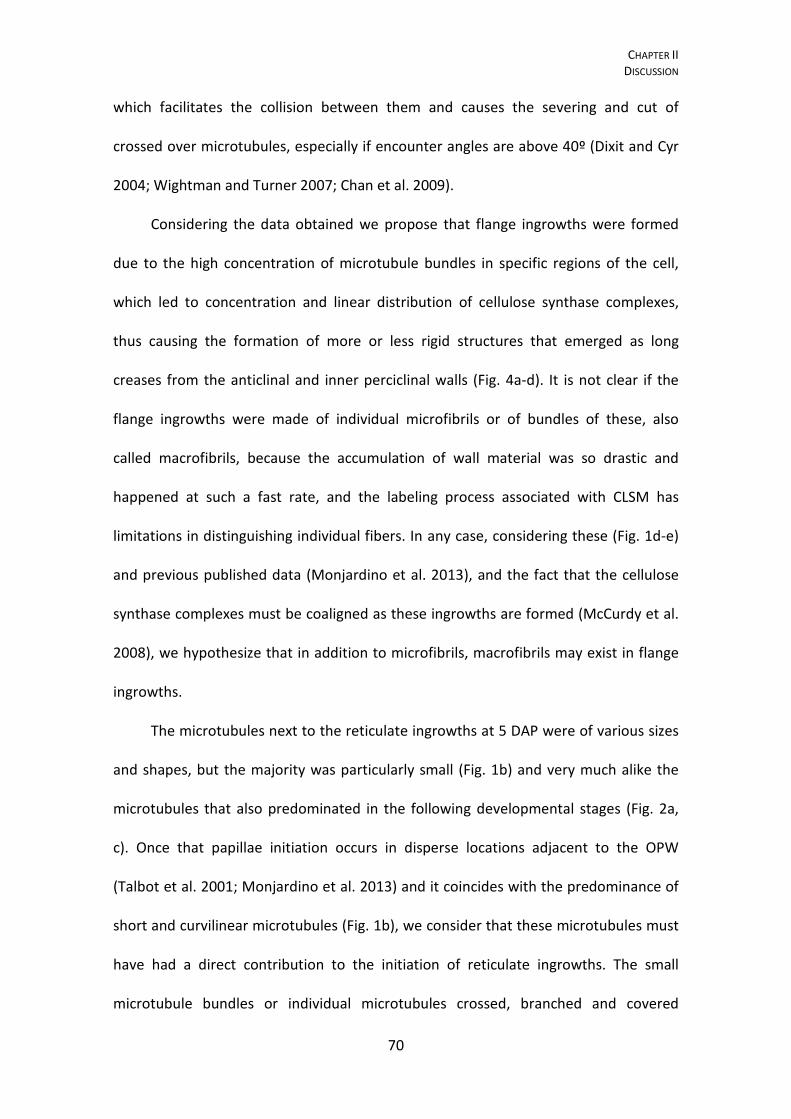
CHAPTER II DISCUSSION
70
which facilitates the collision between them and causes the severing and cut of
crossed over microtubules, especially if encounter angles are above 40º (Dixit and Cyr
2004; Wightman and Turner 2007; Chan et al. 2009).
Considering the data obtained we propose that flange ingrowths were formed
due to the high concentration of microtubule bundles in specific regions of the cell,
which led to concentration and linear distribution of cellulose synthase complexes,
thus causing the formation of more or less rigid structures that emerged as long
creases from the anticlinal and inner perciclinal walls (Fig. 4a-d). It is not clear if the
flange ingrowths were made of individual microfibrils or of bundles of these, also
called macrofibrils, because the accumulation of wall material was so drastic and
happened at such a fast rate, and the labeling process associated with CLSM has
limitations in distinguishing individual fibers. In any case, considering these (Fig. 1d-e)
and previous published data (Monjardino et al. 2013), and the fact that the cellulose
synthase complexes must be coaligned as these ingrowths are formed (McCurdy et al.
2008), we hypothesize that in addition to microfibrils, macrofibrils may exist in flange
ingrowths.
The microtubules next to the reticulate ingrowths at 5 DAP were of various sizes
and shapes, but the majority was particularly small (Fig. 1b) and very much alike the
microtubules that also predominated in the following developmental stages (Fig. 2a,
c). Once that papillae initiation occurs in disperse locations adjacent to the OPW
(Talbot et al. 2001; Monjardino et al. 2013) and it coincides with the predominance of
short and curvilinear microtubules (Fig. 1b), we consider that these microtubules must
have had a direct contribution to the initiation of reticulate ingrowths. The small
microtubule bundles or individual microtubules crossed, branched and covered

CHAPTER II DISCUSSION
71
entirely the inner side of OPW at 6 DAP (Fig. 2a-b). The apparently chaotic organization
of the microtubules (Fig. 2a, c, e) is consistent with the fenestrated layer that rapidly
formed in the MBETC, with multiple branching points and galleries, thus leading to the
detection of microtubules within reticulate ingrowths (Fig. 2b, d, f). The high density of
microtubules adjacent to the reticulate ingrowths must have oriented many cellulose
synthase complexes in the inner side of the OPW, more evenly and randomly
distributed than next to the other cell walls of the MBETC (Fig. 1d-e). The irregular
surface of the newly formed reticulate labyrinth must have caused restrictions in the
distribution of the microtubules and consequently of the cellulose synthase complexes,
therefore it per se may have restrained its own expansion and perpetuated the
irregularity of these ingrowths.
The γ-tubulin complexes were fairly concentrated near the microtubules
adjacent to flange and reticulate ingrowths. The distribution of γ-tubulin rapidly
became mostly linear and close to the longitudinal microtubule bundles, probably to
assure their persistency throughout the development of flange ingrowths. On the
other hand, the γ-tubulin complexes had a more dispersed distribution near the
reticulate ingrowths than to the flange ingrowths at early developmental stages (Fig.
2e-f) and we believe that it should maintain this pattern at later developmental stages.
Considering the complex structure formed by the short microtubules and reticulate
ingrowths, it was not possible to clearly determine how γ-tubulin contributed to
nucleation of the microtubules. In any case the microtubules must have an
organization pattern that assures the movement of cellulose synthase to numerous
initiation spots, to allow them to expand, unlike the well defined pattern of the flange
CHAPTER II DISCUSSION
72
ingrowths (Fig. 2b, d). The coexistence of the two size γ-tubulin complexes next to both
ingrowths remained throughout development.
The starchy cells differentiation course is rather distinct from the transfer cells
and that may have resulted from different organization patterns of the microtubules
and γ-tubulin complexes. Before these cells differentiate and start to accumulate large
quantities of assimilates, the microtubules were randomly organized (Fig. 3a), but
progressively bundled and became more dispersed and predominantly crossed (Fig.
3c), thus forming a netlike array, or in some cases formed parallel arrays. The netlike
and parallel arrays are not necessarily mutually exclusive, because it has been
observed that parallel microtubules may continue in contiguous walls, whereas in
some walls (sacrificial walls) the parallel microtubules of adjacent walls cross, thus
forming a netlike array (Flanders et al. 1989). However, considering that the netlike
array predominated, the existence of sacrificial walls must have been marginal. As the
starchy cells developed up to 12 DAP (Fig. 3e), the parallel array became predominant,
and the netlike arrays that still existed may have been induced by internal factors of
the cell or may have resulted from crossing of parallel microtubules from contiguous
walls. The phenomenon of microtubules that cross, even at steeper angles (>40º), and
still continue to grow has been reported before (Shaw et al. 2003; Chan et al. 2007;
Wightman and Turner 2007), and that seems to happen in the starchy cells up to 12
DAP. However this probably was not the case in the microtubules adjacent to the
reticulate ingrowths, and there is not a specific reason for which we may account for
such differences. At later developmental stages (after 12 DAP), at a period that these
cells actively accumulated starch and proteins, the microtubules became individually
organized or the bundles aggregated much less numbers of microtubules and these
CHAPTER II DISCUSSION
73
became organized in tight parallel arrays (Fig. 3g). At 18 DAP these cells were very
close to undergo apoptosis (data not shown), therefore we presume that this trait
would remain till the end of these cell’s life cycle.
The γ-tubulin complexes distribution pattern varied in starchy cells throughout
development. At earlier to mid developmental stages both sizes of γ-tubulin complexes
coexisted, whereas at later developmental stages the small size complexes
predominated (Fig. 3i-k). The reasons that may account for such differences are not
clear, but there may be a relation with the fact of at that stage most microtubules
being either individual or with narrow bundles (Fig. 3g). Indeed the density of γ-tubulin
complexes was relatively higher at later developmental stages, which we can only
attribute to more densely packed microtubules than in any previous stage.
Originally the cellulose microfibrils of starchy cells were not easily detected by
the CLSM, but as the microtubules bundled from 6 through 12 DAP, the newly formed
cellulose microfibrils seemed to aggregate in macrofibrils, as reported in other tissues
of maize (Ding and Himmel 2006). This was unexpected, because the formation of
macrofibrils is mostly associated to plant organs and tissues with high physical
strength, and the starchy endosperm cells do not fit this pattern. At 12 DAP the
cellulose macrofibrils were particularly evident, they were quite similar to the ones of
the inner transfer cells at earlier developmental stages (Fig. 1d-e, 3f, Monjardino et al.
2013), but in no sample did they form ingrowths (Fig. 3l-n). The reasons for the
formation of macrofibrils are unknown, but considering that these are large cells with
thin walls in a process of thickening at these developmental stages (Fig. 3o), the
macrofibrils may be necessary to reinforce these cells before becoming thick enough
to accumulate large quantities of assimilates.
CHAPTER II DISCUSSION
74
The differentiation of transfer cells has been proposed to be influenced by
“positional cues” (Becraft 2001), due to signals from the vascular bundles, and this
study reinforces this hypothesis. In the MBETC the type of cortical microtubules near
the OPW (the closest to the vascular tissues) was unique, and so were the reticulate
ingrowths. In the other parts of these and inner transfer cells the microtubules were
long and mostly longitudinal and they contained only flange ingrowths. The reasons
that assisted this polarized development are unknown, but considering the proximity
to the vascular bundles we believe that some signal or signals arising from the
assimilate flow must determine the differentiation of the transfer cells and of both
types of ingrowths.
With the information obtained in this study we developed models for the
formation of both types of ingrowths, which revises previous ones (e.g. Offler et al.
2003; Talbot et al. 2007a; McCurdy et al. 2008) and propose a new one for the
thickening of the starchy cells walls (Fig. 4). Before the onset of ingrowth formation the
microtubules are short and randomly oriented (Fig. 4a), but as the flange ingrowths
start developing, some of the microtubules become long next to them (Fig. 1b),
probably contributing to define their initiation sites and start their enlargement. In the
immediate following stages, the microtubules bundle, become long and are essentially
parallel to each other and in relation to the newly developed flange ingrowths (Fig. 1d-
g). These microtubule bundles guide the cellulose synthase complexes that will enlarge
the ingrowths, laying both microfibrils and macrofibrils of cellulose (Fig. 4b-c). At
earlier developmental stages the microtubules overlie the expanding flange ingrowths
(Fig. 4b-c), but at 18 DAP they only flank them in the MBETC (Fig. 1f-g, 4d), thus
contributing mostly to their thickening, whereas in the inner transfer cells they flank
CHAPTER II DISCUSSION
75
and overlie, thus contributing to their thickening and expansion into the cytosol. The γ-
tubulin complexes are distributed mainly in the periphery of the transfer cells
throughout their development and at early developmental stages they are mostly
situated adjacent to the microtubules, especially next to branching points, contributing
to nucleation (Fig. 1c, 4b-c). As the MBETC develop, the γ-tubulin complexes become
predominantly aligned with the longitudinal microtubule bundles (Fig. 1h, 4d), thus
contributing to nucleation centers along those bundles which should increase their
stability and assistance to ingrowth formation (Shaw and Lucas 2011). The major
novelties of this model when compared with previous ones are that microtubules
overlay the flange ingrowths of inner transfer cells at later developmental stages (Fig.
1f-g), the formation of macrofibrils is considered and we analyzed the contribution of
γ-tubulin complexes.
Next to the reticulate ingrowths the microtubules are short, numerous and
dispersed throughout the OPW, which must lead cellulose synthase complexes to
many and more distributed initiation spots that result in lower concentration of
cellulose per initiation spot (Fig. 4e-g). Therefore the newly formed microfibrils must
be less sustained by each others as in the flange ingrowths, so they swirl as the fibers
penetrate into the fenestrae (Fig. 4f-g). These ingrowths do not have one dominant
expansion axis but instead many axes due to multiple branching, depending on the
localization of the cellulose synthase complexes in the growing tips, which ultimately
will lead to the formation of the fenestrated layer (Fig. 4g). The existence of large
numbers of γ-tubulin promotes multiple branching and extension of circular of
microtubule bundles contribute to the formation of the reticulate ingrowths (Fig. 4f-g).
This model is a profound revision of previous ones.
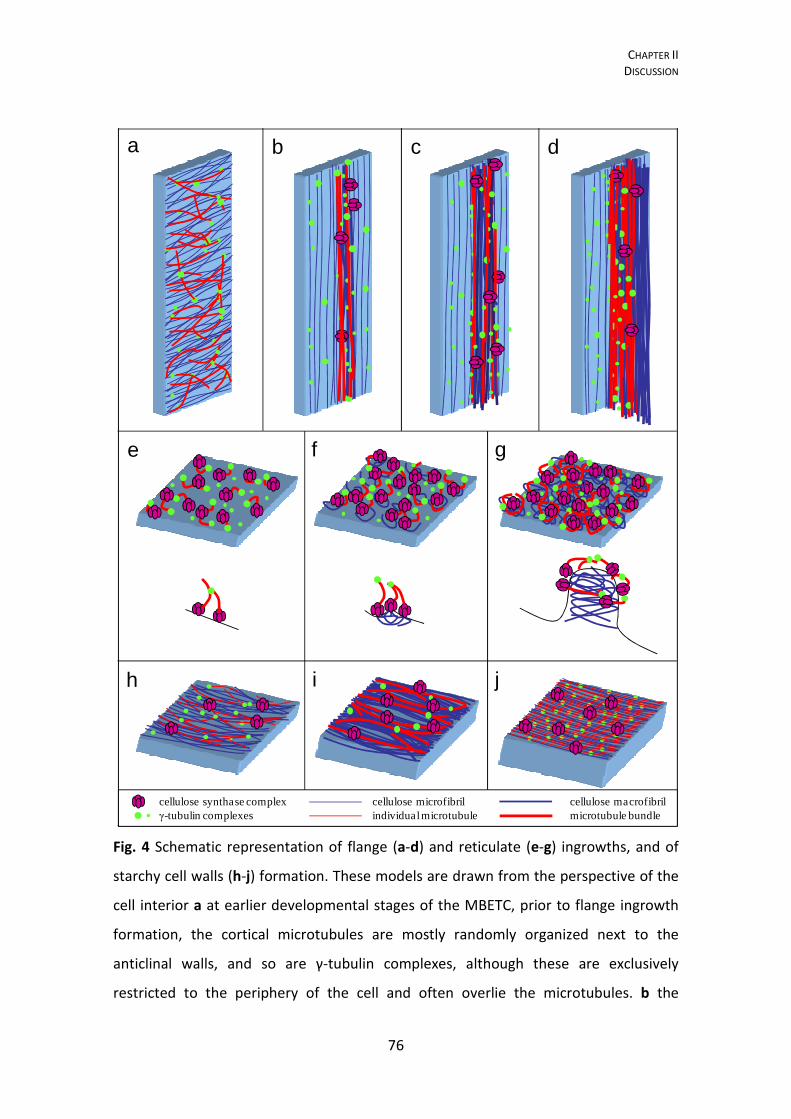
CHAPTER II DISCUSSION
76
a b c d
e f g
h i j
cellulose synthase complex cellulose microfibril cellulose macrofibrilγ-tubulin complexes individual microtubule microtubule bundle
Fig. 4 Schematic representation of flange (a-d) and reticulate (e-g) ingrowths, and of
starchy cell walls (h-j) formation. These models are drawn from the perspective of the
cell interior a at earlier developmental stages of the MBETC, prior to flange ingrowth
formation, the cortical microtubules are mostly randomly organized next to the
anticlinal walls, and so are γ-tubulin complexes, although these are exclusively
restricted to the periphery of the cell and often overlie the microtubules. b the
CHAPTER II DISCUSSION
77
microtubules bundle, become mostly longitudinally oriented and they lead the
cellulose synthase complexes to expand newly formed flange ingrowths; the γ-tubulin
complexes in most cases overlie the microtubules. c the concentration of microtubules
next to the ingrowths increases, they overlie and flank those, and ingrowths expand
inwards and sideways. d ingrowths have expanded fully into the cytosol, they are
flanked by the microtubules and γ-tubulin is mostly linearly distributed adjacent to the
microtubules. e short and curvilinear microtubule bundles start to accumulate next to
the OPW and they lead dispersed cellulose synthase complexes to form papillae, the
initiating structures of the reticulate ingrowths. f the microtubules remain short but
are more abundant than in previous stages, adjacent to them are the highest
concentrations of γ-tubulin and the labyrinth of reticulate ingrowths expands
significantly into the cytosol. g the reticulate ingrowths are fully grown, the
concentration of short and curvilinear bundles of microtubules next to and within
them is the highest and so is the concentration of γ-tubulin. h the walls of starchy cells
at earlier developmental stages have no specific organization and the cortical
microtubules are randomly oriented and so are the γ-tubulin complexes, although they
are in most cases associated with the microtubules. i as the starchy cells begin to
differentiate, the microtubules bundle and are parallel or form a netlike array, the
more recently synthesized cellulose microfibrils also bundle in macrofibrils and the cell
wall thickens. j at advanced developmental stages, the cellulose microfibrils do not
stand out within the wall, this has become thicker, the microtubules are thinner and
became parallel to each other, and γ-tubulin has became restricted to the space
between the microtubules and the plasma membrane.
The starchy cells at very early developmental stages change significantly and
rapidly, the organization of the microtubules shift from mostly individual and randomly
oriented microtubules to bundles that cross or are parallel, thus leading to the
deposition of cellulose microfibrils without a clear organization pattern of deposition
to macrofibrils with mostly parallel arrays (Fig. 4h-i). As the accumulation of assimilates
commences, the microtubules become individual or the bundles narrow, they are
CHAPTER II DISCUSSION
78
more numerous and organized in tight parallel arrays, thus leading to the deposition of
parallel microfibrils of cellulose in the inner side of the wall. The presence of γ-tubulin
complexes near the microtubules varies throughout the development, the small and
large size complexes coexist until 12 DAP, and at later developmental stages the small
complexes predominate.
This study enabled us to comprehend more thoroughly the contribution of
microtubules and γ-tubulin complexes to the differentiation of maize endosperm
transfer cells, either those from the most basal layer and the inner cells. On top of that
we established a clear comparison with the development of the starchy cells. But,
besides the novelties therein, this work also raises many open questions, namely on
the exact localization of the cellulose synthase complexes and the contribution of
microtubule bundles to macrofibril formation, for which further studies will need to be
conducted in the near future.
CHAPTER II REFERENCES
79
2.6. REFERENCES
Baskin TI (2001) On the alignment of cellulose microfibrils by cortical microtubules: a
review and a model. Protoplasma 215:150-171. doi:10.1007/BF01280311
Becraft PW (2001) Cell fate specification in the cereal endosperm. Semin Cell Dev Biol
12:387-394. doi:10.1006/scdb.2001.0268
Brown RC, Lemmon BE (1995) Methods in plant immunolight microscopy. Methods
Cell Biol. 49: 85-107. doi:10.1016/S0091-679X(08)61448-X
Bulbert MW, Offler CE, McCurdy DW (1998) Polarized microtubule deposition
coincides with wall ingrowth formation in transfer cells of Vicia faba L.
cotyledons. Protoplasma 201(1-2):8-16. doi:10.1007/BF01280706
Chan J, Calder GM, Doonan JH, Lloyd CW (2003) EB1 reveals mobile microtubule
nucleation sites in Arabidopsis. Nat Cell Biol 5:967-971.
doi:10.3410/f.1015789.198454
Chan J, Calder G, Fox S, Lloyd C (2007) Cortical microtubule arrays undergo rotary
movements in Arabidopsis hypocotyl epidermal cells. Nat Cell Biol 9:171-175.
doi:10.1038/ncb1533
Chan J, Sambade A, Calder G, Lloyd C (2009) Arabidopsis cortical microtubules are
initiated along, as well as branching from, existing microtubules. Plant Cell
21:2298-2306. doi:10.1105/tpc.109.069716
Consonni G, Gavazzi G, Dolfini S (2005) Genetic analysis as a tool to investigate the
molecular mechanisms underlying seed development in maize. Ann Bot 96:353-
62. doi:10.1093/aob/mci187
CHAPTER II REFERENCES
80
Davis RW, Smith JD, Cobb BG (1990) A light and electron microscope investigation of
the transfer cell region of maize caryopses. Can J Bot 68:471–479.
doi:10.1139/B90-063
Delmer DP (1987) Cellulose biosynthesis. Annu Rev Plant Physiol 38:259–290.
doi:10.1146/annurev.arplant.50.1.245
Ding SH, Himmel ME (2006) The Maize Primary Cell Wall Microfibril: A New Model
Derived from Direct Visualization. J Agric Food Chem 54:597-606.
doi:10.1021/jf051851z
Dixit R, Cyr R (2004) Encounters between dynamic cortical microtubules promote
ordering of the cortical array through angle-dependent modifications of
microtubule behavior. Plant Cell16:3274-84. doi:10.1105/tpc.104.026930
Duvik DN (1961) Protein granules of maize endosperm cells. Cereal Chem 38(4):374–
385.
Ehrhardt DW (2008) Straighten up and fly right: microtubule dynamics and
organization of non-centrosomal arrays in higher plants. Curr Opin Cell Biol
20:107-16. doi:10.1016/j.ceb.2007.12.004
Erhardt M, Stoppin-Mellet V, Campagne S, Canaday J, Mutterer J, Fabian T, Sauter M,
Muller T, Peter C, Lambert AM, Schmit AC (2002) The plant Spc98p homologue
colocalizes with gamma-tubulin at microtubule nucleation sites and is required
for microtubule nucleation. J Cell Sci 115:2423-2431.
Falconer MM, Seagull RW (1985) Immunofluorescent and Calcofluor White Staining of
Developing Tracheary Elements in Zinnia elegans L. Suspension Cultures.
Protoplasma 125:190-198. doi:10.1007/BF01281237
CHAPTER II REFERENCES
81
Flanders DJ, Rawlins DJ, Shaw PJ, Lloyd CW (1989) Computer-aided 3-D reconstruction
of interphase microtubules in epidermal cells of Datura stramonium reveals
principles of array assembly. Development 106(3):531-541.
Gilmore EC, Rogers JS (1958) Heat units as a method of measuring maturity in corn.
Agron J 50:611–615.
Jarvis MC (1992) Self-assembly of plant cell walls. Plant Cell Environ 15:1–5.
Job D, Valiron O, Oakley B (2003) Microtubule nucleation. Curr Opin Cell Biol 15:111-
117. doi:10.1111/j.1365-3040.1992.tb01452.x
Kiesselbach TA (1949) The Structure and Reproduction of Corn. Nebr Agric Exp Stn Res
Bull 161:1–96.
Kremer C, Drinnan A (2004) Secondary walls in hyaline cells of Sphagnum. Australian
Jornal of Botany 52(2):243-256. doi:10.1071/BT03010
Kyle DJ, Styles ED (1977) Development of aleurone and subaleurone layers in maize.
Planta 137:185–193. doi:10.1007/BF00388149
Lloyd CW (1984) Toward a dynamic helical model for the influence of microtubules on
wall patterns in plants. Int Rev Cytol 86:1–51. doi:10.1016/S0074-7696(08)60176-
X
McCurdy DW, Patrick JW, Offler CE (2008) Wall ingrowth formation in transfer cells:
novel examples of localized wall deposition in plant cells. Curr Opin Plant Biol
11:653-661. doi:10.1016/j.pbi.2008.08.005
Monjardino P, Rocha S, Tavares AC, Fernandes R, Sampaio P, Salema R, da Camara
Machado A (2013) Development of flange and reticulate wall ingrowths in maize
(Zea mays L.) endosperm transfer cells. Protoplasma 250(2):495-503.
doi:10.1007/s00709-012-0432-4
CHAPTER II REFERENCES
82
Murata T, Sonobe S, Baskin TI, Hyodo S, Hasezawa S, Nagata T, Horio T, Hasebe M
(2005) Microtubule-dependent microtubule nucleation based on recruitment of
gamma-tubulin in higher plants. Nat Cell Biol 7:961-968. doi:10.1038/ncb1306
Nakamura M, Ehrhardt DW, Hashimoto T (2010) Microtubule and katanin-dependent
dynamics of microtubule nucleation complexes in the acentrosomal Arabidopsis
cortical array. Nat Cell Biol 12:1064-1070. doi:10.1038/ncb2110
Oda Y, Mimura T, Hasezawa S (2005) Regulation of secondary cell wall development by
cortical microtubules during tracheary element differentiation in Arabidopsis cell
suspensions. Plant Physiol 137:1027-1036. doi:10.1104/pp.104.052613.
Offler CE, McCurdy DW, Patrick JW, Talbot MJ (2003) Transfer cells: cells specialized for
a special purpose. Annu Rev Plant Biol 54:431-454.
doi:10.1146/annurev.arplant.54.031902.134812
Paredez AR, Somerville CR, Ehrhardt DW (2006) Visualization of cellulose synthase
demonstrates functional association with microtubules. Science 312:1491-1495.
doi:10.1126/science.1126551
Sabelli PA (2012) Replicate and die for your own good: Endoreduplication and cell
death in the cereal endosperm. Journal of Cereal Science 56:9-20.
doi:10.1016/j.jcs.2011.09.006
Satiat-Jeunemaitre B (1987) Inhibition of the helicoidal assembly of the cellulose–
hemicellulose complex by 2,6-dichlorobenzonitrile (DCB). Biol Cell 59:89–96.
Schmit AC (2002) Acentrosomal microtubule nucleation in higher plants. Int Rev Cytol
220:257-89.
Shaw SL, Kamyar R, Ehrhardt DW (2003) Sustained microtubule treadmilling in
Arabidopsis cortical arrays. Science 300:1715-1718. doi:10.1126/science.1083529
CHAPTER II REFERENCES
83
Shaw SL, Lucas J (2011) Intrabundle microtubule dynamics in the Arabidopsis cortical
array. Cytoskeleton (Hoboken) 68:56-67. doi:10.1002/cm.20495
Singh S, Lazzaro MD, Walles B (1999) Microtubule organization in the differentiating
transfer cells of the placenta in Lilium spp.. Protoplasma 207:75-83.
doi:10.1007/BF01294715
Stoppin-Mellet V, Peter C, Lambert AM (2000) Distribution of γ-Tubulin in Higher Plant
Cells: Cytosolic γ-Tubulin is Part of High Molecular Weight Complexes. Plant biol
2(3):290-296. doi:10.1055/s-2000-3709
Talbot MJ, Franceschi VR, McCurdy DW, Offler CE (2001) Wall ingrowth architecture in
epidermal transfer cells of Vicia faba cotyledons. Protoplasma 215:191-203.
doi:10.1007/BF01280314
Talbot MJ, Offler CE, McCurdy DW (2002) Transfer cell wall architecture: a contribution
towards understanding localized wall deposition. Protoplasma 219:197-209.
doi:10.1007/s007090200021
Talbot MJ, Wasteneys GO, McCurdy DW, Offler CE (2007a) Deposition patterns of
cellulose microfibrils in flange wall ingrowths of transfer cells indicate clear
parallels with those of secondary wall thickenings. Funct Plant Biol 34:307-313.
doi:10.1071/FP06273
Talbot MJ, Wasteneys GO, Offler CE, McCurdy DW (2007b) Cellulose synthesis is
required for deposition of reticulate wall ingrowths in transfer cells. Plant Cell
Physiol 48:147-58. doi:10.1093/pcp/pcl046
Vincent JFV (1999) From cellulose to cell. J Exp Biol 202:3263–3268.
CHAPTER II REFERENCES
84
Wang HH, Wang Z, Wang F, Gu YJ., Liu Z (2012) Development of basal endosperm
transfer cells in Sorghum bicolor (L.) Moench and its relationship with caryopsis
growth. Protoplasma 249:309–321. doi:10.1007/s00709-011-0281-6
Wasteneys GO, Williamson RE (1989) Reassembly of microtubules in Nitella tasmanica:
quantitative analysis of assembly and orientation. Eur J Cell Biol 50(1):76-83.
Wightman R, Turner SR (2008) The roles of the cytoskeleton during cellulose
deposition at the secondary cell wall. Plant J 54:794-805. doi:10.1111/j.1365-
313X.2008.03444.x
Wightman R, Turner SR (2007) Severing at sites of microtubule crossover contributes
to microtubule alignment in cortical arrays. Plant J 52:742-51.
doi:10.1111/j.1365-313X.2007.03271.x
Young TE, Gallie DR (2000) Programmed cell death during endosperm development.
Plant Mol Biol 44:283-301. doi:10.1023/ A:1026588408152
Young TE, Gallie DR, DeMason DA (1997) Ethylene-Mediated Programmed Cell Death
during Maize Endosperm Development of Wild-Type and shrunken2 Genotypes.
Plant Physiol 115:737-751.
CHAPTER III
85
_____________________________________________________________________
CHAPTER III
LIGNIFICATION AND GROWTH OF MAIZE (ZEA MAYS L.) ENDOSPERM TRANSFER CELLS AND STARCHY
CELLS
______________________________________________________________________
CHAPTER III ABSTRACT
86
3. LIGNIFICATION AND GROWTH OF MAIZE (ZEA MAYS L.) ENDOSPERM TRANSFER CELLS AND STARCHY
CELLS
3.1. ABSTRACT
Transfer cells have extensive cell wall ingrowths and this unique structure could
benefit from lignifications, albeit several studies reported otherwise, on the basis of
negative results after staining with the periodic acid-Schiff reaction plus toluidine blue
and phloroglucinol. Despite that, other studies have proved that lignification occurs in
tissues that have tested negative for the above cited stains. The main goal of this study
was to determine whether or not developing maize endosperm transfer cells had
lignified cell walls through potassium permanganate treatment and acriflavine staining
using transmission electron microscopy-energy dispersive X-ray technique and the
confocal scanning microscopy, respectively. In addition a transmission electron
microscopy analysis was done on hydrogen peroxide treated samples. For comparison,
we also tested for lignification levels of the cell walls of the starchy endosperm cells.
The transfer cells contain lignin since the earliest developmental stages and the
concentration increases as cells grow and the kernel approaches the physiological
maturity. Likewise, flange and reticulate ingrowths also become lignified at very similar
levels of the adjacent walls for most of endosperm development. The cell walls of
starchy cells also contain lignin during their growing period. The significance of
lignification of these cells is discussed.
Keywords Transfer cells, Maize endosperm, Reticulate ingrowths, Flange ingrowths,
Starchy cells, Cell wall, Lignin.

CHAPTER III INTRODUCTION
87
3.2. INTRODUCTION
Lignification has been associated with several traits in plants, namely structural
integrity of the cell wall, secondary growth of vascular tissues, strength of the stem
and root (Lewis and Yamamoto 1990; Dixon et al. 2001), resistance mechanisms to
fungi (Ride 1975; Xu et al. 2011), resistance of cell walls to autolysis (O’Brien 1970) and
the gravitropic response of trees (Donaldson et al. 2010). Lignins are the second most
abundant polymers in plants (after cellulose), are phenolic heteropolymers which
mainly result from the oxidative coupling of the three p-hydroxycinnamyl alcohols, p-
coumaryl, coniferyl and sinapyl (Lewis and Yamamoto 1990; Dixon et al. 2001). A free-
radical-mediated polymerization process links various phenolic monomers of p-
hydroxyphenyl, guaiacyl and syringyl with carbon-carbon as well as ether linkages
(Nadji et al. 2009; Liu 2012; Zhang et al. 2012).
There is a general consensus that transfer cells are not lignified, considering early
studies in which the periodic-Schiff reaction plus toluidine stains failed to detect it as
compared to xylem cells in nodes of Trifolium repens and Trollius europaeus (Gunning
and Pate 1974), and that there was no detection of lignin by phloroglucinol in Vicia
faba cotyledone transfer cells (Vaughn et al. 2007). However, one must be cautious in
taking such conclusions, because these methodologies may not be sensitive enough to
detect small amounts of lignin. For instance, studies using phloroglucinol stain
concluded that it is not sensitive enough to early stages of lignification and a negative
phloroglucinol reaction does not necessarily mean that lignin is absent, since the
reaction involves only a small part of the lignin molecule (Pfoser 1959; Jensen 1962;
Kutscha and Gray 1972; Müsel et al. 1997).
CHAPTER III INTRODUCTION
88
Potassium permanganate (KMnO4) was established as a general electron-dense
staining agent for lignin. It is generally accepted that a coniferyl molecule is oxidised by
KMnO4; the permanganate anion is reduced to insoluble manganese dioxide (MnO2)
which then precipitates, indicating the site of reaction (Bland et al. 1971; Hepler et al.
1970; Kutscha and Gray 1972; Donaldson 1991, Xu et al. 2006, Ma et al. 2011). The
staining of ultrathin sections with KMnO4 in order to determine the lignin distribution
in woody cell walls was the subject of various studies during the 1980s 1990s and it is
currently used in today’s research (Grünwal et al. 2002; Coleman et al. 2004; Wi et al.
2005; Xu et al. 2006; Lee et al. 2007; Tao et al. 2009; Ma et al. 2011). It shouldbe
highlighted the work of Maurer and Fengel (1991) that went a step further by using
densitometric evaluation of the staining intensity as an indicator for lignin distribution
within woody cell walls after KMnO4 staining. Also the work of Fromm et al. (2003)
who studied lignin distribution in spruce and beech wood in sections stained with
KMnO4 deserves special reference. Indeed, their contribution was very valuable
because, in addition to normal transmission electron microscopy (TEM), they used field
emission scanning electron microscopy to get backscattered electrons for energy
dispersive X-ray spectrometry analysis as a highly confident way to ascertain the sites
of Mn deposition. They did this step of the technique by performing the so called
mercurization of the wall where mercuric acetate reacts under mildly acidic conditions
via an electrophilic substitution reaction with the aromatic moiety of the lignin,
producing a covalent bond between the aromatic ring of the syringil residue and the
acetoxymercuric group to enhance the spectrometer efficiency and resolution (Fromm
et al. 2003).
CHAPTER III INTRODUCTION
89
Scanning Electron Microscopy or TEMcan be used to get backscattered electrons
for Energy Dispersive X-ray Analysis (EDX) and these techniques were used to probe
the results of KMnO4 treatments (Xu et al. 2006; Ma et al. 2011). It is known that the
higher the manganese concentration, as revealed by transmission electron microscopy
energy dispersive X-ray (TEM–EDX) analysis, the higher the lignin concentration (Xu et
al. 2006) and data can be used for the quantitative assessment of lignin distribution
(Ma et al. 2011). However Bland et al. (1971) and Hoffman and Parameswaran (1976)
warn that KMnO4 can stain other cell wall components in addition to lignin if they have
acidic groups but one must keep in mind that they worked with chemically de-lignified
plant material and acidic groups that are rare in native cell walls. Coleman et al. (2004)
also call attention to the treatment time with KMnO4 because extensive treatments
can contrast cell walls unspecifically, which is in accordance with the long known
strong oxidation capacity of this salt (Lawn 1960) that demands close attention to the
treatment time and the concentration of the reagent as well.
Acriflavin is a fluorochrome that can detect lignin at very low levels, thus being
an elite dye in various plant tissues (Coleman et al. 2004; Donaldson and Bond 2005;
Christiernin 2006; Cho et al. 2008; Santiago et al. 2010). Its fluorescence intensity can
be proportional to lignin concentration and usually is detected with the confocal laser
scanning microscopy (CLSM) (Coleman et al. 2004; Christiernin 2006) or
epifluorescence microscopy (Donaldson and Bond 2005).
The presence of lignin can also be detected by the use of specific solvents,
namely hydrogen peroxide (H2O2) (Svitelska et al. 2004; Yao et al. 2006; Hejri and
Saboora 2009). In the literature there are reports that some polyphenolic compounds
accumulate in vesicle-like structures during the transfer to other cell locales (Zobel et
CHAPTER III INTRODUCTION
90
al. 1989; Donaldson 2001). This technique alone hardly proves the existence of lignin,
but as complement of other methodologies may be a very useful tool.
We have determined the presence of lignin on developing transfer cells and
starchy cells using two staining techniques, KMnO4 and acriflavine in conjunction with
TEM-EDX and CLSM, respectively. In addition we have done a TEM analysis on H2O2
treated samples and growth analyses on both types of cells. Our results showed that
transfer cells became lignified since very early stages of development at a period
where they were still actively growing and the lignification increased with the
development of these cells. It was also detected similarities in the lignification levels of
the reticulate and flange ingrowths and the adjacent walls from which they arose. The
cell walls of starchy cells also contained lignin since very early stages of development
and the lignin levels also increased as the kernels approached physiological maturity.
CHAPTER III MATERIALS AND METHODS
91
3.3. MATERIALS AND METHODS
Plant material, growth conditions and sampling
Maize plants (inbred W64A) were grown and kernels were collected as described
earlier (Monjardino et al. 2013) in 2009 through 2012, and for each sampling date a
minimum of 30 kernels were collected from at least 5 different ears. The most basal
endosperm transfer cells (MBETC) and the starchy cells were the focus of our analysis.
The temperature was recorded daily during early kernel development allowing
the calculation of growing degree days (GDD) according to the formula
GDD=Σ(ADT−BT), where ADT is the average daily temperature and BT is the base
temperature of 10 °C (Gilmore and Rogers 1958). Minimum temperatures <10 °C were
adjusted to 10 °C, and maximum temperatures >30 °C were adjusted to 30 °C. The
developmental stages were therefore described as DAP and references were made to
GDD.
Transmission electron microscopy with EDX
Twelve and 20 DAP kernels (190-192.5 and 315.5-318.5 GDD, respectively) were
hand sectioned with a razor blade, discarding most of the endosperm tissue except for
the basal or the central endosperm region, and were immediately fixed in 4%
glutaraldehyde plus 2% osmium tetroxide for 2 h. The fixed sections were dehydrated
in acetone and progressively infiltrated in Spurr's resin over 8 days at room
temperature (Monjardino et al. 2007) before polymerization at 60 °C.
Ultrathin sections (40-60 nm thickness) were prepared on a LKB 2188 NOVA
Ultramicrotome (LKB NOVA, Bromma, Sweden) using diamond knives (Diatome, Biel,
CHAPTER III MATERIALS AND METHODS
92
Switzerland). The sections were mounted on 400 mesh gold grids (Agar Scientific,
Essex, UK), stained with 1% KMnO4 for 2 min. each, and examined under a JEOL JEM
1400 TEM (Tokyo, Japan) equipped with an EDX Microanalysis System (Oxford
Instruments, Abingdon, UK). The observations were made on MBETC walls, ingrowths
and vesicles adjacent to the reticulate ingrowths (when visible) where areas were
traced for the probe to raster and produce an integrated average of several thousand
readings. Similar set up was followed for starchy cells walls, except for ingrowths and
vesicles because these cells did not contain them, and the blank analysis were made
on parts of the sample that apparently did not present any cell content (these could
only be obtained in starchy cells). The analyzed elements in all samples were C, O, Mn,
Na, K, Ca and Fe (Fig. 1a). The levels of each element were expressed in terms of the
relative proportion in relation to the sum of the seven elements.
Transmission electron microscopy with H2O2 treatment
Five to 20 DAP kernels (78.5-318.5 GDD) were processed as in those analyzed by
TEM-EDX. After mounting the ultrathin sections in 400 mesh gold grids they were
treated with 4% H2O2 for 15 minutes, followed by three washes in water. Images were
examined using a Zeiss EM10 C TEM (Carl Zeiss Oberkochen, Germany) and were
digitally recorded using a Gatan SC 1000 ORIUS CCD camera (Warrendale, PA, USA).
Confocal laser scanning microscopy
Five, 10 and 30 DAP kernels (61.5-65, 128-134.5 and 355-356.5 GDD,
respectively) were sectioned longitudinally (70-100 μm thicknesses) on a Leica VT 1200
vibratome (Leica Microsystems, Wetzlar, Germany) and stained with 0.0025% aqueous
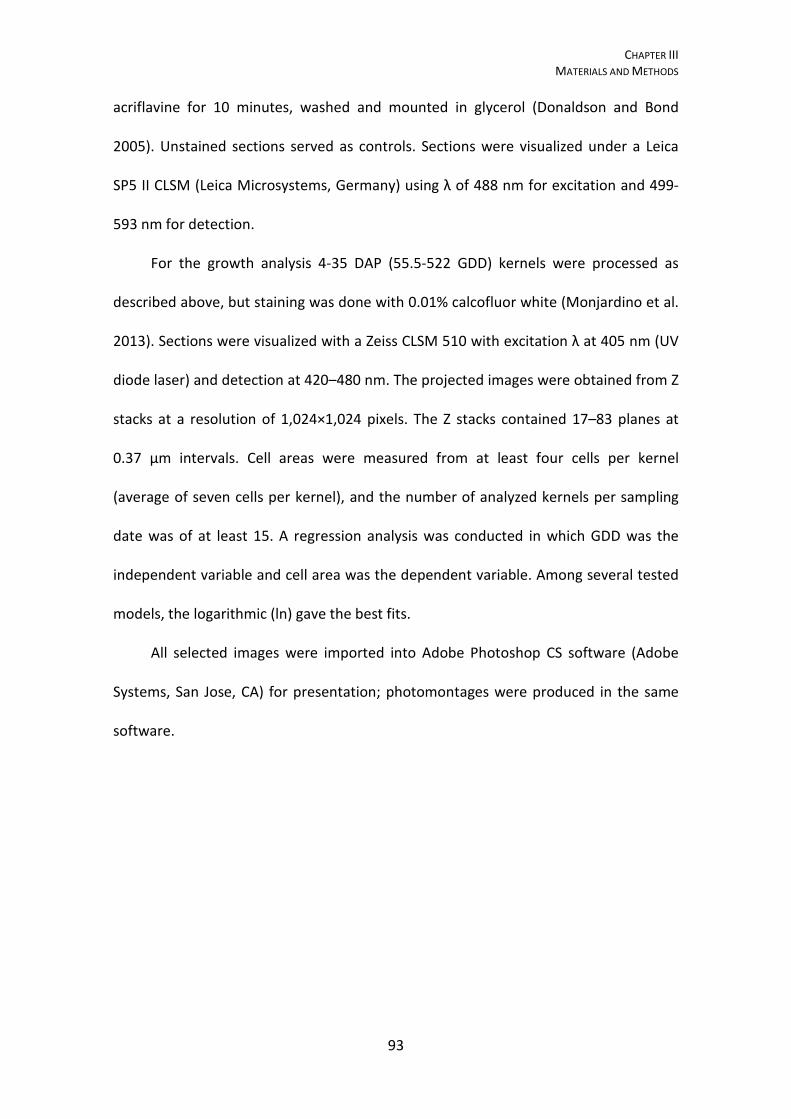
CHAPTER III MATERIALS AND METHODS
93
acriflavine for 10 minutes, washed and mounted in glycerol (Donaldson and Bond
2005). Unstained sections served as controls. Sections were visualized under a Leica
SP5 II CLSM (Leica Microsystems, Germany) using λ of 488 nm for excitation and 499-
593 nm for detection.
For the growth analysis 4-35 DAP (55.5-522 GDD) kernels were processed as
described above, but staining was done with 0.01% calcofluor white (Monjardino et al.
2013). Sections were visualized with a Zeiss CLSM 510 with excitation λ at 405 nm (UV
diode laser) and detection at 420–480 nm. The projected images were obtained from Z
stacks at a resolution of 1,024×1,024 pixels. The Z stacks contained 17–83 planes at
0.37 μm intervals. Cell areas were measured from at least four cells per kernel
(average of seven cells per kernel), and the number of analyzed kernels per sampling
date was of at least 15. A regression analysis was conducted in which GDD was the
independent variable and cell area was the dependent variable. Among several tested
models, the logarithmic (ln) gave the best fits.
All selected images were imported into Adobe Photoshop CS software (Adobe
Systems, San Jose, CA) for presentation; photomontages were produced in the same
software.

CHAPTER III RESULTS AND DISCUSSION
94
3.4. RESULTS AND DISCUSSION
Transmission electron microscopy – EDX analysis
Transfer cells had extensive wall inward projections that contrasted with the
much thinner walls of the starchy cells (Fig. 1b-f). The inward growth of cell wall
regions had to overcome and develop against the outward pressure of the living cell
cytoplasm. It can be assumed that this process might require reinforcement by some
additional molecule, not unreasonably the ubiquitous lignin.
Ultrathin sections contrasted with 1% KMnO4 gave inconclusive results when
viewed by TEM alone (data not shown). The eventual differences between the various
parts of the analyzed cells were not clear enough to state that differences existed
between various wall components. Therefore, we used the TEM-EDX technique to
determine the degree to which Mn atoms were deposited in various components of
the cells, namely the walls and the ingrowths.
The data obtained, based on the trusted and reliable Clifft Lorimer thin ratio
section quantification method, showed Mn deposition on the walls of the transfer cells
and of the starchy cells (Table 1; Fig. 1b-f). Since EDX elemental analysis has a high
degree of confidence it is possible to draw the conclusion that Mn atoms were
deposited in the wall ingrowths in amounts that could not be attributed to background
counts, as reported in the blank analysis (Table 1). The question arises on the biological
significance of the data obtained. From the literature it is known that KMnO4 does not
react with cellulose, or hemicelluloses or pectin molecules (Kutscha and Gray 1972);
the short times used for staining certainly preclude undesirable Mn deposition so it
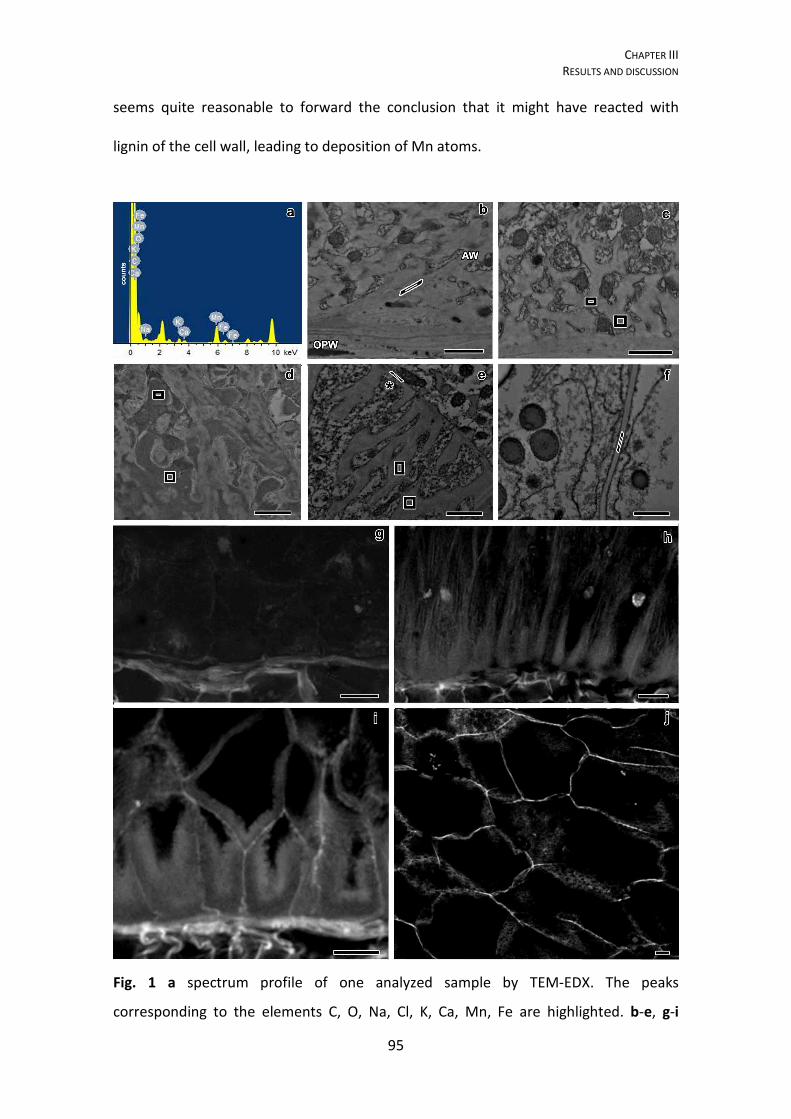
CHAPTER III RESULTS AND DISCUSSION
95
seems quite reasonable to forward the conclusion that it might have reacted with
lignin of the cell wall, leading to deposition of Mn atoms.
Fig. 1 a spectrum profile of one analyzed sample by TEM-EDX. The peaks
corresponding to the elements C, O, Na, Cl, K, Ca, Mn, Fe are highlighted. b-e, g-i
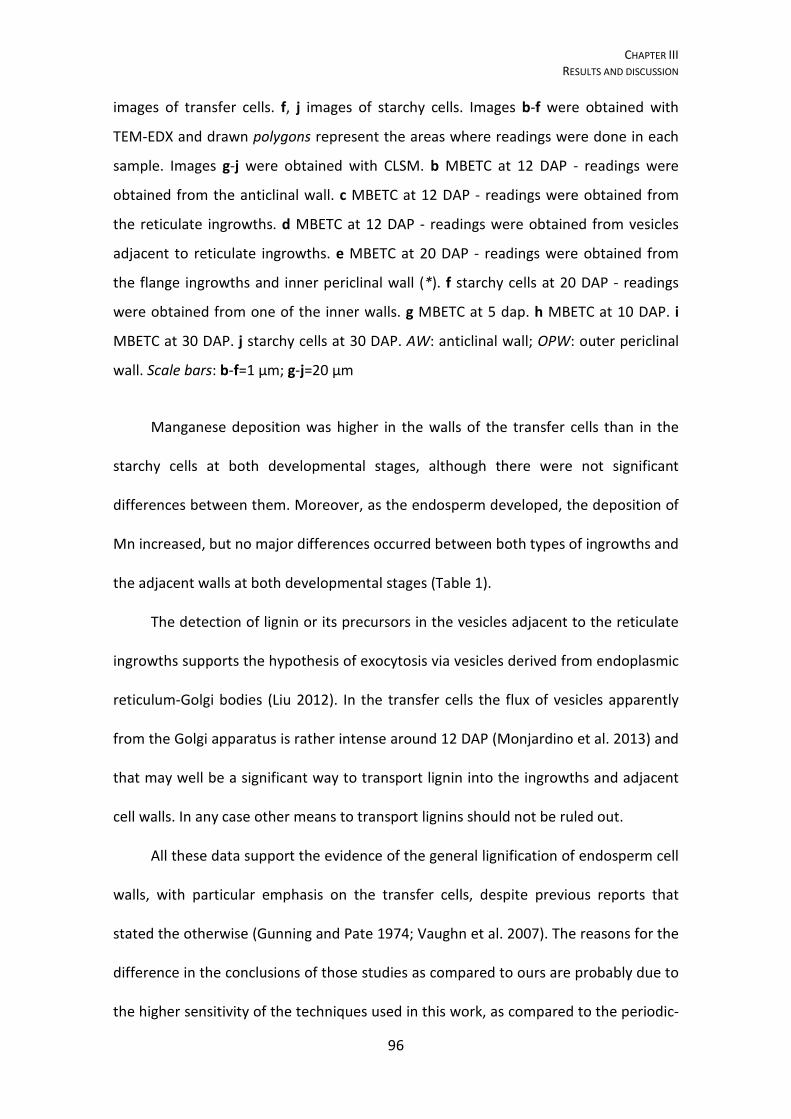
CHAPTER III RESULTS AND DISCUSSION
96
images of transfer cells. f, j images of starchy cells. Images b-f were obtained with
TEM-EDX and drawn polygons represent the areas where readings were done in each
sample. Images g-j were obtained with CLSM. b MBETC at 12 DAP - readings were
obtained from the anticlinal wall. c MBETC at 12 DAP - readings were obtained from
the reticulate ingrowths. d MBETC at 12 DAP - readings were obtained from vesicles
adjacent to reticulate ingrowths. e MBETC at 20 DAP - readings were obtained from
the flange ingrowths and inner periclinal wall (*). f starchy cells at 20 DAP - readings
were obtained from one of the inner walls. g MBETC at 5 dap. h MBETC at 10 DAP. i
MBETC at 30 DAP. j starchy cells at 30 DAP. AW: anticlinal wall; OPW: outer periclinal
wall. Scale bars: b-f=1 μm; g-j=20 μm
Manganese deposition was higher in the walls of the transfer cells than in the
starchy cells at both developmental stages, although there were not significant
differences between them. Moreover, as the endosperm developed, the deposition of
Mn increased, but no major differences occurred between both types of ingrowths and
the adjacent walls at both developmental stages (Table 1).
The detection of lignin or its precursors in the vesicles adjacent to the reticulate
ingrowths supports the hypothesis of exocytosis via vesicles derived from endoplasmic
reticulum-Golgi bodies (Liu 2012). In the transfer cells the flux of vesicles apparently
from the Golgi apparatus is rather intense around 12 DAP (Monjardino et al. 2013) and
that may well be a significant way to transport lignin into the ingrowths and adjacent
cell walls. In any case other means to transport lignins should not be ruled out.
All these data support the evidence of the general lignification of endosperm cell
walls, with particular emphasis on the transfer cells, despite previous reports that
stated the otherwise (Gunning and Pate 1974; Vaughn et al. 2007). The reasons for the
difference in the conclusions of those studies as compared to ours are probably due to
the higher sensitivity of the techniques used in this work, as compared to the periodic-

CHAPTER III RESULTS AND DISCUSSION
97
Schiff reaction plus toluidine stains used by Gunning and Pate (1974) and
phloroglucinol used by Vaughn et al. (2007). We also have tested the use of
phloroglucinol in transfer cells and, as expected, it did not detect any presence of
lignin (data not shown). The difference in sensitivity of several testing methodologies
has been reported previously, and in case of the phloroglucinol several authors
demonstrated that it is not the adequate methodology for early lignifications studies
(Kutscha and Gray 1972; Müsel et al. 1997).
Table 1. The average concentration (%) and standard deviation (SD) of element Mn in
transfer cells (TC) and starchy cells (SC) at 12 and 20 DAP determined by the TEM-EDX.
TC 12 DAP TC 20 DAP SC 12 DAP SC 20 DAP
Average SD Average SD Average SD Average SD
Reticulate ingrowths 6.08 1.92 7.86 3.21 - - - -
Anticlinal walls next to the
OPW 6.31 2.50 7.26 0.29 - - - -
Vesicles adjacent to
reticulate ingrowths 8.40 0.46 10.25 0.52 - - - -
Flange ingrowths 5.34 0.41 6.43 1.36 - - - -
Other cell walls 5.06 1.29 7.60 2.00 3.89 1.73 6.22 2.28
Blank - - - - 0.92 0.25 0.78 0.18
The lack of differences in lignin content between the ingrowths and the adjacent
walls reinforces their similarity in composition for most of the components as reported
before (Vaughn et al. 2007). However we cannot tell whether the nature of lignin is the
same in both structures, and that deserves to be addressed in future studies.
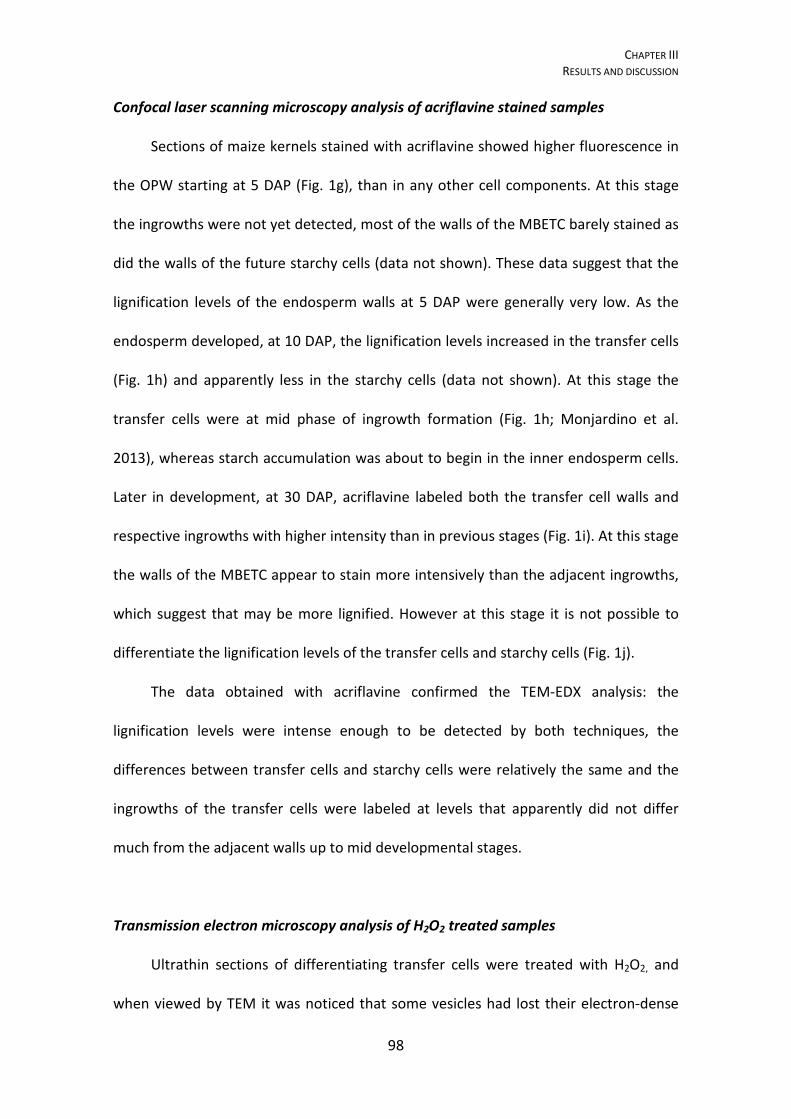
CHAPTER III RESULTS AND DISCUSSION
98
Confocal laser scanning microscopy analysis of acriflavine stained samples
Sections of maize kernels stained with acriflavine showed higher fluorescence in
the OPW starting at 5 DAP (Fig. 1g), than in any other cell components. At this stage
the ingrowths were not yet detected, most of the walls of the MBETC barely stained as
did the walls of the future starchy cells (data not shown). These data suggest that the
lignification levels of the endosperm walls at 5 DAP were generally very low. As the
endosperm developed, at 10 DAP, the lignification levels increased in the transfer cells
(Fig. 1h) and apparently less in the starchy cells (data not shown). At this stage the
transfer cells were at mid phase of ingrowth formation (Fig. 1h; Monjardino et al.
2013), whereas starch accumulation was about to begin in the inner endosperm cells.
Later in development, at 30 DAP, acriflavine labeled both the transfer cell walls and
respective ingrowths with higher intensity than in previous stages (Fig. 1i). At this stage
the walls of the MBETC appear to stain more intensively than the adjacent ingrowths,
which suggest that may be more lignified. However at this stage it is not possible to
differentiate the lignification levels of the transfer cells and starchy cells (Fig. 1j).
The data obtained with acriflavine confirmed the TEM-EDX analysis: the
lignification levels were intense enough to be detected by both techniques, the
differences between transfer cells and starchy cells were relatively the same and the
ingrowths of the transfer cells were labeled at levels that apparently did not differ
much from the adjacent walls up to mid developmental stages.
Transmission electron microscopy analysis of H2O2 treated samples
Ultrathin sections of differentiating transfer cells were treated with H2O2, and
when viewed by TEM it was noticed that some vesicles had lost their electron-dense
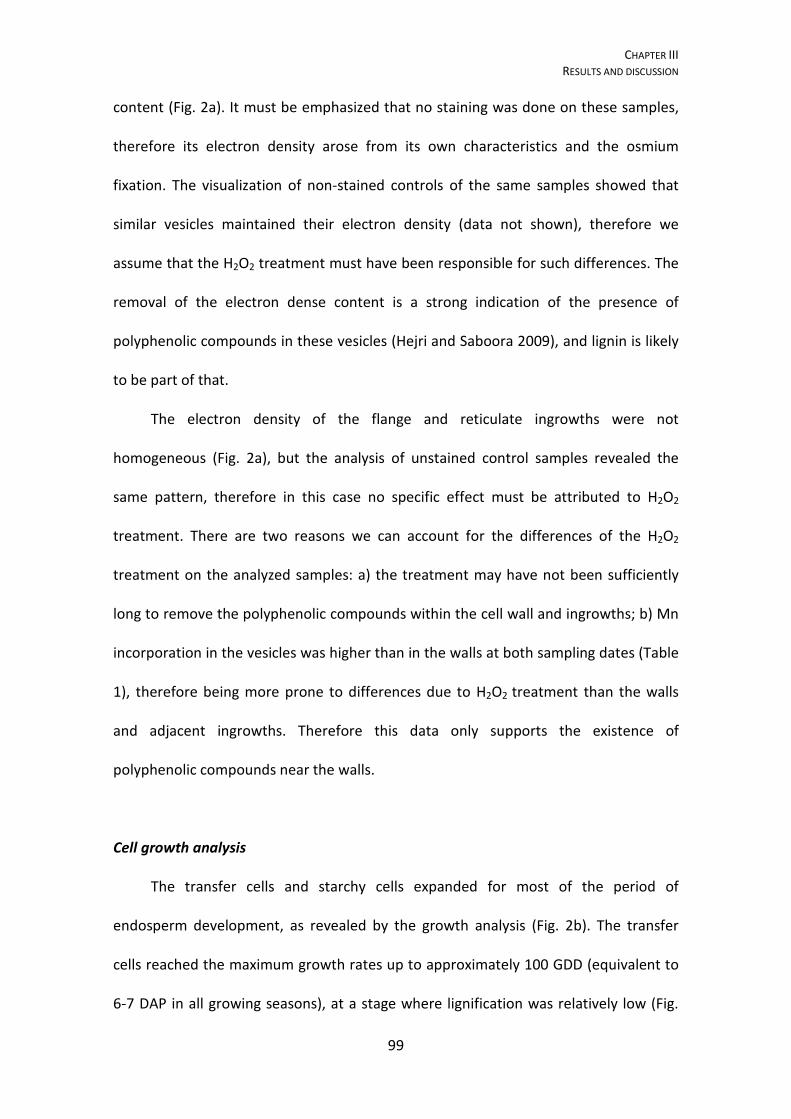
CHAPTER III RESULTS AND DISCUSSION
99
content (Fig. 2a). It must be emphasized that no staining was done on these samples,
therefore its electron density arose from its own characteristics and the osmium
fixation. The visualization of non-stained controls of the same samples showed that
similar vesicles maintained their electron density (data not shown), therefore we
assume that the H2O2 treatment must have been responsible for such differences. The
removal of the electron dense content is a strong indication of the presence of
polyphenolic compounds in these vesicles (Hejri and Saboora 2009), and lignin is likely
to be part of that.
The electron density of the flange and reticulate ingrowths were not
homogeneous (Fig. 2a), but the analysis of unstained control samples revealed the
same pattern, therefore in this case no specific effect must be attributed to H2O2
treatment. There are two reasons we can account for the differences of the H2O2
treatment on the analyzed samples: a) the treatment may have not been sufficiently
long to remove the polyphenolic compounds within the cell wall and ingrowths; b) Mn
incorporation in the vesicles was higher than in the walls at both sampling dates (Table
1), therefore being more prone to differences due to H2O2 treatment than the walls
and adjacent ingrowths. Therefore this data only supports the existence of
polyphenolic compounds near the walls.
Cell growth analysis
The transfer cells and starchy cells expanded for most of the period of
endosperm development, as revealed by the growth analysis (Fig. 2b). The transfer
cells reached the maximum growth rates up to approximately 100 GDD (equivalent to
6-7 DAP in all growing seasons), at a stage where lignification was relatively low (Fig.
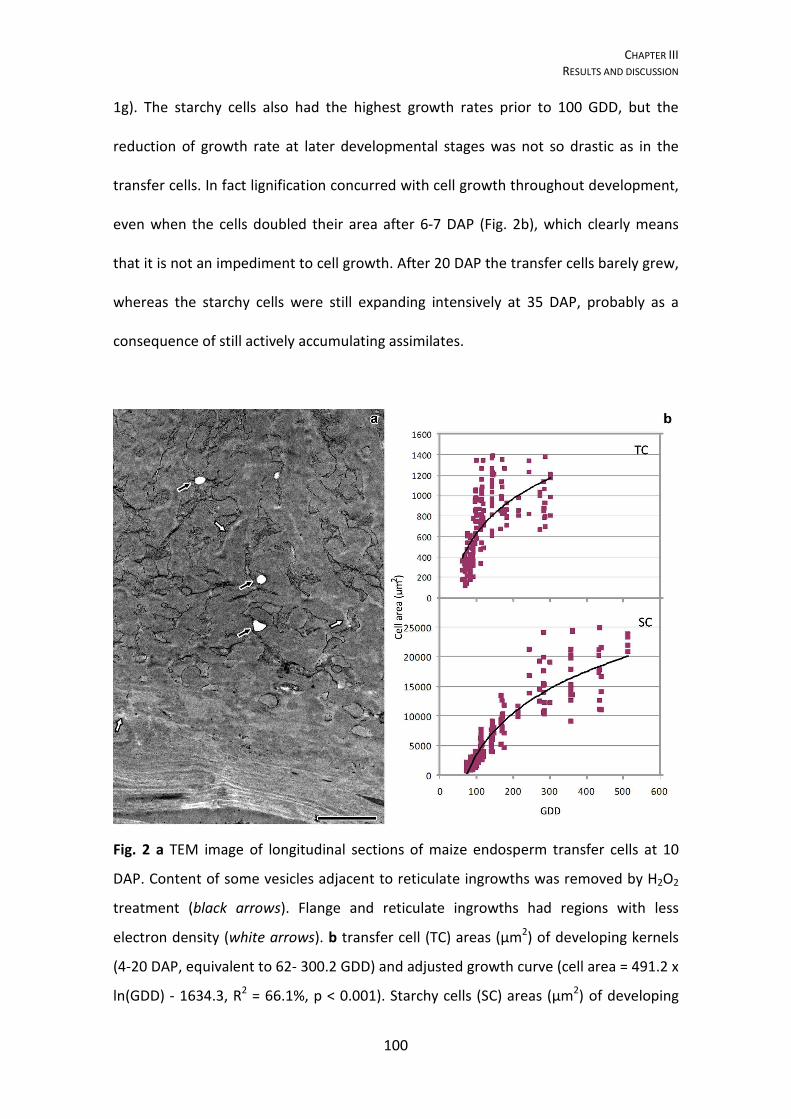
CHAPTER III RESULTS AND DISCUSSION
100
1g). The starchy cells also had the highest growth rates prior to 100 GDD, but the
reduction of growth rate at later developmental stages was not so drastic as in the
transfer cells. In fact lignification concurred with cell growth throughout development,
even when the cells doubled their area after 6-7 DAP (Fig. 2b), which clearly means
that it is not an impediment to cell growth. After 20 DAP the transfer cells barely grew,
whereas the starchy cells were still expanding intensively at 35 DAP, probably as a
consequence of still actively accumulating assimilates.
Fig. 2 a TEM image of longitudinal sections of maize endosperm transfer cells at 10
DAP. Content of some vesicles adjacent to reticulate ingrowths was removed by H2O2
treatment (black arrows). Flange and reticulate ingrowths had regions with less
electron density (white arrows). b transfer cell (TC) areas (μm2) of developing kernels
(4-20 DAP, equivalent to 62- 300.2 GDD) and adjusted growth curve (cell area = 491.2 x
ln(GDD) - 1634.3, R2 = 66.1%, p < 0.001). Starchy cells (SC) areas (μm2) of developing
CHAPTER III RESULTS AND DISCUSSION
101
kernels (5-35 DAP, equivalent to 73.5- 515.5 GDD) and adjusted growth curve (cell area
= 10195.3 x ln(GDD) - 43582.6, R2 = 92.3%, p < 0.001)
Further support for the presence of lignin
Basic fuchsin in combination with fluorescent or light microscopy has been
successfully used as another staining method for lignified walls (Fuchs 1963;
Dharmawardhana et al. 1996; Kraus et al. 1998; Caño-Delgado et al. 2000; Soyano et
al. 2008; Wagner et al. 2009). A previous study conducted in our lab has shown that
basic fuchsin reacts with the ingrowths and adjacent walls at 14 DAP and later stages
(Machado 2004). However there are reports that basic fuchsin also showed affinity for
suberized or cutinized walls of plants cells and also for other structures devoid of
lignin, such as the chloroplasts and starch granules from the endosperm of maize
(Kraus et al. 1998; Machado 2004; Pereira et al. 2008); therefore it per se cannot be
considered an unequivocal proof, but reinforces the data obtained in this study.
We also have tested acridine orange in similar samples (data not shown) and it
confirmed the same labeling pattern as acriflavine, which is no surprise considering the
great similarities between both stains (Donaldson and Bond 2005). However, acridine
orange also stains quite strongly the nuclei, at much higher levels than acriflavine,
therefore it is a method that per se we do not consider unequivocal, but reinforces our
data on the existence of lignin in the walls of transfer cells and starchy cells of maize
endosperm.
Lignin is a molecule with a role currently associated to the cell wall rigidity and
strength and its presence has been detected in very low amounts even in growing
primary cell walls (Müsel et al. 1997). We also have detected lignin since very early
CHAPTER III RESULTS AND DISCUSSION
102
developmental stages (Fig. 1g) and it increased substantially at a time that the cells
were still actively growing (Fig. 1b-d, 1h, 2b). In case of the transfer cells, this may be
even more surprising, because the ingrowths are also lignified and thicken the walls
unevenly to a degree that one would consider to be restrictive to cell expansion, but it
certainly is not the case. This certainly calls to rethink the role of lignin on wall
structure. Müsel et al. (1997) proposed that in the process of cell wall growth lignin
might act as a negative control whereas independent wall-loosening processes
(mediated by growth-promoting agents) might have a positive control, thus allowing
the cell to expand the wall however without loose the necessary rigidity. Our results
support this view. In case of the starchy cells, in addition of their very large size (Fig. 1j,
2b) with thin walls (Chapter II), they grow intensively up to late developmental stages
(Fig. 2b) and accumulate very large amounts of starch and protein in a tissue that is
rapidly loosing water. Therefore these walls need to have the strength and flexibility to
endure in such challenging conditions, and lignin must be an important constituent
that provides such traits.
In conclusion, the lignin detection techniques used in the present work showed
lignin in all cell walls studied. At earlier developmental stages, the amount of lignin in
the cell walls of the starchy endosperm was lower than in the cell walls of transfer cells
but increased in latter in development. The lignification of reticulate and flanged
ingrowths followed a pattern similar to the adjacent cell walls. The results obtained
through the highly confidence TEM-EDX analysis, acriflavine and H2O2 treatment
produced a trusty body of support for the existence of lignin in the walls of transfer
cells and the starchy cells. They made further studies a justifiable avenue of research

CHAPTER III RESULTS AND DISCUSSION
103
that certainly calls for an immunological localization of these polymers with recourse
to specific antibodies to impinge additional strength to the very important data already
accumulated.
CHAPTER III REFERENCES
104
3.5. REFERENCES
Bland DE, Foster RC, Logan AF (1971) The mechanism of permanganate and osmium
tetroxide fixation and the distribution of the lignin in the cell wall of Pinus
radiate. Holzforschung 25:137-143.
Caño-Delgado AI, Metzlaff K, Bevan MW (2000) The eli1 mutation reveals a link
between cell expansion and secondary cell wall formation in Arabidopsis
thaliana. Development 127:3395-3405.
Cho CH, Lee KH, Kim JS, Kim YS (2008) Micromorphological characteristics of bamboo
(Phyllostachys pubescens) fibers degraded by a brown rot fungus (Gloeophyllum
trabeum). J Wood Sci 54:261–265. doi:10.1007/s10086-007-0937-1
Christiernin M (2006) Composition of lignin in outer cell-wall layers. Doctoral Thesis.
Royal Institute of Technology, Stockholm, Sweden, pp 53.
Coleman CM, Prather BL, Valente MJ, Dute RR, Miller ME (2004) Torus lignification in
hardwoods. IAWA Journal 25(4):435–447.
Dixon RA, Chen F, Guo D, Parvathi K (2001) The biosynthesis of monolignols: a
‘‘metabolic grid’’, or independent pathways to guaiacyl and syringyl units?
Phytochemistry 57:1069-1084. doi:10.1016/S0031-9422(01)00092-9
Dharmawardhana DP (1996) A biochemical and molecular study of lignin biosynthesis.
Doctoral Thesis. University of British Columbia. Canada, pp 141
Donaldson L.A. (1991) Seasonal changes in lignin distribution during tracheid
development of Pinus radiate D. Don. Wood Sci Tecn 25:15-24.
Donaldson LA, Bond J (2005) Fluorescence Microscopy of Wood. Rotorua, New Zealand
(CD-ROM).
CHAPTER III REFERENCES
105
Donaldson L, Radotić K, Kalauzi A, Djikanović D, Jeremić M (2010) Quantification of
compression wood severity in tracheids of Pinus radiate D. Don using confocal
fluorescence imaging and spectral deconvolution. J Struct Biol 169:106-115.
doi:10.1016/j.jsb.2009.09.006
Fromm J, Rockel B, Lautner S, Windeisen E, Wanner G (2003) Lignin distribution in
wood cell walls determined by TEM and backscattered SEM techniques. J Struct
Biol 143(1):77-84. doi:10.1016/S1047-8477(03)00119
Fuchs CH (1963) Fuchsin staining with NAOH clearing for lignified elements of whole
plants or plant organs. Stain Technol 38:141-144
Grünwal C, Ruel K, Kim YS, Schmitt U (2002) On the cytochemistry of cell wall
formation in poplar trees. Plant biol 4(1):13-21. doi:10.1055/s-2002-20431
Gunning BES, Pate JS (1974) Transfer cells. In: Robards AW (ed) Dynamic aspects of
plant ultrastructure. McGraw-Hill, London, pp 441–479
Hejri S, Saboora A (2009) Removal of phenolic compounds from synthetic wastewaters
by enzymatic treatments. JSUT 35:13-19
Hepler P, Fosket D, Newcomb E (1970) Lignification during secondary wall formation in
Coleus: an electron microscopic study. American Journal of Botany 57(1):85-96.
doi:10.2307/2440382
Hoffman P, Parameswaran N (1976) On the ultrastructural localization of
hemicelluloses within delignified tracheids of spruce. Holzforschung 30:62–70.
Jensen W (1962) Botanical histochemistry: principles and practice. W. H. Freeman. San
Francisco, pp 408
CHAPTER III REFERENCES
106
Kraus JE, de Sousa HC, Rezende MH, Castro NM, Vecchi C, Luque R (1998) Astra blue
and basic fuchsin double staining of plant materials. Biotechnic and
Histochemistry 73(5):235-243. doi:1052-0295/98/235-243
Kutscha NP, Gray JR (1972) The suitability of certain stains for studying lignification in
Balsam Fir, Abies balsamea (L.) Mill. Technical Bulletin, Life Sciences and
Agriculture Experiment Station, University of Maine 53:1-50.
Lee KH, Singh AP, Kim YS (2007) Cellular characteristics of a traumatic frost ring in the
secondary xylem of Pinus radiate. Trees 21(4):403-410. doi:10.1007/s00468-007-
0131-5
Lewis NG, Yamamoto E (1990) Lignin: occurrence, biogenesis and biodegradation.
Annu Rev Plant Physiol Plant Mol Biol 41:455-496.
doi:10.1146/annurev.arplant.41.1.455
Liu CJ (2012) Deciphering the enigma of lignification: precursor transport, oxidation,
and the topochemistry of lignin assembly. Molecular Plant 5(2):304-317. doi:
10.1093/mp/ssr121
Ma JF, Yang GH, Mao JZ, Xu F (2011) Characterization of anatomy, ultrastructure and
lignin microdistribution in Forsythia suspense. Industrial Crops and Products
33:358-363. doi:10.1016/j.indcrop.2010.11.009
Machado J (2004) Caracterização do desenvolvimento de grãos de milho (Zea mays L.)
nos estádios iniciais de desenvolvimento. Relatório de estágio de licenciatura em
Ciências Agrárias, Universidade dos Açores, Açores, Portugal., p. 59.
Maurer A, Fengel D (1991) Electron microscopic representation of structural details in
softwood cell walls by very thin ultramicrotome sections. Holz Roh Werkst 49:53-
56. doi:10.1007/BF02662800
CHAPTER III REFERENCES
107
Monjardino P, Machado J, Gil FS, Fernandes R, Salema R (2007) Structural and
ultrastructural characterization of maize coenocyte and endosperm
cellularization. Can J Bot 85:216–223. doi:10.1139/B06-156
Monjardino P, Rocha S, Tavares AC, Fernandes R, Sampaio P, Salema R, da Camara
Machado A (2013) Development of flange and reticulate wall ingrowths in maize
(Zea mays L.) endosperm transfer cells. Protoplasma 250(2):495-503.
doi:10.1007/s00709-012-0432-4
Müsel G, Schindler T, Bergfeld R, Ruel K, Jacquet G, Lapierre C, Speth V, Schpfer P
(1997) Structure and distribution of lignin in primary and secondary cell walls of
maize coleoptiles analized by chemical and immunological probes. Planta 20:146-
159. doi:10.1007/BF01007699
Nadji H, Diouf PN, Benaboura A, Bedard Y, Riedl B, Stevanovic T (2009) Comparative
study of lignins isolated from Alfa grass (Stipa tenacissima L.). Bioresource
Technology 100:3585–3592. doi:10.1016/j.biortech.2009.01.074
O’Brien, TP 1970. Further observations on hydrolysis of the cell wall in the xylem.
Protoplasma 69:1-14. doi:10.1007/BF01276648
Pfoser K (1959) Vergleichende versuch über verholzung-reaktionen und fluoreszenze.
s. b. osterr. Akad. Wiss. Math. -Nat Kl Abt I, 168:523-539.
Pereira RC, Davide LC, Pedrozo CA, Carneiro NP, Souza IRP, Paiva E (2008) Relationship
between structural and biochemical characteristics and texture of corn grains.
Genetics and Molecular Research 7(2):498-505
Ride JP 1975. Lignification in wounded wheat leaves in response to fungi and its
possible role in resistance. Physiol. Plant Pathol 5:125-134. doi:10.1016/0048-
4059(75)90016-8
CHAPTER III REFERENCES
108
Santiago R, Quintana J, Rodríguez S, Díaz EM, Legaz ME, Vicente C (2010) An elicitor
isolated from smut teliospores (sporisorium scitamineum) enhances lignin
deposition on the cell wall of both sclerenchyma and xylem in sugarcane leaves.
Pak J Bot 42(4):2867-2881.
Soyano T, Thitamadee S, Machida Y, Chua NH (2008) Asymmetric leaves2-like19/lateral
organ boundaries domain30 and asl20/lbd18 regulate tracheary element
differentiation in Arabidopsis. The Plant Cell 20:3359–3373.
doi:10.1105/tpc.108.061796
Svitelska GV, Gallios GP, Zouboulis AI (2004) Sonochemical decomposition of natural
polyphenolic compound (condensed tannin). Chemosphere 56(10):981-987.
doi:10.1016/j.chemosphere.2004.05.022
Vaughn KC, Talbot MJ, Offler CE, McCurdy DW (2007) Wall ingrowths in epidermal
transfer cells of Vicia faba cotyledons are modified primary walls marked by
localized accumulations of arabinogalactan proteins. Plant Cell Physiol 48:159–
168. doi:10.1093/pcp/pcl047
Tao S, Shahrokh K, Hua Z, Shaoling Z (2009) Anatomy, ultrastructure and lignin
distribution of stone cells in two Pyrus species. Plant Science 176:413-419.
doi:10.1016/j.plantsci.2008.12.011
Wagner A, Donaldson L, Kim H, Phillips L, Flint H, Steward D, Torr K, Koch G, Schmitt U,
Ralph J (2009) Suppression of 4-coumarate-coa ligase in the coniferous
gymnosperm Pinus radiate. Plant Physiology 149:370–383.
doi:10.1104/pp.108.125765
CHAPTER III REFERENCES
109
Wi SG, Singh AP, Lee KH, Kim YS (2005) The pattern of distribution of pectin,
peroxidase and lignin in the middle lamella of secondary xylem fibres in alfalfa
(Medicago sativa). Ann Bot 95:863-868. doi:10.1093/aob/mci092
Xu F, Zhong XC, Sun RC, Lu Q (2006) Anatomy, ultrastructure and lignin distribution in
cell wall of Caragana Korshinskii. Industrial Crops and Products 24:186–193.
doi:10.1016/j.indcrop.2006.04.002
Xu L, Zhu L, Tu L, Liu L, Yuan D, Jin L, Long L, Zhang X (2011) Lignin metabolism has a
central role in the resistance of cotton to the wilt fungus Verticillium dahliae as
revealed by RNA-Seq-dependent transcriptional analysis and histochemistry. J
Exp Bot 62(15):5607-5621. doi:10.1093/jxb/err245
Yao RS, Sun M, Wang CL, Deng SS (2006) Degradation of phenolic compounds with
hydrogen peroxide catalyzed by enzyme from Serratia marcescens AB 90027.
Water Res 40:3091-3098. doi:10.1016/j.watres.2006.06.009
Zhang K, Bhuiya MW, Pazo JR, Miao Y, Kim H, Ralph J, Liu CJ (2012) An engineered
monolignol 4-o-methyltransferase depresses lignin biosynthesis and confers
novel metabolic capability in Arabidopsis. The Plant Cell 24(7):3135-3152.
doi:10.1105/tpc.112.101287
Zobel A, Kuras M, Tyrarska T (1989) Cytoplasmic and apoplastic location of phenolic
compounds in the covering tissue of the Brassica napus radicle between
embryogenesis and germination. Ann Bot 64 (2):149-157.
doi:cgi/content/short/64/2/149
GENERAL CONCLUSIONS
110
GENERAL CONCLUSIONS
This study on maize endosperm transfer cell development enabled us to
conclude:
1- The most basal endosperm transfer cells (MBETC) form reticulate and flange
ingrowths in distinct walls, starting at 5 days after pollination (DAP). The reticulate
ingrowths are formed next to the outer periclinal wall, whereas the flange ingrowths
are formed next to the anticlinal walls and inner periclinal walls.
2- Ingrowth structure and ultrastructure and in particular cellulose microfibril
compaction and orientation patterns are distinguishable from each other at all stages
of development: flange ingrowths form long and mostly longitudinal creases and their
cellulose fibers are parallel and densely packed; reticulate ingrowths form a
fenestrated layer and the cellulose fibers are less densely packed with multiple
orientations.
3- Inner transfer cells only have flange ingrowths.
4- The microtubules associated with flange ingrowths form long parallel bundles
that are predominantly longitudinal.
5- The microtubules associated with the reticulate ingrowths are short, often
bundle, at early developmental stages become entangled, have multiple orientations
and tend to be curvilinear, apparently surrounding the tips of the ingrowths.
6- The γ-tubulin complexes next to the flange ingrowths are mostly distributed
along the microtubules, whereas those adjacent to the reticulate ingrowths do not
have a clear organization pattern, although are also mostly associated with the short
microtubules.
GENERAL CONCLUSIONS
111
7- The cortical microtubules of the starchy cells at very early developmental
stages are random, but soon after they bundle and form net and parallel arrays and, as
these cells start accumulating assimilates, they become individualized or the bundles
narrow and form densely packed parallel arrays.
8- Macrofibrils must be permanently formed in the flange ingrowths of transfer
cells and transiently formed in the early developing starchy cells, which coincide with
the stages that the microtubules have bundled. We hypothesize that there may exist a
cause-effect relation between these two traits.
9- There must exist two size classes of γ-tubulin complexes in both the transfer
cells and the starchy cells.
10- In case of the starchy cells, the proportion of the two size classes of γ-tubulin
complexes vary throughout development, because the small size complex
predominates at later developmental stages in unparallel ways to any other
developmental stage.
11- New models on the contribution of the microtubules and γ-tubulin
complexes on transfer cell ingrowths and starchy cell walls formation were developed.
12- The walls of transfer cells and starchy cells become progressively more
lignified as the kernel develops.
13- Ingrowths and adjacent walls tendentially have similar levels of lignification.
14- The flow of lignin into the walls and ingrowths of the transfer cells is
probably done through vesicles of the Golgi apparatus.
15- The expansion of the transfer cells and starchy cells is not hampered by
lignification.
GENERAL CONCLUSIONS
112
This study has contributed to increasse the knowledge on transfer cell
development, namely on the types and processes of ingrowth formation and
composition, and on starchy cell wall formation.