Sara Delle Macchie, Simone Secchi * and Gianfranco Cellai
17
buildings Article Acoustic Issues in Open Plan Offices: A Typological Analysis Sara Delle Macchie, Simone Secchi * and Gianfranco Cellai Department of Industrial Engineering, University of Florence, 50139 Florence, Italy; [email protected] (S.D.M.); gianfranco.cellai@unifi.it (G.C.) * Correspondence: simone.secchi@unifi.it Received: 20 September 2018; Accepted: 12 November 2018; Published: 14 November 2018 Abstract: This paper reports the acoustic issues of open plan office environments. According to a detailed research based on the scientific literature of the most suitable acoustic descriptors recommended for the open plan offices analysis, the main typological-functional configurations of these environments have been analyzed in order to identify six spatial typologies. The variation of acoustic parameters of these typologies has been evaluated by using a sound pyramid tracing software. The analysis procedure was calibrated in a case study of an office environment, where a measurement campaign was carried out. Results point out that the acoustic improvement of open plan offices can usually be achieved by introducing a sound absorbing false ceiling and dividing panels between working positions, but there are different issues depending on spatial geometries of the office. Better results are referred to office typologies characterized by reduced height and equal plan dimensions. Keywords: open plan office; room acoustic; Indoor Environmental Quality 1. Introduction Since the 1960’s researchers have been addressing the acoustic problem in open-plan offices [1]. Over this period, there have been substantial changes in the nature of the sounds of office equipment; for example, the most notable change from typewriters to computers on every desk. In 1966m, Keighley [2] found that in the UK, office noise levels varied from 60 to 79 dB(A). In the last decades, the world of work has changed by improving the collaborative importance and mutual exchange of knowledge to be able to generate new ideas and foster innovation. Recent experiences have highlighted the following trends: • Significant increase of non-productive spaces, such as collaborative work spaces where workers can interact with each other in an informal way; • Growing number of workers who use the office in a non-continuative way (teleworkers, home workers, etc.); • Decrease in the number of individual workstations in favor of open plan spaces; • Reduction of archive spaces by software data storage, up to their absence; and, • Spatial flexibility to respond to different future economic and management needs. These trends have led to the defining of the workplace as a container of activities, some of these productive, others connected to the elaboration of immaterial products, and some others became mixed areas. The answer to these needs was the diffusion of the open plan type office model, but today’s workplaces need to be healthy environments that minimize the risks of illnesses to occupants to compete in the marketplace. In open plan offices, silence and concentration conditions should be Buildings 2018, 8, 161; doi:10.3390/buildings8110161 www.mdpi.com/journal/buildings
Transcript of Sara Delle Macchie, Simone Secchi * and Gianfranco Cellai
buildings
Article
Acoustic Issues in Open Plan Offices:A Typological Analysis
Sara Delle Macchie, Simone Secchi * and Gianfranco Cellai
Department of Industrial Engineering, University of Florence, 50139 Florence, Italy;[email protected] (S.D.M.); [email protected] (G.C.)* Correspondence: [email protected]
Received: 20 September 2018; Accepted: 12 November 2018; Published: 14 November 2018 �����������������
Abstract: This paper reports the acoustic issues of open plan office environments. Accordingto a detailed research based on the scientific literature of the most suitable acoustic descriptorsrecommended for the open plan offices analysis, the main typological-functional configurations ofthese environments have been analyzed in order to identify six spatial typologies. The variationof acoustic parameters of these typologies has been evaluated by using a sound pyramid tracingsoftware. The analysis procedure was calibrated in a case study of an office environment, where ameasurement campaign was carried out. Results point out that the acoustic improvement of openplan offices can usually be achieved by introducing a sound absorbing false ceiling and dividingpanels between working positions, but there are different issues depending on spatial geometries ofthe office. Better results are referred to office typologies characterized by reduced height and equalplan dimensions.
Keywords: open plan office; room acoustic; Indoor Environmental Quality
1. Introduction
Since the 1960’s researchers have been addressing the acoustic problem in open-plan offices [1].Over this period, there have been substantial changes in the nature of the sounds of office equipment;for example, the most notable change from typewriters to computers on every desk. In 1966m,Keighley [2] found that in the UK, office noise levels varied from 60 to 79 dB(A).
In the last decades, the world of work has changed by improving the collaborative importanceand mutual exchange of knowledge to be able to generate new ideas and foster innovation.
Recent experiences have highlighted the following trends:
• Significant increase of non-productive spaces, such as collaborative work spaces where workerscan interact with each other in an informal way;
• Growing number of workers who use the office in a non-continuative way (teleworkers,home workers, etc.);
• Decrease in the number of individual workstations in favor of open plan spaces;• Reduction of archive spaces by software data storage, up to their absence; and,• Spatial flexibility to respond to different future economic and management needs.
These trends have led to the defining of the workplace as a container of activities, some ofthese productive, others connected to the elaboration of immaterial products, and some others becamemixed areas. The answer to these needs was the diffusion of the open plan type office model, but today’sworkplaces need to be healthy environments that minimize the risks of illnesses to occupants tocompete in the marketplace. In open plan offices, silence and concentration conditions should be
Buildings 2018, 8, 161; doi:10.3390/buildings8110161 www.mdpi.com/journal/buildings

Buildings 2018, 8, 161 2 of 17
guaranteed, because on the one hand, there is the advantage to see each other and work together,on the other, staying in a noisy environment can generate problems of concentration and generalannoyance, with the consequent reduction of working productivity.
Today many people work in open plan offices where the most annoying element is irrelevantspeech [3–6] that is the perception of the speech distracting for the single worker compared to activitythat he is carrying out, especially based on their own semantic content.
In particular, from the results of a study that involved more than 40,000 workers in 300 U.S. officebuildings [3], the authors came to the conclusion that enclosed private offices clearly outperformedopen-plan layouts in most aspects of Indoor Environmental Quality, particularly in acoustics, privacy,and in proxemics issues. Benefits of enhanced ‘ease of interaction’ were smaller than the penalties ofincreased noise level and decreased privacy resulting from open-plan office configurations.
The technical literature [7–11] is consistent in affirming that open plan offices offer worseenvironmental conditions than traditional offices due to the lack of individual space, the lack ofacoustics, and privacy requirements, in addition to the poor air and light quality and the high possibilityof distraction for workers.
In open plan offices, furthermore, the control of air quality is very difficult because it is necessaryto prevent the dispersion and depository of expiratory droplets that are generated locally [12].For these reasons, the study on the type of ventilation is fundamental; some researches haveinvestigated the impact of ventilation strategies on particle deposition in a ventilated room [13,14].Other researches show that the air curtain system is efficient in removing and preventing dispersion ofthe expiratory droplets [15].
Therefore, the relationship between the physical and environmental qualities and satisfaction isvery important because the workers spend a large amount of their time in indoor environments thataffect health, productivity, and comfort.
The European Standard EN 15,251 [16] addresses this problem with a holistic view because theenergy consumption of buildings depends significantly on the criteria used for the indoor environment(temperature, ventilation, and lighting) and building (including equipment) design and operation.The Annex E of the standard describes the criteria for noise and shows the correlation between thermalcomfort, energy performance, and noise. When the occupants open the windows in naturally ventilatedbuildings to obtain adequate ventilation, the equivalent sound pressure level shall be used to evaluatenoise, including the periods when the windows are open and the room is exposed to outdoor noise.
In urban areas, the environmental noise is frequently very high [17,18] and so the windows areshut with the consequence of poor air quality.
In the case of Heating, Ventilation and Air Conditioning systems (HVAC), providing therequired amount of air would result in unacceptable noise levels from fans and often withhigh-energy requirements.
As can be seen in Figure 1, experimental researches [19] show that within an office a worker canhave a reduction of concentration up to 50% with very high consequences from the point of view ofproduction. Moreover, the subjective sensitivity of the workers is important for the changing of theacoustic and environmental conditions [13].
Figure 1. Influence of environmental requirements on concentration. Figure re-edited from [19].
Up to 35% of the decrease in concentration is due to the presence of noise (Figure 1).
Buildings 2018, 8, 161 3 of 17
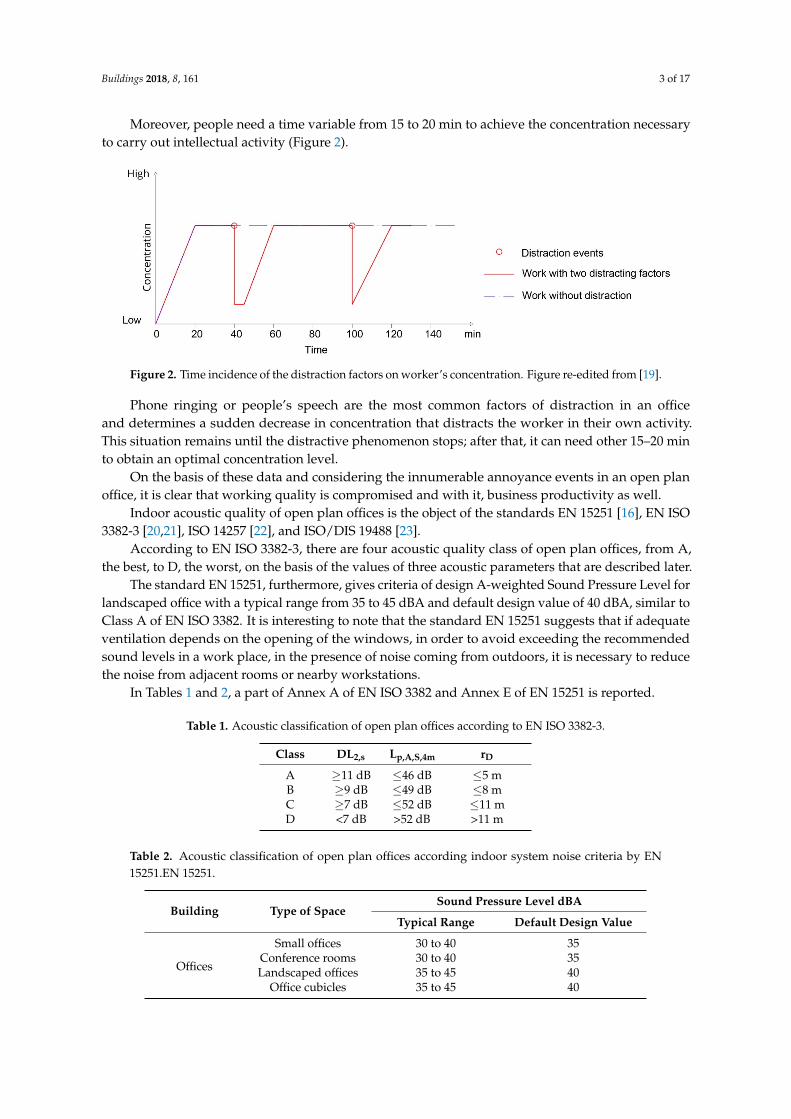
Moreover, people need a time variable from 15 to 20 min to achieve the concentration necessaryto carry out intellectual activity (Figure 2).
Figure 2. Time incidence of the distraction factors on worker’s concentration. Figure re-edited from [19].
Phone ringing or people’s speech are the most common factors of distraction in an officeand determines a sudden decrease in concentration that distracts the worker in their own activity.This situation remains until the distractive phenomenon stops; after that, it can need other 15–20 minto obtain an optimal concentration level.
On the basis of these data and considering the innumerable annoyance events in an open planoffice, it is clear that working quality is compromised and with it, business productivity as well.
Indoor acoustic quality of open plan offices is the object of the standards EN 15251 [16], EN ISO3382-3 [20,21], ISO 14257 [22], and ISO/DIS 19488 [23].
According to EN ISO 3382-3, there are four acoustic quality class of open plan offices, from A,the best, to D, the worst, on the basis of the values of three acoustic parameters that are described later.
The standard EN 15251, furthermore, gives criteria of design A-weighted Sound Pressure Level forlandscaped office with a typical range from 35 to 45 dBA and default design value of 40 dBA, similar toClass A of EN ISO 3382. It is interesting to note that the standard EN 15251 suggests that if adequateventilation depends on the opening of the windows, in order to avoid exceeding the recommendedsound levels in a work place, in the presence of noise coming from outdoors, it is necessary to reducethe noise from adjacent rooms or nearby workstations.
In Tables 1 and 2, a part of Annex A of EN ISO 3382 and Annex E of EN 15251 is reported.
Table 1. Acoustic classification of open plan offices according to EN ISO 3382-3.
Class DL2,s Lp,A,S,4m rD
A ≥11 dB ≤46 dB ≤5 mB ≥9 dB ≤49 dB ≤8 mC ≥7 dB ≤52 dB ≤11 mD <7 dB >52 dB >11 m
Table 2. Acoustic classification of open plan offices according indoor system noise criteria by EN15251.EN 15251.
Building Type of SpaceSound Pressure Level dBA
Typical Range Default Design Value
Offices
Small offices 30 to 40 35Conference rooms 30 to 40 35Landscaped offices 35 to 45 40
Office cubicles 35 to 45 40

Buildings 2018, 8, 161 4 of 17
Navai and Veitch [1] conducted a comprehensive literature review on acoustical satisfaction inopen plan offices and found that occupants reported decreased acoustical satisfaction when ambientlevels exceeded 45 dBA.
The scientific literature [24–29] refers, for the evaluation of the acoustical quality of open planoffices, to the following parameters:
• Reverberation time, RT,• Spatial decay, D2,S,• A-weighted sound pressure level at 4 m distance from the sound source, Lp,A,S,4m,• Distraction distance, rD,• Speech transmission index, STI.
P. Virjonen et al. [25] have studied and analysed the acoustic quality of 16 offices and have shownthat it is essential that the designer have a general view of these acoustic parameters that are thebasis for a possible improvement intervention. In the following, these parameters are described andreferences to their limit values are given.
Acoustic performance of the interior environment is usually characterised by theReverberation Time RT (s) that is still the most used parameter for the preliminary study of roomacoustic. However, scientific literature [25,26] shows that reverberation time isn’t always adequate tostudy the acoustic properties of open plan offices.
The rate of spatial decay of sound pressure level to distance doubling D2,S can be preferred toreverberation time because it considers the spatial attenuation of sound. D2,S depends on the chosenevaluation interval; in many offices a suitable interval appears to be from 3 to 16 m. D2,S is given bythe regression line of SPL over this region. If D2,S will increase after acoustic treatment, this imply thatthe speech level will decrease faster as a function of distance.
The sound attenuation in the first 4 m from the source, Lp,A,S,4m, is a useful parameter because 4 m isthe typical distance between two different workstations. Just like large values of D2,S are desirable tohave a good acoustic condition in the environment, small values of Lp,A,S,4m indicate that the speech isattenuated efficiently when the distance source-receiver is 4 m.
Another important parameter for the study of the acoustic quality of open plan offices is theSpeech Transmission Index (STI). Speech intelligibility means the percent of word or phrases correctlyunderstood by one receiver compared to those pronounced by the talker and depends on therelationship between the noise level caused by the conversation and the background noise level.It varies from 0 to 1, where 1 means 100% of intelligibility of the conversation and 0 total unintelligibility.Table 3 shows reference values of STI according to the standard IEC 60268-16:2011.
Table 3. STI reference values according to IEC 60268-16:2011.
Intelligibility Null Negative Inadequate Acceptable Good Excellent
STI 0 <0.3 0.3–0.45 0.45–0.60 0.60–0.75 >0.75
In the short distance, the STI allows to evaluate the speech intelligibility between two colleagueswho interact in the workplace and sit opposite to each other. Since the more annoying noise in anoffice is the private conversation of workers and the greater discomfort is caused by the lack of privacy,to transform in incomprehensible the irrelevant speech, it is needed to reduce the intelligible index atlarger distances but maintaining it great in the part of office where users interact.
Appropriated values of STI index useful to guarantee an adequate privacy of the conversationbetween next workstations are those below 0.2.
Kostallari et al. [30] highlighted the correlation among STI and DP (Decrease in Performance) anddemonstrated that changing STI from 0.2 to 1 gives an increase of DP (%) considerably, but when STIvalues are comprised from 0.7 to 1 the DP values remain constant.

Buildings 2018, 8, 161 5 of 17
The study by R. Romano et al. [31] shows, in the case of a workstation with dimensions 3 × 3 m,the combinations of height of the partitions and sound-absorbing coefficient of the false ceiling that canmake an acceptable confidentiality of the conversation with STI values less or equal to 0.2: these valuesare possible with sound absorbing coefficient greater of 0.9 and height partition greater of 1.55 m.
The distraction distance rD is defined as the distance where STI value gets off below 0.5 andis determined through linear interpolation among the point above and below STI equal to 0.5.Small values of rD mean high privacy and a low speech intelligibility. In the same way, wherethe STI value gets off below 0.2 we can define the privacy distance rP.
The study by Sarwono et al. [32] by computer simulation of several open-plan offices have showedthe influence of workstation layout and height partition on STI, distraction distance rD, and spatialdecay D2,S, similar to what is done in the present study.
In open plan offices, the background noise can have a masking role and decrease the speechintelligibility contributing to increase privacy during private speeches. However, its value cannot betoo high, otherwise it could cause itself a disturbing factor.
Typical values of the background noise change from 30 to 60 dB(A) in an open plan office [19,25,27];indeed, the sound pressure level can change strongly on the base of office’s dimension, height, typologyof the furniture and the distribution of the workstations as well as the kind of air conditioning systemand the environment acoustic climate of the zone where the office is located.
Working in a noisy environment can produce concentration problems and annoyance, but in themost serious cases, stress and symptoms of fatigue as well. The renovation of these environments canbe faced by little recurring modifications such as the correct choice of furniture components and falseceiling, the optimization of aggregation criteria, and orientation of workstations.
In general terms, the control of the acoustic comfort in working environment concerns thefollowing factors that determine the acoustic climate of the space: The sound source typologies,the workstation distribution on the space, the presence of high partitions or screen between theworkstations, the constructive typology of the building (especially about sound-isolation andsound-absorbing requests), the characterization of the background noise determined by continuous(noise of computer operation, HVAC systems, mounting background noise, etc.), and discontinuoussound sources (mobile phone ring, play of copier, etc.), and finally the windows opening time in areaswith high external noise if adequate ventilation depends on the opening of the windows.
Furthermore, disproportionate spaces such as open plan offices, with height lesser than the otherplan dimensions, are characterized by an un-diffused sound field. In fact, in these environments,the spatial decays are very different from each other in the various directions.
One first solution to the problem consists in inserting systems that increase the sound-absorptionreducing the effect of reflections and so the overall sound level. It is generally recommendable to actfirst on the false ceiling and on the taller part of the walls, then with fixed or mobile systems to dividethe space or with vertical (baffles) or horizontal elements suspended to the ceiling. In very large andhigh open space offices, a widely used technique is to create acoustic islands by portions of ceilingssuspended on workstations.
To reduce perceived distraction, another solution consists in increasing the number of quietrooms: Haapakangas et al. [33] have shown that an open-plan office with more quiet rooms yieldsbetter results in terms of perceived distractions, environmental satisfaction, collaboration, and stresssymptoms than an office with less quiet rooms.
The selection of the materials and systems to insert in a space to improve acoustic quality mustconsider the frequency sound absorbing coefficient α of the materials. An optimal solution consists invibration panels or resonators, which also works very well at low frequencies, with porous materialsin the cavity that, instead, works better to in a medium-high frequency. Many kinds of materials canbe suitable for this purpose, also considering the case of sustainable materials [34].
Regarding performances of the partition panels, in addition to the sound-absorbing coefficient,they must also guarantee the sound-insulation respect to direct transmission.
Buildings 2018, 8, 161 6 of 17
V. Hongisto et al. [24] carried out a study on an open space office with 135 employees that hasbeen the object of refurbishment to improve thermal and ergonomic conditions, privacy (hearing andvisual), and spatial density. The purpose of the research group was to demonstrate, with measurementsbefore and after the renovation, the presence of a close relationship between environment quality andsatisfaction for the workers. The renovation of the working environment has been made to reduce theoccupation density, increase the sound-absorbing surfaces already present, and change the partitionswith other higher. These environmental changes improved the satisfaction and working productivity.
The introduction, in an open plan office of high partitions, is usually the better intervention,especially if the office has a sound-absorbing false-ceiling.
On the basis of scientific literature studies [11,19,24,28], the minimum values to guarantee a goodperformance of the division panels are the following:
• Heigh: h ≥ 1.80 m;• Lenght: l ≥ 1.20 m;• Thickness: s ≤ 0.30 m;• Sound-absorbing coefficient: αw ≥ 0.8.
Another technique used to reduce the general annoyance in open plan offices and decrease privacyproblem is sound masking, which is widespread, especially in the USA since the 1960’s and todayalso diffuse in North Europe [35]. Anyway, sound masking can have disturbing characteristics for theemployees, so the research of optimal spectra is open again.
The acoustic effect of the above described techniques can be very different when dimensionsand proportion of the open space office are varied. For example, the effect of a dividing panel can beirrelevant when the office is very reverberant or very high.
In the literature, there is a lack of systematic approaches to the effect of office dimensions andproportions on the variation of the main acoustic parameters described above. For this reason, the aimof this paper is to analyze this effect with reference to different kinds of open plan offices, which arerepresentative of the most widespread kinds of offices.
2. Methods and Instruments
In this study, a room acoustic analysis of six spatial typologies of open plan offices has beencarried out by means of a ray tracing software, also considering the effect of different kinds of acoustictreatment. The results have been analyzed with reference to the acoustic parameters described in theprevious section.
In open plan offices, acoustics are influenced, largely, by the environment dimensions, both inplan and in elevation, so the following six typical spatial typologies, representative of the most spreadkinds of open plan offices, have been analyzed:
A. office with squared plan (256 m2) and height of 3 m;B. office with squared plan (256 m2) and height of 6 m;C. office with lengthened plan (720 m2) and height of 4 m;D. office with lengthened plan (720 m2) and height of 6 m;E. office with irregular plan (216 m2) and height of 3 m; andF. office with irregular plan (216 m2) and height of 6 m.
The offices type C and D represent many cases where old industrial buildings have beenrenovated and converted into tertiary work-spaces. The typologies with the irregular plan represent,still in a schematic way, a morphology with less rigid spaces within the most modern buildings ofcontemporary architecture.
Each of the six types, described above, have been studied in the four different configurationsdescribed in Table 4. The sound absorption coefficients used for each material are shown in Table 5.

Buildings 2018, 8, 161 7 of 17
Table 4. The configurations analyzed for each of the six office typologies.
Floor Plaster Windows Tables Chairs Doors False Ceiling High Partition Screen
1 x x x x x x2 x x x x x x x3 x x x x x x x x4 x x x x x x x x x
Table 5. Sound absorption coefficient of the materials used for the simulations.
Sound Absorbing Coefficient α
Materials 125 Hz 250 Hz 500 Hz 1000 Hz 2000 Hz 4000 Hz
Floor 0.022 0.032 0.032 0.032 0.043 0.054Plaster 0.065 0.065 0.065 0.076 0.098 0.154
Window 0.395 0.279 0.199 0.131 0.076 0.043Tables 0.120 0.120 0.131 0.131 0.109 0.109Chairs 0.221 0.279 0.325 0.348 0.325 0.279Door 0.120 0.131 0.131 0.131 0.109 0.109
Sound-absorbing false ceiling 0.240 0.70 0.970 0.900 0.950 0.850High partition 0.763 0.866 0.892 0.958 0.958 1.00
Screen 0.510 0.700 0.800 0.770 0.600 0.500
The acoustic simulations have been carried out by means of the pyramid tracing predictivesoftware Ramsete® in the presence of furniture, but in the absence of people. This Pyramid Tracingalgorithm is capable of solving the sound propagation problems following the geometrical acousticsassumptions. It takes into account specular reflections over sound absorbing surfaces, the diffractioneffect over free edges of screens, and sound insulation of partitions, holes, windows, and doors.The diffraction effect is computed with the Keller/Maekawa formula [36]. This method produces animportant approximation of the wave propagation over an obstacle. Anyway, the software outputshave been widely validated in literature with reference to large rooms [36], as well as to commonindoor environments [37].
In this study, the software outputs have been analyzed with reference to a case study of anoffice (Figure 3) where measurements of some of the previously descripted acoustical parameterswere carried out [38]. The office analyzed in this part of the study is a typical office characterizedby hard surfaces and typical furniture, with 11 workstations and the following main dimensions:8.1 m (width) × 17.35 m (length) × 3 m (height).
For the measurements the following instrumentation was used (Figure 3):
• 01 dB sound source dodecahedron;• 01 dB sound amplifier;• double channel sound analyzer 01 dB Symphonie, with real time analysis in 1/3 octave frequency
bands; and• two diffuse field 1⁄2 Grass microphones with preamplifiers.
Measurements of the Reverberation Time were carried out over 12 points randomly distributedover the entire volume of the office.
Figures 4 and 5 show the comparison between calculated and measured values of theReverberation Time (as space averaged values) and of the spatial decay over the longitudinal dimensionof the office.
Figure 4 also shows the error bars of the Reverberation Time measurements, which indicate plusand minus the value of the standard deviation of the measurement over the 12 points. It can be notedthat the uncertainty of the results is greater at lower frequencies, as already shown in the previousstudies of the author [38]. This is due to the lack of uniformity of the sound field at low frequency.

Buildings 2018, 8, 161 8 of 17
At mid frequency (500 Hz), the standard deviation is 0.07 s, which is about 10% of the average value ofthe reverberation time.
The comparisons between measured and simulated values shown in Figures 4 and 5 point out agood agreement with reference to the examined parameters.
Simulations were carried out by analyzing the following configurations for each of the six spatialtypologies (Table 4 and Figure 6):
1. no surfaces with sound-absorbing materials;2. insertion of the false ceiling in gypsum plaster with αw = 0.7;3. equal to (2) but with addition of 2 m high sound-absorbing partitions between workstations
characterized by αw = 0.85 and Rw = 34 dB; and4. equal to (3) but with addition of low divisors on the table surface, placed between two opposite
working people with αw = 0.8.
Figure 3. Measurement instrumentation in the case study office.
Figure 4. Comparison between simulated and measured values of the Reverberation Time (RT) in thecase study. The error bars indicate plus and minus the standard deviation of the measurements.

Buildings 2018, 8, 161 9 of 17
Figure 5. Comparison between simulated and measured values of the Sound Pressure Level (SPL) overthe longitudinal dimension of the case study.
Figure 6. The examined office configurations.
Globally, 24 series of simulations were carried out (6 spatial configurations for 4 internalmaterial typologies).
The sound source used for the acoustic simulations had the human voice spectrum and directivity,according to the standard ISO 9921 [39]. The receivers have been positioned, such as the sound source,at 1.20 m from the ground, located on a straight line and distance of 1 m from themselves.
The following parameters, previously described, were calculated:
• the spatial decay D2,S, to the short distance, in order to evaluate the performance within the sameworking area, and to a greater distance, from 4 to 8 m;
• the A-weighted Sound Pressure Level Lp,A,S,2m at 2 m and Lp,A,S,4m at 4 m distance from thesound source;
• the Reverberation Time RT; and• the Speech Transmission Index (STI) and the distraction distance rD.

Buildings 2018, 8, 161 10 of 17
We obtained the distraction distance rD by the Speech Transmission Index (STI), taking a mediumbackground noise as input, referring to the values highlighted by researchers [40] and on the basis of thebackground noise level measured in a typical working morning in the case study office (Figure 7) [40].
Figure 7. Environmental noise measured in the case study office (Figure 3) in the time slot 9:30–15:00(LAeq = 57 dB(A)) [40].
The second step of this study involved the insertion of a large number of receivers (every 20 cm)within a small part of the virtual model analyzed, in order to better describe the sound propagation inthe various configurations.
3. Results and Discussion
Simulation results show a similar behavior of the six office types when varying the acousticalproperties of the materials introduced.
Regarding the spatial decay rate of sound, D2,S(4–8m), it can be observed that a substantialimprovement from configuration 1 to 3, thus, thanks to the insertion of both the sound-absorbingfalse ceiling and the partitions panels (Table 4), as already shown by previous studies [41].The configuration 4 doesn’t produce any additional improvement.
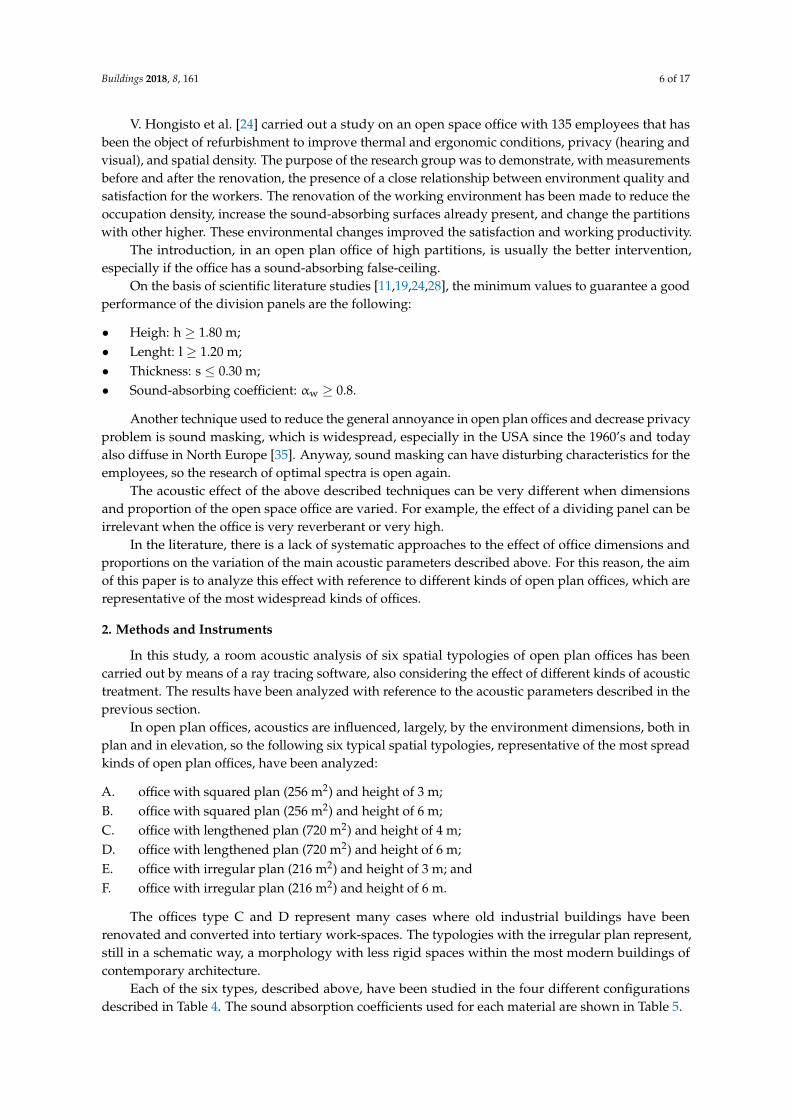
Typology A is the open plan situation that is most affected by the changes in theenvironment acoustic properties where D2,S reaches the value of 5 dB in configuration 3. However,every configuration falls within class D according to the classification given in Table 1 from the standardISO 3382-3, since they always have D2,S < 7 dB; this suggests the necessity of adding absorbing materialalso on the lateral walls. Anyway, it must be underlined that this parameter has been obtained fromthe trend line on LAeq vs. distance, that, in cases 3 and 4, have a correlation coefficient lower than incases 1 and 2. For example, in office type A, the correlation coefficient R2 is equal to 0.91 in case 1,while in case 3, this value is 0.83 (Figure 8).
This phenomenon is caused by the diffraction effect of the sound that determines a decrease ofthe sound level immediately after the high partition and the screens in the workstations, while in thesuccessive points, this effect is reduced and the sound pressure level increases again, according tothe room’s acoustic quality. The diffraction effect determines great data dispersion, and consequently,a lower correlation coefficient.
This latter problem is particularly strong in case 3, where the sound spatial decay in the box(the portion of the office between two opposite separating screens), called D2,S(box), shows negative
Buildings 2018, 8, 161 11 of 17
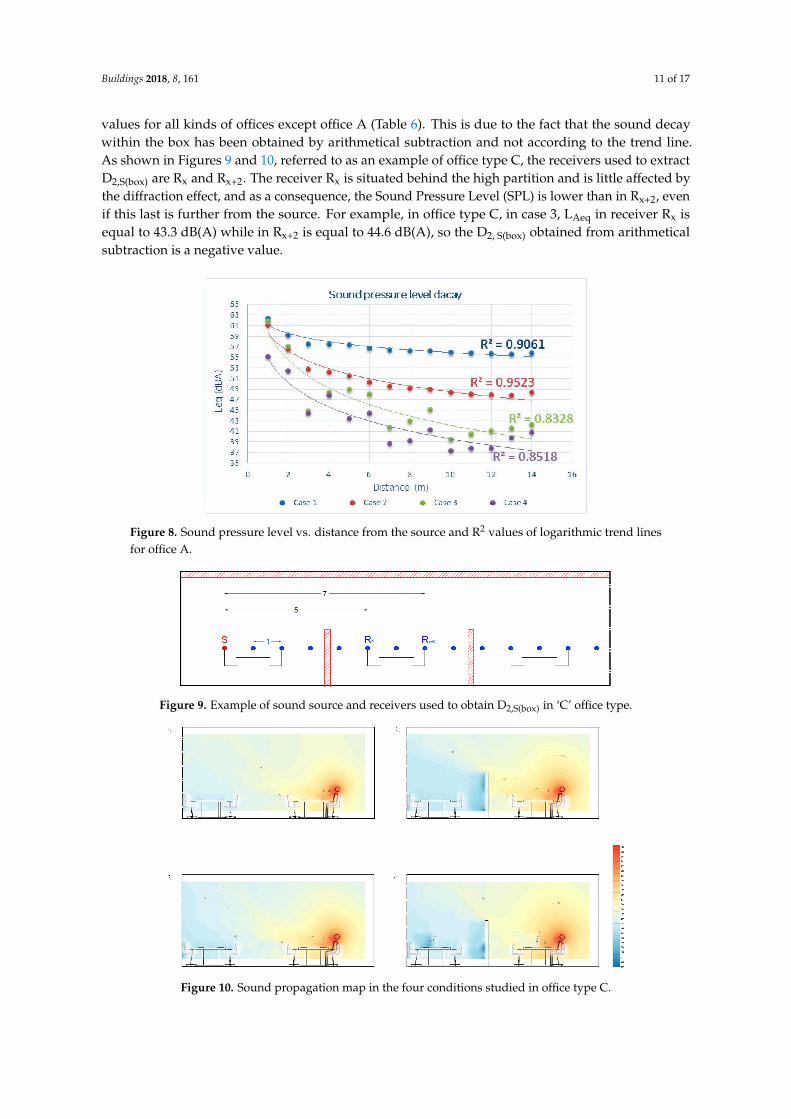
values for all kinds of offices except office A (Table 6). This is due to the fact that the sound decaywithin the box has been obtained by arithmetical subtraction and not according to the trend line.As shown in Figures 9 and 10, referred to as an example of office type C, the receivers used to extractD2,S(box) are Rx and Rx+2. The receiver Rx is situated behind the high partition and is little affected bythe diffraction effect, and as a consequence, the Sound Pressure Level (SPL) is lower than in Rx+2, evenif this last is further from the source. For example, in office type C, in case 3, LAeq in receiver Rx isequal to 43.3 dB(A) while in Rx+2 is equal to 44.6 dB(A), so the D2, S(box) obtained from arithmeticalsubtraction is a negative value.
Figure 8. Sound pressure level vs. distance from the source and R2 values of logarithmic trend linesfor office A.
Figure 9. Example of sound source and receivers used to obtain D2,S(box) in ‘C’ office type.
Figure 10. Sound propagation map in the four conditions studied in office type C.
Buildings 2018, 8, 161 12 of 17
However, by considering the sound pressure level absolute value, we can still deduce a positiveresult from the introduction of the panel and the low screens on the tables. With reference to officetype A, there is a reduction of approximately 7 dB from the configurations 1 to the configuration 4,while at 4 m, the distance from the sound source of the reduction is almost 10 dB.
In the office type B, there is the same difference of the sound level at a short distance, while theintroduction of the partition panels and low screens have a greater effect causing a reduction of SPL of13.3 dB at 4 m from the source.
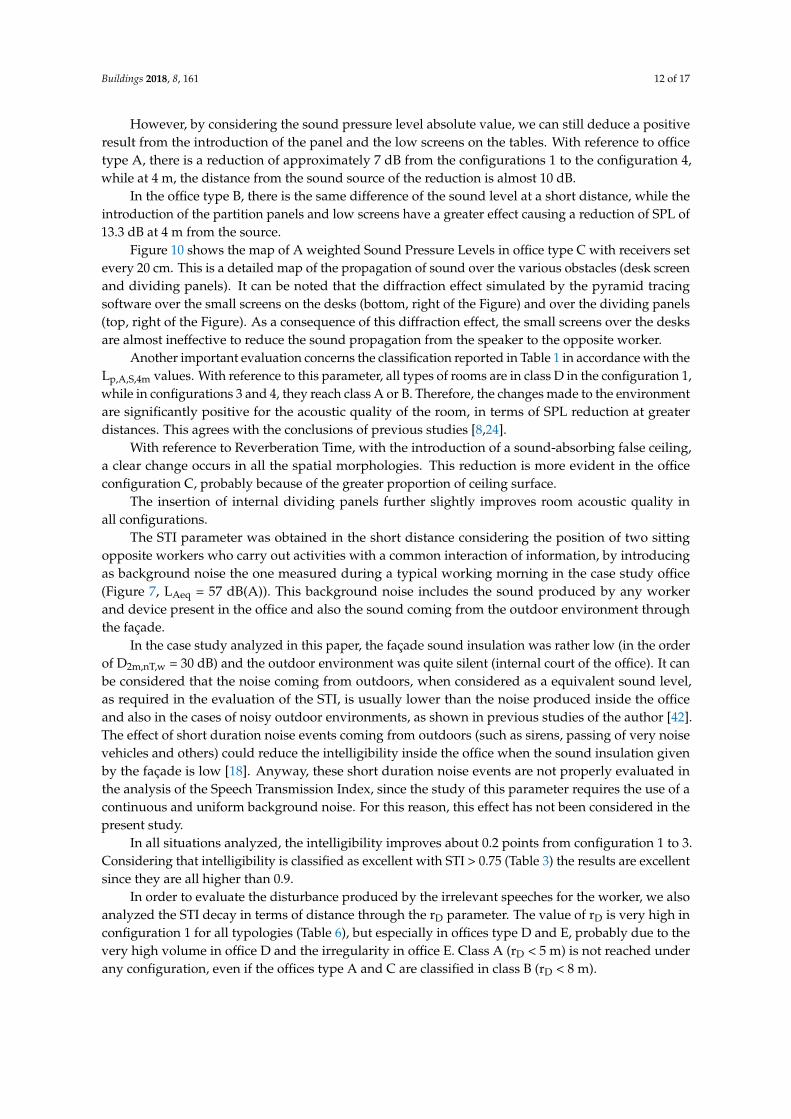
Figure 10 shows the map of A weighted Sound Pressure Levels in office type C with receivers setevery 20 cm. This is a detailed map of the propagation of sound over the various obstacles (desk screenand dividing panels). It can be noted that the diffraction effect simulated by the pyramid tracingsoftware over the small screens on the desks (bottom, right of the Figure) and over the dividing panels(top, right of the Figure). As a consequence of this diffraction effect, the small screens over the desksare almost ineffective to reduce the sound propagation from the speaker to the opposite worker.
Another important evaluation concerns the classification reported in Table 1 in accordance with theLp,A,S,4m values. With reference to this parameter, all types of rooms are in class D in the configuration 1,while in configurations 3 and 4, they reach class A or B. Therefore, the changes made to the environmentare significantly positive for the acoustic quality of the room, in terms of SPL reduction at greaterdistances. This agrees with the conclusions of previous studies [8,24].
With reference to Reverberation Time, with the introduction of a sound-absorbing false ceiling,a clear change occurs in all the spatial morphologies. This reduction is more evident in the officeconfiguration C, probably because of the greater proportion of ceiling surface.
The insertion of internal dividing panels further slightly improves room acoustic quality inall configurations.
The STI parameter was obtained in the short distance considering the position of two sittingopposite workers who carry out activities with a common interaction of information, by introducingas background noise the one measured during a typical working morning in the case study office(Figure 7, LAeq = 57 dB(A)). This background noise includes the sound produced by any workerand device present in the office and also the sound coming from the outdoor environment throughthe façade.
In the case study analyzed in this paper, the façade sound insulation was rather low (in the orderof D2m,nT,w = 30 dB) and the outdoor environment was quite silent (internal court of the office). It canbe considered that the noise coming from outdoors, when considered as a equivalent sound level,as required in the evaluation of the STI, is usually lower than the noise produced inside the officeand also in the cases of noisy outdoor environments, as shown in previous studies of the author [42].The effect of short duration noise events coming from outdoors (such as sirens, passing of very noisevehicles and others) could reduce the intelligibility inside the office when the sound insulation givenby the façade is low [18]. Anyway, these short duration noise events are not properly evaluated inthe analysis of the Speech Transmission Index, since the study of this parameter requires the use of acontinuous and uniform background noise. For this reason, this effect has not been considered in thepresent study.
In all situations analyzed, the intelligibility improves about 0.2 points from configuration 1 to 3.Considering that intelligibility is classified as excellent with STI > 0.75 (Table 3) the results are excellentsince they are all higher than 0.9.
In order to evaluate the disturbance produced by the irrelevant speeches for the worker, we alsoanalyzed the STI decay in terms of distance through the rD parameter. The value of rD is very high inconfiguration 1 for all typologies (Table 6), but especially in offices type D and E, probably due to thevery high volume in office D and the irregularity in office E. Class A (rD < 5 m) is not reached underany configuration, even if the offices type A and C are classified in class B (rD < 8 m).
Buildings 2018, 8, 161 13 of 17
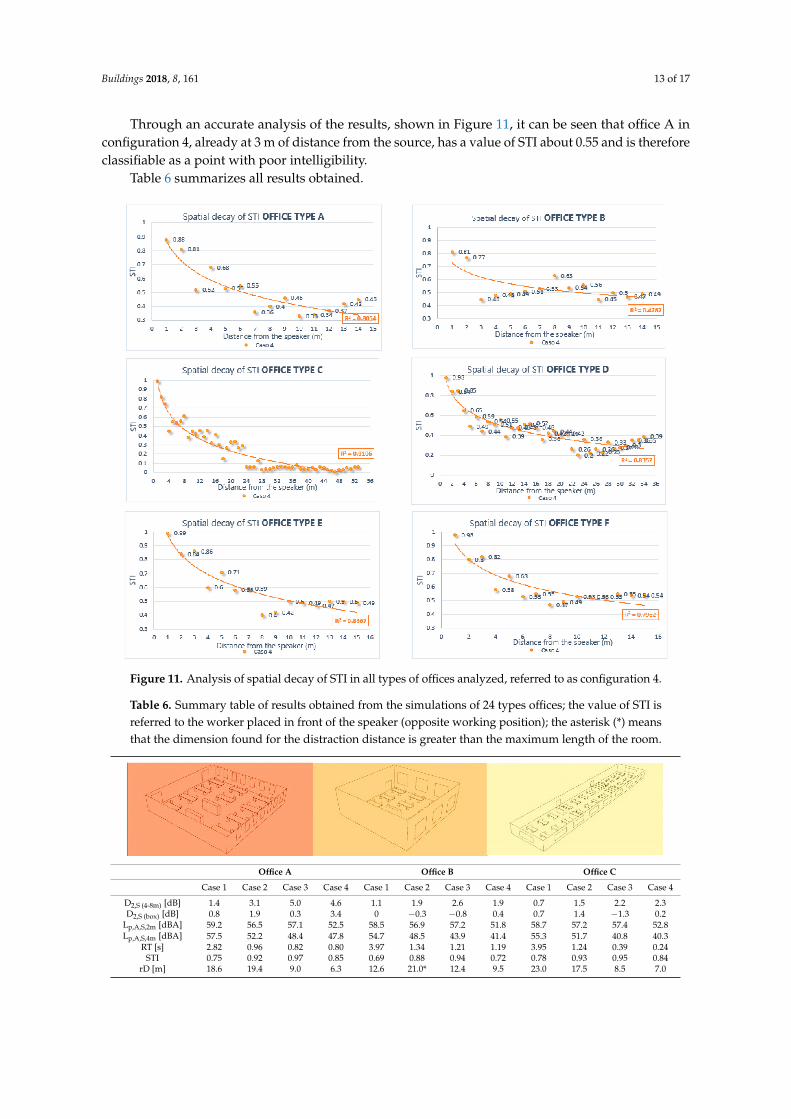
Through an accurate analysis of the results, shown in Figure 11, it can be seen that office A inconfiguration 4, already at 3 m of distance from the source, has a value of STI about 0.55 and is thereforeclassifiable as a point with poor intelligibility.
Table 6 summarizes all results obtained.
Figure 11. Analysis of spatial decay of STI in all types of offices analyzed, referred to as configuration 4.
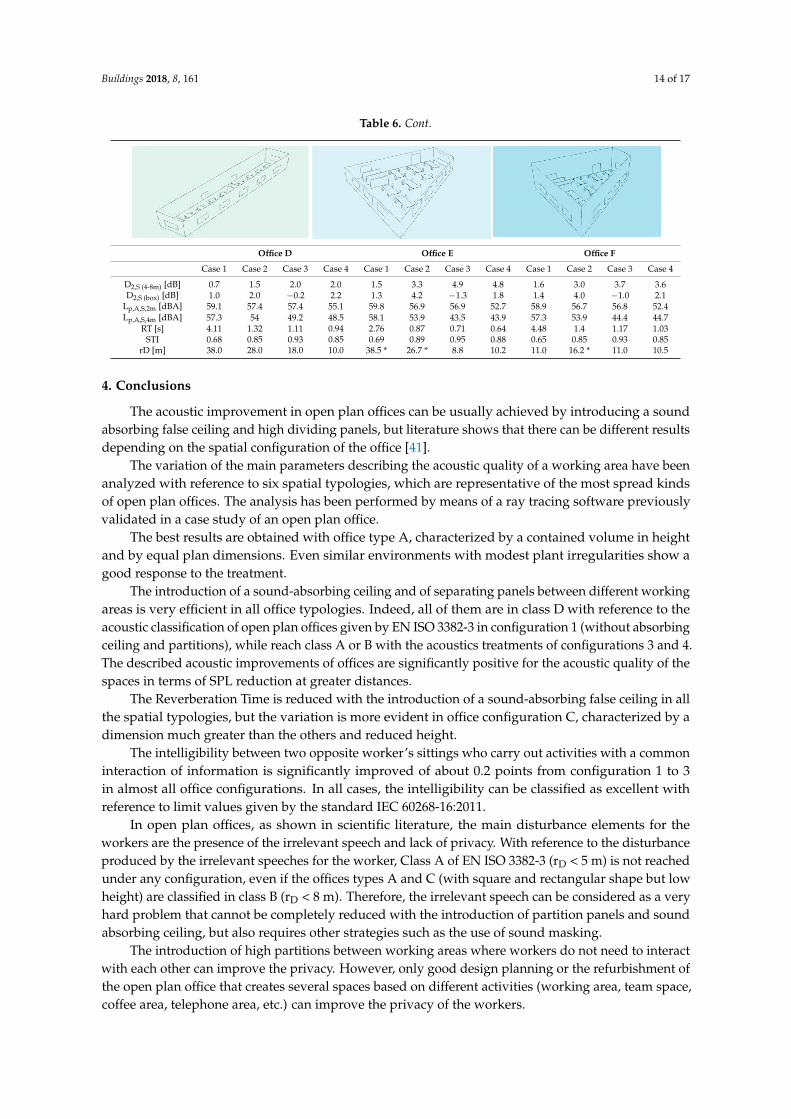
Table 6. Summary table of results obtained from the simulations of 24 types offices; the value of STI isreferred to the worker placed in front of the speaker (opposite working position); the asterisk (*) meansthat the dimension found for the distraction distance is greater than the maximum length of the room.
Office A Office B Office C
Case 1 Case 2 Case 3 Case 4 Case 1 Case 2 Case 3 Case 4 Case 1 Case 2 Case 3 Case 4
D2,S (4-8m) [dB] 1.4 3.1 5.0 4.6 1.1 1.9 2.6 1.9 0.7 1.5 2.2 2.3D2,S (box) [dB] 0.8 1.9 0.3 3.4 0 −0.3 −0.8 0.4 0.7 1.4 −1.3 0.2
Lp,A,S,2m [dBA] 59.2 56.5 57.1 52.5 58.5 56.9 57.2 51.8 58.7 57.2 57.4 52.8Lp,A,S,4m [dBA] 57.5 52.2 48.4 47.8 54.7 48.5 43.9 41.4 55.3 51.7 40.8 40.3
RT [s] 2.82 0.96 0.82 0.80 3.97 1.34 1.21 1.19 3.95 1.24 0.39 0.24STI 0.75 0.92 0.97 0.85 0.69 0.88 0.94 0.72 0.78 0.93 0.95 0.84
rD [m] 18.6 19.4 9.0 6.3 12.6 21.0* 12.4 9.5 23.0 17.5 8.5 7.0
Buildings 2018, 8, 161 14 of 17
Table 6. Cont.
Office D Office E Office F
Case 1 Case 2 Case 3 Case 4 Case 1 Case 2 Case 3 Case 4 Case 1 Case 2 Case 3 Case 4
D2,S (4-8m) [dB] 0.7 1.5 2.0 2.0 1.5 3.3 4.9 4.8 1.6 3.0 3.7 3.6D2,S (box) [dB] 1.0 2.0 −0.2 2.2 1.3 4.2 −1.3 1.8 1.4 4.0 −1.0 2.1
Lp,A,S,2m [dBA] 59.1 57.4 57.4 55.1 59.8 56.9 56.9 52.7 58.9 56.7 56.8 52.4Lp,A,S,4m [dBA] 57.3 54 49.2 48.5 58.1 53.9 43.5 43.9 57.3 53.9 44.4 44.7
RT [s] 4.11 1.32 1.11 0.94 2.76 0.87 0.71 0.64 4.48 1.4 1.17 1.03STI 0.68 0.85 0.93 0.85 0.69 0.89 0.95 0.88 0.65 0.85 0.93 0.85
rD [m] 38.0 28.0 18.0 10.0 38.5 * 26.7 * 8.8 10.2 11.0 16.2 * 11.0 10.5
4. Conclusions
The acoustic improvement in open plan offices can be usually achieved by introducing a soundabsorbing false ceiling and high dividing panels, but literature shows that there can be different resultsdepending on the spatial configuration of the office [41].
The variation of the main parameters describing the acoustic quality of a working area have beenanalyzed with reference to six spatial typologies, which are representative of the most spread kindsof open plan offices. The analysis has been performed by means of a ray tracing software previouslyvalidated in a case study of an open plan office.
The best results are obtained with office type A, characterized by a contained volume in heightand by equal plan dimensions. Even similar environments with modest plant irregularities show agood response to the treatment.
The introduction of a sound-absorbing ceiling and of separating panels between different workingareas is very efficient in all office typologies. Indeed, all of them are in class D with reference to theacoustic classification of open plan offices given by EN ISO 3382-3 in configuration 1 (without absorbingceiling and partitions), while reach class A or B with the acoustics treatments of configurations 3 and 4.The described acoustic improvements of offices are significantly positive for the acoustic quality of thespaces in terms of SPL reduction at greater distances.
The Reverberation Time is reduced with the introduction of a sound-absorbing false ceiling in allthe spatial typologies, but the variation is more evident in office configuration C, characterized by adimension much greater than the others and reduced height.
The intelligibility between two opposite worker’s sittings who carry out activities with a commoninteraction of information is significantly improved of about 0.2 points from configuration 1 to 3in almost all office configurations. In all cases, the intelligibility can be classified as excellent withreference to limit values given by the standard IEC 60268-16:2011.
In open plan offices, as shown in scientific literature, the main disturbance elements for theworkers are the presence of the irrelevant speech and lack of privacy. With reference to the disturbanceproduced by the irrelevant speeches for the worker, Class A of EN ISO 3382-3 (rD < 5 m) is not reachedunder any configuration, even if the offices types A and C (with square and rectangular shape but lowheight) are classified in class B (rD < 8 m). Therefore, the irrelevant speech can be considered as a veryhard problem that cannot be completely reduced with the introduction of partition panels and soundabsorbing ceiling, but also requires other strategies such as the use of sound masking.
The introduction of high partitions between working areas where workers do not need to interactwith each other can improve the privacy. However, only good design planning or the refurbishment ofthe open plan office that creates several spaces based on different activities (working area, team space,coffee area, telephone area, etc.) can improve the privacy of the workers.

Buildings 2018, 8, 161 15 of 17
The introduction of the small screens in the table between two opposite working positions(Figure 6, case 4) is almost always irrelevant, as shown to be the differences between the configurations3 and 4 (Table 6).
Therefore, the essential interventions consist in introducing a sound-absorbing false ceiling andplacing partitions at least 1.8 m high between the work areas that do not have to interact with each other.
On the contrary, it is more difficult and onerous to obtain suitable environmental qualities inspaces with great heights and not well-proportioned dimension in plan.
The only effective solution consists in increasing the sound-absorbing surface and in dividing thework place into specific areas, according to the activities, with the use of high panels.
These results can be used as guidelines for the layout design of open plan offices and for theselection of appropriate materials.
Author Contributions: Conceptualization, S.S.; Data curation, S.D.M.; Methodology, S.S.; Writing—original draft,S.D.M.; Writing—review & editing, S.D.M., S.S. and G.C.
Funding: This research received no external funding.
Acknowledgments: The authors wish to thank the Regional Agency for the Environmental Protection of Tuscanyfor making available the office of the case study.
Conflicts of Interest: The authors declare no conflict of interest.
References
1. Navai, M.; Veitch, J.A. Acoustic Satisfaction in Open-Plan Offices: Review and Recommendations; IRC-RR-151; NationalResearch Council of Canada, Institute for Research in Construction: Ottawa, ON, Canada, 2003; Availableonline: https://nparc.nrc-cnrc.gc.ca/eng/view/fulltext/?id=dfaa533c-57c3-4f06-9be7-5d393d4c163b (accessed on13 September 2018).
2. Keighley, E.C. The determination of acceptability criteria for office noise. J. Sound Vib. 1966, 4, 73–87. Available online:https://www.sciencedirect.com/science/article/pii/0022460$\times$66901556 (accessed on 16 September 2018).[CrossRef]
3. Kim, J.; De Dear, R. Workspace satisfaction: The privacy-communication trade-off in open-plan offices.J. Environ. Psychol. 2013, 36, 18–26. [CrossRef]
4. Schlittmeier, S.J.; Liebl, A. The effects of intelligible irrelevant background speech in offices—Cognitivedisturbance, annoyance, and solutions. Facilities 2015, 33, 61–75. [CrossRef]
5. Hongisto, V.; Haapakangas, A.; Hyönä, J.; Kokko, J.; Keränen, J. Effects of unattended speech on performanceand subjective distraction: The role of acoustic design in open-plan offices. Appl. Acoust. 2014, 86, 1–16.[CrossRef]
6. Varjo, J.; Hongisto, V.; Haapakangas, A.; Maula, H.; Koskela, H.; Hyönä, J. Simultaneous effects of irrelevant speech,temperature and ventilation rate on performance and satisfaction in open-plan office. J. Environ. Psychol. 2015,44, 16–33. [CrossRef]
7. Sylke, N. Ergonomics workplace design. In Work Environments, 2nd ed.; Schittich, C., Ed.; Birkhauser:Basel, Switzerland, 2013; Volume 56, pp. 39–43.
8. Machner, R. Acoustic design in open–plan offices, In Work Environments, 2nd ed.; Schittich, C., Ed.; Birkhauser:Basel, Switzerland, 2013; Volume 56, pp. 45–49.
9. Boubekri, M.; Haghighat, F. Windows and environmental satisfaction: A survey study of an office building.Indoor Environ. 1993, 3, 164–172. [CrossRef]
10. Freihoefer, K.; Guerin, D.; Martin, C.; Kim, H.Y.; Brigham, J.K. Occupants’ satisfaction with, and physicalreadings of, thermal, acoustic, and lighting conditions of sustainable office workspaces. Indoor Built Environ.2015, 24, 457–472. [CrossRef]
11. Vellenga, S.; Bouwhuis, T.; Höngens, T. Proposed method for measuring ‘liveliness’ in open plan offices.In Proceedings of the 24th International Congress on Sound and Vibration, London, UK, 23–27 July 2017.
12. Morawska, L. Droplet fate in indoor environments, or can we prevent the spread of infection? Indoor Air2006, 16, 335–347. [CrossRef] [PubMed]
13. Bouilly, J.; Limam, K.; Béghein, C.; Allard, F. Effect of ventilation strategies on particle decay rates indoors:An experimental and modelling study. Atmos. Environ. 2005, 39, 4885–4892. [CrossRef]

Buildings 2018, 8, 161 16 of 17
14. Zhao, B.; Wu, J. Particle deposition in indoor environments: Analysis of influencing factors. J. Hazard. Mater.2007, 147, 439–448. [CrossRef] [PubMed]
15. Park, D.; Chang, S. Numerical investigation of thermal comfort and transport of expiratory contaminants ina ventilated office with an air curtain system. Indoor Built Environ. 2018, 1–21. [CrossRef]
16. EN 15251:2007. Indoor Environmental Input Parameters for Design and Assessment of Energy Performanceof Buildings Addressing Indoor Air Quality, Thermal Environment, Lighting and Acoustics; InternationalOrganization for Standardization: Geneva, Switzerland, May 2007.
17. Casini, D.; Cellai, G.; Fogola, J.; Scamoni, F.; Secchi, S. Correlation between facade sound insulation and urbannoise: A contribution to the acoustic classification of existing buildings. Build. Acoust. 2016, 23, 145–158.[CrossRef]
18. Secchi, S.; Brambilla, G.; Casini, D.; Cellai, G. A Method to Estimate Students’ Exposure to Road Traffic NoiseEvents. Environments 2018, 5, 39. [CrossRef]
19. Furnari, M. Manuale di Progettazione Uffici; Mancosu Editore: Roma, Italy, 2013; Volume D32–D55,p. 8896589126. (In Italian)
20. Nocke, C. Open Plan Offices–classification scheme based on ISO 3382-3 Parameters. In Proceedings of theInternoise, Melbourne, Australia, 16–19 November 2014.
21. ISO 3382-3:2012. Acoustics—Measurement of Room Acoustic Parameters–Part 3: Open Plan Offices; InternationalOrganization for Standardization: Geneva, Switzerland, January 2012.
22. ISO 14257:2001. Measurement and Parametric Description of Spatial Sound Distribution Curves in Workrooms for Evaluationof Their Acoustical Performance; International Organization for Standardization: Geneva, Switzerland, October 2001.
23. ISO/DIS 19488:2018. Acoustics—Acoustic Classification of Dwellings; International Organization for Standardization:Geneva, Switzerland, October 2018.
24. Hongisto, V.; Haapakangas, A.; Varyjo, J.; Helenius, R.; Koskela, H. Refurbishment of an open-planoffice—Environmental and job satisfaction. J. Environ. Psychol. 2016, 45, 176–191. [CrossRef]
25. Virjonen, P.; Keränen, J.; Hongisto, V. Determination of acoustical conditions in open-plan offices—Proposalfor new measurement method and target values. Acta Acust. United Acust. 2009, 95, 279–290. [CrossRef]
26. Nilsson, E.; Hellstom, B. Room acoustic design in open plan offices. In Proceedings of the 10eme CogresFrancais d’Acoustique, Lyon, France, 12–16 April 2010.
27. Keranen, J.; Virjonen, P.; Hongisto, V. A new model for acoustic of open plan offices. In Proceedings of theICA, Madrid, Spain, 2–7 September 2007.
28. Kohlert, C. Wellbeing at new ways of working-acoustics. In Proceedings of the Internoise, Hamburg, Germany,21–24 August 2016.
29. Keränen, J.; Hongisto, V.; Hakala, J.; Elorza, D.O. Speech privacy in an open plan office with different roomacoustic conditions. In Proceedings of the Forum Acusticum, Aalborg, Denmark, 27 June–1 July 2011.
30. Kostallari, K.; Parizet, E.; Chevret, P.; Amato, J.; Galy, E. Irrelevant speech effect in open plan offices:A laboratory study. In Proceedings of the 24th International Congress on Sound and Vibration, London, UK,23–27 July 2017.
31. Romano, R.; Quindici, R.; Dragonetti, R. Approccio metodologico per la valutazione del disturbo da rumorein ambienti di lavoro open-space in cui si svolgono attività che richiedono concentrazione. In Proceedings ofthe II Conference of Forensic Engeneering, Pisa, Italy, 15–17 November 2012. (In Italian)
32. Sarwono, J.; Larasati, A.E.; Novianto, W.N.I.; Sihara, I.; Utami, S.S. Simulation of several open plan officedesign to improve speech privacy condition without additional acoustic treatment. Procedia Soc. Behav. Sci.2015, 184, 315–321. [CrossRef]
33. Haapakangas, A.; Hongisto, V.; Varjo, J.; Lahtinen, M. Benefits of quiet workspaces in open-plan offices eevidence from two office relocations. J. Environ. Psychol. 2018, 56, 63–75. [CrossRef]
34. Secchi, S.; Asdrubali, F.; Cellai, G.; Nannipieri, E.; Rotili, A.; Vannucchi, I. Experimental and environmentalanalysis of new sound-absorbing and insulating elements in recycled cardboard. J. Build. Eng. 2016, 5, 1–12.[CrossRef]
35. Hongisto, V. Effects of sound masking on workers—A case study in a land-escaped office. In Proceedings ofthe 9th ICBEN, Foxwoods, Mashantucket, 21–25 July 2008.
36. Farina, A. Pyramid tracing vs. ray tracing for the simulation of sound propagation in large rooms. In Transactions onthe Built Environment; WIT Press: Southampton, UK, 1995; Volume 10, ISSN 1743-3509.

Buildings 2018, 8, 161 17 of 17
37. Farina, A. RAMSETE—A new Pyramid Tracer for medium and large scale acoustic problems. In Proceedingsof the EURO-NOISE 95 Conference, Lyon, France, 21–23 March 1995.
38. Scrosati, C.; Scamoni, F.; Prato, A.; Secchi, S.; Fausti, P.; Astolfi, A.; Barbaresi, L.; D’Alessandro, F.; Di Bella, A.;Schenone, C.; et al. Uncertainty of Facade Sound Insulation by a Round Robin Test. Evaluations ofLow-Frequency Procedure and Single Numbers. Build. Environ. 2016, 105, 253–266. [CrossRef]
39. ISO 9921:2003. Ergonomics–Assessment of Speech Communication; International Organization for Standardization:Geneva, Switzerland, October 2003.
40. Delle Macchie, S. The Acoustic Issues in Open Plan Office. Master’s Thesis, School of Architecture, Florence, Italy, 14February 2017.
41. Keränen, J.; Hongisto, V. Prediction of the spatial decay of speech in open-plan Offices. Appl. Acoust. 2013,74, 1315–1325. [CrossRef]
42. Secchi, S.; Astolfi, A.; Calosso, G.; Casini, D.; Cellai, G.; Scamoni, F.; Scrosati, C.; Shtrepi, L. Effect of outdoor noiseand façade sound insulation on indoor acoustic environment of Italian schools. Appl. Acoust. 2017, 126, 120–130.[CrossRef]
© 2018 by the authors. Licensee MDPI, Basel, Switzerland. This article is an open accessarticle distributed under the terms and conditions of the Creative Commons Attribution(CC BY) license (http://creativecommons.org/licenses/by/4.0/).